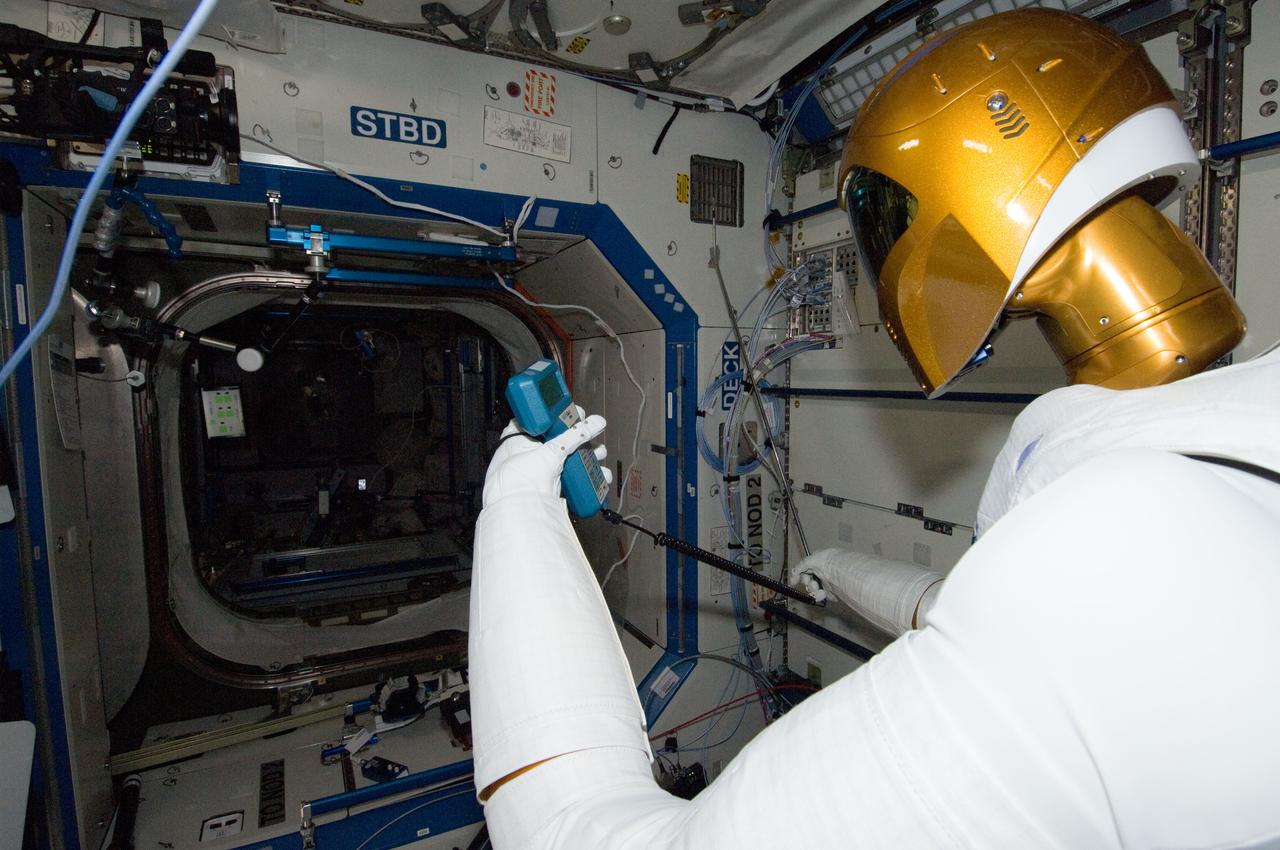
ISS030-E-148268 (14 March 2012) --- Controlled by teams on the ground, Robonaut 2 humanoid robot holds an instrument to measure air velocity during another system check out in the Destiny laboratory of the International Space Station.
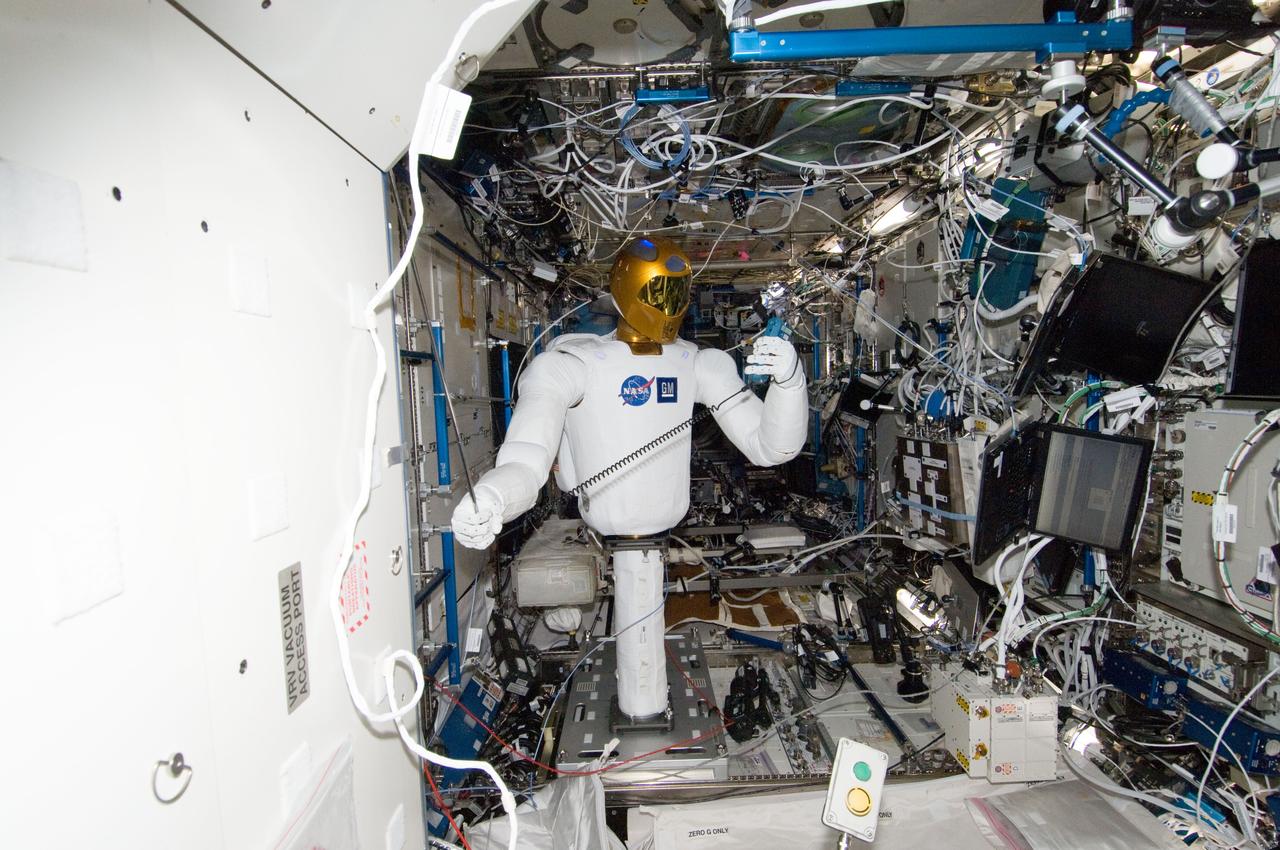
ISS030-E-148273 (14 March 2012) --- Controlled by teams on the ground, Robonaut 2 humanoid robot holds an instrument to measure air velocity during another system check out in the Destiny laboratory of the International Space Station.
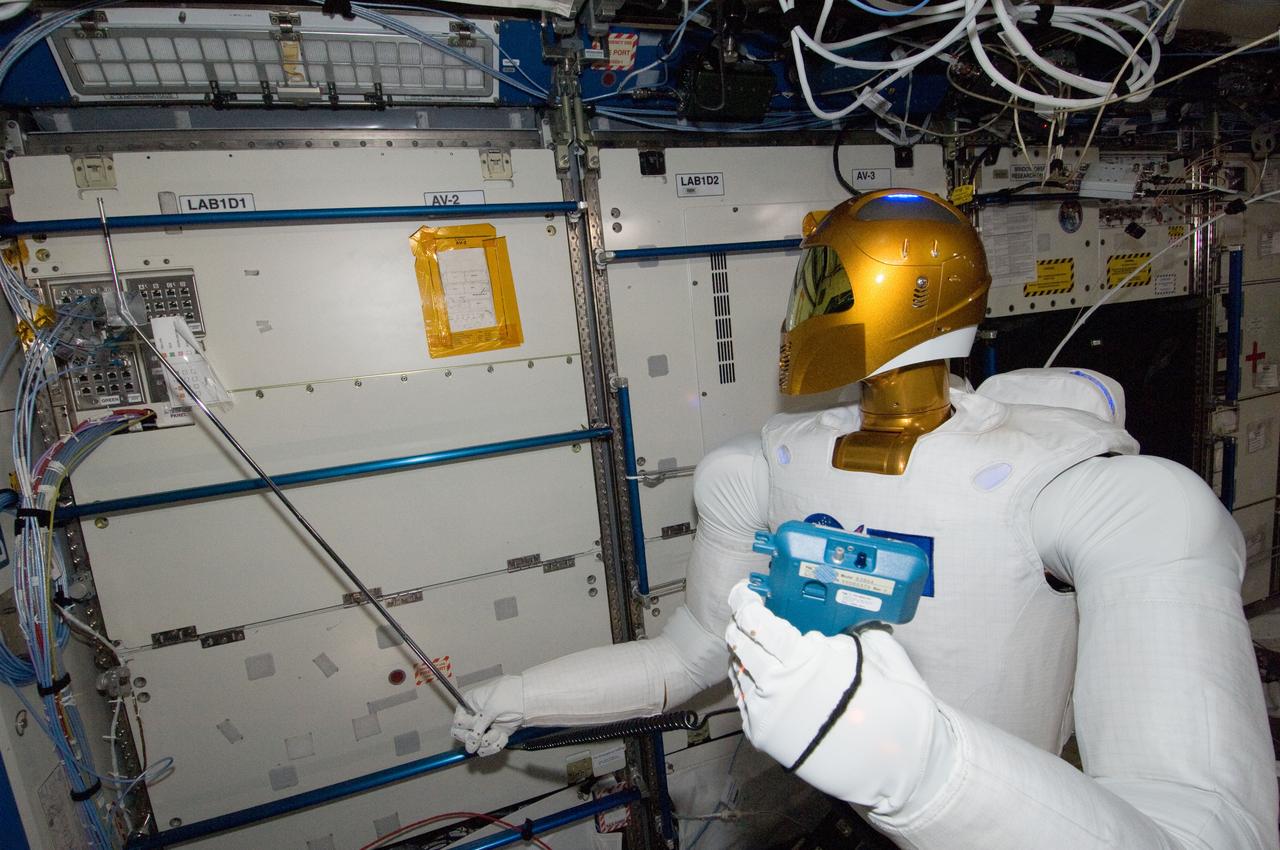
ISS030-E-148260 (14 March 2012) --- Controlled by teams on the ground, Robonaut 2 humanoid robot holds an instrument to measure air velocity during another system check out in the Destiny laboratory of the International Space Station.
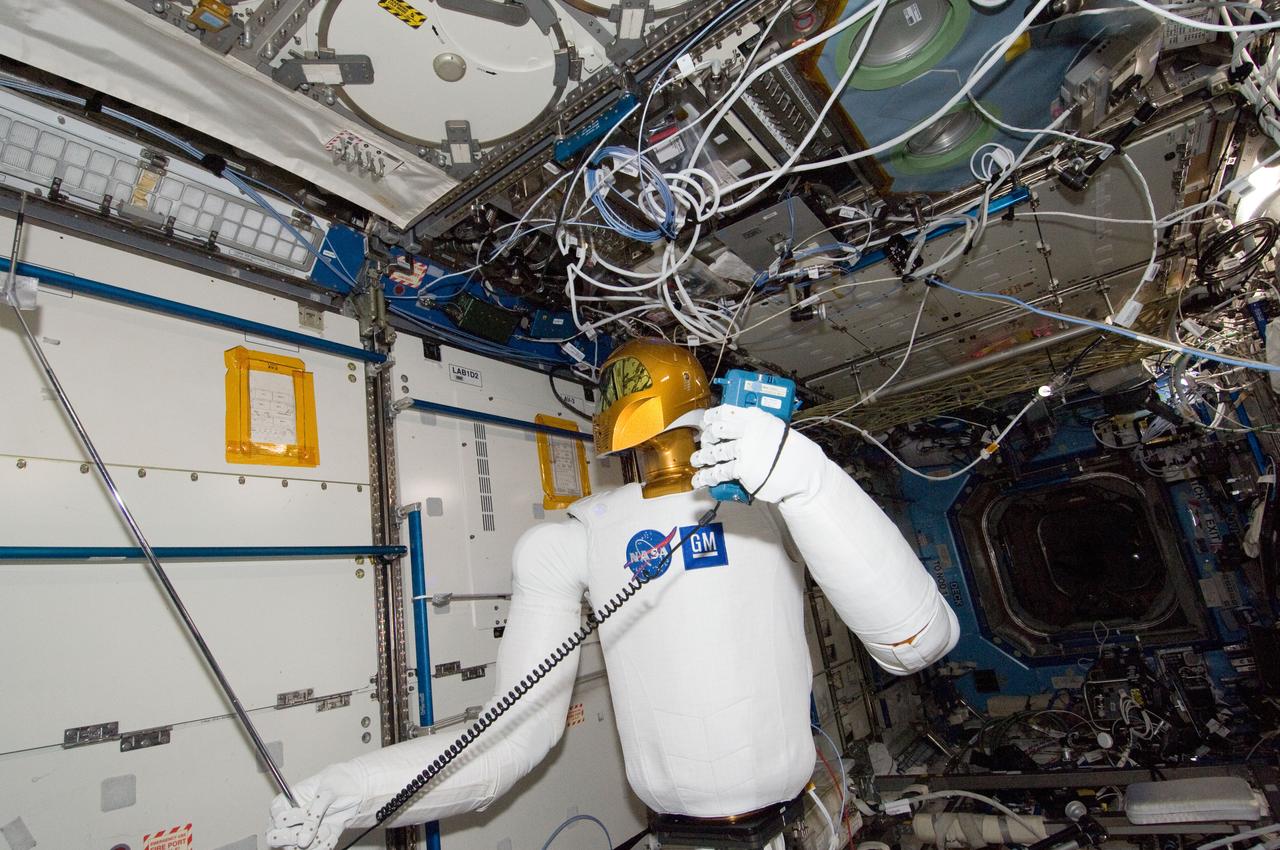
ISS030-E-148257 (14 March 2012) --- Controlled by teams on the ground, Robonaut 2 humanoid robot holds an instrument to measure air velocity during another system check out in the Destiny laboratory of the International Space Station.
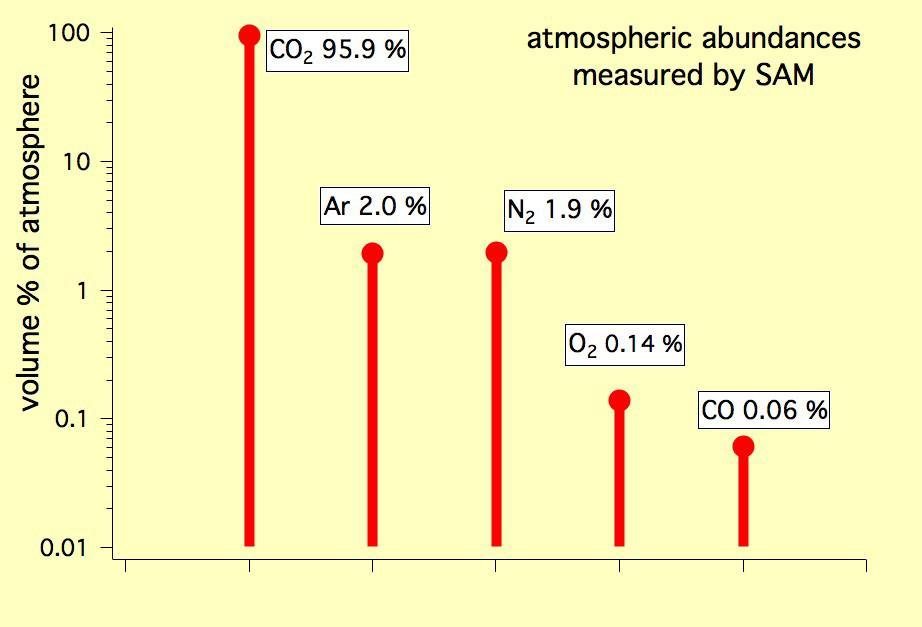
This graph shows the percentage abundance of five gases in the atmosphere of Mars, as measured by the Quadrupole Mass Spectrometer instrument of the SAM instrument suite onboard Curiosity.
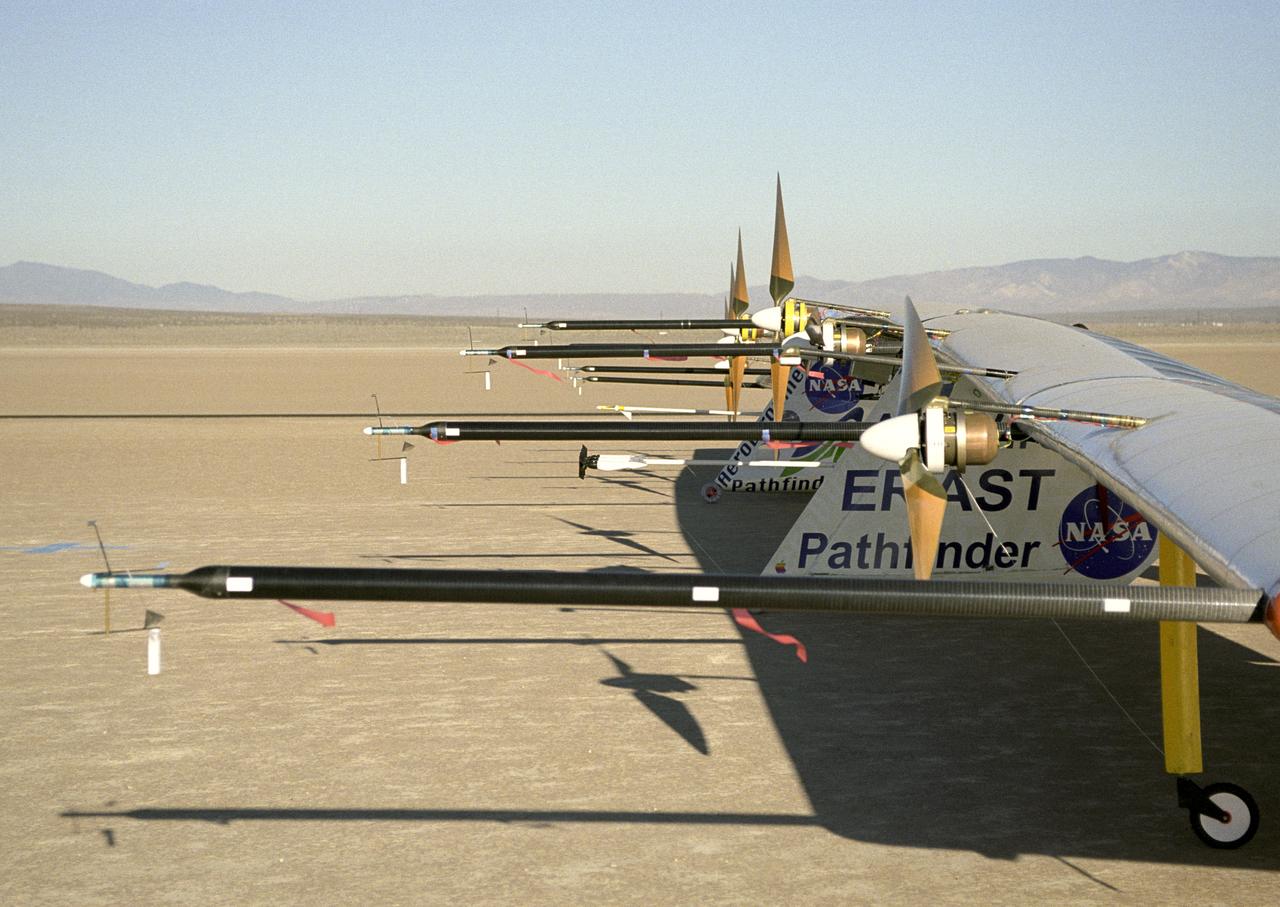
Sensitive instruments mounted on booms extending forward of the wing measure air turbulence and its effect on the stability of the Pathfinder-Plus solar-electric flying wing.
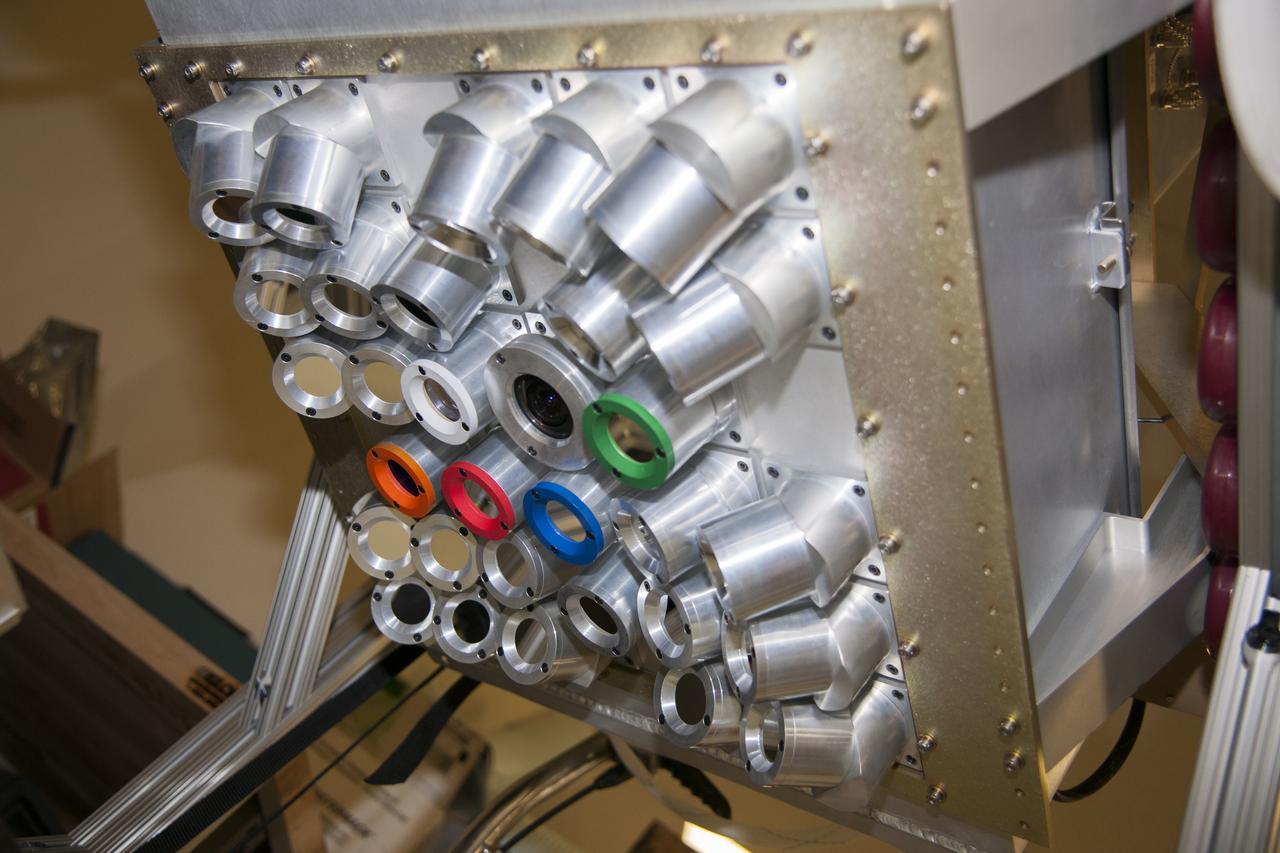
The Fly’s Eye Geostationary Lightning Mapper Simulator will map lightning strikes using 30 photometers, instruments that measure the intensity of light.
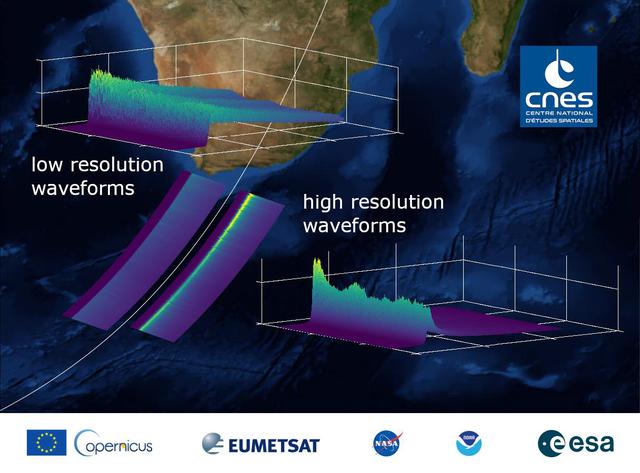
This graphic, released on Dec. 10, 2020, shows the basic radar measurements, called waveforms, collected by the instrument that monitors sea level on the Sentinel-6 Michael Freilich satellite, which launched Nov. 21, 2020. The instrument, called an altimeter, works by bouncing a radar signal off the ocean surface and measuring how long it takes to go out and return. The higher-resolution waveforms focus on a smaller area of the ocean than the lower-resolution waveforms, allowing researchers to resolve smaller ocean features such as currents closer to the coast. The waveform provides information not only on sea level, but also on wave height and wind speed. https://photojournal.jpl.nasa.gov/catalog/PIA24136
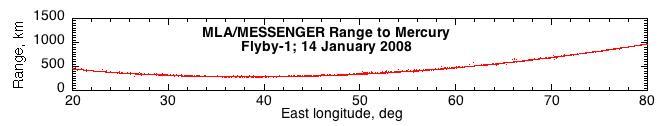
On January 14, 2008, NASA MESSENGER spacecraft Mercury Laser Altimeter MLA became the first instrument to measure the distance between a spacecraft and the surface of Mercury.
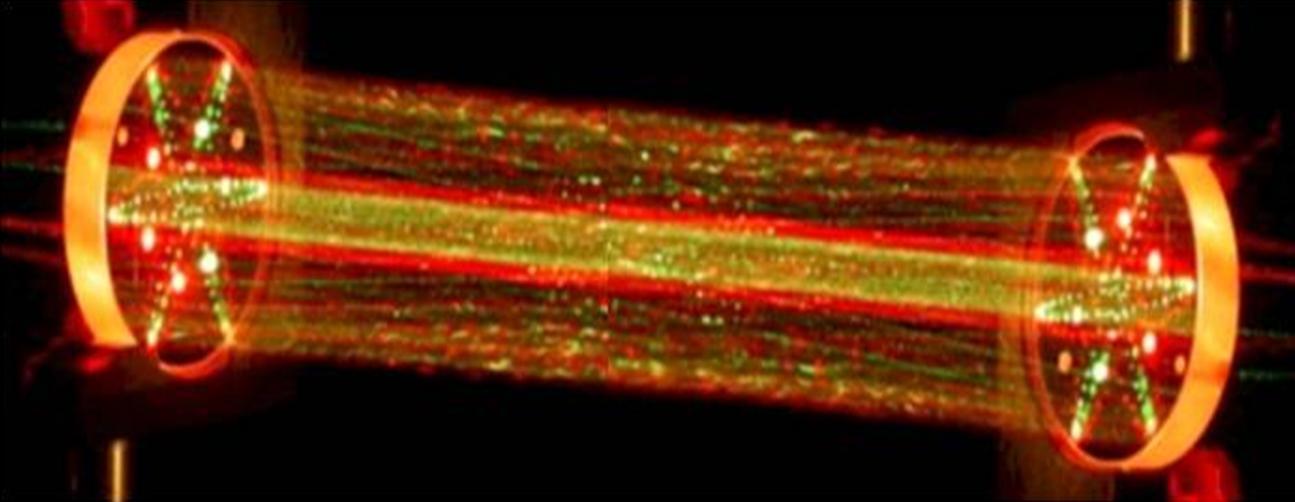
This picture shows a lab demonstration of the measurement chamber inside the Tunable Laser Spectrometer, an instrument that is part of the Sample Analysis at Mars investigation on NASA Curiosity rover.

This image shows the distribution and amount of carbon dioxide in Earth mid-troposphere in July 2008 as measured by NASA Atmospheric Infrared Sounder AIRS instrument.
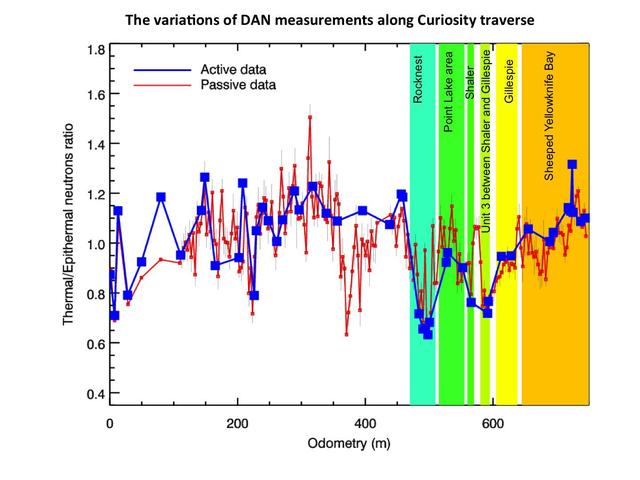
This chart graphs measurements made by the Dynamic Albedo of Neutrons DAN instrument on NASA Mars rover Curiosity against the distance the rover has driven, in meters.
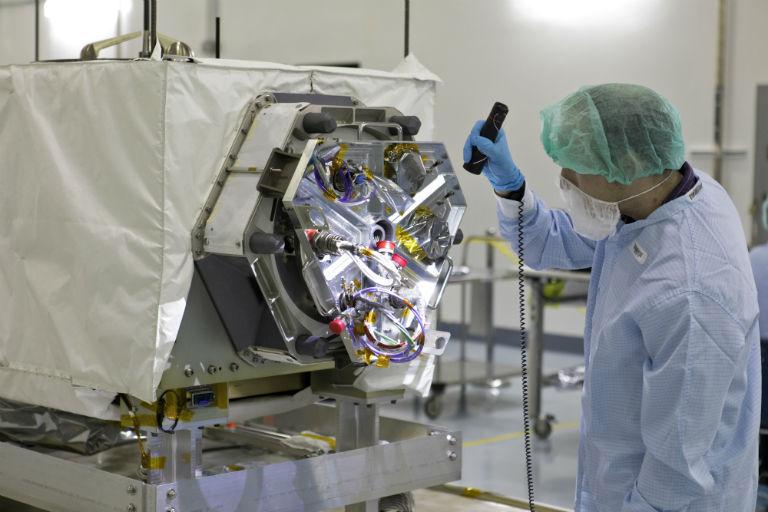
A technician inspects NASA's ECOSTRESS instrument in a clean room at Kennedy Space Center in Florida. ECOSTRESS measures the temperature of plants, which shows how they are regulating their water use in response to heat stress. https://photojournal.jpl.nasa.gov/catalog/PIA22509

The ChemCam instrument on NASA Curiosity Mars rover fired its laser 50 times at its onboard graphite target showing spectral measurements from the first shot, which hit dust on the target, compared to spectral measurements of from the 50th shot.
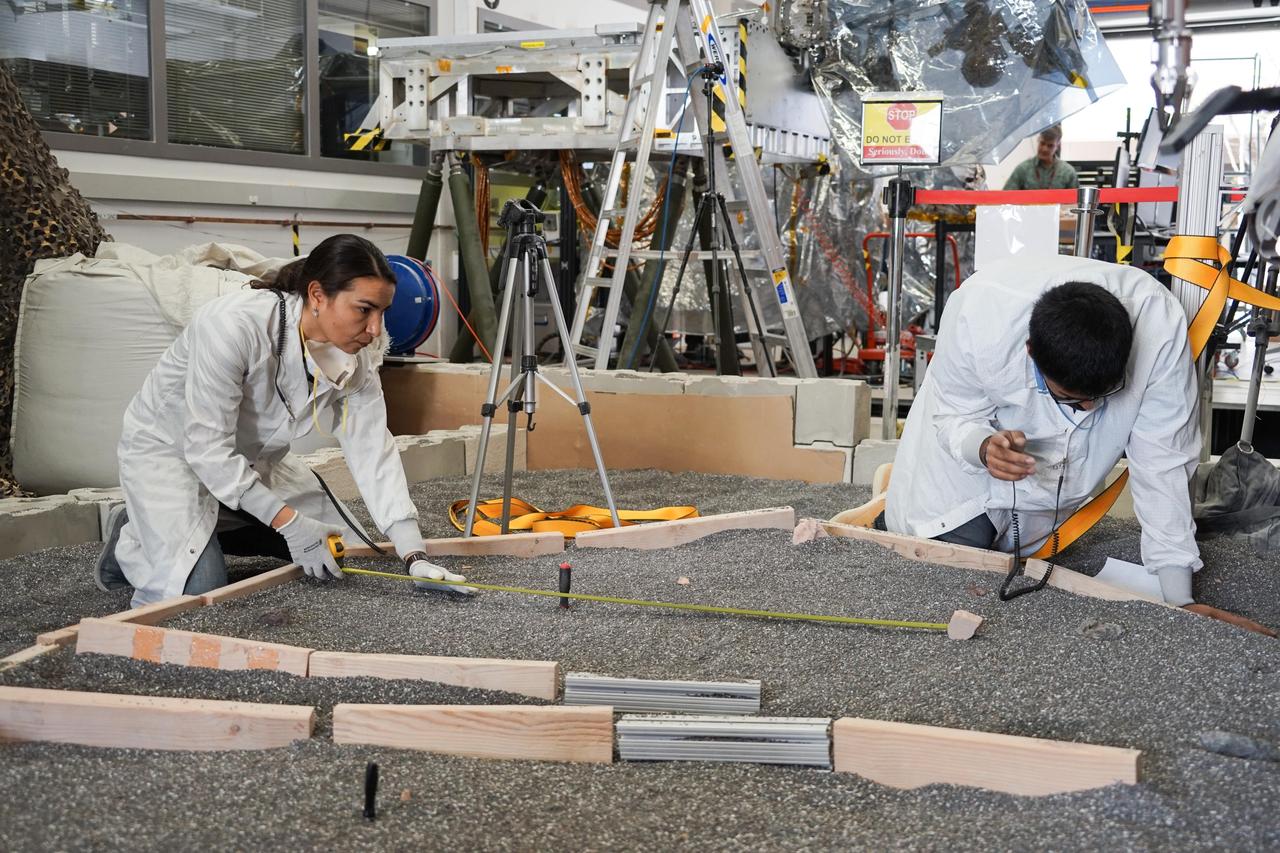
Engineers Marleen Sundgaard (left) and Pranay Mishra measure their test lander's "workspace" -- the terrain where scientists want to set InSight's instruments -- at NASA's Jet Propulsion Laboratory in Pasadena, California. Making sure each feature of the workspace on Mars is mimicked here on Earth allows for more reliable tests to be performed before actually setting down InSight's instruments. https://photojournal.jpl.nasa.gov/catalog/PIA22880
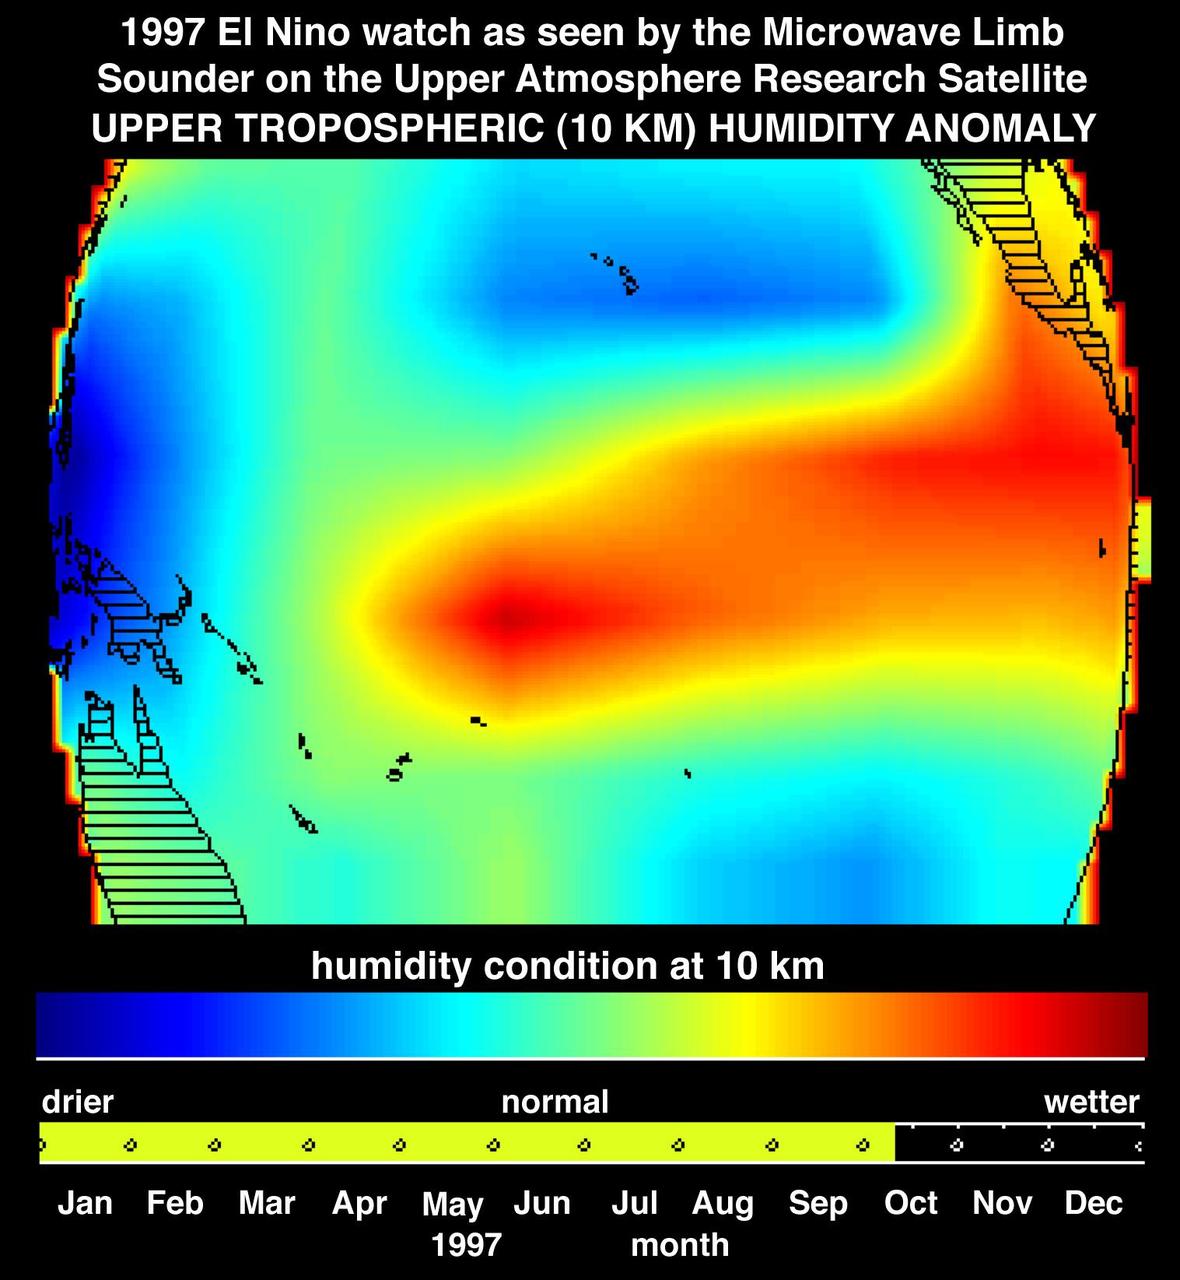
This image shows atmospheric water vapor in Earth upper troposphere, about 10 kilometers 6 miles above the surface, as measured by NASA Microwave Limb Sounder MLS instrument flying aboard the Upper Atmosphere Research Satellite.
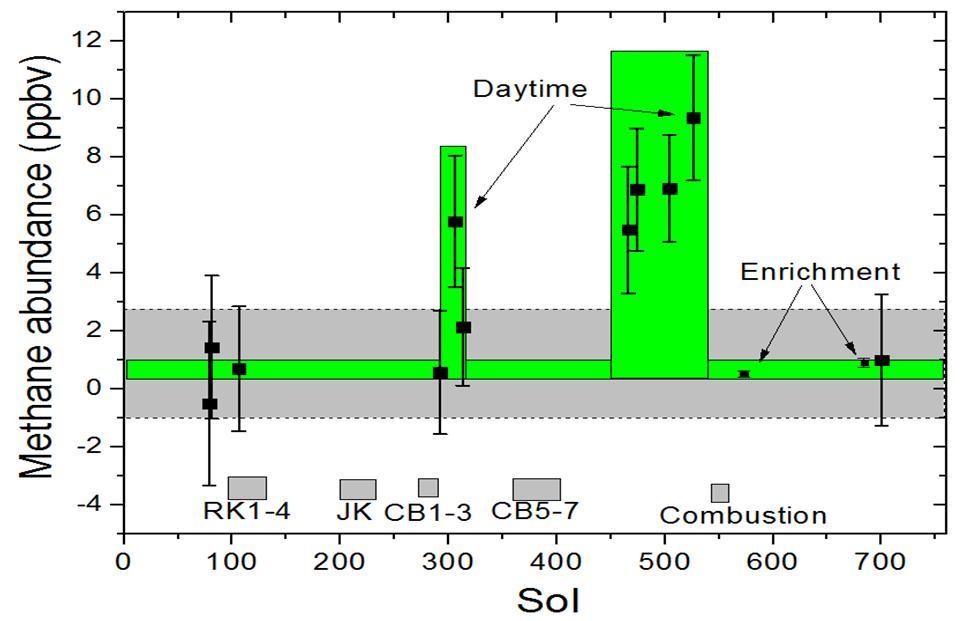
This graphic shows tenfold spiking in the abundance of methane in the Martian atmosphere surrounding NASA Curiosity Mars rover, as detected by a series of measurements made with the Tunable Laser Spectrometer instrument in the rover laboratory suite.
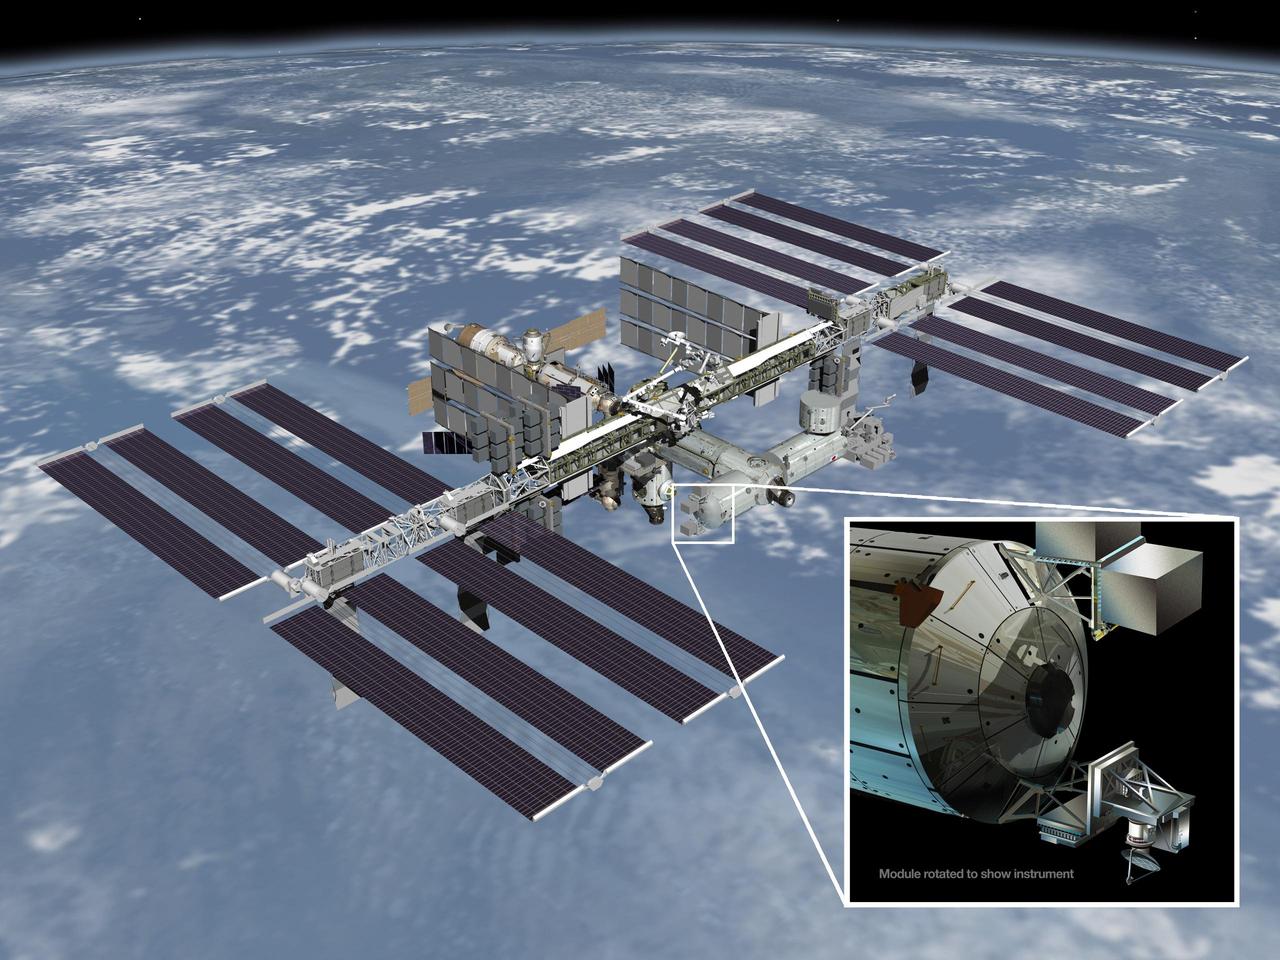
Artist rendering of NASA ISS-RapidScat instrument inset, which will launch to the International Space Station in 2014 to measure ocean surface wind speed and direction and help improve weather forecasts, including hurricane monitoring.
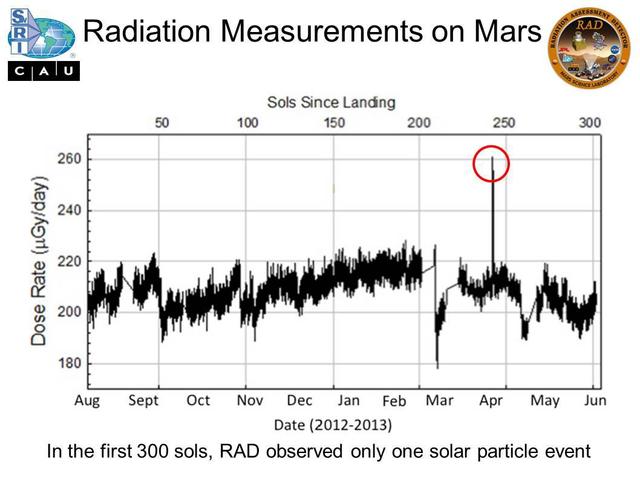
Micrograys are unit of measurement for absorbed radiation dose. The vertical axis is in micrograys per day. The RAD instrument on NASA Curiosity Mars rover monitors the natural radiation environment at the surface of Mars.
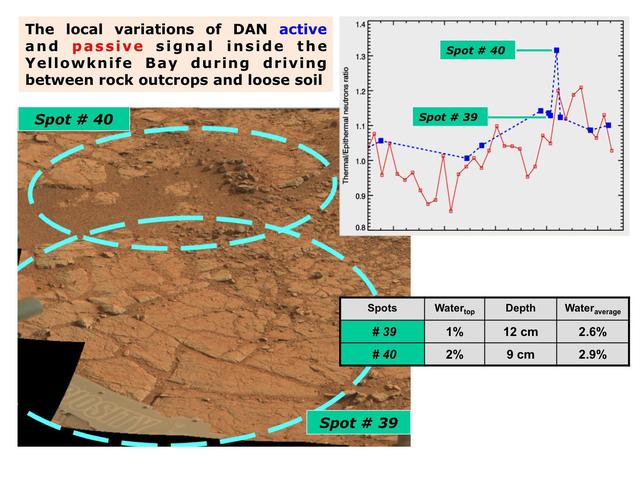
The Dynamic Albedo of Neutrons DAN instrument on NASA Mars rover Curiosity took measurement on a rock outcrop Spot 39 and on loose soil Spot 40 within the Yellowknife Bay area of Mars Gale Crater.
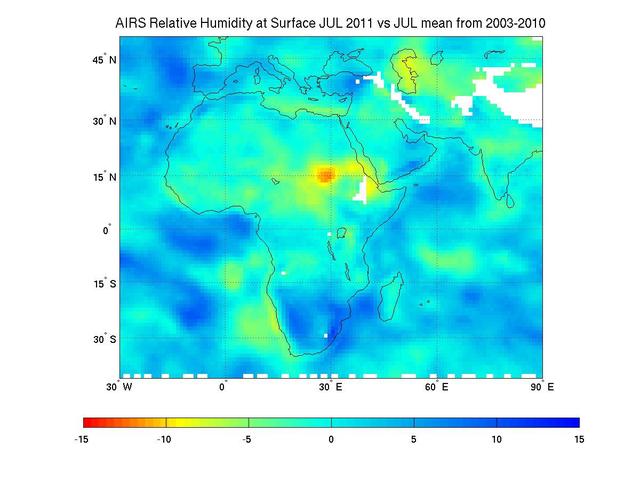
Surface relative humidity anomalies in percent, during July 2011 compared to the average surface relative humidity over the previous eight years, as measured by NASA Aqua instrument AIRS. The driest areas are shown in oranges and reds.
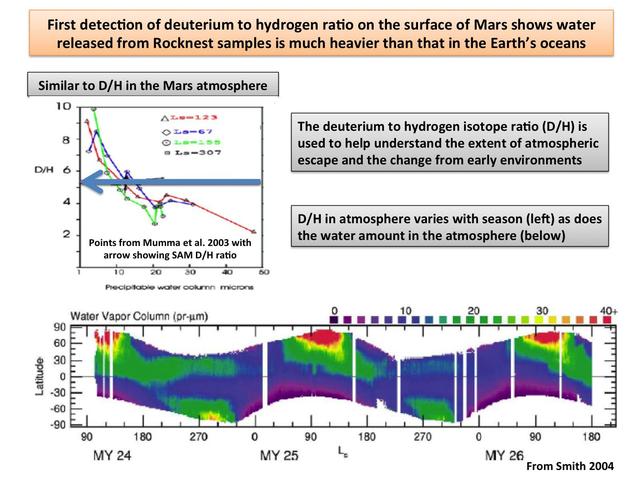
This plot shows the first-ever look at the deuterium to hydrogen ratio measured from the surface of Mars, as detected by the Sample Analysis at Mars instrument, or SAM, on NASA Curiosity rover.
NASA Deep Space 1 flew by comet Borrelly on September 22, 2001 and took these measurements with its plasma instruments. These data show that the flow of ions around the comet rocky, icy nucleus.
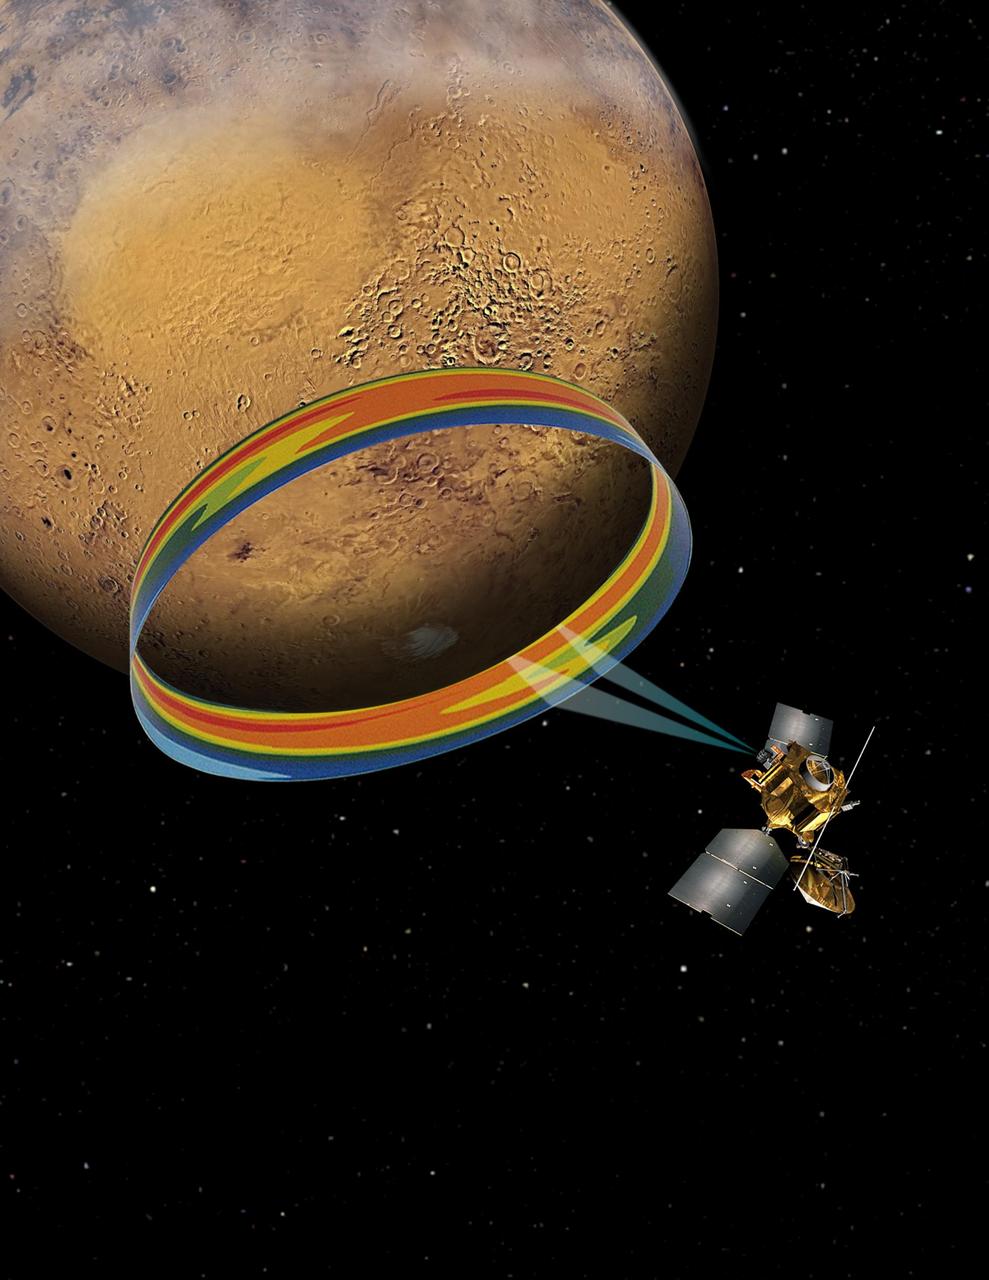
This graphic depicts the Mars Climate Sounder instrument on NASA Mars Reconnaissance Orbiter measuring the temperature of a cross section of the Martian atmosphere as the orbiter passes above the south polar region.
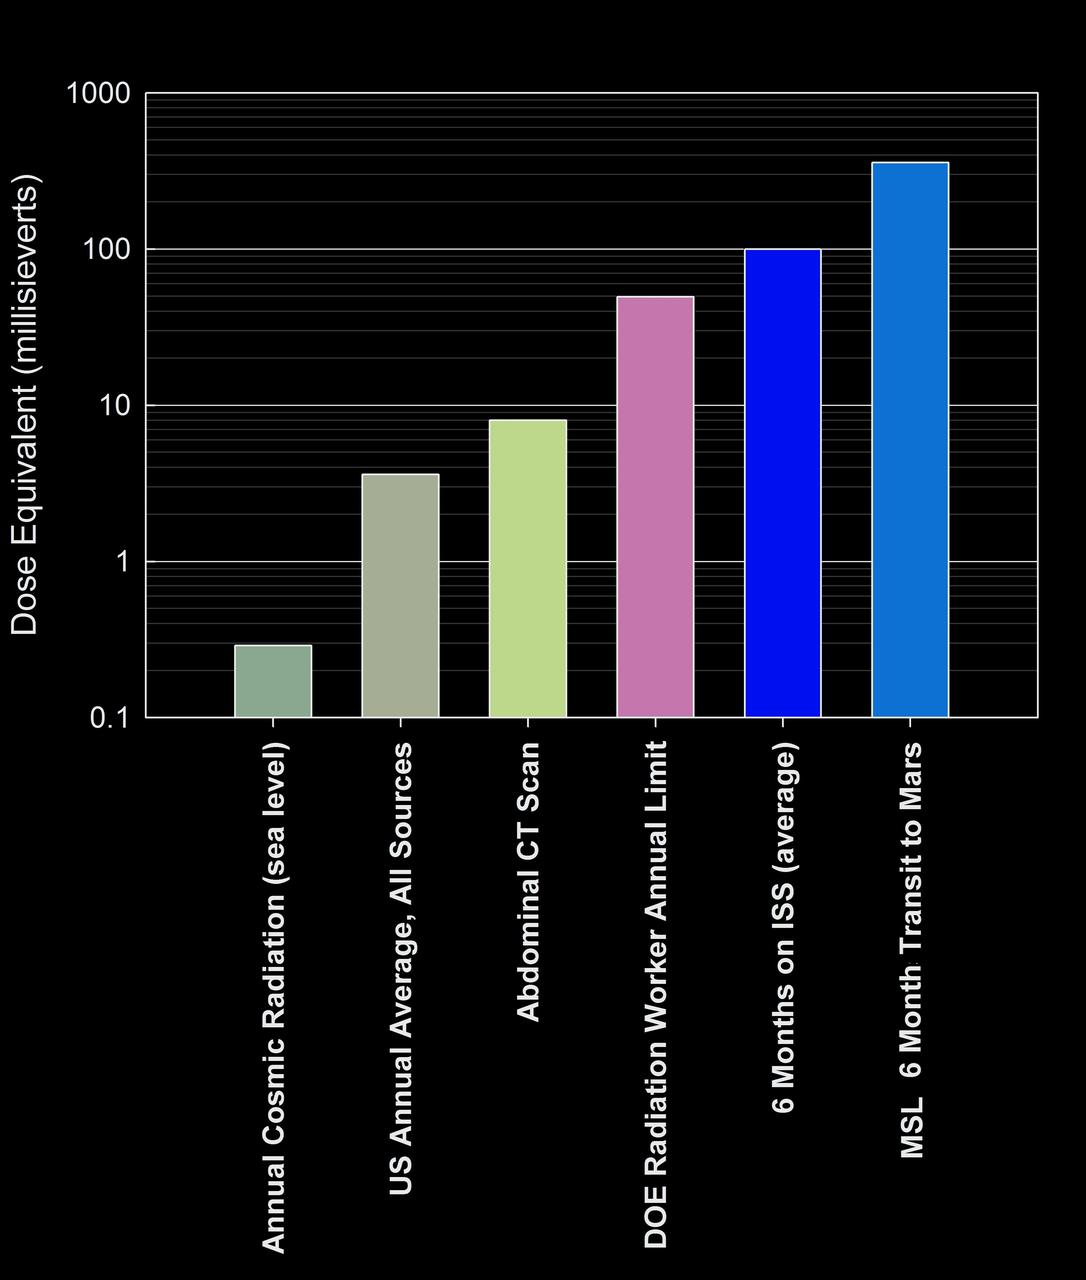
This graphic compares the radiation dose equivalent for several types of experiences, including a calculation for a trip from Earth to Mars based on measurements made by the RAD instrument shielded inside NASA Mars Science Laboratory spacecraft.
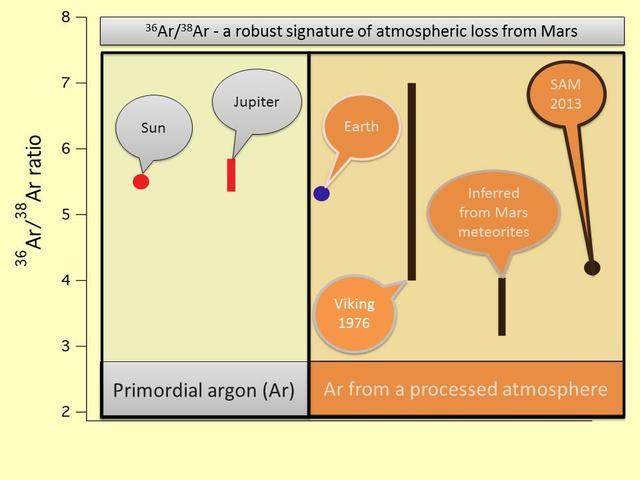
This image, made by the quadrupole mass spectrometer in the SAM suite of instruments in NASA Curiosity Mars rover. shows the ratio of the argon isotope argon-36 to the heavier argon isotope argon-38, in various measurements.
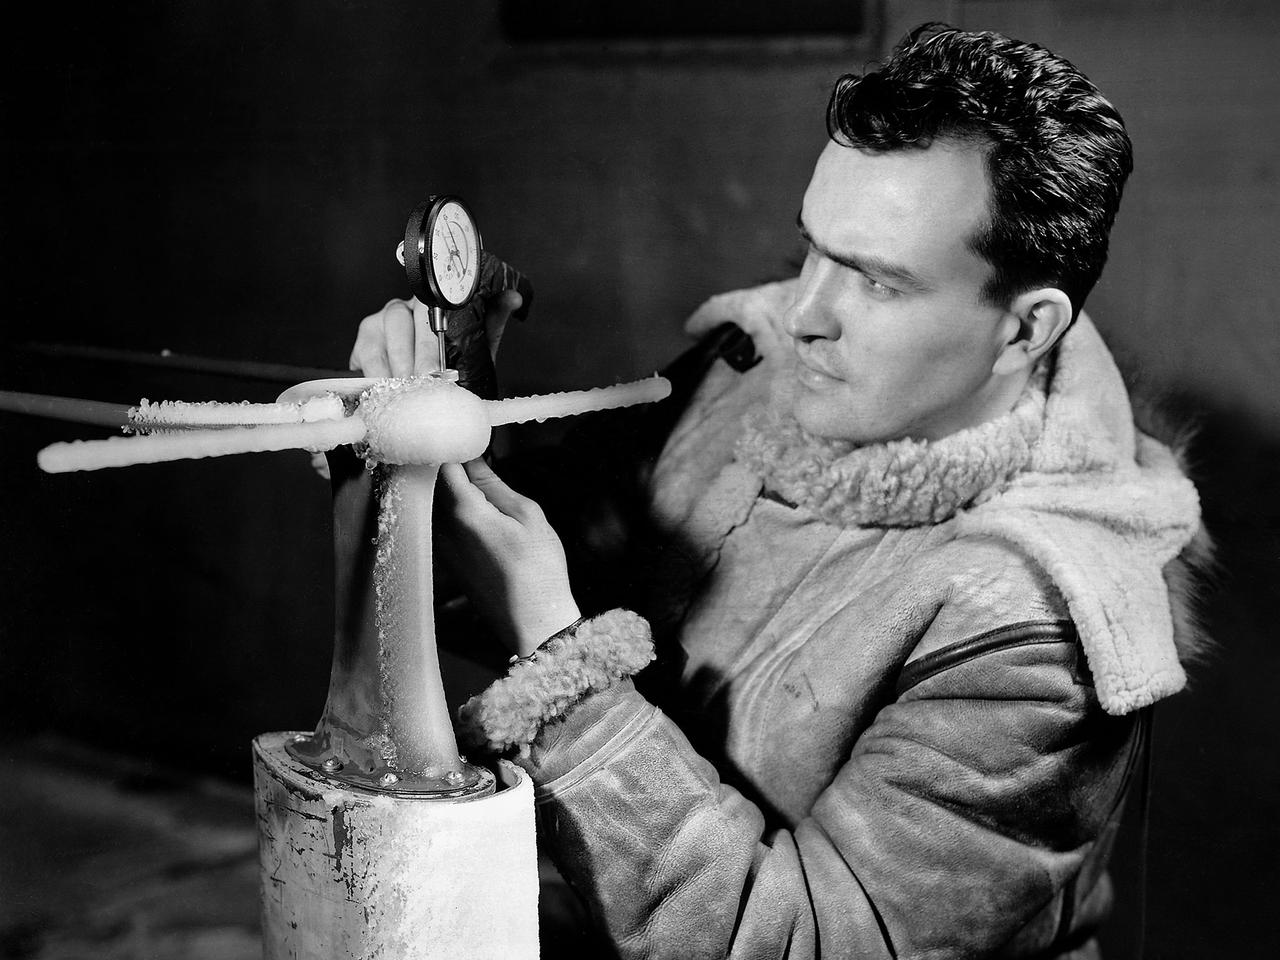
A National Advisory Committee for Aeronautics (NACA) researcher measures the ice thickness on a landing antenna model in the Icing Research Tunnel at the Aircraft Engine Research Laboratory. NACA design engineers added the Icing Research Tunnel to the original layout of the new Aircraft Engine Research Laboratory to take advantage of the massive refrigeration system being built for the Altitude Wind Tunnel. The Icing Research Tunnel was built to study the formation of ice on aircraft surfaces and methods of preventing or eradicating that ice. Ice buildup adds extra weight, effects aerodynamics, and sometimes blocks air flow through engines. The Icing Research Tunnel is a closed-loop atmospheric wind tunnel with a 6- by 9-foot test section. Carrier Corporation refrigeration equipment reduced the internal air temperature to -45 degrees F and a spray bar system injected water droplets into the air stream. The 24-foot diameter drive fan, seen in this photograph, created air flows velocities up to 400 miles per hour. The Icing Research Tunnel began testing in June of 1944. Early testing, seen in this photograph, studied ice accumulation on propellers and antenna of a military aircraft. The Icing Research Tunnel’s designers, however, struggled to develop a realistic spray system since they did not have access to data on the size of naturally occurring water droplets. The system would have to generate small droplets, distribute them uniformly throughout the airstream, and resist freezing and blockage. For five years a variety of different designs were painstakingly developed and tested before the system was perfected.
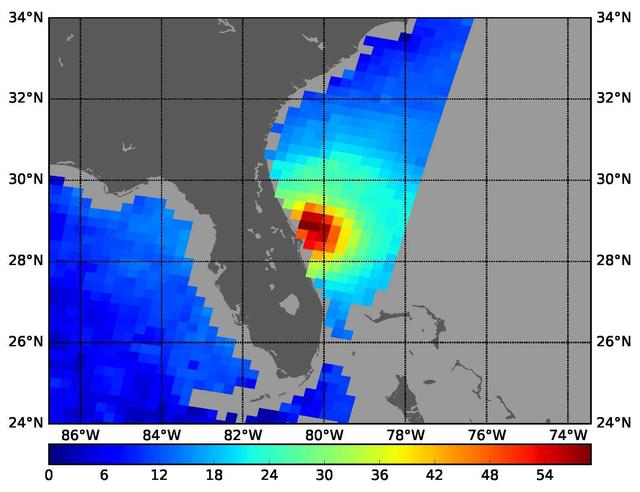
NASA's SMAP radiometer instrument measured Hurricane Matthew's wind speeds at 4:52 a.m. PDT (7:52 a.m. EDT) at up to 132 miles per hour (59 meters per second). SMAP has excellent sensitivity to extreme winds, far beyond that of typical scatterometer instruments now in orbit. http://photojournal.jpl.nasa.gov/catalog/PIA21096
S65-58941 (27 Aug. 1965) --- U.S. Air Force Weapons Laboratory D-8 (Radiation in Space) experiment for Gemini-6 spaceflight. Kennedy Space Center alternative photo number is 104-KSC-65C-5533. Photo credit: NASA

The data captured here is one of the outputs of a September 2023 test conducted at NASA's Jet Propulsion Laboratory of a state-of-the-art imaging spectrometer instrument, which will measure the greenhouse gases methane and carbon dioxide from space. The instrument successfully detected the presence of methane (dark blue line near the top of the rainbow band), a greenhouse gas, in a sample cylinder. The rainbow band shown on a screen here is a measure of the intensity of a spectrum of light. Blue is low intensity and red is high intensity. Designed and built by JPL, imaging spectrometer will be part of an effort led by the nonprofit Carbon Mapper organization to collect data on greenhouse gas point-source emissions. The information will help locate and quantify "super-emitters" – the small percentage of individual sources responsible for a significant fraction of methane and carbon dioxide emissions around the world. https://photojournal.jpl.nasa.gov/catalog/PIA26096
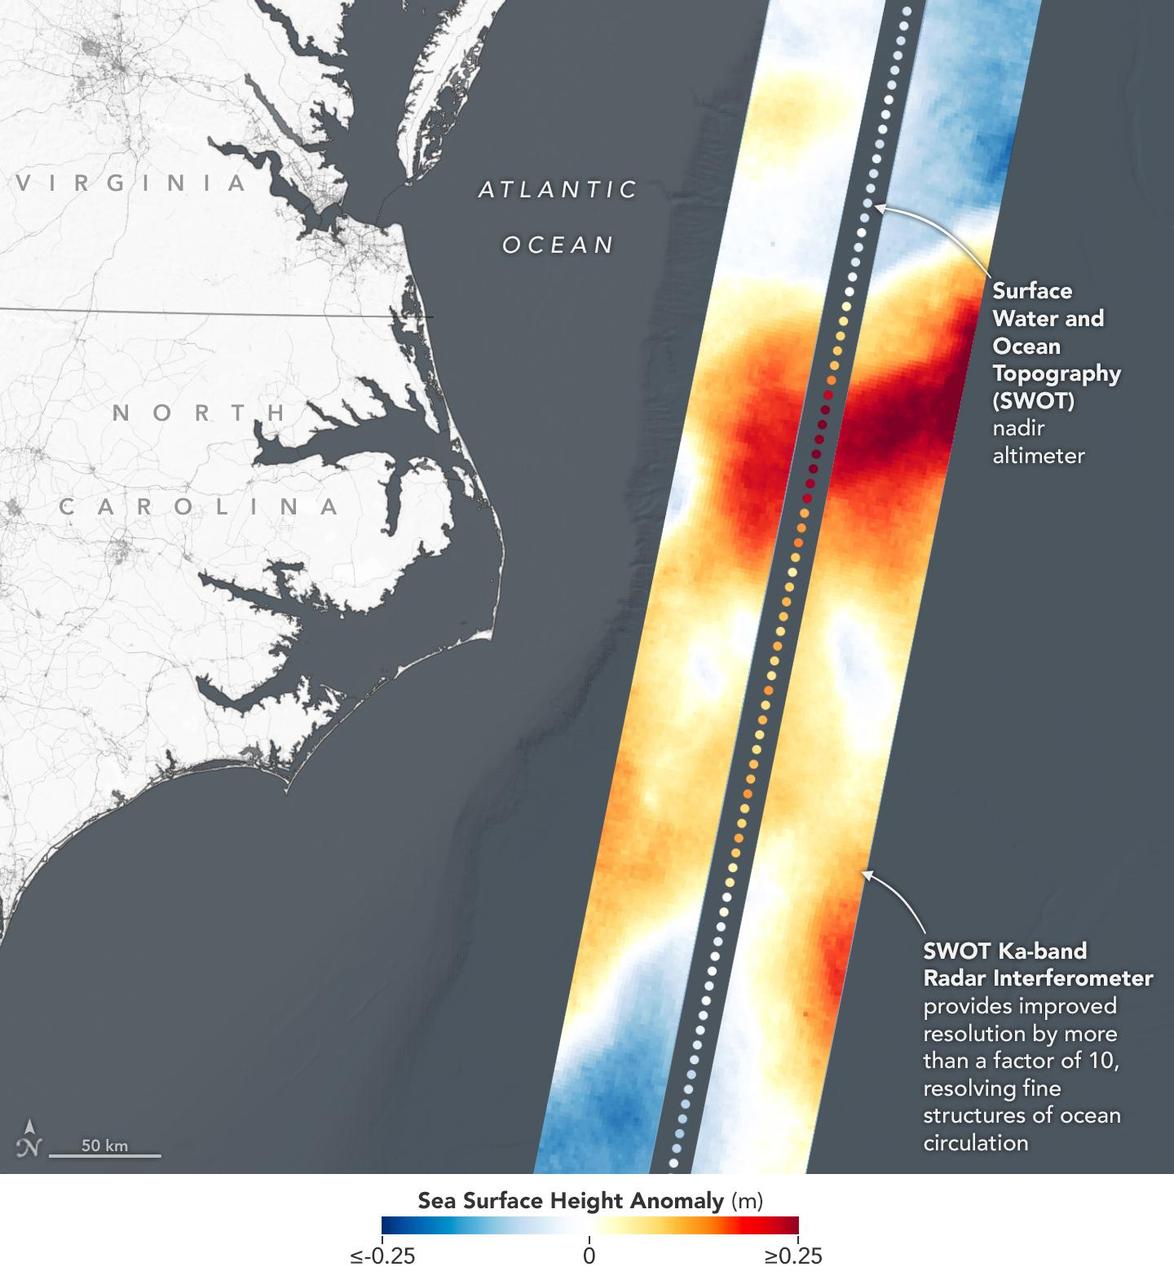
This visualization shows sea surface height measurements in the Gulf Stream off the coast of North Carolina and Virginia. The data was collected on Jan. 21, 2023, by an instrument on the Surface Water and Ocean Topography (SWOT) satellite called the Ka-band Radar Interferometer (KaRIn). KaRIn's two antennas acquired data that was mapped as two wide, colored strips spanning a total of 75 miles (120 kilometers) across. In the visualization, red and orange areas represent sea levels that are higher than the global average, while shades of blue represent sea levels that are lower than average. The spatial resolution of SWOT ocean measurements is 10 times greater than the composite of sea surface height data gathered over the same area by seven other satellites that same day. KaRIn is the scientific heart of the SWOT mission. It's a radar instrument with one antenna at each end of a boom that's 33 feet (10 meters) long. This enables KaRIn to look off to either side of a center line directly below the satellite as the instrument bounces microwave signals off of Earth's surface. The returning radar signals arrive at each antenna slightly out of step, or phase, from one another. When these signals are combined with other information about the antennas and the satellite's altitude, scientists will be able to map the height of water on Earth's surface with never-before-seen clarity. Led by NASA and the French space agency Centre National d'Études Spatiales (CNES), SWOT will measure the height of water on over 90% of Earth's surface, providing a high-definition survey of our planet's water for the first time. The satellite's measurements of freshwater bodies and the ocean will provide insights into how the ocean influences climate change; how a warming world affects lakes, rivers, and reservoirs; and how communities can better prepare for disasters like floods. Launched on Dec. 16, 2022, from Vandenberg Space Force Base in central California, SWOT is now in a six-month period called commissioning, calibration and validation. This is when engineers on the mission check out the satellite's systems and science instruments to ensure data accuracy before the start of science operations in July. https://photojournal.jpl.nasa.gov/catalog/PIA25772
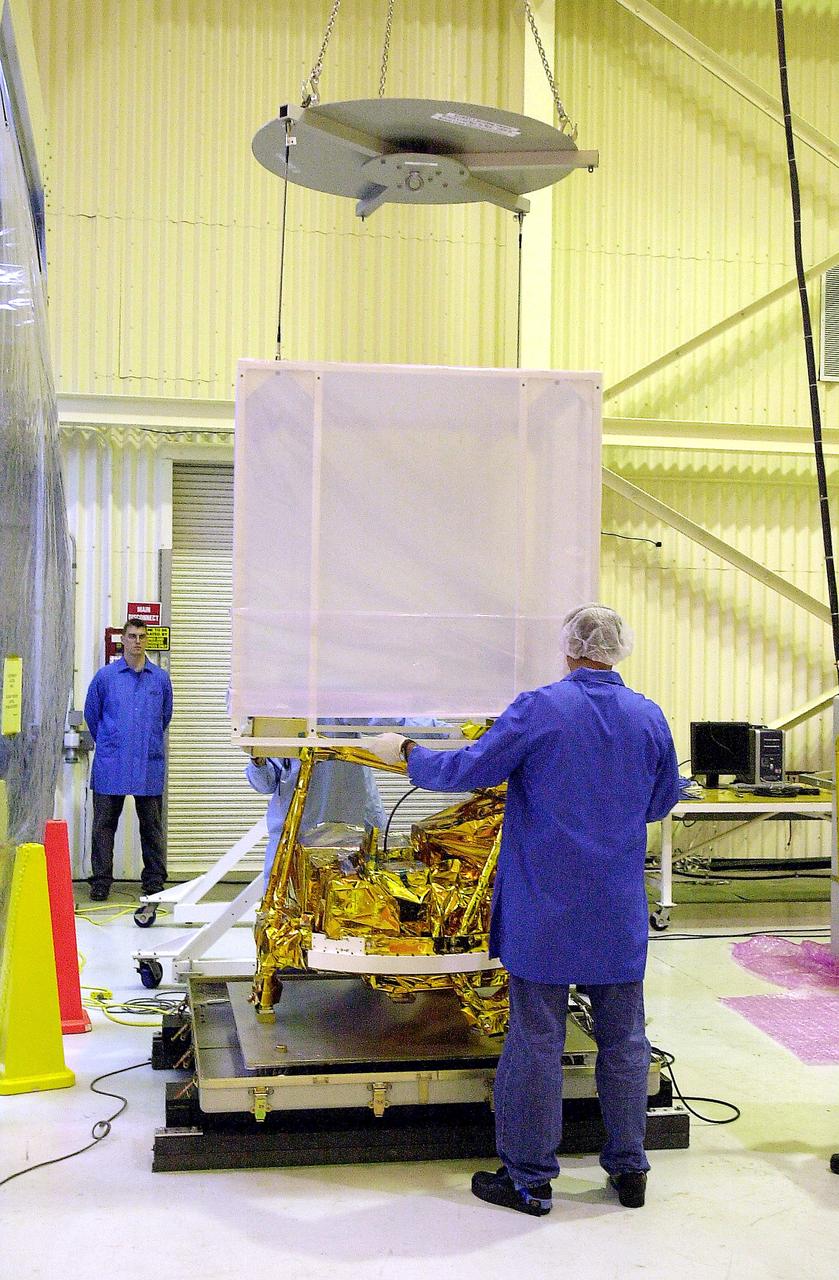
VANDENBERG AIR FORCE BASE, CALIF.- The cover is being lifted off SciSat-1 spacecraft at Vandenberg Air Force Base, Calif. Sci-Sat, which will undergo instrument checkout and spacecraft functional testing, weighs approximately 330 pounds and after launch will be placed in a 400-mile-high polar orbit to investigate processes that control the distribution of ozone in the upper atmosphere. The data from the satellite will provide Canadian and international scientists with improved measurements relating to global ozone processes and help policymakers assess existing environmental policy and develop protective measures for improving the health of our atmosphere, preventing further ozone depletion. The mission is designed to last two years.
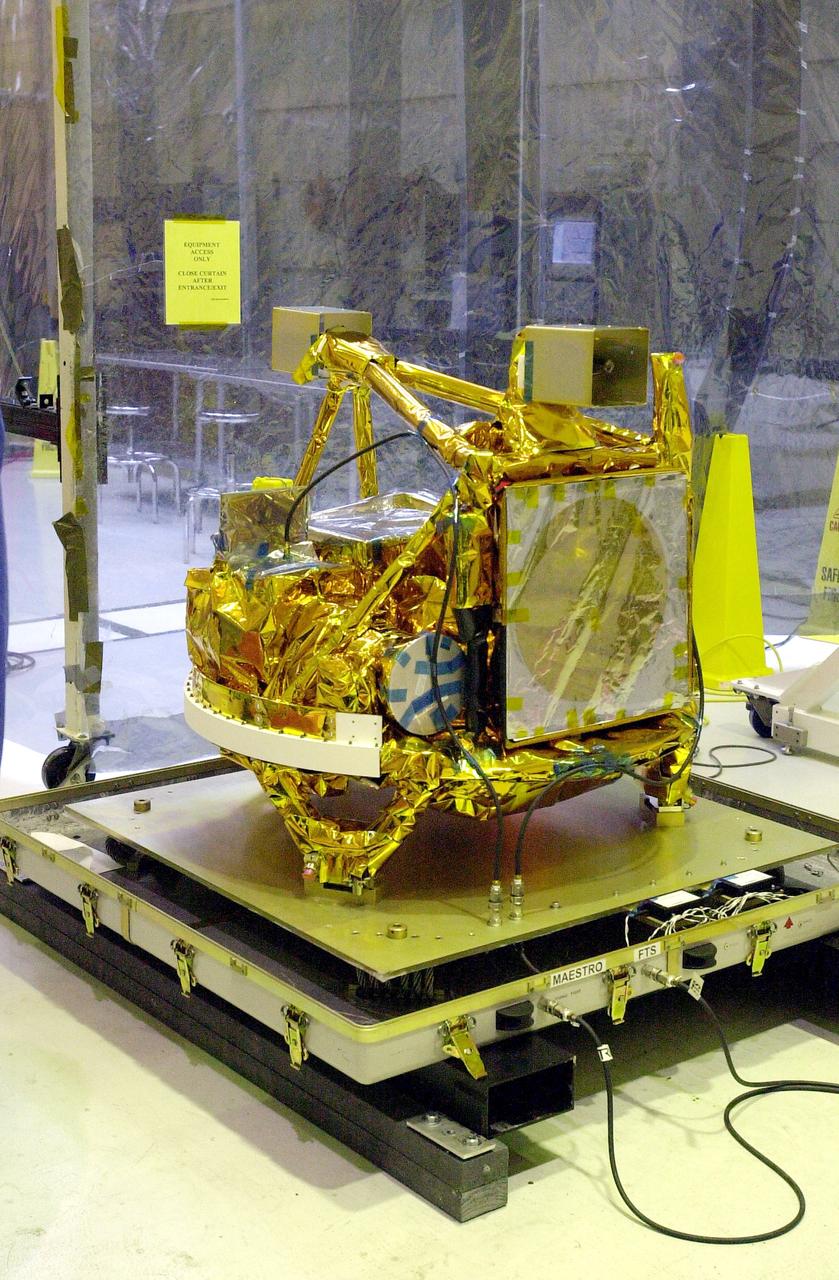
VANDENBERG AIR FORCE BASE, CALIF. - The SciSat-1 spacecraft is revealed at Vandenberg Air Force Base, Calif. Sci-Sat, which will undergo instrument checkout and spacecraft functional testing, weighs approximately 330 pounds and after launch will be placed in a 400-mile-high polar orbit to investigate processes that control the distribution of ozone in the upper atmosphere. The data from the satellite will provide Canadian and international scientists with improved measurements relating to global ozone processes and help policymakers assess existing environmental policy and develop protective measures for improving the health of our atmosphere, preventing further ozone depletion. The mission is designed to last two years.
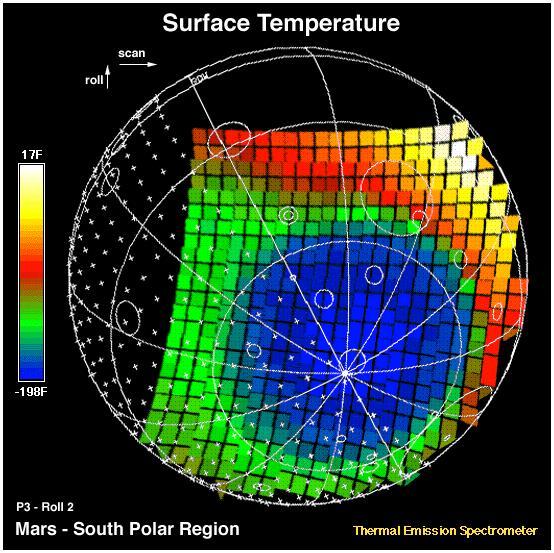
This image shows the temperature of the martian surface measured by the Mars Global Surveyor Thermal Emission Spectrometer (TES) instrument. On September 15, 3 hours and 48 minutes after the spacecrafts third close approach to the planet, the TES instrument was commanded to point at Mars and measure the temperature of the surface during a four minute scan. At this time MGS was approximately 15,000 miles (~24,000 km) from the planet, with a view looking up from beneath the planet at the south polar region. The circular blue region (- 198 F) is the south polar cap of Mars that is composed of CO2 ice. The night side of the planet, shown with crosses, is generally cool (green). The sunlit side of the planet reaches temperatures near 15 F (yellow). Each square represents an individual observation acquired in 2 seconds with a ground resolution of ~125 miles (~200 km). The TES instrument will remain on and collect similar images every 100 minutes to monitor the temperature of the surface and atmosphere throughout the aerobraking phase of the MGS mission. http://photojournal.jpl.nasa.gov/catalog/PIA00937
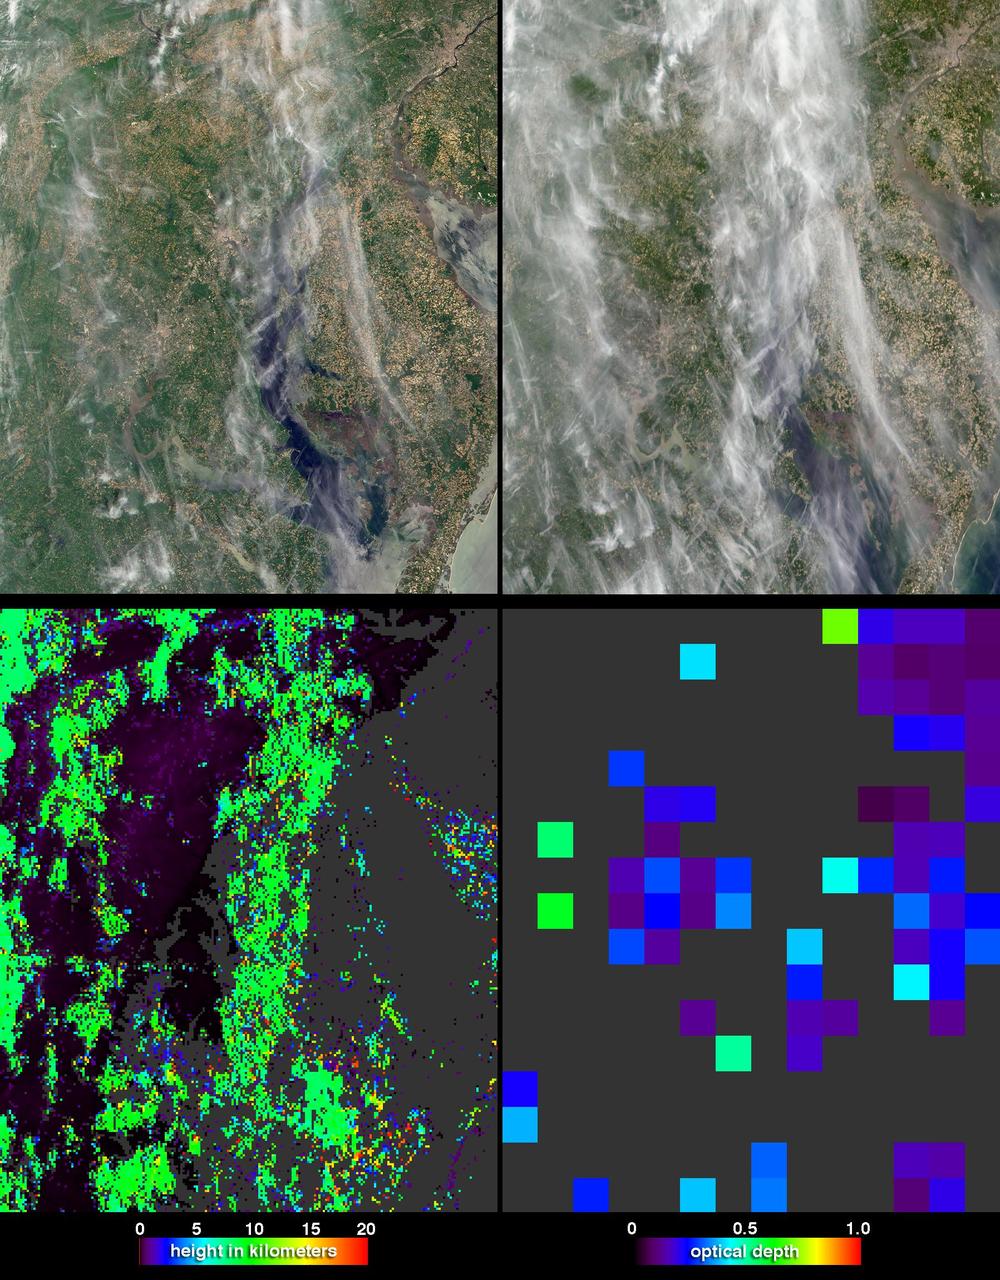
During Spring 2003, students, teachers, and scientists worked side-by-side, measuring the properties of aerosols fine particulate matter suspended in the air over Baltimore, Maryland using hand-held instruments shown here by NASA Terra spacecraft.
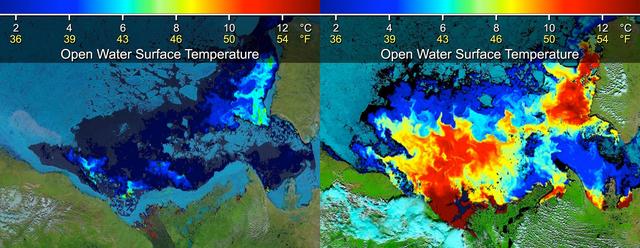
Beaufort Sea surface temperatures where Canada Mackenzie River discharges into the Arctic Ocean, measured by NASA MODIS instrument; warm river waters had broken through a shoreline sea ice barrier to enhance sea ice melt.
NASA Conducts Airborne Science Aboard Zeppelin Airship: equipped with two imaging instruments enabling remote sensing and atmospheric science measurements not previously practical. Pre-flight checkout of airship flight systems and instruments.
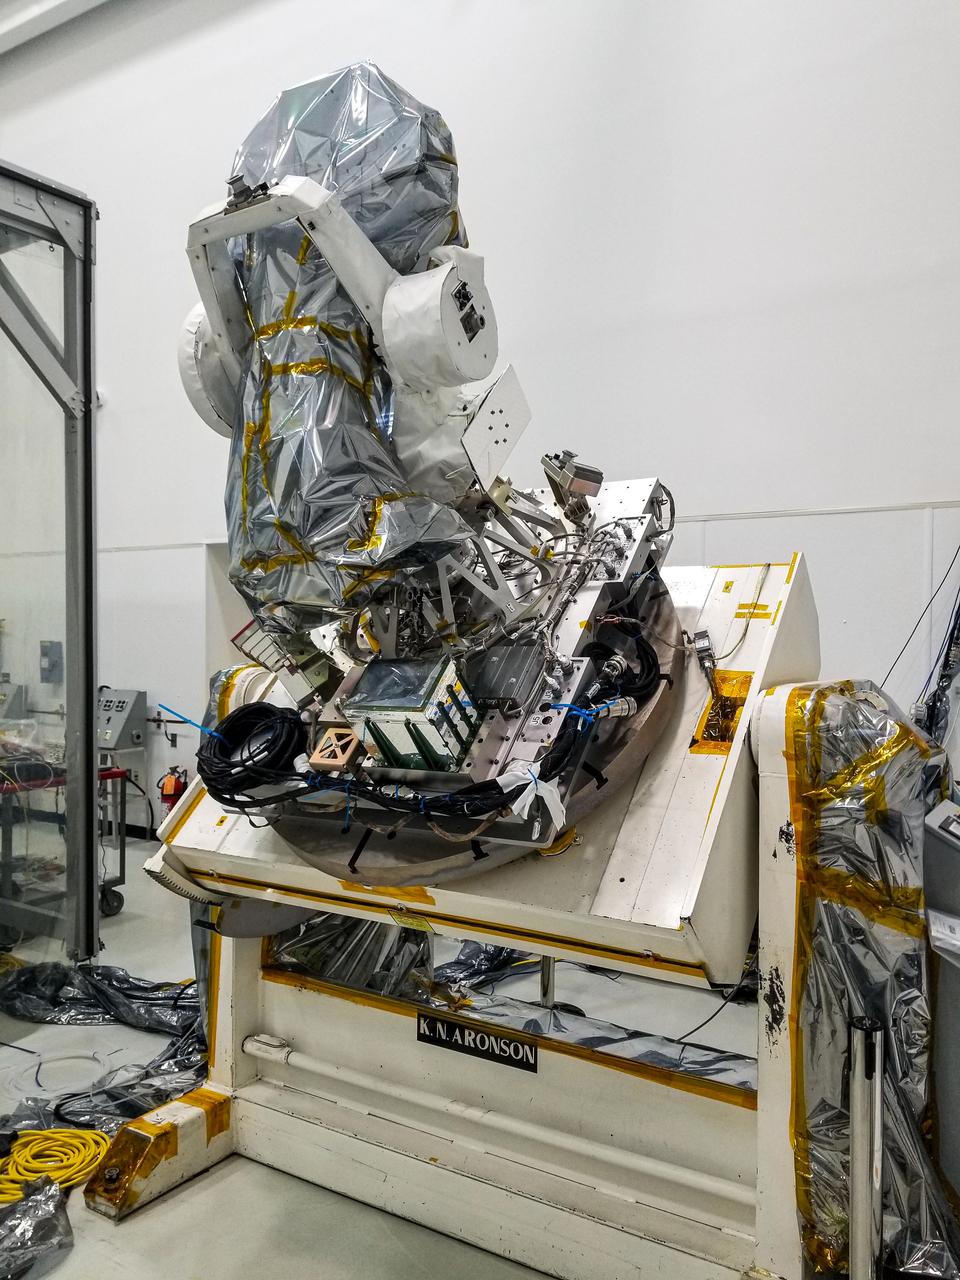
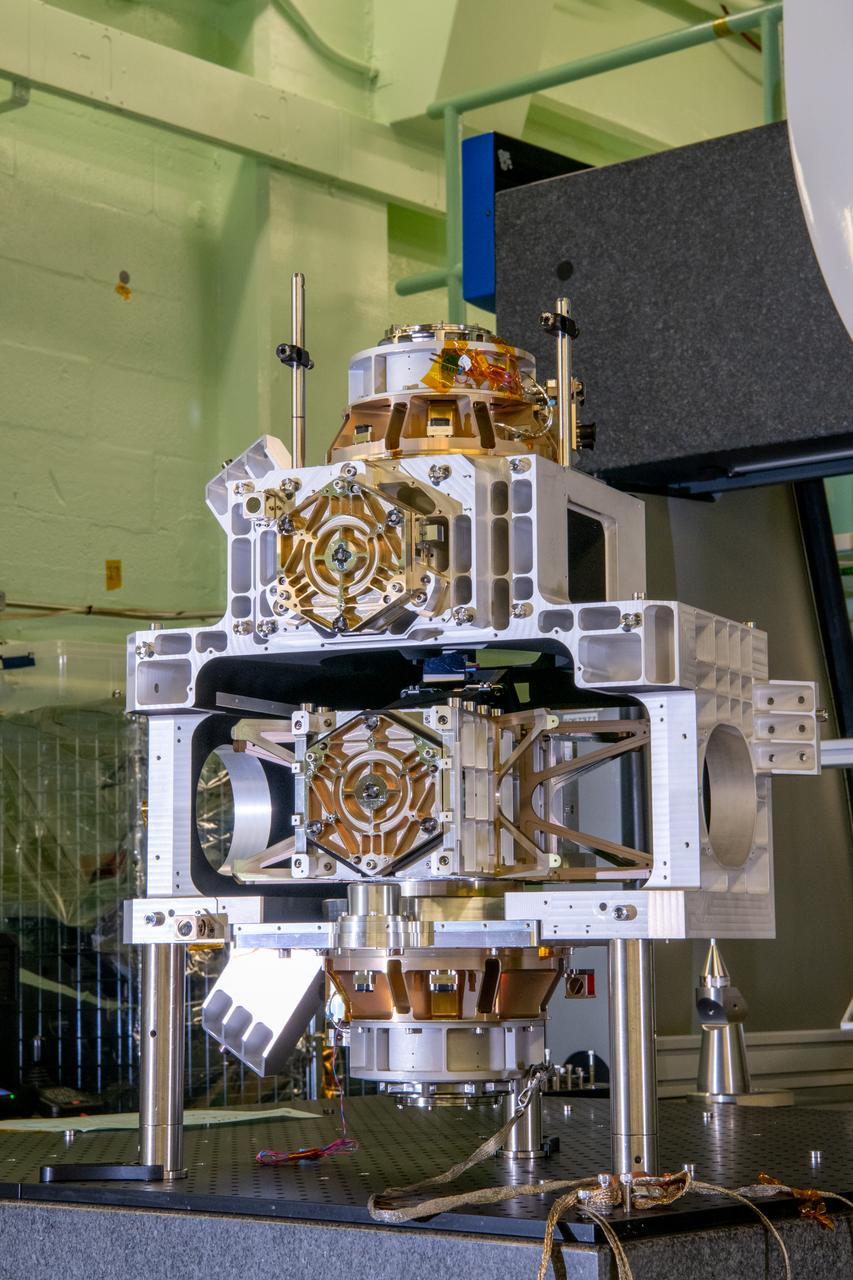
jsc2024e061948 (10/31/2023) --- The COronal Diagnostic EXperiment (CODEX) instrument undergoes the Aronson test where the instrument center of gravity and moments of inertia are measured. Credit: CODEX team / NASA
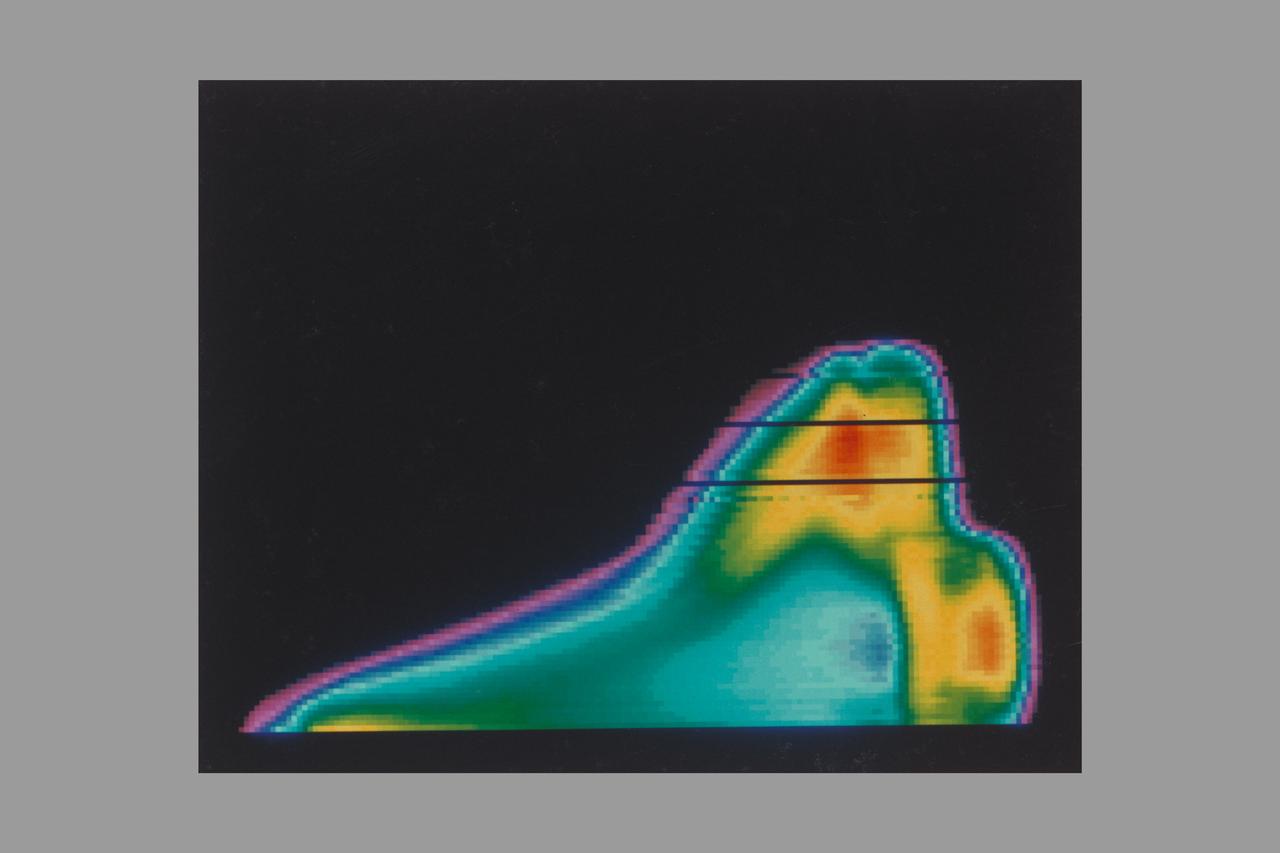
Heating pattern of the Space Shuttle as measured by infrared instruments aboard the Kuiper Airborne Observatory (KAO)
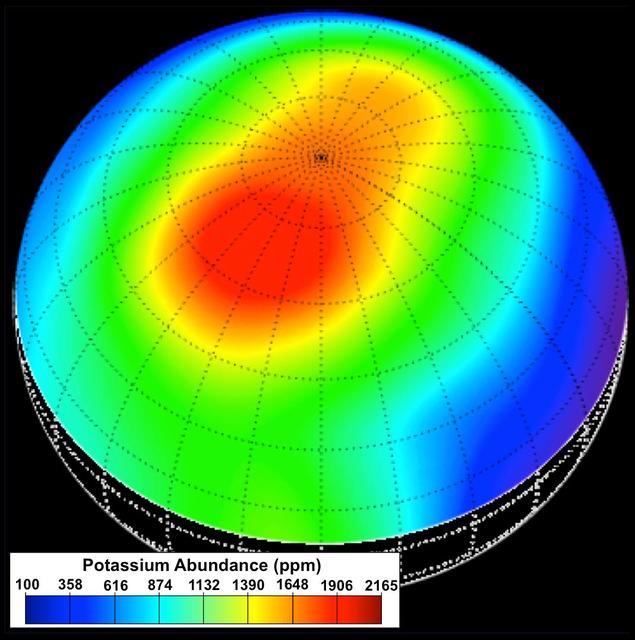
During the first year of NASA MESSENGER orbital mission, the spacecraft GRS instrument measured the elemental composition of Mercury surface materials. mong the most important discoveries from the GRS was the observation of higher abundances of the moderately volatile elements potassium, sodium, and chlorine than expected from previous scientific models and theories. Particularly high concentrations of these elements were observed at high northern latitudes, as illustrated in this potassium abundance map, which provides a view of the surface centered at 60° N latitude and 120° E longitude. This map was the first elemental map ever made of Mercury's surface and is to-date the only map to report absolute elemental concentrations, in comparison to element ratios. Prior to MESSENGER's arrival at Mercury, scientists expected that the planet would be depleted in moderately volatile elements, as is the case for our Moon. The unexpectedly high abundances observed with the GRS have forced a reevaluation of our understanding of the formation and evolution of Mercury. In addition, the K map provided the first evidence for distinct geochemical terranes on Mercury, as the high-potassium region was later found to also be distinct in its low Mg/Si, Ca/Si, S/Si, and high Na/Si and Cl/Si abundances. Instrument: Gamma-Ray Spectrometer (GRS) http://photojournal.jpl.nasa.gov/catalog/PIA19414
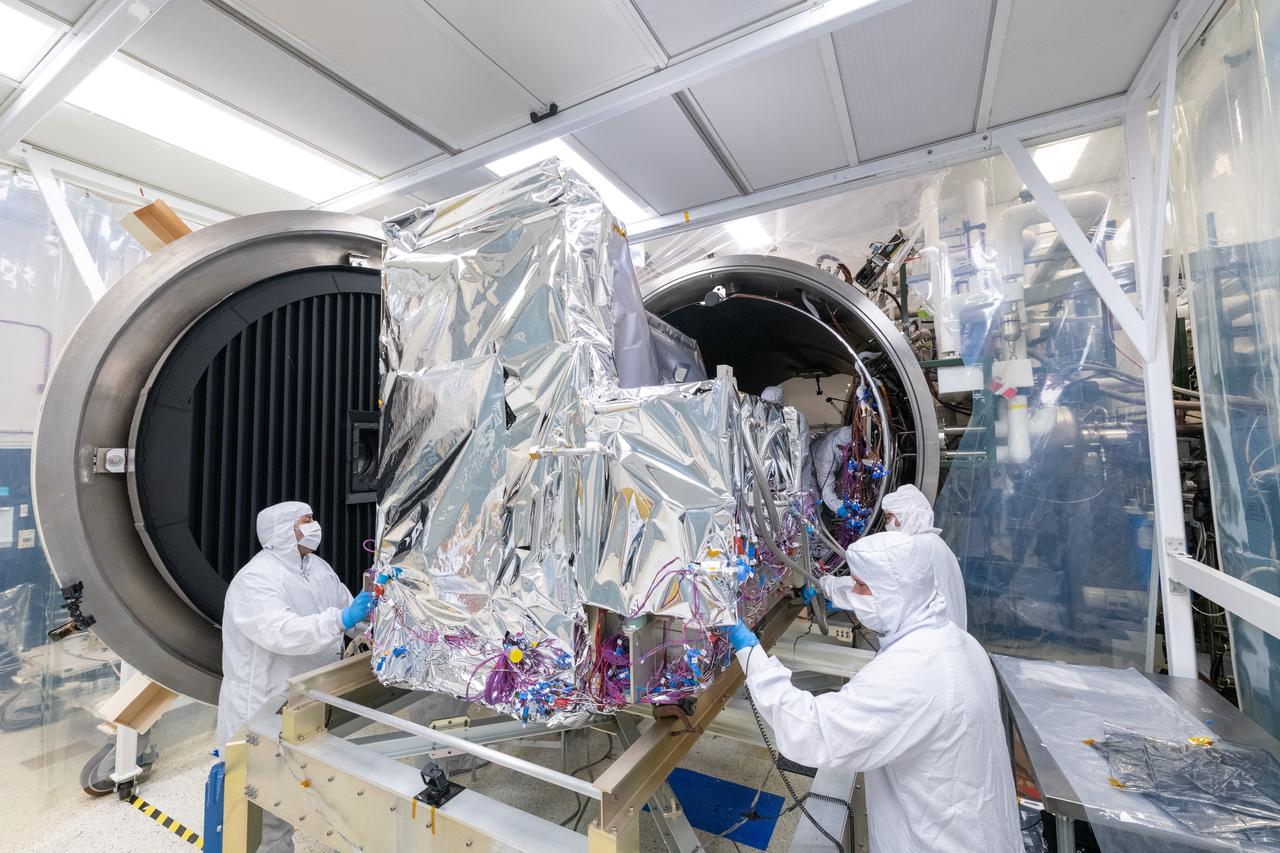
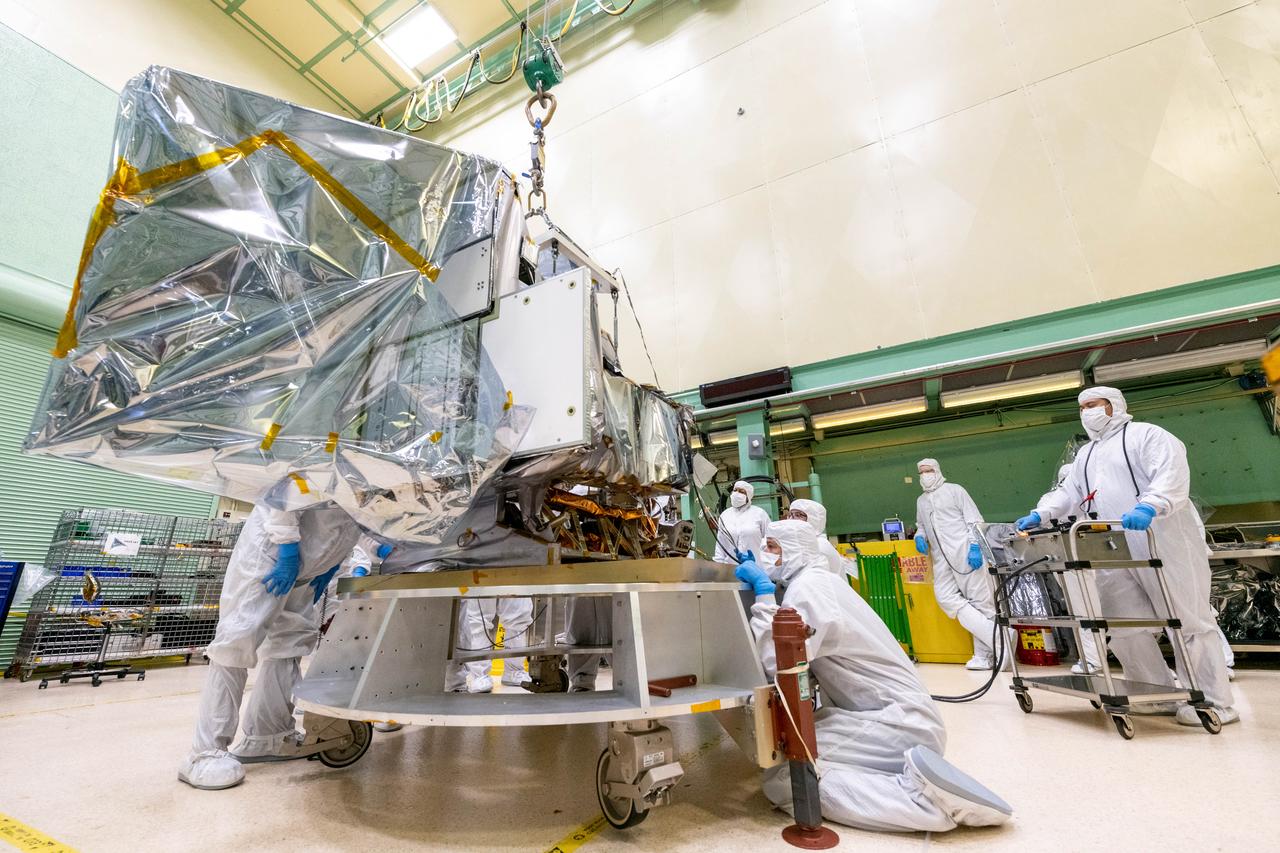
The Ocean Color Instrument (OCI) mechanical team aligns the instrument on a transportation sled and slowly pushes the instrument into a thermal vacuum chamber to prepare it for a sixty day thermal test to ensure the instrument will perform effectively once it launches into the airless environment of space. OCI is a highly advanced optical spectrometer that will be used to measure properties of light over portions of the electromagnetic spectrum. It will enable continuous measurement of light at finer wavelength resolution than previous NASA satellite sensors, extending key system ocean color data records for climate studies. OCI is PACE's (Plankton, Aerosol, Cloud, ocean Ecosystem) primary sensor built at Goddard Space Flight Center in Greenbelt, MD.
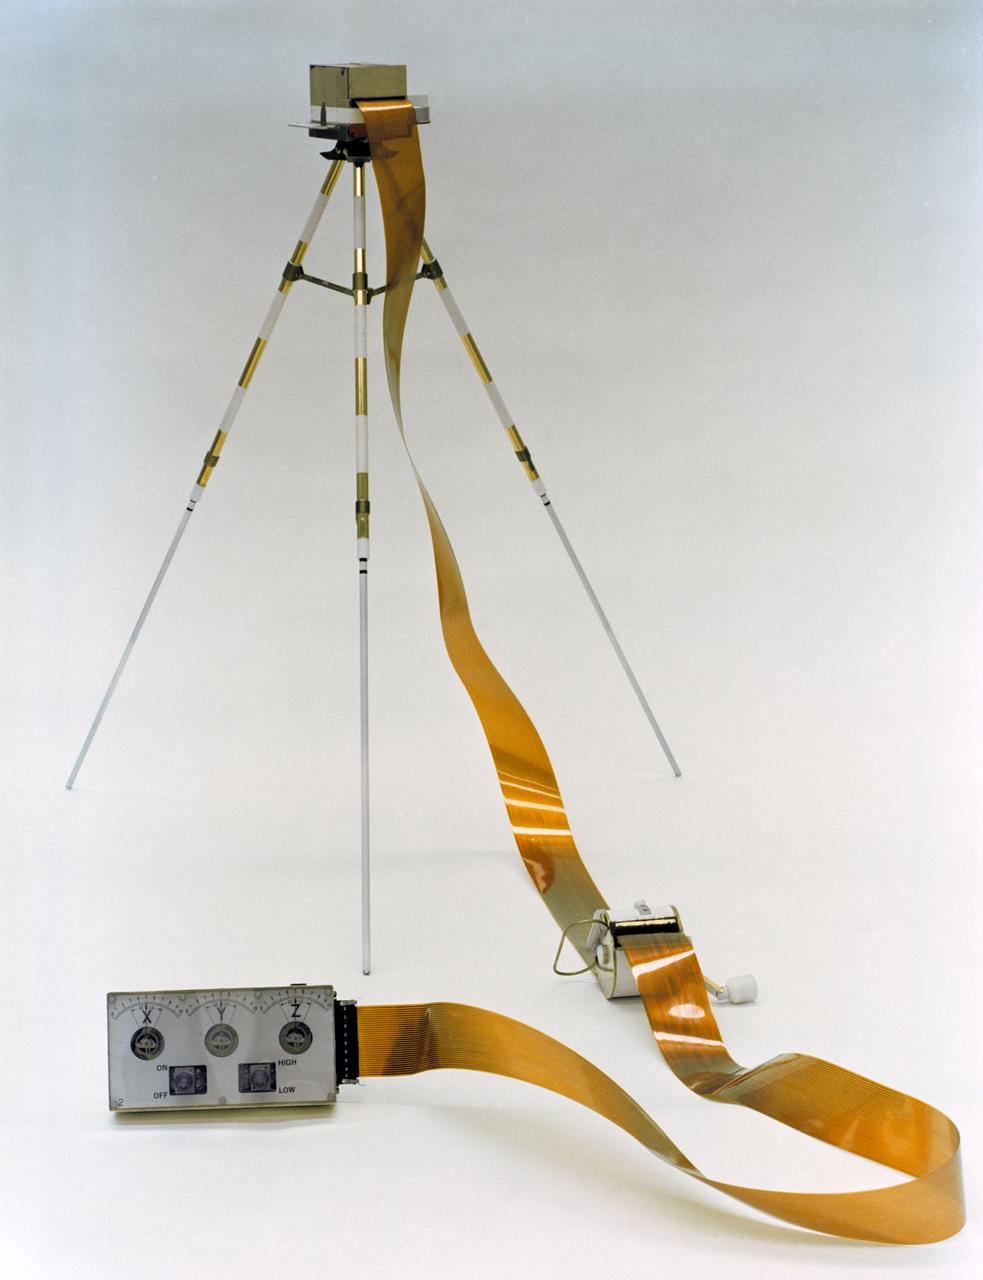
S70-56721 (December 1970) --- A close-up view of the Lunar Portable Magnetometer (LPM), which will be used by the crew of the Apollo 14 lunar landing mission during the second extravehicular activity (EVA). The LPM's components, a tripod-mounted flux-gate magnetometer sensor head and an electronics data package, connected by a 50-feet flat cable, function together to measure variations in the lunar magnetic field at several points on the geological traverse. Data gathered will be used to determine the location, strength and dimensions of magnetic sources, as well as knowledge of the local and total selenological structure. The LPM will be carried on the Modular Equipment Transporter (MET), and deployed by the lunar module pilot, who will align the sensor head at least 35 feet from the data package. The LM pilot will then return to the MET and verbally relay the LPM readouts to Earth. Astronaut Edgar D. Mitchell is the lunar module pilot for the Apollo 14 lunar landing mission.
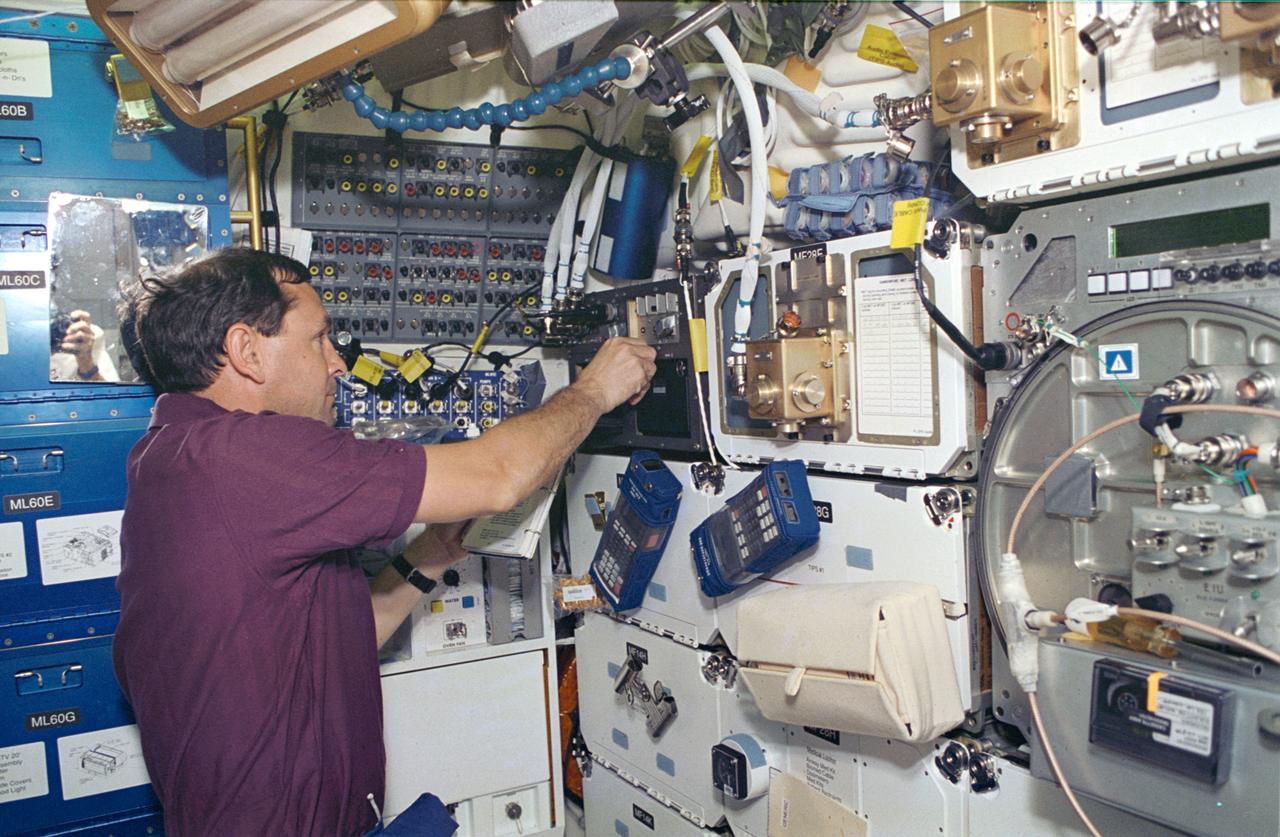
STS066-14-021 (3-14 Nov 1994) --- On the Space Shuttle Atlantis' mid-deck, astronaut Curtis L. Brown, Jr., pilot, works with the Space Acceleration Measurement System (SAMS), which is making its eleventh Shuttle flight. This system supports the Protein Crystal Growth (PCG) experiments onboard by collecting and recording data characterizing the microgravity environment in the Shuttle mid-deck. Brown joined four other NASA astronauts and a European Space Agency (ESA) astronaut for 11-days aboard Atlantis in support of the Atmospheric Laboratory for Applications and Science (ATLAS-3) mission.
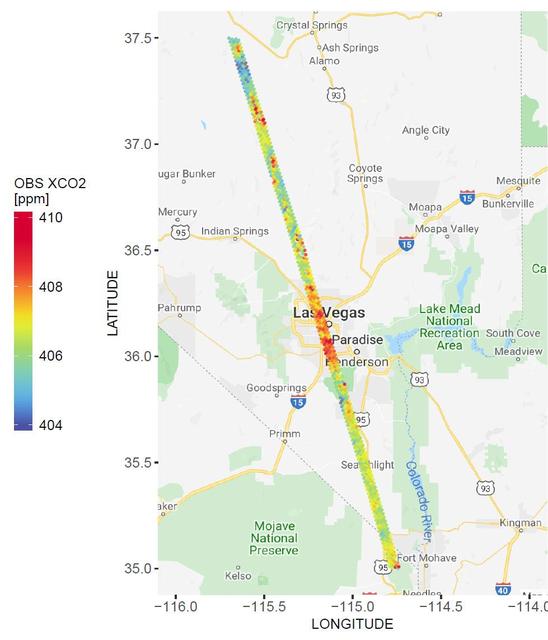
A spatial map of the amount of carbon dioxide (CO2) present in columns of the atmosphere below NASA's Orbiting Carbon Observatory-2 (OCO-2) satellite as it flew over Las Vegas on Feb. 8, 2018. Warmer colors over the city center indicate higher amounts of carbon dioxide. https://photojournal.jpl.nasa.gov/catalog/PIA23781

NASA Conducts Airborne Science Aboard Zeppelin Airship: equipped with two imaging instruments enabling remote sensing and atmospheric science measurements not previously practical
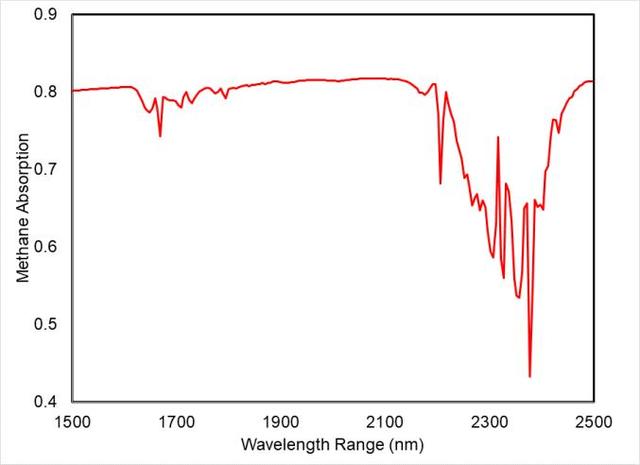
This spectral "fingerprint" of methane was produced from data taken during a September 2023 test at NASA's Jet Propulsion Laboratory in Southern California of a state-of-the-art imaging spectrometer that will measure the greenhouse gases methane and carbon dioxide from space. The instrument measures hundreds of wavelengths of light reflected by Earth's surface and absorbed by gases in the planet's atmosphere. Different compounds absorb different wavelengths of light, leaving a kind of spectral fingerprint that the imaging spectrometer can identify. These infrared fingerprints, invisible to the human eye, can pinpoint and quantify strong greenhouse gas emissions, and accelerate mitigation efforts. Before the imaging spectrometer was shipped from JPL to Planet Labs PBC in San Francisco, where it will be integrated into a Tanager satellite, there was a rare opportunity to use a sample of methane to test the completed instrument while it was in a vacuum chamber. The test was successful, and the imaging spectrometer produced this clear spectral fingerprint of methane (appearing as a red line in the graph). Designed and built by JPL, imaging spectrometer will be part of an effort led by the nonprofit Carbon Mapper organization to collect data on greenhouse gas point-source emissions. The information will help locate and quantify "super-emitters" – the small percentage of individual sources responsible for a significant fraction of methane and carbon dioxide emissions around the world. https://photojournal.jpl.nasa.gov/catalog/PIA26095
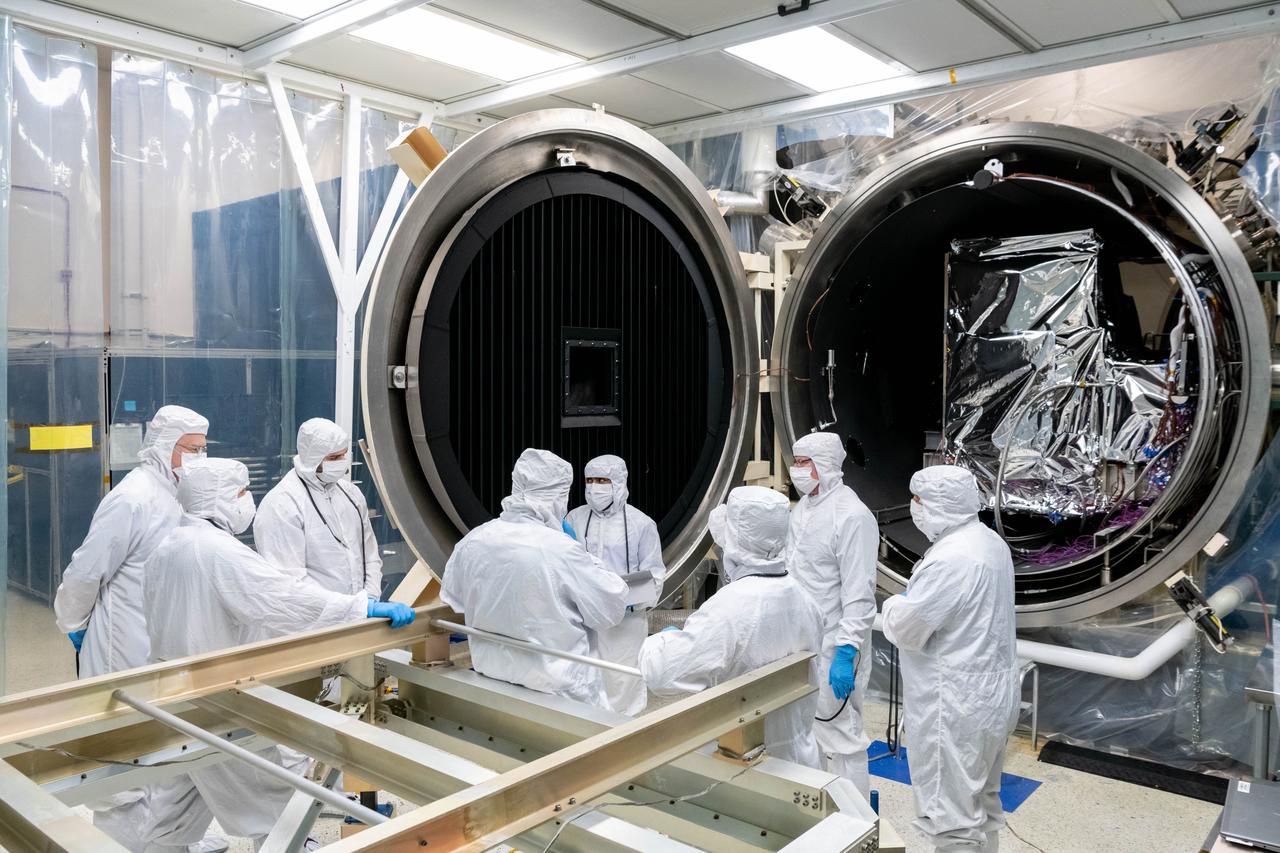
The Ocean Color Instrument (OCI) team reviews test plans and inspects the instrument in the thermal vacuum chamber prior to closing the large door for a sixty day thermal test which ensures the instrument will perform effectively once it launches into the airless environment of space. OCI is a highly advanced optical spectrometer that will be used to measure properties of light over portions of the electromagnetic spectrum. It will enable continuous measurement of light at finer wavelength resolution than previous NASA satellite sensors, extending key system ocean color data records for climate studies. OCI is PACE's (Plankton, Aerosol, Cloud, ocean Ecosystem) primary sensor built at Goddard Space Flight Center in Greenbelt, MD.
iss041e047260 (9/29/2014) --- A view of the removal of the RapidScat Nadir Adapter from the SpaceX-4 Dragon trunk and installation of the adapter onto the Columbus Exposed Facility Unit (EFU). ISS-RapidScat is a space-based scatterometer that replaces the inoperable SeaWinds payload aboard the QuickSCAT satellite. Scatterometers are radar instruments that measure wind speed and direction over the ocean, and are useful for weather forecasting, hurricane monitoring, and observations of large-scale climate phenomena such as El Niño. The ISS RapidScat instrument enhances measurements from other international scatterometers by cross-checking their data, and demonstrates a unique way to replace an instrument aboard an aging satellite. External Caption
jsc2020e004941 (2/7/2020) --- A preflight view of the Airborne Particulate Monitor (APM) engineering unit. APM technology has applications in environmental monitoring and air pollution studies on Earth. Its combination of two instruments into one box offers a wider range of particle size measurement than other commercially available instruments.
NASA Conducts Airborne Science Aboard Zeppelin Airship: equipped with two imaging instruments enabling remote sensing and atmospheric science measurements not previously practical. Shown here is Steve Dunagan, NASA Ames scientist. Cabin viewof instrument operaor Steve Dunagan, Pilot Katharing 'Kate' Board.
This computer-generated image depicts the Jovian Infrared Auroral Mapper (JIRAM) instrument aboard NASA's Juno spacecraft. The JIRAM instrument measures heat radiated from the planet at an infrared wavelength of around 5 microns. https://photojournal.jpl.nasa.gov/catalog/PIA23594
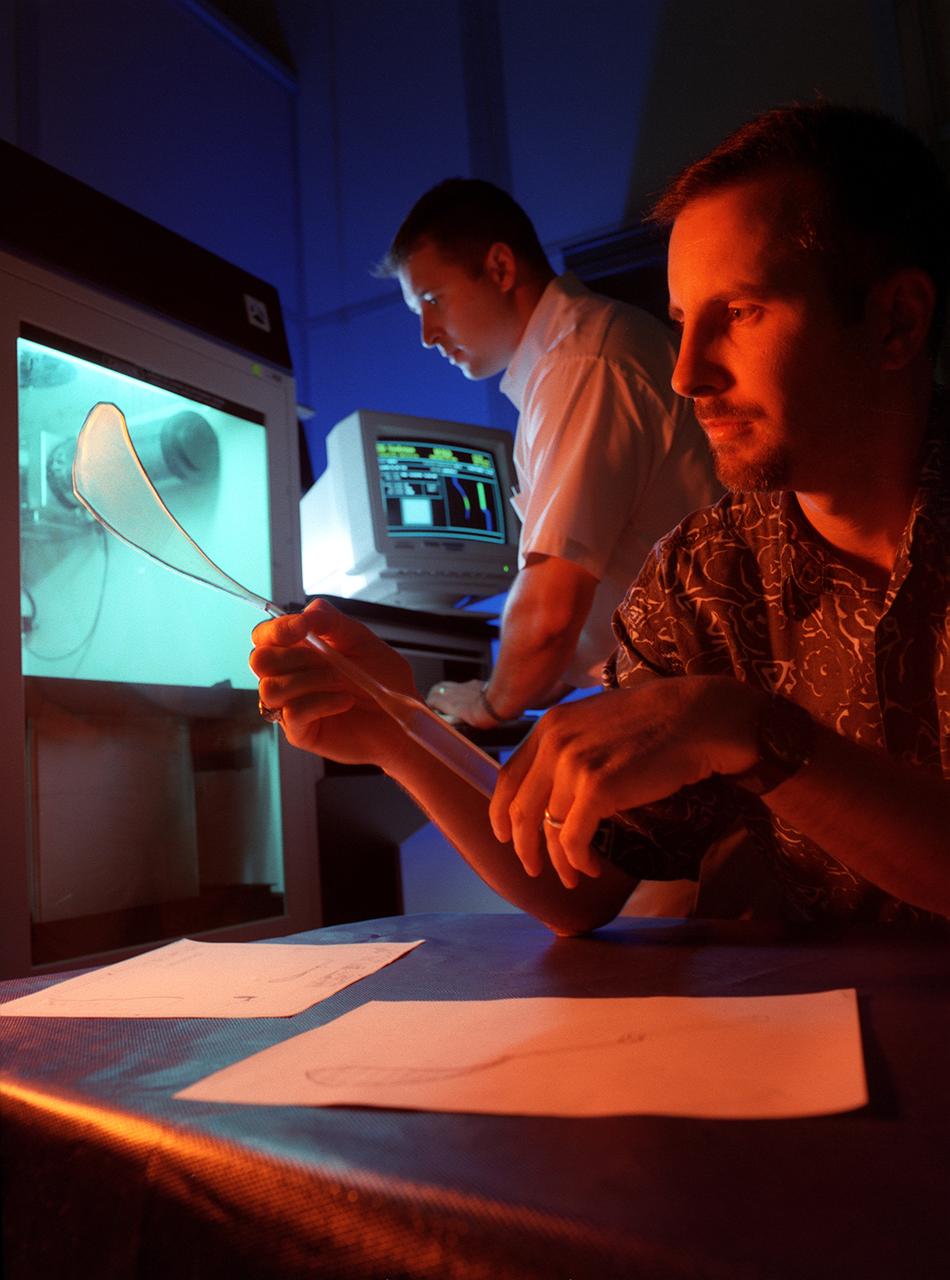
Marshall inventors Seth Lawson and Stanley Smeltzer display a pair of obstetrical forceps they designed. The forceps, made from composite space-age materials, measure the force applied during instrument-assisted delivery. The new forceps will help medical students get a feel for instrument-assisted deliveries before entering practice.
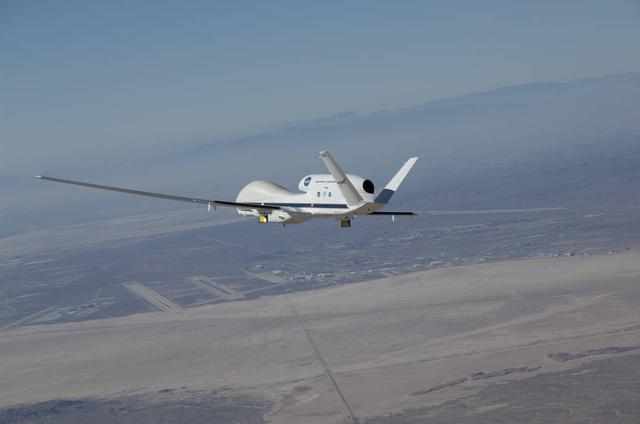
NASA's Global Hawk 872 soared over Rogers Dry Lake at Edwards Air Force Base, CA, during an instrument checkout flight for the 2014 ATTREX mission over the western Pacific Ocean. The aircraft carried 13 science instruments to measure moisture and chemical composition of the stratosphere during the campaign.
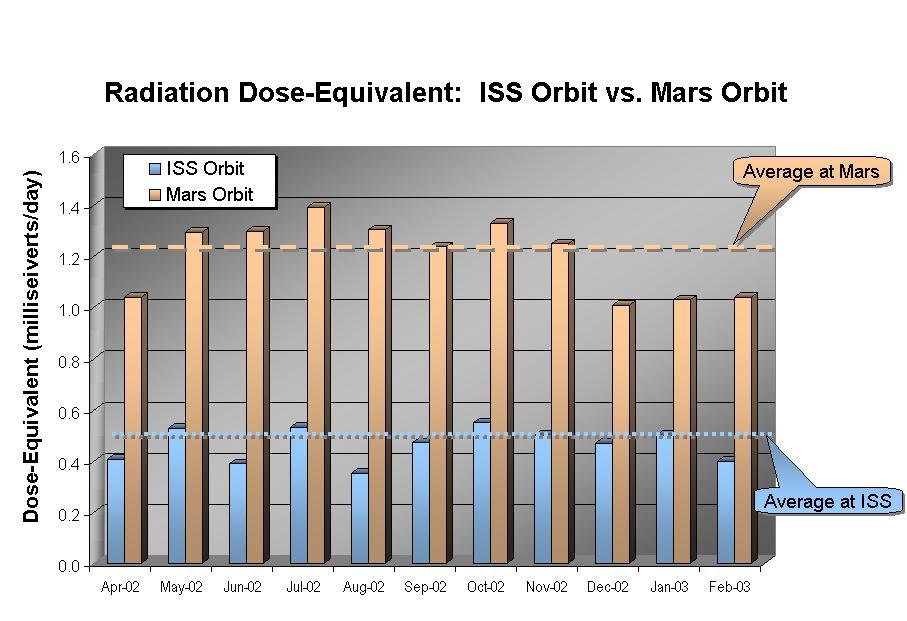
This graphic shows the radiation dose equivalent as measured by Odyssey's Martian radiation environment experiment at Mars and by instruments aboard the International Space Station, for the 11-month period from April 2002 through February 2003. The accumulated total in Mars orbit is about two and a half times larger than that aboard the Space Station. Averaged over this time period, about 10 percent of the dose equivalent at Mars is due to solar particles, although a 30 percent contribution from solar particles was seen in July 2002, when the sun was particularly active. http://photojournal.jpl.nasa.gov/catalog/PIA04258
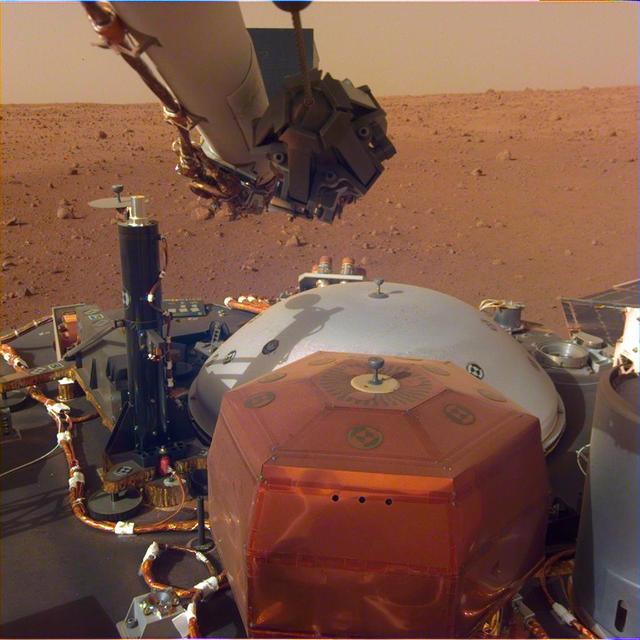
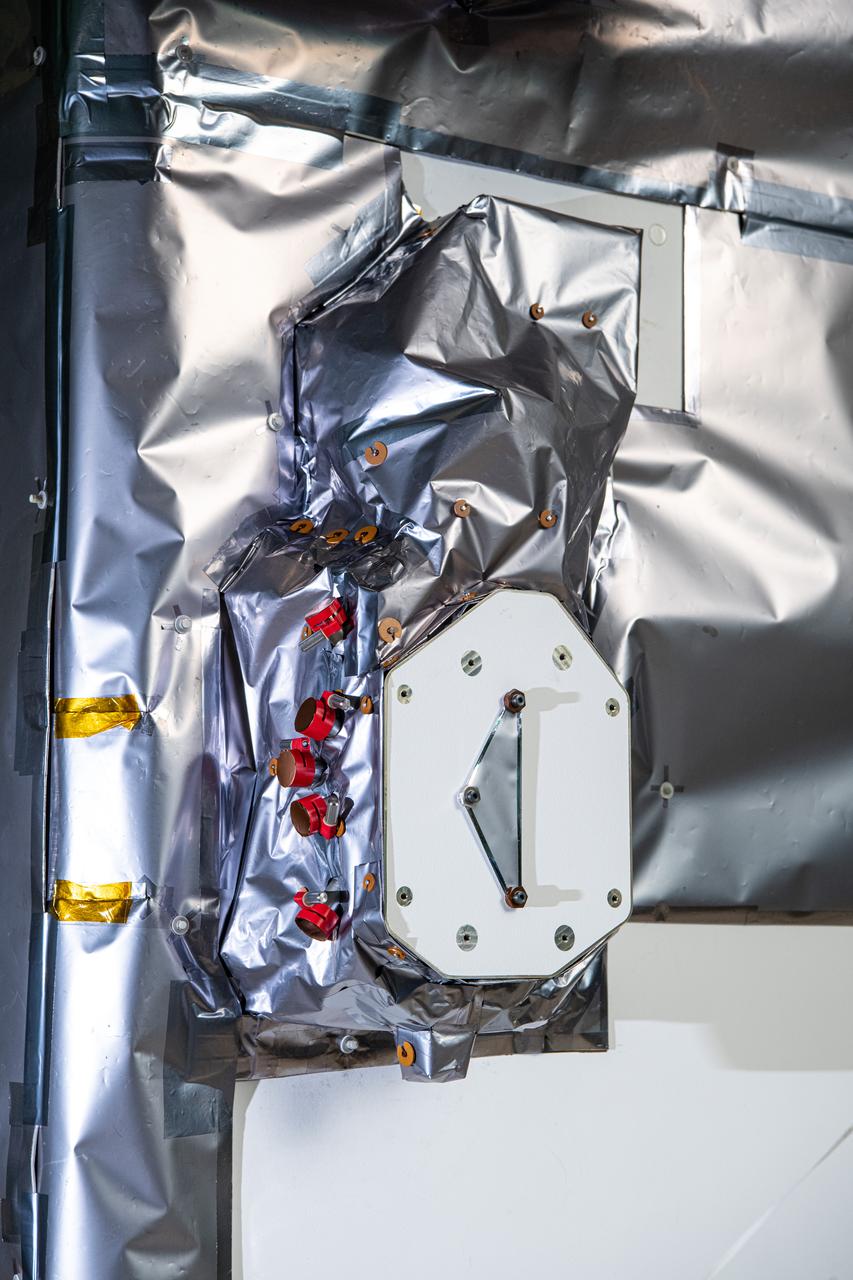
This image from InSight's robotic-arm mounted Instrument Deployment Camera shows the instruments on the spacecraft's deck, with the Martian surface of Elysium Planitia in the background. The color-calibrated picture was acquired on Dec. 4, 2018 (Sol 8). In the foreground, a copper-colored hexagonal cover protects the Seismic Experiment for Interior Structure instrument (SEIS), a seismometer that will measure marsquakes. The gray dome behind SEIS is the wind and thermal shield, which will be placed over SEIS. To the left is a black cylindrical instrument, the Heat Flow and Physical Properties Probe (HP3). HP3 will drill up to 16 feet (5 meters) below the Martian surface, measuring heat released from the interior of the planet. Above the deck is InSight's robotic arm, with the stowed grapple directly facing the camera. To the right can be seen a small portion of one of the two solar panels that help power InSight and part of the UHF communication antenna. https://photojournal.jpl.nasa.gov/catalog/PIA22871
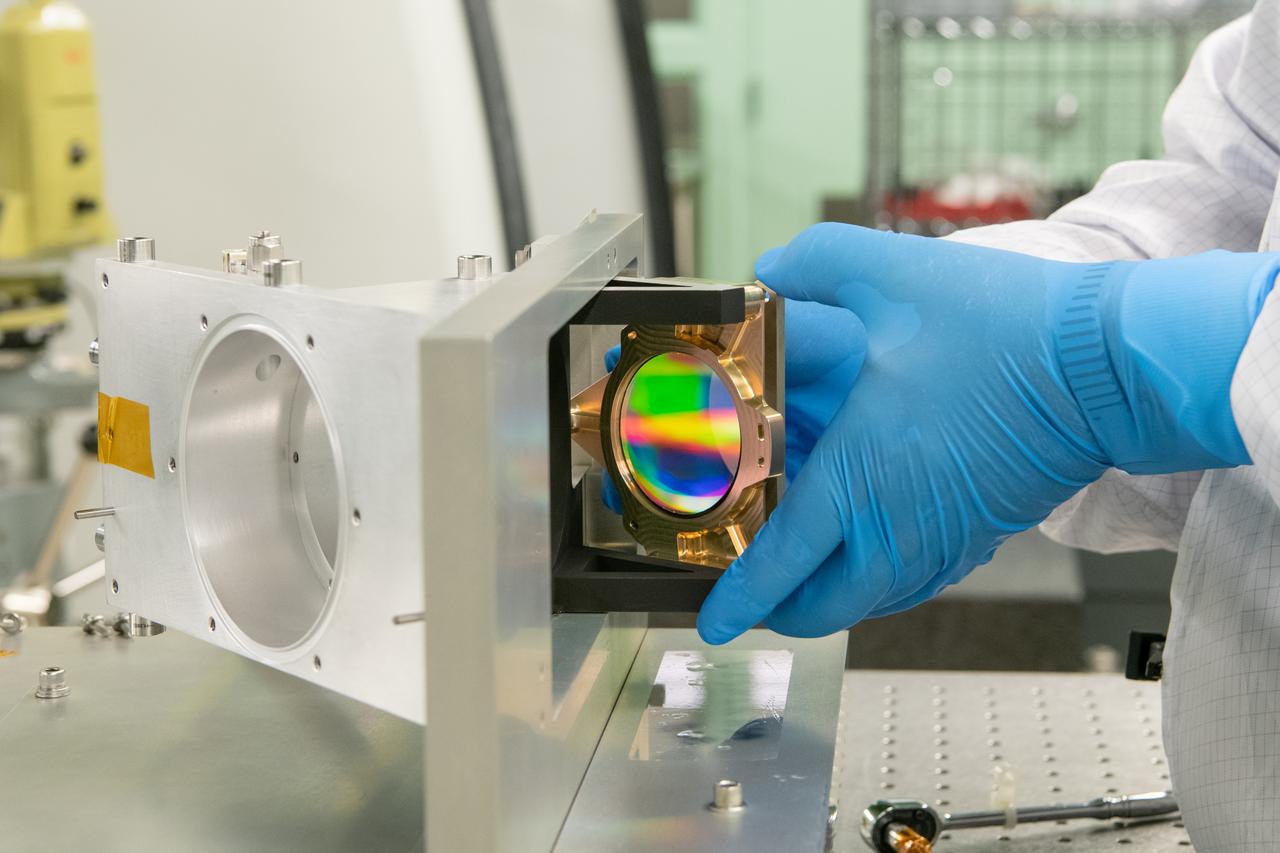
An Ocean Color Instrument (OCI) optical lens is installed into the flight housing hardware for alignment measurements. OCI is a highly advanced optical spectrometer that will be used to measure properties of light over portions of the electromagnetic spectrum. It will enable continuous measurement of light at finer wavelength resolution than previous NASA satellite sensors, extending key system ocean color data records for climate studies. OCI is PACE's (Plankton, Aerosol, Cloud, ocean Ecosystem) primary sensor built at Goddard Space Flight Center in Greenbelt, MD.
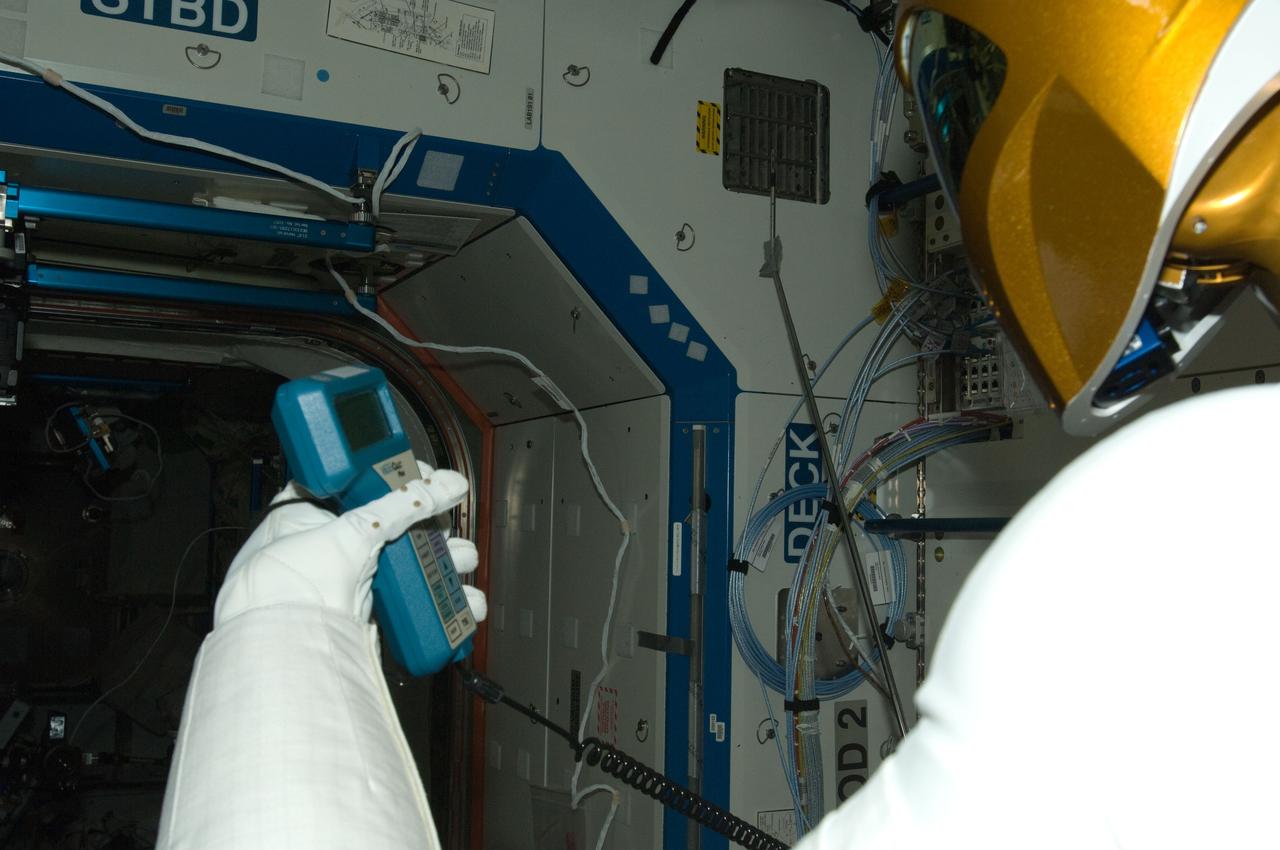
ISS030-E-142875 (14 March 2012) --- Controlled by teams on the ground, Robonaut 2 humanoid robot holds an instrument to measure air velocity during another system check out in the Destiny laboratory of the International Space Station.
A map of infrared radiance in Loki Patera on Jupiter's moon Io, as measured by the Jovian Infrared Auroral Mapper (JIRAM) instrument aboard NASA's Juno spacecraft, right, and by NASA's Voyager 1, left. https://photojournal.jpl.nasa.gov/catalog/PIA26525
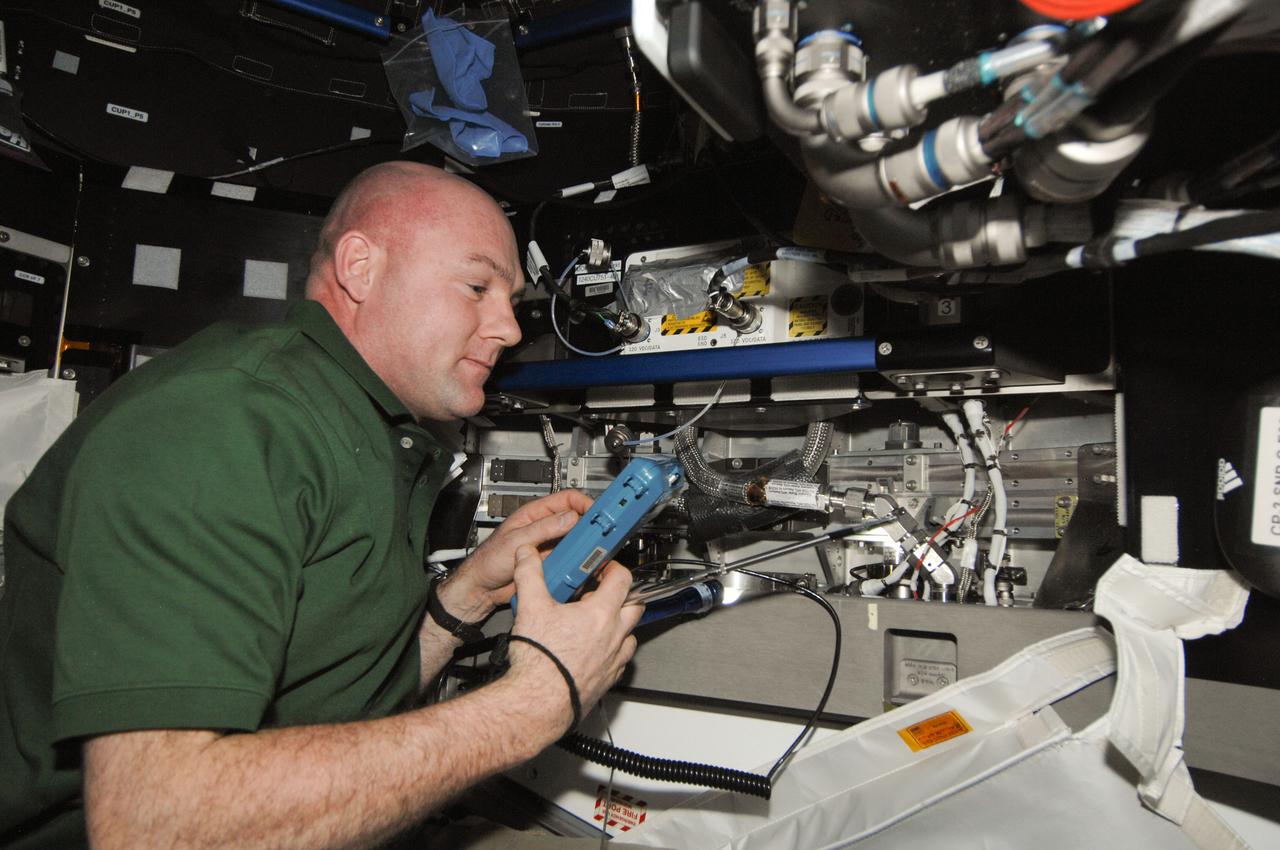
ISS030-E-166606 (28 Jan. 2012) --- European Space Agency astronaut Andre Kuipers, Expedition 30 flight engineer, uses an instrument to measure air velocity in the Tranquility node of the International Space Station.
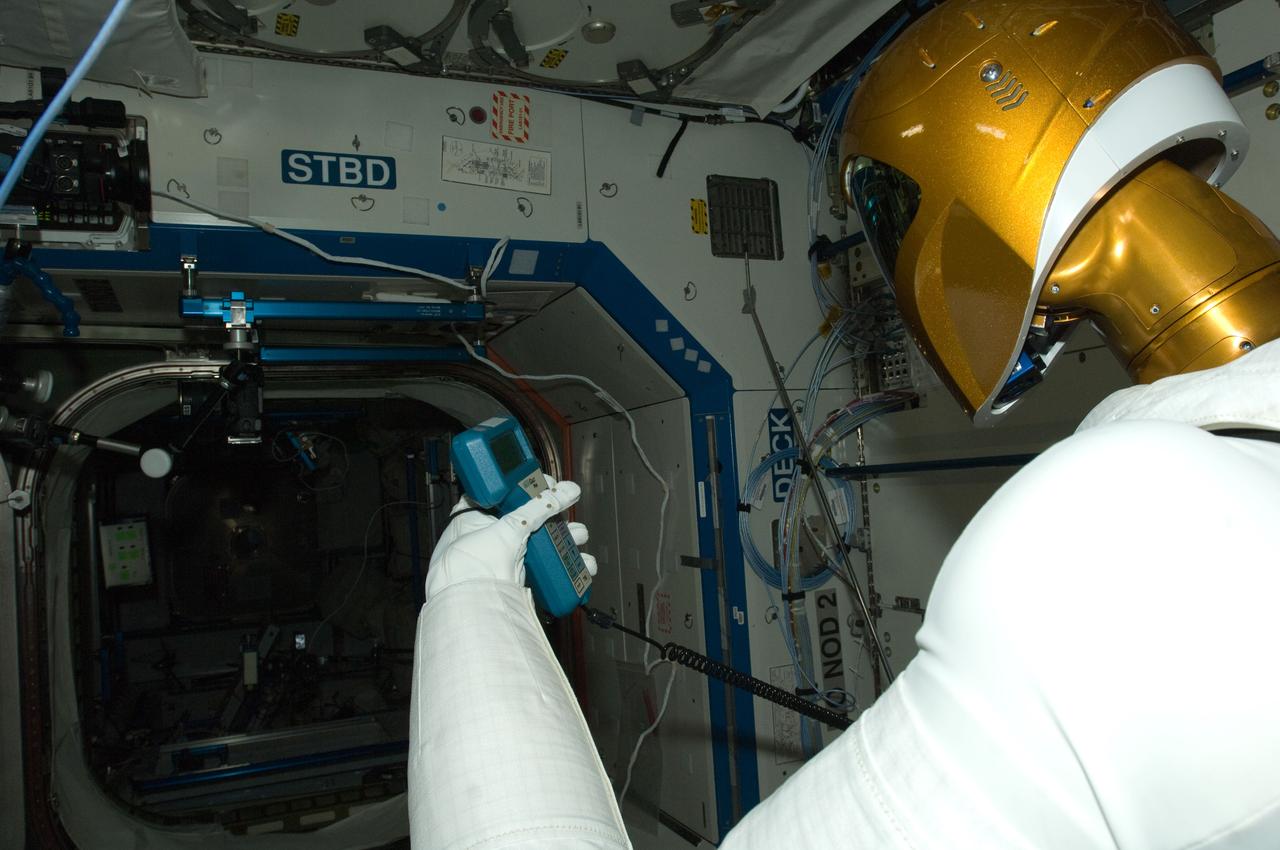
ISS030-E-142876 (14 March 2012) --- Controlled by teams on the ground, Robonaut 2 humanoid robot holds an instrument to measure air velocity during another system check out in the Destiny laboratory of the International Space Station.

The Tropospheric Doppler Radar Wind Profiler (TDRWP), located at Kennedy Space Center, is the only instrument of its kind in operation. Consisting of 640 antennae and occupying five acres near the Launch and Landing Facility, the TDRWP operates at nearly 50 MHz. It will be used as a primary instrument to measure upper level winds for NASA’s Artemis missions, which will launch from the Florida spaceport. The instrument has the ability to provide data from 6,000 to 62,000 feet, every five minutes, far outpacing weather balloons.

Optical engineer, Maurice Stancil, performs final optical alignment metrology measurements prior to the Ocean Color Instrument (OCI) integration to the Plankton, Aerosol, Cloud, ocean Ecosystem (PACE) spacecraft. As he collects data and measures angles on OCI, he is able to determine if the flight hardware is in the correct position. OCI is a highly advanced optical spectrometer that will be used to measure properties of light over portions of the electromagnetic spectrum. It will enable continuous measurement of light at finer wavelength resolution than previous NASA satellite sensors, extending key system ocean color data records for climate studies. OCI is PACE's primary sensor built at Goddard Space Flight Center in Greenbelt, MD.
The Ocean Color Instrument (OCI) Main Optics Bench (MOB) is integrated with the Collimator Slit Assembly (CSA). The CSA is installed to measure the height, width, and depth of the hardware using a Coordinate Measurement Machine. OCI is a highly advanced optical spectrometer that will be used to measure properties of light over portions of the electromagnetic spectrum. It will enable continuous measurement of light at finer wavelength resolution than previous NASA satellite sensors, extending key system ocean color data records for climate studies. OCI is PACE's (Plankton, Aerosol, Cloud, ocean Ecosystem) primary sensor built at Goddard Space Flight Center in Greenbelt, MD.
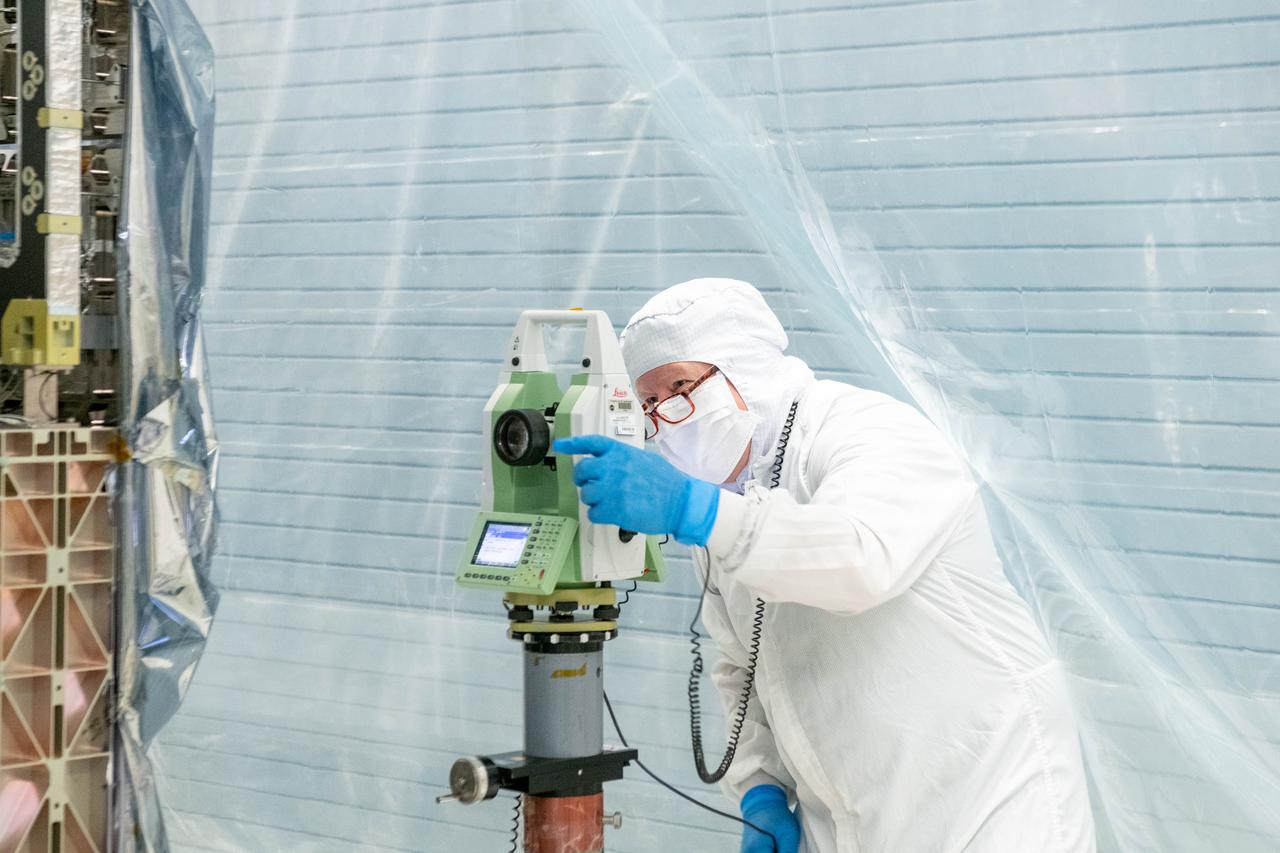
Optical technician, Timothy Madison, uses a theodolite to perform optical measurements on the Ocean Color Instrument (OCI). As he collects data and measures angles on OCI, he is able to determine if the newly integrated flight hardware is in the correct position. OCI is a highly advanced optical spectrometer that will be used to measure properties of light over portions of the electromagnetic spectrum. It will enable continuous measurement of light at finer wavelength resolution than previous NASA satellite sensors, extending key system ocean color data records for climate studies. OCI is PACE's (Plankton, Aerosol, Cloud, ocean Ecosystem) primary sensor built at Goddard Space Flight Center in Greenbelt, MD.
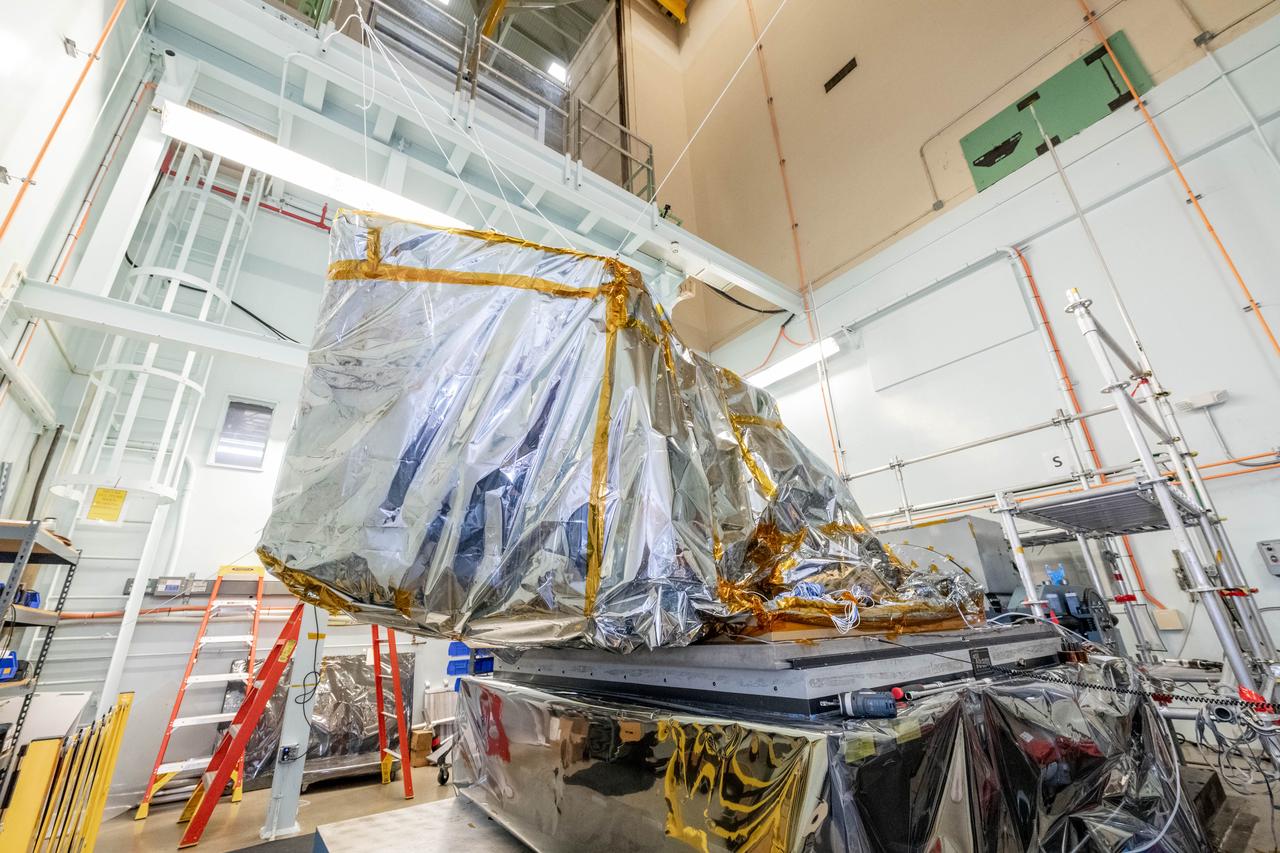
The Ocean Color Instrument (OCI) is configured for vibration testing. OCI is bagged with Dun-Shield to protect the instrument from contamination outside of a cleanroom environment, and also provides protection from static electricity. OCI is a highly advanced optical spectrometer that will be used to measure properties of light over portions of the electromagnetic spectrum. It will enable continuous measurement of light at finer wavelength resolution than previous NASA satellite sensors, extending key system ocean color data records for climate studies. OCI is PACE's (Plankton, Aerosol, Cloud, ocean Ecosystem) primary sensor built at Goddard Space Flight Center in Greenbelt, MD.
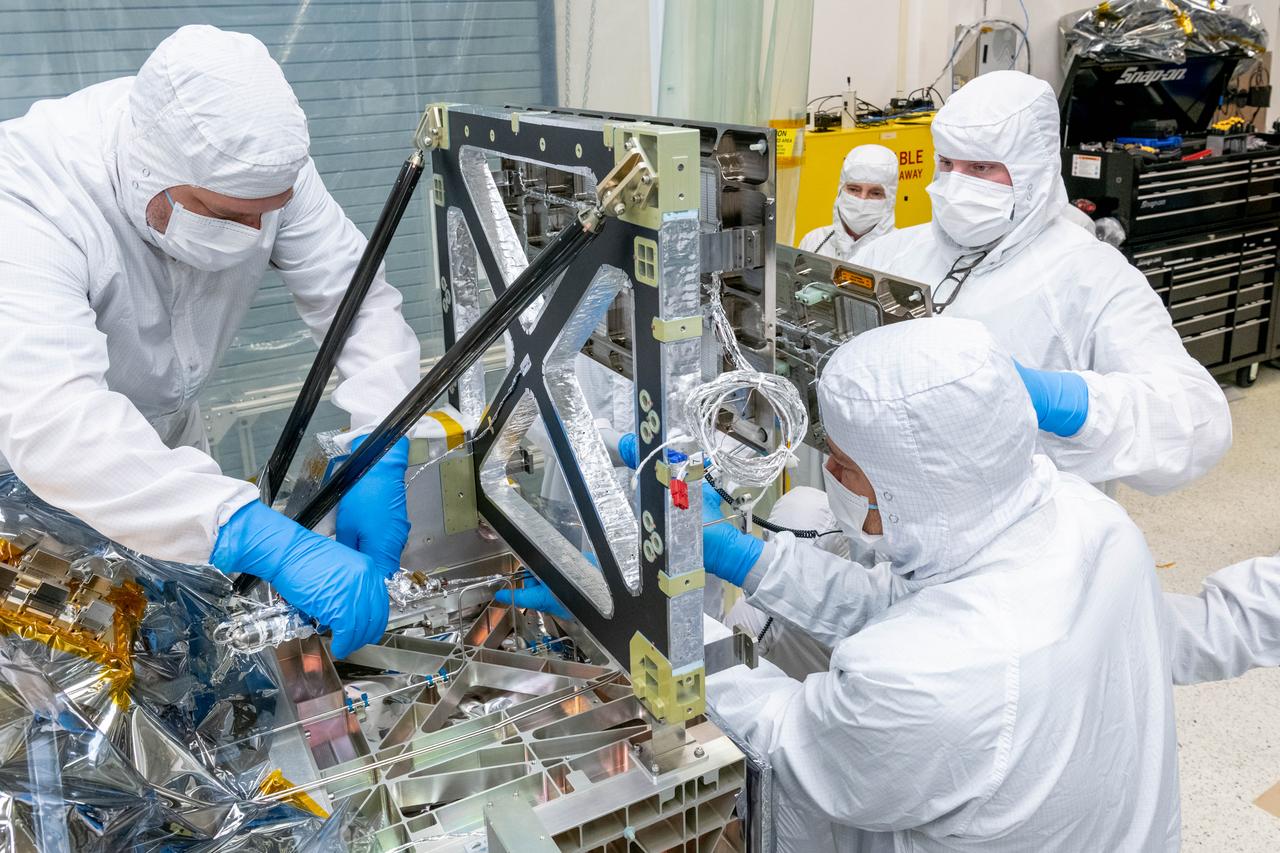
Mechanical technicians and thermal engineers work together to carefully feed the lines of a Loop Heat Pipe onto the Ocean Color Instrument (OCI). This integration operation will allow proper heat transfer throughout the instrument. OCI is a highly advanced optical spectrometer that will be used to measure properties of light over portions of the electromagnetic spectrum. It will enable continuous measurement of light at finer wavelength resolution than previous NASA satellite sensors, extending key system ocean color data records for climate studies. OCI is PACE's (Plankton, Aerosol, Cloud, ocean Ecosystem) primary sensor built at Goddard Space Flight Center in Greenbelt, MD.
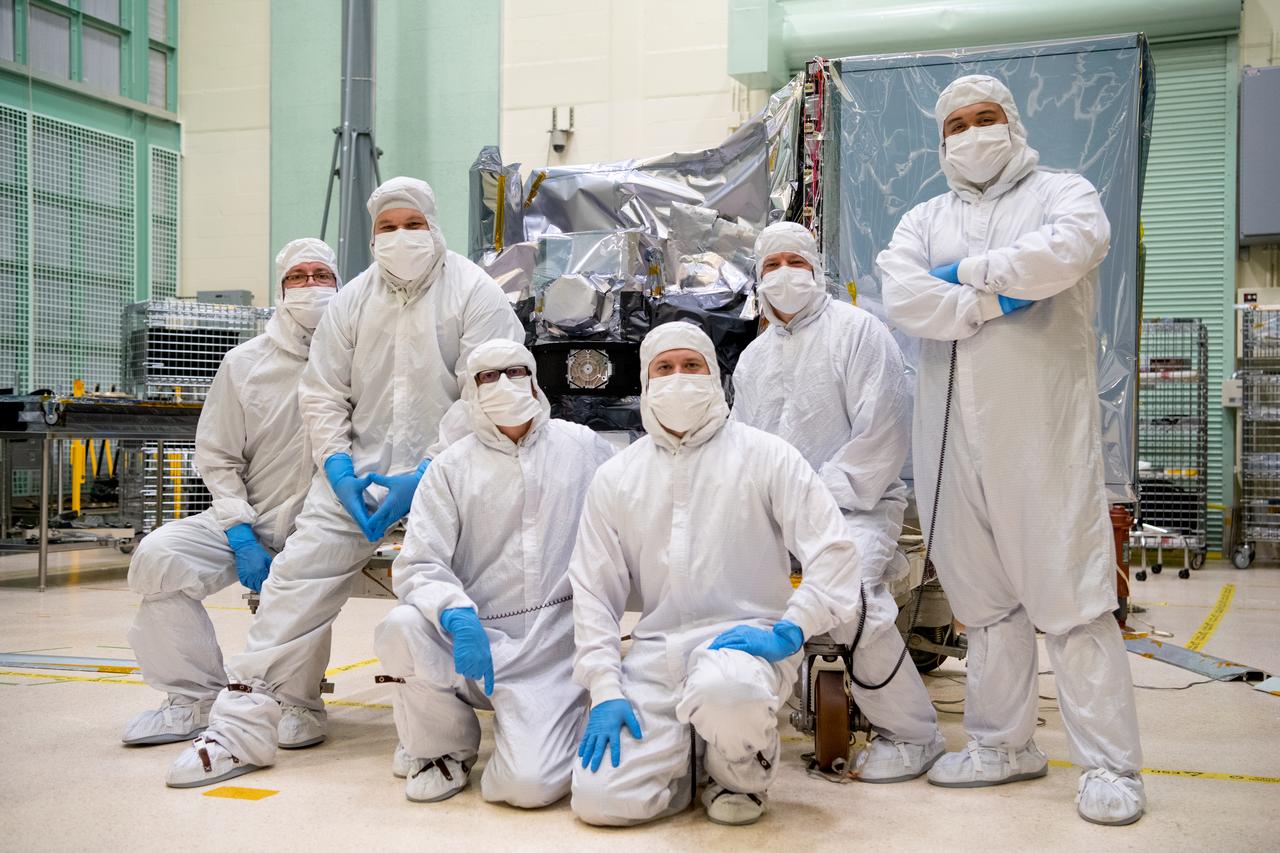
The Ocean Color Instrument (OCI) mechanical technician team pose in front of the instrument after successfully installing the earth shade. OCI is a highly advanced optical spectrometer that will be used to measure properties of light over portions of the electromagnetic spectrum. It will enable continuous measurement of light at finer wavelength resolution than previous NASA satellite sensors, extending key system ocean color data records for climate studies. OCI is PACE's (Plankton, Aerosol, Cloud, ocean Ecosystem) primary sensor built at Goddard Space Flight Center in Greenbelt, MD.
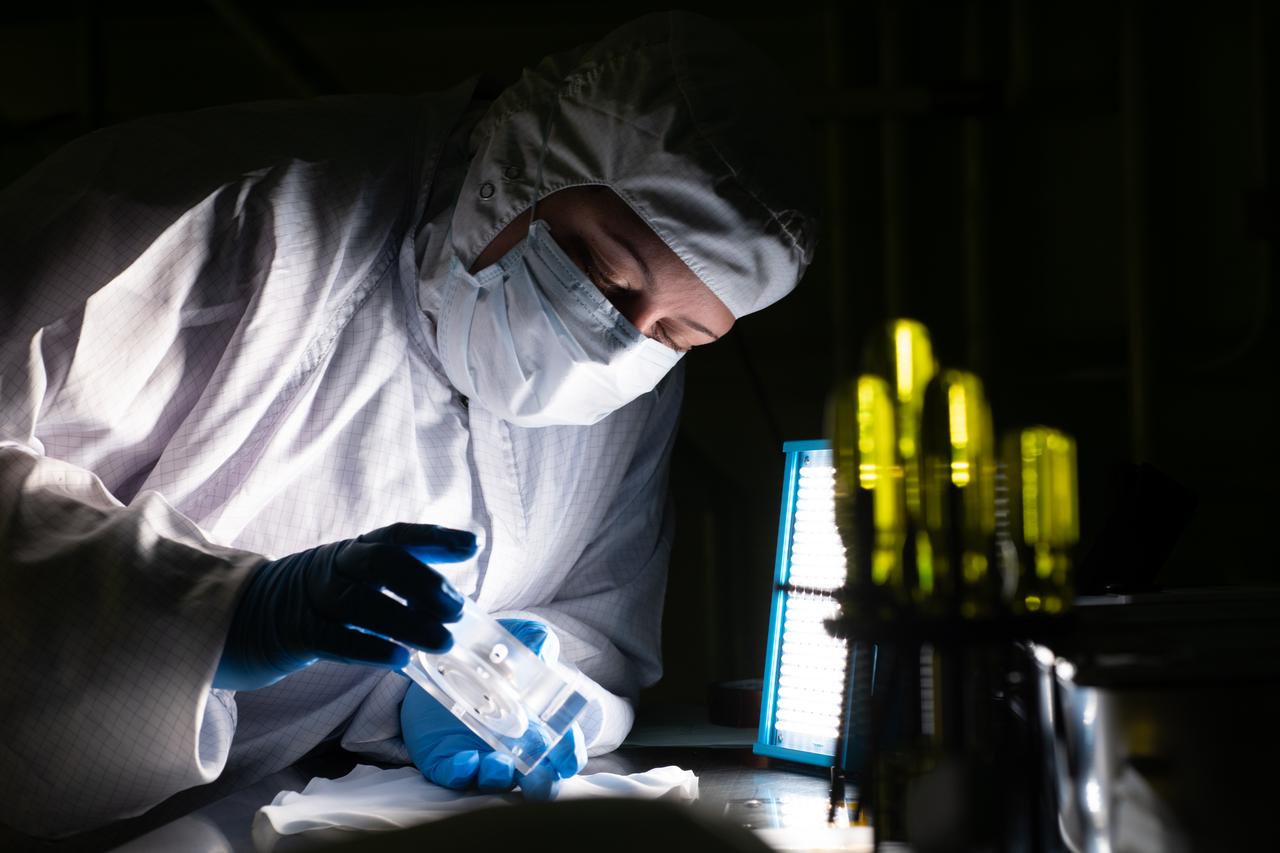
After removal from the handling container physical science technician, Kristen Washington, performs an inspection of the Ocean Color Instrument (OCI) fold flat mirror to note any scratches or damage on the optical surface before it is integrated with the other optical components of the instrument. OCI is a highly advanced optical spectrometer that will be used to measure properties of light over portions of the electromagnetic spectrum. It will enable continuous measurement of light at finer wavelength resolution than previous NASA satellite sensors, extending key system ocean color data records for climate studies. OCI is PACE's (Plankton, Aerosol, Cloud, ocean Ecosystem) primary sensor built at Goddard Space Flight Center in Greenbelt, MD.
The Ocean Color Instrument (OCI) is integrated on the Tilt Mechanism prior to environmental testing in the Spacecraft Checkout Area (SCA) cleanroom. The OCI Tilt will help the instrument avoid sun glint in a space environment. OCI is a highly advanced optical spectrometer that will be used to measure properties of light over portions of the electromagnetic spectrum. It will enable continuous measurement of light at finer wavelength resolution than previous NASA satellite sensors, extending key system ocean color data records for climate studies. OCI is PACE's (Plankton, Aerosol, Cloud, ocean Ecosystem) primary sensor built at Goddard Space Flight Center in Greenbelt, MD.
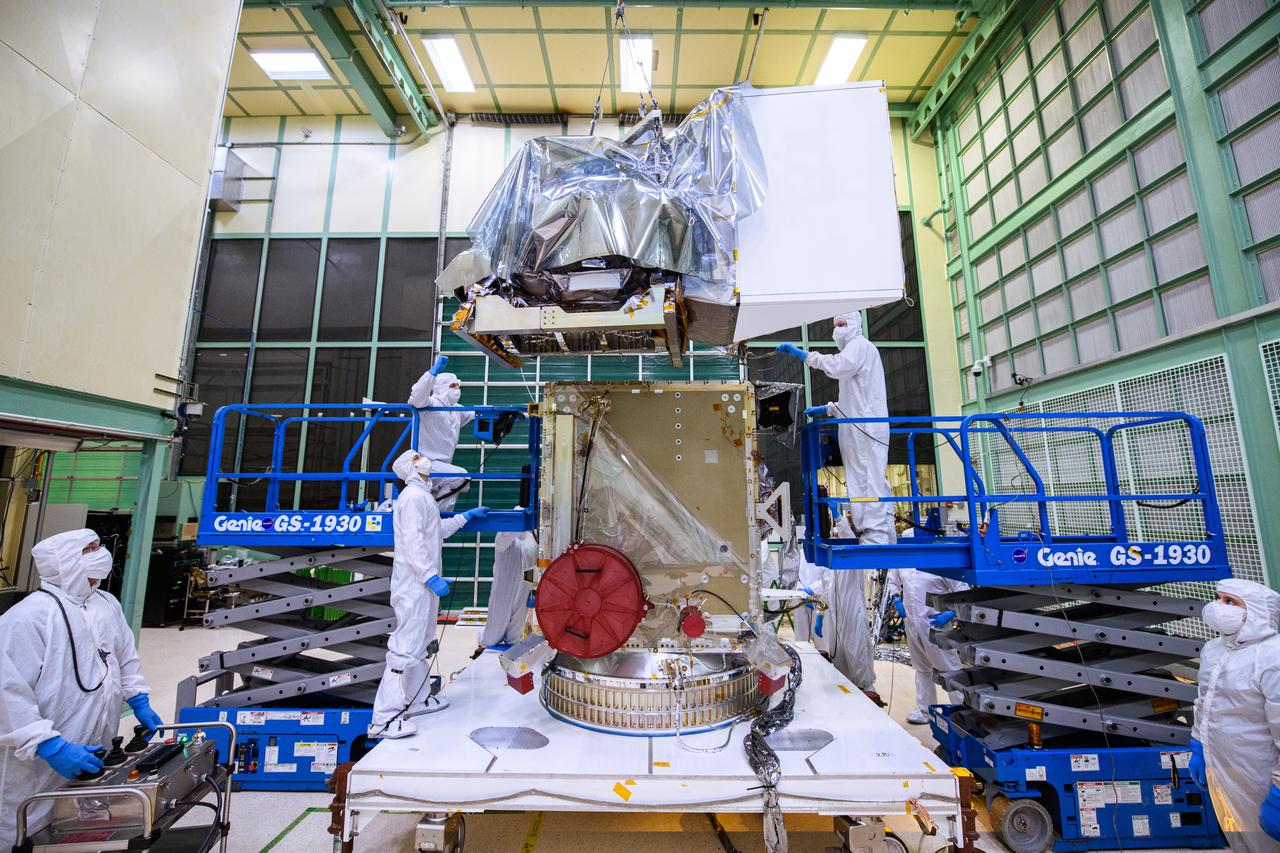
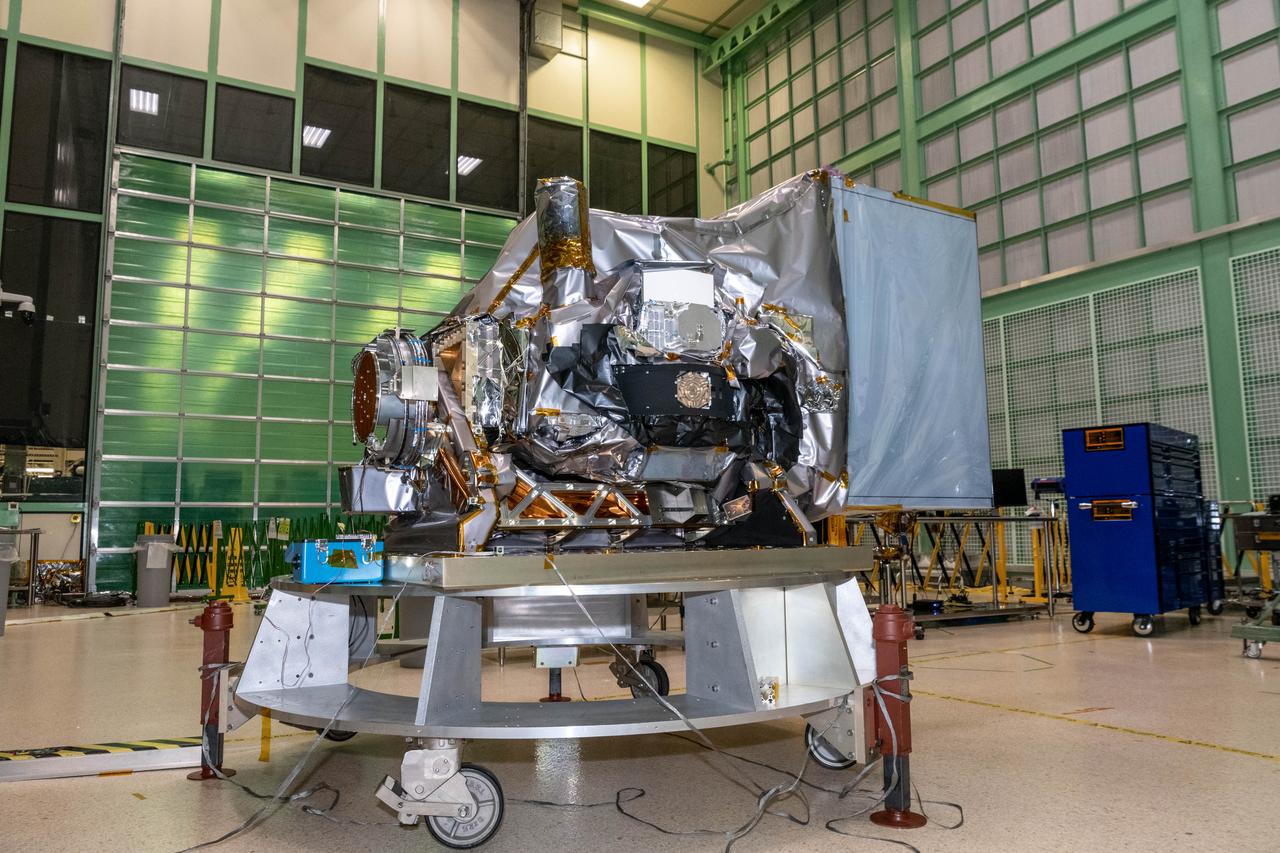
Mechanical technicians install the Flight Ocean Color Instrument (OCI) and Tilt Platform Assembly to the Plankton, Aerosol, Cloud, ocean Ecosystem (PACE) spacecraft. By installing the instrument, the spacecraft is now considered an observatory. OCI is a highly advanced optical spectrometer that will be used to measure properties of light over portions of the electromagnetic spectrum. It will enable continuous measurement of light at finer wavelength resolution than previous NASA satellite sensors, extending key system ocean color data records for climate studies. OCI is PACE's primary sensor built at Goddard Space Flight Center in Greenbelt, MD.

KENNEDY SPACE CENTER, Fla. -- The Microwave Anisotropy Probe (MAP) is mated to the upper stage of the Boeing Delta II rocket. The rocket is scheduled to launch the MAP instrument June 30 into a lunar-assisted trajectory to the Sun-Earth for a 27-month mission. MAP will measure small fluctuations in the temperature of the cosmic microwave background radiation to an accuracy of one millionth of a degree. These measurements should reveal the size, matter content, age, geometry and fate of the universe. They will also reveal the primordial structure that grew to form galaxies and will test ideas about the origins of these primordial structures. The MAP instrument will be continuously shaded from the Sun, Earth, and Moon by the spacecraft. It is a product of Goddard Space Flight Center in partnership with Princeton University
Mechanical technicians and thermal engineers work together to carefully feed the lines of a Loop Heat Pipe onto the Ocean Color Instrument (OCI). This integration operation will allow proper heat transfer throughout the instrument. OCI is a highly advanced optical spectrometer that will be used to measure properties of light over portions of the electromagnetic spectrum. It will enable continuous measurement of light at finer wavelength resolution than previous NASA satellite sensors, extending key system ocean color data records for climate studies. OCI is PACE's (Plankton, Aerosol, Cloud, ocean Ecosystem) primary sensor built at Goddard Space Flight Center in Greenbelt, MD.
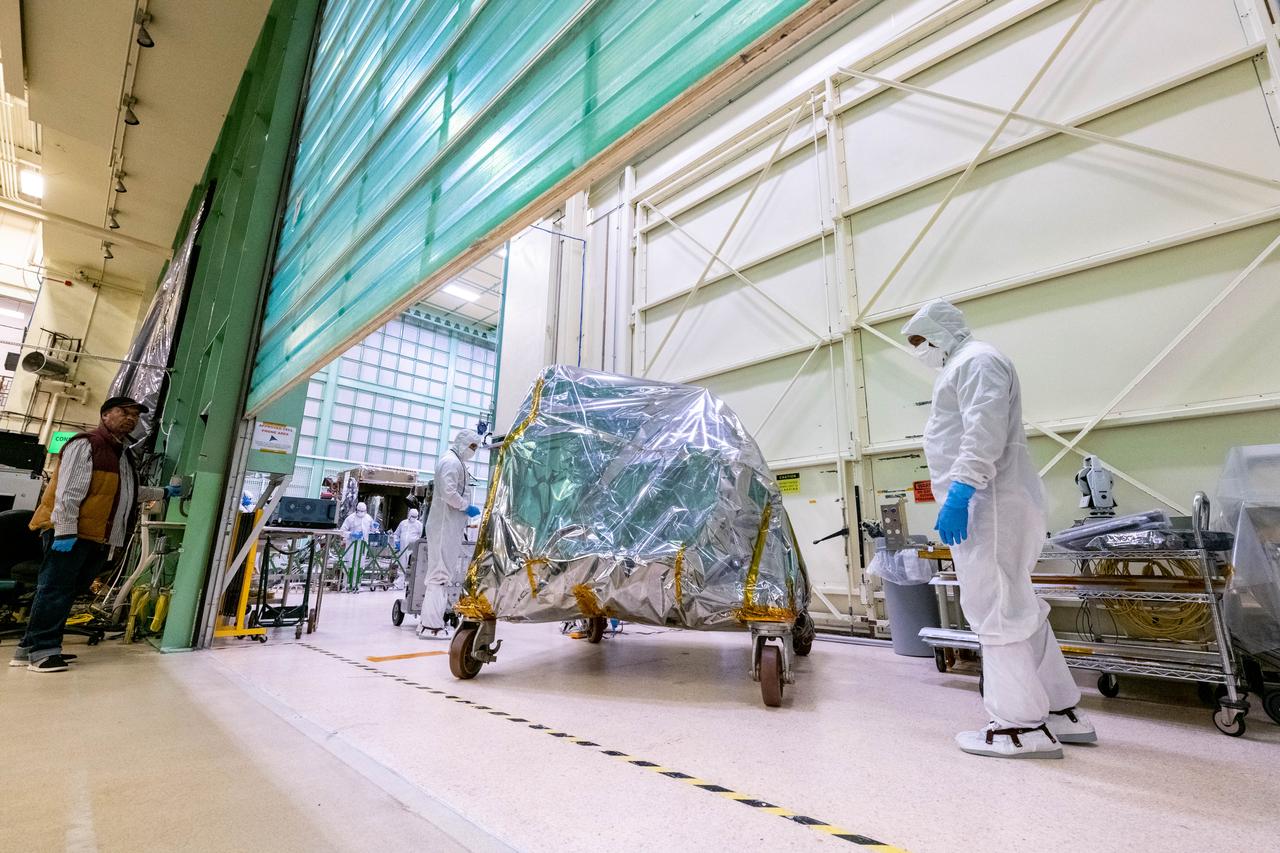
The Ocean Color Instrument (OCI) team transports the instrument on its dolly to a cleanroom at Goddard Space Flight Center for final operations prior to integration to the Plankton, Aerosol, Cloud, ocean Ecosystem (PACE) spacecraft. OCI is a highly advanced optical spectrometer that will be used to measure properties of light over portions of the electromagnetic spectrum. It will enable continuous measurement of light at finer wavelength resolution than previous NASA satellite sensors, extending key system ocean color data records for climate studies. OCI is PACE's primary sensor built at Goddard Space Flight Center in Greenbelt, MD.
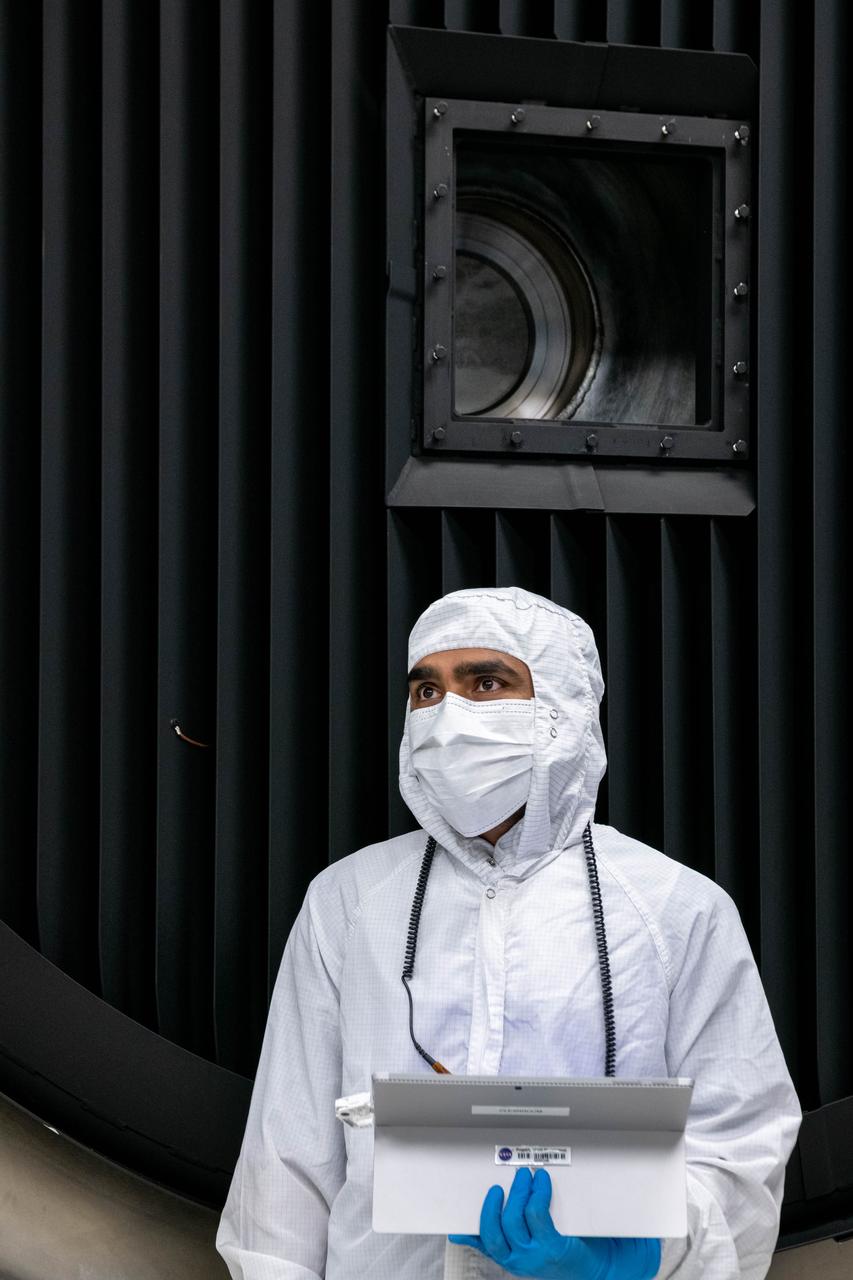
Thermal Engineer, Deepak Patel, reviews test plans and inspects the Ocean Color Instrument (OCI) in the thermal vacuum chamber prior to the door for the instruments sixty day thermal test to ensure it will perform effectively once it launches into the airless environment of space. OCI is a highly advanced optical spectrometer that will be used to measure properties of light over portions of the electromagnetic spectrum. It will enable continuous measurement of light at finer wavelength resolution than previous NASA satellite sensors, extending key system ocean color data records for climate studies. OCI is PACE's (Plankton, Aerosol, Cloud, ocean Ecosystem) primary sensor built at Goddard Space Flight Center in Greenbelt, MD.
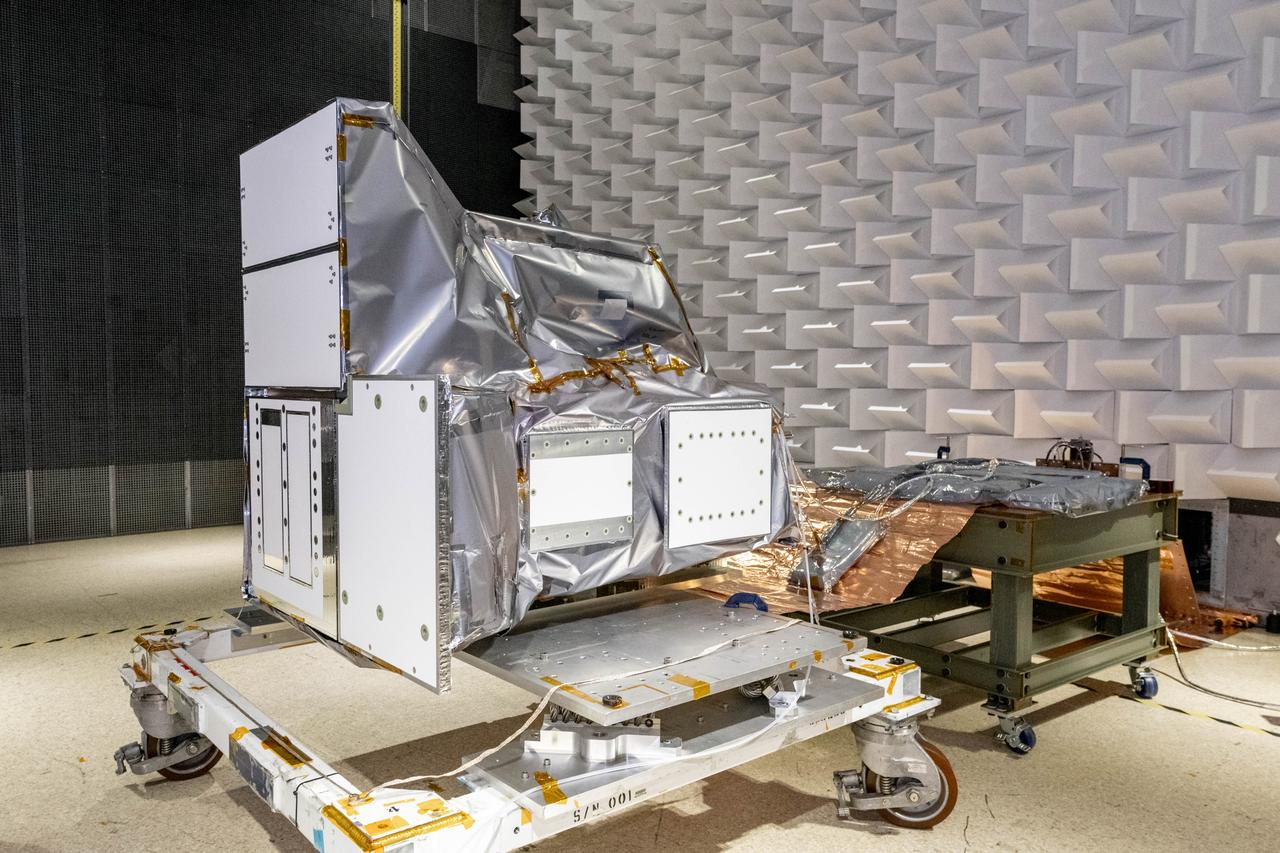
The Ocean Color Instrument (OCI) is prepared for testing in the Electro Magnetic Interference (EMI) chamber showing the radiator side of the instrument. This test will help engineers and scientists learn if OCI will be compatible with the electromagnetic environment on the spacecraft. OCI is a highly advanced optical spectrometer that will be used to measure properties of light over portions of the electromagnetic spectrum. It will enable continuous measurement of light at finer wavelength resolution than previous NASA satellite sensors, extending key system ocean color data records for climate studies. OCI is PACE's (Plankton, Aerosol, Cloud, ocean Ecosystem) primary sensor built at Goddard Space Flight Center in Greenbelt, MD.
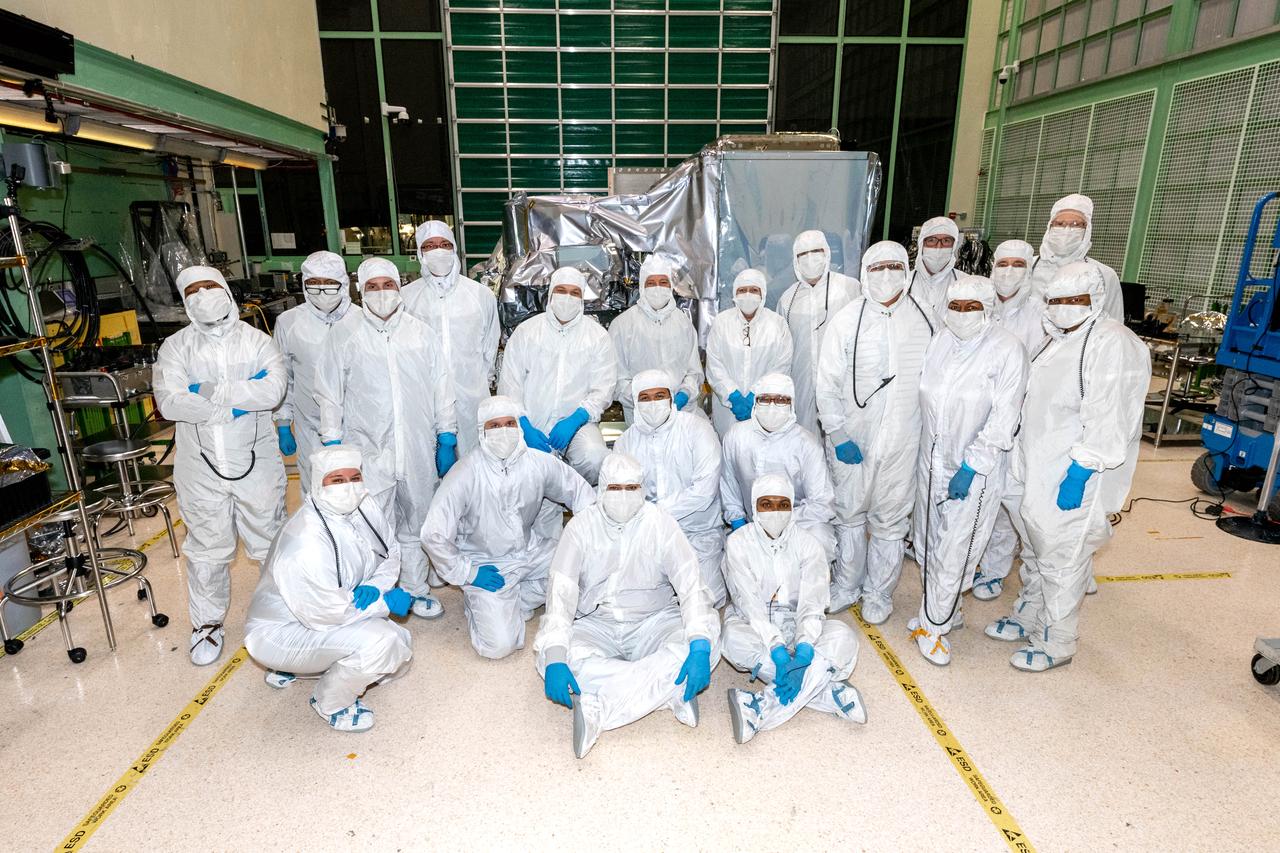
Ocean Color Instrument (OCI) team members pose with the flight hardware after successful instrument integration to the Tilt mechanism. OCI is a highly advanced optical spectrometer that will be used to measure properties of light over portions of the electromagnetic spectrum. It will enable continuous measurement of light at finer wavelength resolution than previous NASA satellite sensors, extending key system ocean color data records for climate studies. OCI is PACE's (Plankton, Aerosol, Cloud, ocean Ecosystem) primary sensor built at Goddard Space Flight Center in Greenbelt, MD.
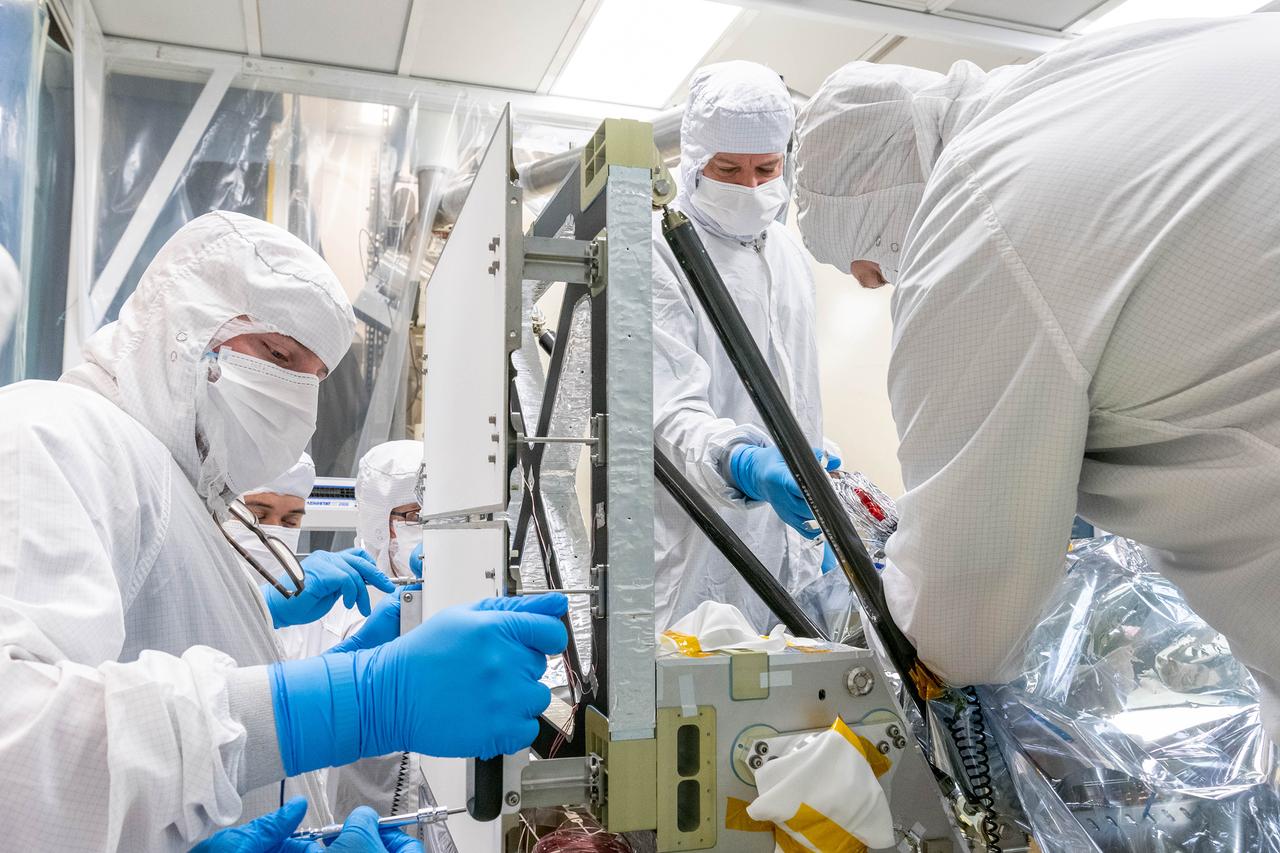
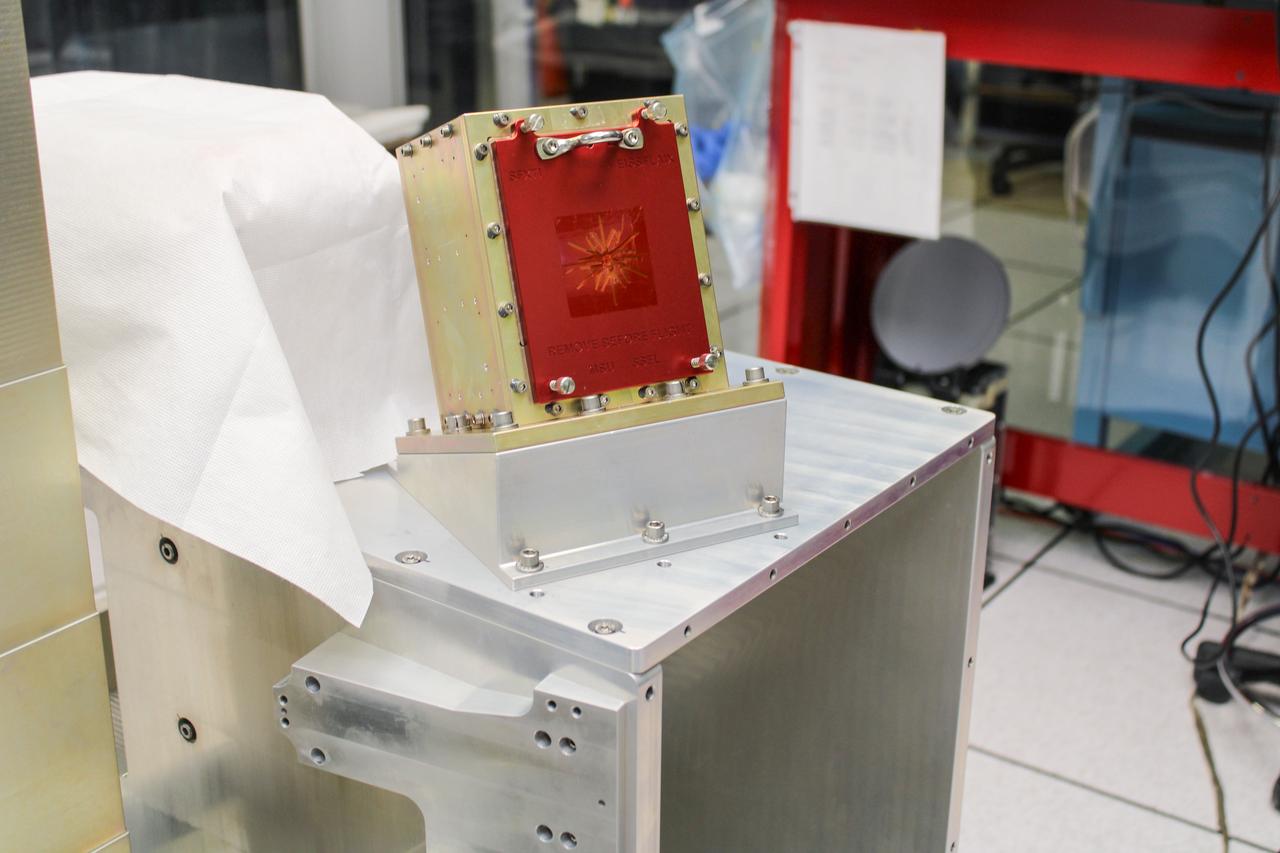
The SPEXone instrument on The Plankton, Aerosol, Cloud, ocean Ecosystem (PACE) in the clean room at NASA's Goddard Space Flight Center in Greenbelt, Maryland on October 31st, 2023. SPEXone is one of three instruments on NASA's Plankton, Aerosol, Cloud, ocean Ecosystem (PACE) observatory and has been developed by a Dutch consortium consisting of SRON Netherlands Institute for Space Research and Airbus Defence and Space Netherlands, supported by opto-mechanical expertise from TNO. SRON and Airbus DS NL are responsible for the design, manufacturing and testing of the instrument. The scientific lead is in the hands of SRON. SPEXone is a public-private initiative, funded by the Netherlands Space Office (NSO), the Netherlands Organization of Scientific Research (NWO), SRON and Airbus DS NL. PACE's unprecedented spectral coverage will provide the first-ever global measurements designed to identify phytoplankton community composition. The mission will make global ocean color measurements, using the Ocean Color Instrument (OCI), to provide extended data records on ocean ecology and global biogeochemistry along with polarimetry measurements, using the Spectro-polarimeter for Planetary Exploration (SPEXone) and the Hyper Angular Research Polarimeter (HARP2) to provide extended data records on clouds and aerosols. The Earth-observing satellite mission, built at Goddard Space Flight Center in Greenbelt, MD, will continue and advance observations of global ocean color, biogeochemistry, and ecology, as well as the carbon cycle, aerosols and clouds.
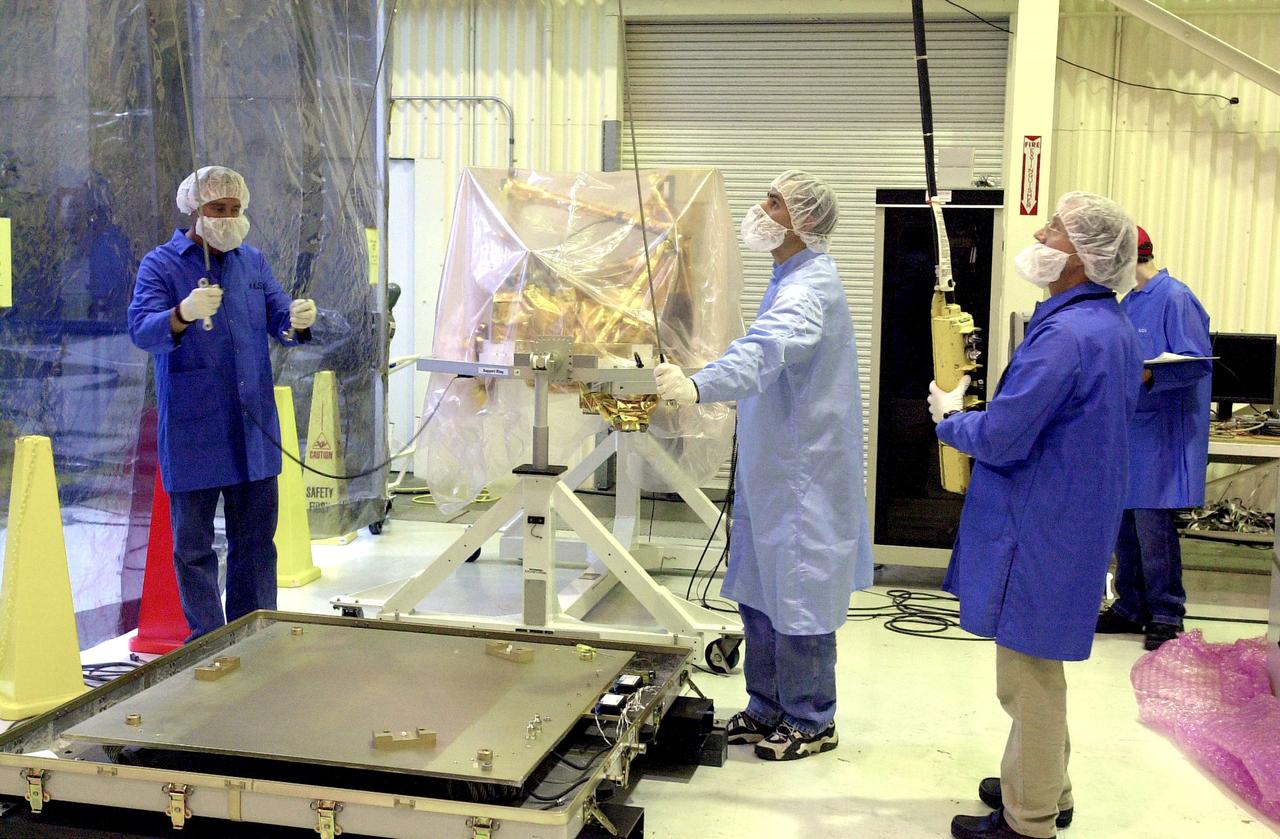
VANDENBERG AIR FORCE BASE, CALIF. - Outside the clean room at Vandenberg Air Force Base, Calif., the SciSat-1 spacecraft (background) has been removed from the shipping container mounting base (lower left) and placed on the handling fixture. Sci-Sat, which will undergo instrument checkout and spacecraft functional testing, weighs approximately 330 pounds and after launch will be placed in a 400-mile-high polar orbit to investigate processes that control the distribution of ozone in the upper atmosphere. The data from the satellite will provide Canadian and international scientists with improved measurements relating to global ozone processes and help policymakers assess existing environmental policy and develop protective measures for improving the health of our atmosphere, preventing further ozone depletion. The mission is designed to last two years.
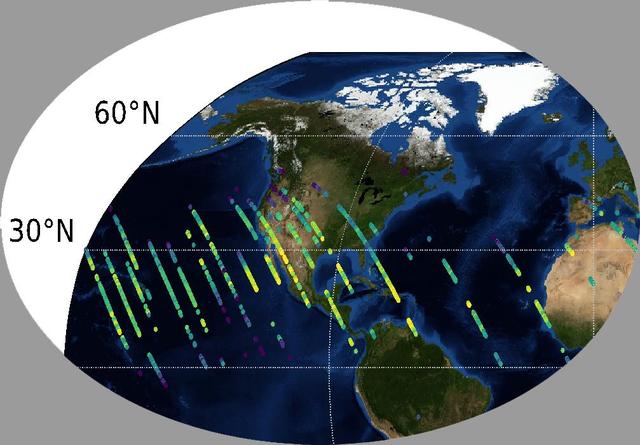
This image shows CO2 over the United States during OCO-3's first few days of science data collection. These initial measurements are consistent with measurements taken by OCO-3's older sibling, OCO-2, over the same area — meaning that even though OCO-3's instrument calibration is not yet complete, it is right on track to continue its (currently still operational) predecessor's data record. The mission team expects to complete OCO-3's in-orbit checkout phase — the period where they ensure all instruments and components are working and calibrated correctly — in August 2019. They are scheduled to release official CO2 and solar-induced fluorescence data to the science community a year later; however, this data will likely be available sooner given the quality of the measurements that OCO-3 is already making. https://photojournal.jpl.nasa.gov/catalog/PIA23352
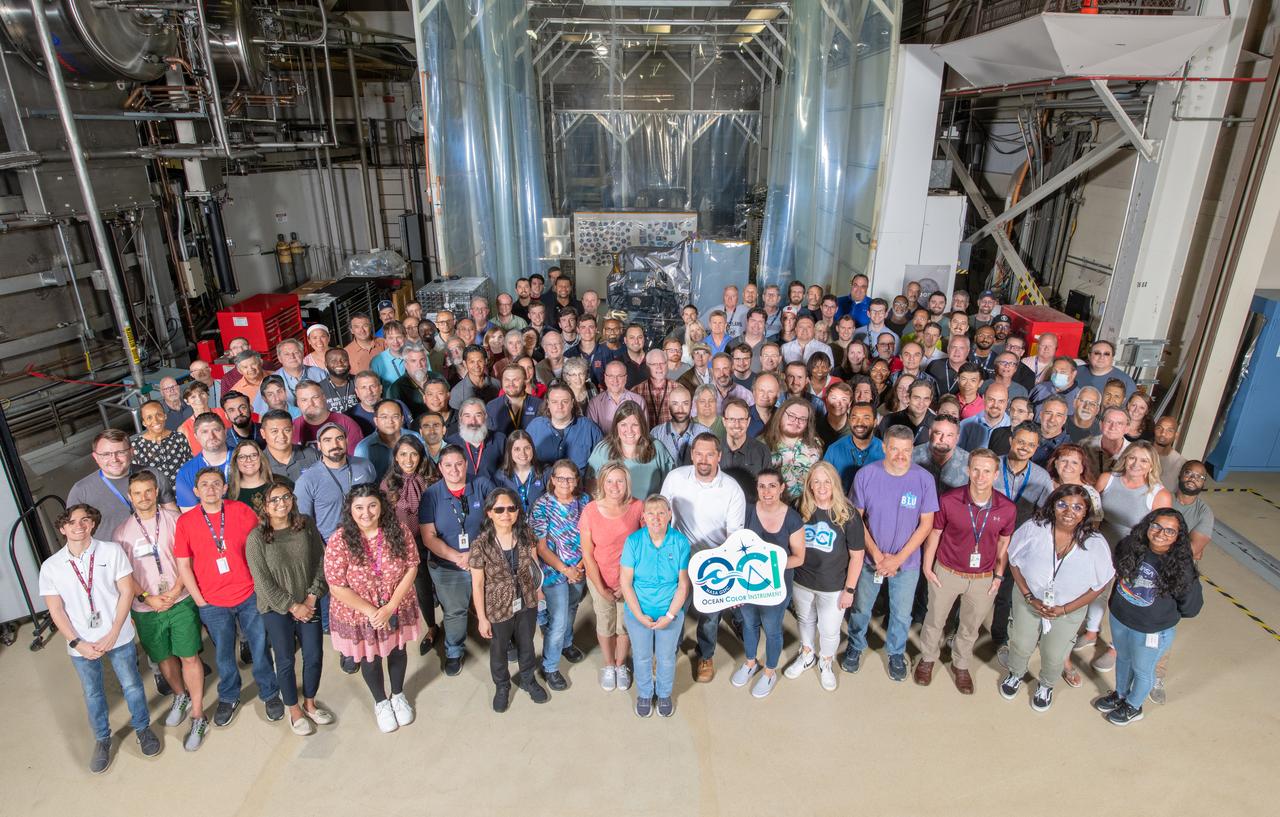
The Ocean Color Instrument (OCI) team pose with OCI and its integrated Earth Shade behind a clean tent curtain. This composite image made of two frames shows the Ocean Color Instrument team standing in front of the flight hardware before the instrument is integrated to the Plankton, Aerosol, Cloud, ocean Ecosystem spacecraft in summer, 2022. OCI is a highly advanced optical spectrometer that will be used to measure properties of light over portions of the electromagnetic spectrum. It will enable continuous measurement of light at finer wavelength resolution than previous NASA satellite sensors, extending key system ocean color data records for climate studies. OCI is PACE's (Plankton, Aerosol, Cloud, ocean Ecosystem) primary sensor built at Goddard Space Flight Center in Greenbelt, MD.
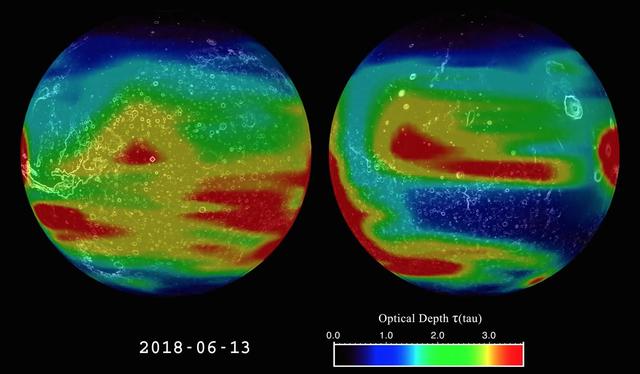
This image is from an animation that shows the evolution of the 2018 Mars global dust storm from late May to September. The animation shows the optical depth tau -- a measure of how much light is being blocked by atmospheric dust as measured by the Mars Climate Sounder instrument onboard NASA's Mars Reconnaissance Orbiter. NASA's Opportunity rover is marked with a red dot. The dust is mapped to two opposite hemispheres of Mars, giving a view of the full globe. Certain features of the Martian terrain, including Olympus Mons, the three volcanoes in the equatorial region, and Vallis Marineris, are also visible. The data shows the daily global column of dust, illustrating how the dust behaves over the course of the storm. The storm has a complex growth affecting most of Mars over the first month. It then remains near the peak for three weeks. Finally, the storm starts a multi-month decay back to regular weather. A color scale in the lower right-hand corner of the animation explains the colors in relation to approximate tau values. A tau of three indicates that only about 5 percent of the sunlight entering the atmosphere directly reaches the surface. Animation is available at https://photojournal.jpl.nasa.gov/catalog/PIA22737
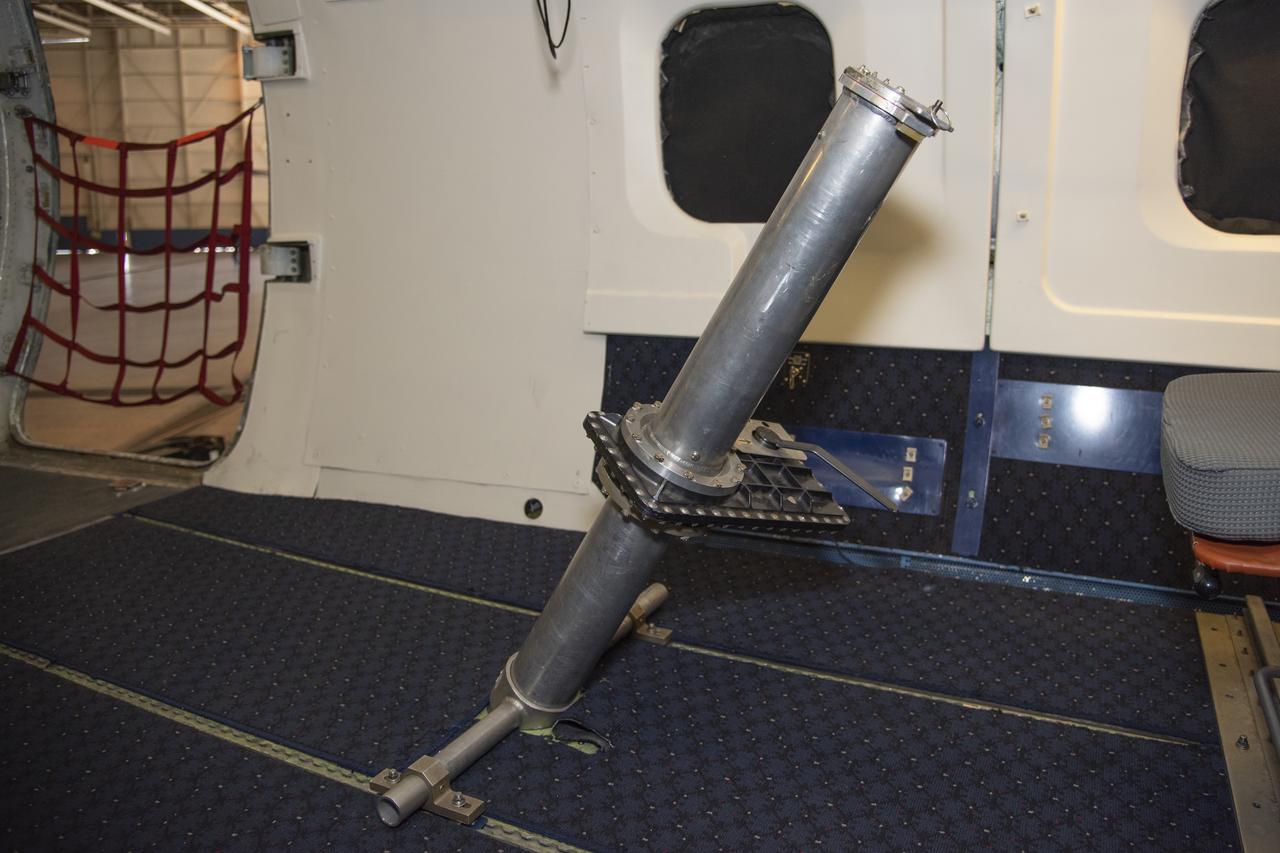
To verify the lidar data they're collecting on the DC-8 airborne science laboratory, Aeolus mission scientists will use dropsondes, which are devices they'll drop from this tube in the aircraft to collect wind and water vapor data.
Mechanical technicians crane lift the Ocean Color Instrument (OCI) onto the Tilt Mechanism. OCI is a highly advanced optical spectrometer that will be used to measure properties of light over portions of the electromagnetic spectrum. It will enable continuous measurement of light at finer wavelength resolution than previous NASA satellite sensors, extending key system ocean color data records for climate studies. OCI is PACE's (Plankton, Aerosol, Cloud, ocean Ecosystem) primary sensor built at Goddard Space Flight Center in Greenbelt, MD.
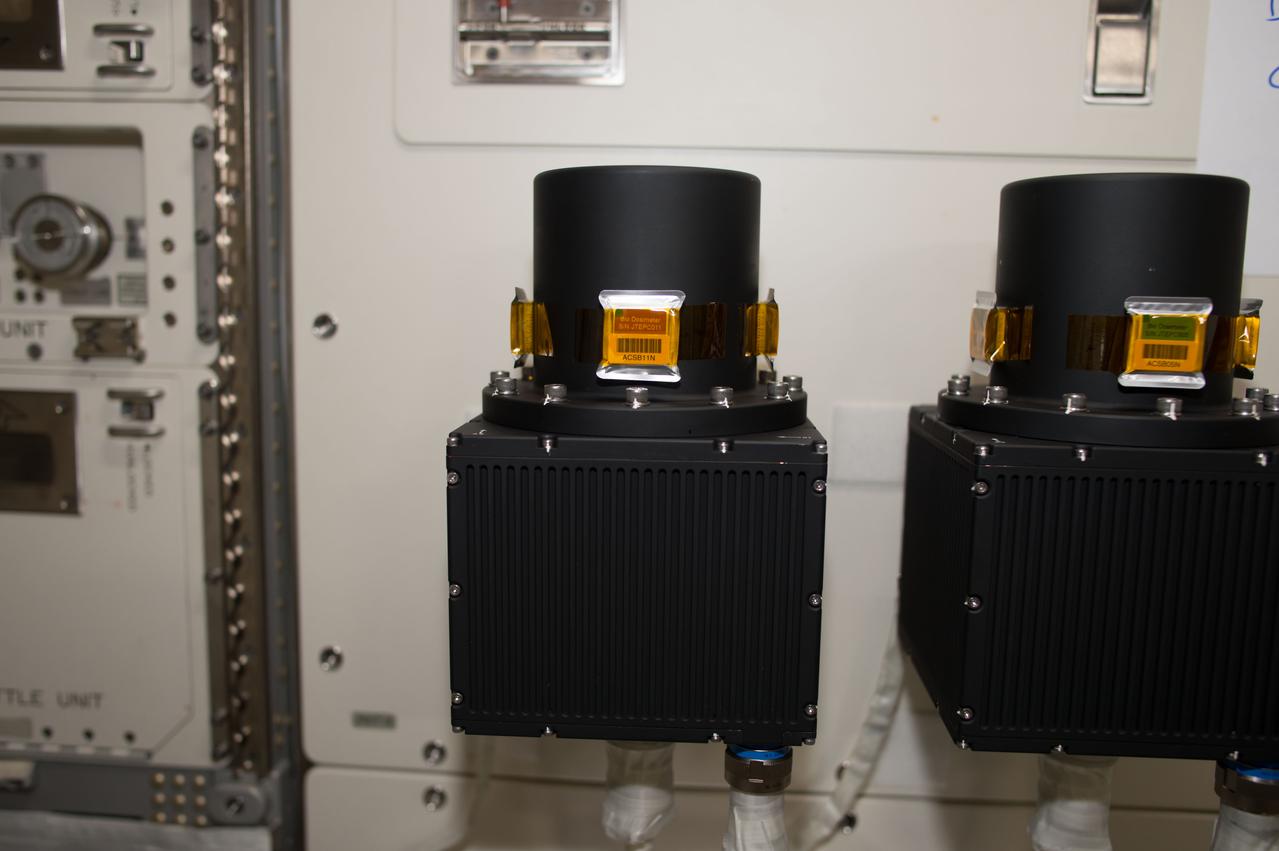
iss050e016013 (12/14/2016) --- A view during Position Sensitive-Tissue Equivalent Proportional Chamber (PS-TEPC) Installation aboard the International Space Station (ISS). The PS-TEPC is a radiation measuring instrument that measures absorbed doses and path length of space radiation particles simultaneously, and determines the real time Liner Energy Transfer (LET), and equivalent doses, to assess radiation risk to crew members during space flight.
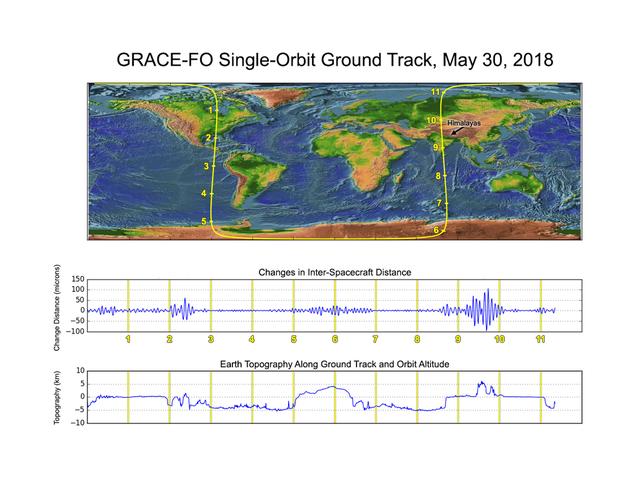
GRACE-FO has completed its first mission phase and demonstrated the performance of the precise ranging system that enables its measurements of how mass migrates around Earth. Along the satellites' ground track (top), the inter-spacecraft distance between them changes as the mass distribution underneath (i.e., from mountains, etc.) varies. The small changes measured by the Microwave Ranging Instrument (middle) agree well with topographic features along the orbit (bottom). https://photojournal.jpl.nasa.gov/catalog/PIA22507
The Ocean Color Instrument (OCI) is installed on the Plankton, Aerosol, Cloud, ocean Ecosystem (PACE) observatory spacecraft. OCI is a highly advanced optical spectrometer that will be used to measure properties of light over portions of the electromagnetic spectrum. It will enable continuous measurement of light at finer wavelength resolution than previous NASA satellite sensors, extending key system ocean color data records for climate studies. OCI is PACE's primary sensor built at Goddard Space Flight Center in Greenbelt, MD.
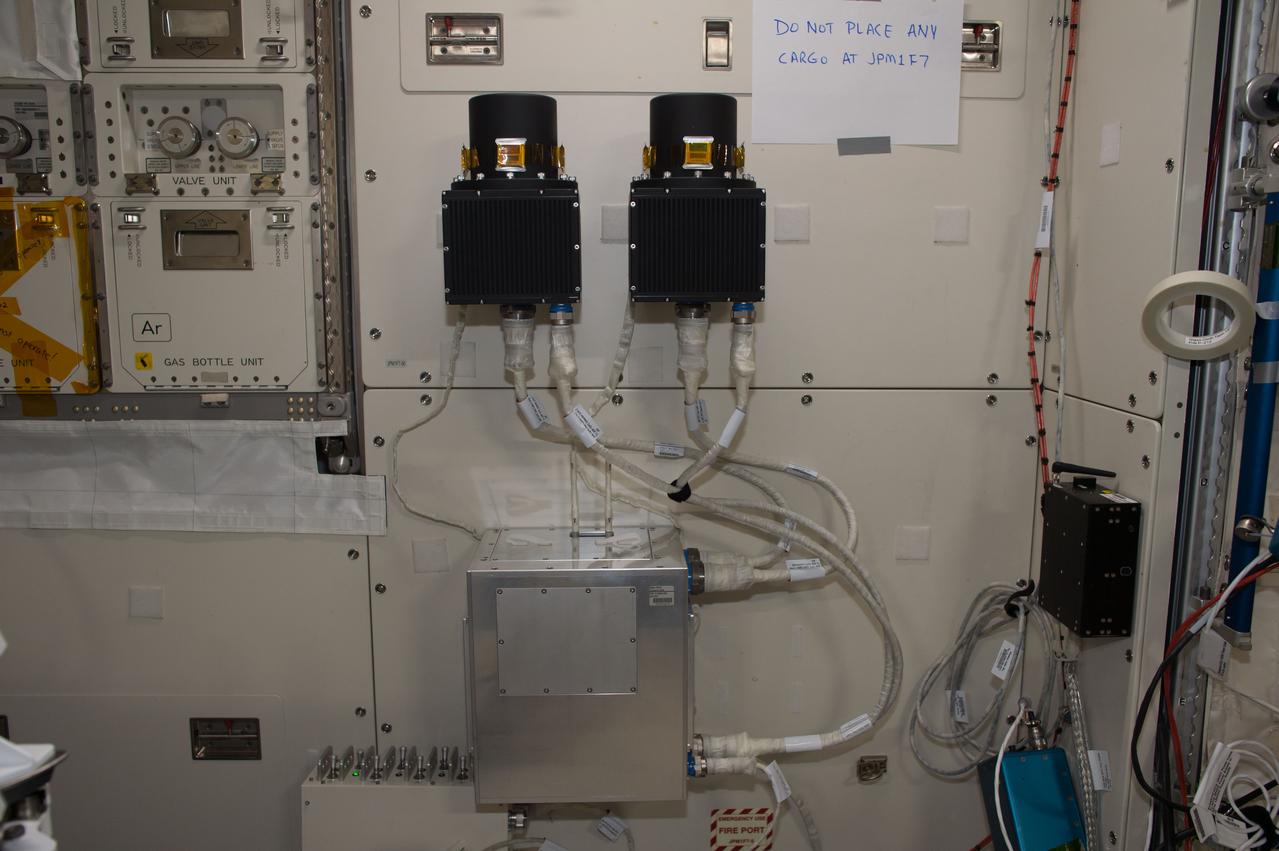
iss050e016008 (12/14/2016) --- A view during Position Sensitive-Tissue Equivalent Proportional Chamber (PS-TEPC) Installation aboard the International Space Station (ISS) The PS-TEPC is a radiation measuring instrument that measures absorbed doses and path length of space radiation particles simultaneously, and determines the real time Liner Energy Transfer (LET), and equivalent doses, to assess radiation risk to crew members during space flight. Bio Dosimeters are also visible.
jsc2025e044726 (5/12/2025) --- Solar Flare X-Ray Timing Instrument (SFXTI) integrated on Space Test Program – Houston 10 (STP-H10). STP-H10-SFXTI measures solar hard X-ray energy spectra with high energy and time resolution. These measurements can only be made from space because solar X-rays do not penetrate Earth’s atmosphere. Image courtesy of Montana State University.
Mechanical technicians crane lift the Ocean Color Instrument (OCI) off of the transportation dolly. OCI is a highly advanced optical spectrometer that will be used to measure properties of light over portions of the electromagnetic spectrum. It will enable continuous measurement of light at finer wavelength resolution than previous NASA satellite sensors, extending key system ocean color data records for climate studies. OCI is PACE's (Plankton, Aerosol, Cloud, ocean Ecosystem) primary sensor built at Goddard Space Flight Center in Greenbelt, MD.
The Ocean Color Instrument (OCI) is installed on its transportation dolly and prepared for additional integration operations in a clean tent. OCI is a highly advanced optical spectrometer that will be used to measure properties of light over portions of the electromagnetic spectrum. It will enable continuous measurement of light at finer wavelength resolution than previous NASA satellite sensors, extending key system ocean color data records for climate studies. OCI is PACE's (Plankton, Aerosol, Cloud, ocean Ecosystem) primary sensor built at Goddard Space Flight Center in Greenbelt, MD.
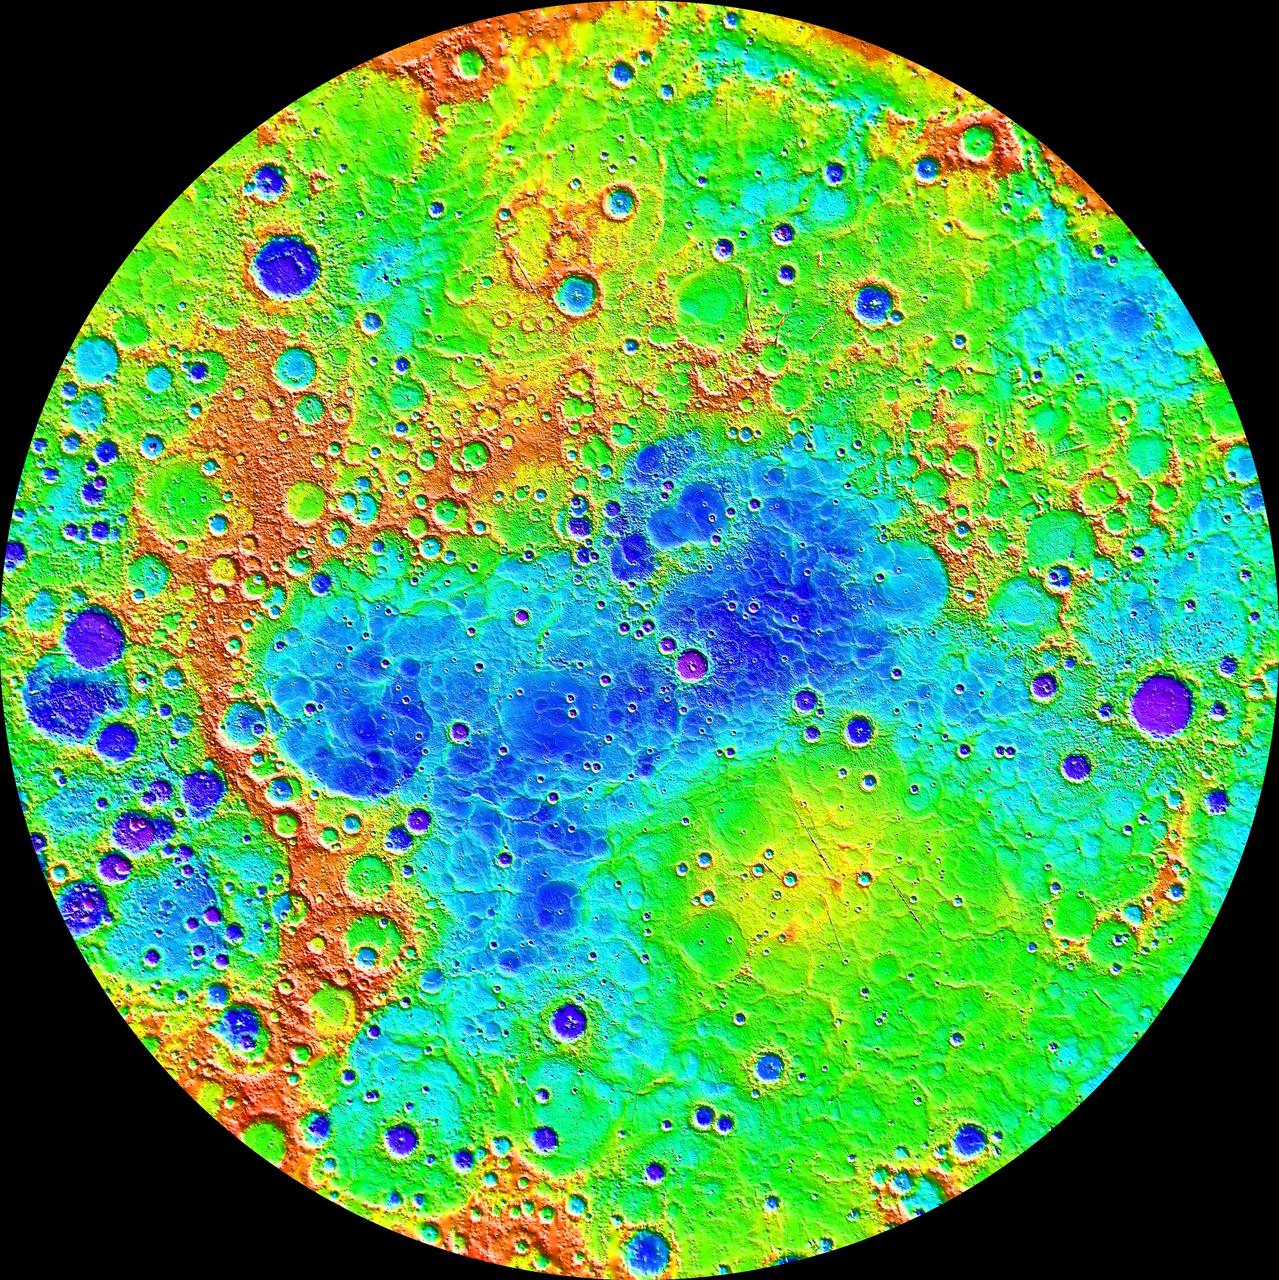
Measurements from NASA MESSENGER MLA instrument during the spacecraft greater than four-year orbital mission have mapped the topography of Mercury northern hemisphere in great detail. The view shown here is an interpolated shaded relief map of these data. The lowest regions are shown in purple, and the highest regions are shown in red. The difference in elevation between the lowest and highest regions shown here is roughly 10 kilometers! Among the prominent features visible here are the smooth northern volcanic plains and the enigmatic northern rise. The low-lying craters near the north pole host radar-bright materials, thought to be water ice. Linear artifacts can be seen in some areas of this map. These are due to individual MLA tracks that need minor adjustments in order to fit the rest of the data. Crossover analysis and better knowledge of the spacecraft position can be used to adjust these tracks and improve the map. Instrument: Mercury Laser Altimeter (MLA) Center Latitude: 90° Center Longitude: 0° E Latitude Range: 45° to 90° N http://photojournal.jpl.nasa.gov/catalog/PIA19420
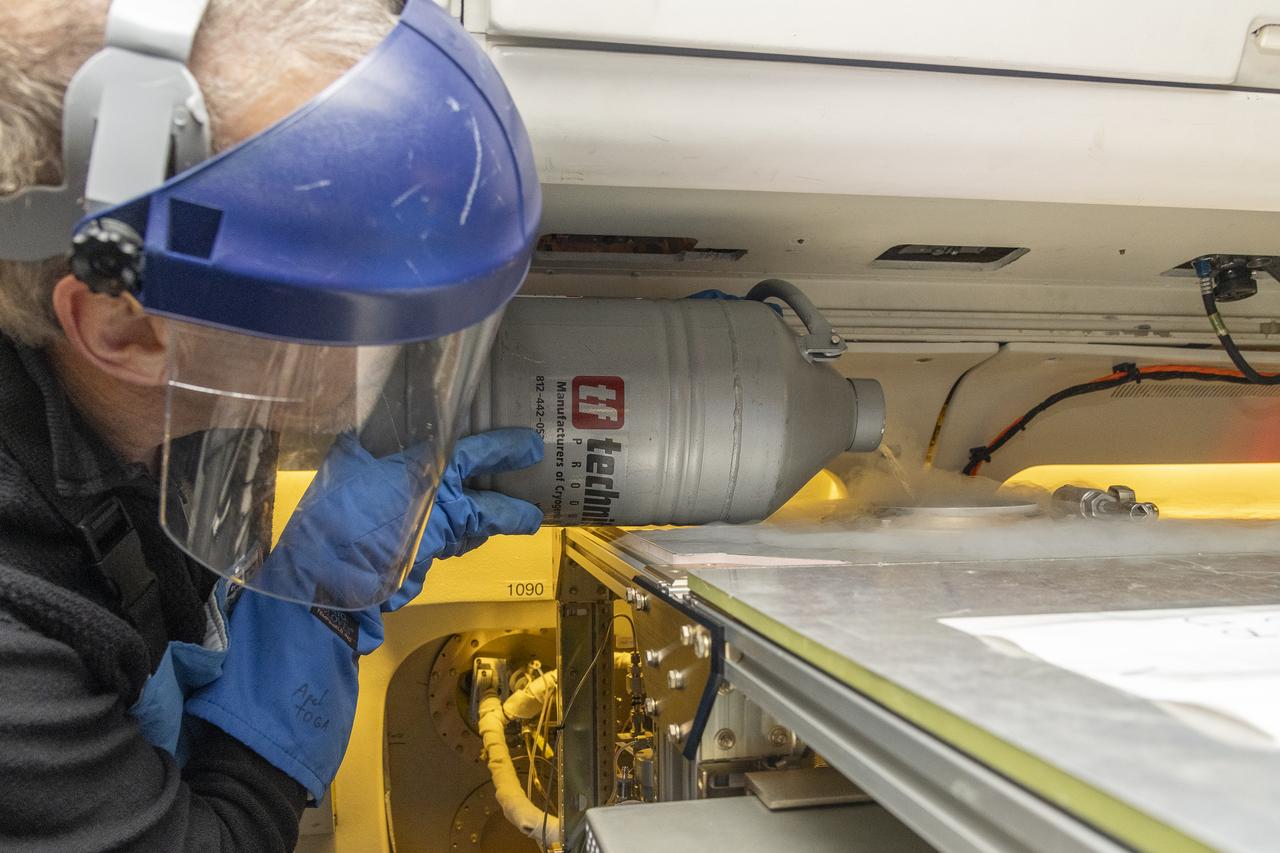
Alan Hills fills liquid nitrogen in the Trace Organic Gas Analyzer (TOGA) instrument onboard the DC-8 aircraft at Building 703 in Palmdale, CA. This instrument measures volatile organic compounds (VOCs) in the atmosphere. The DC-8 aircraft is prepared for its last mission, ASIA-AQ (Airborne and Satellite Investigation of Asian Air Quality), that will collect detailed air quality data over several locations in Asia to improve the understanding of local air quality in collaboration with local scientists, air quality agencies, and government partners

WFIRST, the Wide Field Infrared Survey Telescope, is shown here in an artist's rendering. It will carry a Wide Field Instrument to provide astronomers with Hubble-quality images covering large swaths of the sky, and enabling several studies of cosmic evolution. Its Coronagraph Instrument will directly image exoplanets similar to those in our own solar system and make detailed measurements of the chemical makeup of their atmospheres. http://photojournal.jpl.nasa.gov/catalog/PIA20060
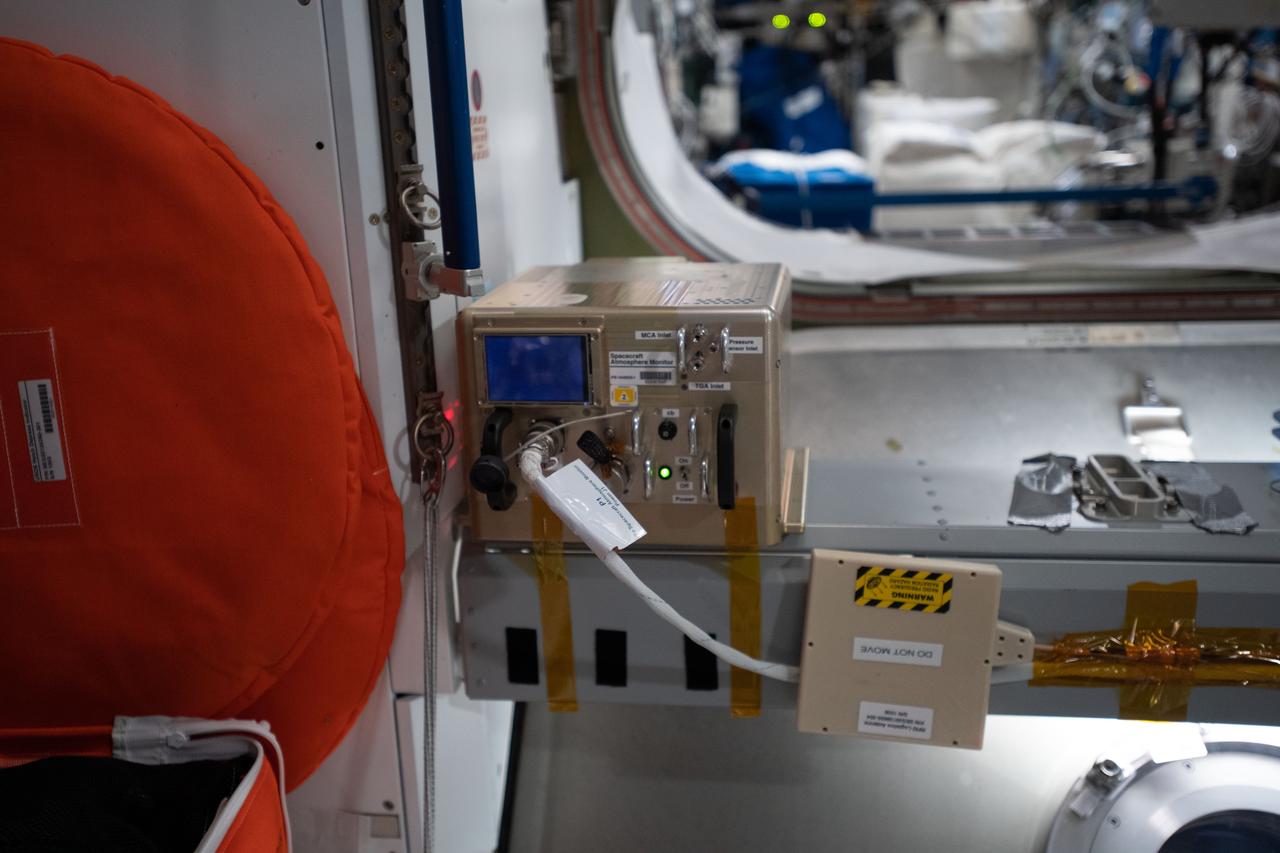
iss063e035115 (7/6/2020) --- A view of the Spacecraft Atmosphere Monitor in the Node 2 module aboard the International Space Station (ISS). The Spacecraft Atmosphere Monitor investigation demonstrates the capabilities of a small, reliable, portable gas chromatograph mass spectrometer instrument aboard the ISS to conduct major and minor elements of air measurement. The instrument transmits data back to the ground research team every two seconds, providing a continuous analysis to the ground research team.
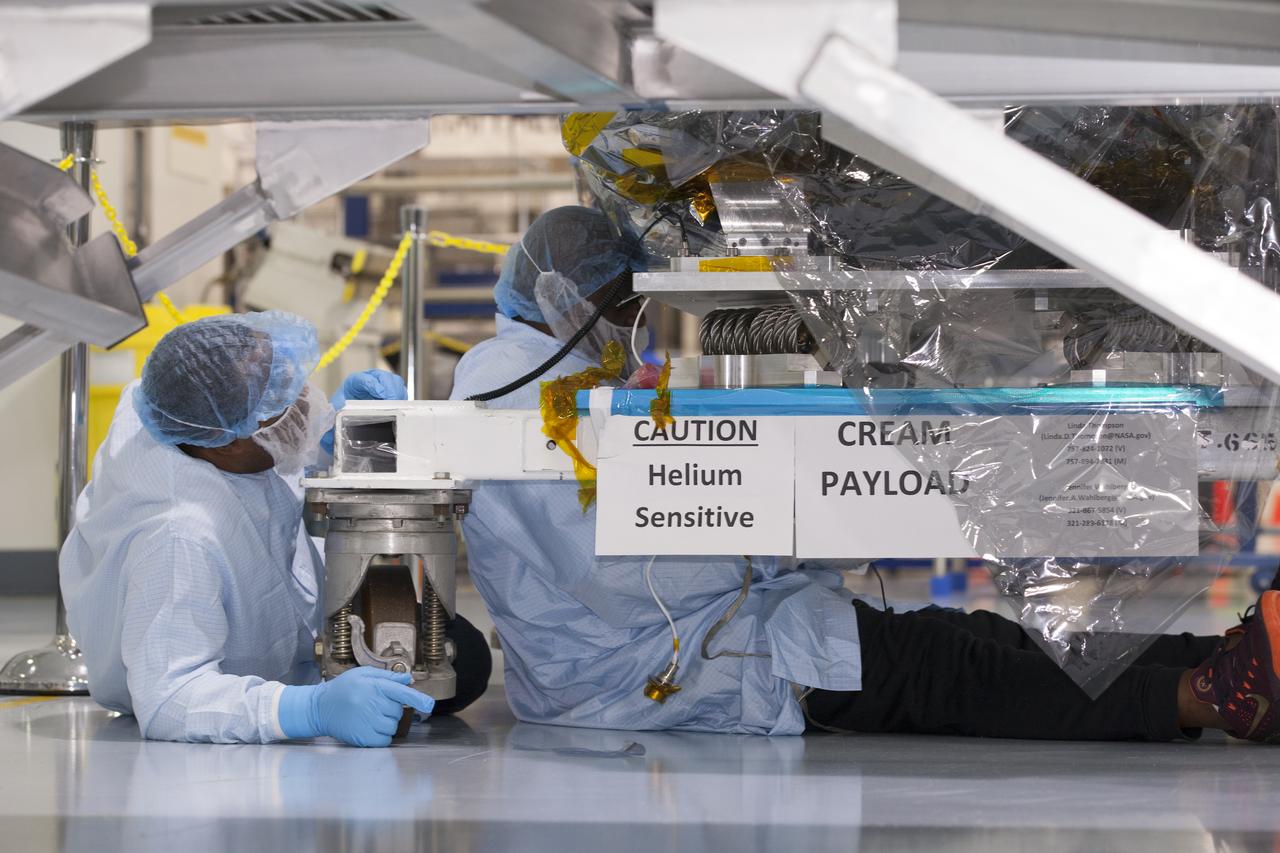
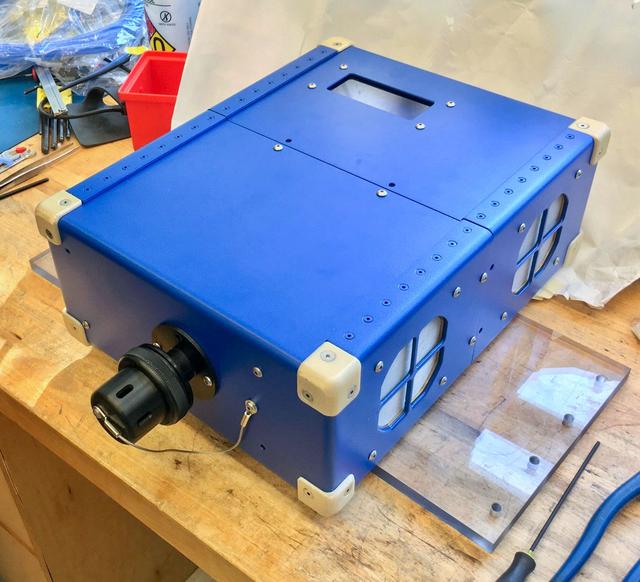
In the Space Station Processing Facility at NASA's Kennedy Space Center in Florida, technicians and engineers remove a protective cover on the Cosmic-Ray Energetics and Mass investigation, or CREAM, instrument. It is designed to measure the charges of cosmic rays to better understand what gives them such incredible energies, and how that effects the composition of the universe. The instrument will be launched to the space station on the SpaceX CRS-12 commercial resupply mission in August 2017.

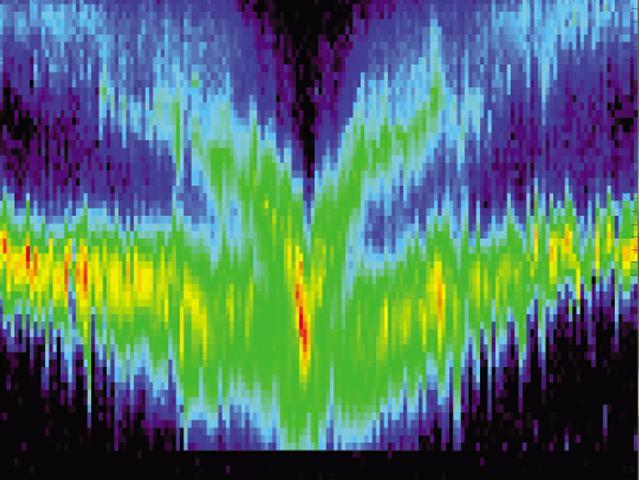
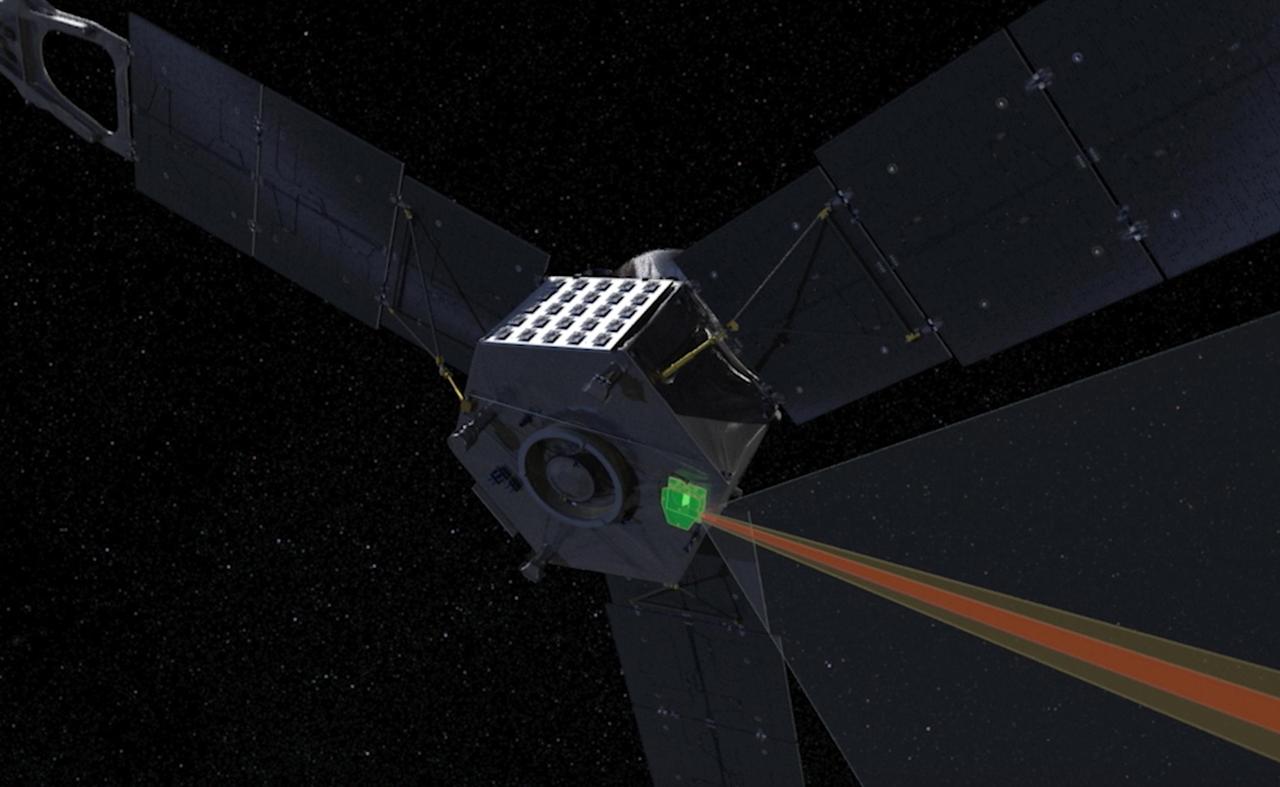
This is a reconstructed view of Jupiter's northern lights through the filters of Juno's Ultraviolet Imaging Spectrometer (UVS) instrument on Dec. 11, 2016, as the Juno spacecraft approached Jupiter, passed over its poles, and plunged towards the equator. Such measurements present a real challenge for the spacecraft's science instruments: Juno flies over Jupiter's poles at 30 miles (50 kilometers) per second -- more than 100,000 miles per hour -- speeding past auroral forms in a matter of seconds. https://photojournal.jpl.nasa.gov/catalog/PIA21938
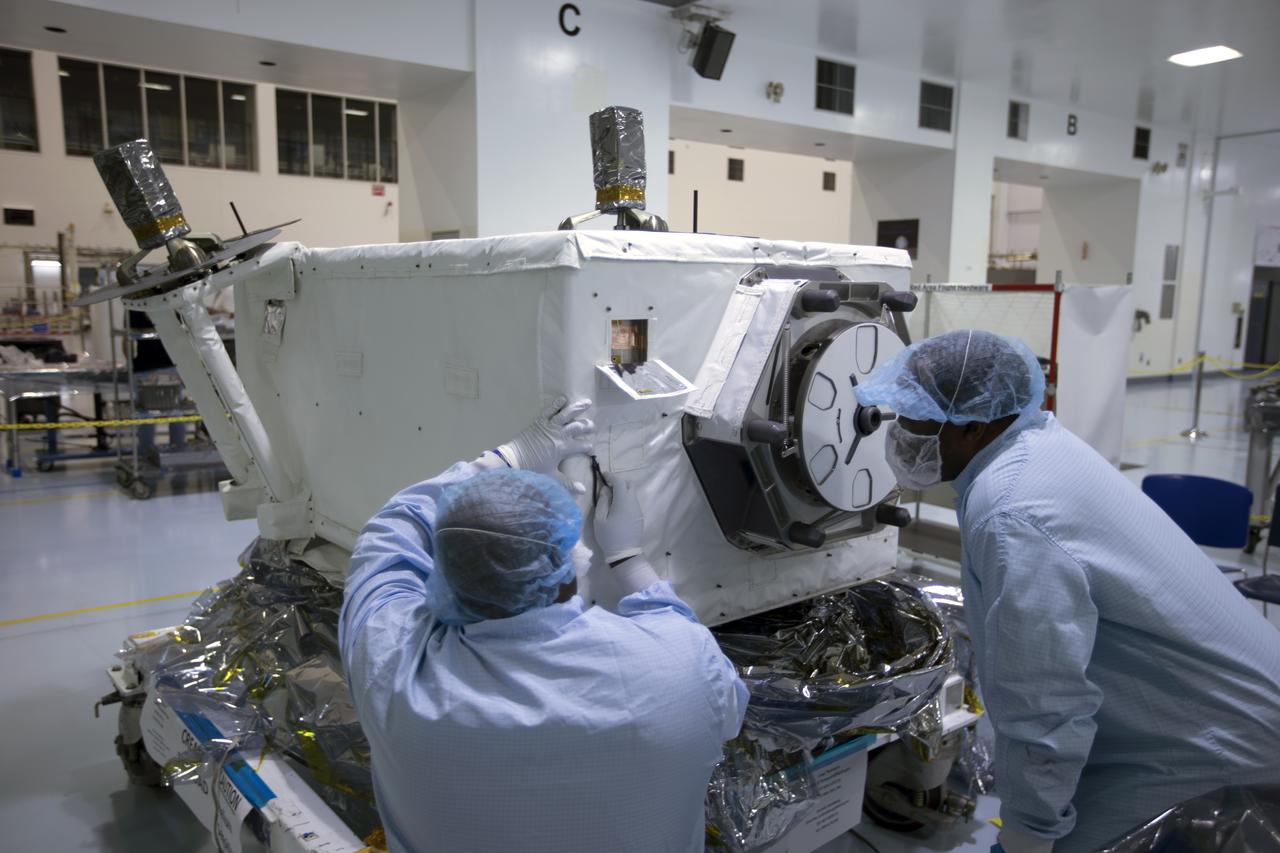
In the Space Station Processing Facility at NASA's Kennedy Space Center in Florida, technicians and engineers inspect the Cosmic-Ray Energetics and Mass investigation, or CREAM, instrument. It is designed to measure the charges of cosmic rays to better understand what gives them such incredible energies, and how that effects the composition of the universe. The instrument will be launched to the space station on the SpaceX CRS-12 commercial resupply mission in August 2017.
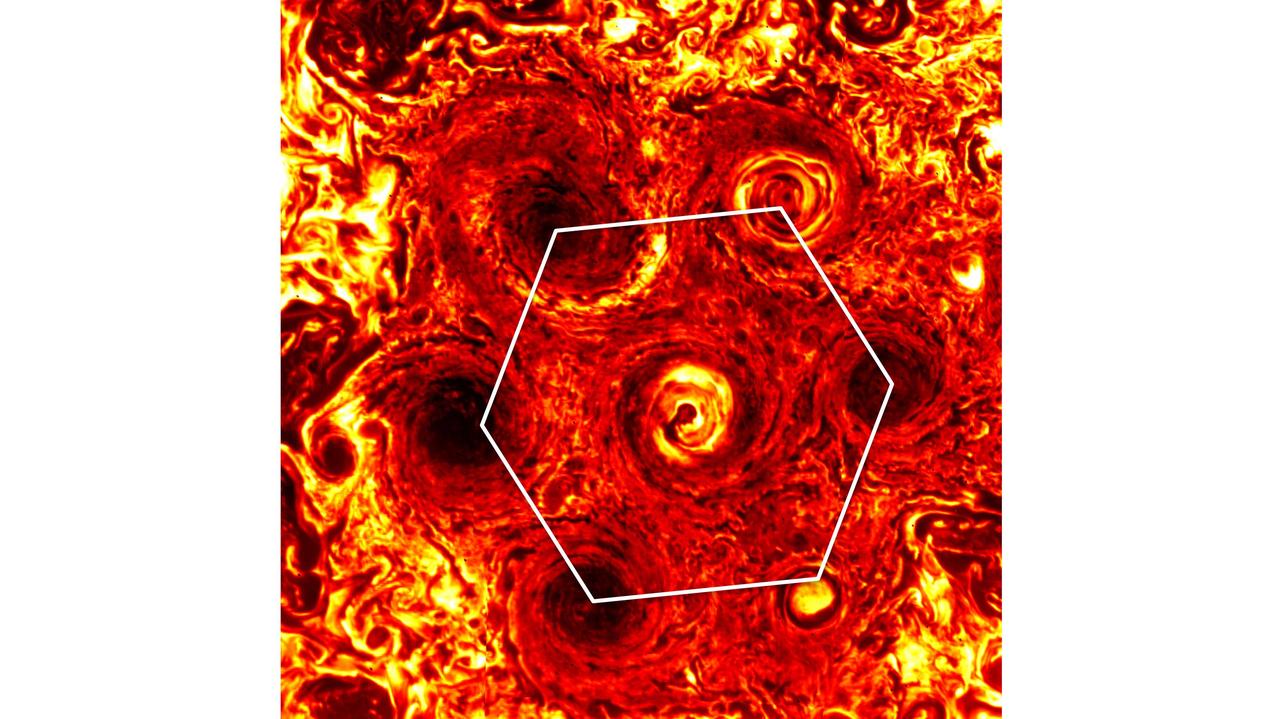
In this annotated infrared image, six cyclones form a hexagonal pattern around a central cyclone at Jupiter's south pole. The image was generated from data collected on Nov. 4, 2019, by the Jovian Infrared Auroral Mapper (JIRAM) instrument aboard NASA's Juno mission during its 23rd science pass of the planet. The JIRAM instrument measures heat radiated from the planet at an infrared wavelength of around 5 microns. https://photojournal.jpl.nasa.gov/catalog/PIA23559
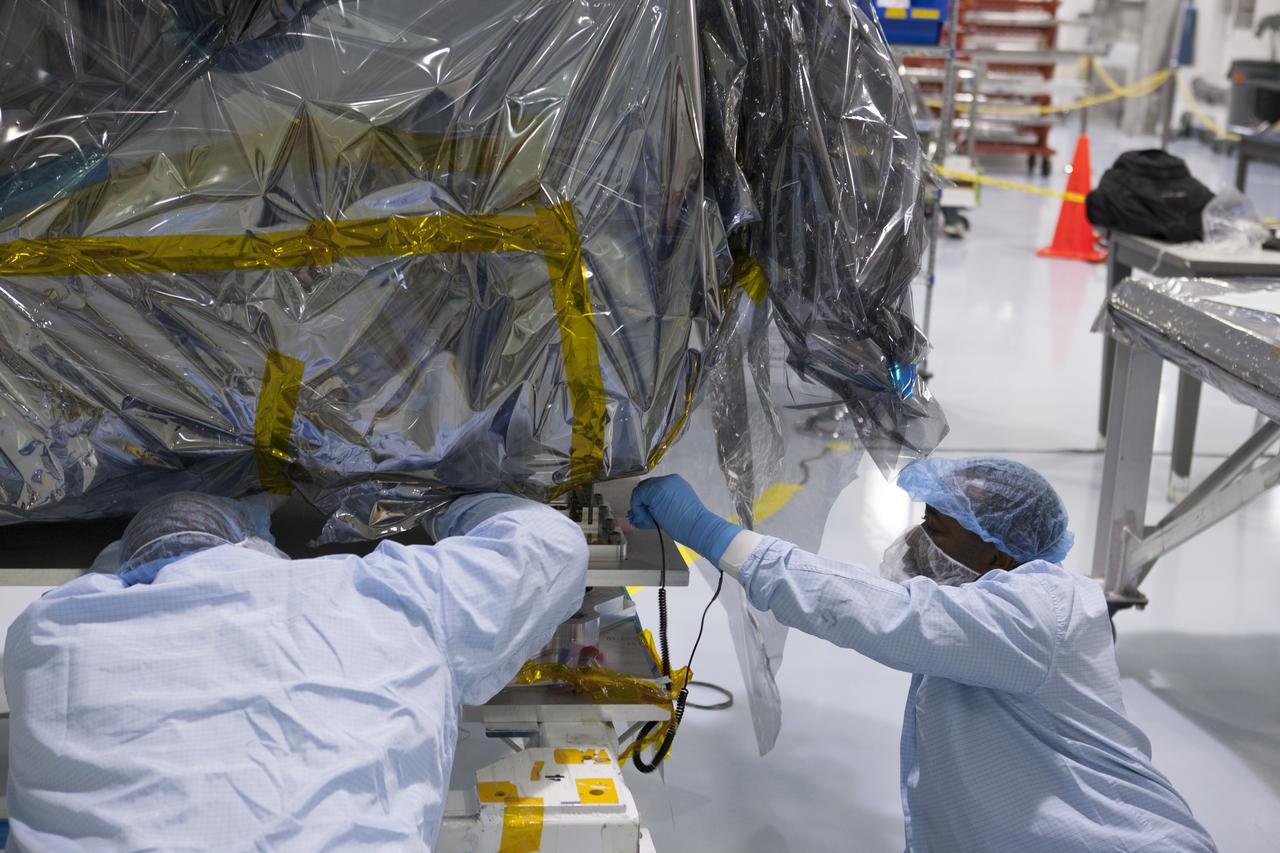
In the Space Station Processing Facility at NASA's Kennedy Space Center in Florida, technicians and engineers remove a protective cover on the Cosmic-Ray Energetics and Mass investigation, or CREAM, instrument. It is designed to measure the charges of cosmic rays to better understand what gives them such incredible energies, and how that effects the composition of the universe. The instrument will be launched to the space station on the SpaceX CRS-12 commercial resupply mission in August 2017.
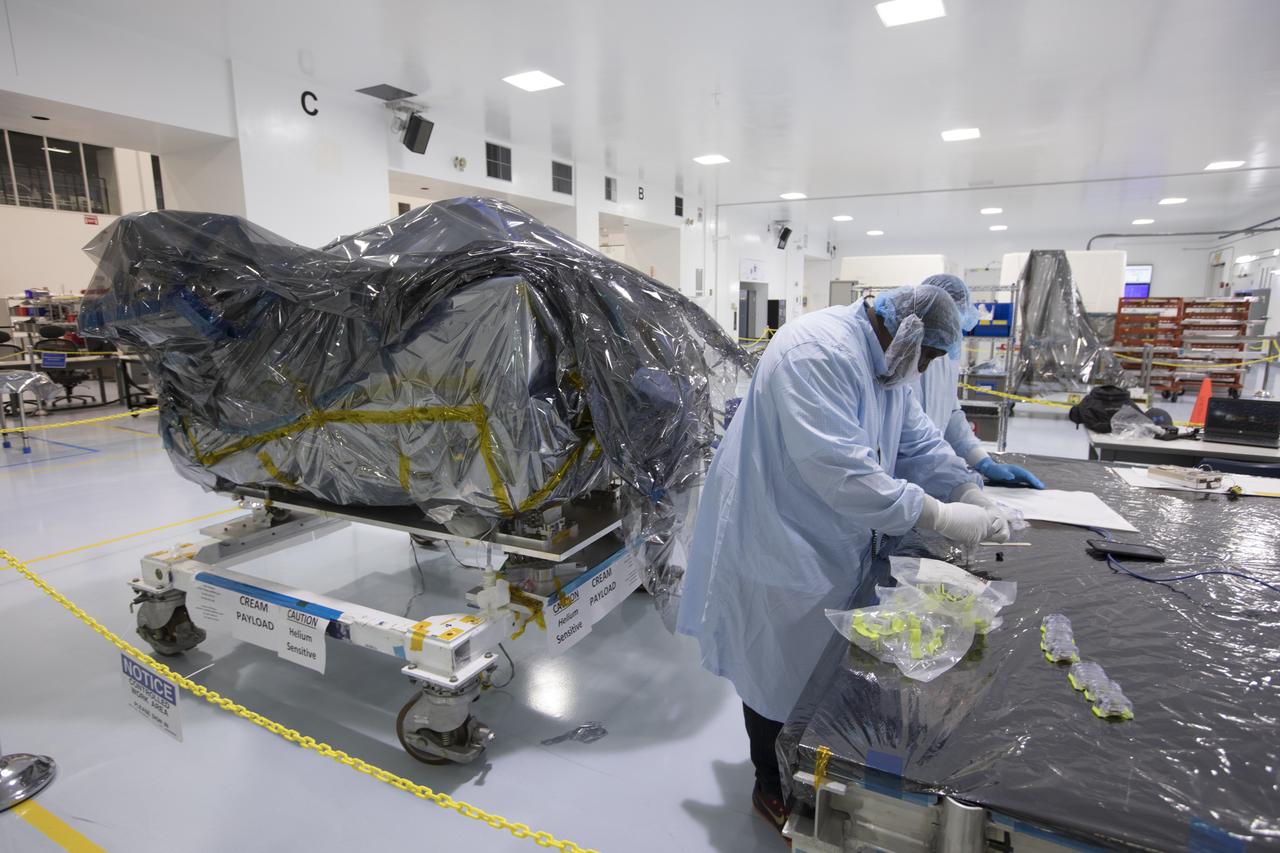
In the Space Station Processing Facility at NASA's Kennedy Space Center in Florida, technicians and engineers inspect components for the Cosmic-Ray Energetics and Mass investigation, or CREAM, instrument. It is designed to measure the charges of cosmic rays to better understand what gives them such incredible energies, and how that effects the composition of the universe. The instrument will be launched to the space station on the SpaceX CRS-12 commercial resupply mission in August 2017.