
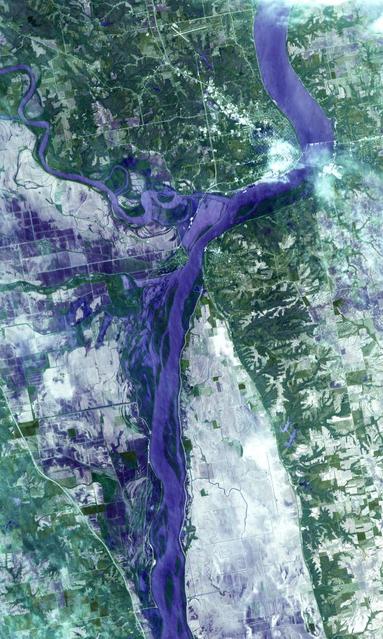
NASA image acquired July 17, 2011 In mid-July 2011, more than a month after the Missouri River broke through two levees and flooded fields near Hamburg, Iowa, muddy water lingered near the city. Hamburg residents were relieved, however, that a newly built levee had spared the town from flooding. On July 17, 2011, the Advanced Land Imager (ALI) on NASA’s Earth Observing-1 (EO-1) satellite captured this natural-color image. Compared to an image acquired on June 24, flooding has apparently receded slightly in some areas. Sediment-choked water nevertheless lingers on large swaths of land. On July 13, 2011, KETV of Omaha, Nebraska, reported that a newly built, 2-mile levee designed to protect Hamburg already exceeded federal standards. The U.S. Army Corps of Engineers handed control of the levee over to city officials on July 12. In the end, the levee was expected to cost the Army Corps $6 million, and the city of Hamburg about $800,000. On July 18, 2011, the Advanced Hydrological Prediction Service reported moderate flooding along the Missouri River not far from Hamburg, Iowa. In the northwest, the river reached 24.37 feet (7.43 meters) at Nebraska City. In the southeast, the river reached 38.98 feet (11.88 meters) at Brownville, Nebraska. NASA Earth Observatory image created by Jesse Allen and Robert Simmon, using EO-1 ALI data provided courtesy of the NASA EO-1 team. Caption by Michon Scott. Instrument: EO-1 - ALI Credit: <b><a href="http://www.earthobservatory.nasa.gov/" rel="nofollow"> NASA Earth Observatory</a></b> <b><a href="http://www.nasa.gov/centers/goddard/home/index.html" rel="nofollow">NASA Goddard Space Flight Center</a></b> enables NASA’s mission through four scientific endeavors: Earth Science, Heliophysics, Solar System Exploration, and Astrophysics. Goddard plays a leading role in NASA’s accomplishments by contributing compelling scientific knowledge to advance the Agency’s mission. <b>Follow us on <a href="http://twitter.com/NASA_GoddardPix" rel="nofollow">Twitter</a></b> <b>Like us on <a href="http://www.facebook.com/pages/Greenbelt-MD/NASA-Goddard/395013845897?ref=tsd" rel="nofollow">Facebook</a></b> <b>Find us on <a href="http://web.stagram.com/n/nasagoddard/?vm=grid" rel="nofollow">Instagram</a></b>
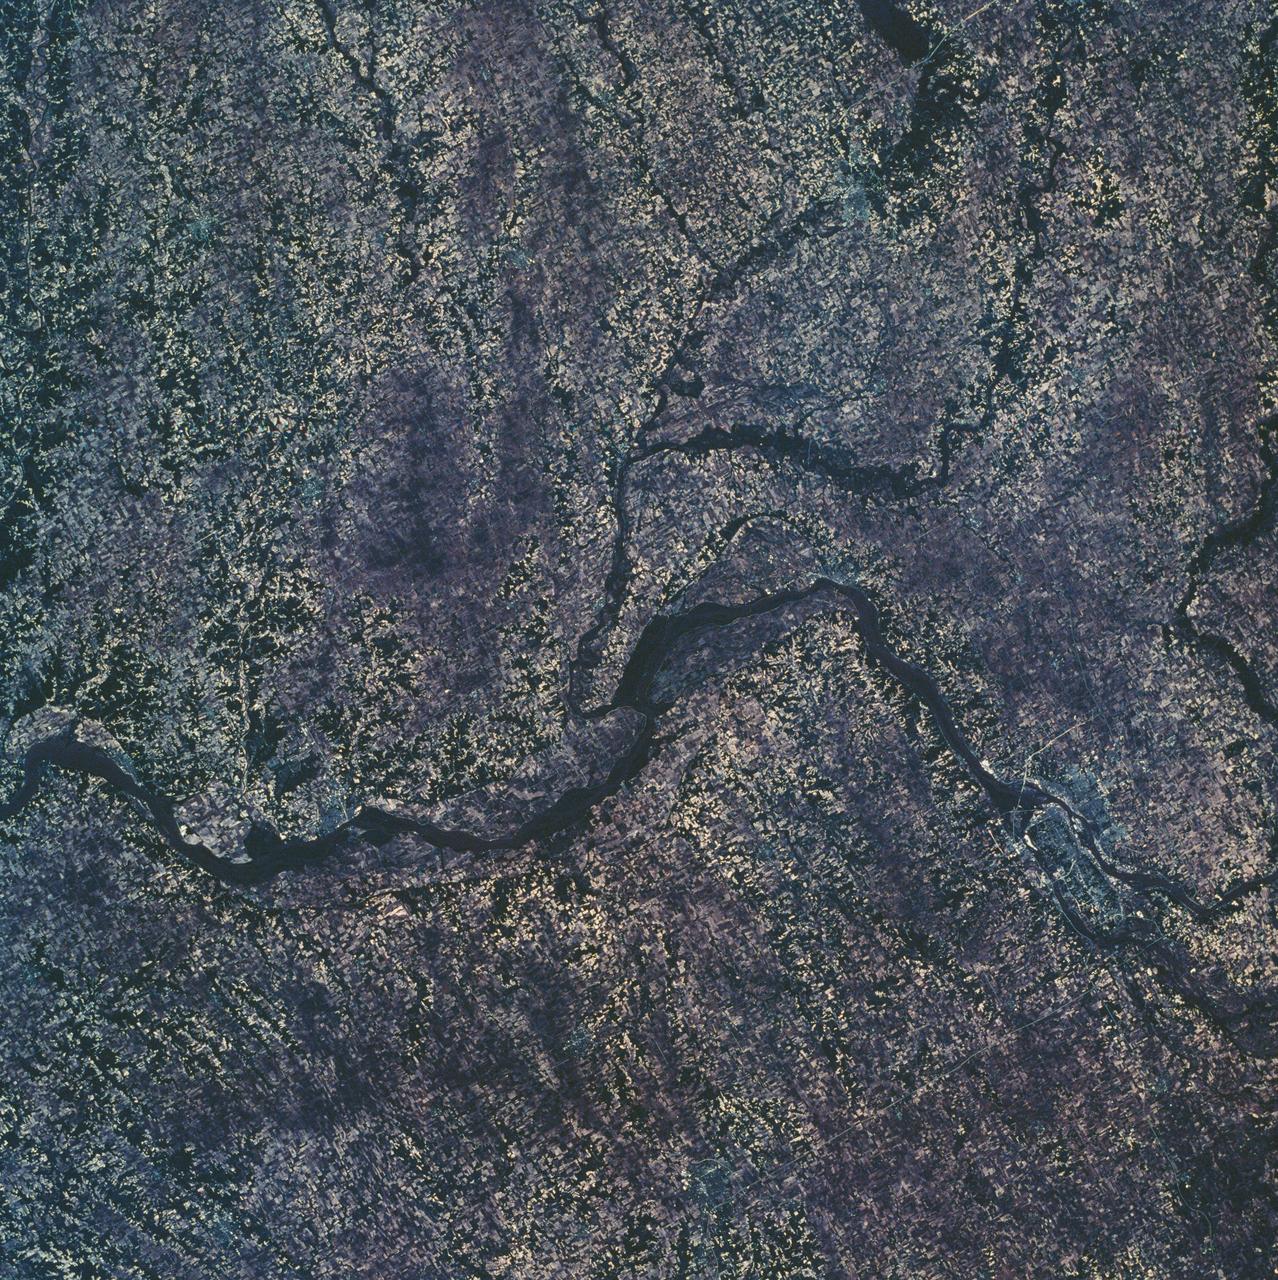
SL2-10-250 (May-June 1973) --- A vertical view of eastern Iowa and northwestern Illinois, as photographed from Skylab space station in Earth orbit. Davenport, Burlington and Muscatine, Iowa; and Rock Island and Moline, Illinois can be delineated on opposite sides of the Mississippi River. The Iowa River and tributaries of it can also be delineated. This photograph was taken with one of six lenses of the Itek-furnished Multispectral Photographic Facility Experiment S190-A mounted in the Multiple Docking Adapter (MDA) of the space station. A six-inch lens, using 70mm medium speed Ektachrome (SO-356) film, was used. Agencies participating with NASA on the EREP project are the Departments of Agriculture, Commerce and Interior; the Environmental Protection Agency and the Corps of Engineers. All EREP photography is available to the public through the Department of Interior's Earth Resources Observations Systems Data Center, Sioux Falls, South Dakota, 57198. Photo credit: NASA

L59-3802 Nike-Cajun sounding rocket with University of Iowa payload on launcher at Wallops for flight test, May 20, 1959. Photograph published in A New Dimension Wallops Island Flight Test Range: The First Fifteen Years by Joseph Shortal. A NASA publication. Page 698.

L59-3802 Nike-Cajun sounding rocket with University of Iowa payload on launcher at Wallops for flight test, May 20, 1959. Photograph published in A New Dimension Wallops Island Flight Test Range: The First Fifteen Years by Joseph Shortal. A NASA publication. Page 698.
SL4-139-3932 (December 1973) --- A 70mm hand-held Hasselblad photograph showing parts of Minnesota, Iowa and Wisconsin. Lake Superior is in the upper part of the photo; Duluth at upper left; Castle Rock Flowage and Petenwell Flowage at far right center. Note circular feature (partially formed by rivers) which the Skylab 4 crewmen commented on when they made this fly-over. Photo credit: NASA
NASA Terra spacecraft acquired this image on April 30, 2011, showing flooding along the Mississippi River at its junction with the Des Moines River near Keokuk, Iowa.
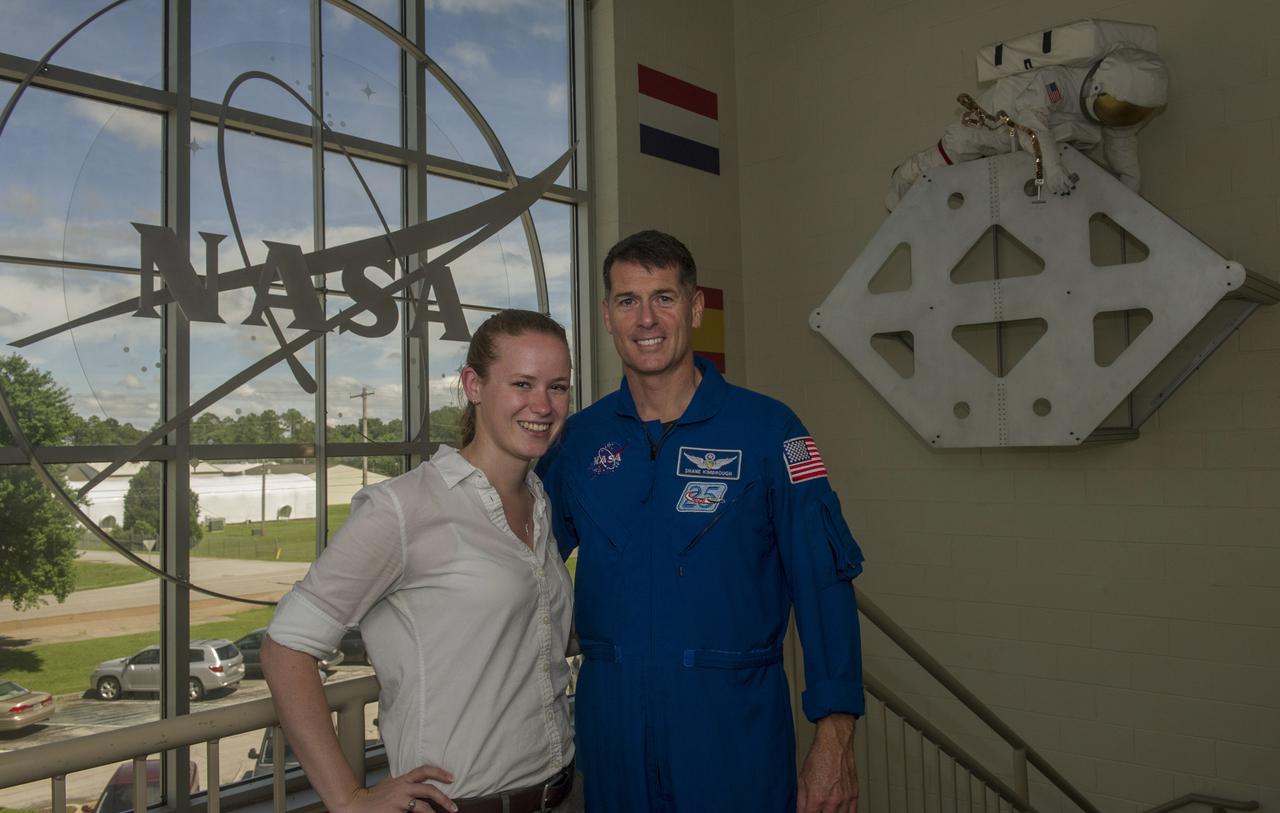
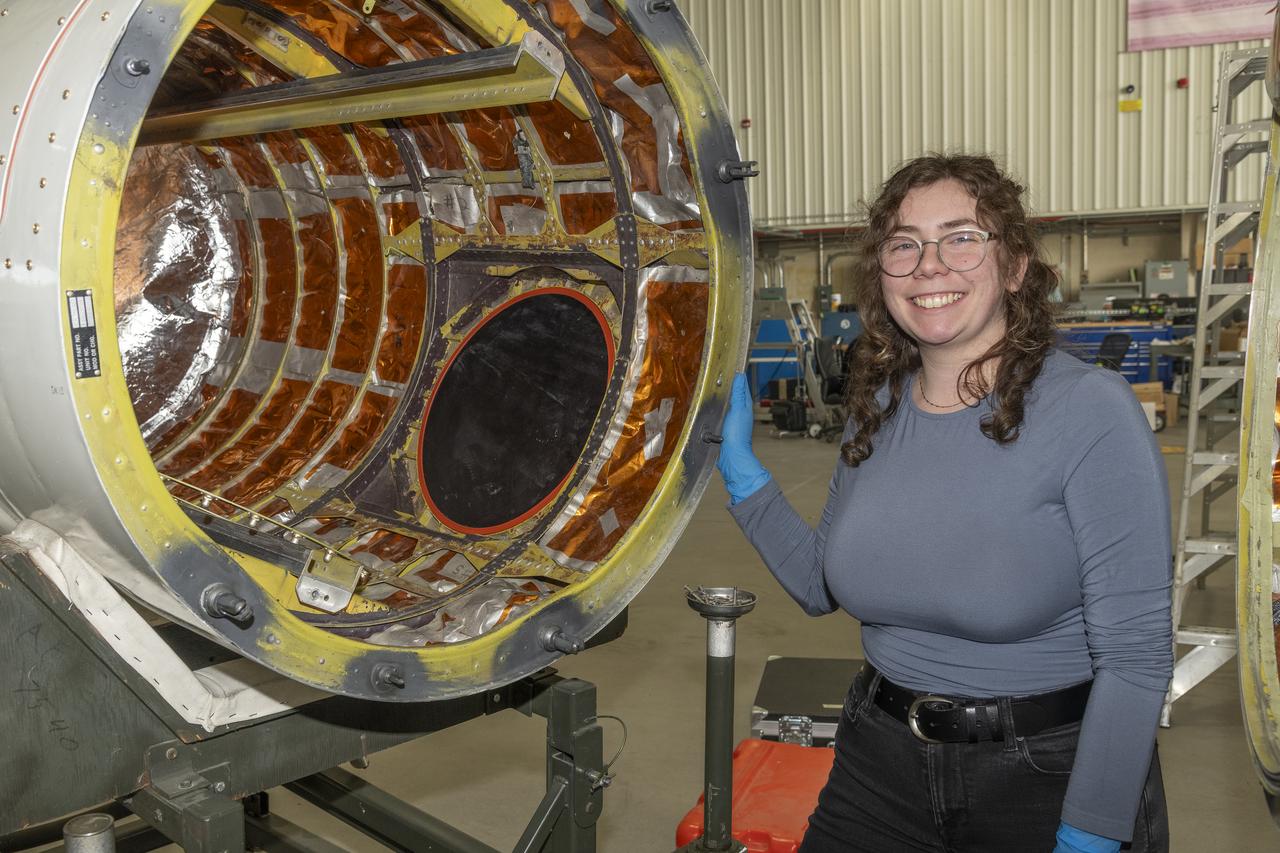
SUMMER INTERN RACHEL RICE, A SENIOR AT SIMPSON COLLEGE, INDIANOLA, IOWA, WITH ASTRONAUT SHANE KIMBROUGH
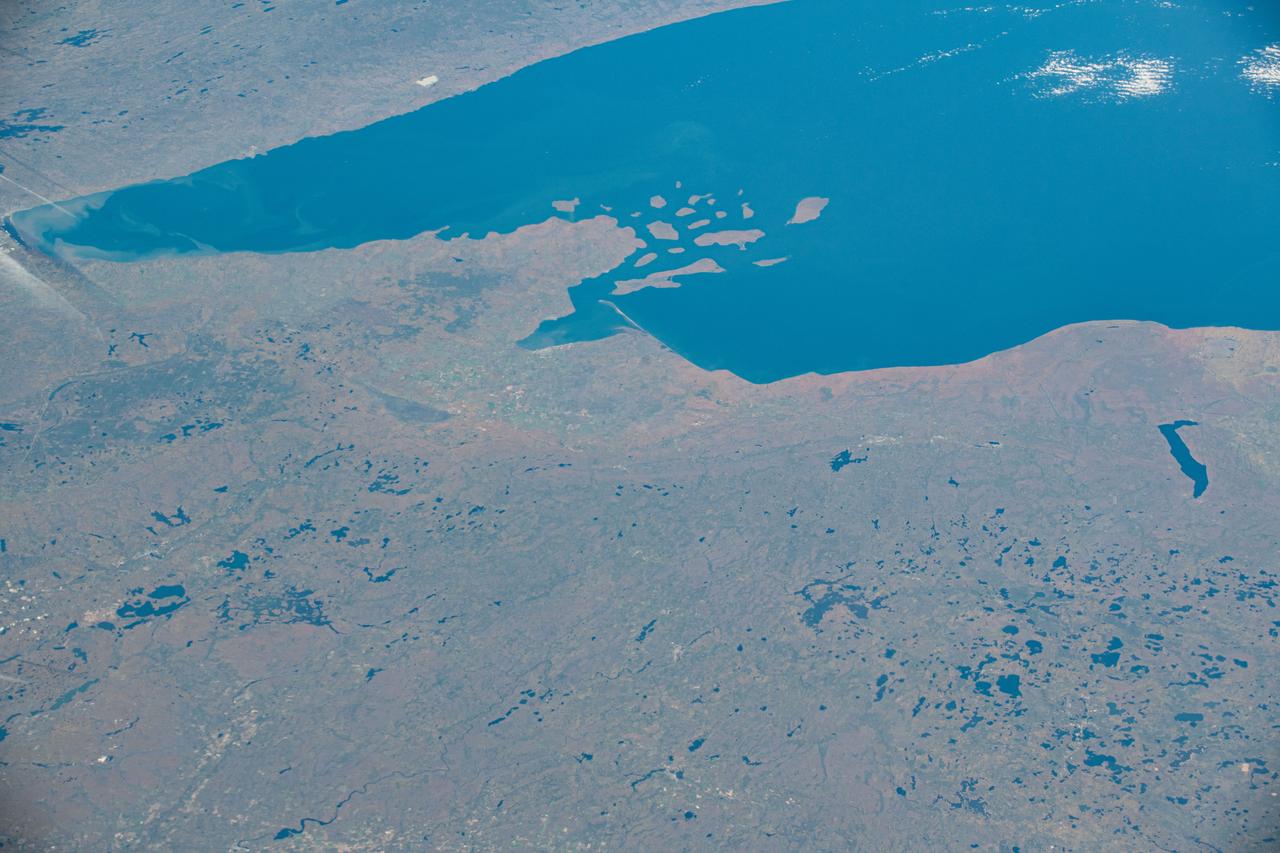
iss070e005398 (Oct. 17, 2023) --- The western tip of Lake Superior is pictured from the International Space Station as it orbited 258 miles above the state of Iowa.
iss061e067892 (Dec. 6, 2019) --- The city of Moline, Illinois is surrounded by the Mississippi and Rock Rivers. The Mississippi River is the boundary between the states of Illinois and Iowa.
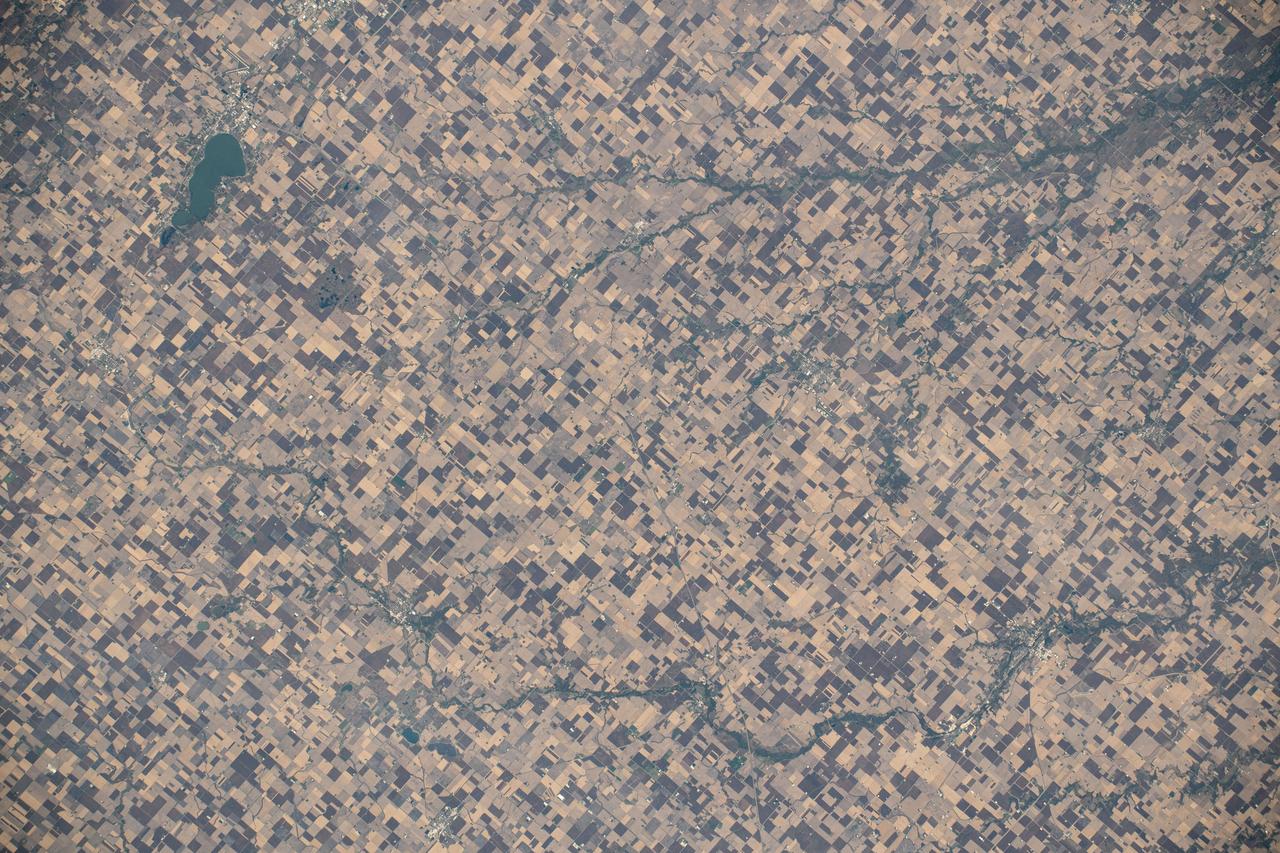
iss070e005396 (Oct. 17, 2023) --- Clear Lake, Iowa, and its namesake lake (upper left) are surrounded by farmland in this photograph from the International Space Station as it orbited 259 miles above the Hawkeye State.
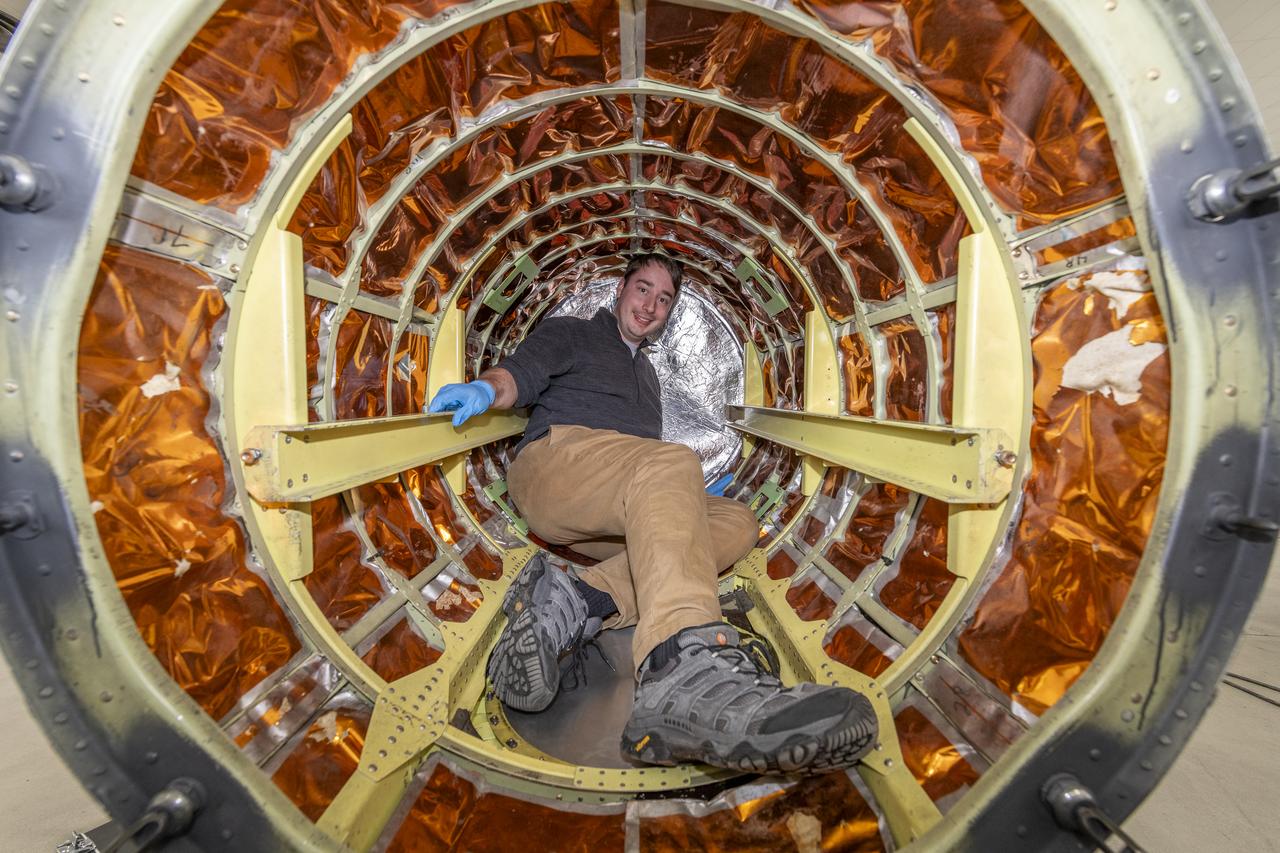
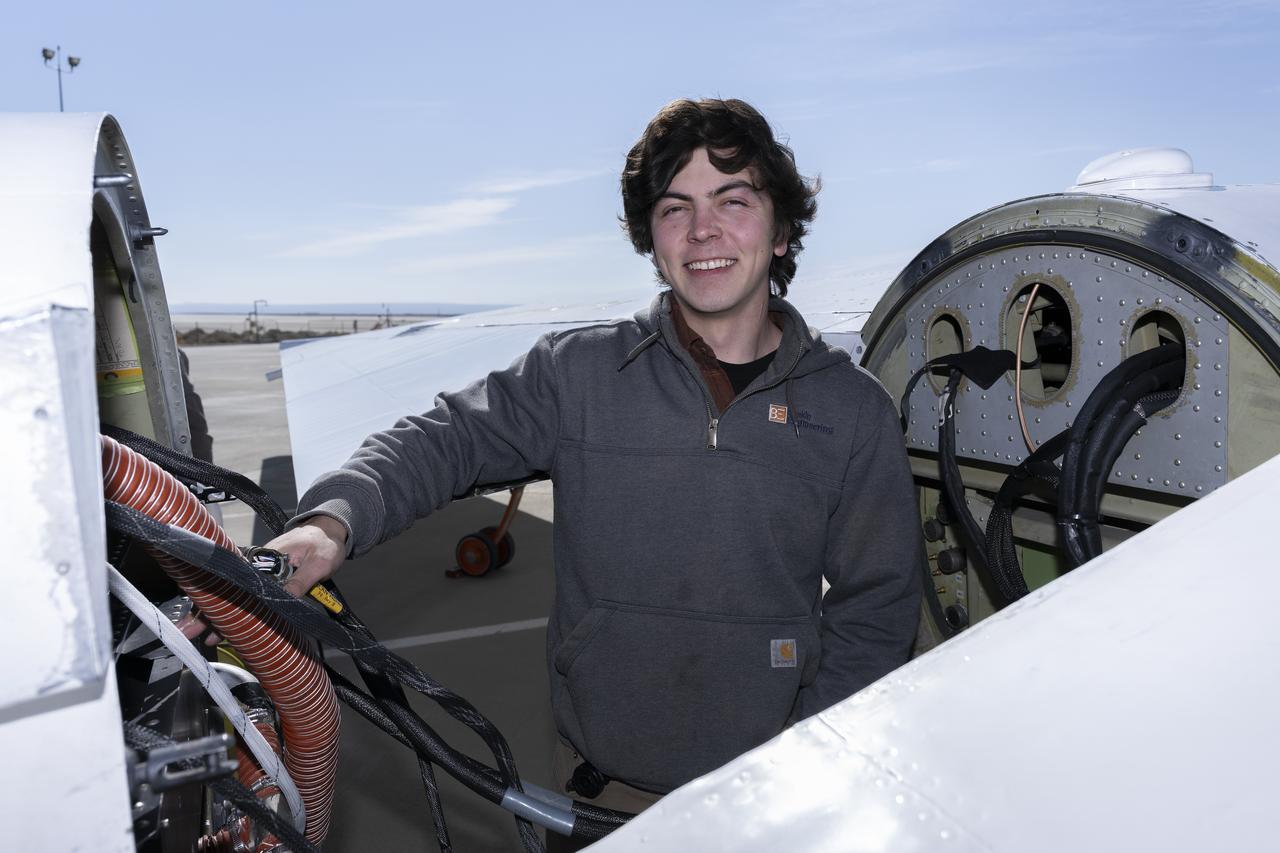
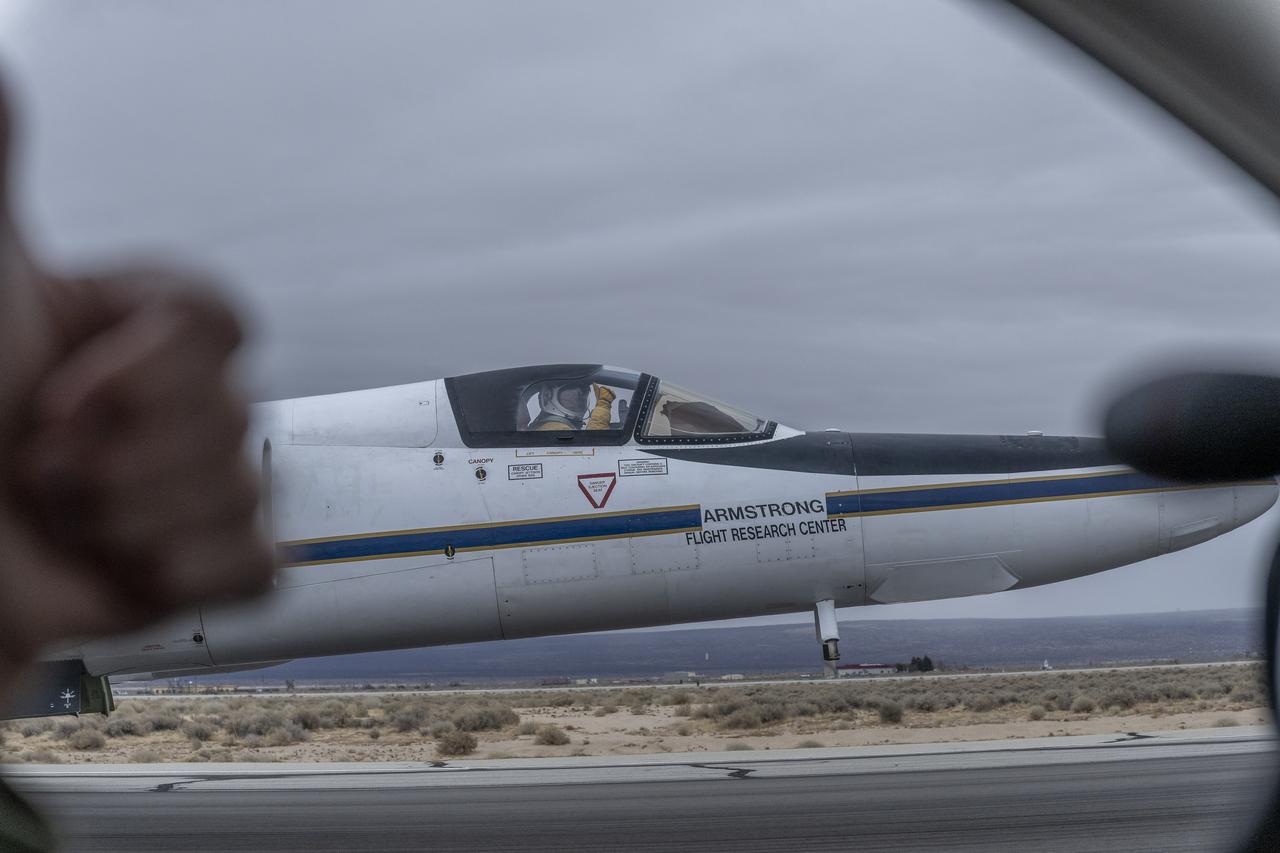
A team of experts prepares the ER-2 aircraft at Armstrong Flight Research Center in Edwards, California for the GSFC Lidar Observation and Validation Experiment (GLOVE) in February 2025. Researcher Grant Finneman from the University of Iowa installs the insulations at the front of the ER-2 forebody pod where the Cloud Physics Lidar (CPL) flies. As a collaboration between engineers, scientists, and aircraft professionals, GLOVE aims to improve satellite data products for Earth Science applications.
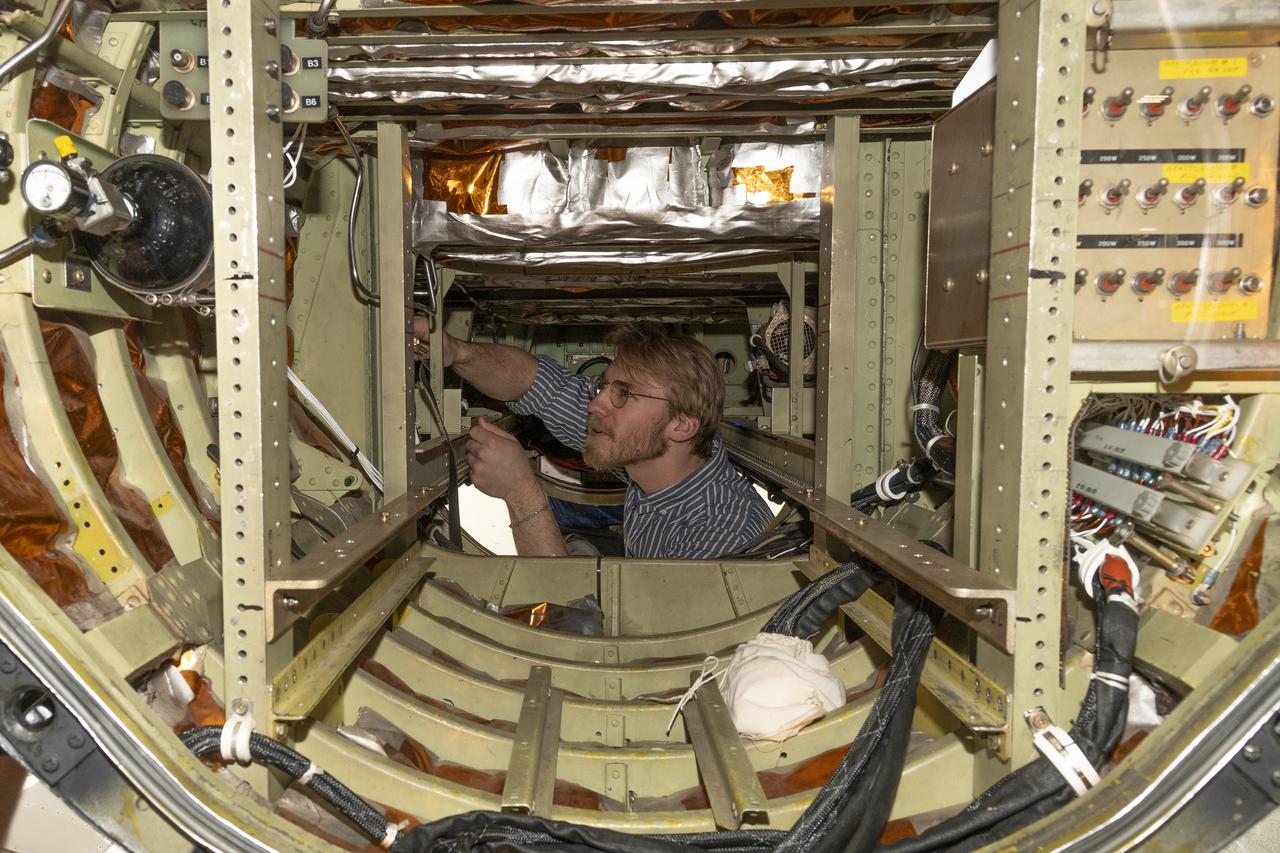
A team of experts prepares the ER-2 aircraft at Armstrong Flight Research Center in Edwards, California for the GSFC Lidar Observation and Validation Experiment (GLOVE) in February 2025. Researcher Jackson Begolka from the University of Iowa examines the instrument connectors in the ER-2 onboard the ER-2, which flies at high altitudes to validate satellite-borne data. As a collaboration between engineers, scientists, and aircraft professionals, GLOVE aims to improve satellite data products for Earth Science applications.
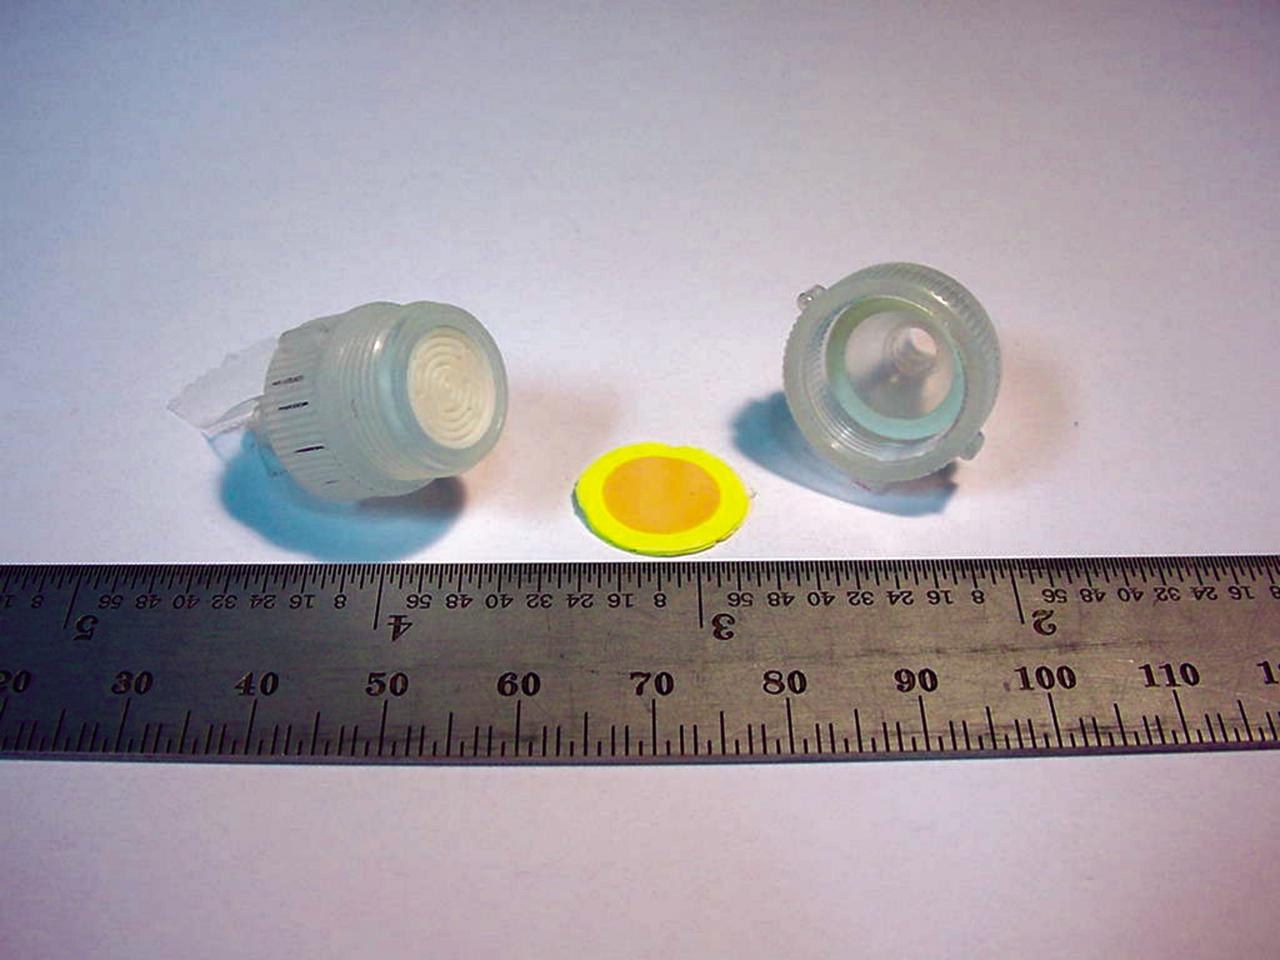
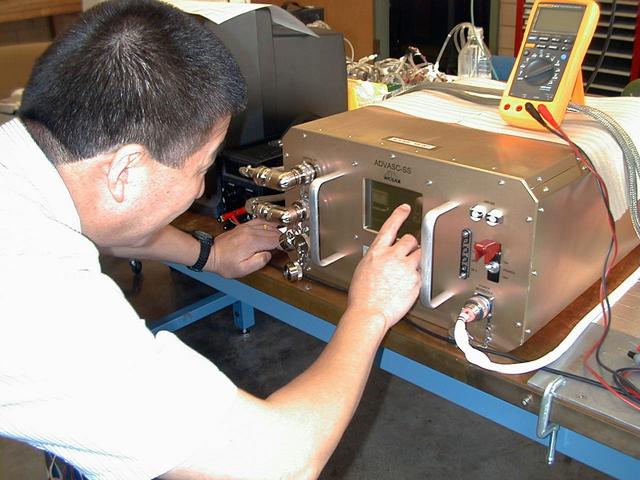
The heart of a colorimetric solid phase extractor (CSPE) test kit quickly measures the concentration of the biocides silver or iodine in astronauts’ drinking water to determine whether concentrations are safe. When 10 milliliters (ml) of water is drawn through the disk, the disk will turn color (yellow in this picture for iodine) indicating the presence of the biocides. The device could someday be used to test water safety at reservoirs and water treatment plants on Earth. (photo credit: Microanalytical Instrumentation Center, Iowa State University).
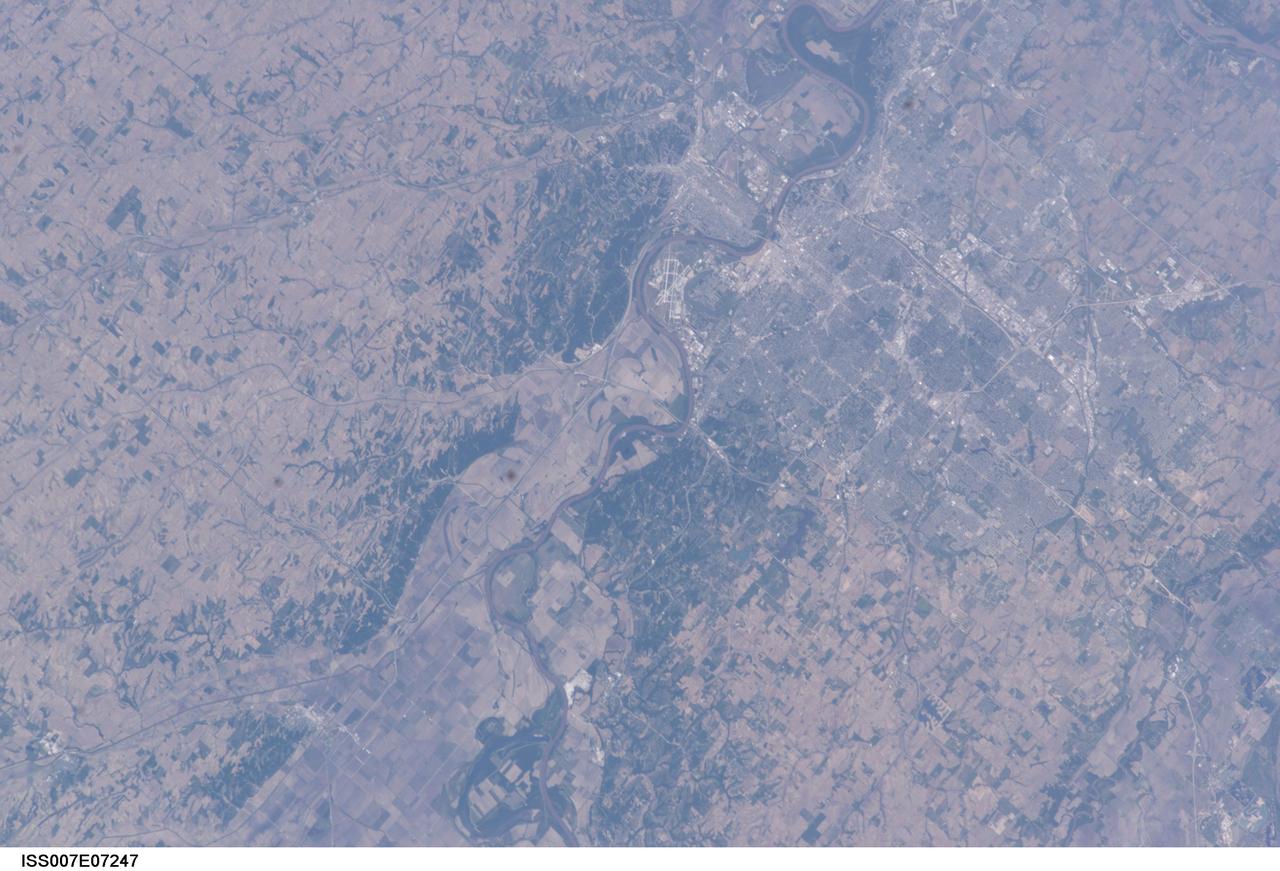
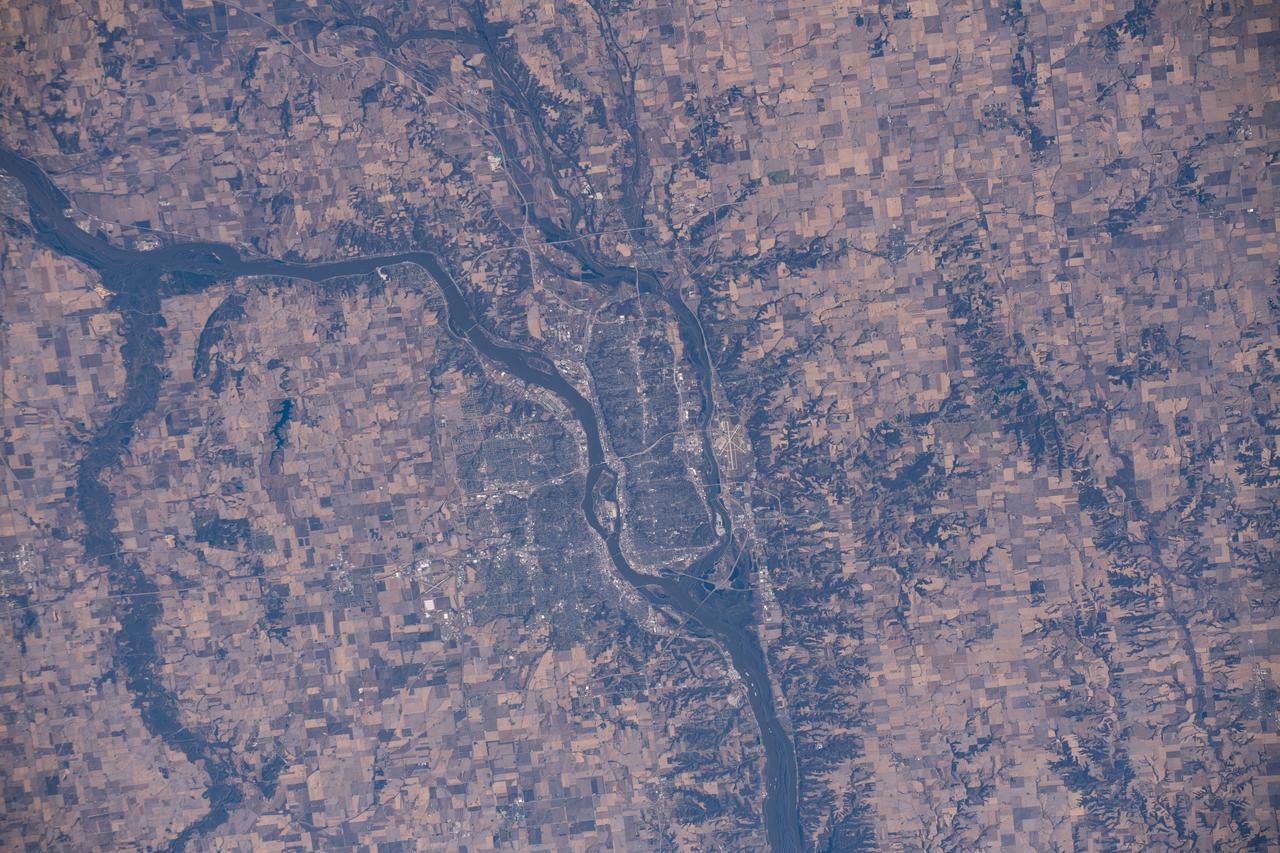
ISS007-E-07247 (13 June 2003) --- This image, photographed by an Expedition 7 crewmember onboard the International Space Station (ISS), features the Missouri River and a near-vertical view of Omaha, Nebraska. With a population estimated at more than three quarters of a million residents, Omaha is situated on high ground to the west of the river while Eppley Airfield and the town of Council Bluffs, Iowa are located on the floodplain.
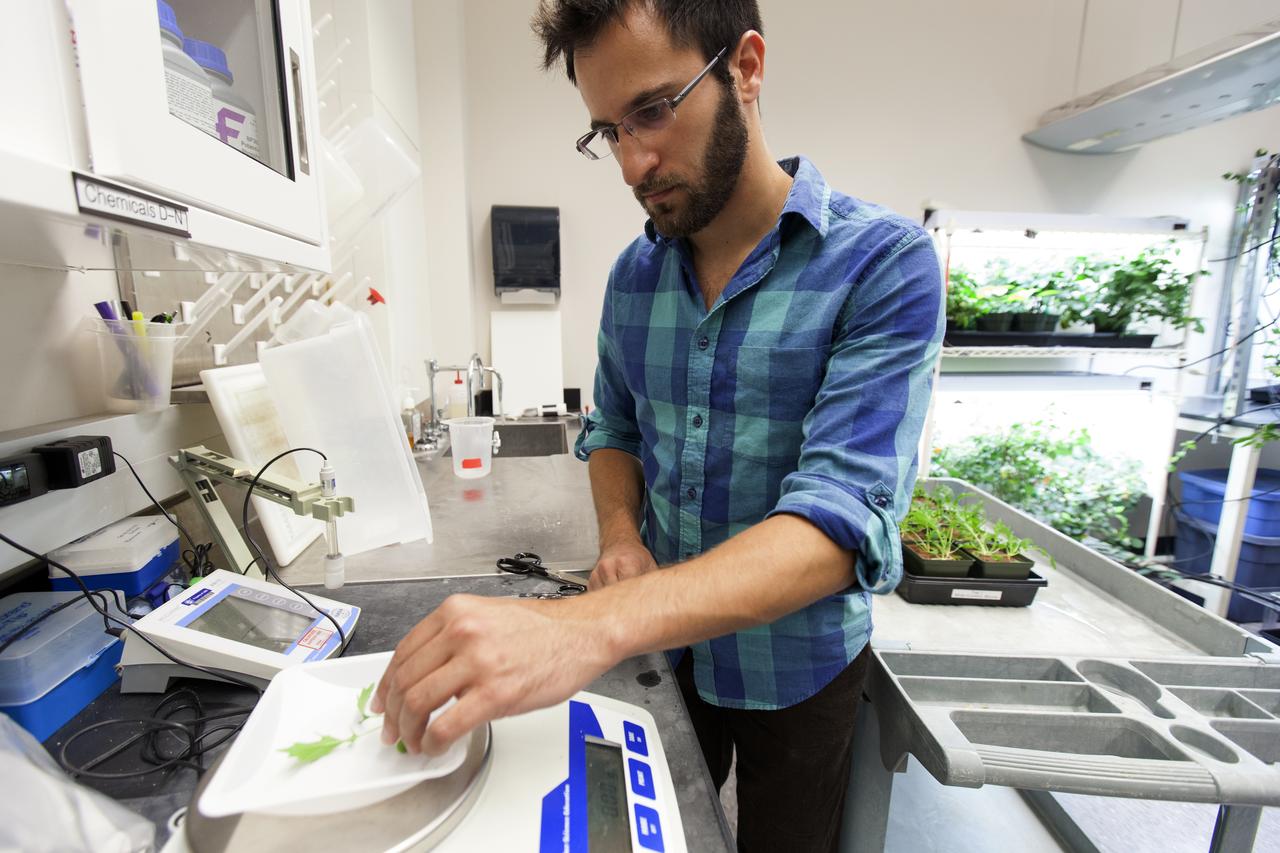
In the Space Life Sciences Laboratory at NASA's Kennedy Space Center in Florida, student interns such as Alex Litvin are joining agency scientists, contributing in the area of plant growth research for food production in space. Litvin is pursuing doctorate in horticulture at Iowa State University. The agency attracts its future workforce through the NASA Internship, Fellowships and Scholarships, or NIFS, Program.
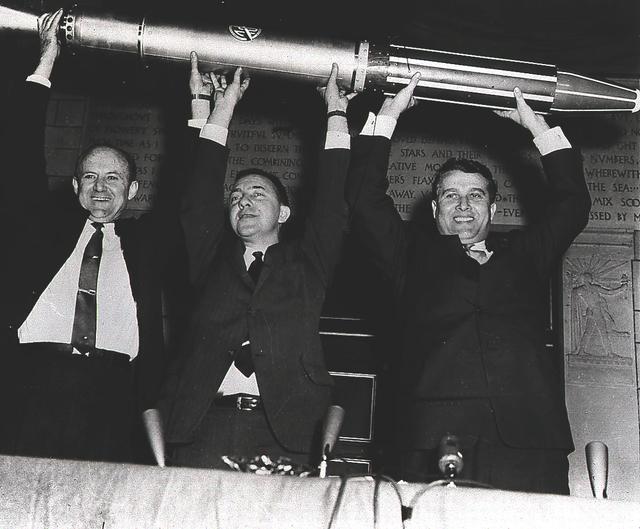
Jet Propulsion Laboratory Director Dr. William Pickering, Dr. James van Allen of the State University of Iowa, and Army Ballistic missionile Agency Technical Director Dr. Wernher von Braun triumphantly display a model of the Explorer I, America's first satellite, shortly after the satellite's launch on January 31, 1958. The Jet Propulsion Laboratory packed and tested the payload, a radiation detection experiment designed by Dr. van Allen. Dr. von Braun's rocket team at Redstone Arsenal in Huntsville, Alabama, developed the Juno I launch vehicle, a modified Jupiter-C.
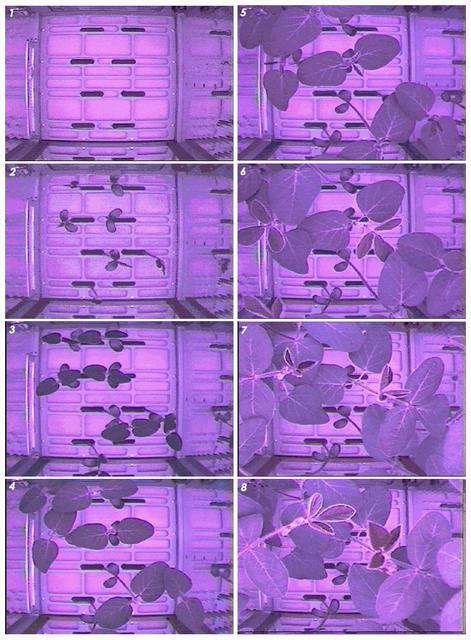
This composite image shows soybean plants growing in the Advanced Astroculture experiment aboard the International Space Station during June 11-July 2, 2002. DuPont is partnering with NASA and the Wisconsin Center for Space Automation and Robotics (WCSAR) at the University of Wisconsin-Madison to grow soybeans aboard the Space Station to find out if they have improved oil, protein, carbohydrates or secondary metabolites that could benefit farmers and consumers. Principal Investigators: Dr. Tom Corbin, Pioneer Hi-Bred International Inc., a Dupont Company, with headquarters in Des Moines, Iowa, and Dr. Weijia Zhou, Wisconsin Center for Space Automation and Robotics (WCSAR), University of Wisconsin-Madison.

Students from Iowa State University College students prepare their robotic miner for its turn to dig in the mining arena during NASA’s LUNABOTICS competition on May 23, 2022, at the Center for Space Education near the Kennedy Space Center Visitor Complex in Florida. More than 35 teams from around the U.S. have designed and built remote-controlled robots for the mining competition. Teams use their autonomous or remote-controlled robots to maneuver and dig in a supersized sandbox filled with rocks and simulated lunar soil, or regolith. The objective of the challenge is to see which team’s robot can collect and deposit the most rocky regolith within a specified amount of time.
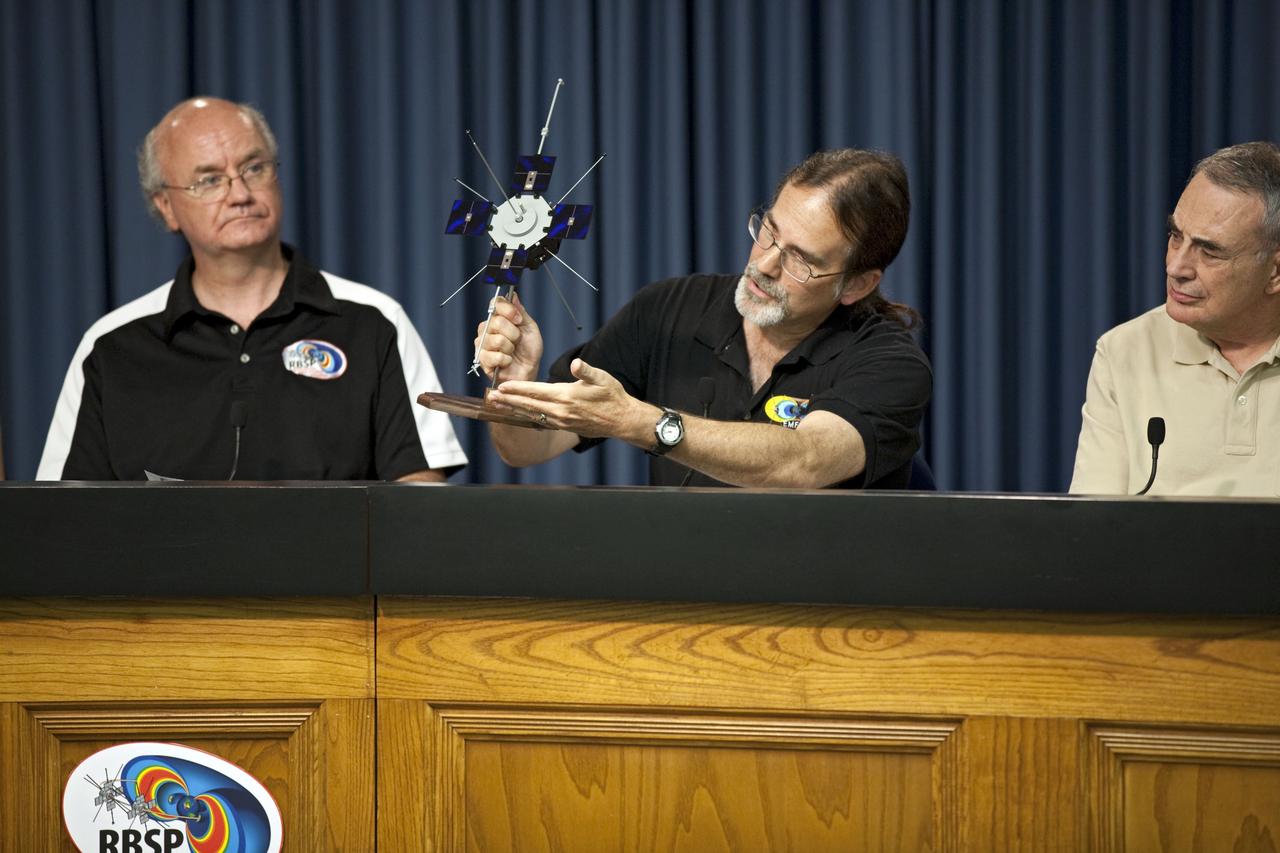
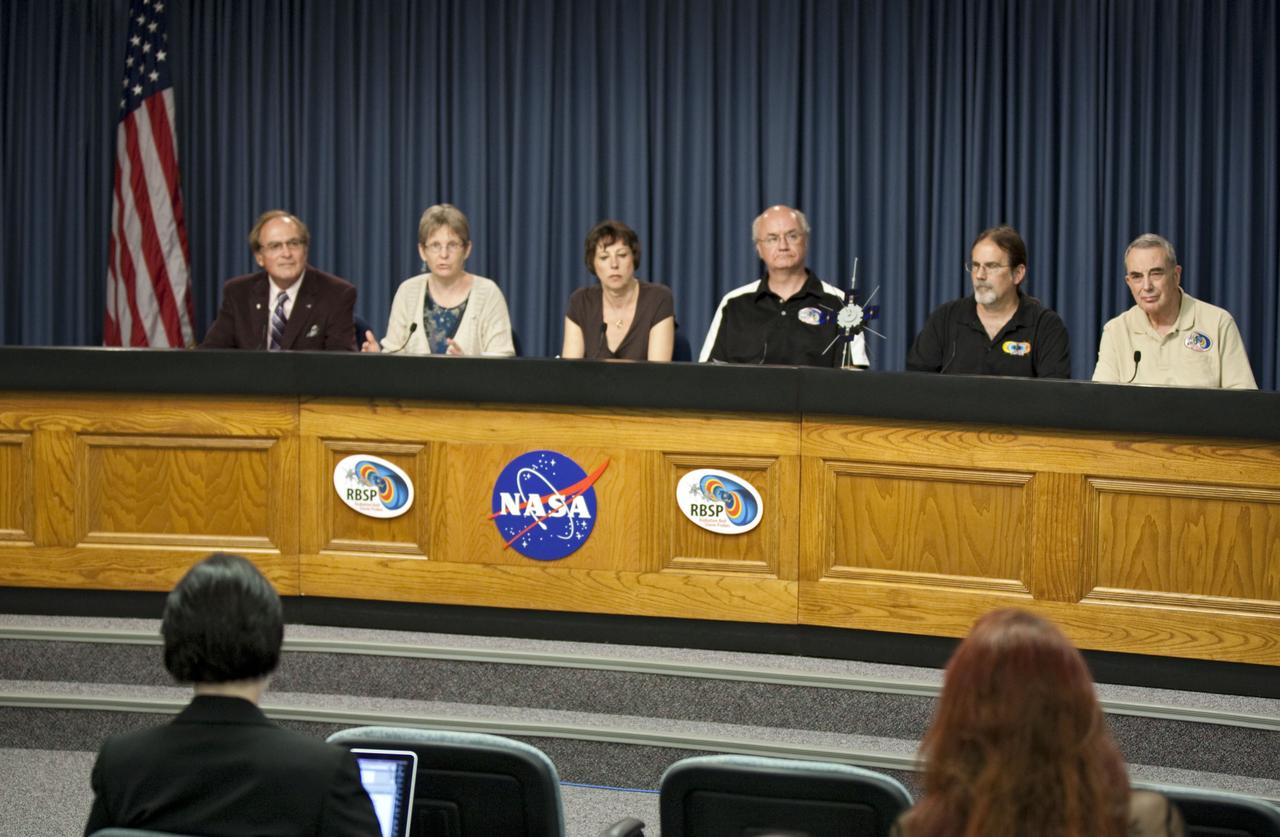
CAPE CANAVERAL, Fla. - During a mission science briefing for the Radiation Belt Storm Probes, or RBSP, mission at NASA Kennedy Space Center’s Press Site in Florida, Craig Kletzing, a principal investigator from the University of Iowa, answers questions and displays a scale model of the twin probes. To the left, is Harlan Spence, principal investigator with the University of New Hampshire. To the right, is Lou Lanzerotti, principal investigator with the New Jersey Institute of Technology. NASA’s RBSP mission will help us understand the sun’s influence on Earth and near-Earth space by studying the Earth’s radiation belts on various scales of space and time. RBSP will begin its mission of exploration of Earth’s Van Allen radiation belts and the extremes of space weather after its launch aboard an Atlas V rocket. Launch is targeted for Aug. 24. For more information, visit http://www.nasa.gov/rbsp. Photo credit: NASA/Glenn Benson
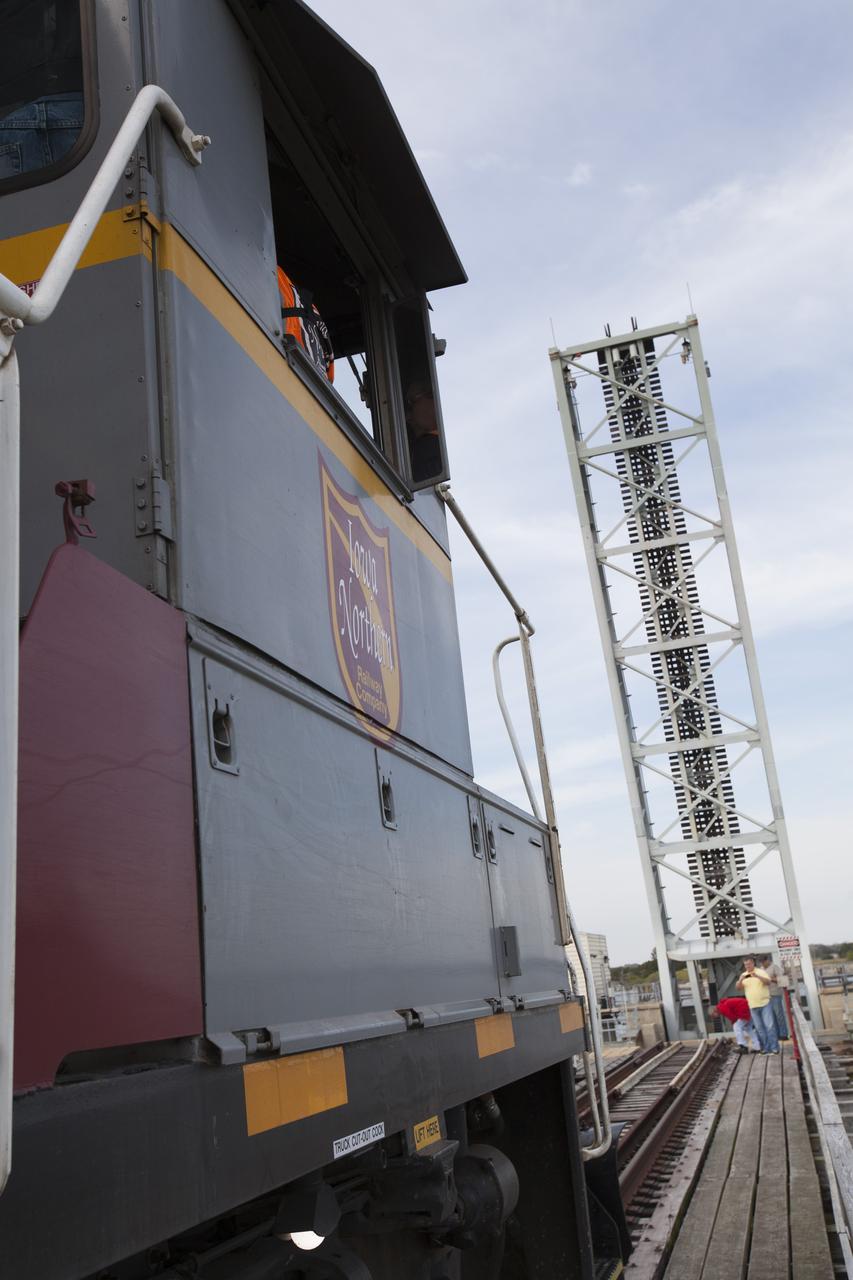
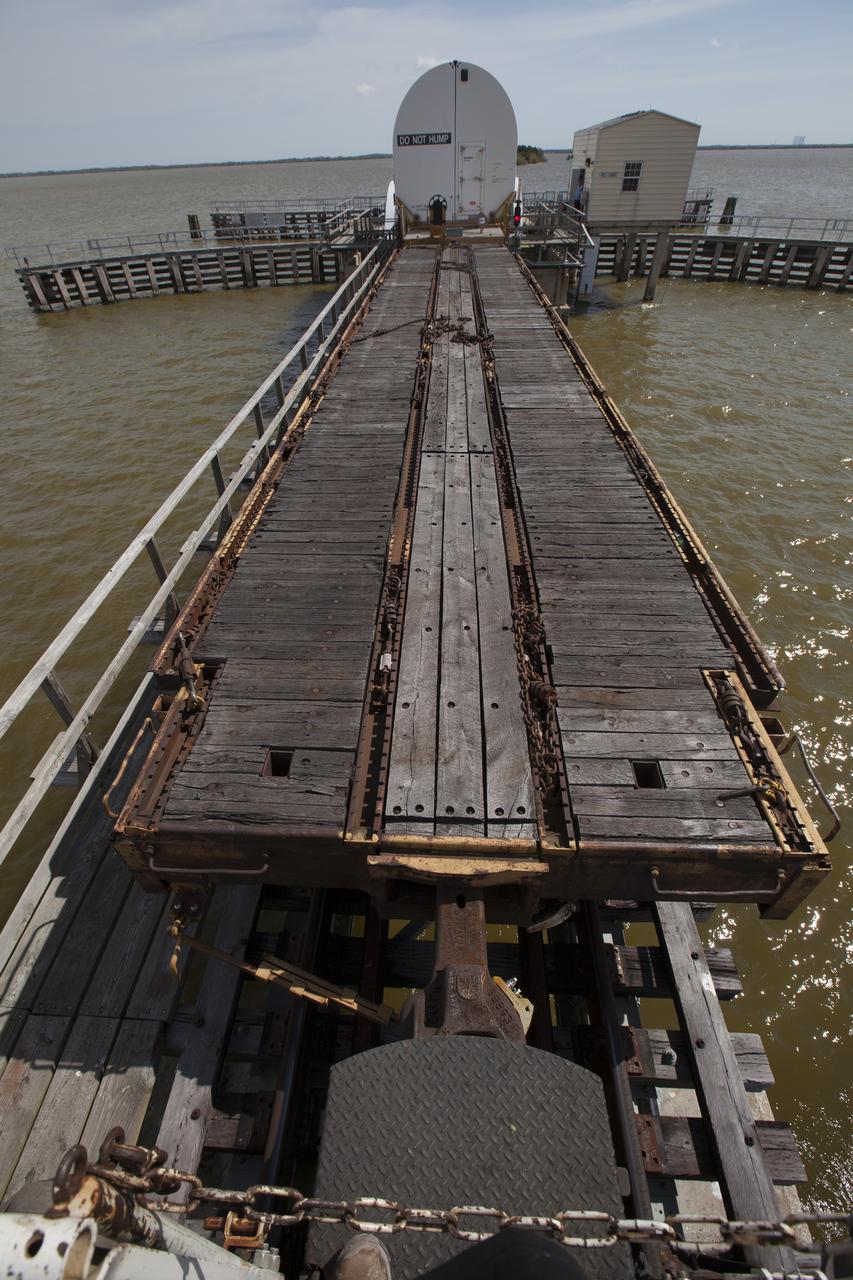
An Iowa Northern locomotive, contracted by Goodloe Transportation of Chicago, approaches the raised span of the NASA railroad bridge to continue over the Indian River north of Kennedy Space Center with two containers on railcars for storage at the NASA Jay Jay railroad yard. The containers held two pathfinders, or test versions, of solid rocket booster segments for NASA’s Space Launch System rocket that were delivered to the Rotation, Processing and Surge Facility (RPSF). Inside the RPSF, the Ground Systems Development and Operations Program and Jacobs Engineering, on the Test and Operations Support Contract, will conduct a series of lifts, moves and stacking operations using the booster segments, which are inert, to prepare for Exploration Mission-1, deep-space missions and the journey to Mars. The pathfinder booster segments are from Orbital ATK in Utah.
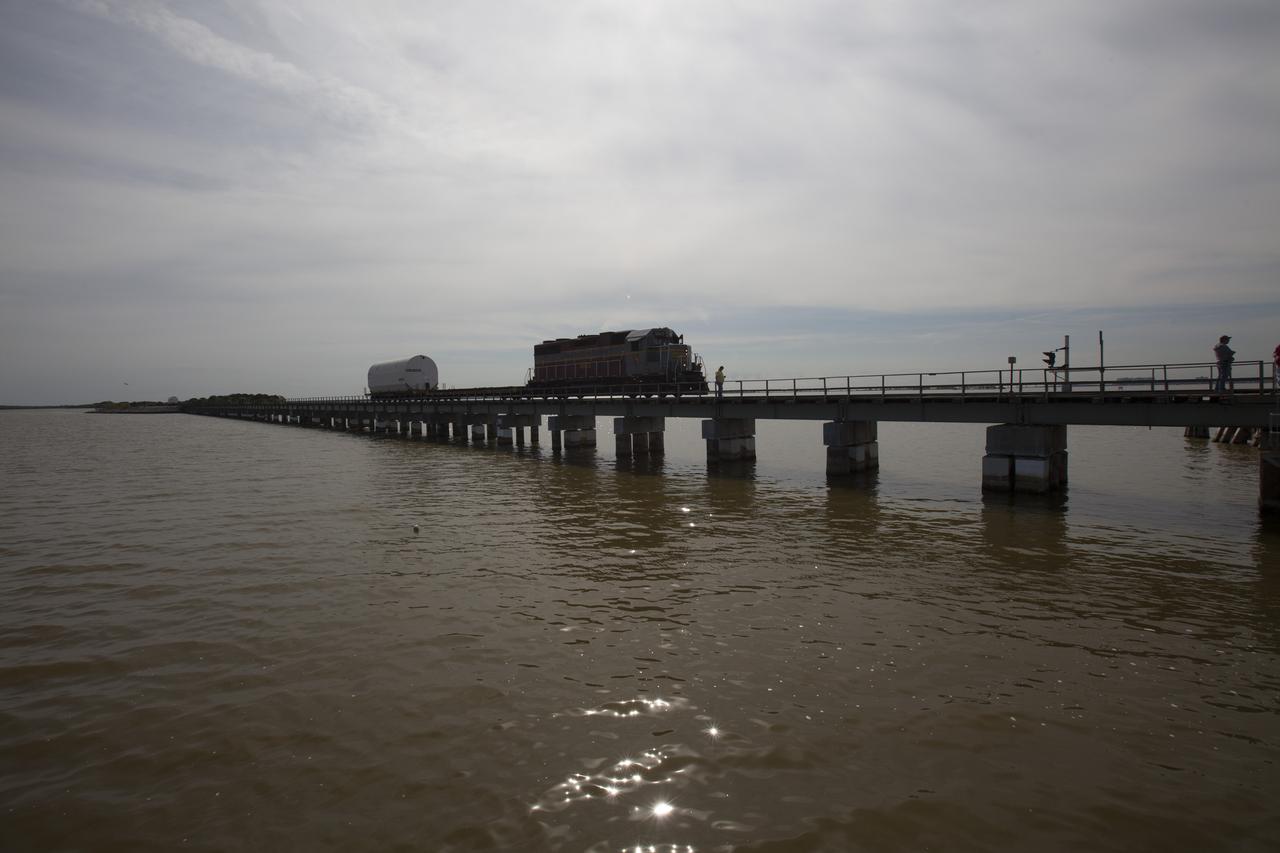
An Iowa Northern locomotive, contracted by Goodloe Transportation of Chicago, travels along the NASA railroad bridge over the Indian River north of Kennedy Space Center, carrying one of two containers on a railcar for transport to the NASA Jay Jay railroad yard. The containers held two pathfinders, or test versions, of solid rocket booster segments for NASA’s Space Launch System rocket that were delivered to the Rotation, Processing and Surge Facility (RPSF). Inside the RPSF, the Ground Systems Development and Operations Program and Jacobs Engineering, on the Test and Operations Support Contract, will conduct a series of lifts, moves and stacking operations using the booster segments, which are inert, to prepare for Exploration Mission-1, deep-space missions and the journey to Mars. The pathfinder booster segments are from Orbital ATK in Utah.
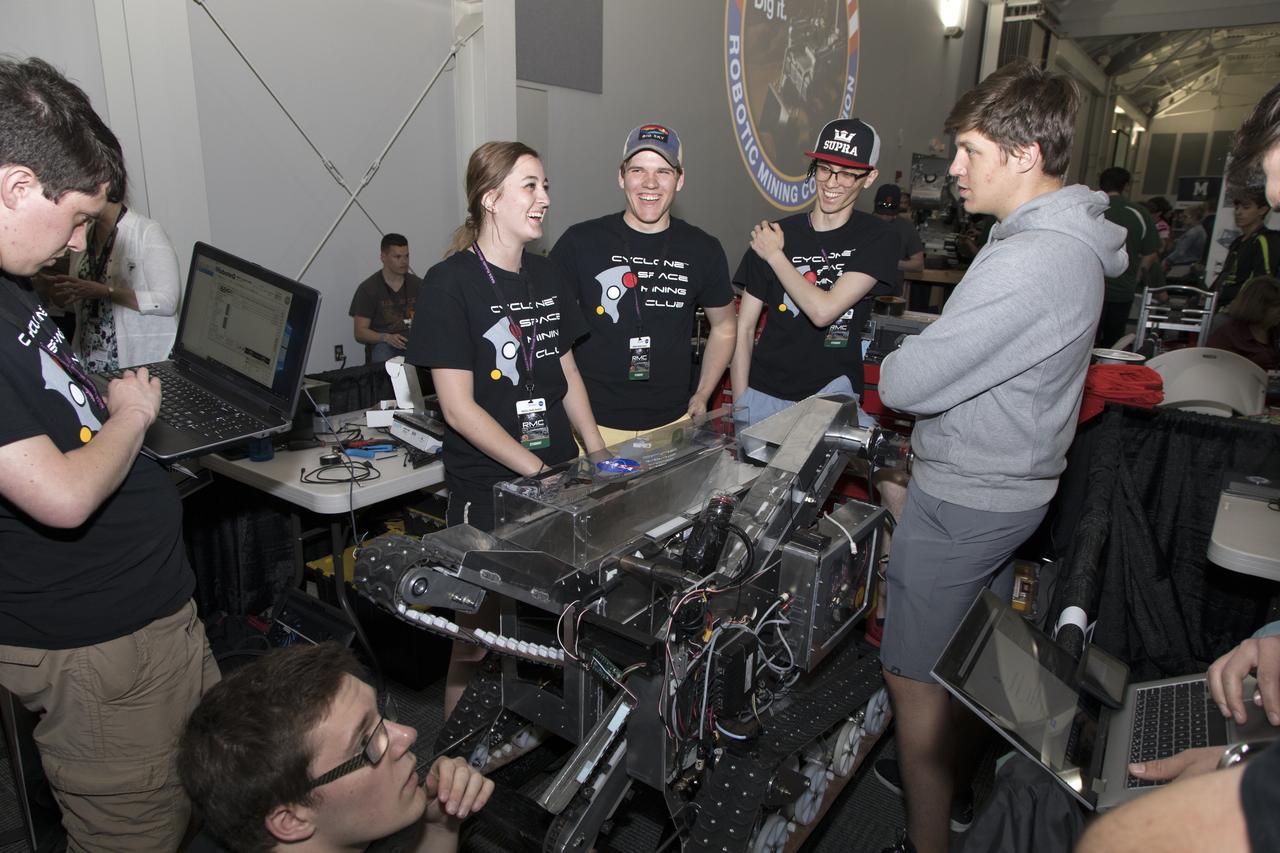
Team members from Iowa State University prepare their robot miner on the second day of NASA's 9th Robotic Mining Competition, May 15, in the RobotPits in the Educator Resource Center at Kennedy Space Center Visitor Complex in Florida. More than 40 student teams from colleges and universities around the U.S. will use their mining robots to dig in a supersized sandbox filled with BP-1, or simulated Lunar soil, gravel and rocks, and participate in other competition requirements. The Robotic Mining Competition is a NASA Human Exploration and Operations Mission Directorate project designed to encourage students in science, technology, engineering and math, or STEM fields. The project provides a competitive environment to foster innovative ideas and solutions that could be used on NASA's deep space missions.
An Iowa Northern locomotive, contracted by Goodloe Transportation of Chicago, continues along the NASA railroad bridge over the Indian River north of Kennedy Space Center, carrying one of two containers on a railcar for transport to the NASA Jay Jay railroad yard. The containers held two pathfinders, or test versions, of solid rocket booster segments for NASA’s Space Launch System rocket that were delivered to the Rotation, Processing and Surge Facility (RPSF). Inside the RPSF, the Ground Systems Development and Operations Program and Jacobs Engineering, on the Test and Operations Support Contract, will conduct a series of lifts, moves and stacking operations using the booster segments, which are inert, to prepare for Exploration Mission-1, deep-space missions and the journey to Mars. The pathfinder booster segments are from Orbital ATK in Utah.
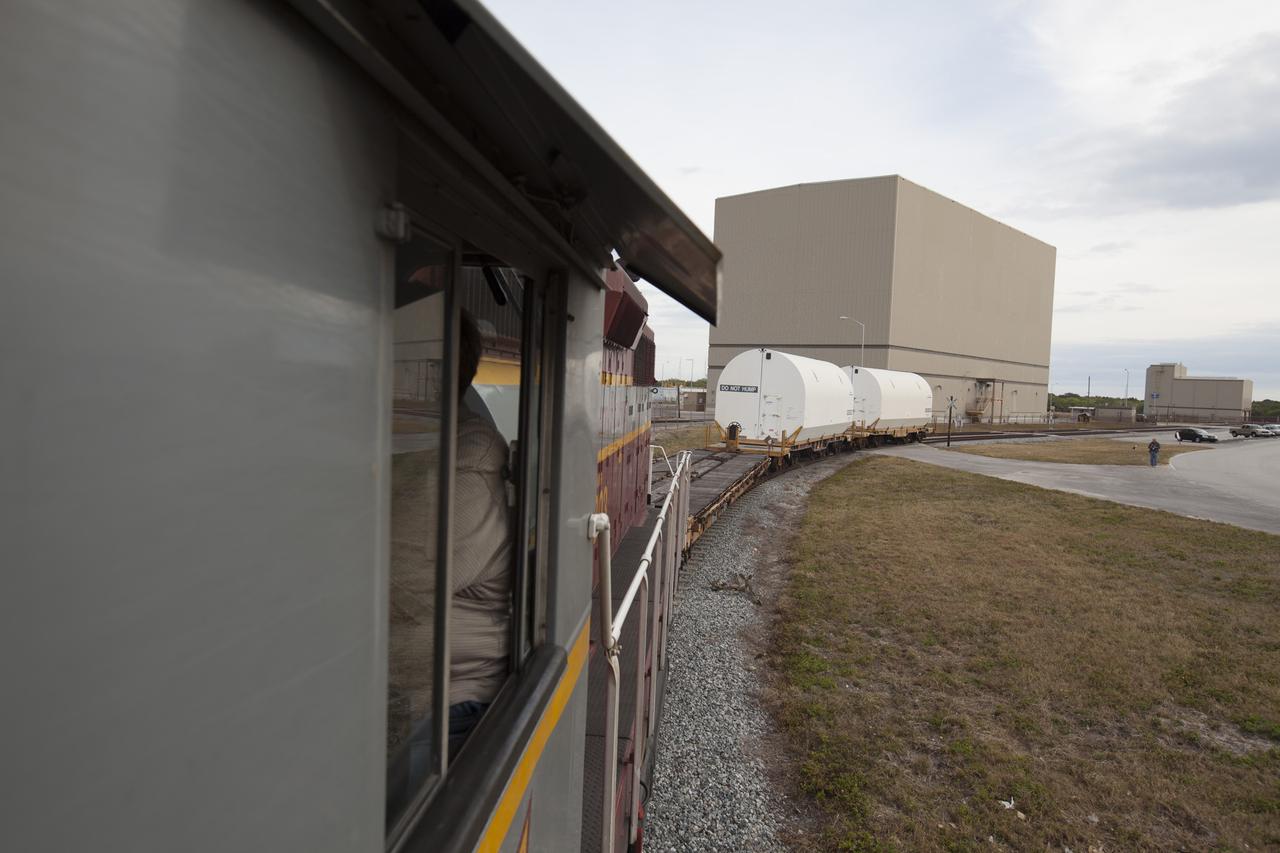
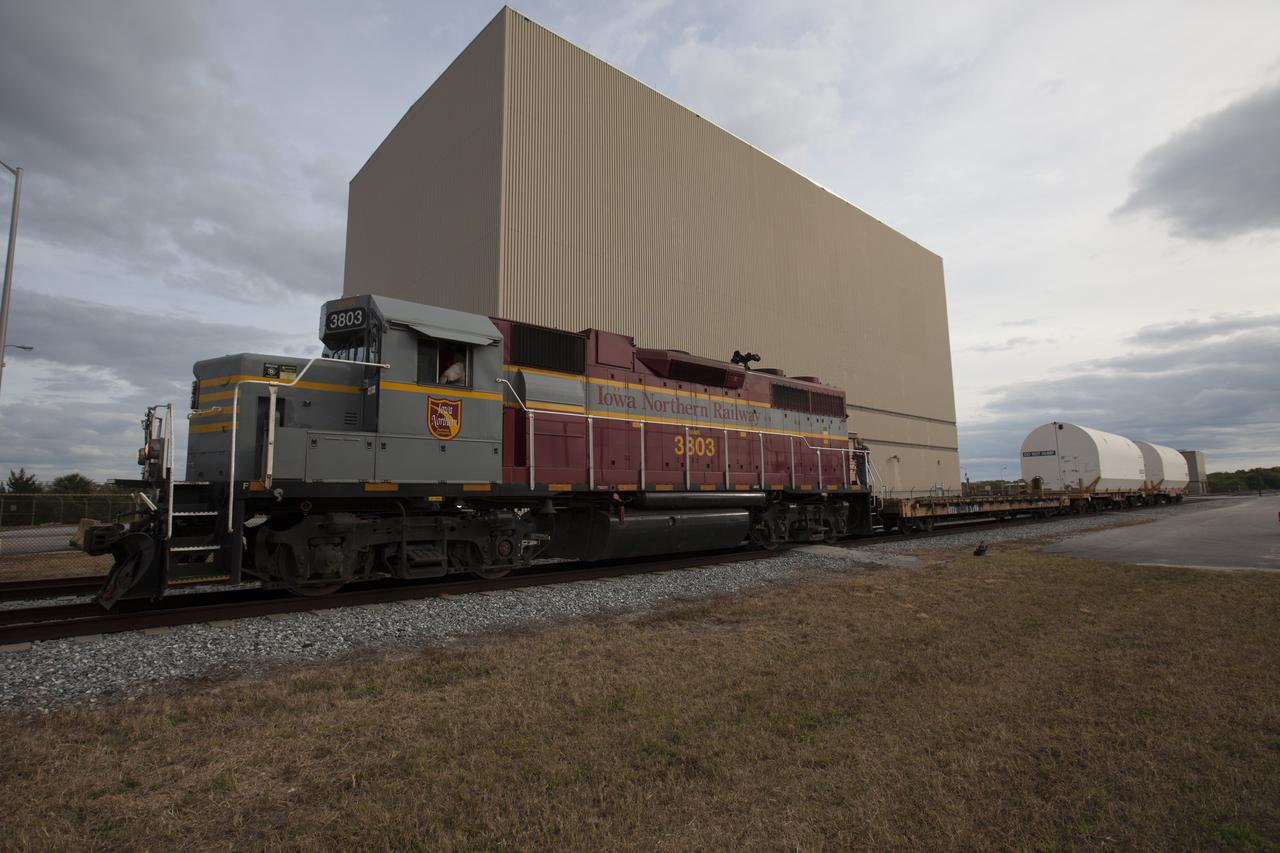
An Iowa Northern locomotive, contracted by Goodloe Transportation of Chicago, departs from the Rotation, Processing and Surge Facility (RPSF) at NASA’s Kennedy Space Center in Florida, with two containers on railcars for transport to the NASA Jay Jay railroad yard. The containers held two pathfinders, or test versions, of solid rocket booster segments for NASA’s Space Launch System rocket that were delivered to the RPSF. Inside the RPSF, the Ground Systems Development and Operations Program and Jacobs Engineering, on the Test and Operations Support Contract, will conduct a series of lifts, moves and stacking operations using the booster segments, which are inert, to prepare for Exploration Mission-1, deep-space missions and the journey to Mars. The pathfinder booster segments are from Orbital ATK in Utah.
An Iowa Northern locomotive, contracted by Goodloe Transportation of Chicago, departs from the Rotation, Processing and Surge Facility (RPSF) at NASA’s Kennedy Space Center in Florida, with two containers on railcars for transport to the NASA Jay Jay railroad yard. The containers held two pathfinders, or test versions, of solid rocket booster segments for NASA’s Space Launch System rocket that were delivered to the RPSF. Inside the RPSF, the Ground Systems Development and Operations Program and Jacobs Engineering, on the Test and Operations Support Contract, will conduct a series of lifts, moves and stacking operations using the booster segments, which are inert, to prepare for Exploration Mission-1, deep-space missions and the journey to Mars. The pathfinder booster segments are from Orbital ATK in Utah.
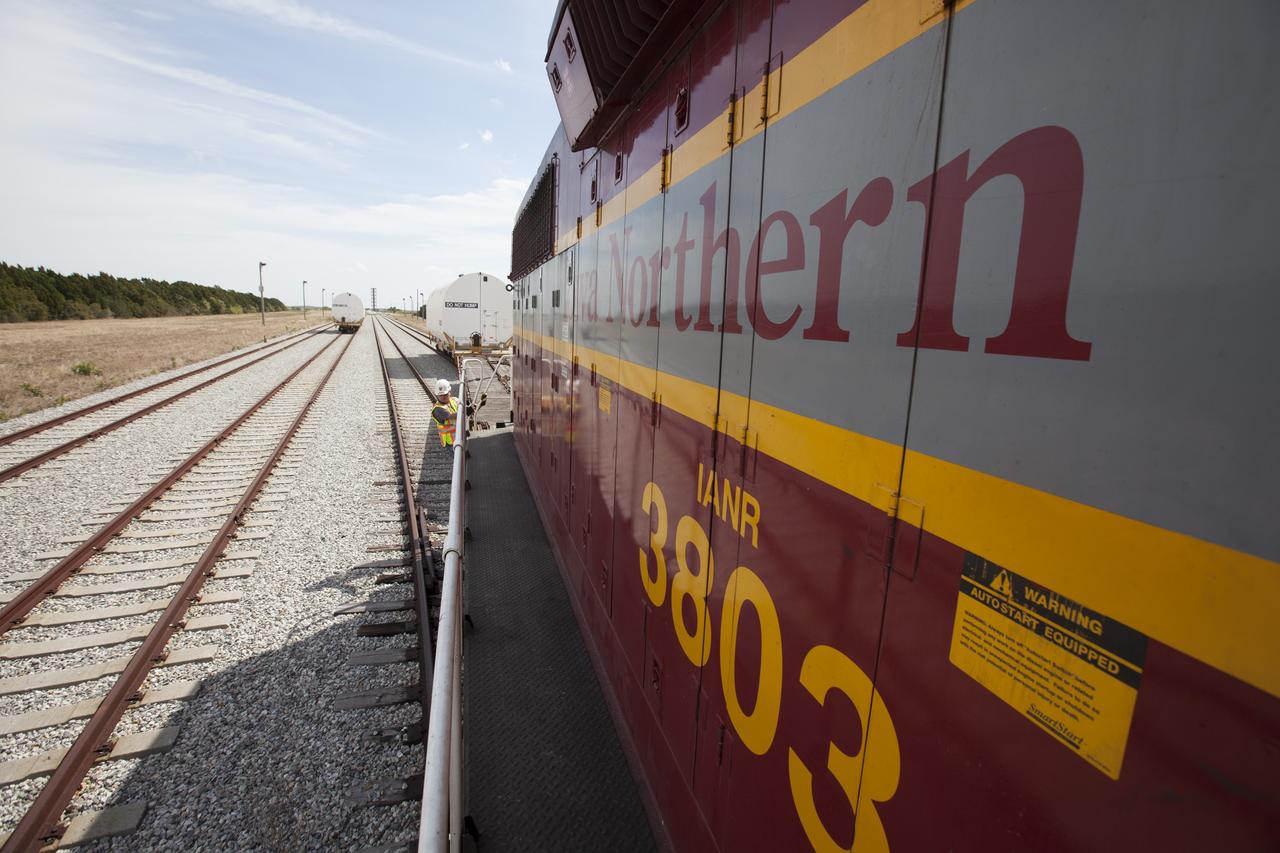
An Iowa Northern locomotive, contracted by Goodloe Transportation of Chicago, arrives at the NASA Jay Jay railroad yard from Kennedy Space Center in Florida, with the second of two containers on a railcar. The first container is at left. The containers held two pathfinders, or test versions, of solid rocket booster segments for NASA’s Space Launch System rocket that were delivered to the Rotation, Processing and Surge Facility (RPSF). Inside the RPSF, the Ground Systems Development and Operations Program and Jacobs Engineering, on the Test and Operations Support Contract, will conduct a series of lifts, moves and stacking operations using the booster segments, which are inert, to prepare for Exploration Mission-1, deep-space missions and the journey to Mars. The pathfinder booster segments are from Orbital ATK in Utah.
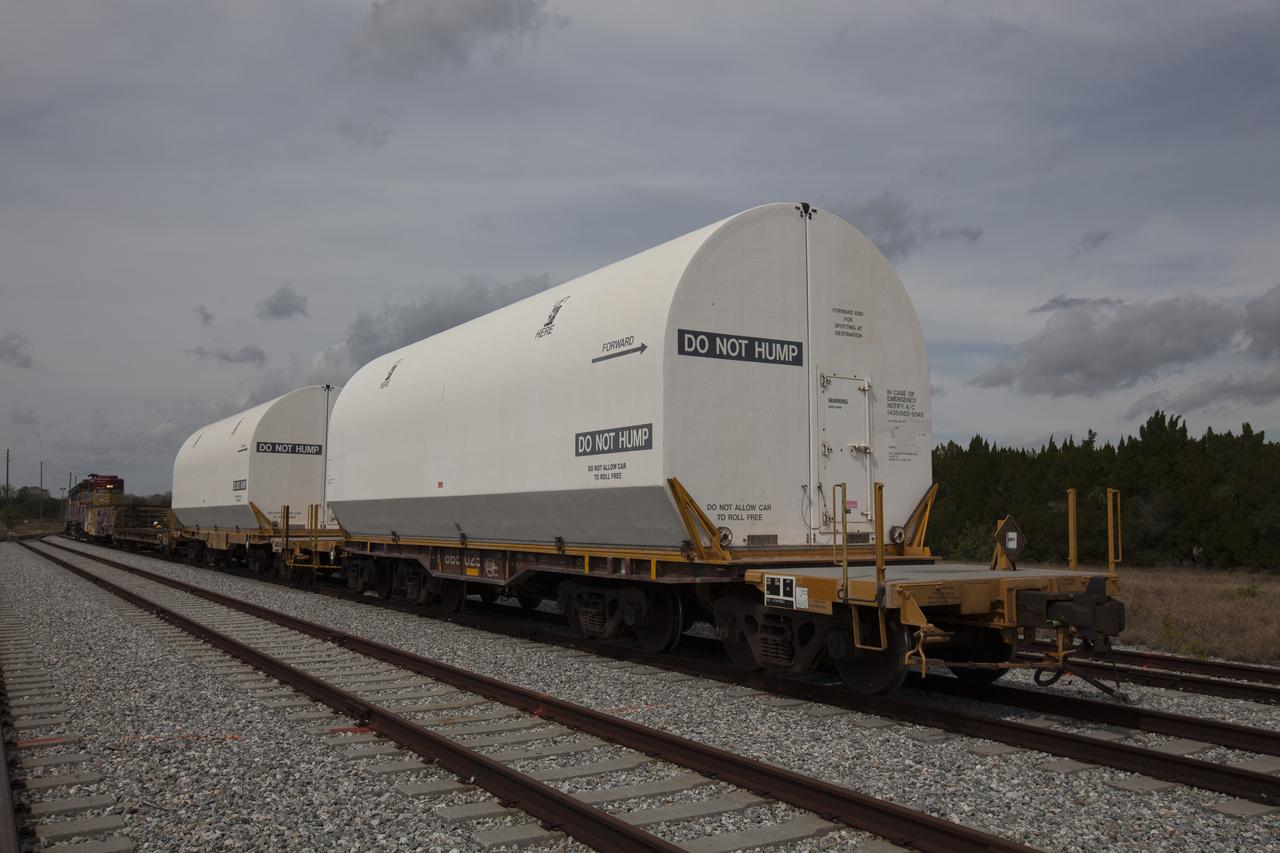
An Iowa Northern locomotive, contracted by Goodloe Transportation of Chicago, arrives at the NASA Jay Jay railroad yard from Kennedy Space Center in Florida, with two containers on railcars for storage. The containers held two pathfinders, or test versions, of solid rocket booster segments for NASA’s Space Launch System rocket that were delivered to the Rotation, Processing and Surge Facility (RPSF). Inside the RPSF, the Ground Systems Development and Operations Program and Jacobs Engineering, on the Test and Operations Support Contract, will conduct a series of lifts, moves and stacking operations using the booster segments, which are inert, to prepare for Exploration Mission-1, deep-space missions and the journey to Mars. The pathfinder booster segments are from Orbital ATK in Utah.
An Iowa Northern locomotive, contracted by Goodloe Transportation of Chicago, departs from the Rotation, Processing and Surge Facility (RPSF) at NASA’s Kennedy Space Center in Florida, with two containers on railcars for transport to the NASA Jay Jay railroad yard. The containers held two pathfinders, or test versions, of solid rocket booster segments for NASA’s Space Launch System rocket that were delivered to the RPSF. Inside the RPSF, the Ground Systems Development and Operations Program and Jacobs Engineering, on the Test and Operations Support Contract, will conduct a series of lifts, moves and stacking operations using the booster segments, which are inert, to prepare for Exploration Mission-1, deep-space missions and the journey to Mars. The pathfinder booster segments are from Orbital ATK in Utah.
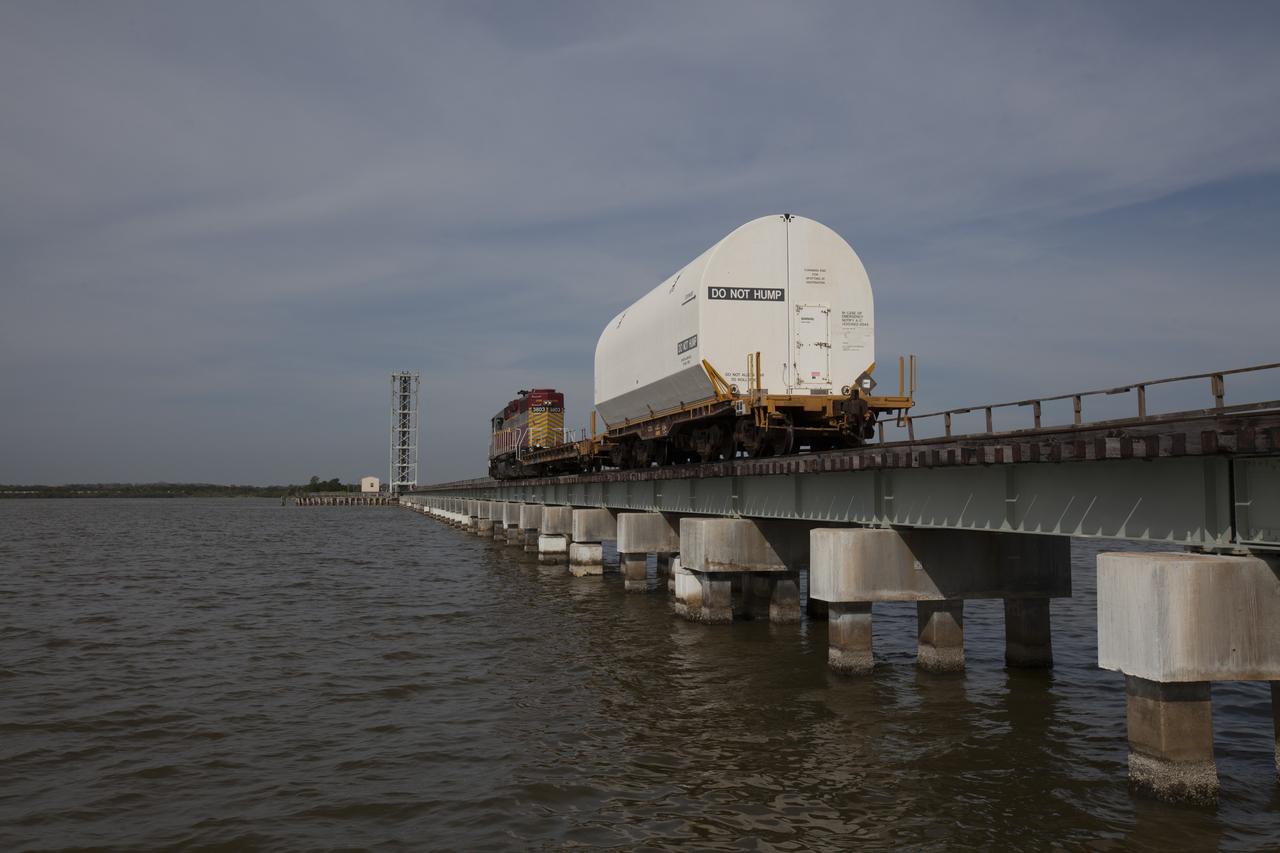
An Iowa Northern locomotive, conracted by Goodloe Transportation of Chicago, travels along the NASA railroad bridge over the Indian River north of Kennedy Space Center, with two containers on railcars for transport to the NASA Jay Jay railroad yard. The containers held two pathfinders, or test versions, of solid rocket booster segments for NASA’s Space Launch System rocket that were delivered to the Rotation, Processing and Surge Facility (RPSF). Inside the RPSF, the Ground Systems Development and Operations Program and Jacobs Engineering, on the Test and Operations Support Contract, will conduct a series of lifts, moves and stacking operations using the booster segments, which are inert, to prepare for Exploration Mission-1, deep-space missions and the journey to Mars. The pathfinder booster segments are from Orbital ATK in Utah.
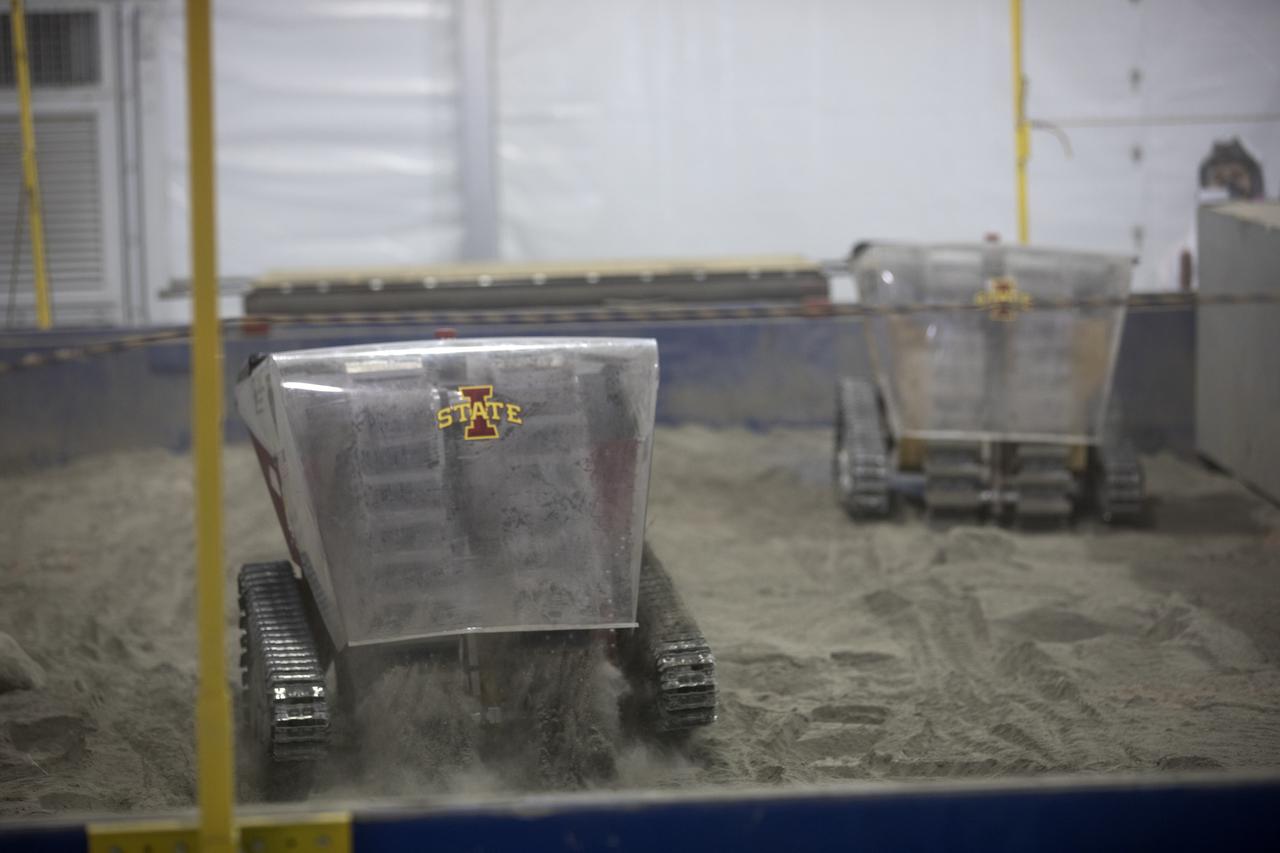
Twin mining robots from the University of Iowa dig in a supersized sandbox filled with BP-1, or simulated Martian soil, during NASA's 8th Annual Robotic Mining Competition at the Kennedy Space Center Visitor Complex in Florida. More than 40 student teams from colleges and universities around the U.S. are using their uniquely-designed mining robots to dig in a supersized sandbox filled with BP-1, or simulated Martian soil, and participate in other competition requirements. The Robotic Mining Competition is a NASA Human Exploration and Operations Mission Directorate project designed to encourage students in science, technology, engineering and math, or STEM fields. The project provides a competitive environment to foster innovative ideas and solutions that could be used on NASA's Journey to Mars.
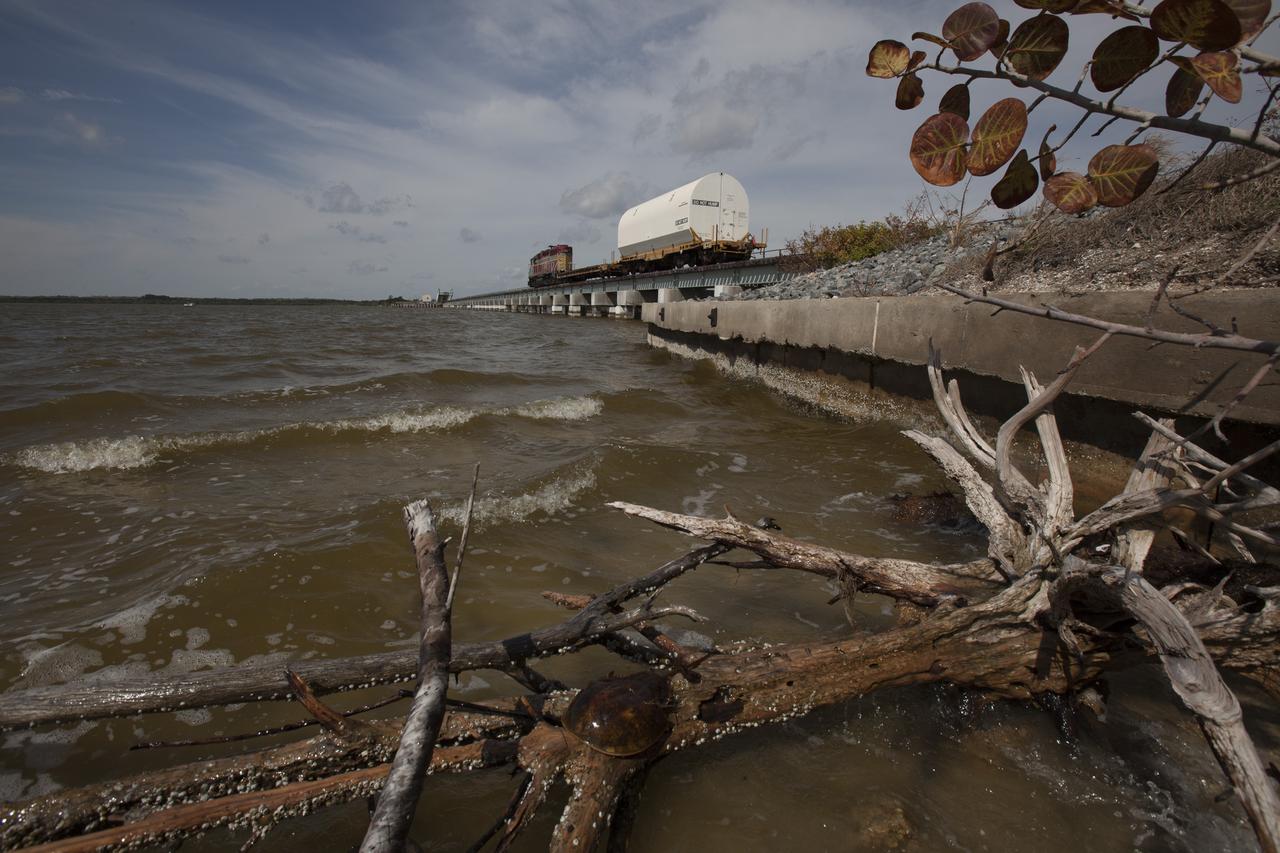
An Iowa Northern locomotive, contracted by Goodloe Transportation of Chicago, travels along the NASA railroad bridge over the Indian River north of Kennedy Space Center, carrying one of two containers on a railcar for transport to the NASA Jay Jay railroad yard near the center. The containers held two pathfinders, or test versions, of solid rocket booster segments for NASA’s Space Launch System rocket that were delivered to the Rotation, Processing and Surge Facility (RPSF). Inside the RPSF, the Ground Systems Development and Operations Program and Jacobs Engineering, on the Test and Operations Support Contract, will conduct a series of lifts, moves and stacking operations using the booster segments, which are inert, to prepare for Exploration Mission-1, deep-space missions and the journey to Mars. The pathfinder booster segments are from Orbital ATK in Utah.
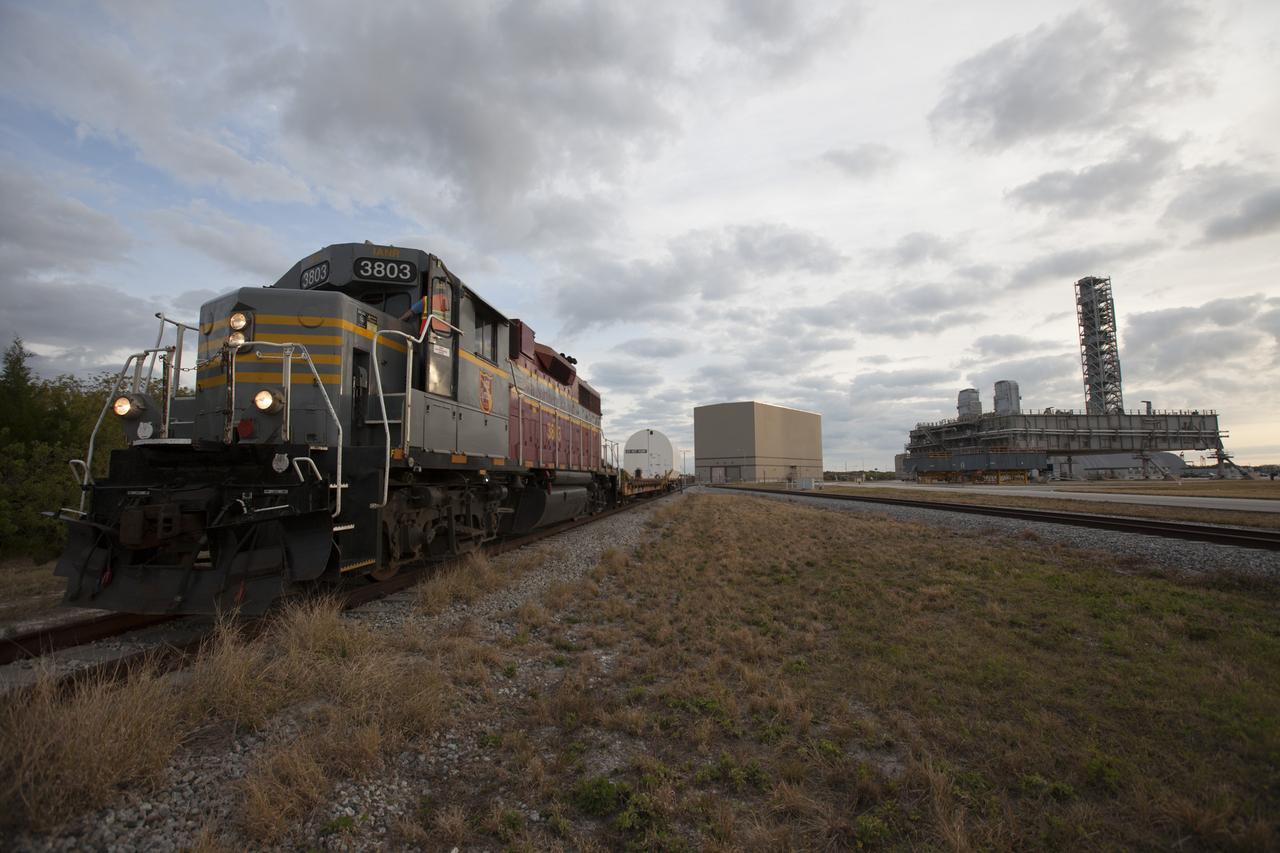
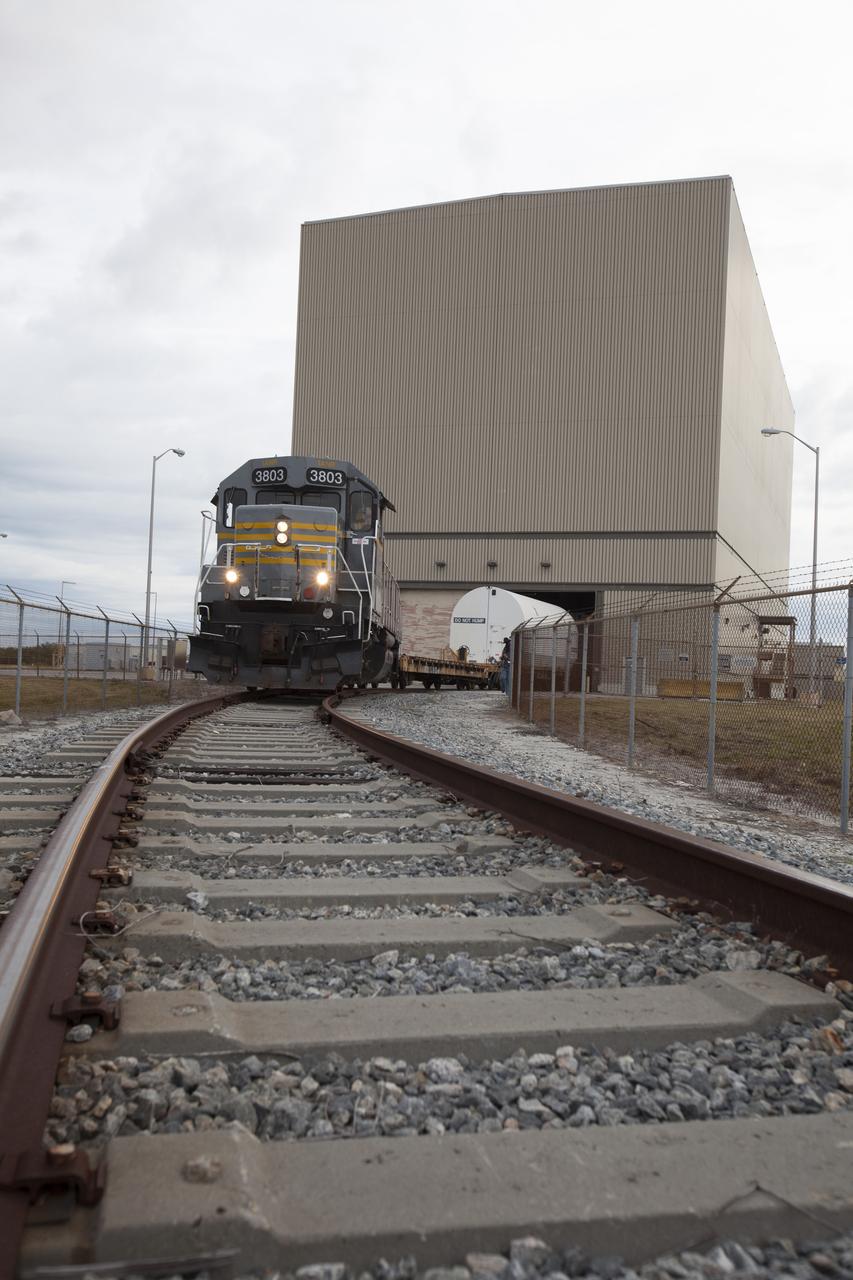
An Iowa Northern locomotive, contracted by Goodloe Transportation of Chicago, departs from NASA’s Kennedy Space Center in Florida, with two containers on railcars for transport to the Jay Jay railroad yard. The containers held two pathfinders, or test versions, of solid rocket booster segments for NASA’s Space Launch System rocket that were delivered to the Rotation, Processing and Surge Facility (RPSF). Inside the RPSF, the Ground Systems Development and Operations Program and Jacobs Engineering, on the Test and Operations Support Contract, will conduct a series of lifts, moves and stacking operations using the booster segments, which are inert, to prepare for Exploration Mission-1, deep-space missions and the journey to Mars. The pathfinder booster segments are from Orbital ATK in Utah.
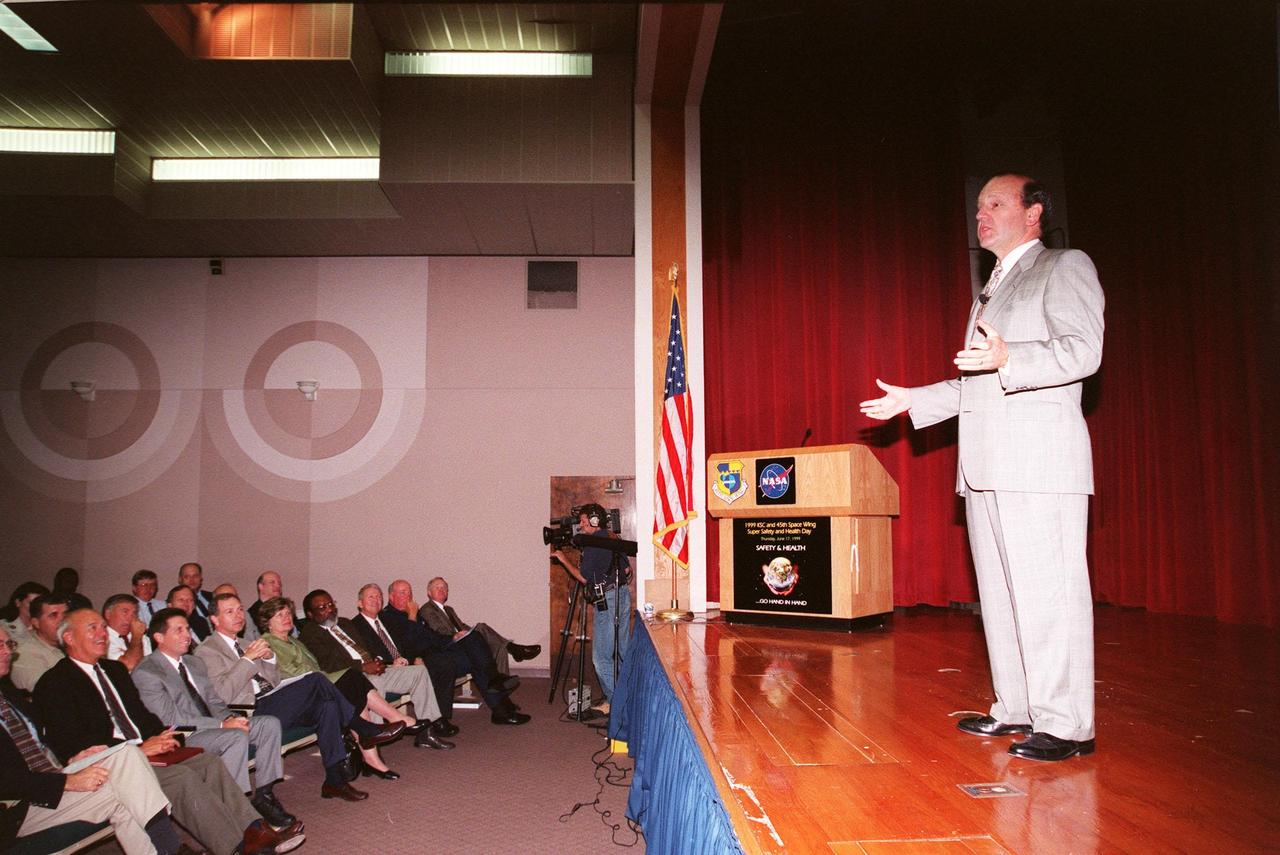
Capt. Dennis E. Fitch, a consultant and former pilot instructor with United Airlines, addresses an audience of KSC employees to kick off Super Safety and Health Day at KSC. Fitch related his tale of the catastrophic engine failure in UAL flight 232, which crash landed in Iowa in 1989, and the teamwork that contributed to his survival and the lives of 183 other passengers. For the second time Kennedy Space Center dedicated an entire day to safety and health. Most normal work activities were suspended to allow personnel to attend Super Safety and Health Day activities. The theme, "Safety and Health Go Hand in Hand," emphasized KSC's commitment to place the safety and health of the public, astronauts, employees and space-related resources first and foremost. Events also included a panel session about related issues, vendor exhibits, and safety training in work groups. The keynote address and panel session were also broadcast internally over NASA television
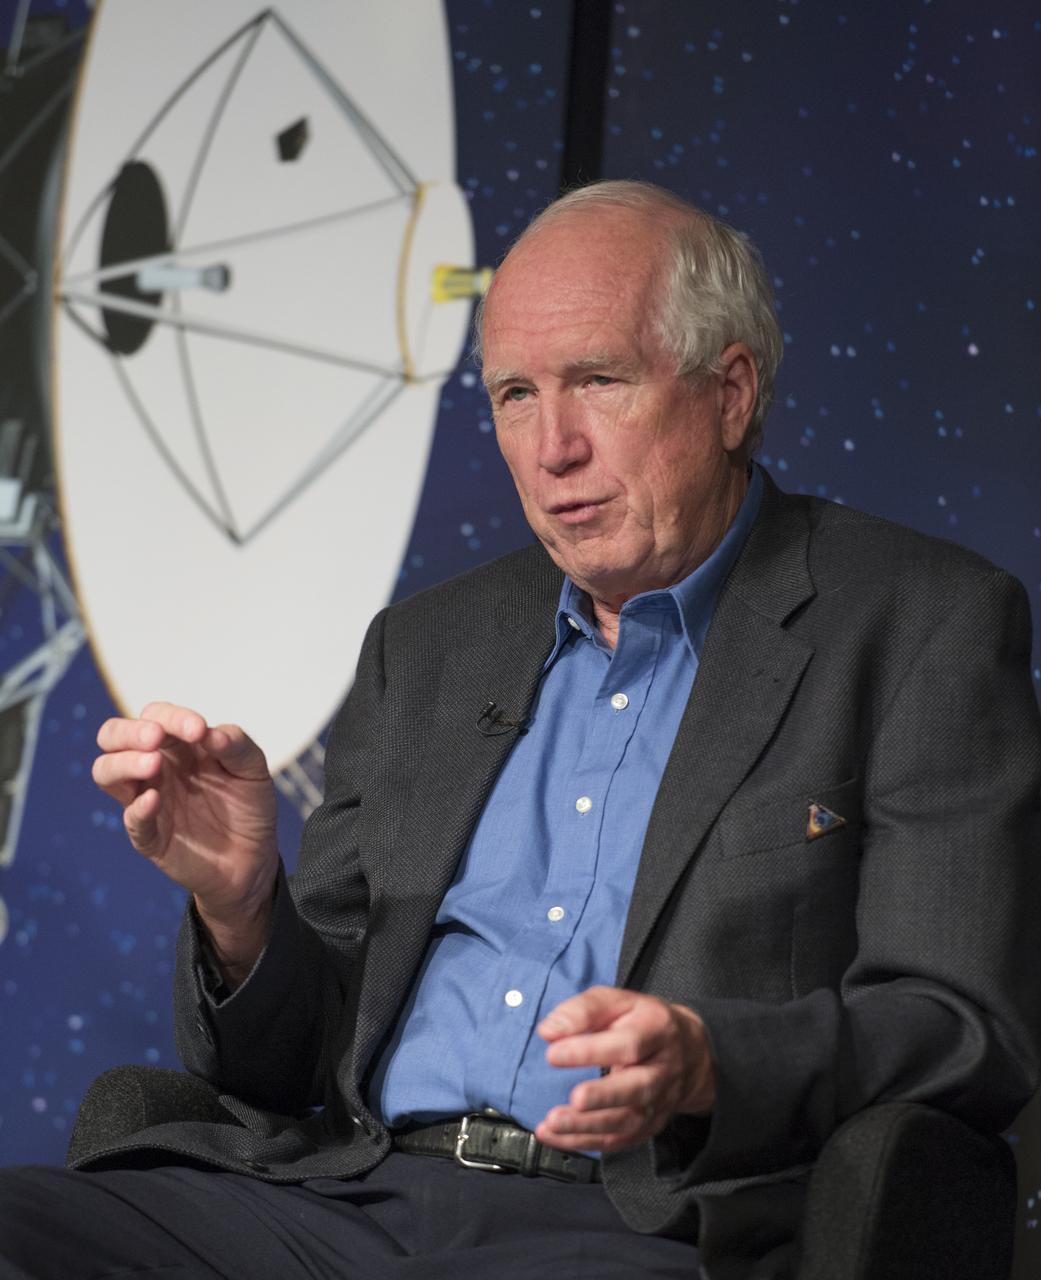
Don Gurnett, Voyager plasma wave investigation principal investigator, University of Iowa, speaks at a news conference on NASA's Voyager 1 spacecraft, Thursday, Sept. 12, 2013 at NASA Headquarters in Washington. NASA's Voyager 1 spacecraft officially is the first human-made object to venture into interstellar space. The 36-year-old probe is about 12 billion miles (19 billion kilometers) from our sun. New and unexpected data indicate Voyager 1 has been traveling for about one year through plasma, or ionized gas, present in the space between stars. A report on the analysis of this new data is published in Thursday's edition of the journal Science. Photo Credit: (NASA/Carla Cioffi)
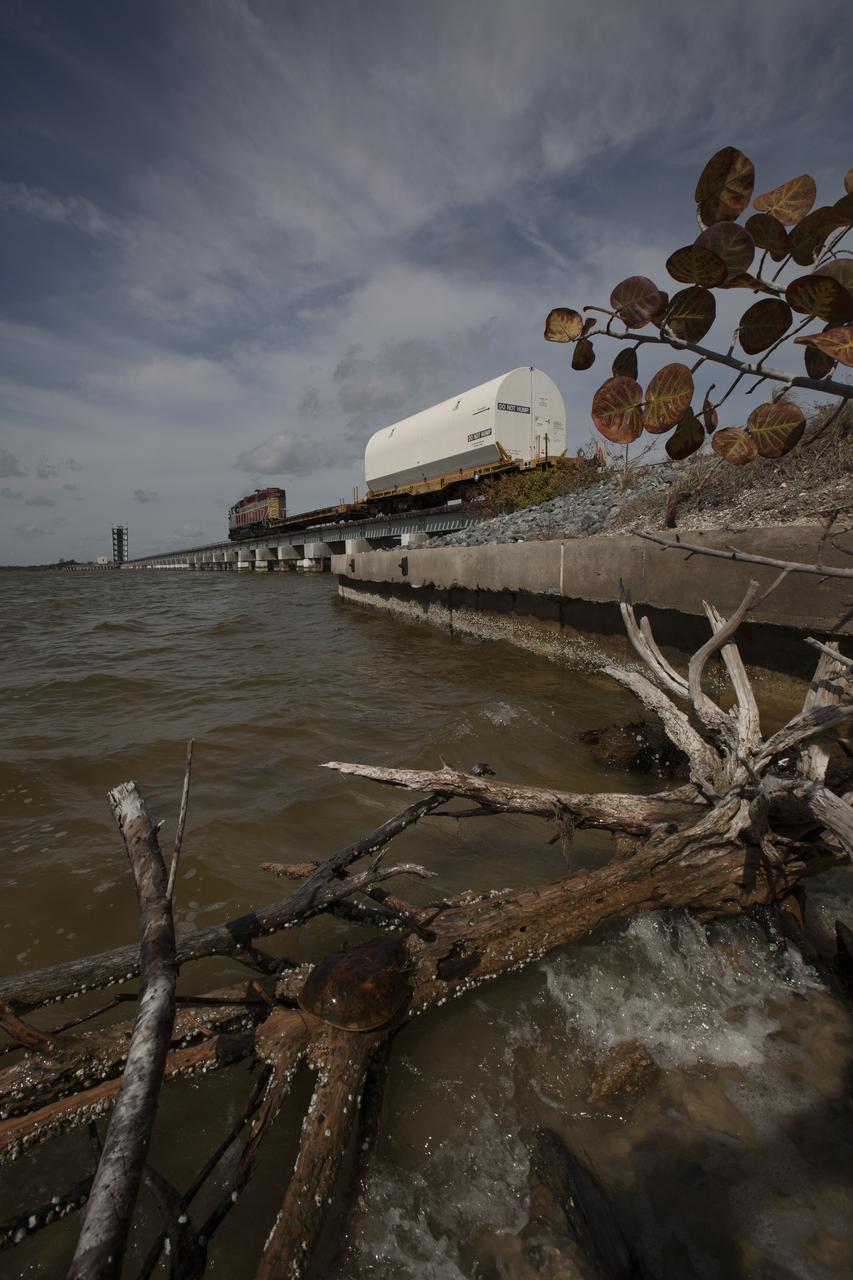
An Iowa Northern locomotive, contracted by Goodloe Transportation of Chicago, travels along the NASA railroad bridge over the Indian River north of Kennedy Space Center, carrying one of two containers on a railcar for transport to the NASA Jay Jay railroad yard. The containers held two pathfinders, or test versions, of solid rocket booster segments for NASA’s Space Launch System rocket that were delivered to the Rotation, Processing and Surge Facility (RPSF). Inside the RPSF, the Ground Systems Development and Operations Program and Jacobs Engineering, on the Test and Operations Support Contract, will conduct a series of lifts, moves and stacking operations using the booster segments, which are inert, to prepare for Exploration Mission-1, deep-space missions and the journey to Mars. The pathfinder booster segments are from Orbital ATK in Utah.
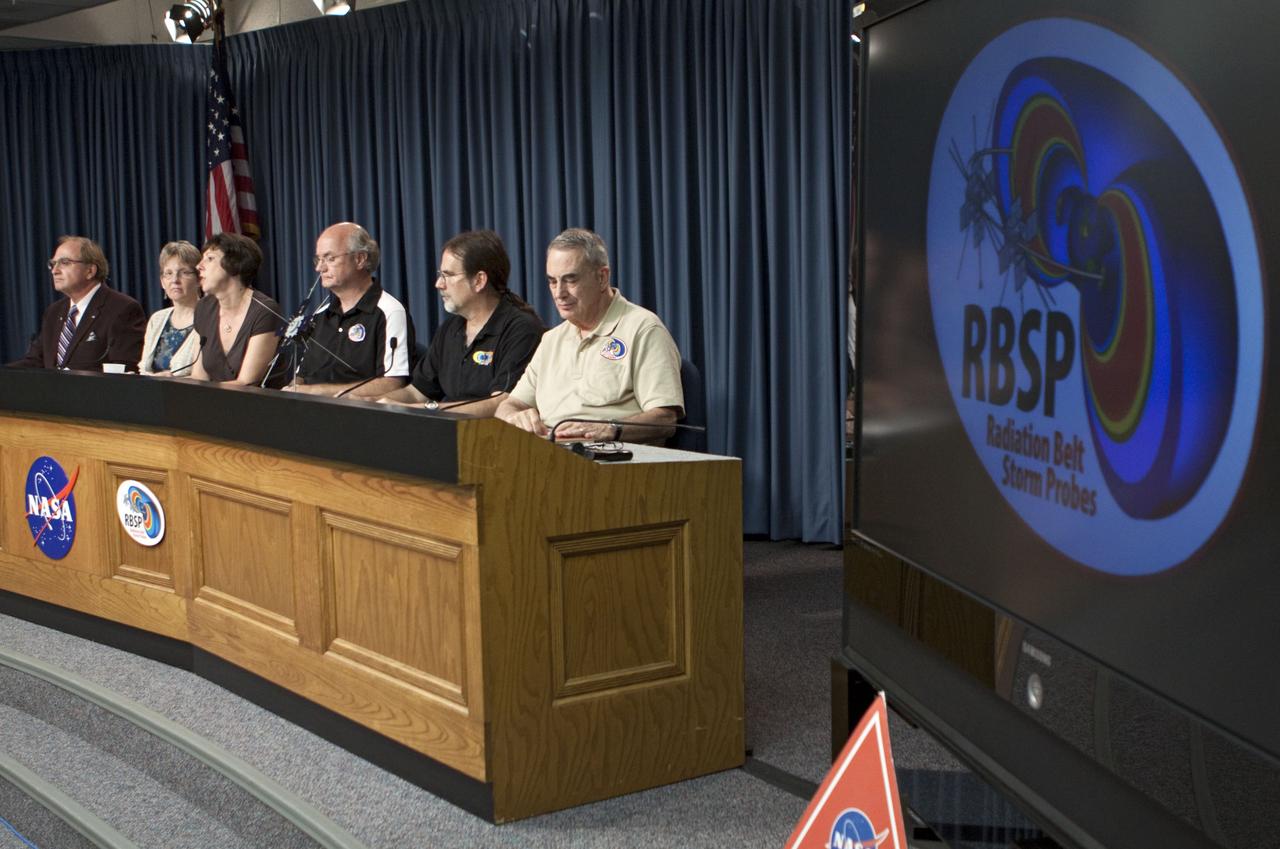
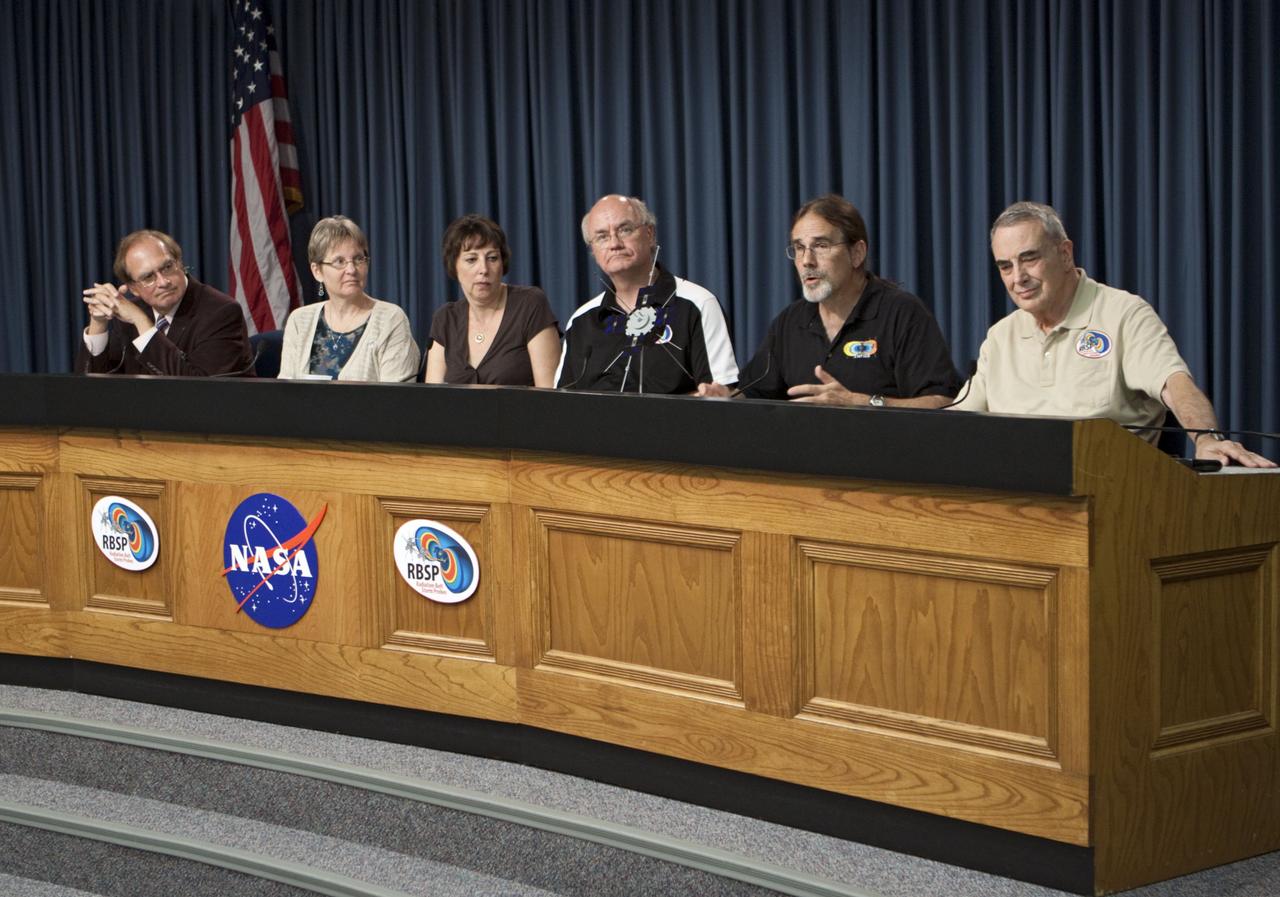
CAPE CANAVERAL, Fla. - A mission science briefing was held at NASA Kennedy Space Center’s Press Site in Florida for the Radiation Belt Storm Probes, or RBSP, mission. From left, are George Diller, public affairs specialist and news conference moderator, Mona Kessel, RBSP program scientist from NASA Headquarters in Washington, Nicola Fox, RBSP deputy project scientist at Johns Hopkins Applied Physics Laboratory in Laurel, Md., Craig Kletzing, principal investigator from the University of Iowa, Harlan Spence, principal investigator from the University of New Hampshire, and Lou Lanzerotti, principal investigator from the New Jersey Institute of Technology. NASA’s RBSP mission will help us understand the sun’s influence on Earth and near-Earth space by studying the Earth’s radiation belts on various scales of space and time. RBSP will begin its mission of exploration of Earth’s Van Allen radiation belts and the extremes of space weather after its launch aboard an Atlas V rocket. Launch is targeted for Aug. 24. For more information, visit http://www.nasa.gov/rbsp. Photo credit: NASA/Glenn Benson
CAPE CANAVERAL, Fla. - A mission science briefing was held at NASA Kennedy Space Center’s Press Site in Florida for the Radiation Belt Storm Probes, or RBSP, mission. From left, are George Diller, public affairs specialist and news conference moderator, Mona Kessel, RBSP program scientist from NASA Headquarters in Washington, Nicola Fox, RBSP deputy project scientist at Johns Hopkins Applied Physics Laboratory in Laurel, Md., Craig Kletzing, principal investigator from the University of Iowa, Harlan Spence, principal investigator from the University of New Hampshire, and Lou Lanzerotti, principal investigator from the New Jersey Institute of Technology. NASA’s RBSP mission will help us understand the sun’s influence on Earth and near-Earth space by studying the Earth’s radiation belts on various scales of space and time. RBSP will begin its mission of exploration of Earth’s Van Allen radiation belts and the extremes of space weather after its launch aboard an Atlas V rocket. Launch is targeted for Aug. 24. For more information, visit http://www.nasa.gov/rbsp. Photo credit: NASA/Glenn Benson
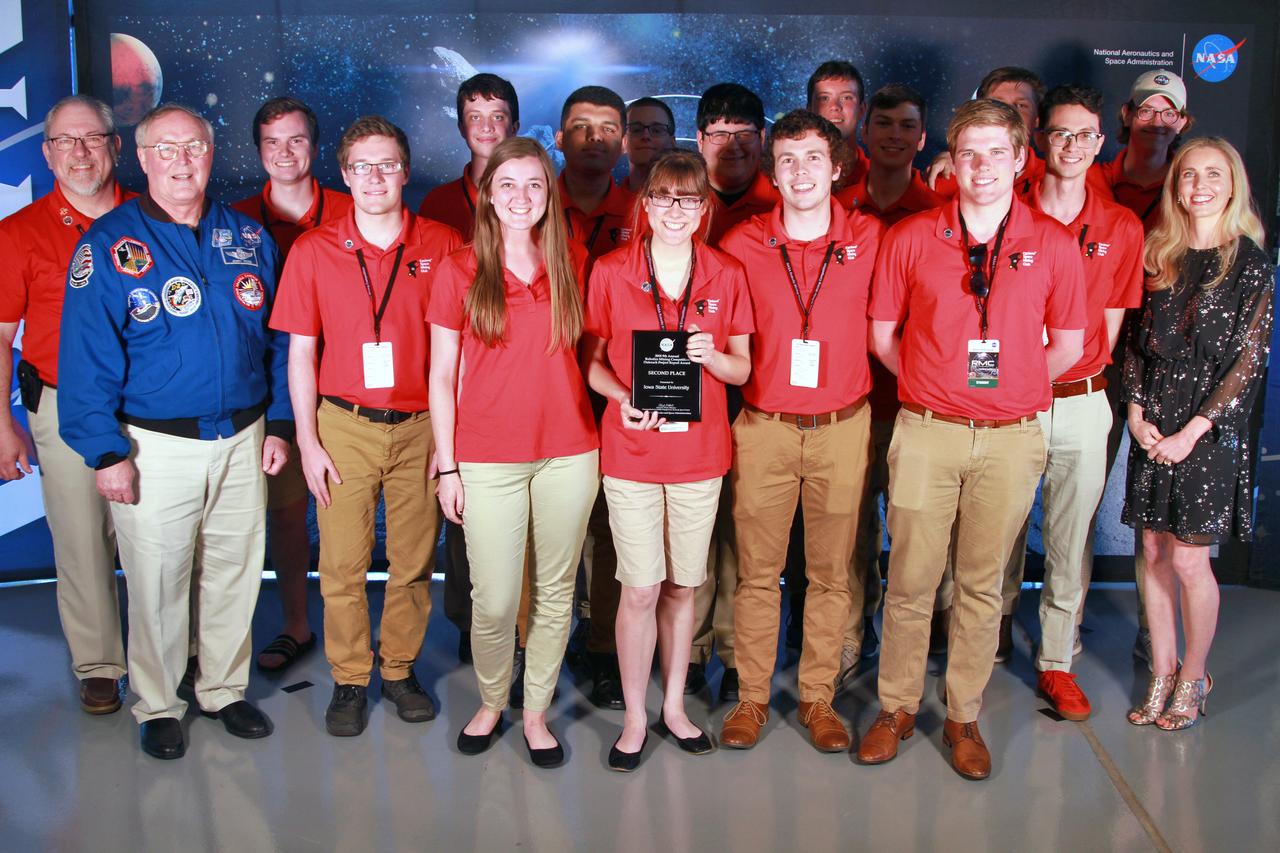
NASA's 9th Annual Robotic Mining Competition concludes with an awards ceremony May 18, 2018, at the Apollo/Saturn V Center at the Kennedy Space Center Visitor Complex in Florida. The team from Iowa State University received second place in the Outreach Project category. At left is retired NASA astronaut Jerry Ross. At right is Bethanne Hull, NASA Education specialist and lead Outreach Project judge. More than 40 student teams from colleges and universities around the U.S. participated in the competition, May 14-18, by using their mining robots to dig in a supersized sandbox filled with BP-1, or simulated lunar soil, gravel and rocks, and participate in other competition requirements. The Robotic Mining Competition is a NASA Human Exploration and Operations Mission Directorate project designed to encourage students in science, technology, engineering and math, or STEM fields. The project provides a competitive environment to foster innovative ideas and solutions that could be used on NASA's deep space missions.
Dr. Weijia Zhou, director of the Wisconsin Center for Space Automation and Robotics at the University of Wisconsin-Madison, inspects the Advanced Astroculture(tm) plant growth unit before its first flight last spring. Coating technology is used inside the miniature plant greenhouse to remove ethylene, a chemical produced by plant leaves that can cause plants to mature too quickly. This same coating technology is used in a new anthrax-killing device. The Space Station experiment is managed by the Space Product Development Program at NASA's Marshall Space Flight Center in Huntsville, Ala. DuPont is partnering with NASA and the Wisconsin Center for Space Automation and Robotics (WCSAR) at the University of Wisconsin-Madison to grow soybeans aboard the Space Station to find out if they have improved oil, protein, carbohydrates or secondary metabolites that could benefit farmers and consumers. Principal Investigators: Dr. Tom Corbin, Pioneer Hi-Bred International Inc., a Dupont Company, with headquarters in Des Moines, Iowa, and Dr. Weijia Zhou, Wisconsin Center for Space Automation and Robotics (WCSAR), University of Wisconsin-Madison.
CAPE CANAVERAL, Fla. - A mission science briefing was held at NASA Kennedy Space Center’s Press Site in Florida for the Radiation Belt Storm Probes, or RBSP, mission. From left, are George Diller, public affairs specialist and news conference moderator, Mona Kessel, RBSP program scientist from NASA Headquarters in Washington, Nicola Fox, RBSP deputy project scientist at Johns Hopkins Applied Physics Laboratory in Laurel, Md., Craig Kletzing, principal investigator from the University of Iowa, Harlan Spence, principal investigator from the University of New Hampshire, and Lou Lanzerotti, principal investigator from the New Jersey Institute of Technology. NASA’s RBSP mission will help us understand the sun’s influence on Earth and near-Earth space by studying the Earth’s radiation belts on various scales of space and time. RBSP will begin its mission of exploration of Earth’s Van Allen radiation belts and the extremes of space weather after its launch aboard an Atlas V rocket. Launch is targeted for Aug. 24. For more information, visit http://www.nasa.gov/rbsp. Photo credit: NASA/Glenn Benson
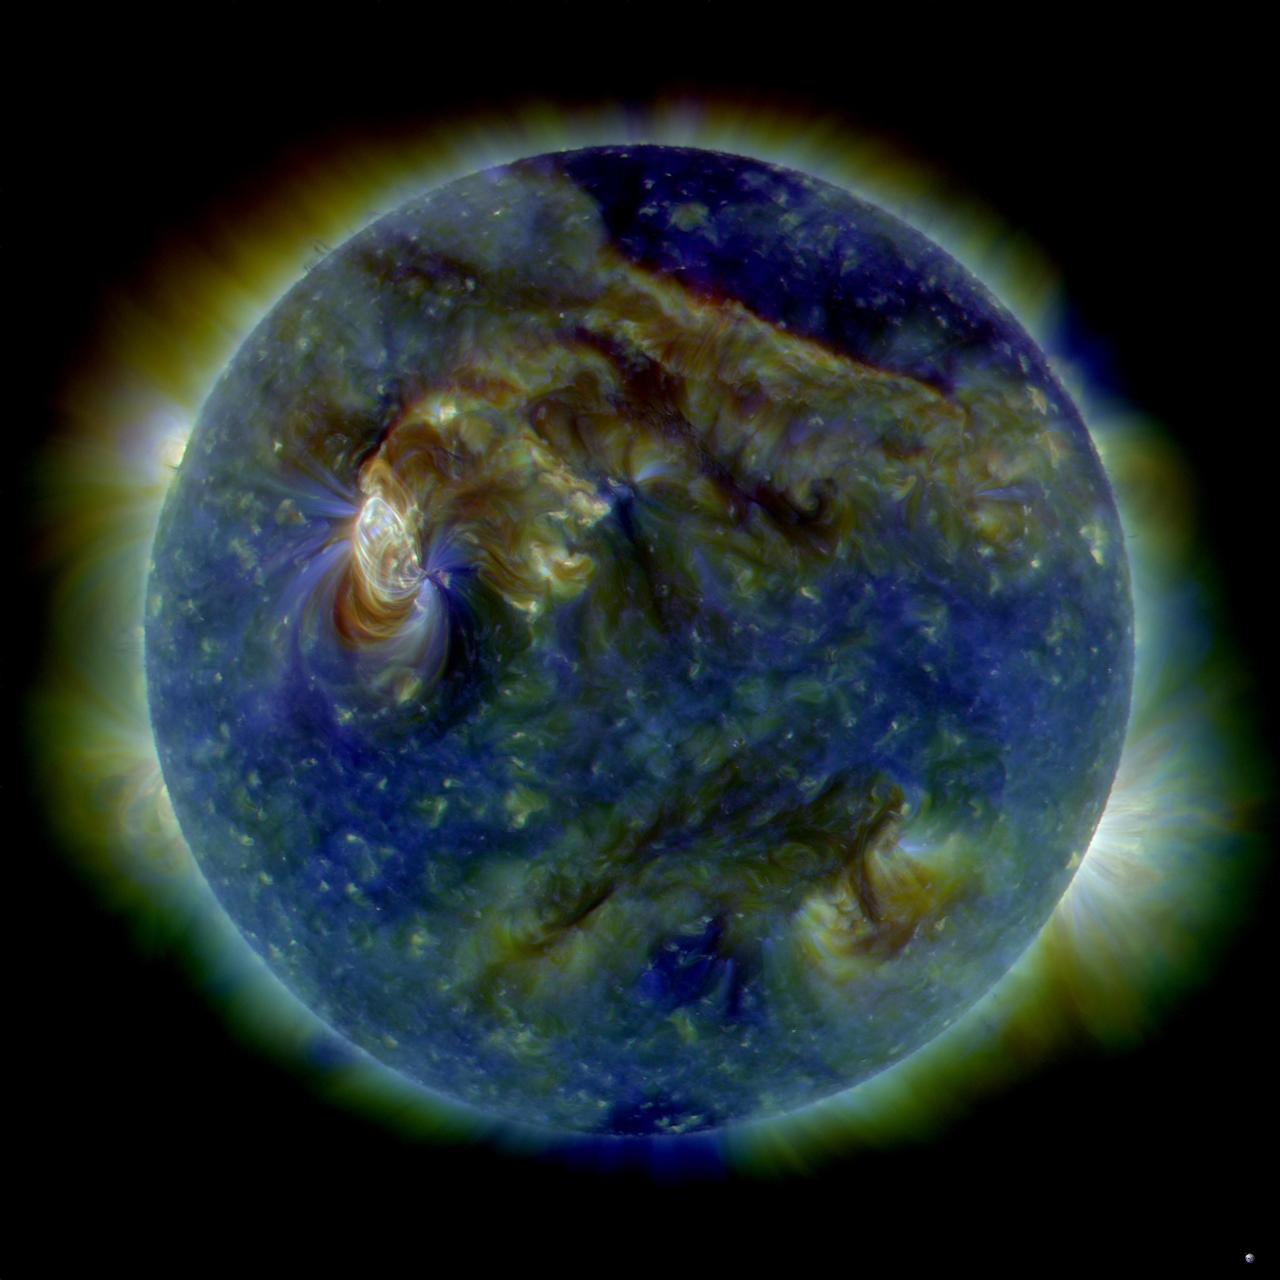
NASA image release August 6, 2010 On August 1, 2010, almost the entire Earth-facing side of the sun erupted in a tumult of activity. This image from the Solar Dynamics Observatory of the news-making solar event on August 1 shows the C3-class solar flare (white area on upper left), a solar tsunami (wave-like structure, upper right), multiple filaments of magnetism lifting off the stellar surface, large-scale shaking of the solar corona, radio bursts, a coronal mass ejection and more. This multi-wavelength extreme ultraviolet snapshot from the Solar Dynamics Observatory shows the sun's northern hemisphere in mid-eruption. Different colors in the image represent different gas temperatures. Earth's magnetic field is still reverberating from the solar flare impact on August 3, 2010, which sparked aurorae as far south as Wisconsin and Iowa in the United States. Analysts believe a second solar flare is following behind the first flare and could re-energize the fading geomagnetic storm and spark a new round of Northern Lights. Credit: NASA/SDO/AIA <b><a href="http://www.nasa.gov/centers/goddard/home/index.html" rel="nofollow">NASA Goddard Space Flight Center</a></b> is home to the nation's largest organization of combined scientists, engineers and technologists that build spacecraft, instruments and new technology to study the Earth, the sun, our solar system, and the universe. <b>Follow us on <a href="http://twitter.com/NASA_GoddardPix" rel="nofollow">Twitter</a></b> <b>Join us on <a href="http://www.facebook.com/pages/Greenbelt-MD/NASA-Goddard/395013845897?ref=tsd" rel="nofollow">Facebook</a><b> </b></b>
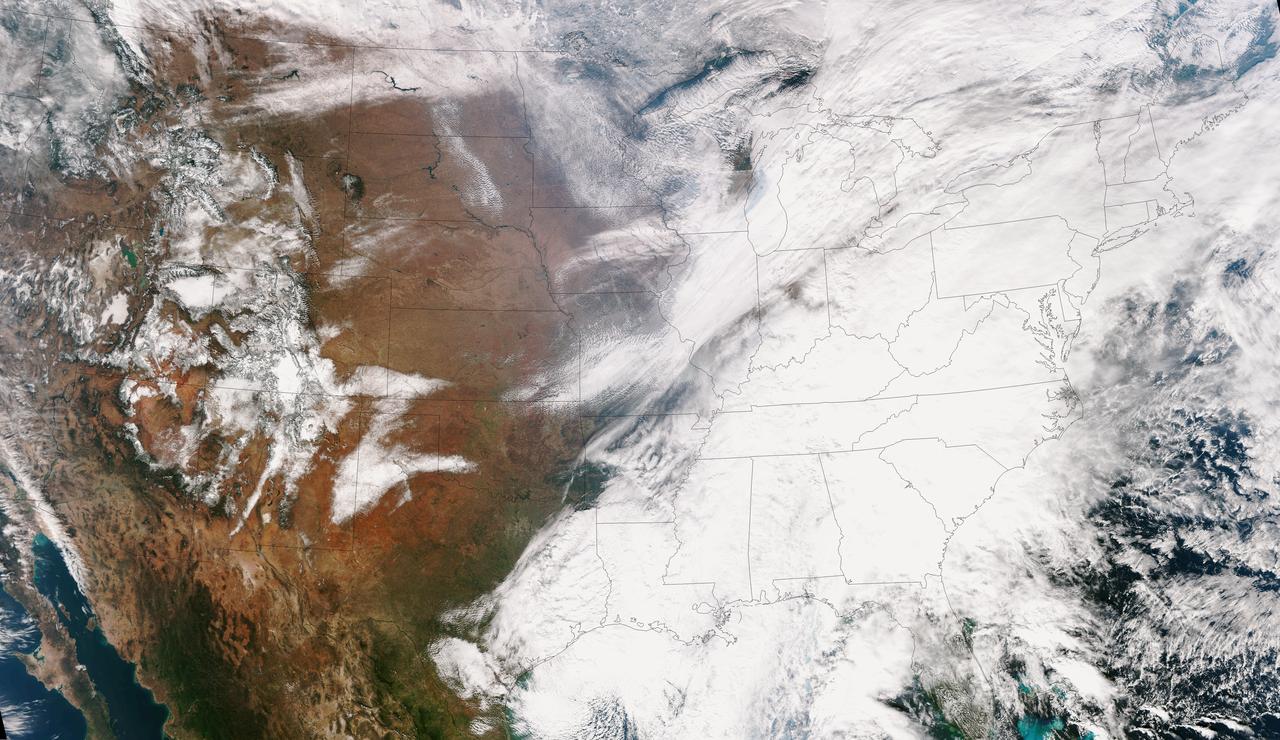
This true color image of the Continental United States was taken on Nov. 25, 2013 by the Suomi NPP satellite and shows the system as it moves through the South and Midwest. The National Weather Service noted that a complex and powerful storm system continues to generate widespread moderate to heavy rainfall and snows in various parts of the eastern United States as travelers make their way to destinations to celebrate Thanksgiving and Hanukkah on Nov. 28. There are two low-pressure areas working together. One was centered near New Jersey while the other was located over the Carolinas. From the Southeast to New England widespread moderate to heavy rainfall is expected. The rains will also affect the Mid-Atlantic and Southeastern United States, although those regions are not expected to get as much of a soaking. The Appalachians and interior New England are expected to receive snowfall. Areas of heavy snow are forecast for northwestern Indiana and northwestern Pennsylvania on Nov. 27. Snows will blanket the north central United States from the Dakotas to Minnesota, Iowa, Wisconsin, Michigan, the Ohio and Tennessee Valleys, upstate New York and parts of northern New England. The National Weather Service noted that cold air is moving in behind the storm and drop temperatures along the eastern U.S. making for a chilly Thanksgiving. Credit: NASA/NOAA <b><a href="http://www.nasa.gov/audience/formedia/features/MP_Photo_Guidelines.html" rel="nofollow">NASA image use policy.</a></b> <b><a href="http://www.nasa.gov/centers/goddard/home/index.html" rel="nofollow">NASA Goddard Space Flight Center</a></b> enables NASA’s mission through four scientific endeavors: Earth Science, Heliophysics, Solar System Exploration, and Astrophysics. Goddard plays a leading role in NASA’s accomplishments by contributing compelling scientific knowledge to advance the Agency’s mission. <b>Follow us on <a href="http://twitter.com/NASA_GoddardPix" rel="nofollow">Twitter</a></b> <b>Like us on <a href="http://www.facebook.com/pages/Greenbelt-MD/NASA-Goddard/395013845897?ref=tsd" rel="nofollow">Facebook</a></b> <b>Find us on <a href="http://instagram.com/nasagoddard?vm=grid" rel="nofollow">Instagram</a></b>
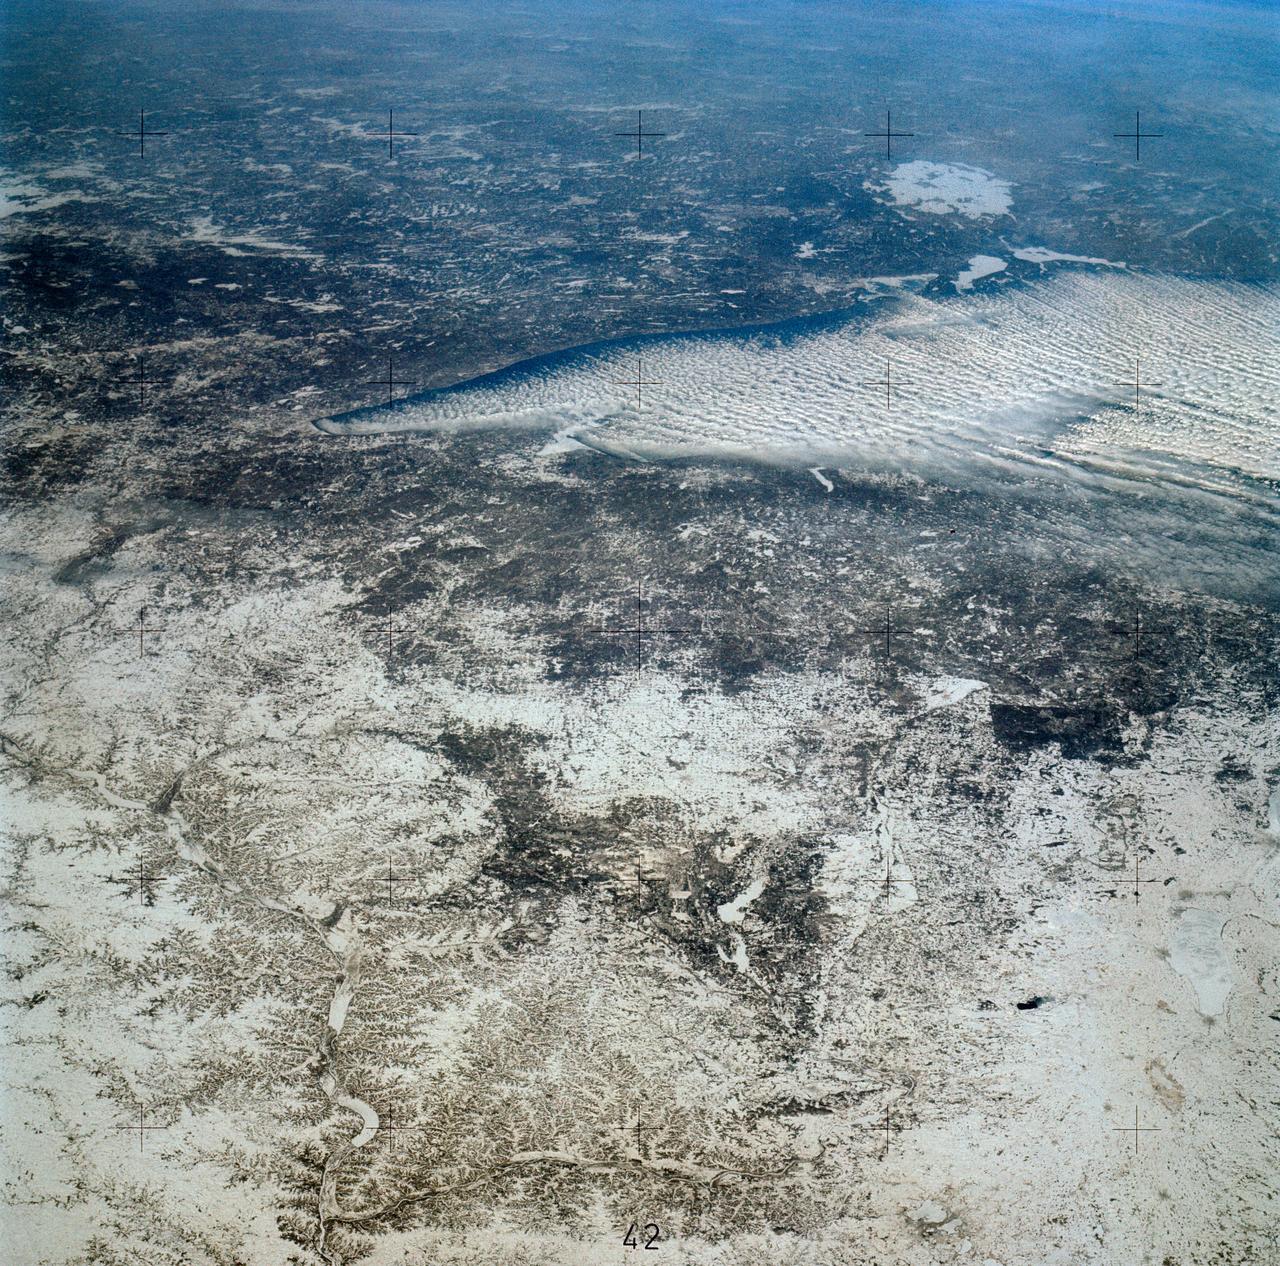
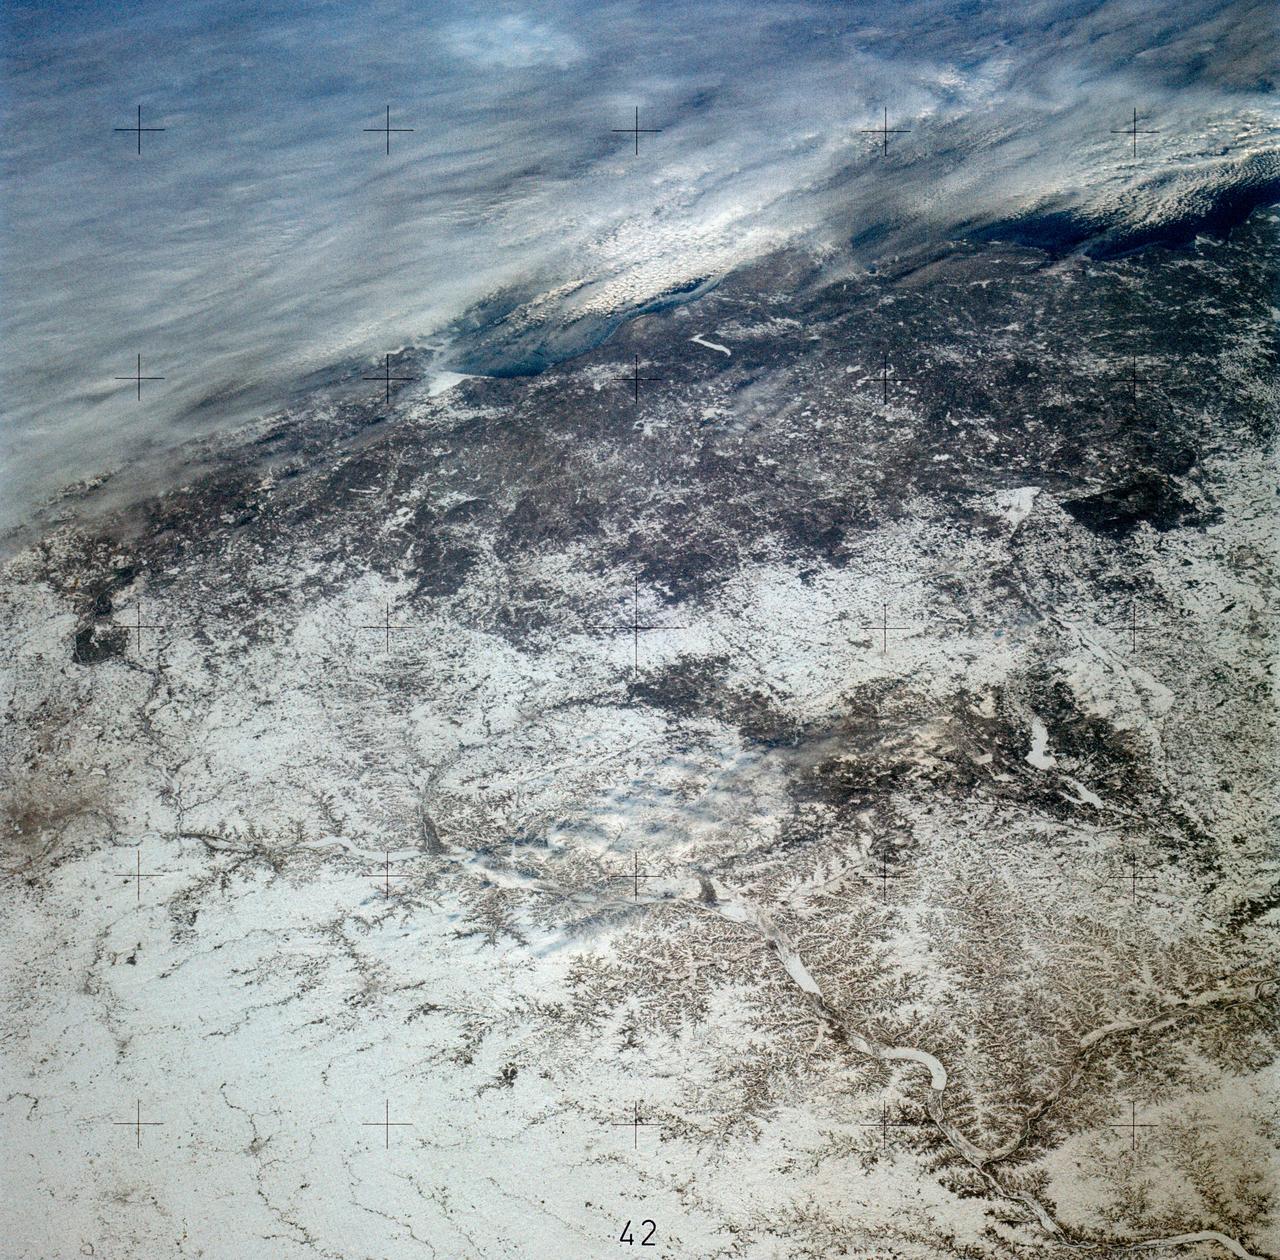
SL4-139-3953 (7 Jan. 1974) --- An oblique view of a portion of the Middle West looking northeastward toward Lake Superior and Ontario, Canada, as seen from the Skylab space station in Earth orbit. This picture was taken by one of the Skylab 4 crewmen with a hand-held 70mm Hasselblad camera using a 100mm lens. Most of the land mass in the foreground is Wisconsin. Iowa is in the lower left corner. Minnesota is at left and upper left. Ontario is in the far right background. Michigan is at right center. Note the circular-shaped feature at center left which was first observed by the Skylab 4 crewmen. The feature is 85 kilometers (55 miles) in diameter, and it is centered near 91.5 degrees west longitude and 44.5 degrees north latitude. The Mississippi River Valley forms the southwest side of the circular feature. The City of La Crosse, Wisconsin, is just south of the near side of the circle, and the Black River completes the southern and eastern part. The City of Eau Claire is at the north edge of the circle. The most likely origin of circular features of this magnitude are (1) volcanic, (2) structural, or (3) meteorite impact. The feature is not volcanic -- the rocks are the wrong type. Possibly it is structural, formed by slight warping of layered rocks into a basin or dome, followed by erosion of all but the most subtle trace of the structure. The feature could be a severely eroded meteorite impact crater. If so, a thorough study of the area may yield evidence of the extreme pressure and temperature the rocks were subjected to by the shock of an impacting meteorite. Photo credit: NASA
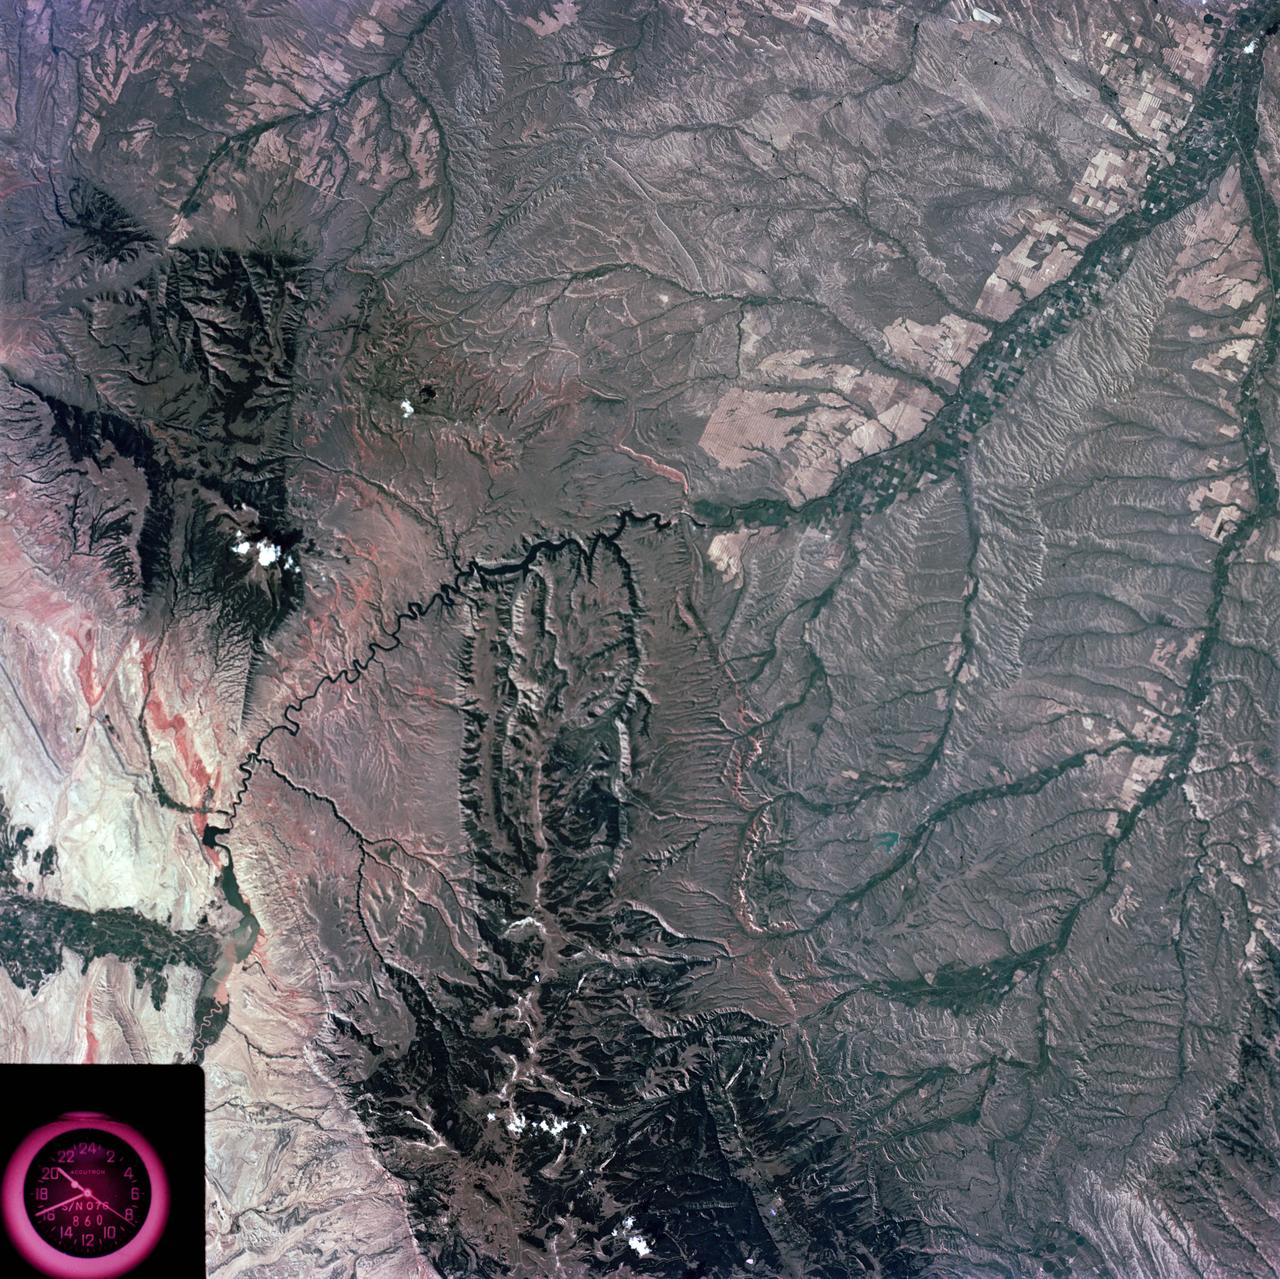
S73-35081 (July-September 1973) --- A view of approximately 3,600 square miles of north central Wyoming and southern Montana is seen in this Skylab 3 Earth Resources Experiments Package S190-B (five-inch Earth terrain camera) photograph taken from the Skylab space station in Earth orbit. The Big Horn River following northward crosses between the northwest trending Big Horn Mountains and the Pryor Mountains. Yellowtail Reservoir, named after a former chief of the Crow Indian tribe in the center of the picture is impounded by a dam across the small rectangular crop area along the Big Horn River (upper right) and the strip farming (yellow) practiced on the rolling hill along the Big Horn River and its tributaries (upper left corner and right edge). The low sun angle enhances the structural features of the mountains as well as the drainage patterns in the adjacent basins. Rock formation appears in this color photograph as they would to the eye from this altitude. The distinctive redbeds can be traced along the front of the Pryor Mountains and indicate the folding that occurred during mountain building. EREP investigators, Dr. Houston of the University of Wyoming and Dr. Hoppin of the University of Iowa, will analyze the photograph and use the results in geological mapping and mineral resource studies. Lowell, Wyoming (lower left corner) and Hardin, Montana (upper right corner) can be recognized. Federal agencies participating with NASA on the EREP project are the Departments of Agriculture, Commerce, Interior, the Environmental Protection Agency and the Corps of Engineers. All EREP photography is available to the public through the Department of Interior?s Earth Resources Observations Systems Data Center, Sioux Falls, South Dakota, 57198. (Alternate number SL3-86-337) Photo credit: NASA
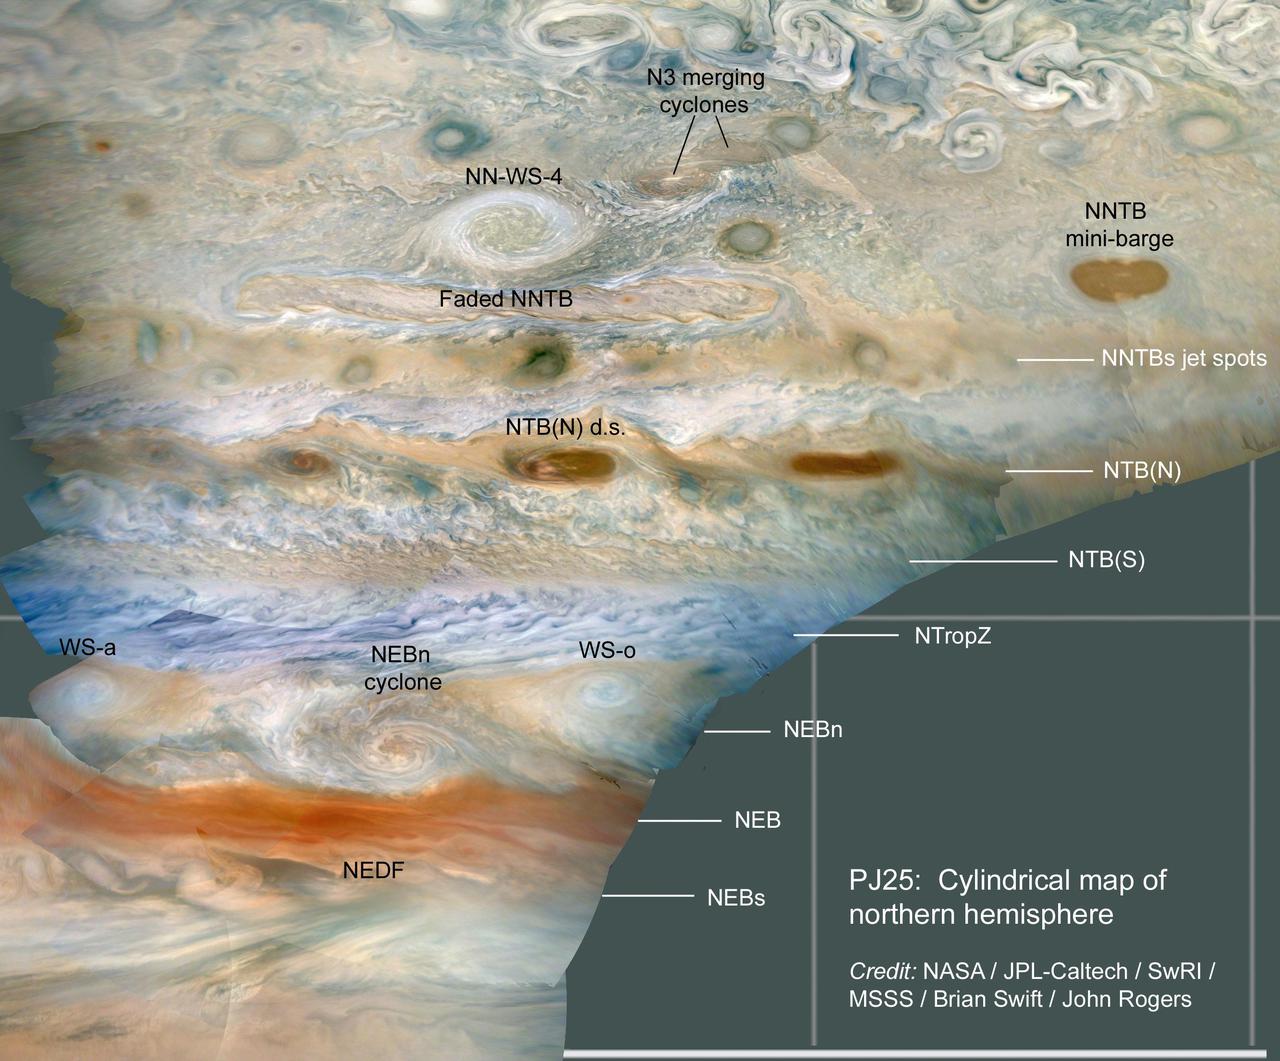
JunoCam imaged numerous storms in Jupiter's atmosphere on Juno's 25th close pass, in the region just north of Jupiter's equator. Amateurs and professional observers track these storms routinely to study the dynamics of Jupiter's atmosphere. Near the top of the image, two cyclones can be seen merging in the N3 jet stream. The next storm down is NN-WS-4 (the North North White Spot 4), rotating in an anticyclonic (clockwise rotation) direction. For scale this storm is about 4,000 miles (6,500 kilometers) across, roughly the distance between Cedar Rapids, Iowa to Honolulu, Hawaii. The elongated brown storms are familiar cyclonic (counterclockwise rotation) features, called "mini-barges." WS-a and WS-o are White Spots "a" and "o," anticyclonic storms that have persisted for over a year, separated by the North Equatorial Belt (NEB) north (NEBn) cyclone. The NEDF is the dark formation on the south edge of the NEB. Latitudinal belts and zones are labeled on the right with the conventions used by the amateur astronomy community and professional observers: NNTBs - North North Temperate Belt south; NTB(N) - North Temperate Belt (North); NTB(S) - North Temperate Belt (South); NTropZ - North Tropical Zone; NEBn - North Equatorial Belt north; NEB - North Equatorial Belt; NEBs - North Equatorial Belt south. The original JunoCam images used to produce these views were taken from altitudes between about 2,900 and 6,300 miles (4,600 and 10,200 kilometers) above Jupiter's cloud tops. Citizen scientist Brian Swift processed the images to produce a cylindrical map and enhance the color and contrast. https://photojournal.jpl.nasa.gov/catalog/PIA24236
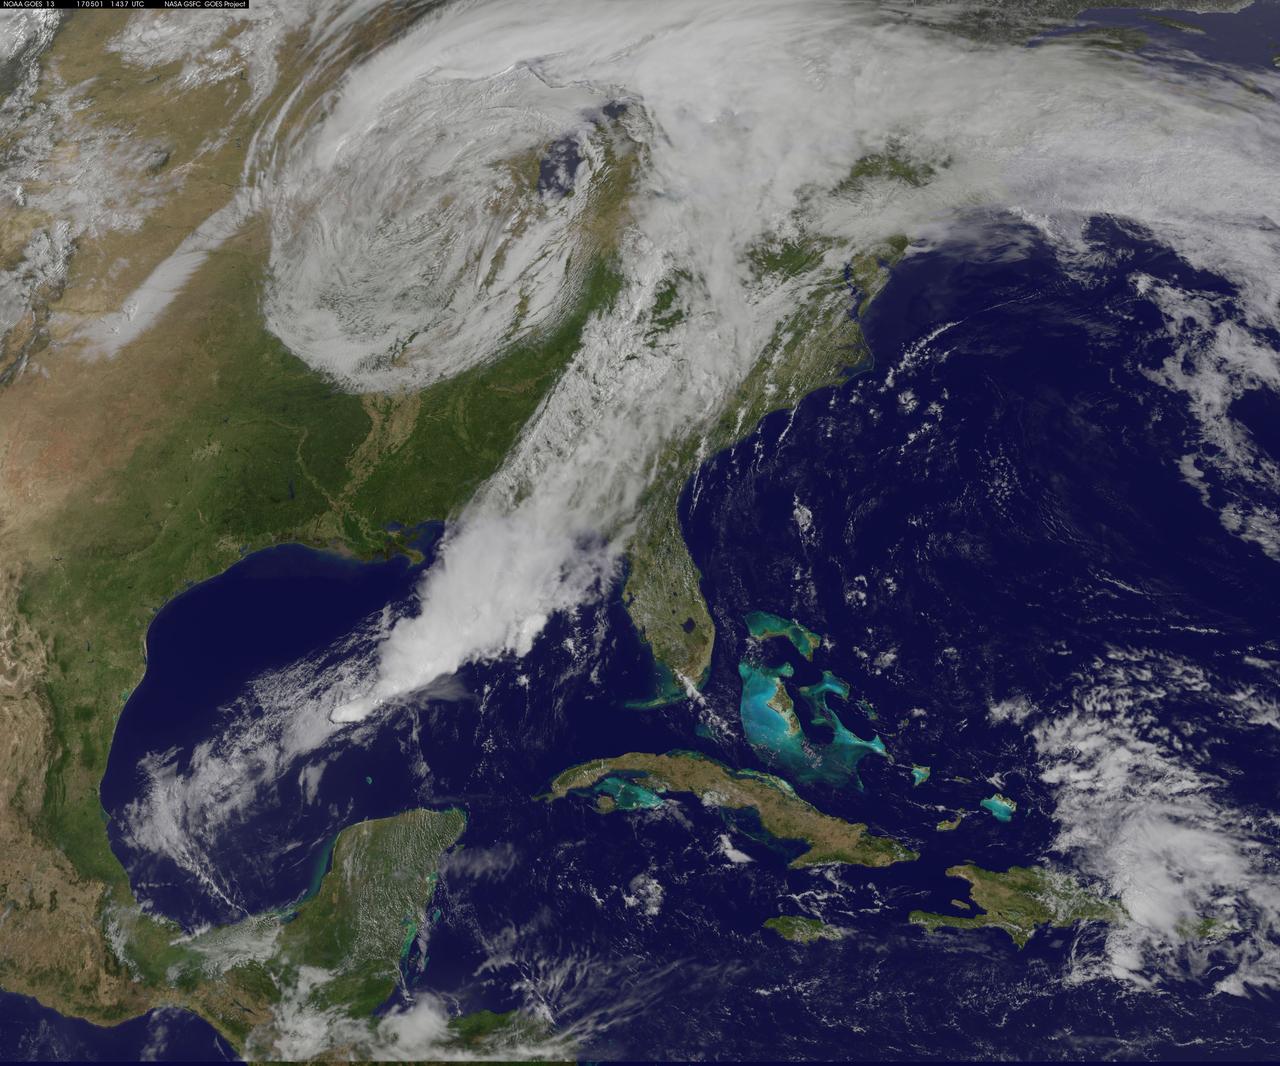
NASA Sees Severe Weather from Central to Eastern US A vigorous weather system has generated severe weather over the mid-section of the U.S. and satellites are providing a look at it as it is moving toward the East Coast. NASA and NOAA satellites have been tracking a storm system that has generated flooding and tornadic thunderstorms in the central U.S. and is expected bring severe weather to the U.S. Mid-Atlantic region. At NASA's Goddard Space Flight Center in Greenbelt, Maryland, data from NOAA's GOES-East satellite were used to create images and an animation of the movement of the powerful storm. On April 30, the Moderate Resolution Imaging Spectroradiometer, or MODIS, instrument aboard NASA's Aqua satellite captured a visible image of the storms moving over eastern Texas and Louisiana. Tornadoes in eastern Texas killed four people. The system generated heavy rainfall and caused additional fatalities and damages in Arkansas, Missouri, Mississippi, Alabama and Tennessee. On Monday, May 1, NOAA's National Weather Service noted, "Major to record flooding continues over portions of the central U.S. Severe thunderstorms are possible from the Mid-Atlantic to the northeastern U.S. "Major to record flooding will continue over portions of eastern Oklahoma, northern Arkansas, Missouri, Illinois and Indiana. Rivers will gradually recede over the next several days. Additional strong to severe thunderstorms will be possible Monday afternoon and evening over portions of the Mid-Atlantic and Northeast U.S. Damaging winds, large hail, and isolated tornadoes will be possible." Image caption: On May 1, 2017, at 10:37 a.m. EDT (1437 UTC) NOAA's GOES-East satellite captured this visible image of the storm system centered over Iowa with an associated cold front that stretches into the Gulf of Mexico. Credits: NASA/NOAA GOES Project <b><a href="http://www.nasa.gov/audience/formedia/features/MP_Photo_Guidelines.html" rel="nofollow">NASA image use policy.</a></b> <b><a href="http://www.nasa.gov/centers/goddard/home/index.html" rel="nofollow">NASA Goddard Space Flight Center</a></b> enables NASA’s mission through four scientific endeavors: Earth Science, Heliophysics, Solar System Exploration, and Astrophysics. Goddard plays a leading role in NASA’s accomplishments by contributing compelling scientific knowledge to advance the Agency’s mission. <b>Follow us on <a href="http://twitter.com/NASAGoddardPix" rel="nofollow">Twitter</a></b> <b>Like us on <a href="http://www.facebook.com/pages/Greenbelt-MD/NASA-Goddard/395013845897?ref=tsd" rel="nofollow">Facebook</a></b> <b>Find us on <a href="http://instagrid.me/nasagoddard/?vm=grid" rel="nofollow">Instagram</a></b>
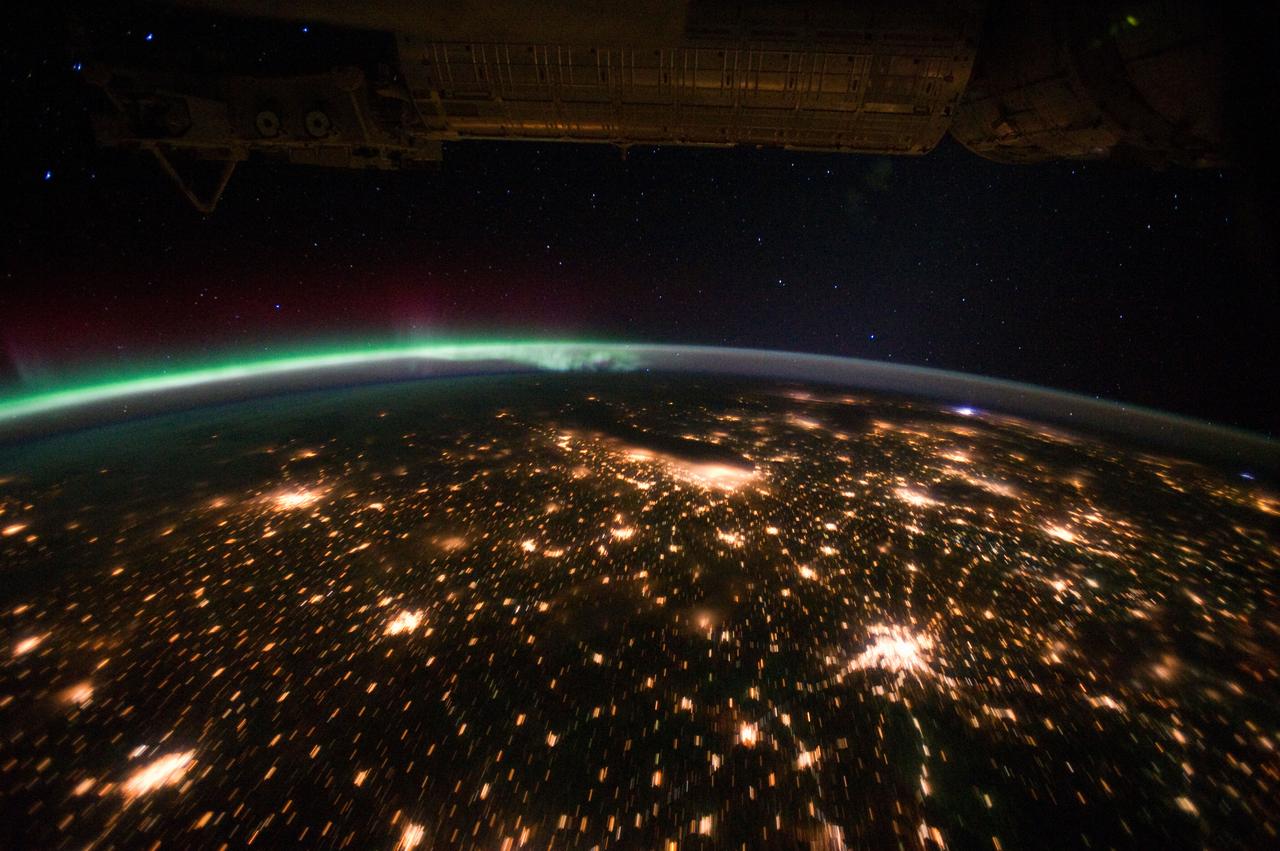
ISS029-E-012564 (29 Sept. 2011) --- The Midwestern United States at night with Aurora Borealis is featured in this image photographed by an Expedition 29 crew member on the International Space Station. The night skies viewed from the space station are illuminated with light from many sources. For example, the Midwestern United States presents a night-time appearance not unlike a patchwork quilt when viewed from orbit. The artificial light from human settlements appears everywhere with a characteristic yellow tinge in this photograph. But green light of the Aurora Borealis also appears strongly in this view (top left)—even seeming to be reflected off Earth’s surface—in Canada—beneath the aurora. A small white patch of light is almost certainly lightning from a storm on the East coast (top right). Part of the International Space Station appears across the top of the image. This photograph highlights the Chicago, IL, metropolitan area as the largest cluster of lights at center, next to the dark patch of Lake Michigan. The other largest metropolitan areas include St. Louis, MO (lower right), Minneapolis–St. Paul, MN (left) and the Omaha–Council Bluffs region on the Nebraska–Iowa border (lower left). City light clusters give an immediate sense of relative city size; demographers have used night time satellite imagery to make estimates of city populations, especially in the developing world where city growth can be very rapid. The U.S. northeast seaboard lies in the most oblique (meaning viewed at an angle) part of the image at top right, just beyond the Appalachian Mts., a dark winding zone without major cities. Scales change significantly in oblique views: Omaha is only 200 kilometers from Des Moines, but appears roughly the same distance from Minneapolis—which is actually 375 kilometers to the north of Des Moines. In addition to the major metropolitan areas, the rectangular NS/EW-oriented pattern of townships is clearly visible in the rural, lower left part of the image. This pattern instantly gives the sense of north orientation (toward the top left corner) and is a distinctive characteristic of the United States, so that ISS crew members can quickly know which continent they are flying over even at night. In contrast to the regular township pattern, interstate highways converge on St. Louis (e.g. Hwy 44), Chicago and other large cities, much like wheel spokes around a central hub. Rivers—major visual features in daylight—become almost invisible at night. The course of the Mississippi River appears as a slightly meandering zone from Minneapolis through St. Louis (dashed line)—the river course continues out of the lower right corner of the image.
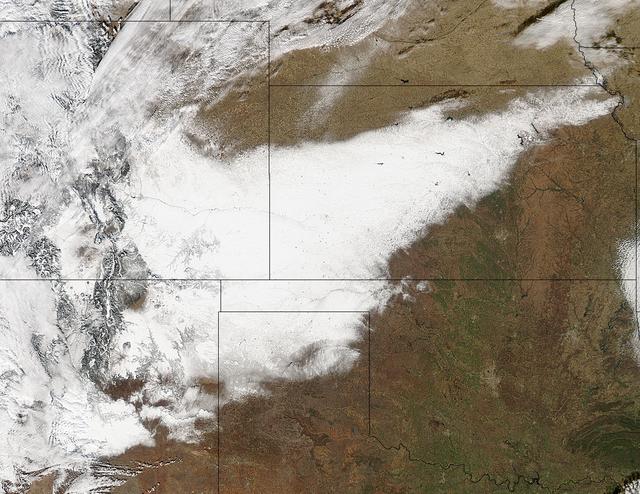
Winter arrived officially on Dec. 22 at 12:35 a.m. EST, but the U.S. Plains states received an early and cool welcome on Dec. 19 from heavy snowfall that was seen by a NASA satellite. NASA's Aqua satellite passed overhead on Dec. 21 at 20:05 UTC (3:05 p.m. EST) and the Moderate Resolution Imaging Spectroradiometer (MODIS) instrument aboard NASA's Aqua satellite captured a visible image of snow blanketing the ground through west and central Kansas, eastern and central Colorado, much of New Mexico, northern Texas and the panhandle of Oklahoma. According to CBS News, blizzard conditions were reported in northern New Mexico, the Texas Panhandle, Oklahoma and northwestern Kansas. The Associated Press reported snow drifts as high as 10 feet in southeast Colorado. Six people lost their lives in traffic accidents from this storm. Heavy snow is expected again today, Dec. 22 in New Mexico and Colorado. Snow is also expected to stretch across the plains into the upper Midwest today, according to the National Weather Service. Portions of many states are expecting some snow today, including the four corners states, north Texas, Kansas, southern Nebraska, western Oklahoma, northern Missouri, Iowa, northern Illinois and southern Wisconsin stretching east into northern New England. The first day of the winter season occurs when the sun is farthest south, either Dec. 21 or 22. The day is also known as the winter solstice. By the second day of winter, NASA's Aqua satellite is going to have a lot more snowfall to observe. Image Credit: NASA Goddard MODIS Rapid Response Team Caption: NASA, Rob Gutro <b><a href="http://www.nasa.gov/audience/formedia/features/MP_Photo_Guidelines.html" rel="nofollow">NASA image use policy.</a></b> <b><a href="http://www.nasa.gov/centers/goddard/home/index.html" rel="nofollow">NASA Goddard Space Flight Center</a></b> enables NASA’s mission through four scientific endeavors: Earth Science, Heliophysics, Solar System Exploration, and Astrophysics. Goddard plays a leading role in NASA’s accomplishments by contributing compelling scientific knowledge to advance the Agency’s mission. <b>Follow us on <a href="http://twitter.com/NASA_GoddardPix" rel="nofollow">Twitter</a></b> <b>Like us on <a href="http://www.facebook.com/pages/Greenbelt-MD/NASA-Goddard/395013845897?ref=tsd" rel="nofollow">Facebook</a></b> <b>Find us on <a href="http://instagrid.me/nasagoddard/?vm=grid" rel="nofollow">Instagram</a></b>
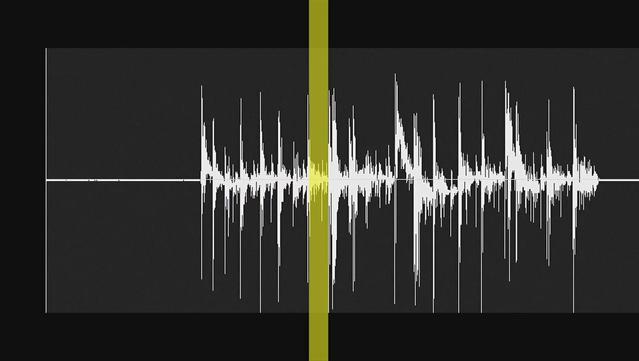
This video demonstrates the hiss-like radio noise generated by electrons moving along magnetic field lines from the Saturnian moon Enceladus to a glowing patch of ultraviolet light on Saturn.

Bizarre Sounds of Saturn Radio Emissions
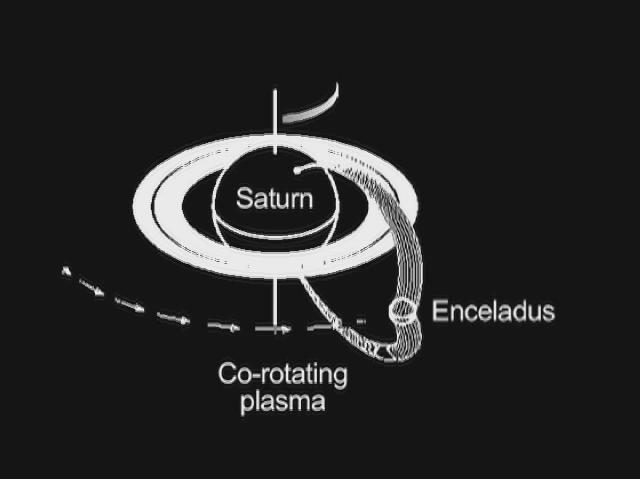
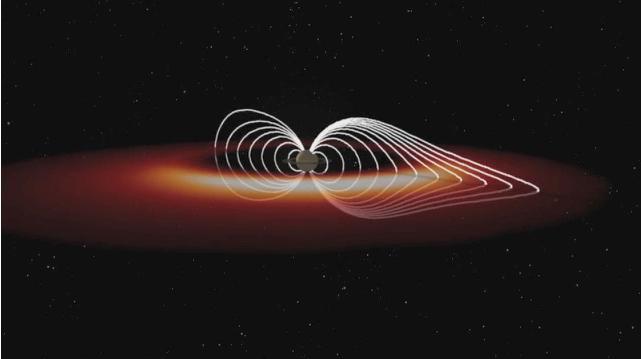
This graphic shows how Saturn and its moon Enceladus are electrically linked. Magnetic field lines, invisible to the human eye but detectable by the fields and particles instruments on NASA's Cassini spacecraft, arc from Saturn's north polar region to south polar region. Enceladus resides in the arc of a set of the field lines and feeds charged particles into the Saturn atmosphere. As Enceladus orbits around Saturn, the "footprint" of its connection to Saturn's north polar region, visible in ultraviolet light, also rotates. A doughnut of plasma, or hot ionized gas, revolves around Saturn at the same pace as the planet turns. The interaction of this plasma cloud with Enceladus shoots electrons along the magnetic field lines into the polar region of Saturn. The rain of electrons into Saturn's atmosphere creates an ultraviolet glow in an aurora-like phenomenon. Cassini's radio and plasma wave science instrument has detected a "hiss-like" radio noise generated by electrons moving along magnetic field lines from Enceladus to the glowing patch of ultraviolet light on Saturn. An animation is available at http://photojournal.jpl.nasa.gov/catalog/PIA13897

Entering Saturn Magnetosphere with a Boom
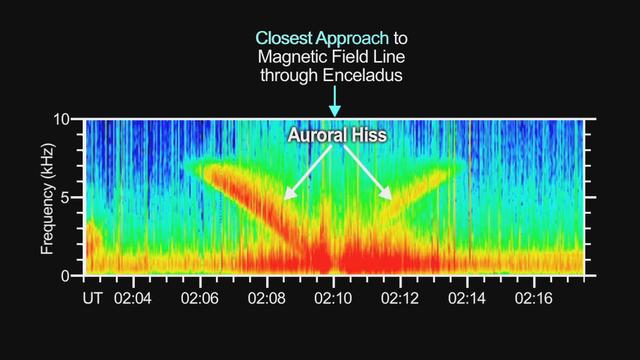
This graphic demonstrates the hiss-like radio noise generated by electrons moving along magnetic field lines from the Saturnian moon Enceladus to a glowing patch of ultraviolet light on Saturn.
Lightning, Crackles and Pops
Lightning sounds from Saturn can be heard via radio signals received by the radio and plasma wave science instrument on the Cassini spacecraft
Eerie Sounds of Saturn Radio Emissions
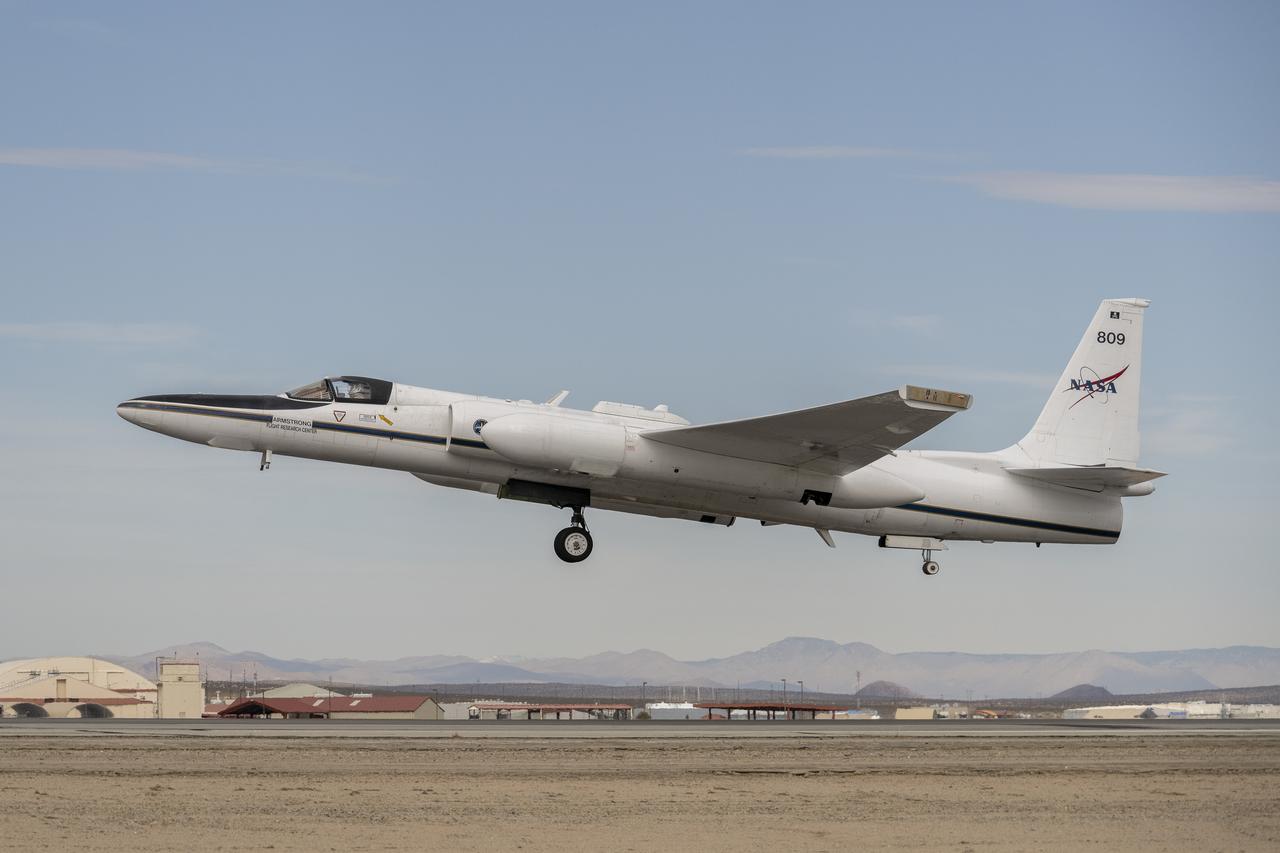
A team of experts wrap up science flights on the ER-2 aircraft at Armstrong Flight Research Center in Edwards, California after the GSFC Lidar Observation and Validation Experiment (GLOVE) in February 2025. Pilot Tim Williams ascends the ER-2 on the runway for one of the final science flights validating satellite-borne data. As a collaboration between engineers, scientists, and aircraft professionals, GLOVE aims to improve satellite data products for Earth Science applications.
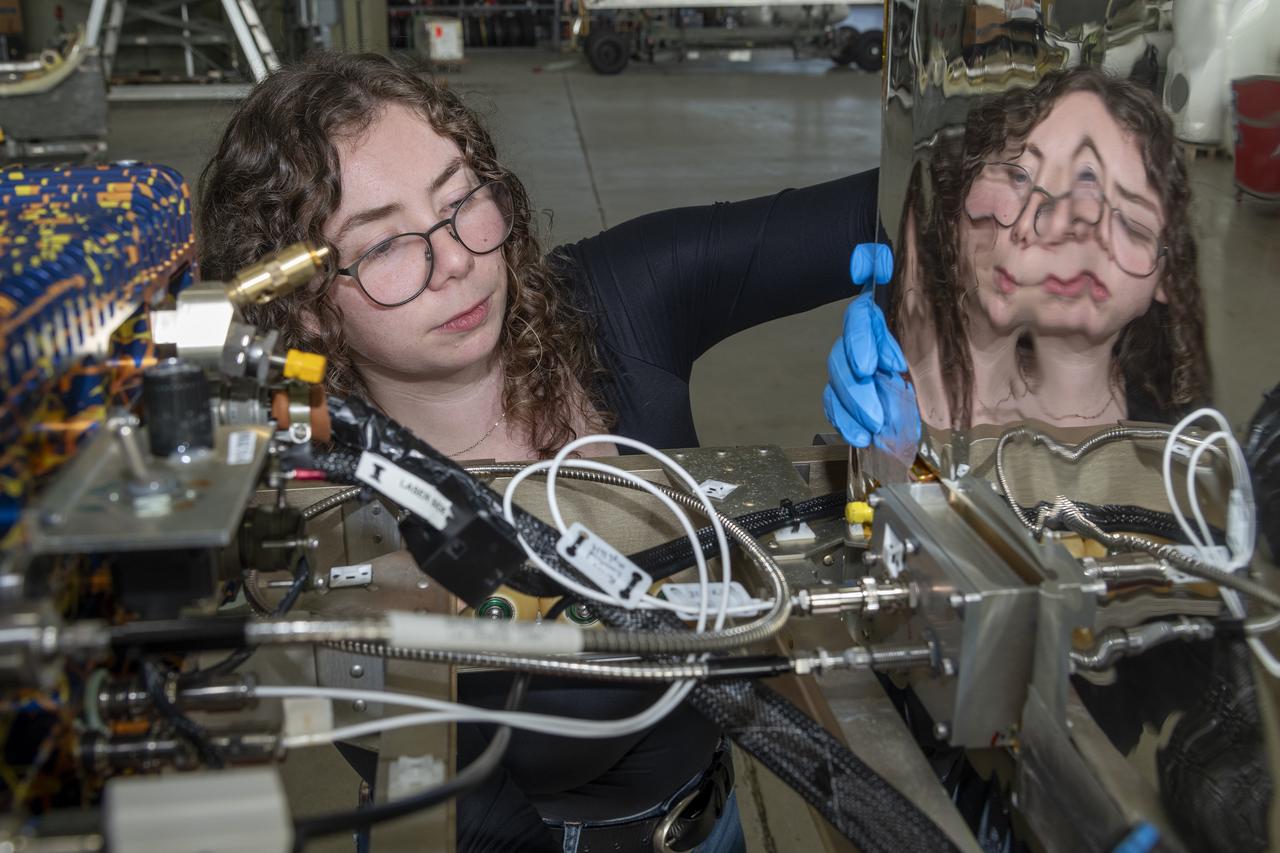
A team of experts prepares the ER-2 aircraft at Armstrong Flight Research Center in Edwards, California for the GSFC Lidar Observation and Validation Experiment (GLOVE) in February 2025. Researcher Jennifer Moore checks the cabling on the Roscoe instrument which flew at high altitudes on the ER-2. As a collaboration between engineers, scientists, and aircraft professionals, GLOVE aims to improve satellite data products for Earth Science applications.
A team of experts prepares the ER-2 aircraft at Armstrong Flight Research Center in Edwards, California for the GSFC Lidar Observation and Validation Experiment (GLOVE) in February 2025. Researcher Jennifer Moore from NASA’s Goddard Space Flight Center smiles beside the ER-2 aircraft’s forebody pod where the Cloud Physics Lidar (CPL) instrument will be installed. As a collaboration between engineers, scientists, and aircraft professionals, GLOVE aims to improve satellite data products for Earth Science applications.
A team of experts wrap up science flights on the ER-2 aircraft at Armstrong Flight Research Center in Edwards, California after the GSFC Lidar Observation and Validation Experiment (GLOVE) in February 2025. Nikolas Gibson from NASA Ames Research Center integrates the enhanced MODIS Airbrone Simulator (eMAS) instrument onto the ER-2. As a collaboration between engineers, scientists, and aircraft professionals, GLOVE aims to improve satellite data products for Earth Science applications.
A team of experts prepares the ER-2 aircraft at Armstrong Flight Research Center in Edwards, California for the GSFC Lidar Observation and Validation Experiment (GLOVE) in February 2025. Aircraft mechanic Darick Alvarez-Alonzo installs a satellite-simulating instrument which will fly at high altitudes on the ER-2 to validate satellite-borne data. As a collaboration between engineers, scientists, and aircraft professionals, GLOVE aims to improve satellite data products for Earth Science applications.
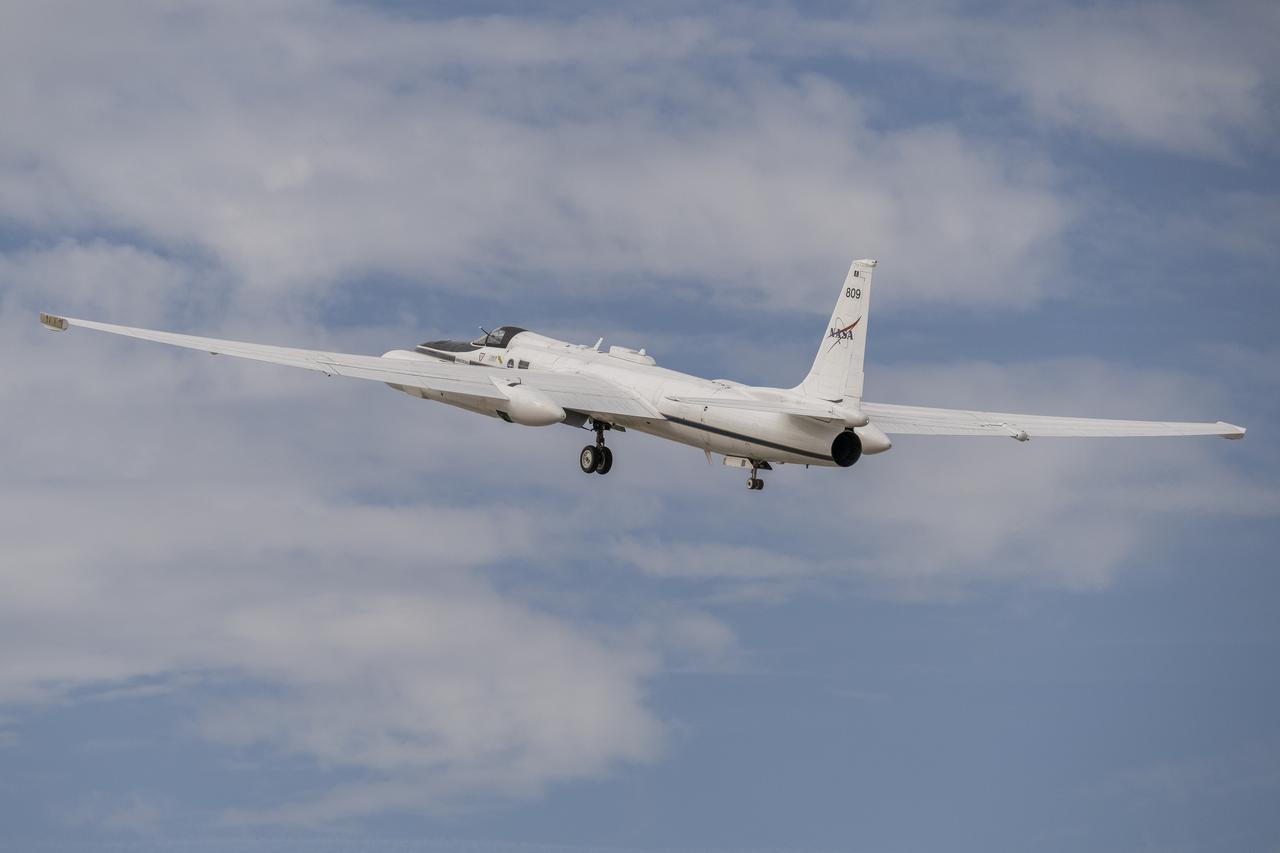
A team of experts wrap up science flights on the ER-2 aircraft at Armstrong Flight Research Center in Edwards, California after the GSFC Lidar Observation and Validation Experiment (GLOVE) in February 2025. Pilot Tim Williams ascends the ER-2 to higher skies for one of the final science flights validating satellite-borne data. As a collaboration between engineers, scientists, and aircraft professionals, GLOVE aims to improve satellite data products for Earth Science applications.
A team of experts wrap up science flights on the ER-2 aircraft at Armstrong Flight Research Center in Edwards, California after the GSFC Lidar Observation and Validation Experiment (GLOVE) in February 2025. Pilot Kirt Stallings ascends the ER-2 on the runway for one of the final science flights validating satellite-borne data. As a collaboration between engineers, scientists, and aircraft professionals, GLOVE aims to improve satellite data products for Earth Science applications.

The Polar Vortex is a whirling and persistent large area of low pressure, found typically over both north and south poles. The northern Polar Vortex is pushing southward over western Wisconsin/eastern Minnesota today, Monday, January 6, 2014 and is bringing frigid temperatures to half of the continental United States. It is expected to move northward back over Canada toward the end of the week. This image was captured by NOAA's GOES-East satellite on January 6, 2014 at 1601 UTC/11:01 a.m. EST. A frontal system that brought rain to the coast is draped from north to south along the U.S. East Coast. Behind the front lies the clearer skies bitter cold air associated with the Polar Vortex. The GOES image also revealed snow on the ground in Minnesota, Wisconsin, Illinois, Indiana, Ohio, Michigan, Iowa and Missouri, stretching into the Great Plains. Cloudiness over Texas is associated with a low pressure system centered over western Oklahoma that is part of the cold front connected to the movement of the Polar Vortex. The GOES image was created at NASA's GOES Project, located at NASA's Goddard Space Flight Center in Greenbelt, Md. Both the northern and southern polar vortices are located in the middle and upper troposphere (lowest level of the atmosphere) and the stratosphere (next level up in the atmosphere). The polar vortex is a winter phenomenon. It develops and strengthens in its respective hemisphere's winter as the sun sets over the polar region and temperatures cool. They weaken in the summer. In the northern hemisphere, they circulate in a counter-clockwise direction, so the vortex sitting over western Wisconsin is sweeping in cold Arctic air around it. The Arctic Polar Vortex peaks in the Northern Hemisphere's wintertime and has already moved southward several times this winter. In the past, it has also moved southward over Europe.On January 21, 1985, the National Oceanic and Atmospheric Administration Daily Weather Map series showed a strong polar vortex centered over Maine. The Polar Vortex also affects ozone. For more information on the Polar Vortex and how it affects ozone, visit NASA's Ozone Watch page: <a href="http://ozonewatch.gsfc.nasa.gov/facts/vortex_NH.html" rel="nofollow">ozonewatch.gsfc.nasa.gov/facts/vortex_NH.html</a> Rob Gutro NASA's Goddard Space Flight Center <b><a href="http://goes.gsfc.nasa.gov/" rel="nofollow">Credit: NOAA/NASA GOES Project</a></b> <b><a href="http://www.nasa.gov/audience/formedia/features/MP_Photo_Guidelines.html" rel="nofollow">NASA image use policy.</a></b> <b><a href="http://www.nasa.gov/centers/goddard/home/index.html" rel="nofollow">NASA Goddard Space Flight Center</a></b> enables NASA’s mission through four scientific endeavors: Earth Science, Heliophysics, Solar System Exploration, and Astrophysics. Goddard plays a leading role in NASA’s accomplishments by contributing compelling scientific knowledge to advance the Agency’s mission. <b>Follow us on <a href="http://twitter.com/NASA_GoddardPix" rel="nofollow">Twitter</a></b> <b>Like us on <a href="http://www.facebook.com/pages/Greenbelt-MD/NASA-Goddard/395013845897?ref=tsd" rel="nofollow">Facebook</a></b> <b>Find us on <a href="http://instagram.com/nasagoddard?vm=grid" rel="nofollow">Instagram</a></b>
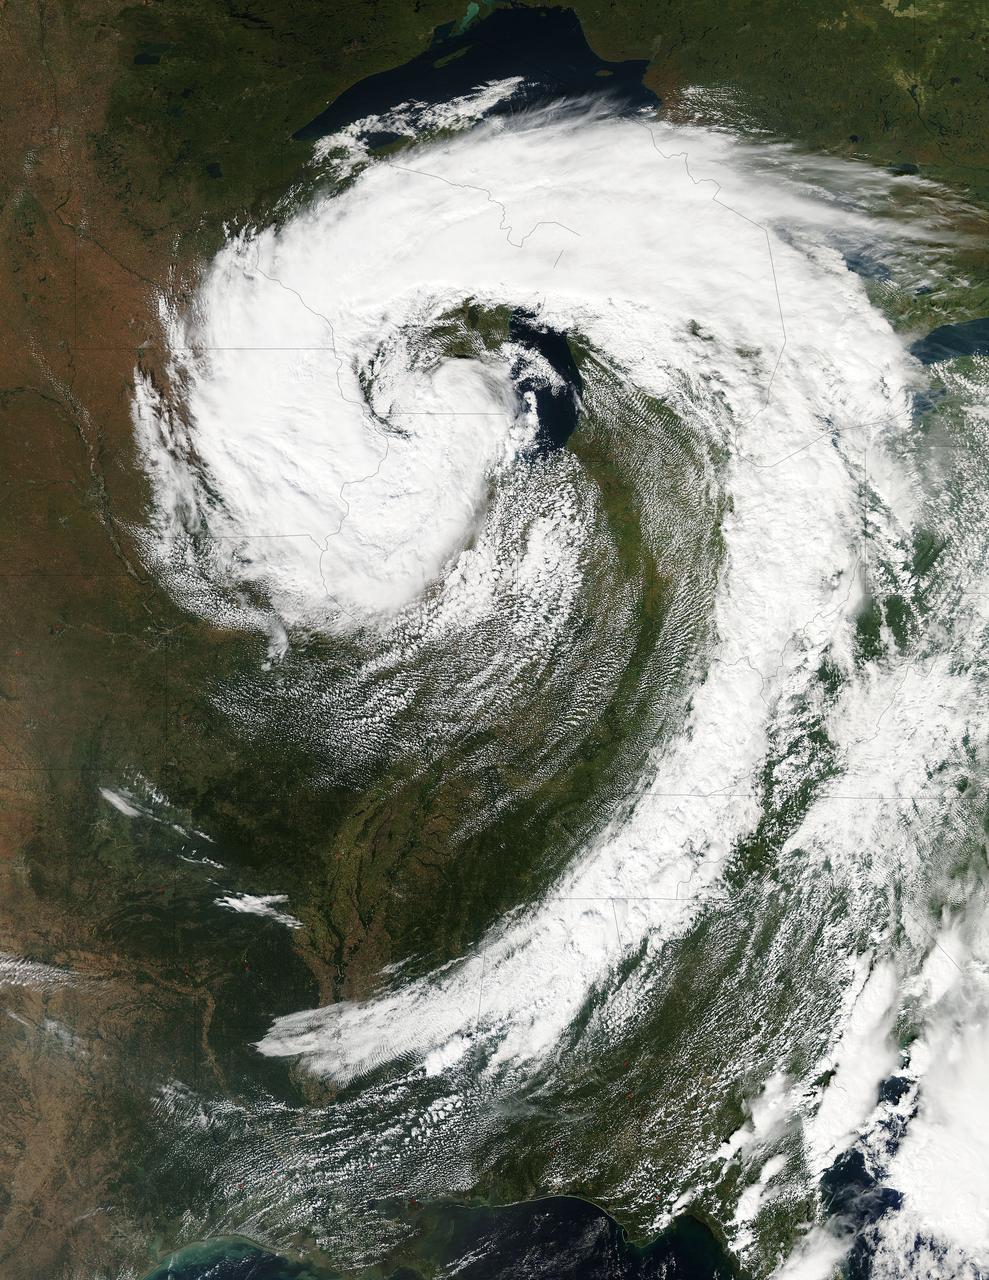
This visible image of the Great Lakes low pressure area was taken from the Moderate Resolution Imaging Spectroradiometer (MODIS) instrument on NASA's Aqua satellite. It was taken at 19:05 UTC (3:05 p.m. EDT) on Monday, Sept. 26, 2011. Credit: NASA Goddard MODIS Rapid Response Team Two Instruments on NASA's Aqua Satellite Catch the Pesky Great Lakes Low A low pressure area has been sitting over the Great Lakes region for about a week now, keeping the region and the U.S. northeast and Mid-Atlantic under cloud cover. NASA's Aqua satellite flew over head yesterday, Sept. 26, and captured two views of it from space. That low pressure area continues to spin counter-clockwise today over the Great Lakes. Its centered over northern Illinois and southeastern Wisconsin and is once again going to keep the region cloudy, cool and wet with showers. When the Aqua satellite passed overhead Monday afternoon at 3:05 p.m. EDT (Sept. 26) a detailed, clear image was captured from the Moderate Resolution Imaging Spectroradiometer (MODIS) instrument . The clouds from the low spread over Illinois, Wisconsin, parts of Iowa, northeastern Missouri, southeastern Minnesota, Michigan, Ohio, Indiana, Pennsylvania, Kentucky, Tennessee, Alabama, Mississippi, Georgia, and the northeastern and Mid-Atlantic states. A second visible image was captured by the Atmospheric Infrared Sounder (AIRS) instrument that also flies aboard NASA's Aqua satellite and showed the huge comma shape of the storm that spans the U.S. from its northern to southern borders. (seen here: <a href="http://www.flickr.com/photos/gsfc/6188946564">www.flickr.com/photos/gsfc/6188946564</a> ) According to the National Weather Service, the low will finally start moving to the east as an upper-atmospheric trough (an elongated area of low pressure) continues to strengthen and move into the upper Midwest. However, a ridge (elongated area) of high pressure will slow its move eastward, so it will be slow clearing this week in the northeastern and Mid-Atlantic U.S. Rob Gutro NASA's Goddard Space Flight Center <b><a href="http://www.nasa.gov/audience/formedia/features/MP_Photo_Guidelines.html" rel="nofollow">NASA image use policy.</a></b> <b><a href="http://www.nasa.gov/centers/goddard/home/index.html" rel="nofollow">NASA Goddard Space Flight Center</a></b> enables NASA’s mission through four scientific endeavors: Earth Science, Heliophysics, Solar System Exploration, and Astrophysics. Goddard plays a leading role in NASA’s accomplishments by contributing compelling scientific knowledge to advance the Agency’s mission. <b>Follow us on <a href="http://twitter.com/NASA_GoddardPix" rel="nofollow">Twitter</a></b> <b>Like us on <a href="http://www.facebook.com/pages/Greenbelt-MD/NASA-Goddard/395013845897?ref=tsd" rel="nofollow">Facebook</a></b> <b>Find us on <a href="http://instagrid.me/nasagoddard/?vm=grid" rel="nofollow">Instagram</a></b>
Lightning Strikes at Saturn
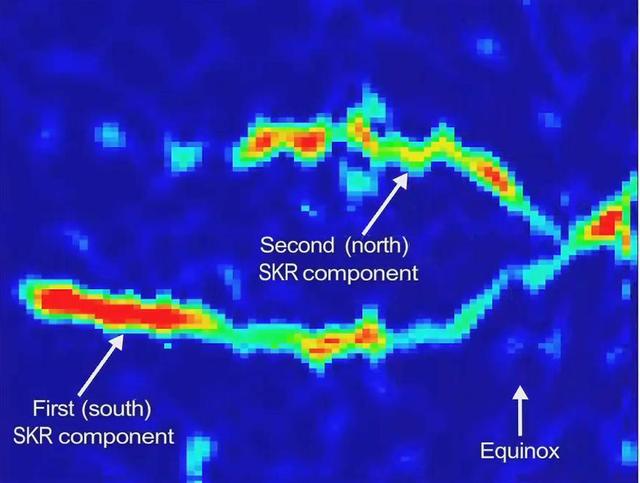
Saturn Radio Period Crossover
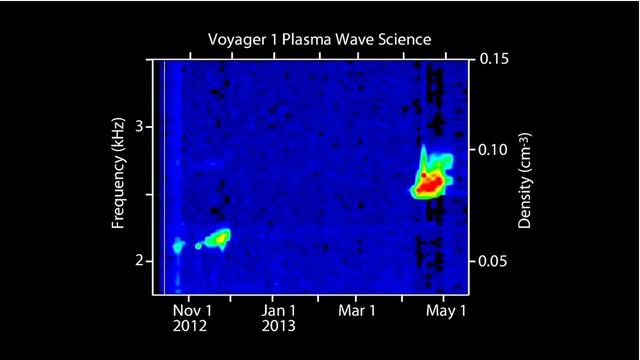
This visual represents sounds captured of interstellar space by NASA Voyager 1 spacecraft. Voyager 1 plasma wave instrument detected the vibrations of dense interstellar plasma.
NASA Spitzer Space Telescope was able to show that a tandard candle used to measure cosmological distances is shrinking, a finding that affects precise measurements of the age, size and expansion rate of our universe.
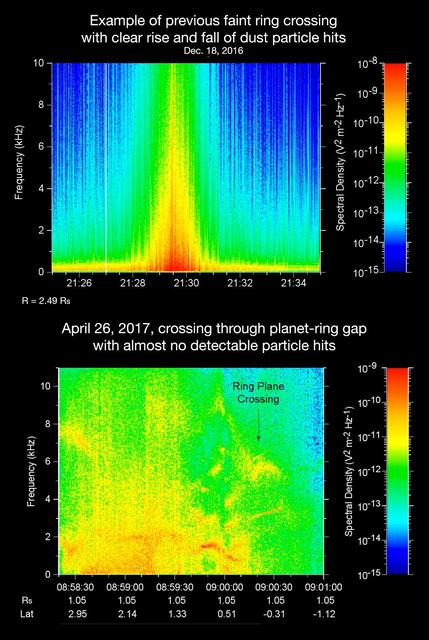
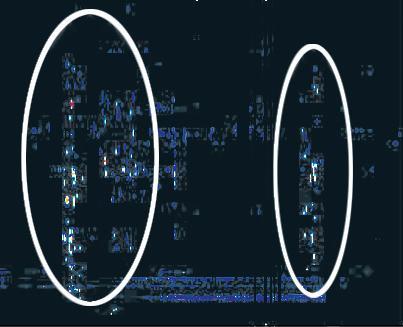
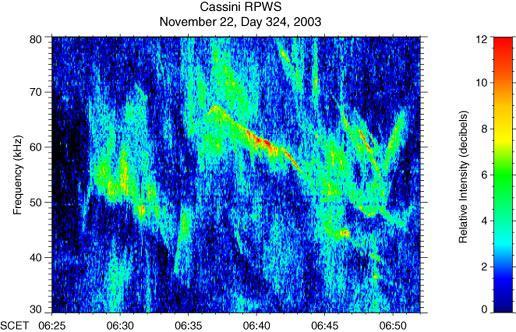
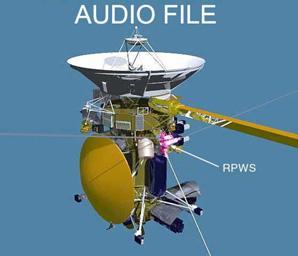
The sounds and spectrograms in these two videos represent data collected by the Radio and Plasma Wave Science, or RPWS, instrument on NASA's Cassini spacecraft, as it crossed the plane of Saturn's rings on two separate orbits. As tiny, dust-sized particles strike Cassini and the three 33-foot-long (10-meter-long), RPWS antennas, the particles are vaporized into tiny clouds of plasma, or electrically excited gas. These tiny explosions make a small electrical signal (a voltage impulse) that RPWS can detect. Researchers on the RPWS team convert the data into visible and audio formats, like those seen here, for analysis. Ring particle hits sound like pops and cracks in the audio. The first video (top image in the montage) was made using RPWS data from a ring plane crossing on Dec. 18, 2016, when the spacecraft passed through the faint, dusty Janus-Epimetheus ring (see PIA08328 for an image that features this ring). This was during Cassini's 253rd orbit of Saturn, known as Rev 253. As is typical for this sort of ring crossing, the number of audible pops and cracks rises to a maximum around the time of a ring crossing and trails off afterward. The peak of the ring density is obvious in the colored display at the red spike. The second video (bottom image in the montage) was made using data RPWS collected as Cassini made the first dive through the gap between Saturn and its rings as part of the mission's Grand Finale, on April 26, 2017. Very few pops and cracks are audible in this data at all. In comparing the two data sets, it is apparent that while Cassini detected many ring-particles striking Cassini when passing through the Janus-Epimetheus ring, the first Grand Finale crossing -- in stark contrast -- was nearly particle free. The unexpected finding that the gap is so empty is a new mystery that scientists are eager to understand. On April 26, 2017, Cassini dove through the previously unexplored ring-planet gap at speeds approaching 75,000 mph (121,000 kph), using its large, dish-shaped high-gain antenna (or HGA) as a shield to protect the rest of the spacecraft and its instruments from potential impacts by small, icy ring particles. Two of Cassini's instruments, the magnetometer and RPWS, extend beyond the protective antenna dish, and were exposed to the particle environment during the dive. The Cassini team used this data from RPWS, along with inputs from other components on the spacecraft, to make the decision of whether the HGA would be needed as a shield on most future Grand Finale dives through the planet-ring gap. Based on these inputs the team determined this protective measure would not be needed, allowing the team's preferred mode of science operations to proceed, with Cassini able to point its science instruments in any direction necessary to obtain scientists' desired observations. (Four of the 21 remaining dives pass through the inner D ring. The mission had already planned to use the HGA as a shield for those passes.) The colors on the spectrogram indicate the emitted power of the radio waves, with red as the most powerful. Time is on the x-axis, and frequency of the radio waves is on the y-axis. The audible whistle in the April 26 data, just before ring plane crossing, is due to a type of plasma wave that will be the subject of further study. In addition, there is an abrupt change beginning at the 09:00:00 mark on the spectrogram that represents a change in the RPWS antenna's operational configuration (from monopole mode to dipole mode). The videos can be viewed at https://photojournal.jpl.nasa.gov/catalog/PIA21446
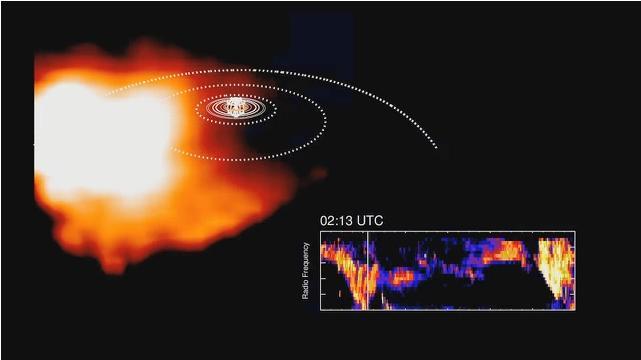
This frame from an animation, derived from data obtained by NASA Cassini spacecraft, shows how plasma swirling around Saturn is correlated to bursts of radio waves emanating from the planet.

During its close flyby of Earth, NASA Jupiter-bound Juno spacecraft listened for a coordinated, global transmission from amateur radio operators using its radio and plasma wave science instrument, known as Waves.
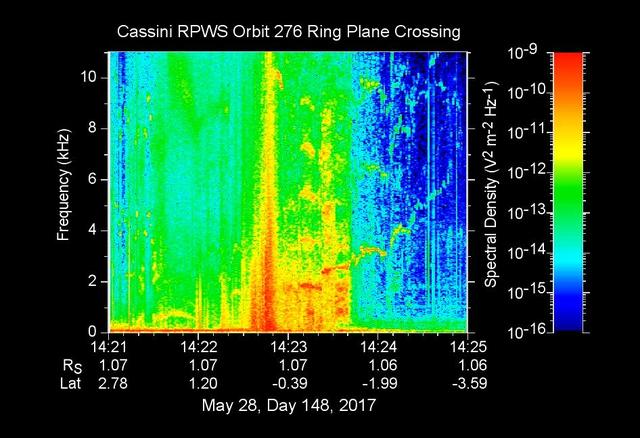
The sounds and colorful spectrogram in this still image and video represent data collected by the Radio and Plasma Wave Science, or RPWS, instrument on NASA's Cassini spacecraft, as it crossed through Saturn's D ring on May 28, 2017. This was the first of four passes through the inner edge of the D ring during the 22 orbits of Cassini's final mission phase, called the Grand Finale. During this ring plane crossing, the spacecraft was oriented so that its large high-gain antenna was used as a shield to protect more sensitive components from possible ring-particle impacts. The three 33-foot-long (10-meter-long) RPWS antennas were exposed to the particle environment during the pass. As tiny, dust-sized particles strike Cassini and the RPWS antennas, the particles are vaporized into tiny clouds of plasma, or electrically excited gas. These tiny explosions make a small electrical signal (a voltage impulse) that RPWS can detect. Researchers on the RPWS team convert the data into visible and audio formats, some like those seen here, for analysis. Ring particle hits sound like pops and cracks in the audio. Particle impacts are seen to increase in frequency in the spectrogram and in the audible pops around the time of ring crossing as indicated by the red/orange spike just before 14:23 on the x-axis. Labels on the x-axis indicate time (top line), distance from the planet's center in Saturn radii, or Rs (middle), and latitude on Saturn beneath the spacecraft (bottom). These data can be compared to those recorded during Cassini's first dive through the gap between Saturn and the D ring, on April 26. While it appeared from those earlier data that there were essentially no particles in the gap, scientists later determined the particles there are merely too small to create a voltage detectable by RPWS, but could be detected using Cassini's dust analyzer instrument. After ring plane crossing (about 14:23 onward) a series of high pitched whistles are heard. The RPWS instrument detects such tones during each of the Grand Finale orbits and the team is working to understand their source. The D ring proved to contain larger ring particles, as expected and recorded here, although the environment was determined to be relatively benign -- with less dust than other faint Saturnian rings Cassini has flown through. https://photojournal.jpl.nasa.gov/catalog/PIA21620
This frame from an animation based on data obtained by NASA Cassini spacecraft shows how the explosions of hot plasma on the night side orange and white periodically inflate Saturn magnetic field white lines.
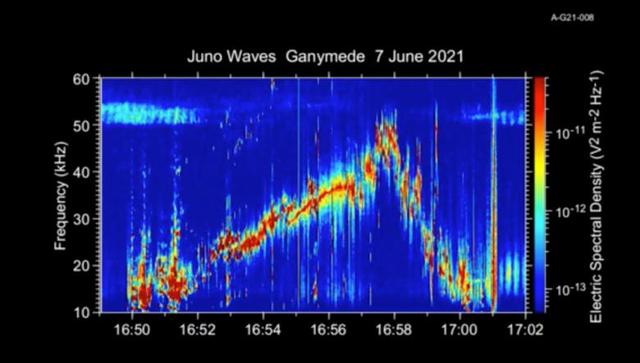
This 50-second animation provides an auditory as well as visual glimpse at data collected by Juno's Waves instrument as the spacecraft flew past the Jovian moon Ganymede on June 7, 2021. The abrupt change to higher frequencies around the midpoint of the recording represents the spacecraft's move from one region of Ganymede's magnetosphere to another. The audio track is made by shifting the frequency of those emissions – which range from 10 to 50 kHz – into the lower audio range. The animation is shorter than the duration of Juno's flyby because the Waves data is edited onboard to reduce telemetry requirements. Movie available at https://photojournal.jpl.nasa.gov/catalog/PIA25030
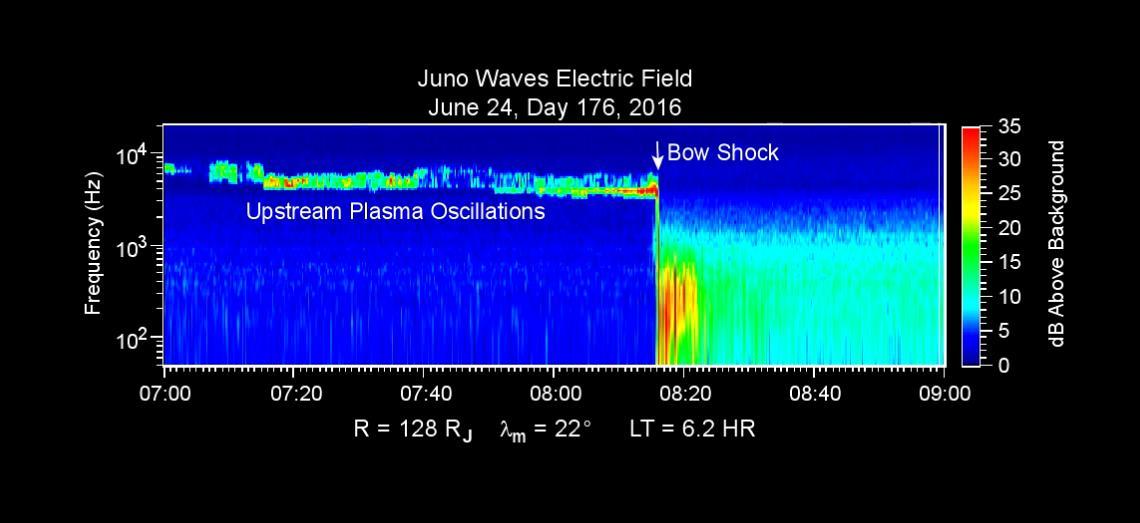
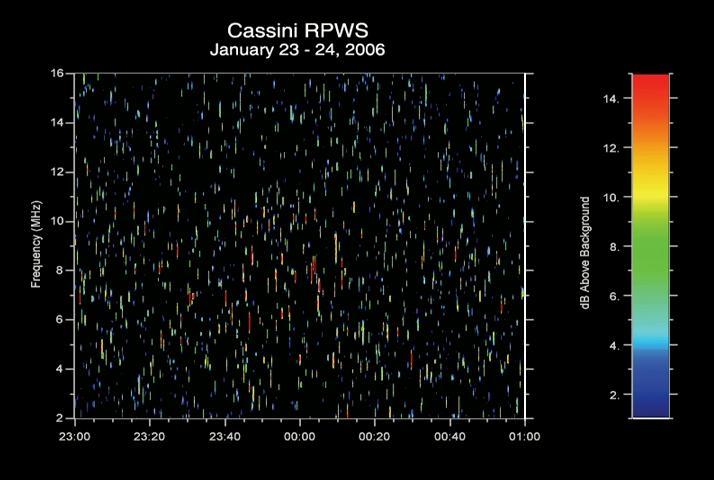
This chart presents data that the Waves investigation on NASA's Juno spacecraft recorded as the spacecraft crossed the bow shock just outside of Jupiter's magnetosphere on June 24, 2016, while approaching Jupiter. Audio accompanies the animation, with volume and pitch correlated to the amplitude and frequency of the recorded waves. The graph is a frequency-time spectrogram with color coding to indicate wave amplitudes as a function of wave frequency (vertical axis, in hertz) and time (horizontal axis, with a total elapsed time of two hours). During the hour before Juno reached the bow shock, the Waves instrument was detecting mainly plasma oscillations just below 10,000 hertz (10 kilohertz). The frequency of these oscillations is related to the local density of electrons; the data yield an estimate of approximately one electron per cubic centimeter (about 16 per cubic inch) in this region just outside Jupiter's bow shock. The broadband burst of noise marked "Bow Shock" is the region of turbulence where the supersonic solar wind is heated and slowed by encountering the Jovian magnetosphere. The shock is analogous to a sonic boom generated in Earth's atmosphere by a supersonic aircraft. The region after the shock is called the magnetosheath. The vertical bar to the right of the chart indicates the color coding of wave amplitude, in decibels (dB) above the background level detected by the Waves instrument. Each step of 10 decibels marks a tenfold increase in wave power. When Juno collected these data, the distance from the spacecraft to Jupiter was about 5.56 million miles (8.95 million kilometers), indicated on the chart as 128 times the radius of Jupiter. Jupiter's magnetic field is tilted about 10 degrees from the planet's axis of rotation. The note of 22 degrees on the chart indicates that at the time these data were recorded, the spacecraft was 22 degrees north of the magnetic-field equator. The "LT" notation is local time on Jupiter at the longitude of the planet directly below the spacecraft, with a value of 6.2 indicating approximately dawn. http://photojournal.jpl.nasa.gov/catalog/PIA20753
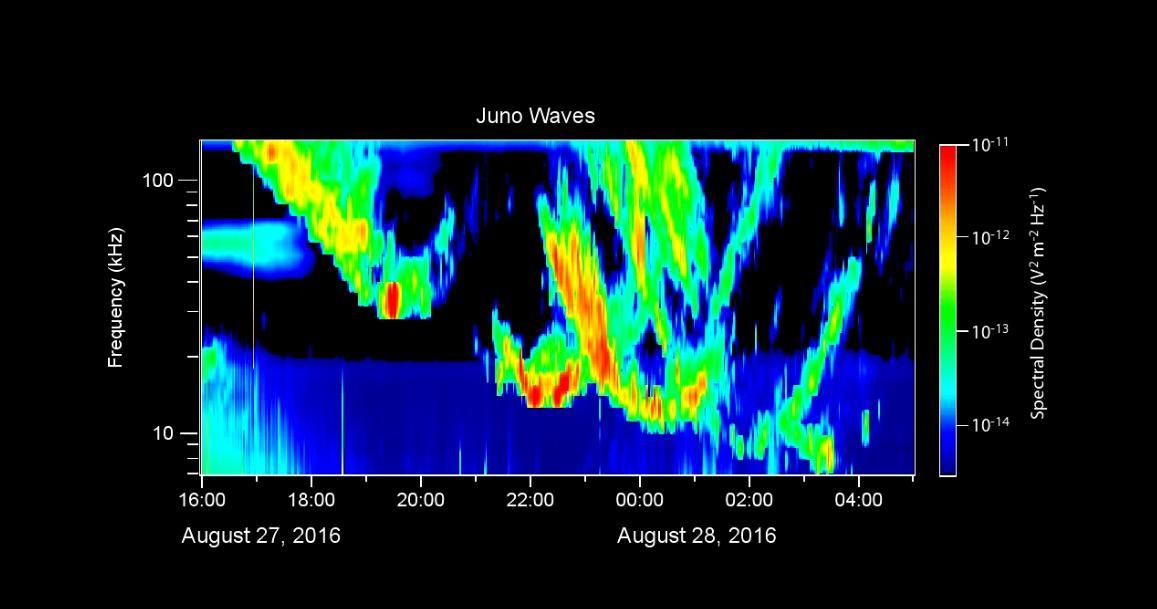
During its close flyby of Jupiter on August 27, 2016, the Waves instrument on NASA's Juno spacecraft received radio signals associated with the giant planet's very intense auroras. This video displays these radio emissions in a format similar to a voiceprint, showing the intensity of radio waves as a function of frequency and time. The largest intensities are indicated in warmer colors. The frequency range of these signals is from 7 to 140 kilohertz. Radio astronomers call these "kilometric emissions" because their wavelengths are about a kilometer long. The time span of this data is 13 hours, beginning shortly after Juno's closest approach to Jupiter. Accompanying this data display is an audio rendition of the radio emissions, shifted into a lower register since the radio waves are well above the audio frequency range. In the video, a cursor moves from left to right to mark the time as the sounds are heard. These radio emissions were among the first observed by early radio astronomers in the 1950s. However, until now, they had not been observed from closely above the auroras themselves. From its polar orbit vantage point, Juno has -- for the first time -- enabled observations of these emissions from very close range. The Juno team believes that Juno flew directly through the source regions for some of these emissions during this flyby, which was Juno's first with its sensors actively collecting data. A movie is available at http://photojournal.jpl.nasa.gov/catalog/PIA21037
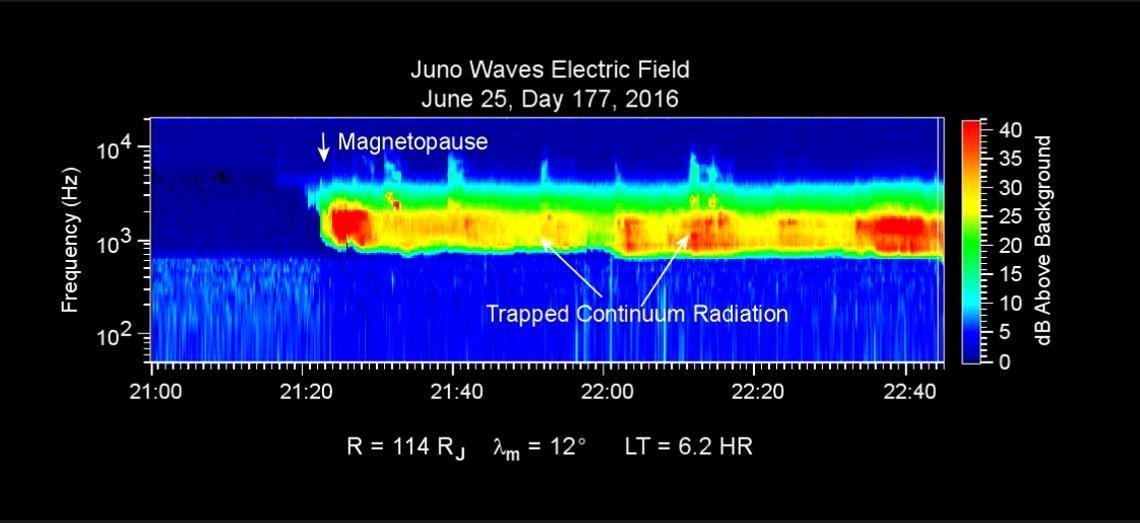
This chart presents data that the Waves investigation on NASA's Juno spacecraft recorded as the spacecraft crossed the bow shock just outside of Jupiter's magnetosphere on June 24, 2016, while approaching Jupiter. Audio accompanies the animation, with volume and pitch correlated to the amplitude and frequency of the recorded waves. The graph is a frequency-time spectrogram with color coding to indicate wave amplitudes as a function of wave frequency (vertical axis, in hertz) and time (horizontal axis, with a total elapsed time of two hours). During the hour before Juno reached the bow shock, the Waves instrument was detecting mainly plasma oscillations just below 10,000 hertz (10 kilohertz). The frequency of these oscillations is related to the local density of electrons; the data yield an estimate of approximately one electron per cubic centimeter (about 16 per cubic inch) in this region just outside Jupiter's bow shock. The broadband burst of noise marked "Bow Shock" is the region of turbulence where the supersonic solar wind is heated and slowed by encountering the Jovian magnetosphere. The shock is analogous to a sonic boom generated in Earth's atmosphere by a supersonic aircraft. The region after the shock is called the magnetosheath. The vertical bar to the right of the chart indicates the color coding of wave amplitude, in decibels (dB) above the background level detected by the Waves instrument. Each step of 10 decibels marks a tenfold increase in wave power. When Juno collected these data, the distance from the spacecraft to Jupiter was about 5.56 million miles (8.95 million kilometers), indicated on the chart as 128 times the radius of Jupiter. Jupiter's magnetic field is tilted about 10 degrees from the planet's axis of rotation. The note of 22 degrees on the chart indicates that at the time these data were recorded, the spacecraft was 22 degrees north of the magnetic-field equator. The "LT" notation is local time on Jupiter at the longitude of the planet directly below the spacecraft, with a value of 6.2 indicating approximately dawn. http://photojournal.jpl.nasa.gov/catalog/PIA20753

These spectrograms from the MARSIS instrument on the European Space Agency Mars Express orbiter show the intensity of radar echo in Mars far-northern ionosphere at three times on Oct. 19 and 20, 2014.
This image from NASA Cassini spacecraft, the first of its kind, shows lightning on Saturn night side flashing in a cloud that is illuminated by light from Saturn rings.
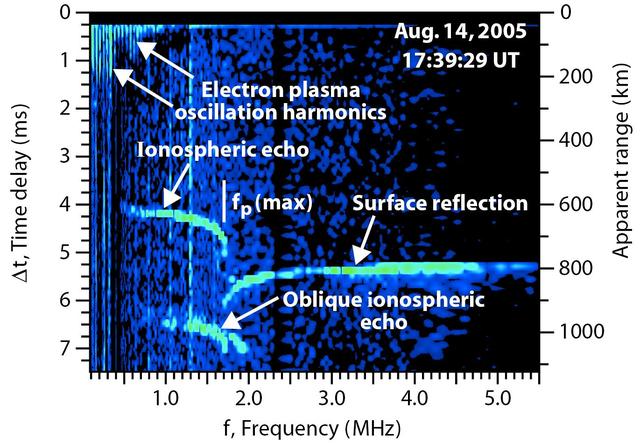
Radar Ionogram with Oblique Ionospheric Echo

These plots portray data from radar sounding of Mars mid-latitude ionosphere at three times on Oct. 19 and 20, 2014. The data are from the MARSIS instrument on the European Space Agency Mars Express orbiter.