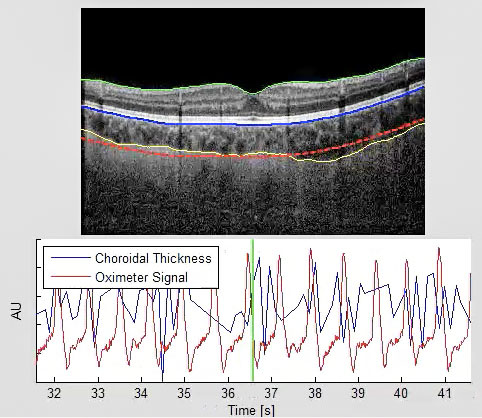
jsc2022e004236 (1/28/2022) --- A Optical coherence tomography (OCT) image of the posterior segement of the eye (top), and chorioidal thickness and oximeter signal time series (bottom). At the top, segmentation lines depict the boundaries of the retina in green and blue. The red colored line shows the mean distance between the retina and the outer limit of the choroid (in yellow) which corresponds to choroidal thickness. At the bottom, the variation in choroidal thickness and the heart rate over time are shown. Space Flight-Associated Neuro-Ocular Syndrome Ocular Rigidity Investigation (SANSORI) investigates whether stiffness of the eye, called ocular rigidity, contributes to development of Space Flight-Associated Neuro-Ocular Syndrome (SANS). Image courtesy University of Montreal