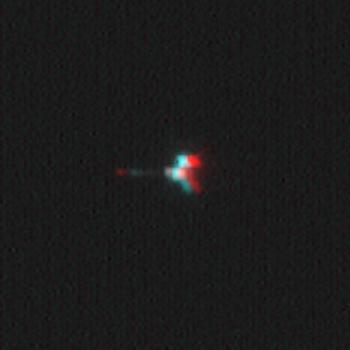
This stereoscopic picture of NASA Mars Odyssey spacecraft was created from two views of that spacecraft taken by the Mars Orbiter Camera on NASA Mars Global Surveyor. 3D glasses are necessary to view this image.
NASA Mars Odyssey spacecraft appears twice in the same frame in this image from the Mars Orbiter Camera aboard NASA Mars Global Surveyor.
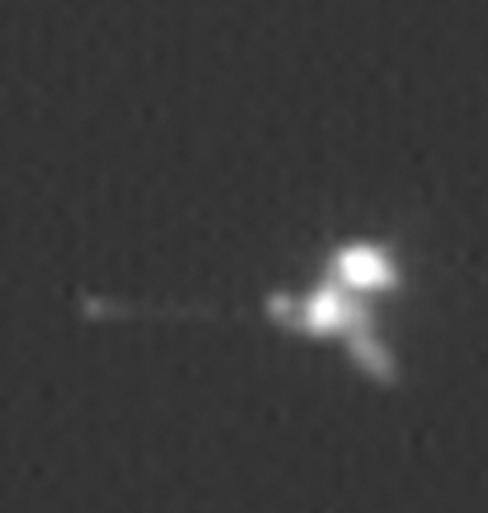
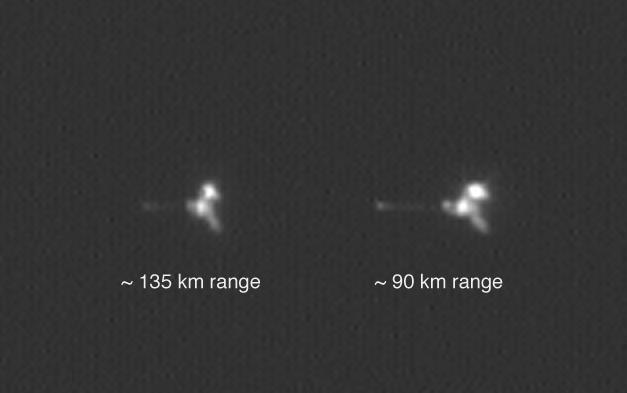
This view is an enlargement of an image of NASA Mars Odyssey spacecraft taken by the Mars Orbiter Camera aboard NASA Mars Global Surveyor while the two spacecraft were about 90 kilometers 56 miles apart.
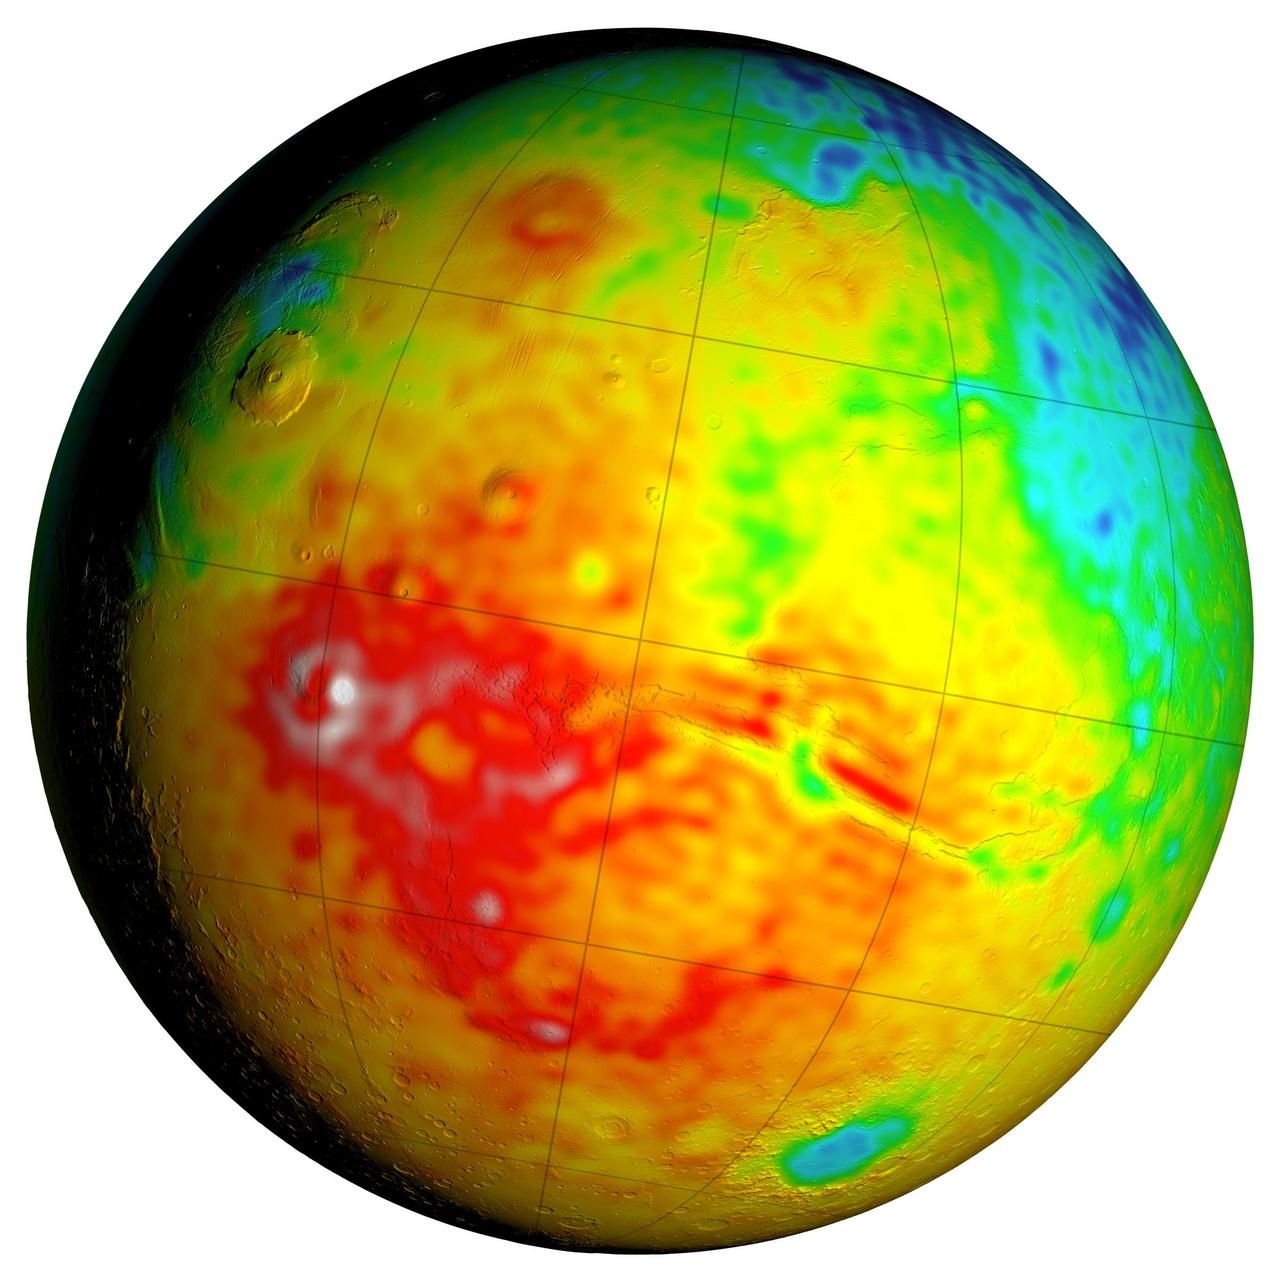
This Mars map shows variations in thickness of the planet crust, the relatively thin surface layer over the interior mantle of the planet. It shows unprecedented detail derived from new mapping of variations in Mars gravitational pull on orbiters.
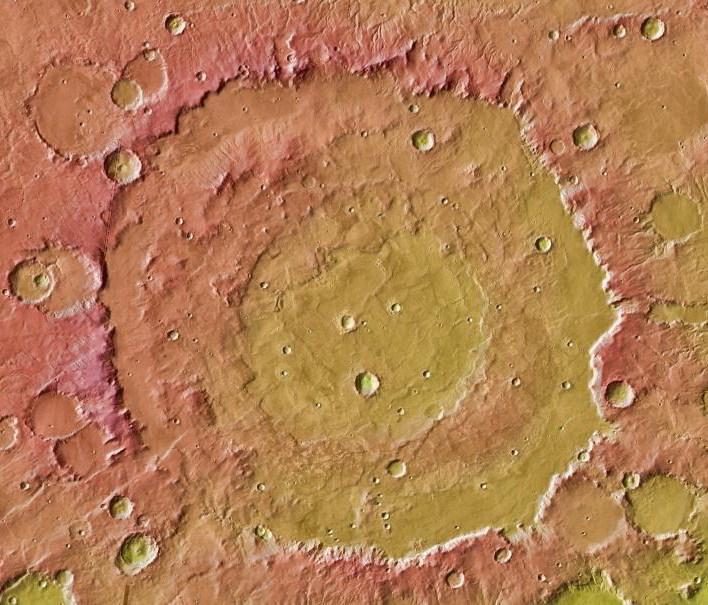
This image from NASA Mars Global Surveyor and Mars Odyssey spacecraft shows the context for orbital observations of exposed rocks that had been buried on Mars. The area is dominated by the Huygens crater, which is about the size of Wisconsin.
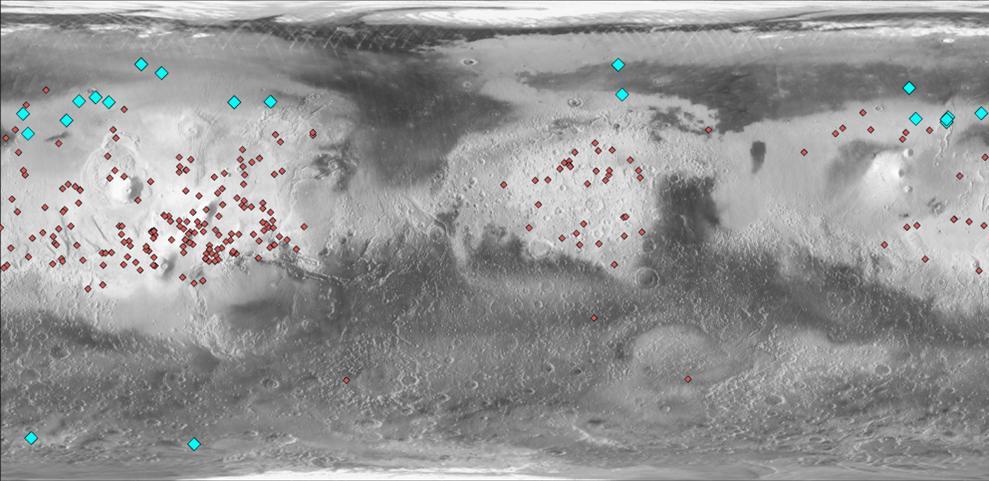
This map of Mars indicates locations of new craters that have excavated ice blue and those that have not red. Albedo information comes from NASA Mars Odyssey orbiter, and the map comes from NASA Mars Global Surveyor orbiter.
This pair of maps based on albedo information from NASA Mars Odyssey orbiter and topographical information from NASA Mars Global Surveyor orbiter indicates locations of confirmed sites of recurrent slope linea on Mars.
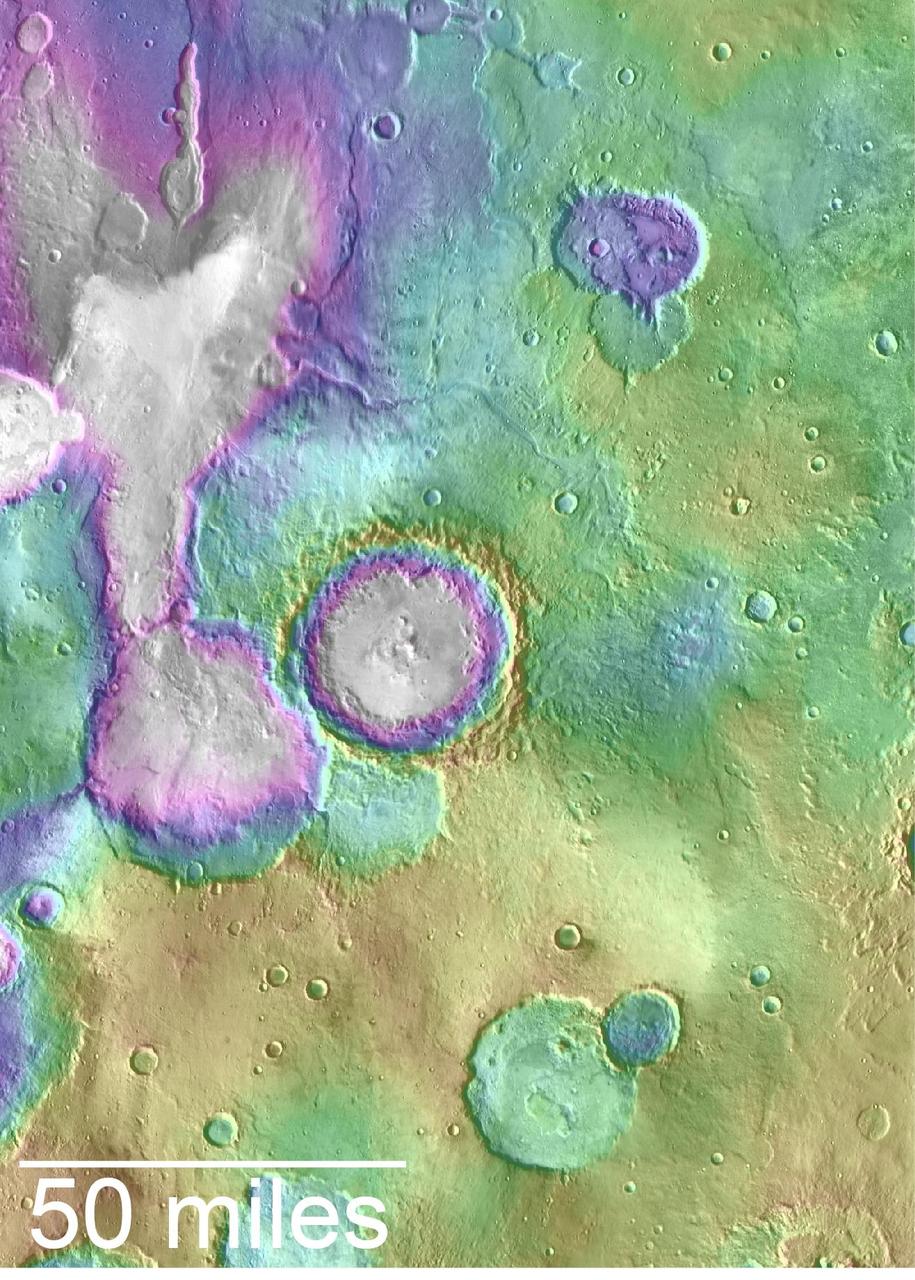
Valleys younger than better-known ancient valley networks on Mars are evident on the landscape in the northern Arabia Terra region of Mars, particularly in the area mapped here with color-coded topographical information overlaid onto a photo mosaic. The area includes a basin informally named "Heart Lake" at upper left (northwest). Data from the Mars Orbiter Laser Altimeter (MOLA) on NASA's Mars Global Surveyor orbiter are coded here as white and purple for lower elevations, yellow for higher elevation. The elevation information is combined with a mosaic of images from the Thermal Emission Imaging System (THEMIS) camera on NASA's Mars Odyssey orbiter, covering an area about 120 miles (about 190 kilometers) wide. The mapped area is centered near 35.91 degrees north latitude, 1 degree east longitude on Mars. These lakes and streams held water several hundred million years after better-known ancient lake environments on Mars, according to 2016 findings. http://photojournal.jpl.nasa.gov/catalog/PIA20838
Mars Ice Age, Simulated
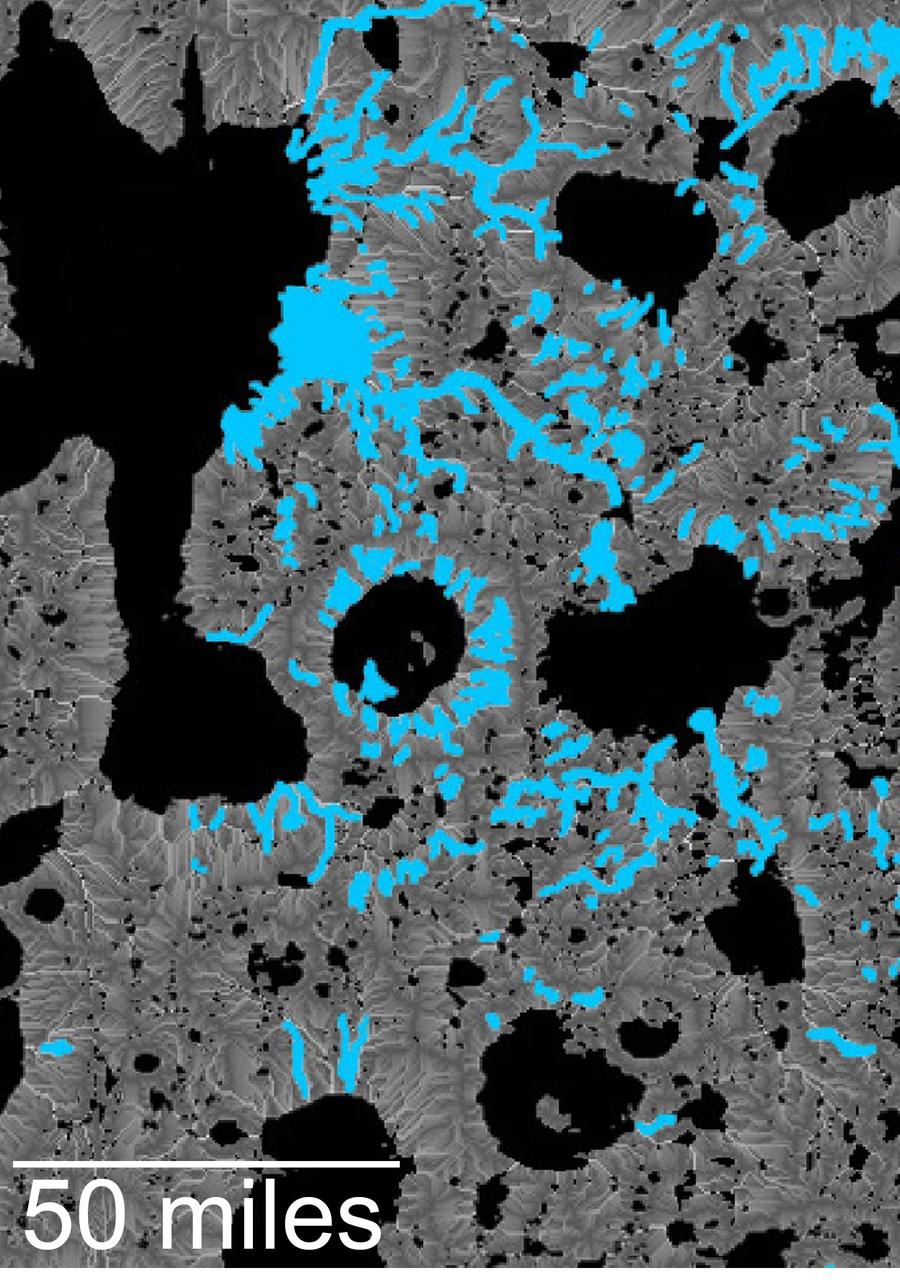
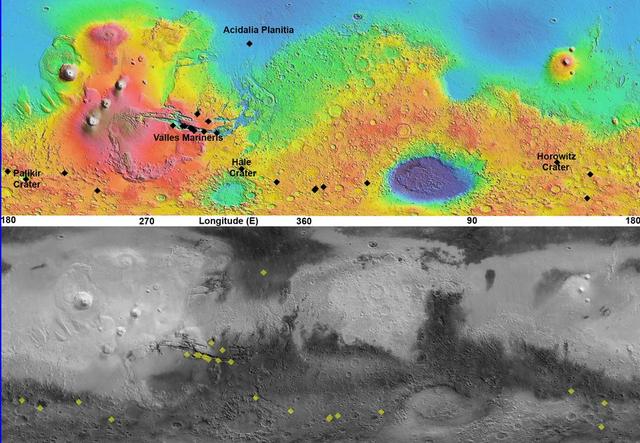
This map of an area within the Arabia Terra region on Mars shows where hydrologic modeling predicts locations of depressions that would have been lakes (black), overlaid with a map of the preserved valleys (blue lines, with width exaggerated for recognition) that would have been streams. The area today holds numerous features called "fresh shallow valleys." Research findings in 2016 interpret the fresh shallow valleys as evidence for flows of liquid water that occurred several hundred million years -- up to about a billion years -- after the ancient lakes and streams previously documented on Mars. Most of the fresh shallow valleys in this northern portion of Arabia Terra terminate at the margins of model-predicted submerged basins, consistent with an interpretation of flows into lakes and out of lakes. Some valley segments connect to form longer systems, consistent with connections forged by flowing water between interspersed lakes. In the area mapped here, for example, valleys connect basin "A" to basin "B," and basin B to "Heart Lake," each lower in elevation in that chain. http://photojournal.jpl.nasa.gov/catalog/PIA20839
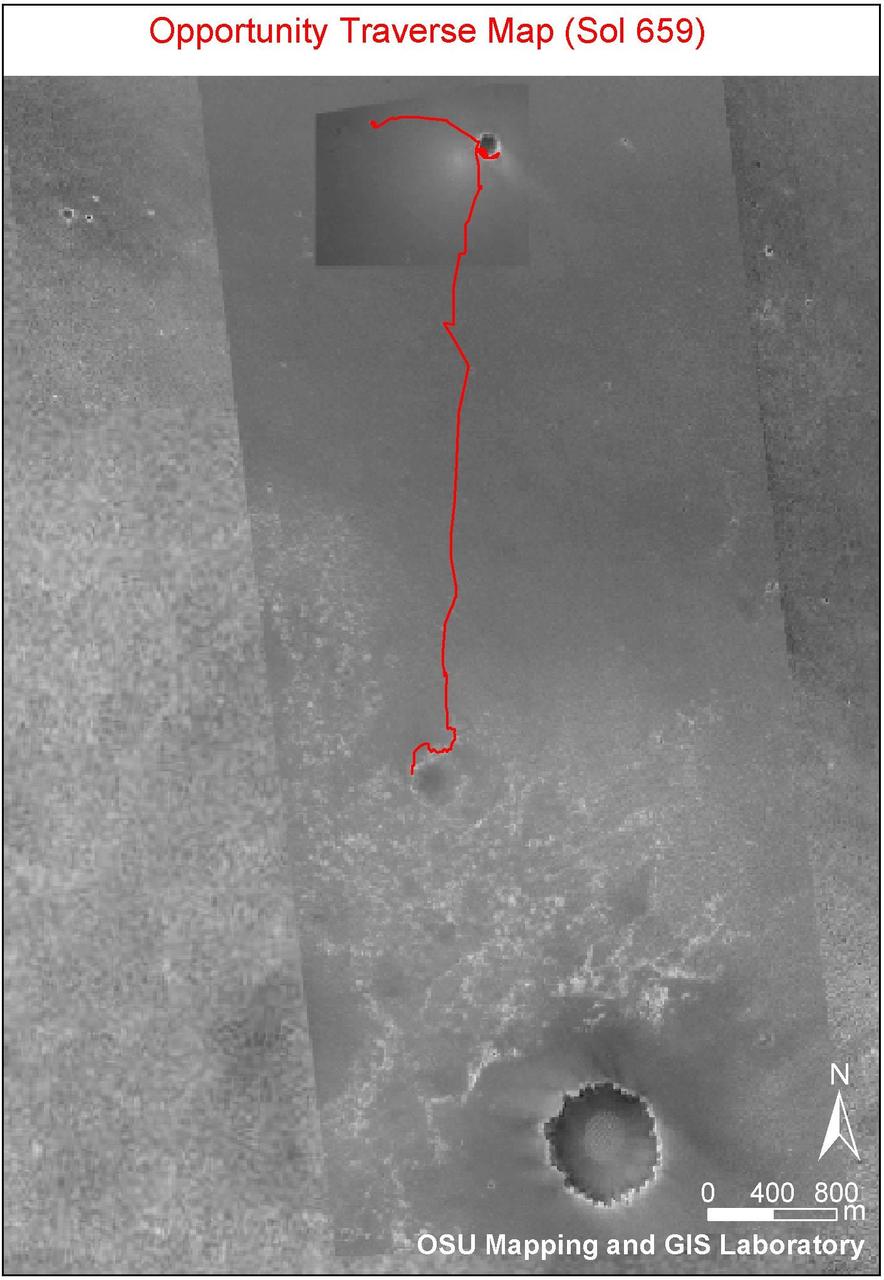
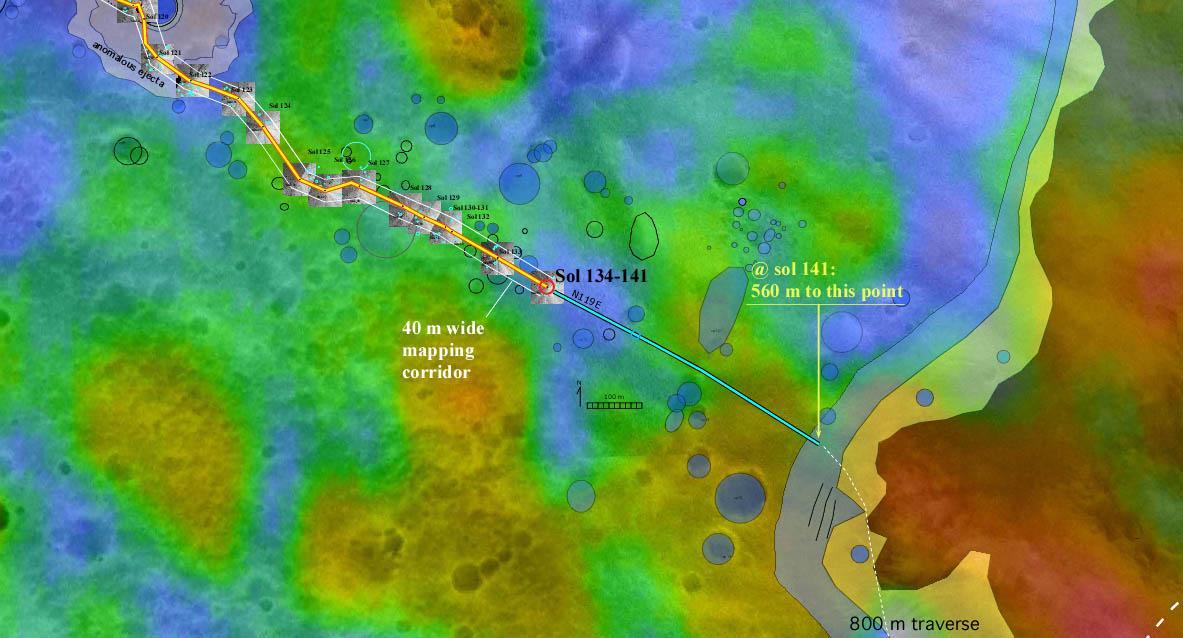
Partway to Victoria
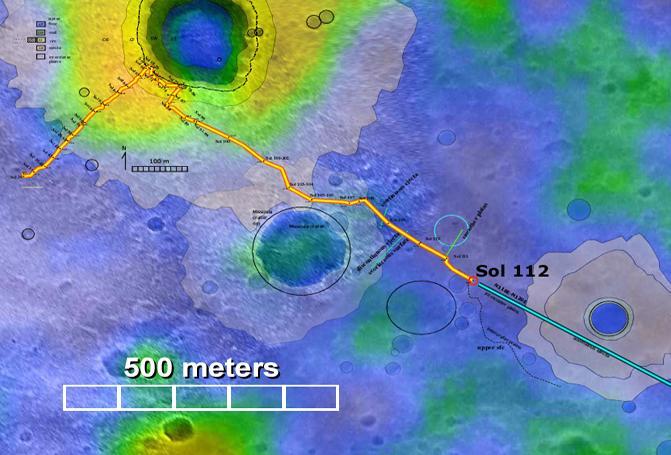
Confirming Predictions
Spirit Traverse Map
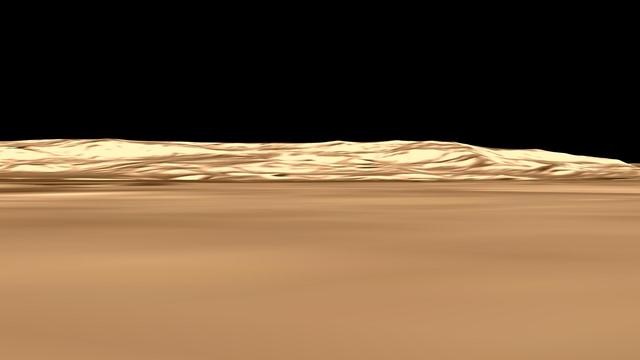
Maadim Vallis From the Top
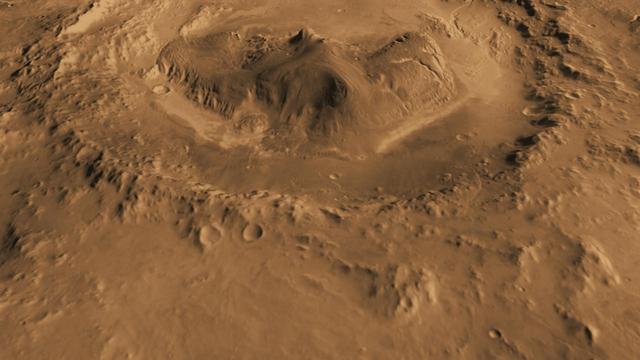
This computer-generated view based on multiple orbital observations shows Mars Gale crater. NASA is considering Gale as a possible landing site for the Mars Science Laboratory mission.
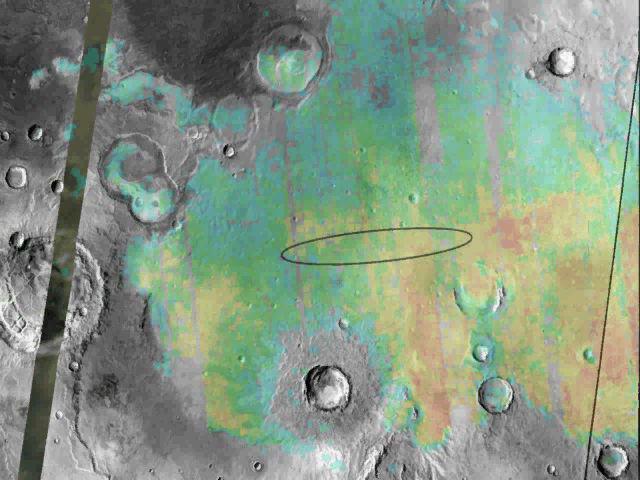
Targeting a Hematite-rich Terrain
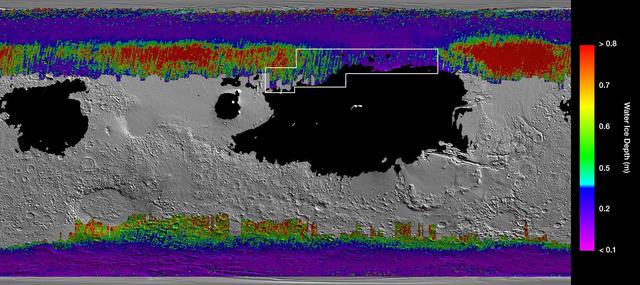
This rainbow-colored map shows underground water ice on Mars. Cool colors represent less than one foot (30 centimeters) below the surface; warm colors are over two feet (60 centimeters) deep. Sprawling black zones on the map represent areas where a landing spacecraft would sink into fine dust. The outlined box represents the ideal region to send astronauts for them to be able to dig up water ice. The map was created by combining data from multiple NASA orbiters, including the Mars Reconnaissance Orbiter and its Mars Climate Sounder instrument; Mars Odyssey and its Thermal Emission Imaging System; and the Mars Global Surveyor. https://photojournal.jpl.nasa.gov/catalog/PIA23514

Spirit Express Route to Columbia Hills
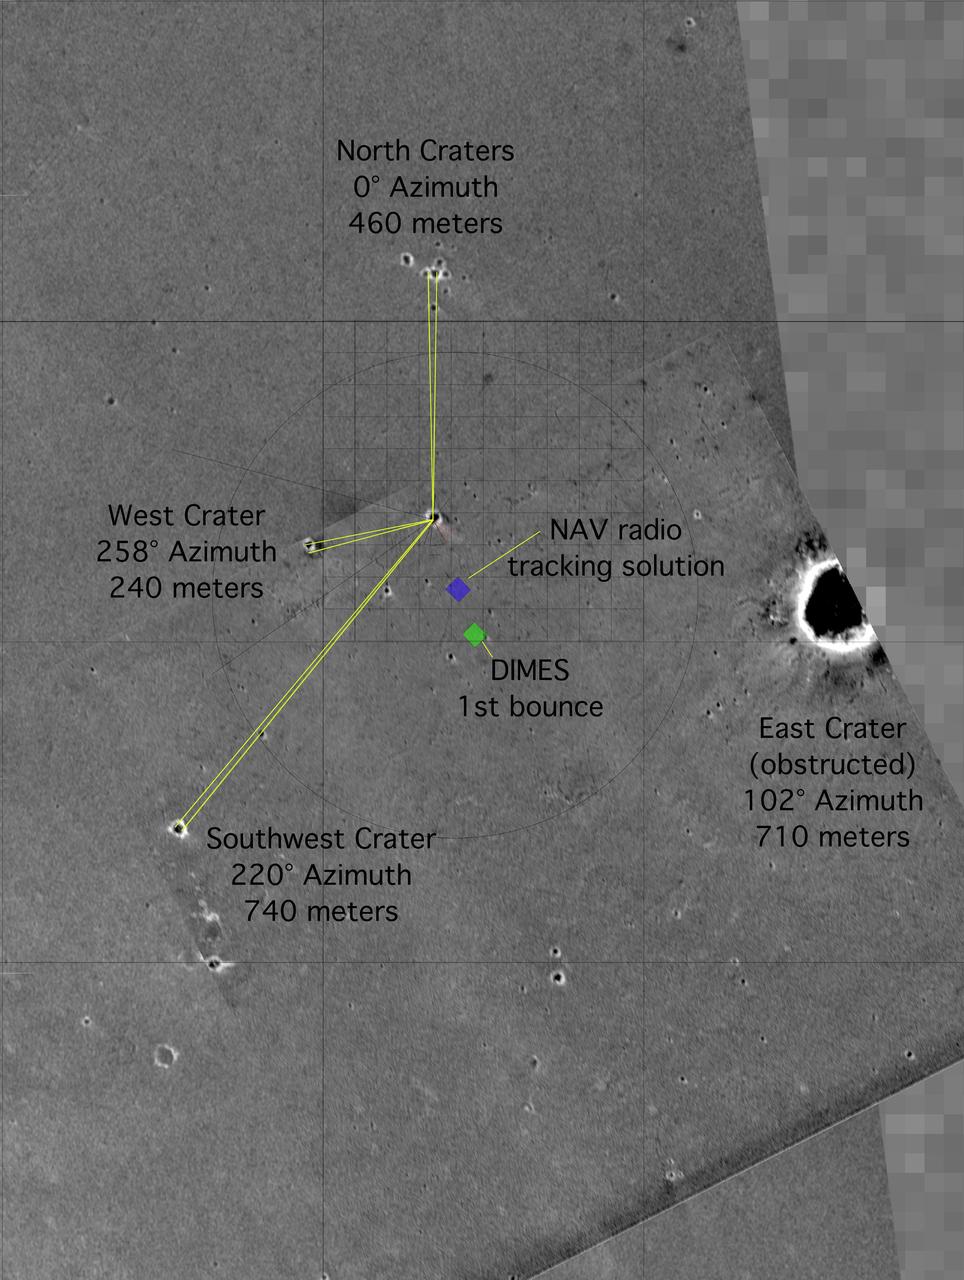
X Marks the Spot
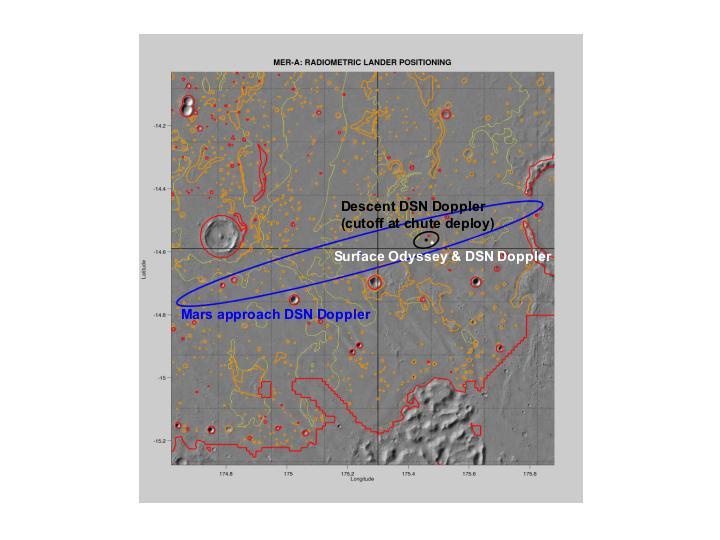
Right on Target
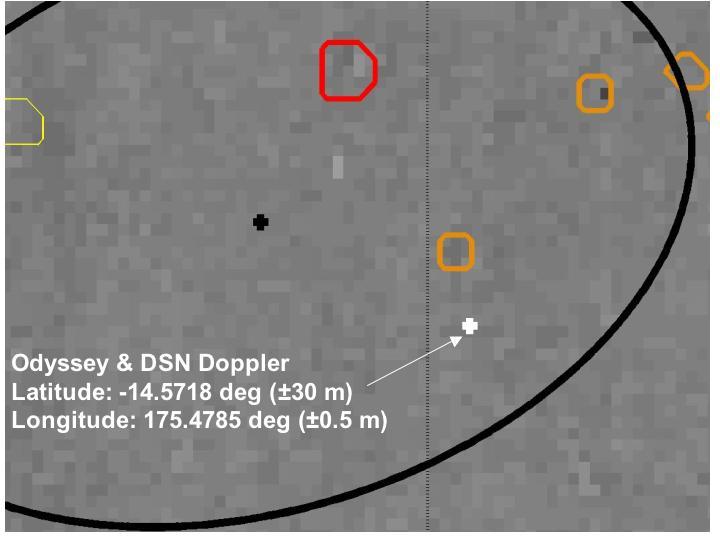
Right on Target-2
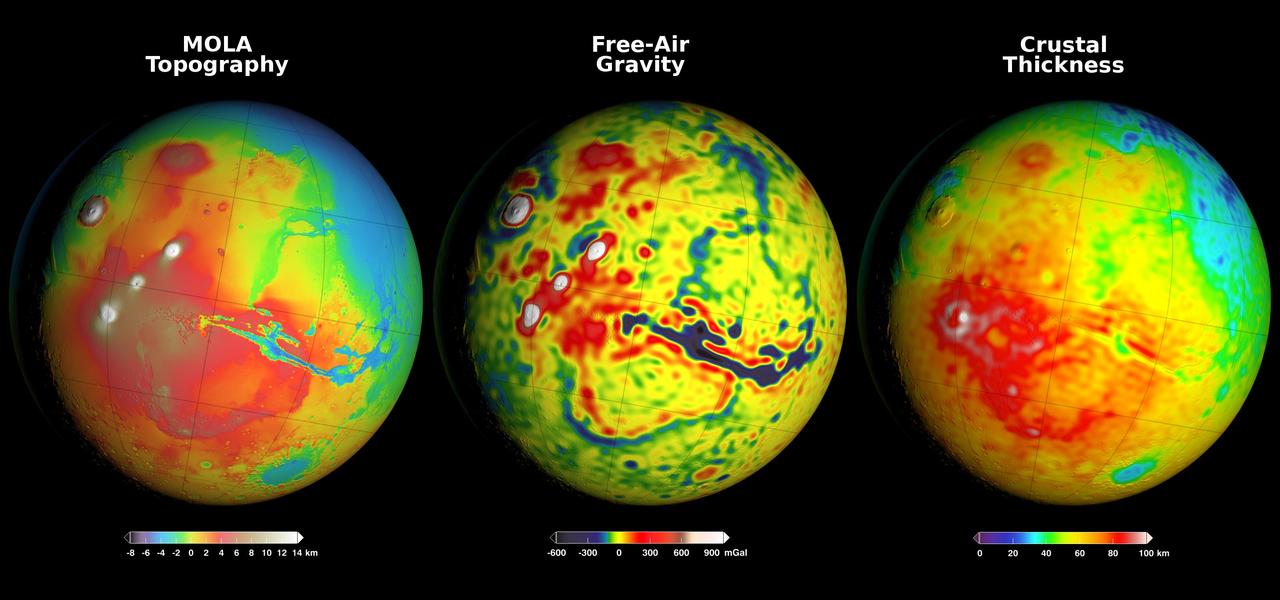
Newly detailed mapping of local variations in Mars' gravitational pull on orbiters (center), combined with topographical mapping of the planet's mountains and valleys (left) yields the best-yet mapping of Mars' crustal thickness (right). These three views of global mapping are centered at 90 degrees west longitude, showing portions of the planet that include tall volcanoes on the left and the deep Valles Marineris canyon system just right of center. Additional views of these global maps are available at http://svs.gsfc.nasa.gov/goto?4436. The new map of Mars' gravity (center) results from analysis of the planet's gravitational effects on orbiters passing over each location on the globe. The data come from many years of using NASA's Deep Space Network to track positions and velocities of NASA's Mars Global Surveyor, Mars Odyssey and Mars Reconnaissance Orbiter. If Mars were a perfectly smooth sphere of uniform density, the gravity experienced by the spacecraft would be exactly the same everywhere. But like other rocky bodies in the solar system, including Earth, Mars has both a bumpy surface and a lumpy interior. As the spacecraft fly in their orbits, they experience slight variations in gravity caused by both of these irregularities, variations which show up as small changes in the velocity and altitude of the three spacecraft. The "free-air" gravity map presents the results without any adjustment for the known bumpiness of Mars' surface. Local gravitational variations in acceleration are expressed in units called gals or galileos. The color-coding key beneath the center map indicates how colors on the map correspond to mGal (milligal) values. The map on the left shows the known bumpiness, or topography, of the Martian surface, using data from the Mars Orbiter Laser Altimeter (MOLA) instrument on Mars Global Surveyor. Mars has no actual "sea level," but does have a defined zero elevation level. The color-coding key beneath this map indicates how the colors correspond to elevations above or below zero, in kilometers. Analysis that subtracts effects of the surface topography from the free-air gravity mapping, combined with an assumption that crust material has a uniform density, leads to the derived mapping of crustal thickness -- or subsurface "lumpiness" -- on the right. Highs in gravity indicate places where the denser mantle material beneath the crust is closer to the surface, and hence where the crust is thinner. The color-coding key for this map indicates how the colors on the map correspond to the thickness of the crust, in kilometers. http://photojournal.jpl.nasa.gov/catalog/PIA20277