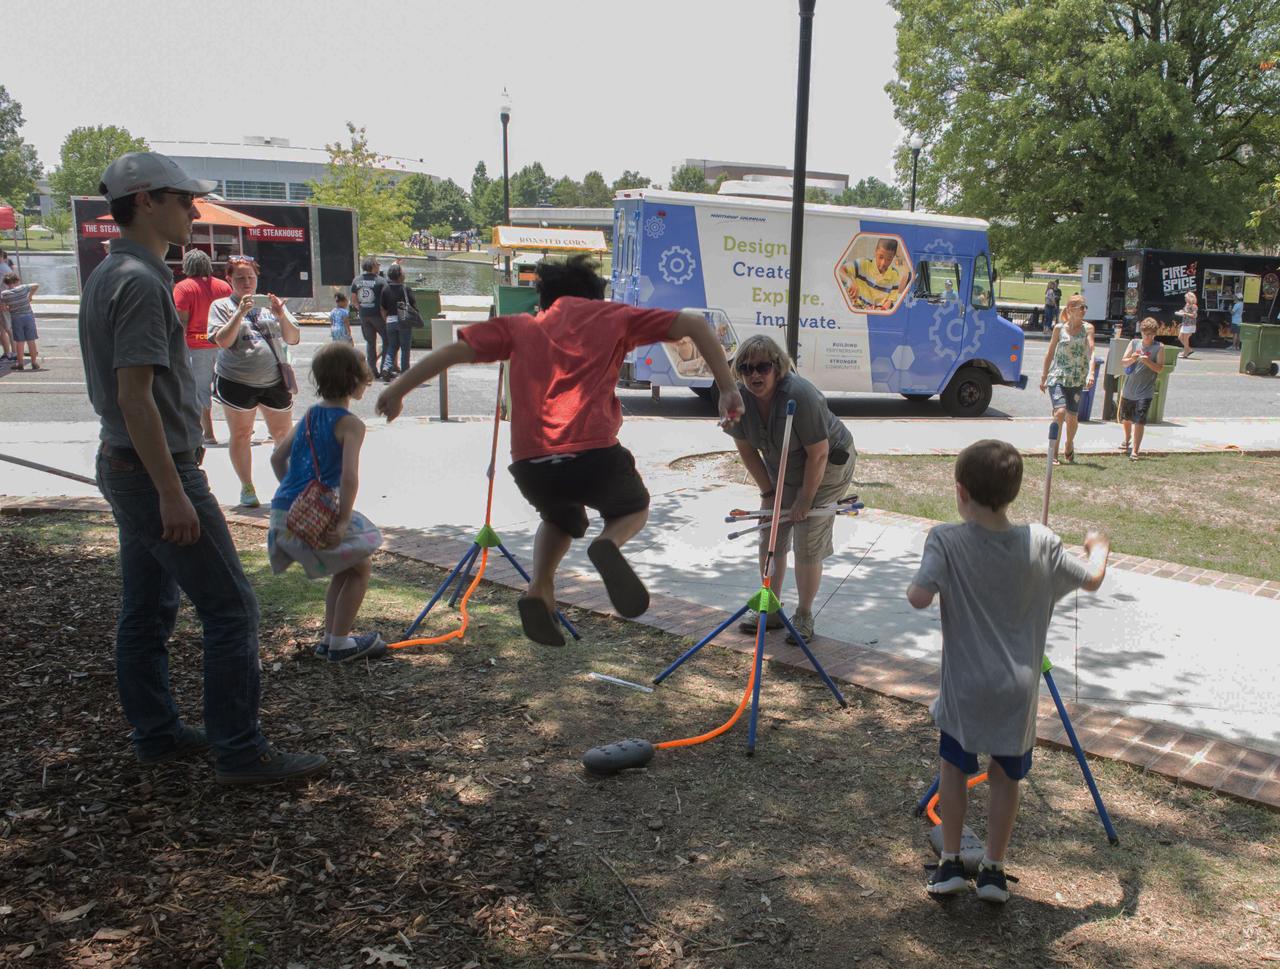
NASA in the Park on June 16 in Huntsville featured more than 60 exhibits and demonstrations by NASA experts, as well as performances by Marshall musicians, educational opportunities, games and hands-on activities for all ages. Youthful energy is exhibited in the foot rocket demonstration.

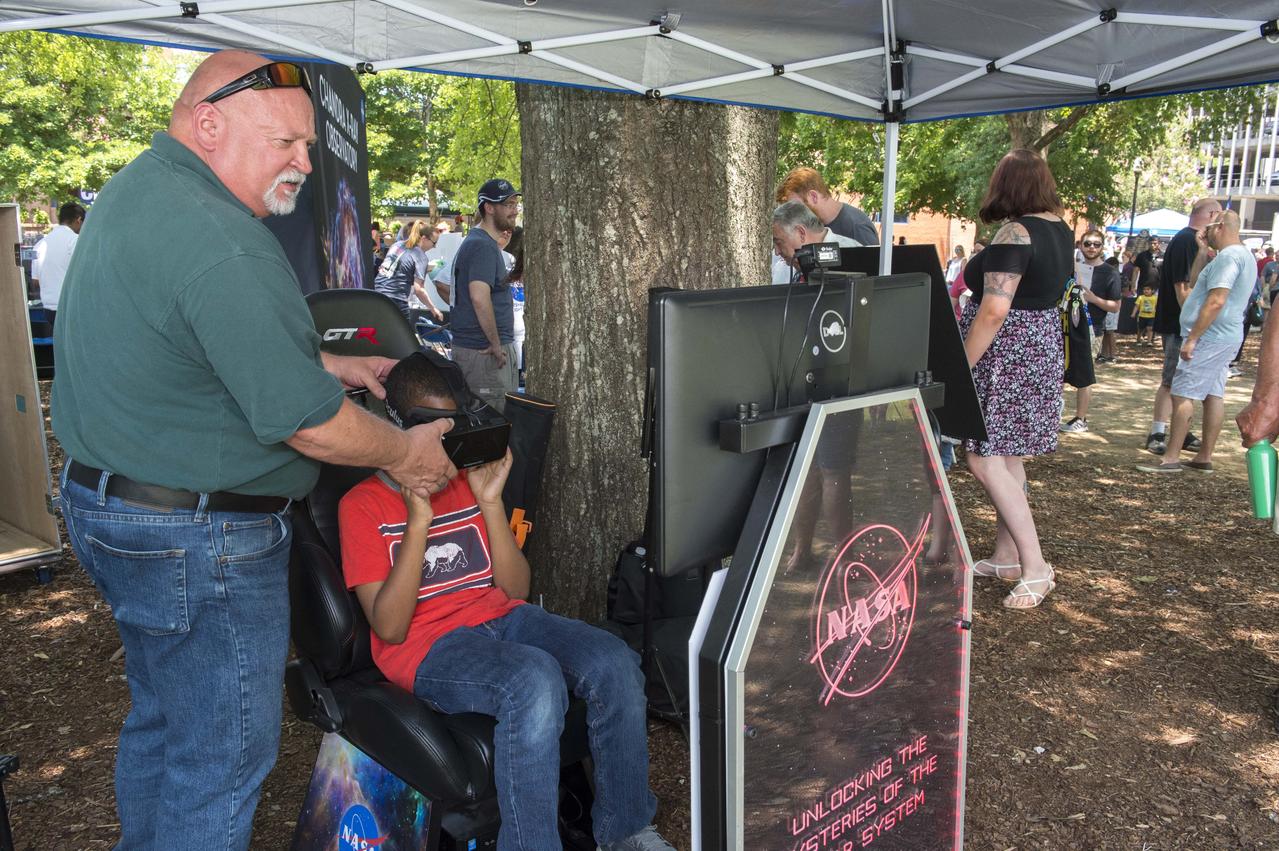
NASA in the Park on June 16 in Huntsville featured more than 60 exhibits and demonstrations by NASA experts, as well as performances by Marshall musicians, educational opportunities, games and hands-on activities for all ages. Many of the exhibits at NASA in the Park were interactive.
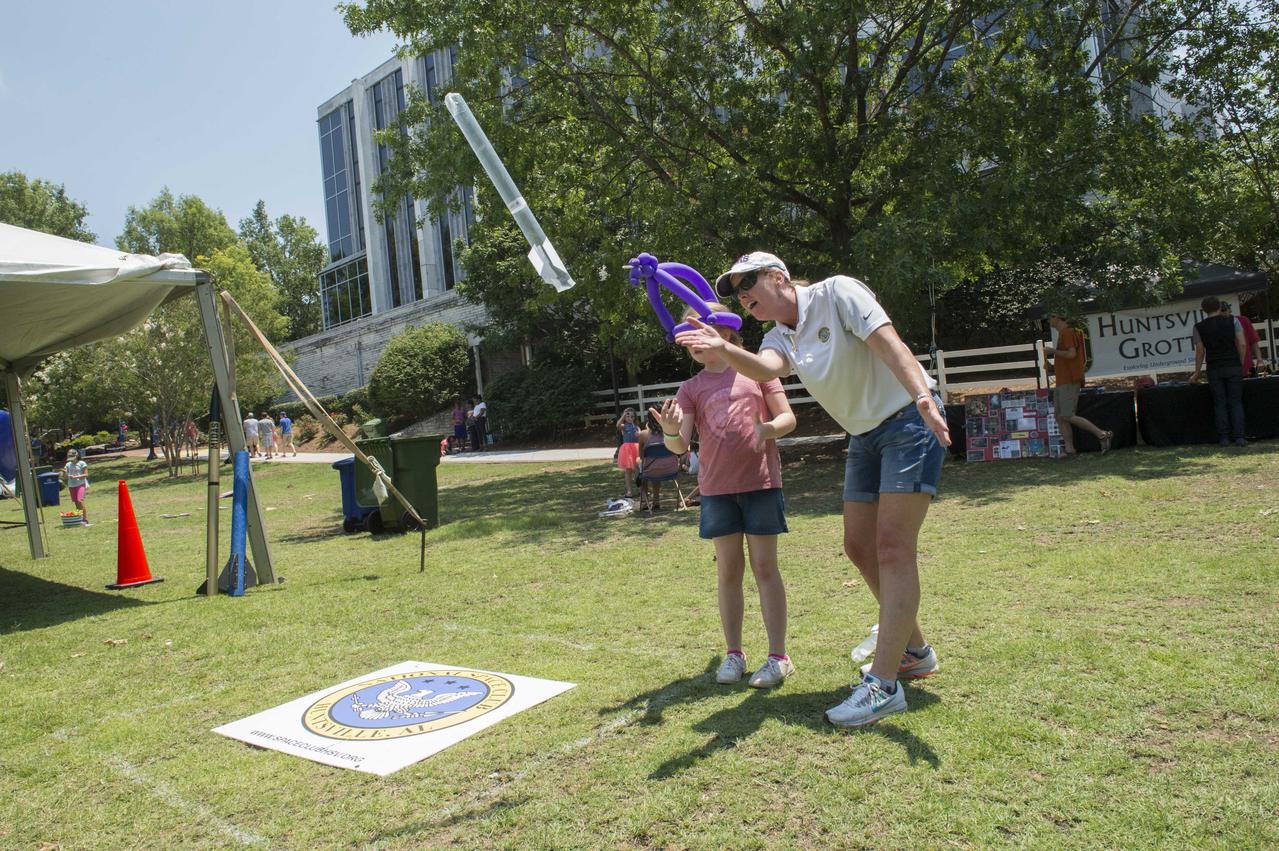
NASA in the Park on June 16 in Huntsville featured more than 60 exhibits and demonstrations by NASA experts, as well as performances by Marshall musicians, educational opportunities, games and hands-on activities for all ages. National Space Club members help demonstrate propulsion principles at NASA in the Park.
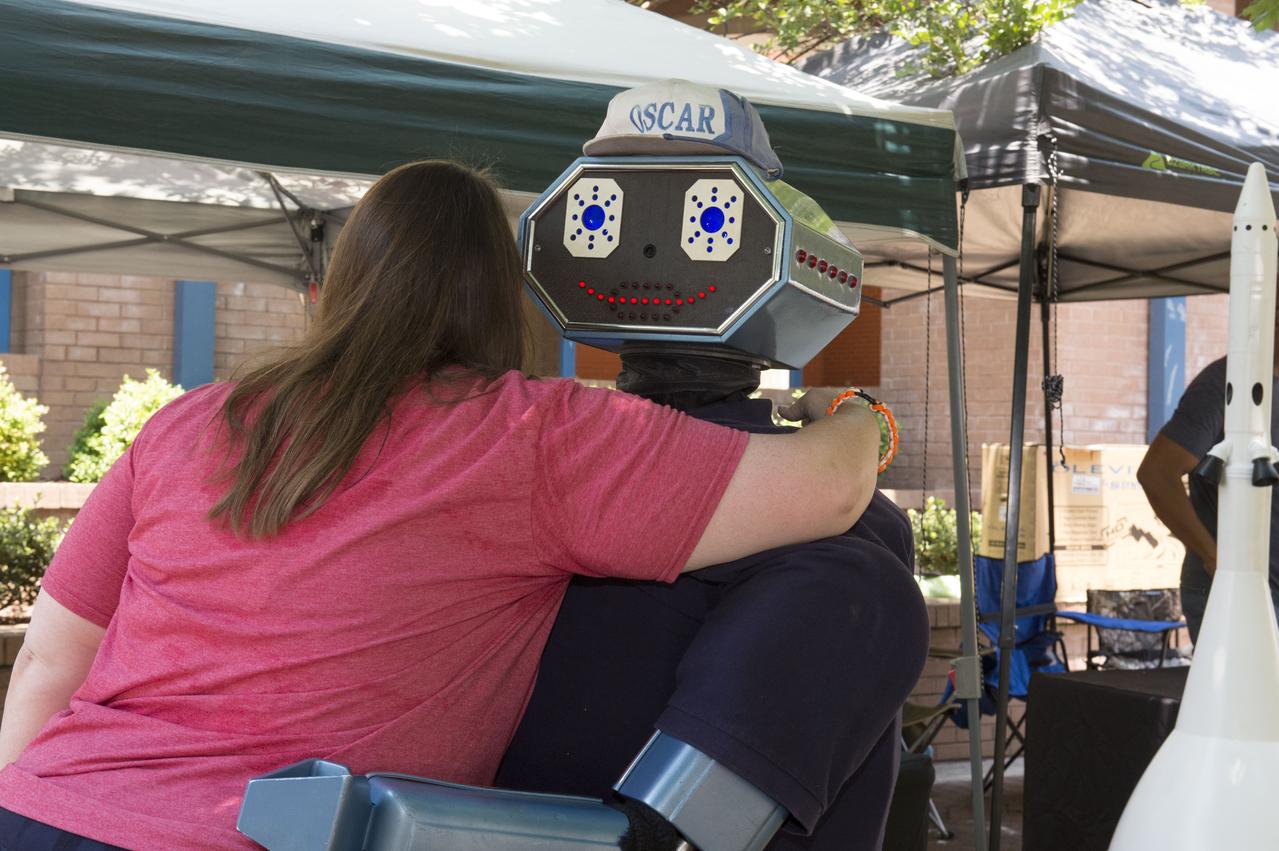
NASA in the Park on June 16 in Huntsville featured more than 60 exhibits and demonstrations by NASA experts, as well as performances by Marshall musicians, educational opportunities, games and hands-on activities for all ages. â€Oscar the Robot†gets and gives lots of hugs.
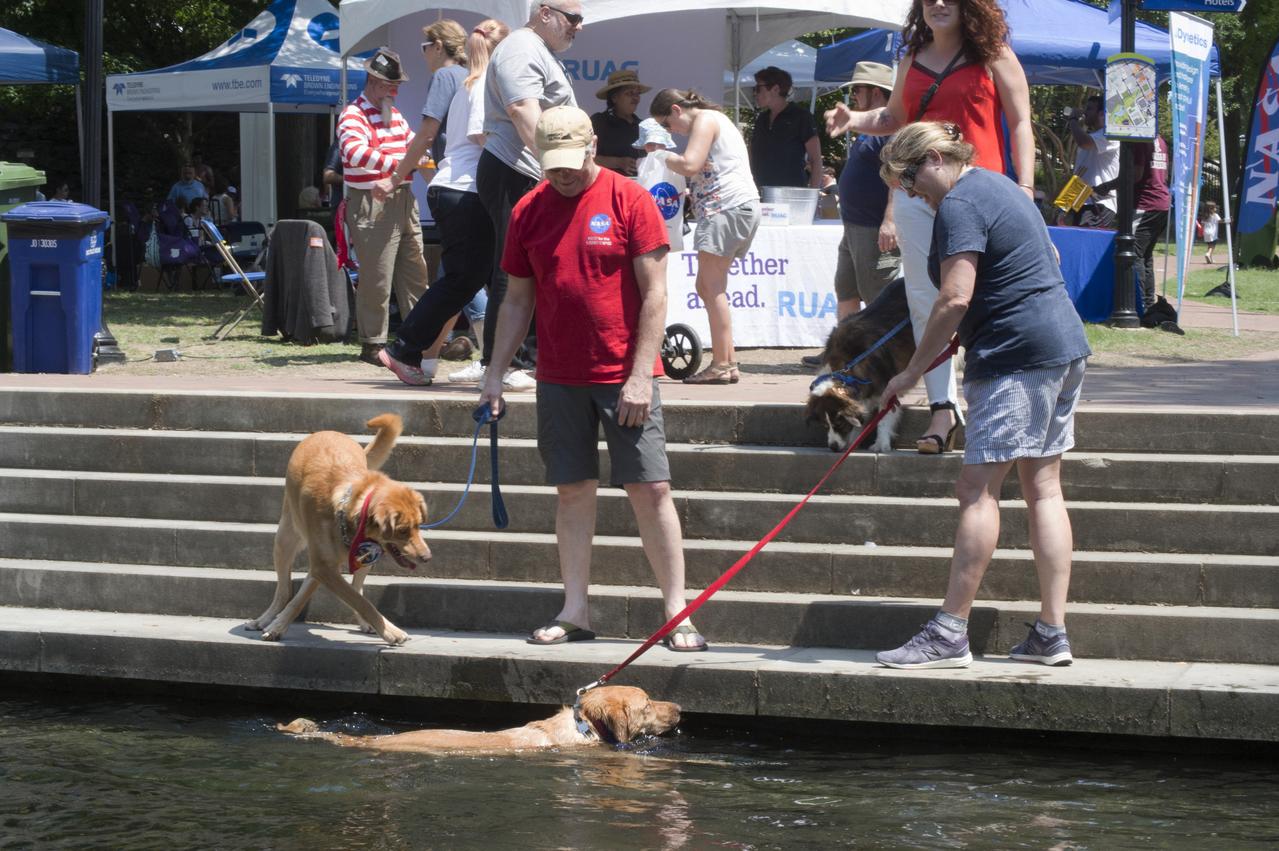
NASA in the Park on June 16 in Huntsville featured more than 60 exhibits and demonstrations by NASA experts, as well as performances by Marshall musicians, educational opportunities, games and hands-on activities for all ages. Big Spring canal is a good place to cool off in the 90 degree heat

NASA in the Park on June 16 in Huntsville featured more than 60 exhibits and demonstrations by NASA experts, as well as performances by Marshall musicians, educational opportunities, games and hands-on activities for all ages. Astronaut Hoot Gibson and Nina Ricks of the band “Just Like Grady†entertained audiences at NASA in the Park.

NASA in the Park on June 16 in Huntsville featured more than 60 exhibits and demonstrations by NASA experts, as well as performances by Marshall musicians, educational opportunities, games and hands-on activities for all ages. NASA employee Renae Scoble and her husband Ryan and son Titus enjoy the the fun and games at NASA in the Park.

NASA in the Park on June 16 in Huntsville featured more than 60 exhibits and demonstrations by NASA experts, as well as performances by Marshall musicians, educational opportunities, games and hands-on activities for all ages. Marshall employees Ola Metcalfe (L), and Sherrie Stroud proudly display trophies awarded to them by Downtown Inc. President, Chad Emerson, in appreciation of their efforts in the five year partnership with NASA in the Park.
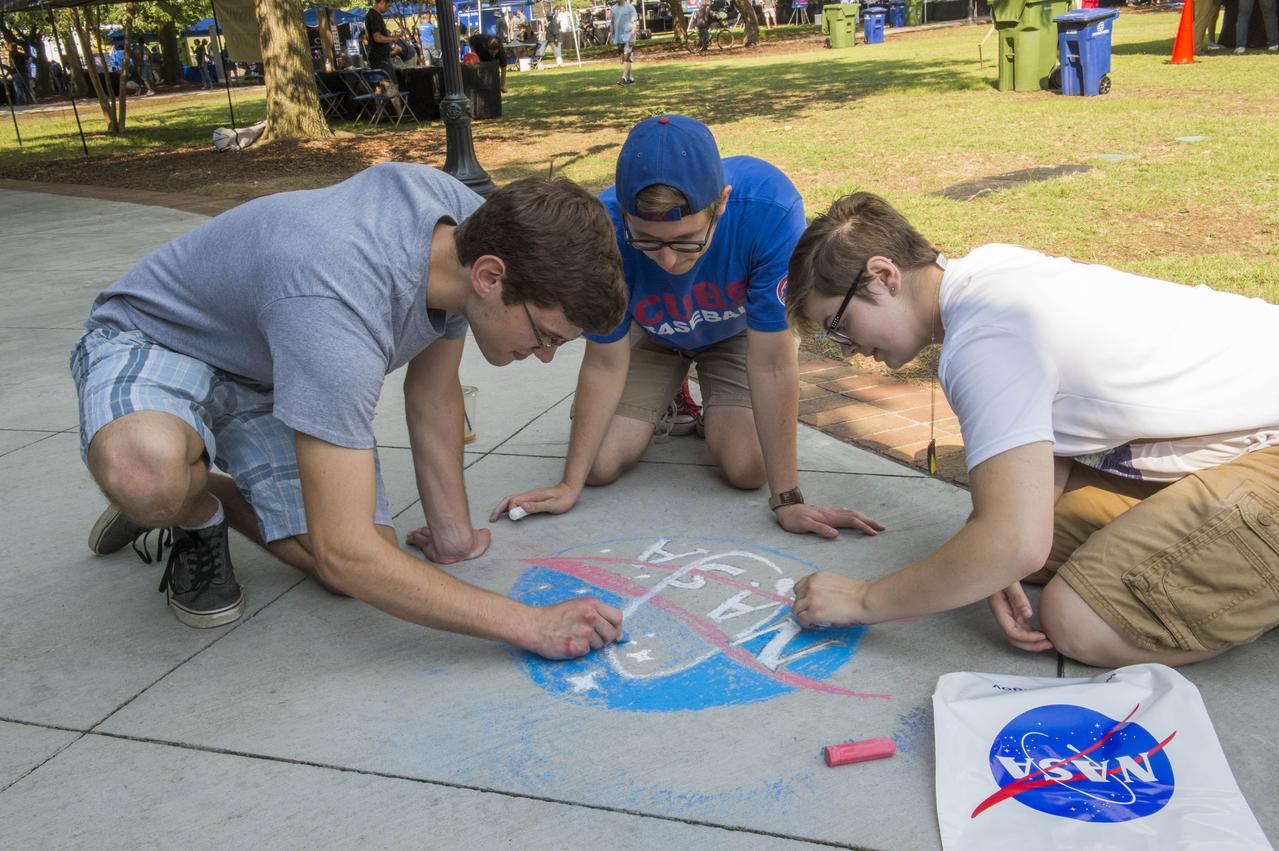
NASA in the Park on June 16 in Huntsville featured more than 60 exhibits and demonstrations by NASA experts, as well as performances by Marshall musicians, educational opportunities, games and hands-on activities for all ages. MSFC Summer Interns Eben Lenfest, Nick Bonini, and April Benedict display their artistic talents on Big Spring Park sidewalk during NASA in the Park festivities.

NASA in the Park on June 16 in Huntsville featured more than 60 exhibits and demonstrations by NASA experts, as well as performances by Marshall musicians, educational opportunities, games and hands-on activities for all ages. MSFC Deputy Director Jody Singer welcomes soloist Alyssa Slocum who sang the National Anthem to officially open NASA in the Park activities.
NASA in the Park on June 16 in Huntsville featured more than 60 exhibits and demonstrations by NASA experts, as well as performances by Marshall musicians, educational opportunities, games and hands-on activities for all ages. Brian Mitchell of Marshall’s Planetary Mission Planning Office gives attendees an opportunity to learn about Science missions managed by his office.
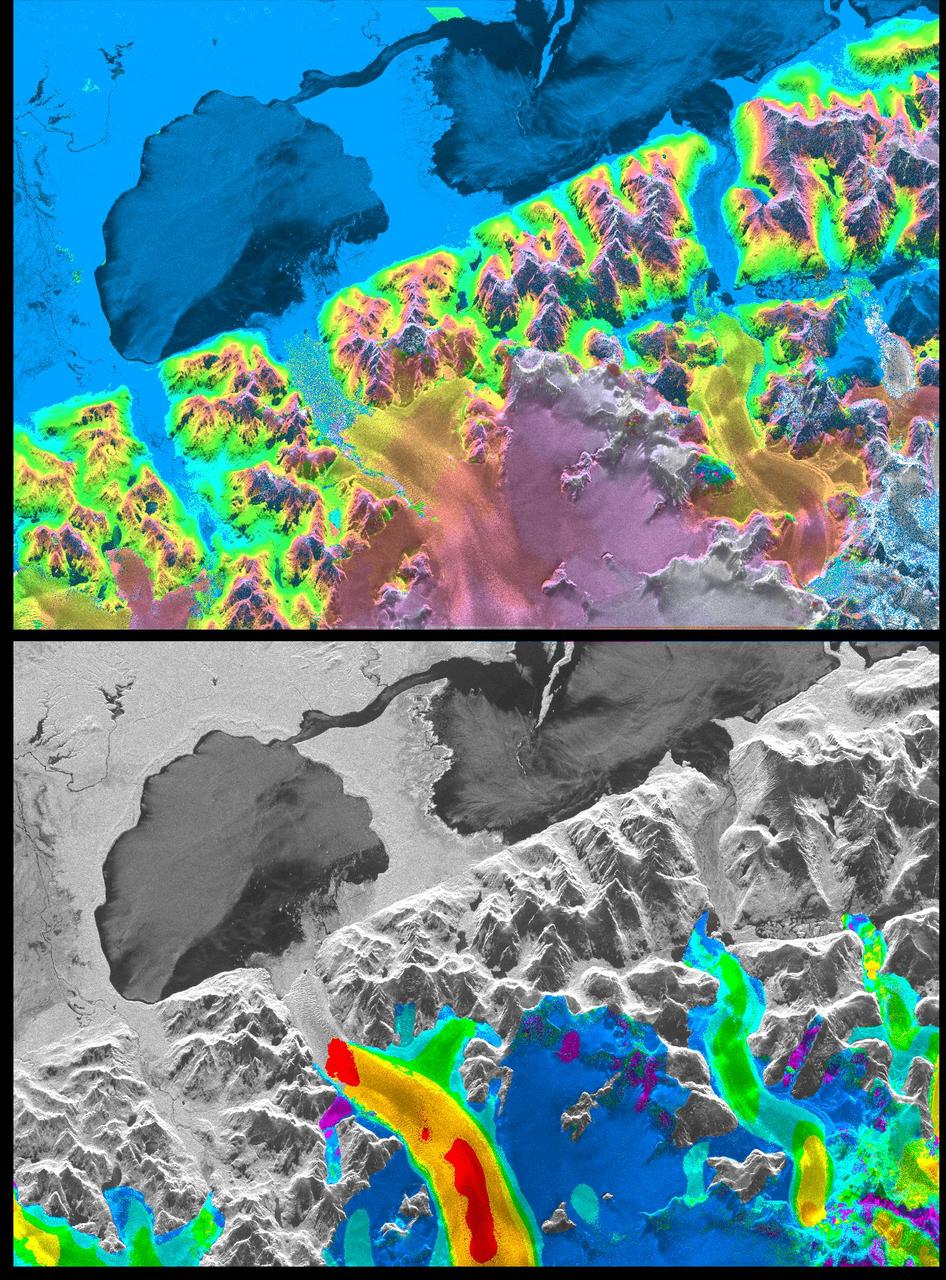
A NASA radar instrument has been successfully used to measure some of the fastest moving and most inaccessible glaciers in the world -- in Chile's huge, remote Patagonia ice fields -- demonstrating a technique that could produce more accurate predictions of glacial response to climate change and corresponding sea level changes. This image, produced with interferometric measurements made by the Spaceborne Imaging Radar-C and X-band Synthetic Aperture Radar (SIR-C/X-SAR) flown on the Space Shuttle last fall, has provided the first detailed measurements of the mass and motion of the San Rafael Glacier. Very few measurements have been made of the Patagonian ice fields, which are the world's largest mid-latitude ice masses and account for more than 60 percent of the Southern Hemisphere's glacial area outside of Antarctica. These features make the area essential for climatologists attempting to understand the response of glaciers on a global scale to changes in climate, but the region's inaccessibility and inhospitable climate have made it nearly impossible for scientists to study its glacial topography, meteorology and changes over time. Currently, topographic data exist for only a few glaciers while no data exist for the vast interior of the ice fields. Velocity has been measured on only five of the more than 100 glaciers, and the data consist of only a few single-point measurements. The interferometry performed by the SIR-C/X-SAR was used to generate both a digital elevation model of the glaciers and a map of their ice motion on a pixel-per-pixel basis at very high resolution for the first time. The data were acquired from nearly the same position in space on October 9, 10 and 11, 1994, at L-band frequency (24-cm wavelength), vertically transmitted and received polarization, as the Space Shuttle Endeavor flew over several Patagonian outlet glaciers of the San Rafael Laguna. The area shown in these two images is 50 kilometers by 30 kilometers (30 miles by 18 miles) in size and is centered at 46.6 degrees south latitude, 73.8 degrees west longitude. North is toward the upper right. The top image is a digital elevation model of the scene, where color and saturation represent terrain height (between 0 meters and 2,000 meters or up to 6,500 feet) and brightness represents radar backscatter. Low elevations are shown in blue and high elevations are shown in pink. The digital elevation map of the glacier surface has a horizontal resolution of 15 meters (50 feet) and a vertical resolution of 10 meters (30 feet). High-resolution maps like these acquired over several years would allow scientists to calculate directly long-term changes in the mass of the glacier. The bottom image is a map of ice motion parallel to the radar look direction only, which is from the top of the image. Purple indicates ice motion away from the radar at more than 6 centimeters per day; dark blue is ice motion toward or away at less than 6 cm per day; light blue is motion toward the radar of 6 cm to 20 cm (about 2 to 8 inches) per day; green is motion toward the radar of 20 cm to 45 cm (about 8 to 18 inches) per day; yellow is 45 cm to 85 cm (about 18 to 33 inches) per day; orange is 85 cm to 180 cm (about 33 to 71 inches) per day; red is greater than 180 cm (71 inches) per day. The velocity estimates are accurate to within 5 millimeters per day. The largest velocities are recorded on the San Rafael Glacier in agreement with previous work. Other outlet glaciers exhibit ice velocities of less than 1 meter per day. Several kilometers before its terminus, (left of center) the velocity of the San Rafael Glacier exceeds 10 meters (32 feet) per day, and ice motion cannot be estimated from the data. There, a revisit time interval of less than 12 hours would have been necessary to estimate ice motion from interferometry data. The results however demonstrate that the radar interferometry technique permits the monitoring of glacier characteristics unattainable by any other means. http://photojournal.jpl.nasa.gov/catalog/PIA01781