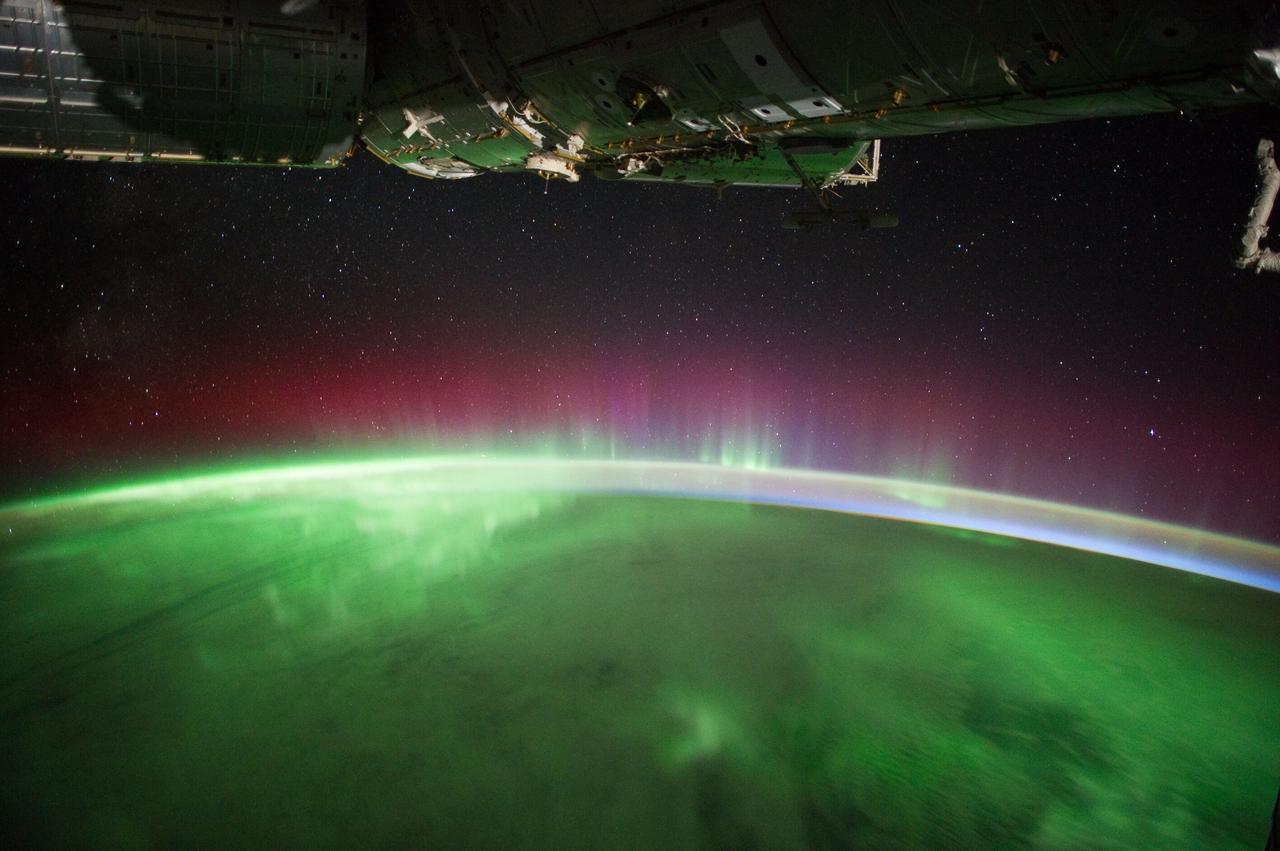
iss030e119777 (3/3/2012) --- A view of the night earth taken aboard the International Space Station (ISS) showing an aurora. An aurora sometimes referred to as polar lights, northern lights (aurora borealis), or southern lights (aurora australis), is a natural light display in the Earth's sky, predominantly seen in the high-latitude regions (around the Arctic and Antarctic). Auroras are the result of disturbances in the magnetosphere caused by solar wind.
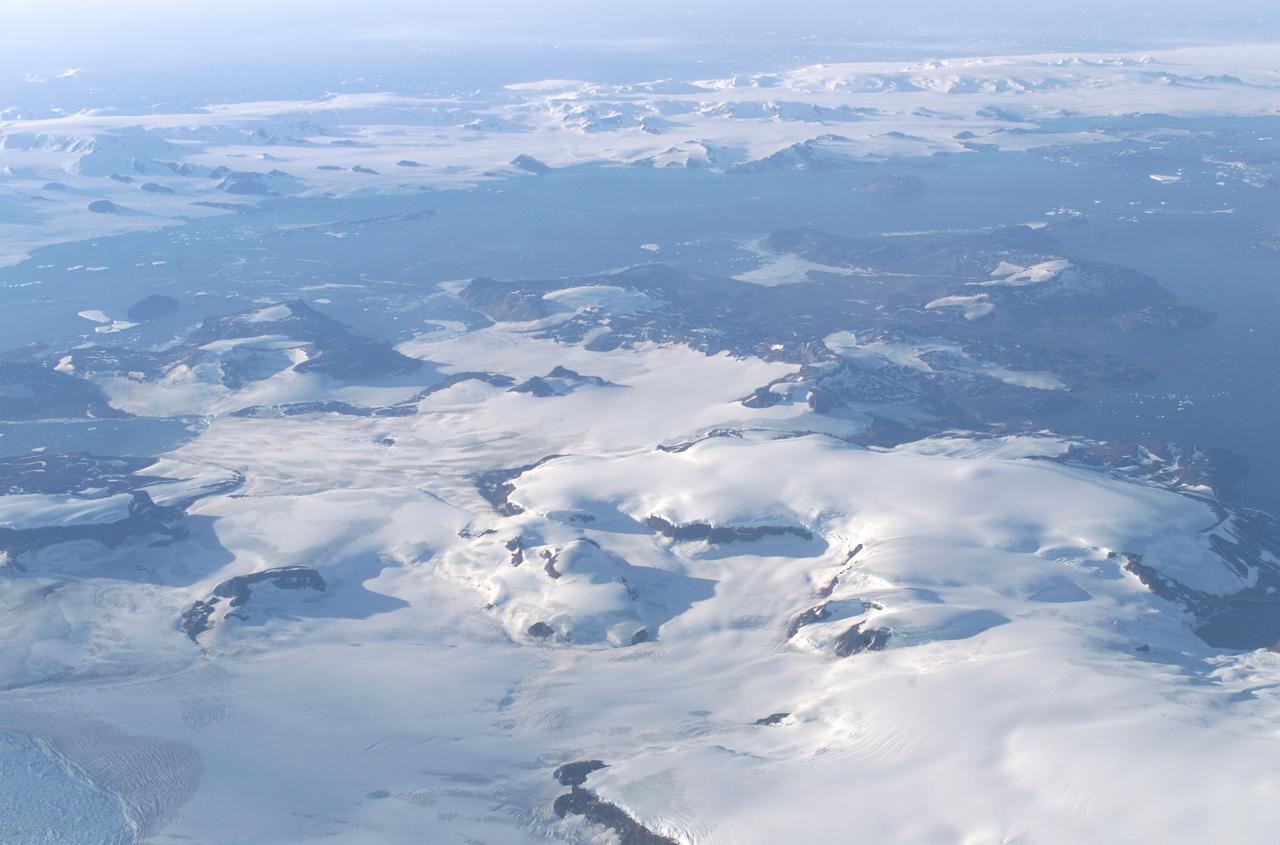
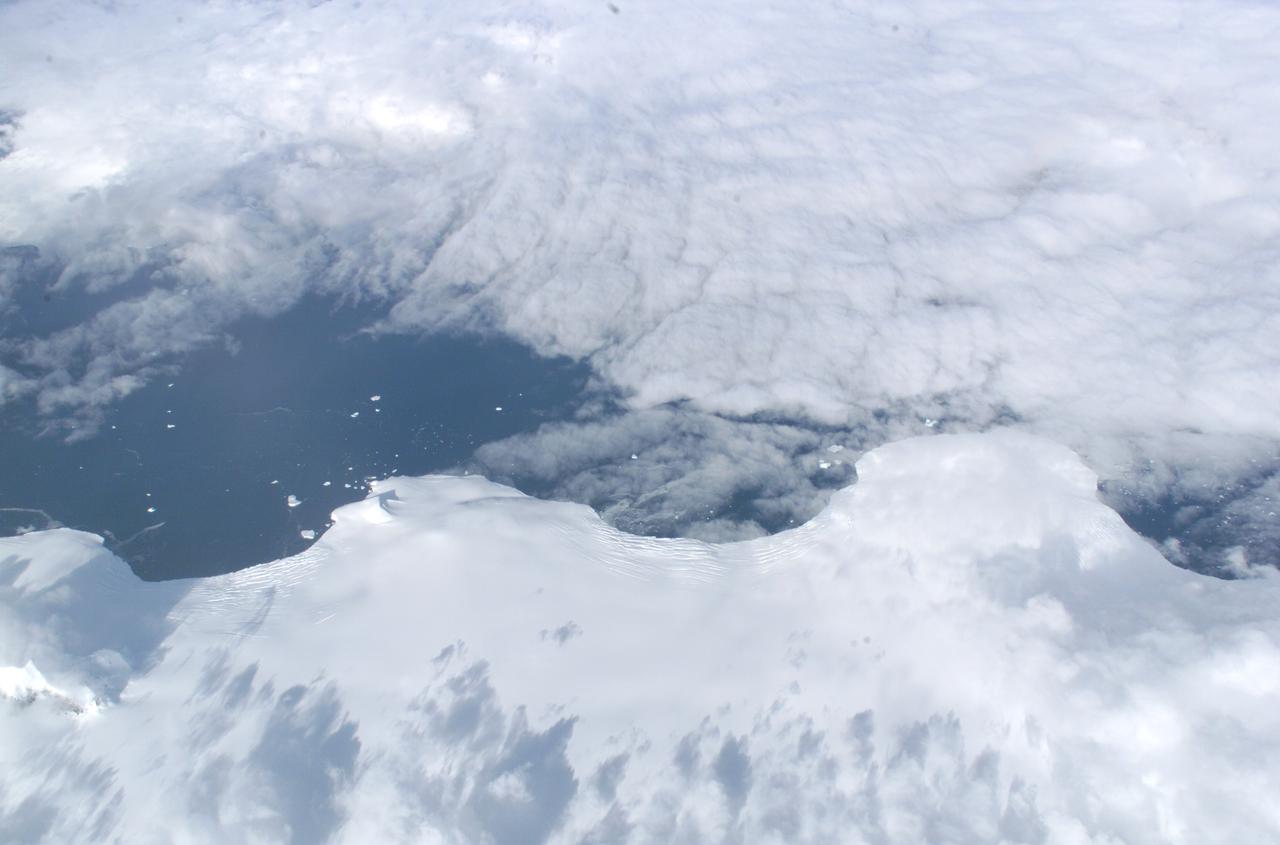
James Ross Island captured by NASA photographer James Ross(no relation), from NASA's DC-8 aircraft during an AirSAR 2004 mission over the Antarctic Peninsula. James Ross Island, named for 19th century British polar explorer Sir James Clark Ross, is located at the northern tip of the Antarctic Peninsula. The island is about 1500 m high and 40-60 km wide. In recent decades, the area has experienced significant atmospheric warming (about 2 degrees C since 1950), which has triggered a vast and spectacular retreat of its floating ice shelves, glacier reduction, a decrease in permanent snow cover and a lengthening of the melt season. AirSAR 2004 is a three-week expedition in Central and South America by an international team of scientists that is using an all-weather imaging tool, called the Airborne Synthetic Aperture Radar (AirSAR), located onboard NASA's DC-8 airborne laboratory. Scientists from many parts of the world are combining ground research with NASA's AirSAR technology to improve and expand on the quality of research they are able to conduct. These photos are from the DC-8 aircraft while flying an AirSAR mission over Antarctica. The Antarctic Peninsula is more similar to Alaska and Patagonia than to the rest of the Antarctic continent. It is drained by fast glaciers, receives abundant precipitation, and melts significantly in the summer months. This region is being studied by NASA using a DC-8 equipped with the Airborne Synthetic Aperture Radar developed by scientists from NASA’s Jet Propulsion Laboratory. AirSAR will provide a baseline model and unprecedented mapping of the region. This data will make it possible to determine whether the warming trend is slowing, continuing or accelerating. AirSAR will also provide reliable information on ice shelf thickness to measure the contribution of the glaciers to sea level.
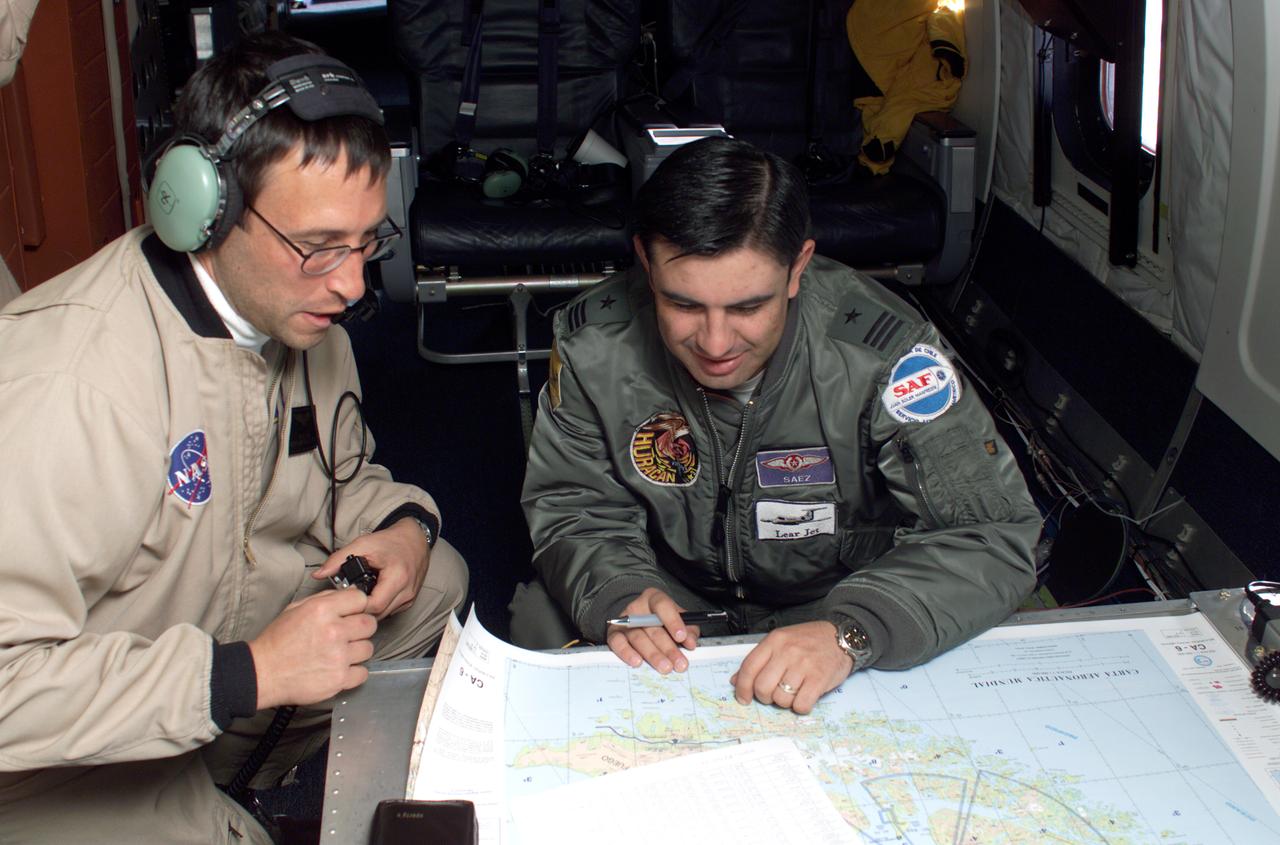
NASA DC-8 Mission Manager Walter Klein and Chilean Air Force Advisor Captain Saez review maps of the Antarctic Peninsula during an AirSAR 2004 mission. AirSAR 2004 is a three-week expedition in Central and South America by an international team of scientists that is using an all-weather imaging tool, called the Airborne Synthetic Aperture Radar (AirSAR), located onboard NASA's DC-8 airborne laboratory. Scientists from many parts of the world are combining ground research with NASA's AirSAR technology to improve and expand on the quality of research they are able to conduct. These photos are from the DC-8 aircraft while flying an AirSAR mission over Antarctica. The Antarctic Peninsula is more similar to Alaska and Patagonia than to the rest of the Antarctic continent. It is drained by fast glaciers, receives abundant precipitation, and melts significantly in the summer months. In recent decades, the Peninsula has experienced significant atmospheric warming (about 2 degrees C since 1950), which has triggered a vast and spectacular retreat of its floating ice shelves, glacier reduction, a decrease in permanent snow cover and a lengthening of the melt season. As a result, the contribution to sea level from this region could be rapid and substantial. With an area of 120,000 km, or ten times the Patagonia ice fields, the Peninsula could contribute as much as 0.4mm/yr sea level rise, which would be the largest single contribution to sea level from anywhere in the world. This region is being studied by NASA using a DC-8 equipped with the Airborne Synthetic Aperture Radar developed by scientists from NASA’s Jet Propulsion Laboratory. AirSAR will provide a baseline model and unprecedented mapping of the region. This data will make it possible to determine whether the warming trend is slowing, continuing or accelerating. AirSAR will also provide reliable information on ice shelf thickness to measure the contribution of the glaciers to sea level.
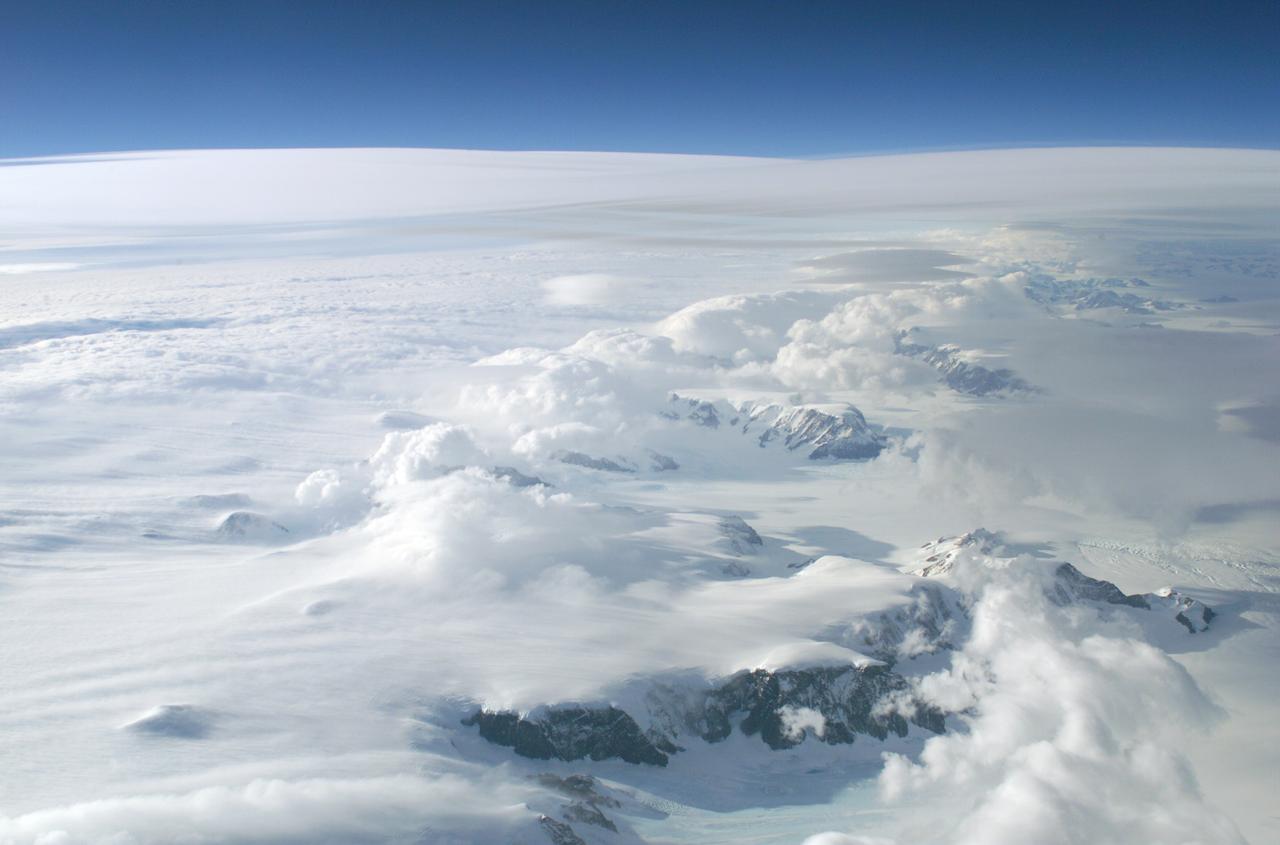
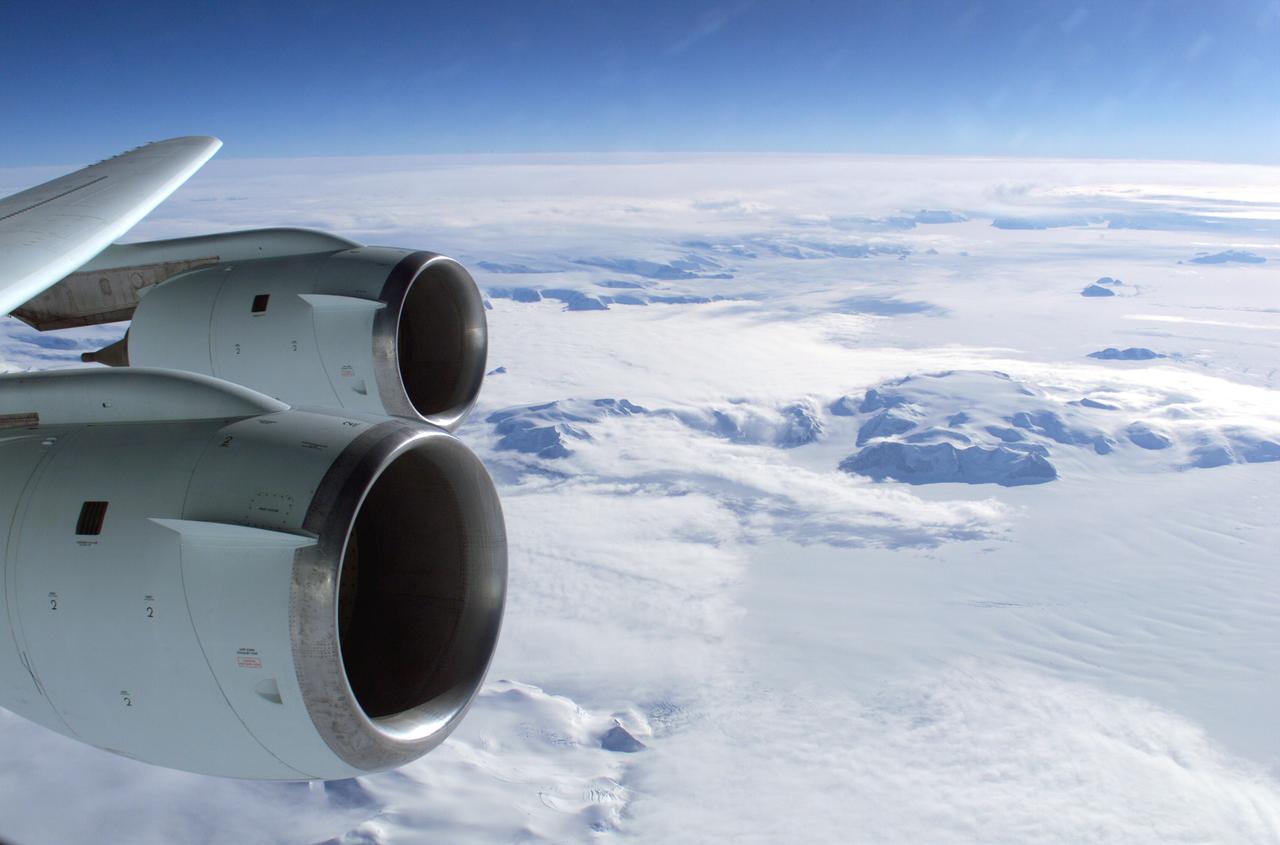
An AirSAR 2004 view from the DC-8 as it approaches the Larsen Ice Shelf, which is part of the Antarctic Peninsula. AirSAR 2004 is a three-week expedition in Central and South America by an international team of scientists that is using an all-weather imaging tool, called the Airborne Synthetic Aperture Radar (AirSAR), located onboard NASA's DC-8 airborne laboratory. Scientists from many parts of the world are combining ground research with NASA's AirSAR technology to improve and expand on the quality of research they are able to conduct. These photos are from the DC-8 aircraft while flying an AirSAR mission over Antarctica. The Antarctic Peninsula is more similar to Alaska and Patagonia than to the rest of the Antarctic continent. It is drained by fast glaciers, receives abundant precipitation, and melts significantly in the summer months. In recent decades, the Peninsula has experienced significant atmospheric warming (about 2 degrees C since 1950), which has triggered a vast and spectacular retreat of its floating ice shelves, glacier reduction, a decrease in permanent snow cover and a lengthening of the melt season. As a result, the contribution to sea level from this region could be rapid and substantial. With an area of 120,000 km, or ten times the Patagonia ice fields, the Peninsula could contribute as much as 0.4mm/yr sea level rise, which would be the largest single contribution to sea level from anywhere in the world. This region is being studied by NASA using a DC-8 equipped with the Airborne Synthetic Aperture Radar developed by scientists from NASA’s Jet Propulsion Laboratory. AirSAR will provide a baseline model and unprecedented mapping of the region. This data will make it possible to determine whether the warming trend is slowing, continuing or accelerating. AirSAR will also provide reliable information on ice shelf thickness to measure the contribution of the glaciers to sea level.
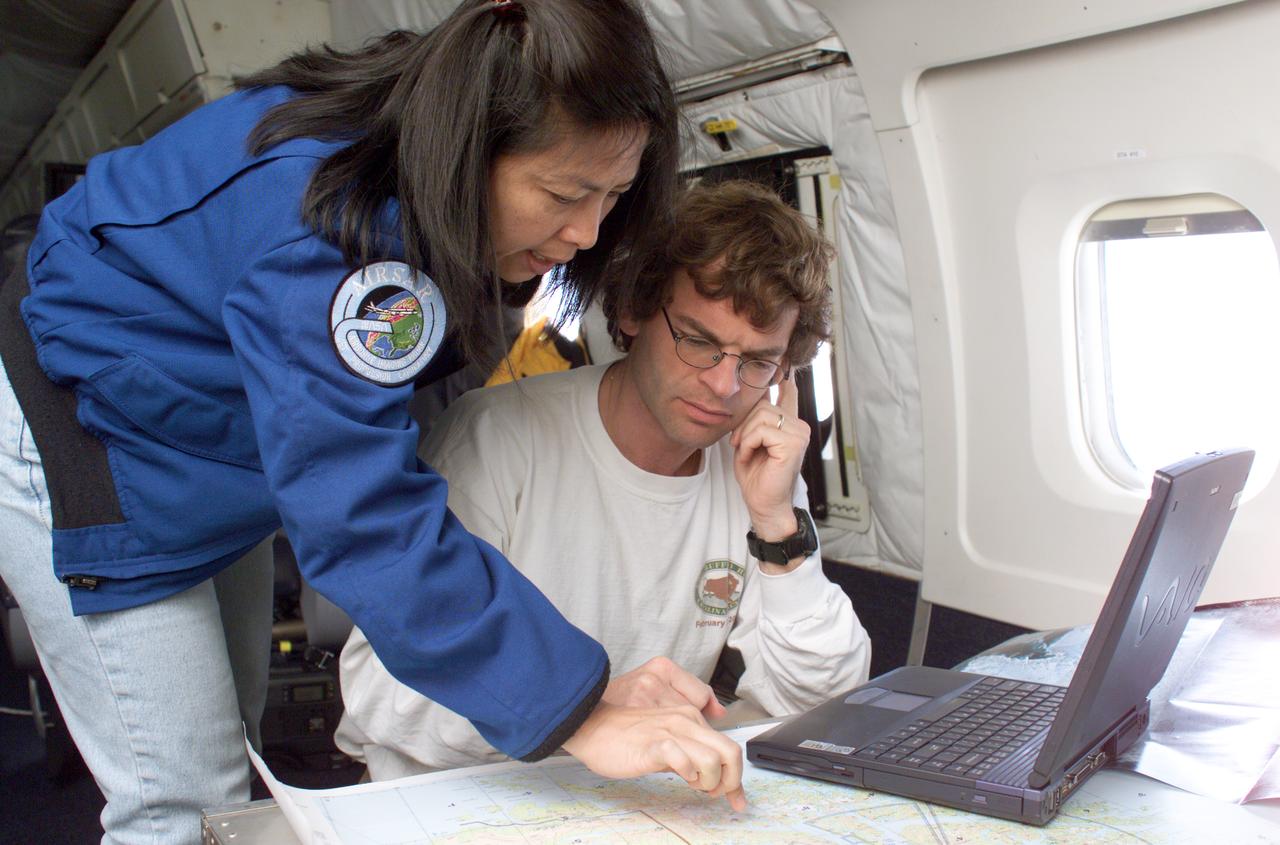
NASA JPL scientists Yunling Lou and Dr. Eric Rignot work on line selection while flying AirSAR missions over the Antarctic Peninsula. AirSAR 2004 is a three-week expedition in Central and South America by an international team of scientists that is using an all-weather imaging tool, called the Airborne Synthetic Aperture Radar (AirSAR), located onboard NASA's DC-8 airborne laboratory. Scientists from many parts of the world are combining ground research with NASA's AirSAR technology to improve and expand on the quality of research they are able to conduct. These photos are from the DC-8 aircraft while flying an AirSAR mission over Antarctica. The Antarctic Peninsula is more similar to Alaska and Patagonia than to the rest of the Antarctic continent. It is drained by fast glaciers, receives abundant precipitation, and melts significantly in the summer months. In recent decades, the Peninsula has experienced significant atmospheric warming (about 2 degrees C since 1950), which has triggered a vast and spectacular retreat of its floating ice shelves, glacier reduction, a decrease in permanent snow cover and a lengthening of the melt season. As a result, the contribution to sea level from this region could be rapid and substantial. With an area of 120,000 km, or ten times the Patagonia ice fields, the Peninsula could contribute as much as 0.4mm/yr sea level rise, which would be the largest single contribution to sea level from anywhere in the world. This region is being studied by NASA using a DC-8 equipped with the Airborne Synthetic Aperture Radar developed by scientists from NASA’s Jet Propulsion Laboratory. AirSAR will provide a baseline model and unprecedented mapping of the region. This data will make it possible to determine whether the warming trend is slowing, continuing or accelerating. AirSAR will also provide reliable information on ice shelf thickness to measure the contribution of the glaciers to sea level.
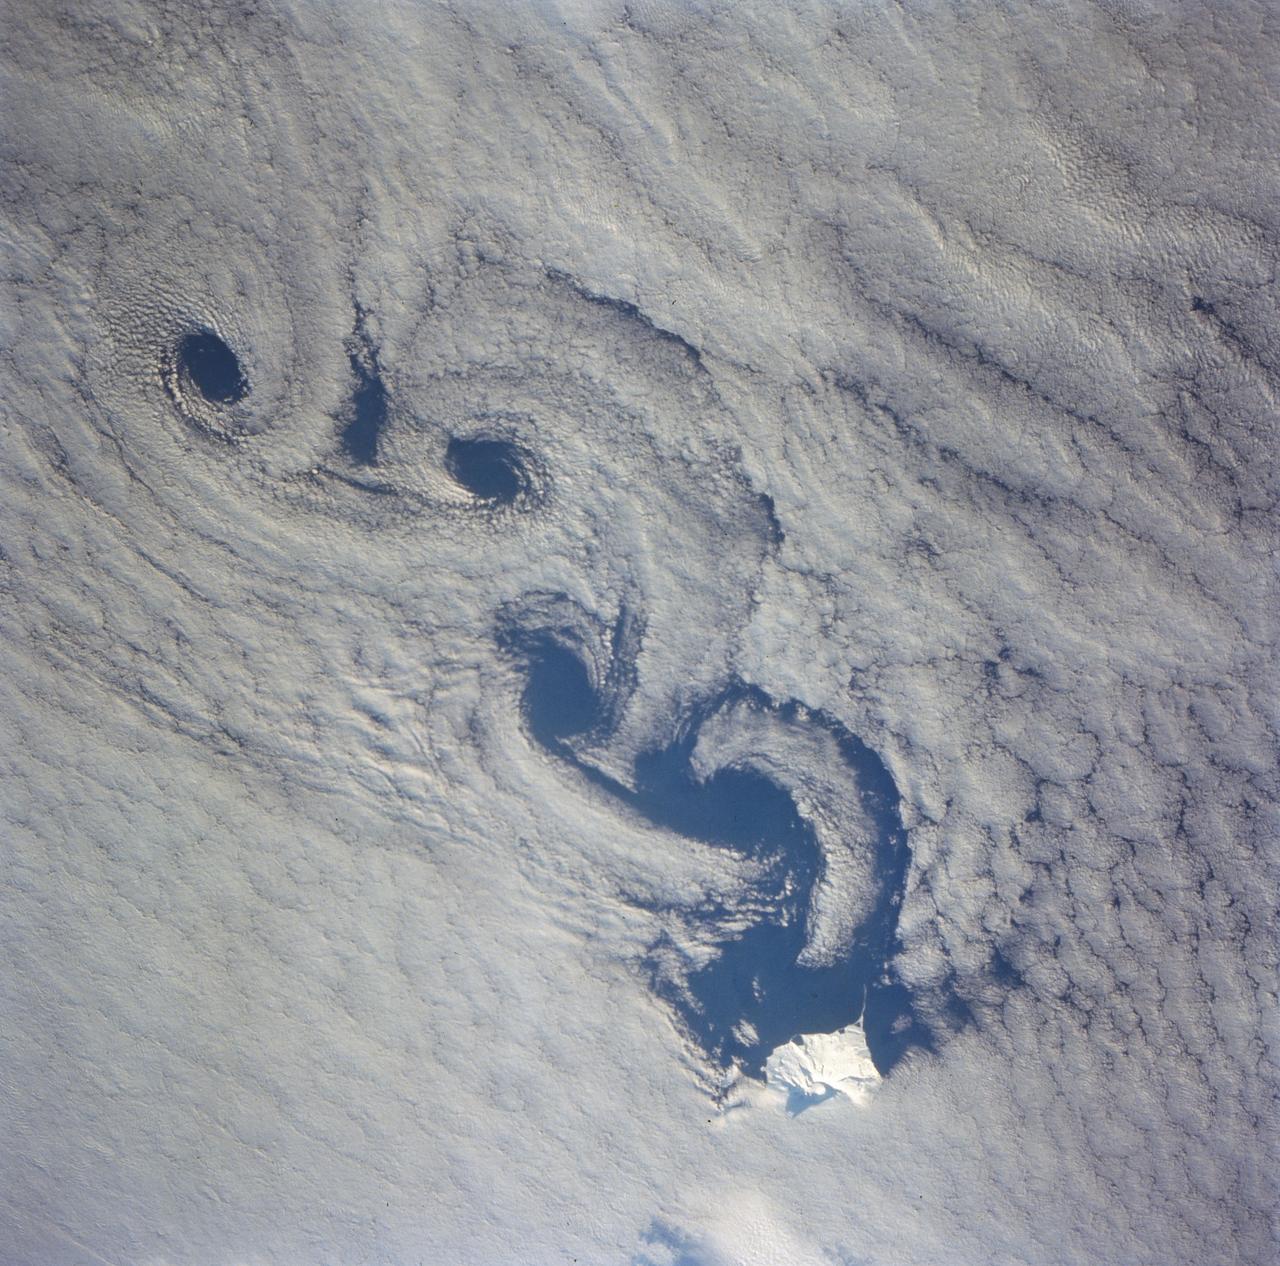
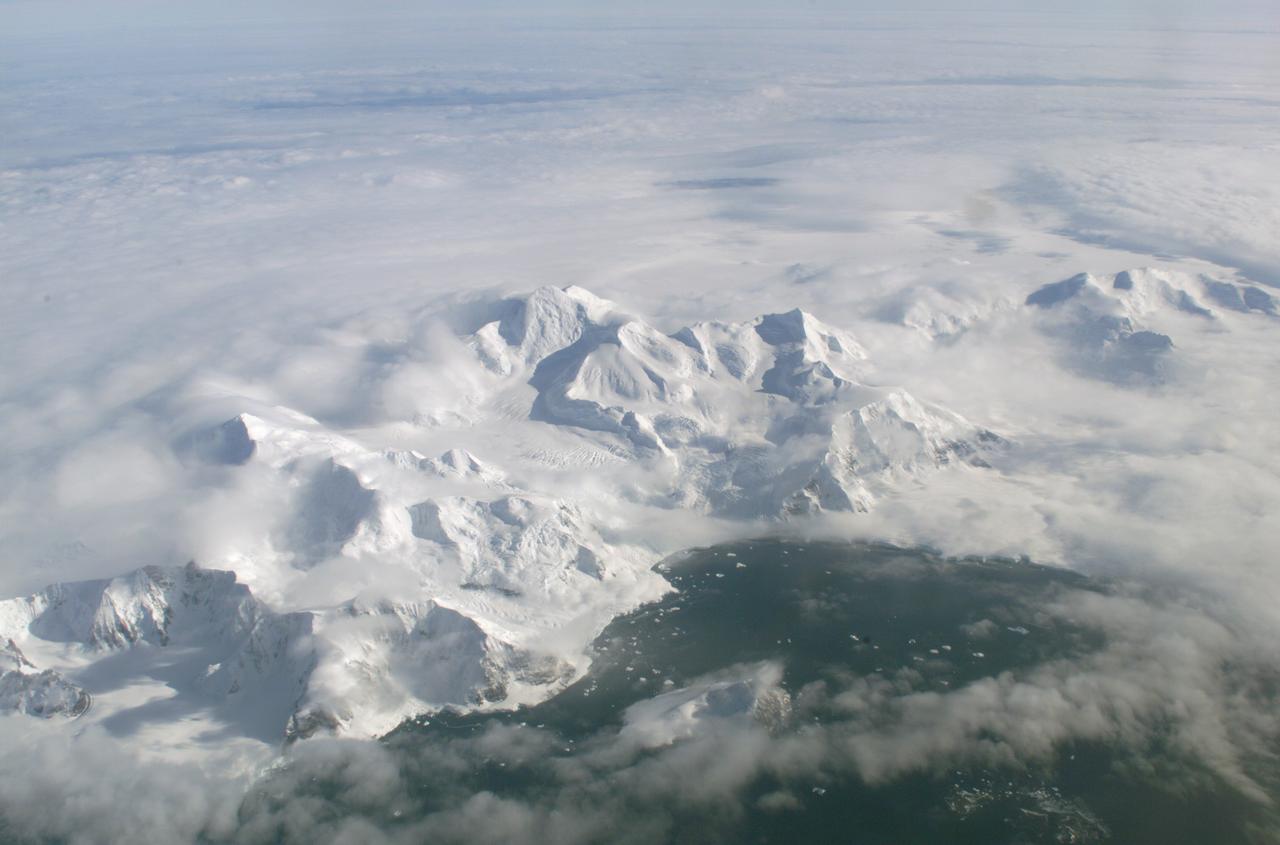
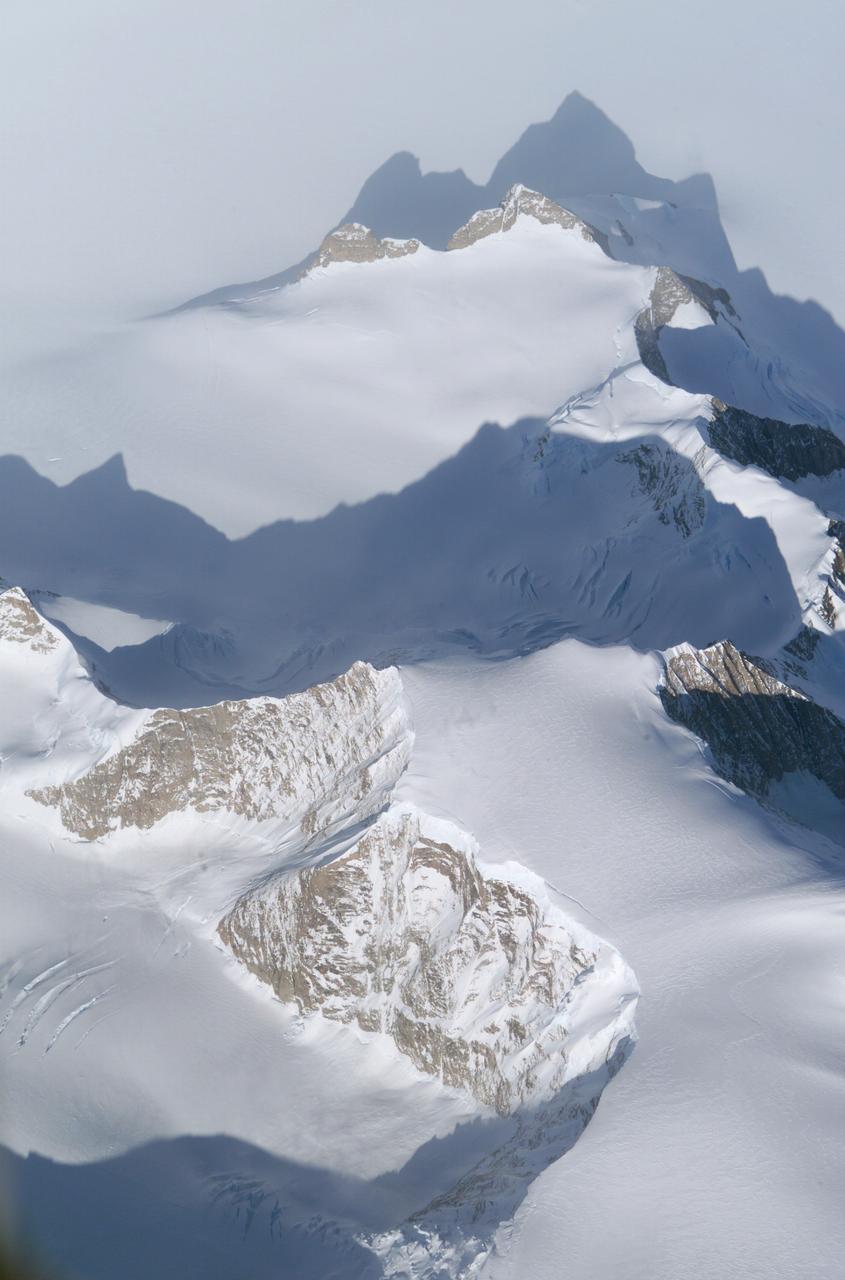
As the air blows over the tops of the mountain peaks, seen here in the clear region, the direction of the air flow is disturbed. These disturbances in the flow pattern are generally small circular eddies with one circulating in a clockwise direction and the next in the reverse direction. The wind here has caused the shallow cloud cover to change accordingly. These eddies are commonly called von Karmen Vortices.

AS04-01-750 (9 Nov. 1967) --- Atlantic Ocean, Antarctica, looking west, as photographed from the Earth-orbital Apollo 4 (Spacecraft 017/Saturn 501) unmanned space mission. This picture was taken when the Spacecraft 017 and the Saturn S-IVB (third) stage was orbiting Earth at an altitude of 8,628 nautical miles.
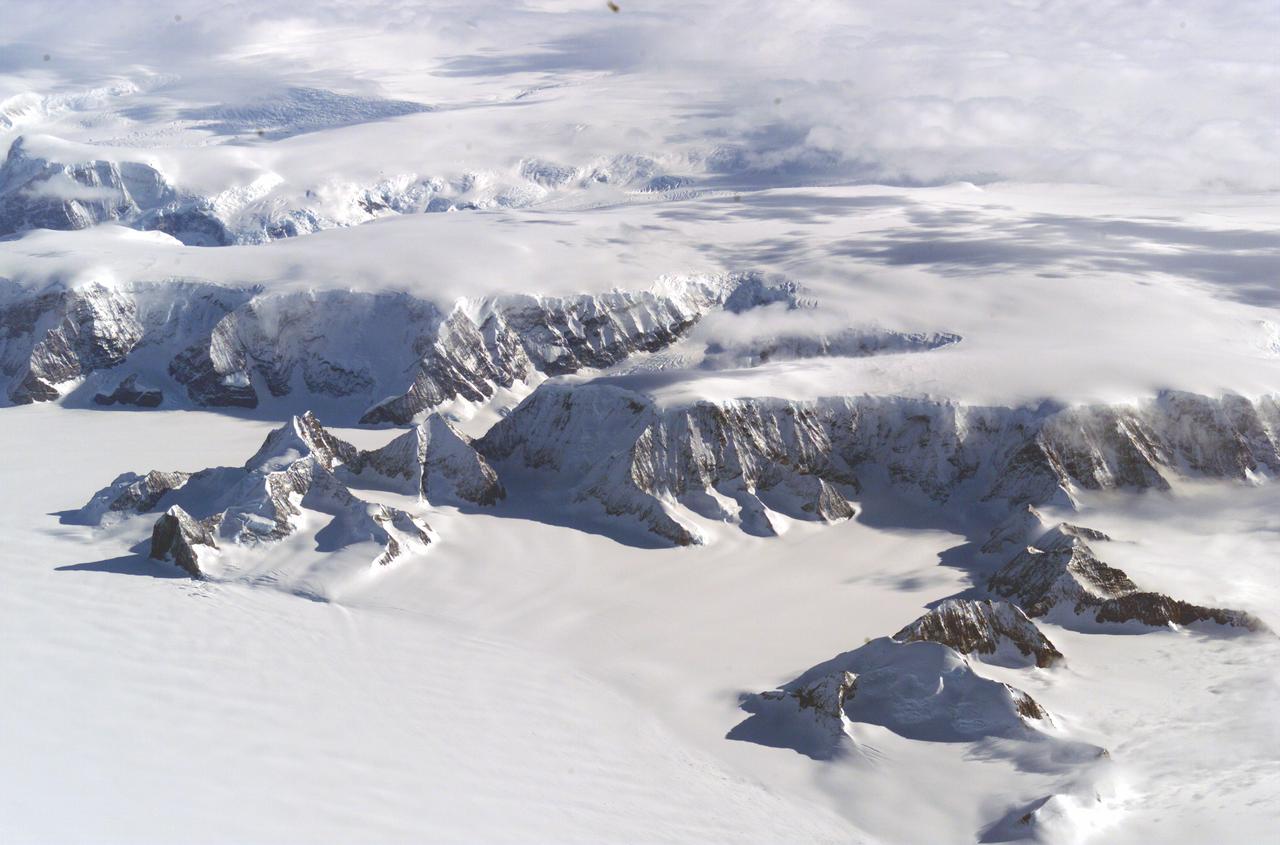
The Larsen Ice Shelf in Antarctica viewed from NASA's DC-8 aircraft during the AirSAR 2004 campaign. AirSAR 2004 is a three-week expedition in Central and South America by an international team of scientists that is using an all-weather imaging tool, called the Airborne Synthetic Aperture Radar (AirSAR), located onboard NASA's DC-8 airborne laboratory. Scientists from many parts of the world are combining ground research with NASA's AirSAR technology to improve and expand on the quality of research they are able to conduct. These photos are from the DC-8 aircraft while flying an AirSAR mission over Antarctica. The Antarctic Peninsula is more similar to Alaska and Patagonia than to the rest of the Antarctic continent. It is drained by fast glaciers, receives abundant precipitation, and melts significantly in the summer months. In recent decades, the Peninsula has experienced significant atmospheric warming (about 2 degrees C since 1950), which has triggered a vast and spectacular retreat of its floating ice shelves, glacier reduction, a decrease in permanent snow cover and a lengthening of the melt season. As a result, the contribution to sea level from this region could be rapid and substantial. With an area of 120,000 km, or ten times the Patagonia ice fields, the Peninsula could contribute as much as 0.4mm/yr sea level rise, which would be the largest single contribution to sea level from anywhere in the world. This region is being studied by NASA using a DC-8 equipped with the Airborne Synthetic Aperture Radar developed by scientists from NASA’s Jet Propulsion Laboratory. AirSAR will provide a baseline model and unprecedented mapping of the region. This data will make it possible to determine whether the warming trend is slowing, continuing or accelerating. AirSAR will also provide reliable information on ice shelf thickness to measure the contribution of the glaciers to sea level.

The Larsen Ice Shelf in Antarctica viewed from NASA's DC-8 aircraft during the AirSAR 2004 campaign. AirSAR 2004 is a three-week expedition in Central and South America by an international team of scientists that is using an all-weather imaging tool, called the Airborne Synthetic Aperture Radar (AirSAR), located onboard NASA's DC-8 airborne laboratory. Scientists from many parts of the world are combining ground research with NASA's AirSAR technology to improve and expand on the quality of research they are able to conduct. These photos are from the DC-8 aircraft while flying an AirSAR mission over Antarctica. The Antarctic Peninsula is more similar to Alaska and Patagonia than to the rest of the Antarctic continent. It is drained by fast glaciers, receives abundant precipitation, and melts significantly in the summer months. In recent decades, the Peninsula has experienced significant atmospheric warming (about 2 degrees C since 1950), which has triggered a vast and spectacular retreat of its floating ice shelves, glacier reduction, a decrease in permanent snow cover and a lengthening of the melt season. As a result, the contribution to sea level from this region could be rapid and substantial. With an area of 120,000 km, or ten times the Patagonia ice fields, the Peninsula could contribute as much as 0.4mm/yr sea level rise, which would be the largest single contribution to sea level from anywhere in the world. This region is being studied by NASA using a DC-8 equipped with an Airborne Synthetic Aperture Radar (AirSAR) developed by scientists from NASA’s Jet Propulsion Laboratory. AirSAR will provide a baseline model and unprecedented mapping of the region. This data will make it possible to determine whether the warming trend is slowing, continuing or accelerating. AirSAR will also provide reliable information on ice shelf thickness to measure the contribution of the glaciers to sea level.
The Larsen Ice Shelf in Antarctica viewed from NASA's DC-8 aircraft during the AirSAR 2004 campaign. AirSAR 2004 is a three-week expedition in Central and South America by an international team of scientists that is using an all-weather imaging tool, called the Airborne Synthetic Aperture Radar (AirSAR), located onboard NASA's DC-8 airborne laboratory. Scientists from many parts of the world are combining ground research with NASA's AirSAR technology to improve and expand on the quality of research they are able to conduct. These photos are from the DC-8 aircraft while flying an AirSAR mission over Antarctica. The Antarctic Peninsula is more similar to Alaska and Patagonia than to the rest of the Antarctic continent. It is drained by fast glaciers, receives abundant precipitation, and melts significantly in the summer months. In recent decades, the Peninsula has experienced significant atmospheric warming (about 2 degrees C since 1950), which has triggered a vast and spectacular retreat of its floating ice shelves, glacier reduction, a decrease in permanent snow cover and a lengthening of the melt season. As a result, the contribution to sea level from this region could be rapid and substantial. With an area of 120,000 km, or ten times the Patagonia ice fields, the Peninsula could contribute as much as 0.4mm/yr sea level rise, which would be the largest single contribution to sea level from anywhere in the world. This region is being studied by NASA using a DC-8 equipped with the Airborne Synthetic Aperture Radar developed by scientists from NASA’s Jet Propulsion Laboratory. AirSAR will provide a baseline model and unprecedented mapping of the region. This data will make it possible to determine whether the warming trend is slowing, continuing or accelerating. AirSAR will also provide reliable information on ice shelf thickness to measure the contribution of the glaciers to sea level.

The Larsen Ice Shelf in Antarctica viewed from NASA's DC-8 aircraft during the AirSAR 2004 campaign. AirSAR 2004 is a three-week expedition in Central and South America by an international team of scientists that is using an all-weather imaging tool, called the Airborne Synthetic Aperture Radar (AirSAR), located onboard NASA's DC-8 airborne laboratory. Scientists from many parts of the world are combining ground research with NASA's AirSAR technology to improve and expand on the quality of research they are able to conduct. These photos are from the DC-8 aircraft while flying an AirSAR mission over Antarctica. The Antarctic Peninsula is more similar to Alaska and Patagonia than to the rest of the Antarctic continent. It is drained by fast glaciers, receives abundant precipitation, and melts significantly in the summer months. In recent decades, the Peninsula has experienced significant atmospheric warming (about 2 degrees C since 1950), which has triggered a vast and spectacular retreat of its floating ice shelves, glacier reduction, a decrease in permanent snow cover and a lengthening of the melt season. As a result, the contribution to sea level from this region could be rapid and substantial. With an area of 120,000 km, or ten times the Patagonia ice fields, the Peninsula could contribute as much as 0.4mm/yr sea level rise, which would be the largest single contribution to sea level from anywhere in the world. This region is being studied by NASA using a DC-8 equipped with the Airborne Synthetic Aperture Radar developed by scientists from NASA’s Jet Propulsion Laboratory. AirSAR will provide a baseline model and unprecedented mapping of the region. This data will make it possible to determine whether the warming trend is slowing, continuing or accelerating. AirSAR will also provide reliable information on ice shelf thickness to measure the contribution of the glaciers to sea level.
The Larsen Ice Shelf in Antarctica viewed from NASA's DC-8 aircraft during the AirSAR 2004 campaign. AirSAR 2004 is a three-week expedition in Central and South America by an international team of scientists that is using an all-weather imaging tool, called the Airborne Synthetic Aperture Radar (AirSAR), located onboard NASA's DC-8 airborne laboratory. Scientists from many parts of the world are combining ground research with NASA's AirSAR technology to improve and expand on the quality of research they are able to conduct. These photos are from the DC-8 aircraft while flying an AirSAR mission over Antarctica. The Antarctic Peninsula is more similar to Alaska and Patagonia than to the rest of the Antarctic continent. It is drained by fast glaciers, receives abundant precipitation, and melts significantly in the summer months. In recent decades, the Peninsula has experienced significant atmospheric warming (about 2 degrees C since 1950), which has triggered a vast and spectacular retreat of its floating ice shelves, glacier reduction, a decrease in permanent snow cover and a lengthening of the melt season. As a result, the contribution to sea level from this region could be rapid and substantial. With an area of 120,000 km, or ten times the Patagonia ice fields, the Peninsula could contribute as much as 0.4mm/yr sea level rise, which would be the largest single contribution to sea level from anywhere in the world. This region is being studied by NASA using a DC-8 equipped with the Airborne Synthetic Aperture Radar developed by scientists from NASA’s Jet Propulsion Laboratory. AirSAR will provide a baseline model and unprecedented mapping of the region. This data will make it possible to determine whether the warming trend is slowing, continuing or accelerating. AirSAR will also provide reliable information on ice shelf thickness to measure the contribution of the glaciers to sea level.
The Larsen Ice Shelf in Antarctica viewed from NASA's DC-8 aircraft during the AirSAR 2004 campaign. AirSAR 2004 is a three-week expedition in Central and South America by an international team of scientists that is using an all-weather imaging tool, called the Airborne Synthetic Aperture Radar (AirSAR), located onboard NASA's DC-8 airborne laboratory. Scientists from many parts of the world are combining ground research with NASA's AirSAR technology to improve and expand on the quality of research they are able to conduct. These photos are from the DC-8 aircraft while flying an AirSAR mission over Antarctica. The Antarctic Peninsula is more similar to Alaska and Patagonia than to the rest of the Antarctic continent. It is drained by fast glaciers, receives abundant precipitation, and melts significantly in the summer months. In recent decades, the Peninsula has experienced significant atmospheric warming (about 2 degrees C since 1950), which has triggered a vast and spectacular retreat of its floating ice shelves, glacier reduction, a decrease in permanent snow cover and a lengthening of the melt season. As a result, the contribution to sea level from this region could be rapid and substantial. With an area of 120,000 km, or ten times the Patagonia ice fields, the Peninsula could contribute as much as 0.4mm/yr sea level rise, which would be the largest single contribution to sea level from anywhere in the world. This region is being studied by NASA using a DC-8 equipped with the Airborne Synthetic Aperture Radar developed by scientists from NASA’s Jet Propulsion Laboratory. AirSAR will provide a baseline model and unprecedented mapping of the region. This data will make it possible to determine whether the warming trend is slowing, continuing or accelerating. AirSAR will also provide reliable information on ice shelf thickness to measure the contribution of the glaciers to sea level.
The Larsen Ice Shelf in Antarctica viewed from NASA's DC-8 aircraft during the AirSAR 2004 campaign. AirSAR 2004 is a three-week expedition in Central and South America by an international team of scientists that is using an all-weather imaging tool, called the Airborne Synthetic Aperture Radar (AirSAR), located onboard NASA's DC-8 airborne laboratory. Scientists from many parts of the world are combining ground research with NASA's AirSAR technology to improve and expand on the quality of research they are able to conduct. These photos are from the DC-8 aircraft while flying an AirSAR mission over Antarctica. The Antarctic Peninsula is more similar to Alaska and Patagonia than to the rest of the Antarctic continent. It is drained by fast glaciers, receives abundant precipitation, and melts significantly in the summer months. In recent decades, the Peninsula has experienced significant atmospheric warming (about 2 degrees C since 1950), which has triggered a vast and spectacular retreat of its floating ice shelves, glacier reduction, a decrease in permanent snow cover and a lengthening of the melt season. As a result, the contribution to sea level from this region could be rapid and substantial. With an area of 120,000 km, or ten times the Patagonia ice fields, the Peninsula could contribute as much as 0.4mm/yr sea level rise, which would be the largest single contribution to sea level from anywhere in the world. This region is being studied by NASA using a DC-8 equipped with the Airborne Synthetic Aperture Radar developed by scientists from NASA’s Jet Propulsion Laboratory. AirSAR will provide a baseline model and unprecedented mapping of the region. This data will make it possible to determine whether the warming trend is slowing, continuing or accelerating. AirSAR will also provide reliable information on ice shelf thickness to measure the contribution of the glaciers to sea level.
The Larsen Ice Shelf in Antarctica viewed from NASA's DC-8 aircraft during the AirSAR 2004 campaign. AirSAR 2004 is a three-week expedition in Central and South America by an international team of scientists that is using an all-weather imaging tool, called the Airborne Synthetic Aperture Radar (AirSAR), located onboard NASA's DC-8 airborne laboratory. Scientists from many parts of the world are combining ground research with NASA's AirSAR technology to improve and expand on the quality of research they are able to conduct. These photos are from the DC-8 aircraft while flying an AirSAR mission over Antarctica. The Antarctic Peninsula is more similar to Alaska and Patagonia than to the rest of the Antarctic continent. It is drained by fast glaciers, receives abundant precipitation, and melts significantly in the summer months. In recent decades, the Peninsula has experienced significant atmospheric warming (about 2 degrees C since 1950), which has triggered a vast and spectacular retreat of its floating ice shelves, glacier reduction, a decrease in permanent snow cover and a lengthening of the melt season. As a result, the contribution to sea level from this region could be rapid and substantial. With an area of 120,000 km, or ten times the Patagonia ice fields, the Peninsula could contribute as much as 0.4mm/yr sea level rise, which would be the largest single contribution to sea level from anywhere in the world. This region is being studied by NASA using a DC-8 equipped with the Airborne Synthetic Aperture Radar developed by scientists from NASA’s Jet Propulsion Laboratory. AirSAR will provide a baseline model and unprecedented mapping of the region. This data will make it possible to determine whether the warming trend is slowing, continuing or accelerating. AirSAR will also provide reliable information on ice shelf thickness to measure the contribution of the glaciers to sea level.
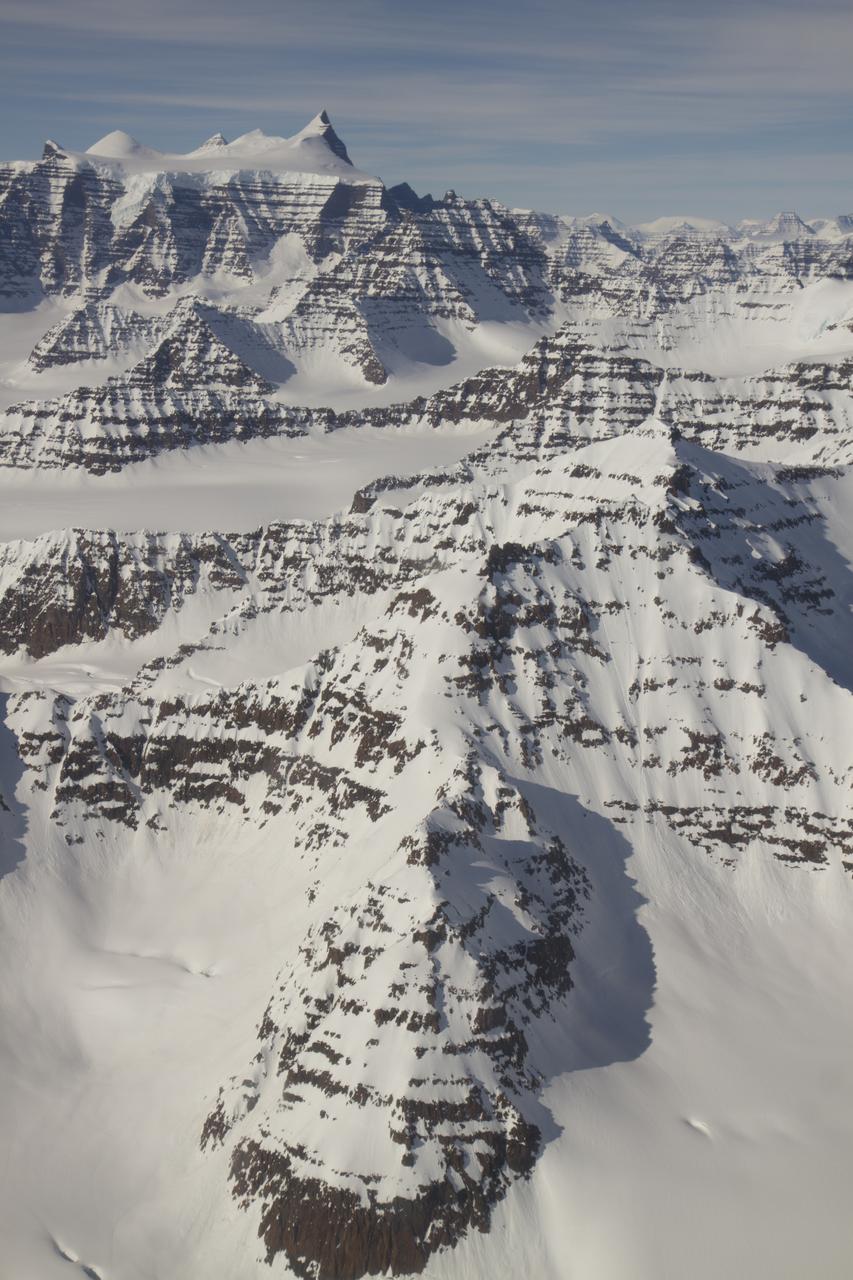
A wider view of mountains showing the distinctive geology of the Geikie Plateau region in eastern Greenland, as seen from NASA's P-3B aircraft on April 16, 2012. Credit: NASA/GSFC/Jefferson Beck =========== IceBridge, a six-year NASA mission, is the largest airborne survey of Earth's polar ice ever flown. It will yield an unprecedented three-dimensional view of Arctic and Antarctic ice sheets, ice shelves and sea ice. These flights will provide a yearly, multi-instrument look at the behavior of the rapidly changing features of the Greenland and Antarctic ice. Data collected during IceBridge will help scientists bridge the gap in polar observations between NASA's Ice, Cloud and Land Elevation Satellite (ICESat) -- in orbit since 2003 -- and ICESat-2, planned for early 2016. ICESat stopped collecting science data in 2009, making IceBridge critical for ensuring a continuous series of observations. IceBridge will use airborne instruments to map Arctic and Antarctic areas once a year. IceBridge flights are conducted in March-May over Greenland and in October-November over Antarctica. Other smaller airborne surveys around the world are also part of the IceBridge campaign. To read more about IceBridge - Arctic 2012 go to: <a href="http://www.nasa.gov/mission_pages/icebridge/index.html" rel="nofollow">www.nasa.gov/mission_pages/icebridge/index.html</a> <b><a href="http://www.nasa.gov/audience/formedia/features/MP_Photo_Guidelines.html" rel="nofollow">NASA image use policy.</a></b> <b><a href="http://www.nasa.gov/centers/goddard/home/index.html" rel="nofollow">NASA Goddard Space Flight Center</a></b> enables NASA’s mission through four scientific endeavors: Earth Science, Heliophysics, Solar System Exploration, and Astrophysics. Goddard plays a leading role in NASA’s accomplishments by contributing compelling scientific knowledge to advance the Agency’s mission. <b>Follow us on <a href="http://twitter.com/NASA_GoddardPix" rel="nofollow">Twitter</a></b> <b>Like us on <a href="http://www.facebook.com/pages/Greenbelt-MD/NASA-Goddard/395013845897?ref=tsd" rel="nofollow">Facebook</a></b> <b>Find us on <a href="http://instagrid.me/nasagoddard/?vm=grid" rel="nofollow">Instagram</a></b>
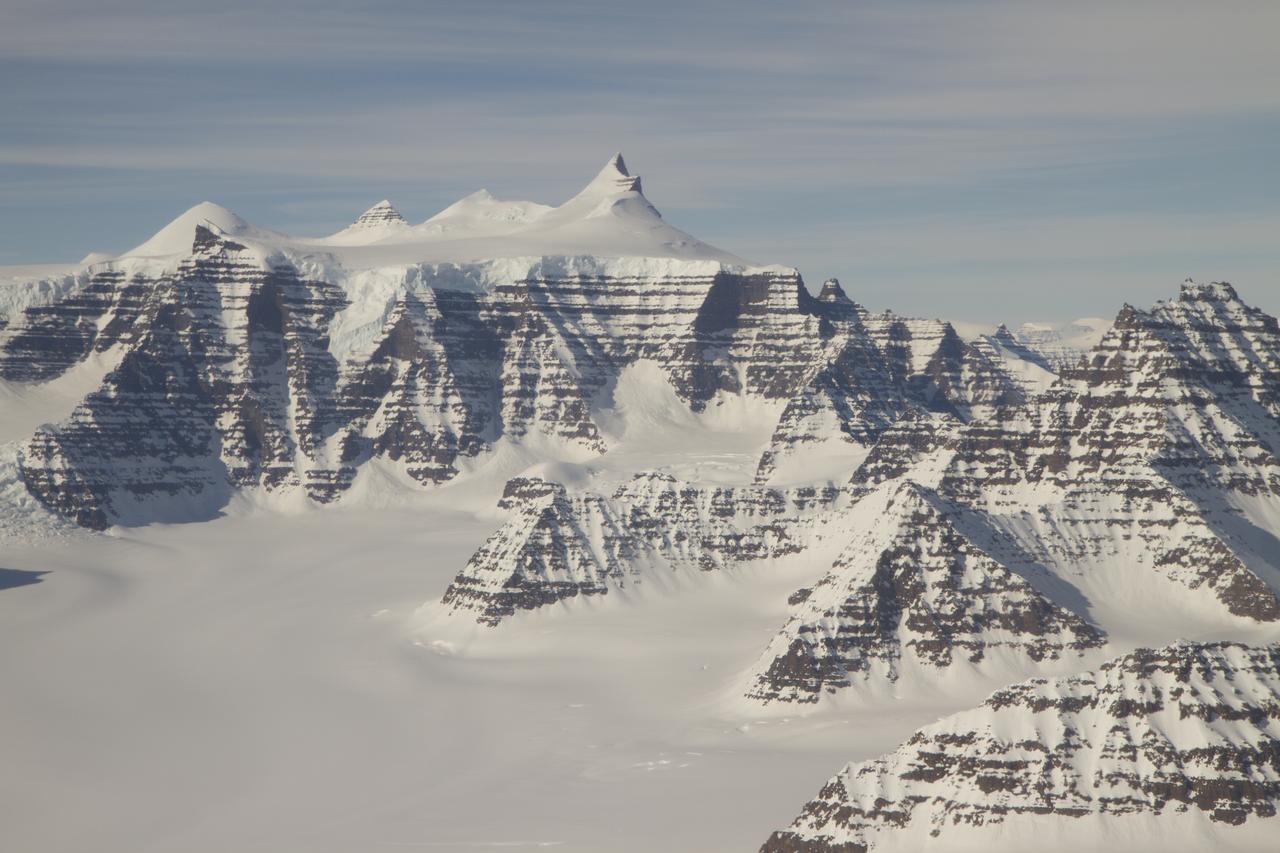
Mountain ridges showing the distinctive geology of the Geikie Plateau region in eastern Greenland, as seen from NASA's P-3B aircraft on April 16, 2012. Credit: NASA/GSFC/Jefferson Beck =========== IceBridge, a six-year NASA mission, is the largest airborne survey of Earth's polar ice ever flown. It will yield an unprecedented three-dimensional view of Arctic and Antarctic ice sheets, ice shelves and sea ice. These flights will provide a yearly, multi-instrument look at the behavior of the rapidly changing features of the Greenland and Antarctic ice. Data collected during IceBridge will help scientists bridge the gap in polar observations between NASA's Ice, Cloud and Land Elevation Satellite (ICESat) -- in orbit since 2003 -- and ICESat-2, planned for early 2016. ICESat stopped collecting science data in 2009, making IceBridge critical for ensuring a continuous series of observations. IceBridge will use airborne instruments to map Arctic and Antarctic areas once a year. IceBridge flights are conducted in March-May over Greenland and in October-November over Antarctica. Other smaller airborne surveys around the world are also part of the IceBridge campaign. To read more about IceBridge - Arctic 2012 go to: <a href="http://www.nasa.gov/mission_pages/icebridge/index.html" rel="nofollow">www.nasa.gov/mission_pages/icebridge/index.html</a> <b><a href="http://www.nasa.gov/audience/formedia/features/MP_Photo_Guidelines.html" rel="nofollow">NASA image use policy.</a></b> <b><a href="http://www.nasa.gov/centers/goddard/home/index.html" rel="nofollow">NASA Goddard Space Flight Center</a></b> enables NASA’s mission through four scientific endeavors: Earth Science, Heliophysics, Solar System Exploration, and Astrophysics. Goddard plays a leading role in NASA’s accomplishments by contributing compelling scientific knowledge to advance the Agency’s mission. <b>Follow us on <a href="http://twitter.com/NASA_GoddardPix" rel="nofollow">Twitter</a></b> <b>Like us on <a href="http://www.facebook.com/pages/Greenbelt-MD/NASA-Goddard/395013845897?ref=tsd" rel="nofollow">Facebook</a></b> <b>Find us on <a href="http://instagrid.me/nasagoddard/?vm=grid" rel="nofollow">Instagram</a></b>

AS04-01-580 (9 Nov. 1967) --- Earth as viewed from 10,000 miles. In 1969, the Apollo 4 (Spacecraft 017/Saturn 501) unmanned test flight made a great ellipse around Earth as a test of the translunar motors and of the high speed entry required of a manned flight returning from the moon. A 70mm camera was programmed to look out a window toward Earth, and take a series of photographs from "high apogee". Coastal Brazil, Atlantic Ocean, West Africa, Antarctica, looking west. This photograph was made when the Apollo 4 spacecraft, still attached to the S-IVB (third) stage, was orbiting Earth at an altitude of 9,544 miles.

AS04-01-410 (9 Nov. 1967) --- Coastal Brazil, Atlantic Ocean, West Africa, Sahara, Antarctica, looking west, as photographed from the Apollo 4 (Spacecraft 017/Saturn 501) unmanned, Earth-orbital space mission. This picture was taken when the Spacecraft 017 and Saturn S-IVB (third) stage were orbiting Earth at an altitude of 9,745 nautical miles.
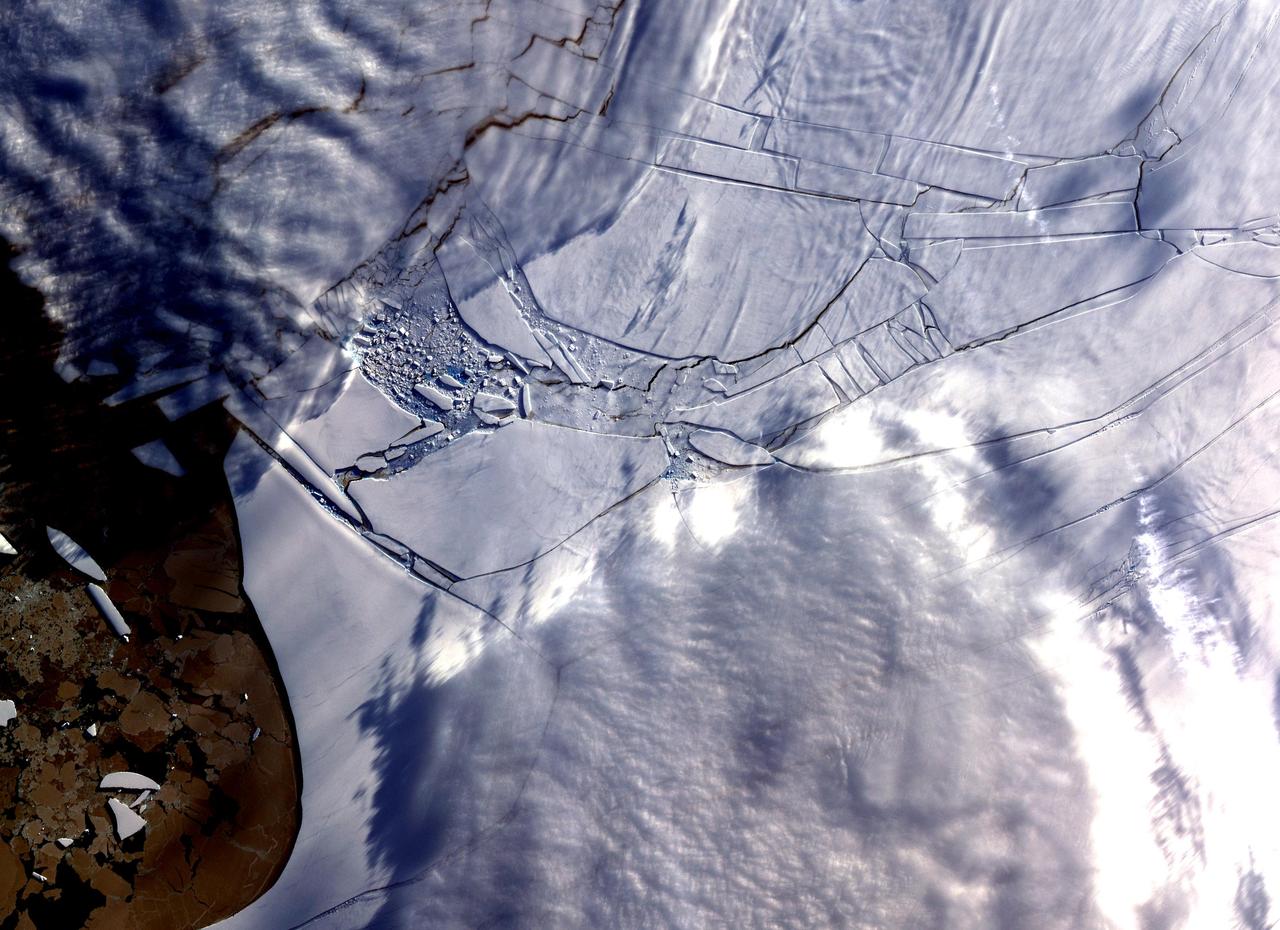
The Wilkins Ice Shelf, as seen by NASA Terra spacecraft, on the western side of the Antarctic Peninsula, experienced multiple disintegration events in 2008. By the beginning of 2009, a narrow ice bridge was all that remained to connect the ice shelf to ice fragments fringing nearby Charcot Island. That bridge gave way in early April 2009. Days after the ice bridge rupture, on April 12, 2009, the Advanced Spaceborne Thermal Emission and Reflection Radiometer (ASTER) on NASA's Terra satellite acquired this image of the southern base of the ice bridge, where it connected with the remnant ice shelf. Although the ice bridge has played a role in stabilizing the ice fragments in the region, its rupture doesn't guarantee the ice will immediately move away. http://photojournal.jpl.nasa.gov/catalog/PIA11991
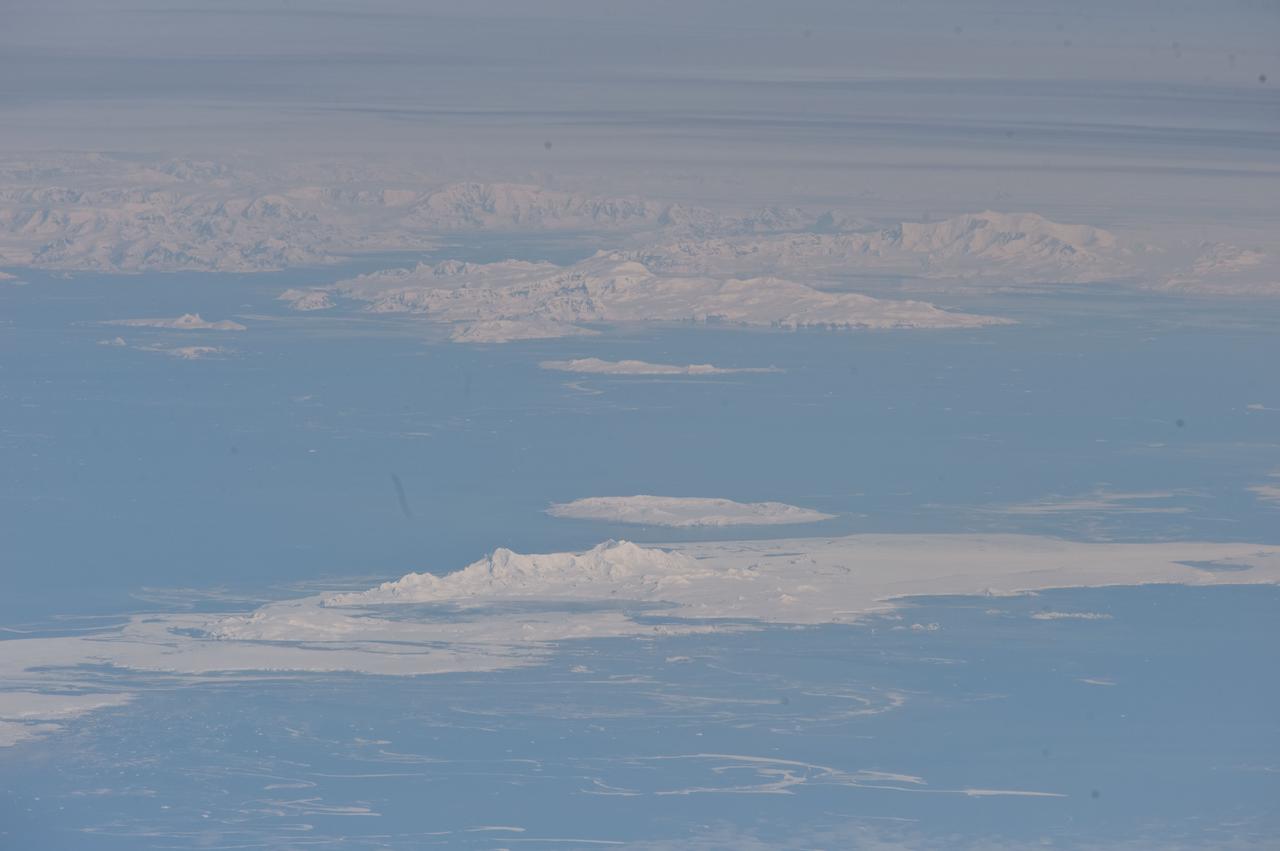
ISS029-E-041836 (4 Oct. 2011) --- South Shetland Islands and Antarctic Peninsula are featured in this image photographed by an Expedition 29 crew member on the International Space Station (ISS). The inclined equatorial orbit of the space station limits nadir Earth views?looking ?straight down? at the surface from the spacecraft?to latitudes between approximately 52 North and 52 South. When viewing conditions are ideal, the crew can obtain detailed oblique imagery?looking outwards at an angle from the space station?of regions at higher latitudes such as Greenland or, in this image, Antarctica. While the bulk of the continent of Antarctica is currently situated over the South Pole, the narrow Antarctic Peninsula extends like a finger towards the southern tip of South America. The northernmost part of the Peninsula is known as Graham Land, a small portion of which (located at approximately 64 South latitude) can be seen at top left in this photograph. Two of the South Shetland Islands that lay off the coast of Graham Land to the north-northwest, Livingston Island and Deception Island, are visible in the image. While both islands have a volcanic origin, active volcanism at Deception Island has been recorded since 1800; the last verified eruptive activity occurred in 1970. Closer to the coastline of Graham Land, Brabant Island (not considered to be part of the South Shetlands) also includes numerous outcrops of volcanic rock attesting to the complex tectonic history of the region. The space station was located over the South Atlantic Ocean, approximately 1,800 kilometers to the northeast in terms of its ground track, when this image was taken. This long viewing distance, combined with the highly oblique viewing angle, accentuates shadowing of the ground surface and provides a sense of the topography similar to the view one gets from an airplane. It also causes foreshortening of features visible in the image, making them appear closer to each other than they actually are ? for example, the actual distance between Livingston and Deception Islands is approximately 20 kilometers.
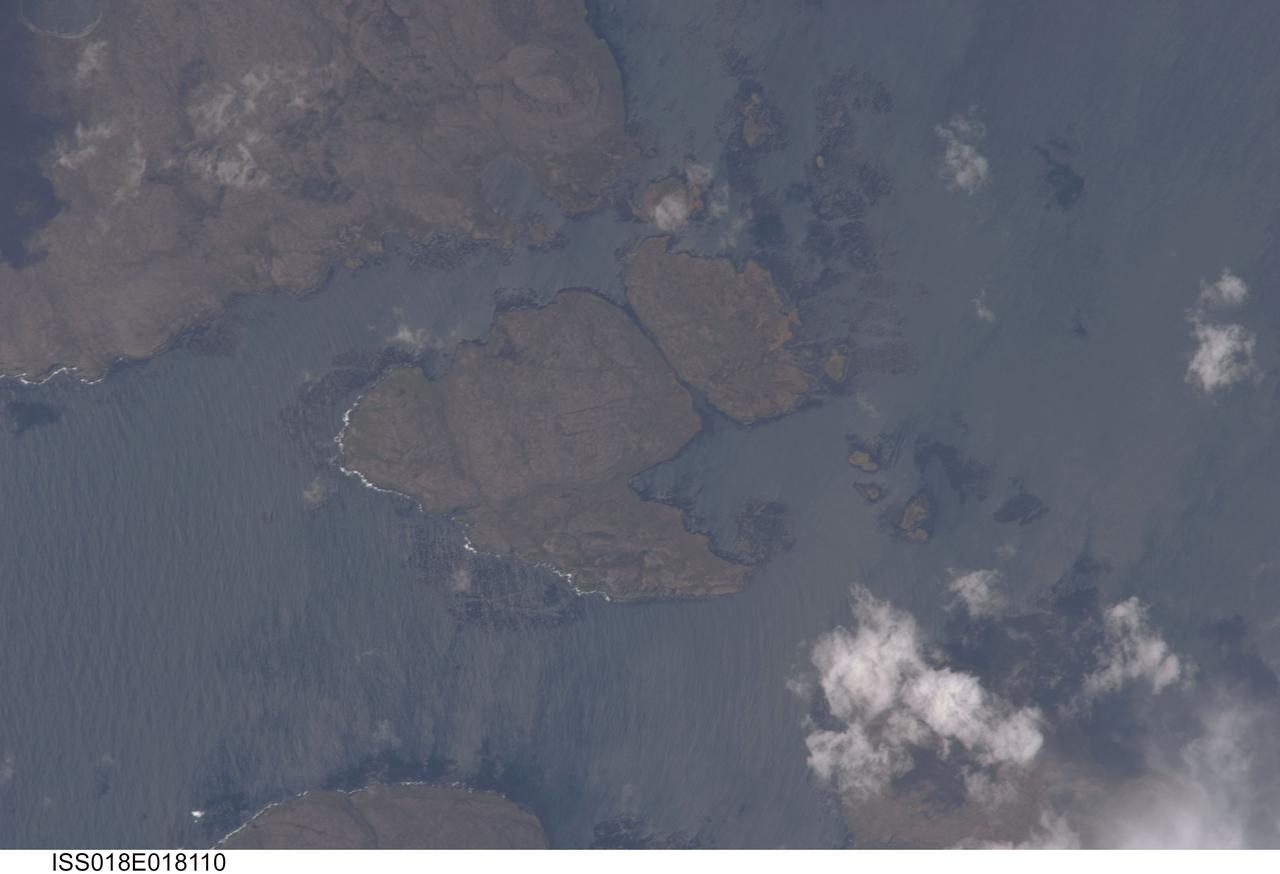
ISS018-E-018110 (6 Jan. 2009) --- Kerguelen Kelp Beds in the Southern Indian Ocean are featured in this image photographed by an Expedition 18 crewmember on the International Space Station. MacMurdo and Howe Islands are two of the 300 islands of the Kerguelen Archipelago, a remote place located in the Southern Indian Ocean that belongs to the French Southern and Antarctic Lands. The Kerguelen Archipelago is also known as the "Desolation Islands". The coastal regions of the islands support low vegetation (mainly genus Acaena), while elevations above 50 meters are rocky. There are no permanent inhabitants of the islands, but there is a permanent settlement (Port aux Francais) that hosts scientists mainly interested in biology, oceanography and earth sciences ? in addition, the settlement maintains a weather station and satellite/rocket tracking station. Latitudinal weather conditions are typical from the ?roaring forties? through the ?furious fifties? - on the day this image was taken, the mean daily temperature was 4.5 degrees Celsius with mean westerly winds of 9 meters per second. A substantial proportion of the coastlines of sub-Antarctic islands, like the Kerguelen Islands, are occupied by highly productive giant kelp beds (Macrocystis pyrifera). One of the largest marine macroalgaes, the species can grow up to 50 meters in length, forming undersea forests in hard-bottom subtidal areas. Fronds can spread out to form a canopy which can totally cover the water surface ? we interpret that the black patches surrounding coastal areas in this astronaut photograph are the offshore kelp beds. These forests serve as a habitat for marine fauna, and due to their large biomass and relatively long turnover act as an efficient sink for atmospheric carbon dioxide. The surface wave pattern traveling southeastward along the gray-blue ocean surface, and through the kelp beds, are visible due to the sunglint from the water surface. This also improves the identification of the kelp beds by creating a different water texture (and therefore a contrast) between the dark vegetation and the ocean surface. Kerguelen Archipelago hosts thousands of marine birds (penguins, albatrosses, and petrels among others) and seals (elephant and Antarctic fur species). Whales (humpback) and dolphins (killer whales and Commerson's dolphin) are very common in the area. Fishing boats also frequent the Archipelago ? including unlicensed, so-called ?pirate? fishing vessels.

NASA's Polar Radiant Energy in the Far-InfraRed Experiment (PREFIRE) mission will measure the amount of heat Earth emits into space from two of the coldest, most remote regions on the planet. Data from the mission will improve computer models researchers use to predict how Earth's ice, seas, and weather will change in a warming world. This artist's concept depicts one of two PREFIRE CubeSats in orbit around Earth. Earth absorbs a lot of the Sun's energy at the tropics, and weather and ocean currents transport that heat to the poles. Ice, snow, clouds, and other parts of the polar environment emit the heat into space, much of it in the form of far-infrared radiation. The difference between how much heat Earth absorbs at the tropics and then radiates out to space from the Arctic and Antarctic determines the planet's temperature and drives a dynamic system of climate and weather. But far-infrared emissions at the poles have never been systematically measured. This is where PREFIRE comes in. The mission will help researchers gain a clearer understanding of when and where Earth's poles emit far-infrared radiation, as well as how atmospheric water vapor and clouds influence the amount that escapes to space. PREFIRE is composed of two roughly shoebox-size CubeSats outfitted with specialized miniature heat sensors that will give researchers a more accurate picture of how much heat Earth emits into space. https://photojournal.jpl.nasa.gov/catalog/PIA26185
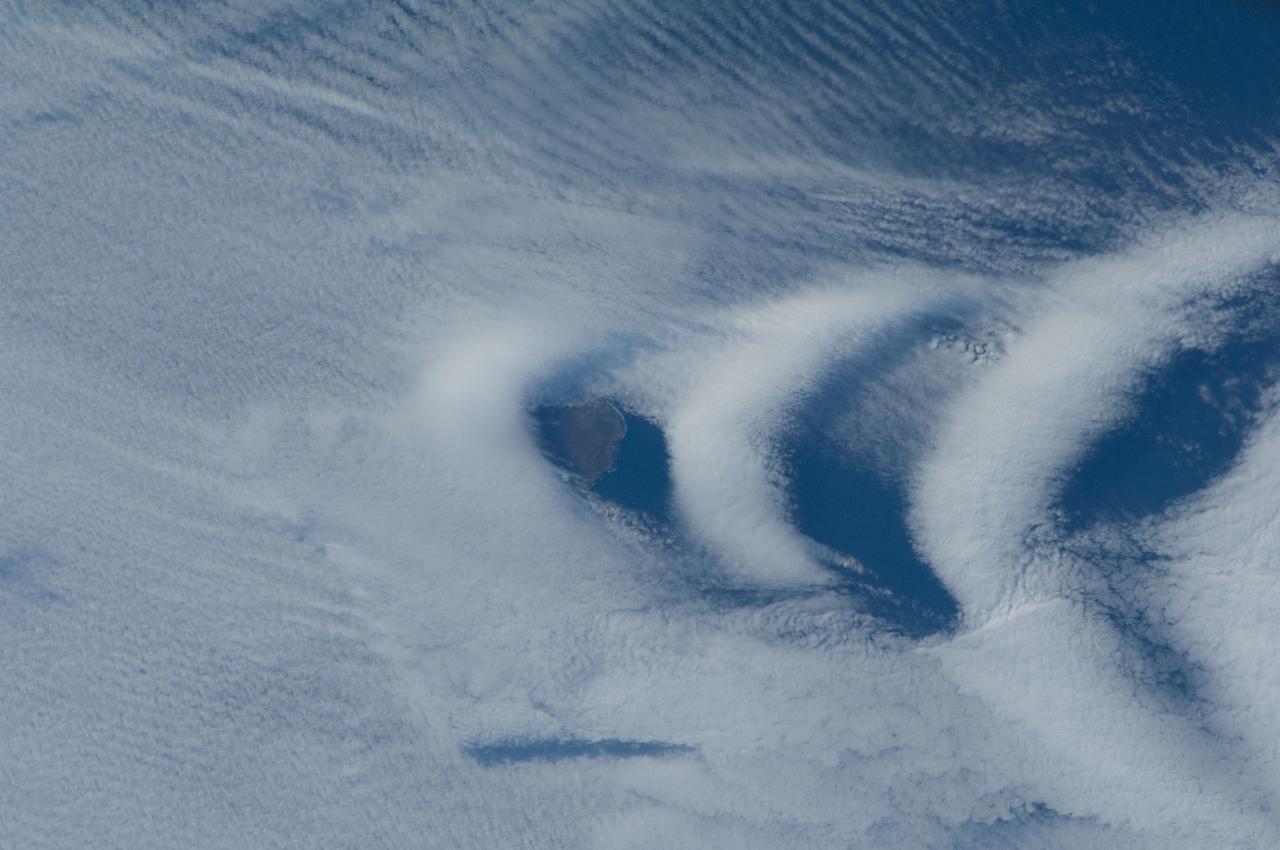
ISS030-E-193144 (25 March 2012) --- Wave clouds near Ile aux Cochons are featured in this image photographed by an Expedition 30 crew member on the International Space Station. This photograph illustrates the formation of wave clouds in the wake—or downwind side—of Ile aux Cochons (“Isle of Pigs”) located in the Southern Indian Ocean. The island is approximately located 3,000 kilometers southeast of the southern tip of the African continent and 2,300 kilometers northwest of Antarctica. The island itself, of which only a part of the eastern coastline is visible at center, is volcanic in origin with a summit elevation of 775 meters above sea level. According to scientists, the Ile aux Cochons stratovolcano is thought to have erupted within the last 12,000 years; however no historical activity has been recorded. The summit elevation is high enough for the land surface to interact with cloud layers and winds flowing past the island. Two major cloud layers are visible; a lower, more uniform layer consists of roughly parallel cloud “streets” that suggest a westerly flow pattern of air. When the air mass encounters the Ile aux Cochons, moisture-laden air rises and cools, causing more water vapor to condense into clouds. As the air mass passes over the summit of Ile aux Cochons and descends, it may encounter alternating moist and dry air layers, enabling the formation of the discontinuous chevron-shaped wave clouds in the wake of the island. While their appearance suggests that the clouds are forming in the wake of the island and moving eastwards, in fact it is the air mass that is moving, with clouds forming in regions of moist air and dissipating in dry regions. Ile aux Cochons is the westernmost of the islands that form the subantarctic Crozet Archipelago (part of the French Southern and Antarctic Lands). Accept for occasional research visits, the island is uninhabited. The island is an important breeding site for seabirds, including the world’s largest King Penguin colony.
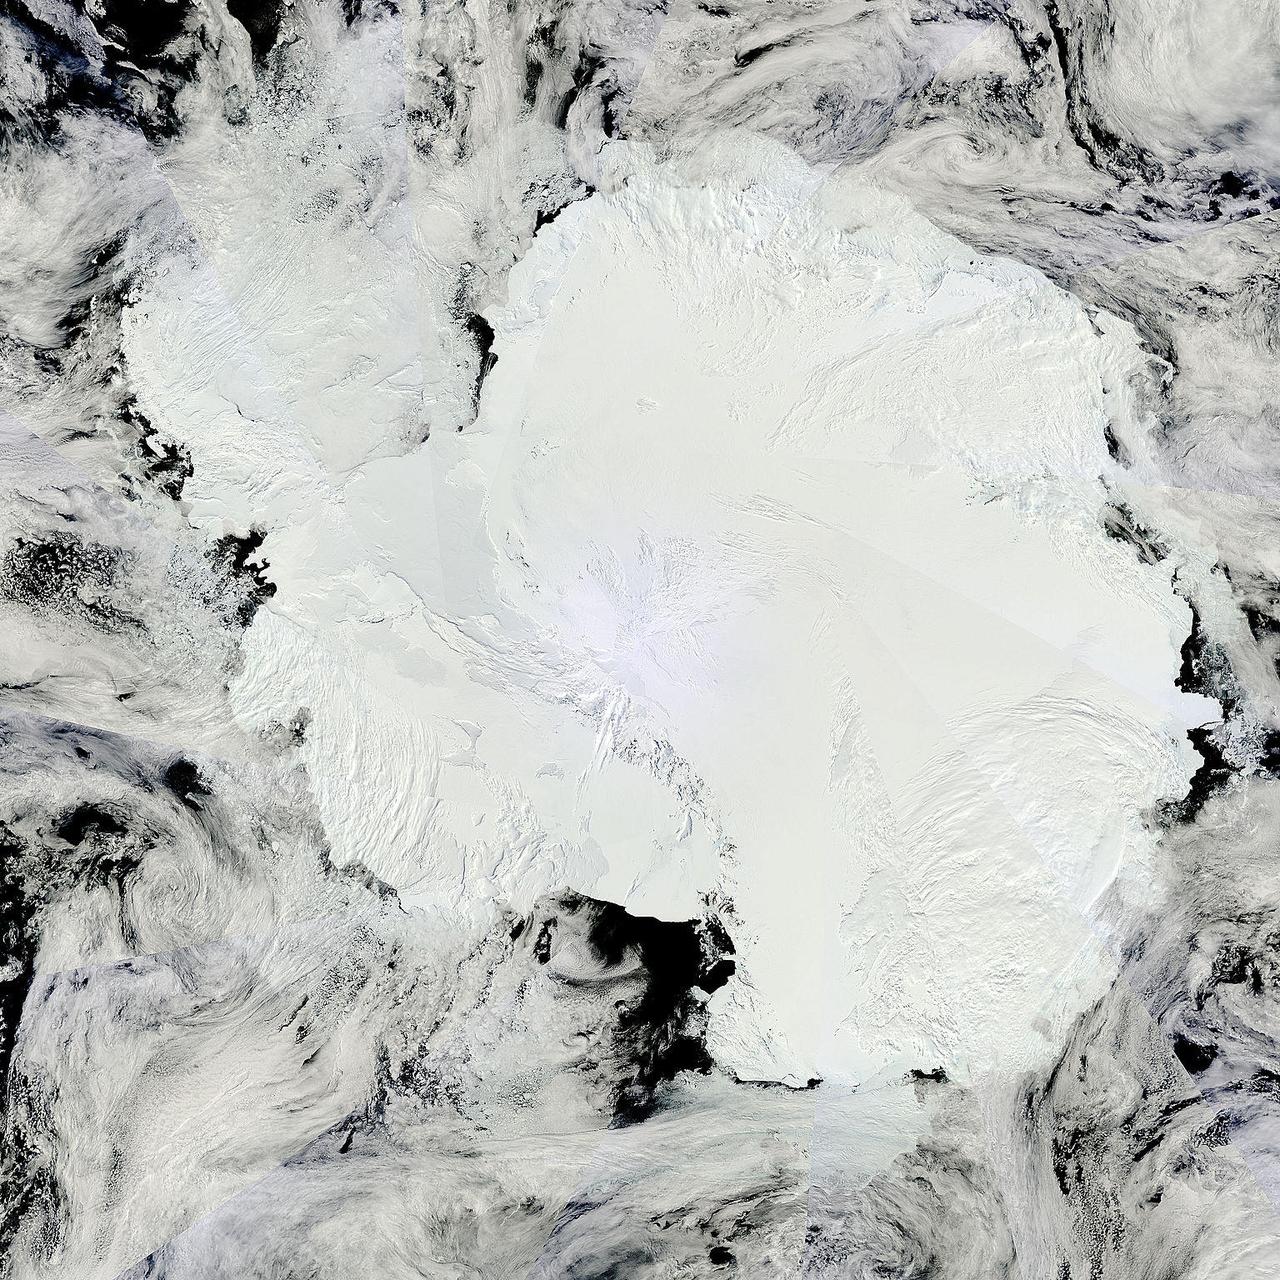
Antarctica is the coldest, driest and windiest place on Earth – and, during the austral summer, it is also the sunniest. Due to the tilt of the Earth’s axis in relation of the sun, the frozen land south of the Antarctic Circle receives six months of daylight in summertime, and six months of darkness in winter. The long hours of sunshine allow for excellent imagery of the region from space. This true-color mosaic of Antarctica was created from images acquired by multiple passes of the Moderate Resolution Imaging Spectroradiometer (MODIS) aboard the Terra satellite on December 16, 2013. Because Terra is in a polar orbit, it passes over each pole approximately 14 times a day, and acquires an image on each pass. To create a mosaic, the data that are closest to the center of each swath – where edge distortion is minimized – are used to create a complete view of the region. The MODIS Rapid Response system generates complete mosaic images of Antarctica every day in austral late spring, summer and early fall. Because the light is poor in austral late fall, winter and early spring, MODIS images are not created during that period. A mosaic of Antarctica can be found for any given day at NASA’s Project Antarctica at <a href="http://rapidfire.sci.gsfc.nasa.gov/subsets/?project=antarctica" rel="nofollow">rapidfire.sci.gsfc.nasa.gov/subsets/?project=antarctica</a> Credit: NASA/GSFC/Jeff Schmaltz/MODIS Land Rapid Response Team <b><a href="http://www.nasa.gov/audience/formedia/features/MP_Photo_Guidelines.html" rel="nofollow">NASA image use policy.</a></b> <b><a href="http://www.nasa.gov/centers/goddard/home/index.html" rel="nofollow">NASA Goddard Space Flight Center</a></b> enables NASA’s mission through four scientific endeavors: Earth Science, Heliophysics, Solar System Exploration, and Astrophysics. Goddard plays a leading role in NASA’s accomplishments by contributing compelling scientific knowledge to advance the Agency’s mission. <b>Follow us on <a href="http://twitter.com/NASA_GoddardPix" rel="nofollow">Twitter</a></b> <b>Like us on <a href="http://www.facebook.com/pages/Greenbelt-MD/NASA-Goddard/395013845897?ref=tsd" rel="nofollow">Facebook</a></b> <b>Find us on <a href="http://instagram.com/nasagoddard?vm=grid" rel="nofollow">Instagram</a></b>

ISS038-E-036501 (28 Jan. 2014) --- This wide field-of-view image photographed by an Expedition 38 crew member on the International Space Station shows an east-west swath of the southwestern Indian Ocean. Two remote islands, part of the French Southern and Antarctic Lands, appear in the center of the image. Possession Island (right center) and East Island (center) are both only 18 kilometers long. A smaller island, Ile aux Cochons (Pigs Island), lies 100 kilometers to the west. Each island has set up V-shaped trains of waves, like bow waves, as the air flows over the islands from the west (right to left). The bow-wave patterns are overlaid on the low regional stratus (blanket) cloud that is so common in the southern Indian Ocean at 50 degrees south latitude. This view was taken from more than 400 kilometers above the sea surface and reveals relationships that could not be readily understood by someone standing on one of the islands. For example, larger and higher islands produce larger waves. So the largest are being generated by Possession Island (934 meters above sea level at the highest point), and East Island, versus much smaller waves developed downwind of the tiny Ile de Pingouins (340 meters above sea level high, invisible below the cloud deck). Other patterns also can be detected. Waves in an upper layer can be seen casting shadows onto a lower layer (lower left). In the top half of the image the waves are making thicker and thinner zones in the clouds of the lower layer. Wave trains from Possession Island and Ile aux Cochons are interacting in a cross-hatch pattern (center).

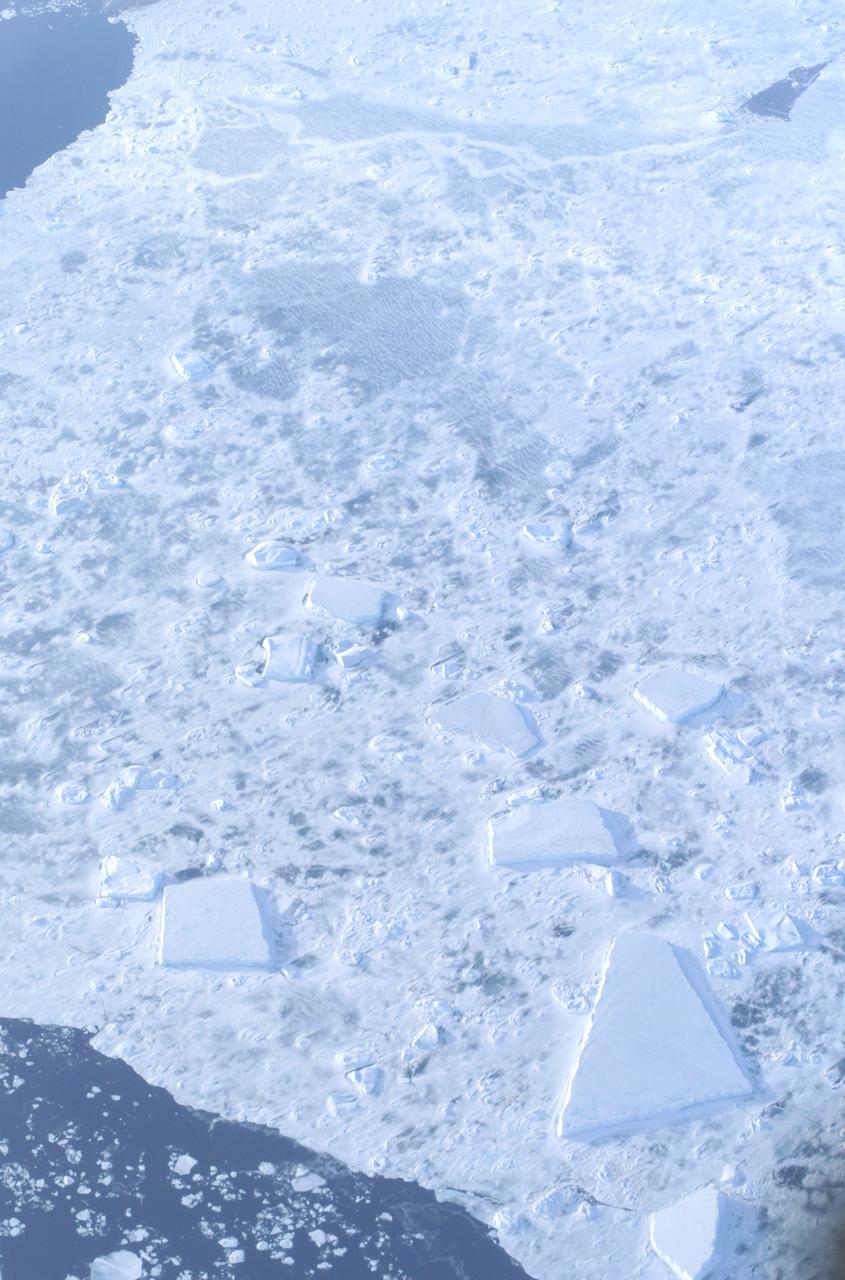
In May 2014, two new studies concluded that a section of the land-based West Antarctic ice sheet had reached a point of inevitable collapse. Meanwhile, fresh observations from September 2014 showed sea ice around Antarctica had reached its greatest extent since the late 1970s. To better understand such dynamic and dramatic differences in the region's land and sea ice, researchers are travelling south to Antarctica this month for the sixth campaign of NASA’s Operation IceBridge. The airborne campaign, which also flies each year over Greenland, makes annual surveys of the ice with instrumented research aircraft. Instruments range from lasers that map the elevation of the ice surface, radars that "see" below it, and downward looking cameras to provide a natural-color perspective. The Digital Mapping System (DMS) camera acquired the above photo during the mission’s first science flight on October 16, 2009. At the time of the image, the DC-8 aircraft was flying at an altitude of 515 meters (1,700 feet) over heavily compacted first-year sea ice along the edge of the Amundsen Sea. Since that first flight, much has been gleaned from IceBridge data. For example, images from an IceBridge flight in October 2011 revealed a massive crack running about 29 kilometers (18 miles) across the floating tongue of Antarctica's Pine Island Glacier. The crack ultimately led to a 725-square-kilometer (280-square-mile) iceberg. In 2012, IceBridge data was a key part of a new map of Antarctica called Bedmap2. By combining surface elevation, ice thickness, and bedrock topography, Bedmap2 gives a clearer picture of Antarctica from the ice surface down to the land surface. Discoveries have been made in Greenland, too, including the identification of a 740-kilometer-long (460-mile-long) mega canyon below the ice sheet. Repeated measurements of land and sea ice from aircraft extend the record of observations once made by NASA’s Ice, Cloud, and Land Elevation Satellite, or ICESat, which stopped functioning in 2009. In addition to extending the ICESat record, IceBridge also sets the stage for ICESat-2, which is scheduled for launch in 2017. Credit: IceBridge DMS L0 Raw Imagery courtesy of the Digital Mapping System (DMS) team/NASA DAAC at the National Snow and Ice Data Center More info: <a href="http://earthobservatory.nasa.gov/IOTD/view.php?id=84549" rel="nofollow">earthobservatory.nasa.gov/IOTD/view.php?id=84549</a> <a href="http://earthobservatory.nasa.gov/IOTD/view.php?id=84549" rel="nofollow">earthobservatory.nasa.gov/IOTD/view.php?id=84549</a>

Some of the BARREL balloon launches took place at the South African National Antarctic Expedition Research base, called SANAE IV, the others at Halley Research Station. This balloon is taking flight at SANAE IV. Credit: NASA --- In Antarctica in January, 2013 – the summer at the South Pole – scientists launched 20 balloons up into the air to study an enduring mystery of space weather: when the giant radiation belts surrounding Earth lose material, where do the extra particles actually go? The mission is called BARREL (Balloon Array for Radiation belt Relativistic Electron Losses) and it is led by physicist Robyn Millan of Dartmouth College in Hanover, NH. Millan provided photographs from the team’s time in Antarctica. The team launched a balloon every day or two into the circumpolar winds that circulate around the pole. Each balloon floated for anywhere from 3 to 40 days, measuring X-rays produced by fast-moving electrons high up in the atmosphere. BARREL works hand in hand with another NASA mission called the Van Allen Probes, which travels through the Van Allen radiation belts surrounding Earth. The belts wax and wane over time in response to incoming energy and material from the sun, sometimes intensifying the radiation through which satellites must travel. Scientists wish to understand this process better, and even provide forecasts of this space weather, in order to protect our spacecraft. As the Van Allen Probes were observing what was happening in the belts, BARREL tracked electrons that precipitated out of the belts and hurtled down Earth’s magnetic field lines toward the poles. By comparing data, scientists will be able to track how what’s happening in the belts correlates to the loss of particles – information that can help us understand this mysterious, dynamic region that can impact spacecraft. Having launched balloons in early 2013, the team is back at home building the next set of payloads. They will launch 20 more balloons in 2014. <b><a href="http://www.nasa.gov/audience/formedia/features/MP_Photo_Guidelines.html" rel="nofollow">NASA image use policy.</a></b> <b><a href="http://www.nasa.gov/centers/goddard/home/index.html" rel="nofollow">NASA Goddard Space Flight Center</a></b> enables NASA’s mission through four scientific endeavors: Earth Science, Heliophysics, Solar System Exploration, and Astrophysics. Goddard plays a leading role in NASA’s accomplishments by contributing compelling scientific knowledge to advance the Agency’s mission. <b>Follow us on <a href="http://twitter.com/NASA_GoddardPix" rel="nofollow">Twitter</a></b> <b>Like us on <a href="http://www.facebook.com/pages/Greenbelt-MD/NASA-Goddard/395013845897?ref=tsd" rel="nofollow">Facebook</a></b> <b>Find us on <a href="http://instagram.com/nasagoddard?vm=grid" rel="nofollow">Instagram</a></b>