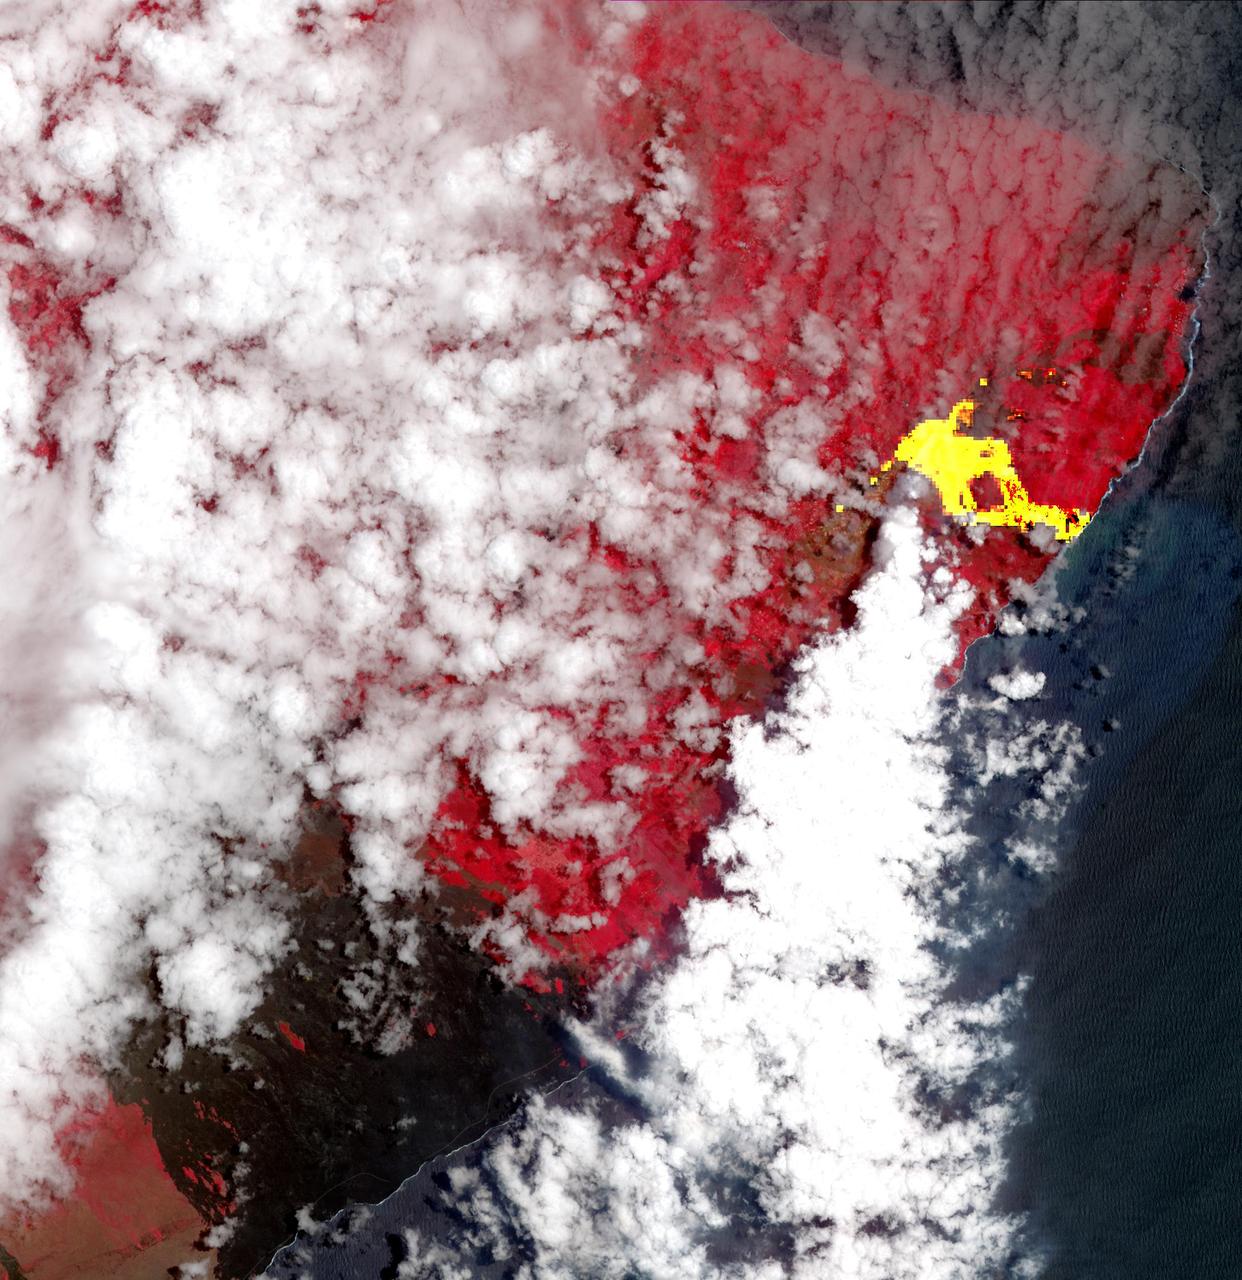
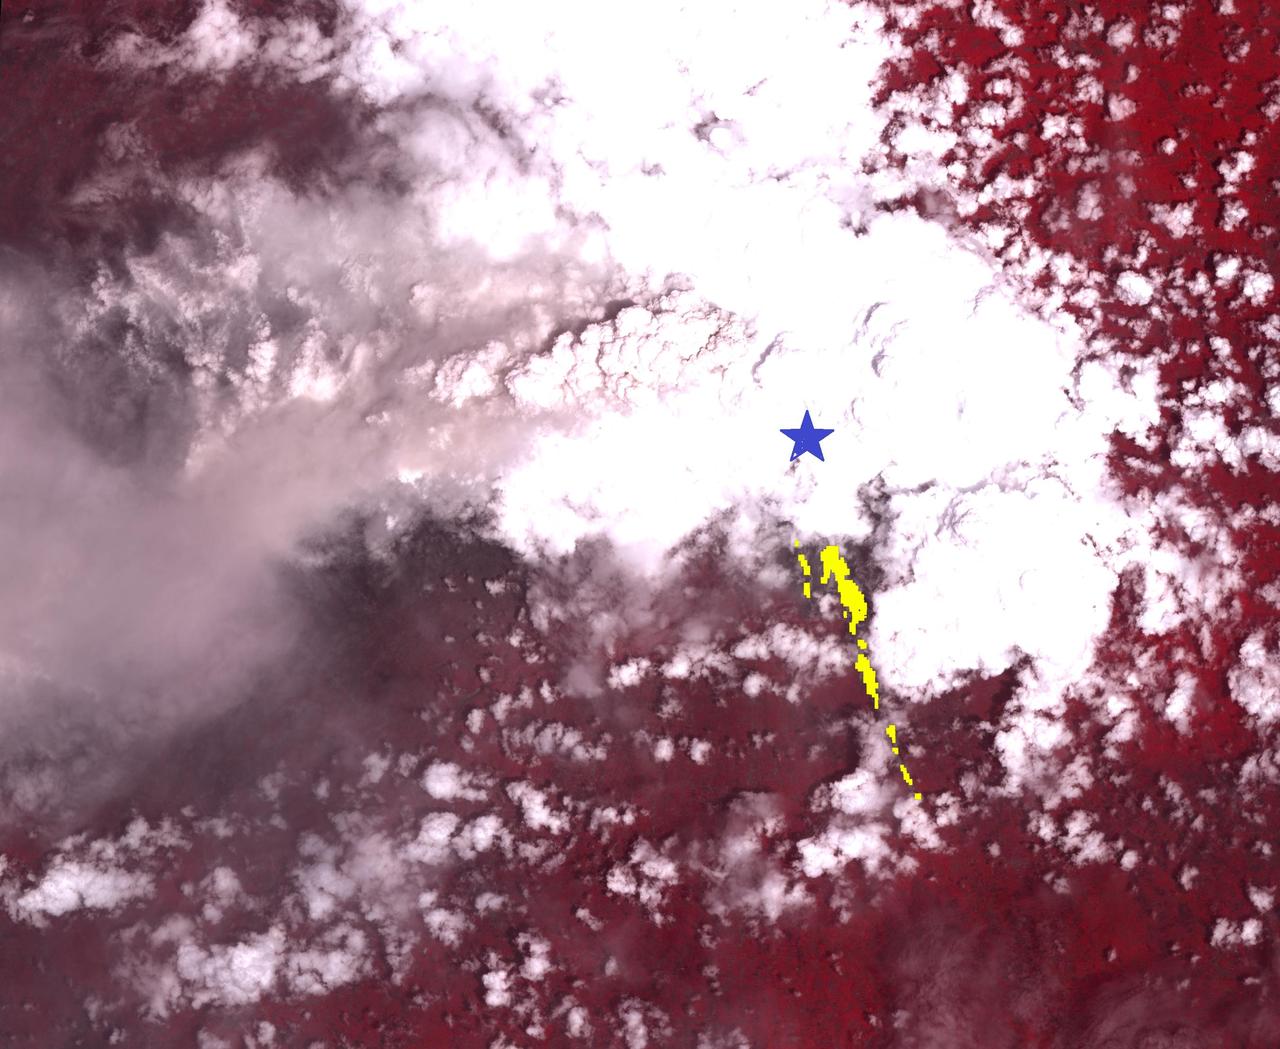
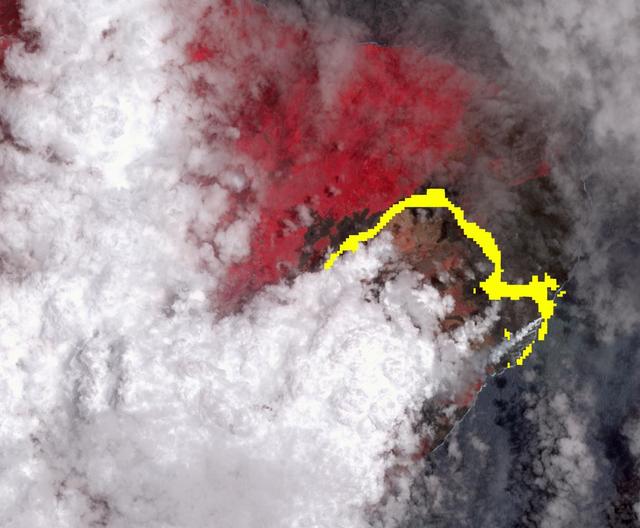
Hawaii's Kilauea's eruption, which began three weeks ago, has produced new lava flows that reached the ocean. The combination of molten lava and sea water produced clouds of noxious gases, such as hydrogen sulfide. In this image from the Advanced Spaceborne Thermal Emission and Reflection (ASTER) radiometer instrument on NASA's Terra satellite, vegetation is displayed in red, clouds are white and the hot lava flows, detected by ASTER's thermal infrared channels, are overlaid in yellow. The image was acquired May 22, 2018, covers an area of 20.3 by 20.9 miles (32.6 by 33.6 kilometers), and is located at 19.6 degrees north, 154.9 degrees west. https://photojournal.jpl.nasa.gov/catalog/PIA22459
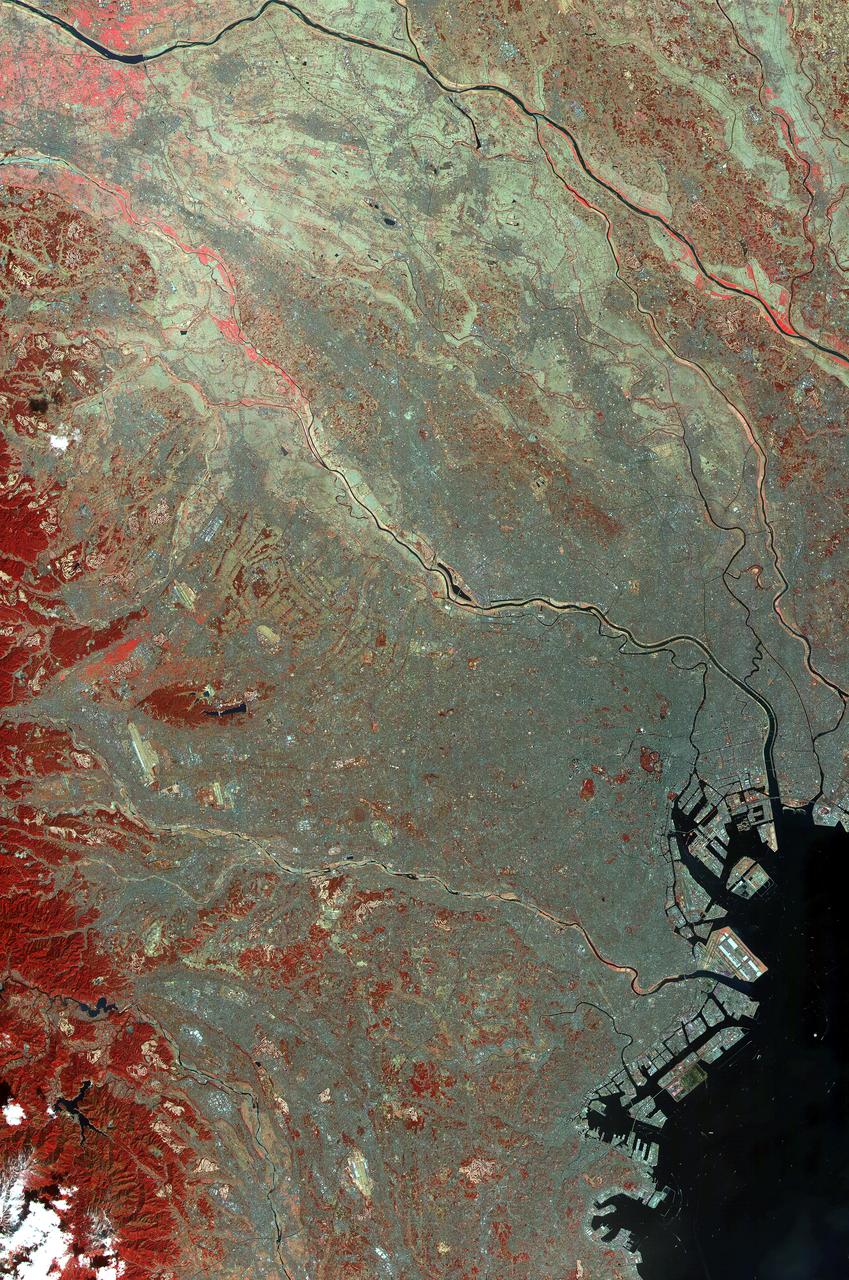
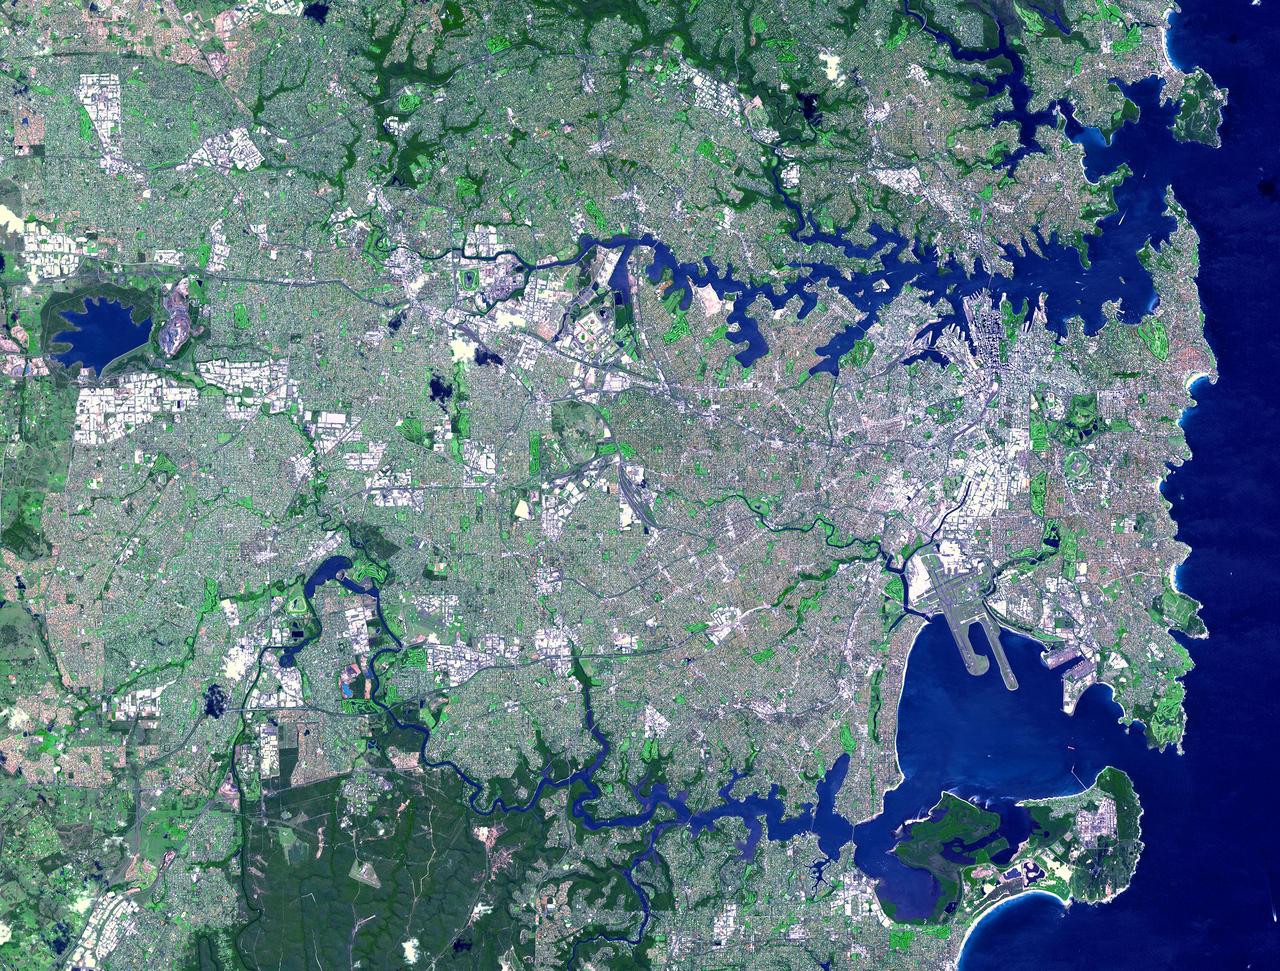
This image of the city of Tokyo was acquired on March 22, 2000 by the Advanced Spaceborne Thermal Emission and Reflection Radiometer (ASTER) on NASA's Terra satellite. With its 14 spectral bands from the visible to the thermal infrared wavelength region, and its high spatial resolution of 15 to 90 meters (about 50 to 300 feet), ASTER will image the Earth for the next 6 years to map and monitor the changing surface of our planet. This false color infrared image covers an area 60 km wide and 75 km long in three bands of the short wavelength infrared region, with a spatial resolution of 15 m. It shows part of the Tokyo metropolitan area extending south to Yokohama; included are the Ginza District, Haneda airport and the Imperial Palace. To the west, Tokyo is hemmed in by mountains, covered with forests (displayed in red); on the southeast, Tokyo Bay is one of the world's great harbors. http://photojournal.jpl.nasa.gov/catalog/PIA02607
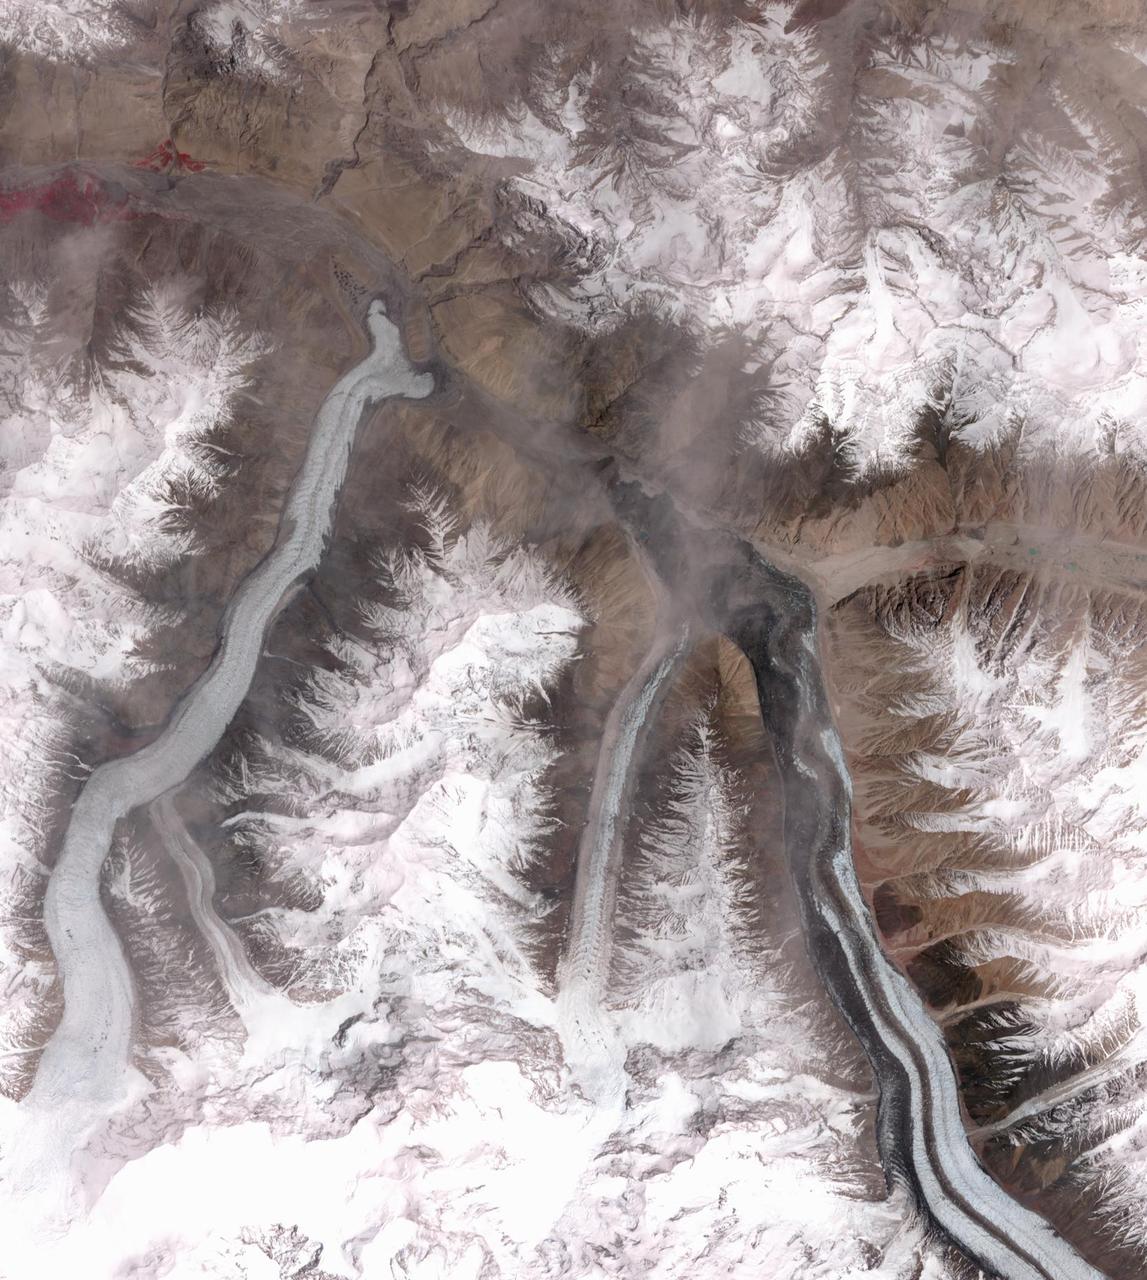
In October 2016, the Khurdopin Glacier in Pakistan began a rapid surge after 20 years of little movement. By March, 2017, a large lake had formed in the Shimshal River, where the glacier had formed a dam. Fortunately, the river carved an outlet through the glacier before the lake could empty catastrophically. In this pair of ASTER images, acquired August 20, 2015 and May 21, 2017, the advance of the Khurdopin Glacier (dark gray and white "river" in lower right quarter of image) is obvious by comparing the before and after images. The images cover an area of 25 by 27.8 km, and are located at 36.3 degrees north, 75.5 degrees east. https://photojournal.jpl.nasa.gov/catalog/PIA22304
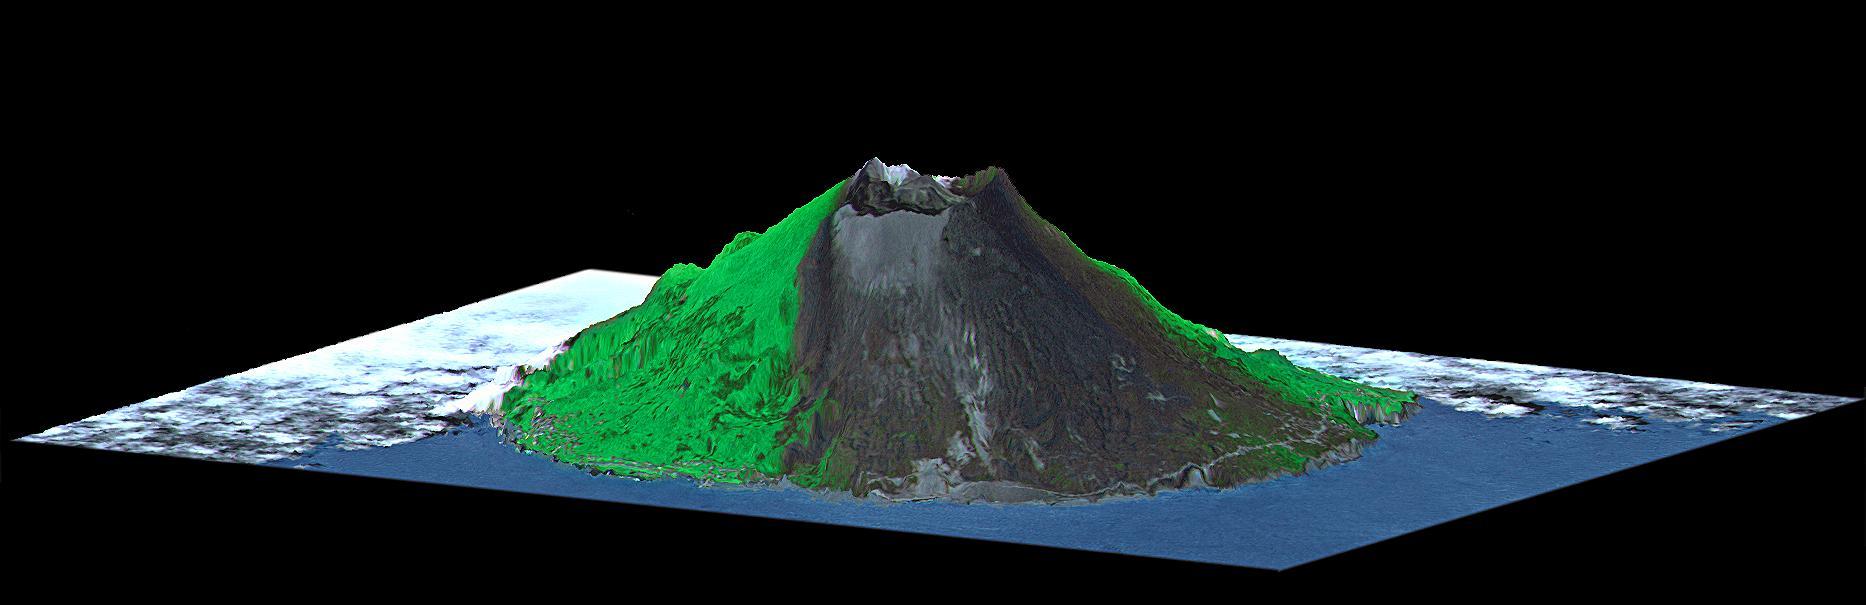
Mount Oyama is a 820-meter-high (2,700 feet) volcano on the island of Miyake-Jima, Japan. In late June 2000, a series of earthquakes alerted scientists to possible volcanic activity. On June 27, authorities evacuated 2,600 people, and on July 8 the volcano began erupting and erupted five times over that week. The dark gray blanket covering green vegetation in the image is the ash deposited by prevailing northeasterly winds between July 8 and 17. This island is about 180 kilometers (110 miles) south of Tokyo and is part of the Izu chain of volcanic islands that runs south from the main Japanese island of Honshu. Miyake-Jima is home to 3,800 people. The previous major eruptions of Mount Oyama occurred in 1983 and 1962, when lava flows destroyed hundreds of houses. An earlier eruption in 1940 killed 11 people. This image is a perspective view created by combining image data from the Advanced Spaceborne Thermal Emission and Reflection Radiometer (ASTER) aboard NASA's Terra satellite with an elevation model from the Shuttle Radar Topography Mission (SRTM). Vertical relief is exaggerated, and the image includes cosmetic adjustments to clouds and image color to enhance clarity of terrain features. http://photojournal.jpl.nasa.gov/catalog/PIA02771
NASA and Japan Ministry of Economy, Trade and Industry METI released the Advanced Spaceborne Thermal Emission and Reflection Radiometer ASTER Global Digital Elevation Model GDEM to the worldwide public on June 29, 2009.
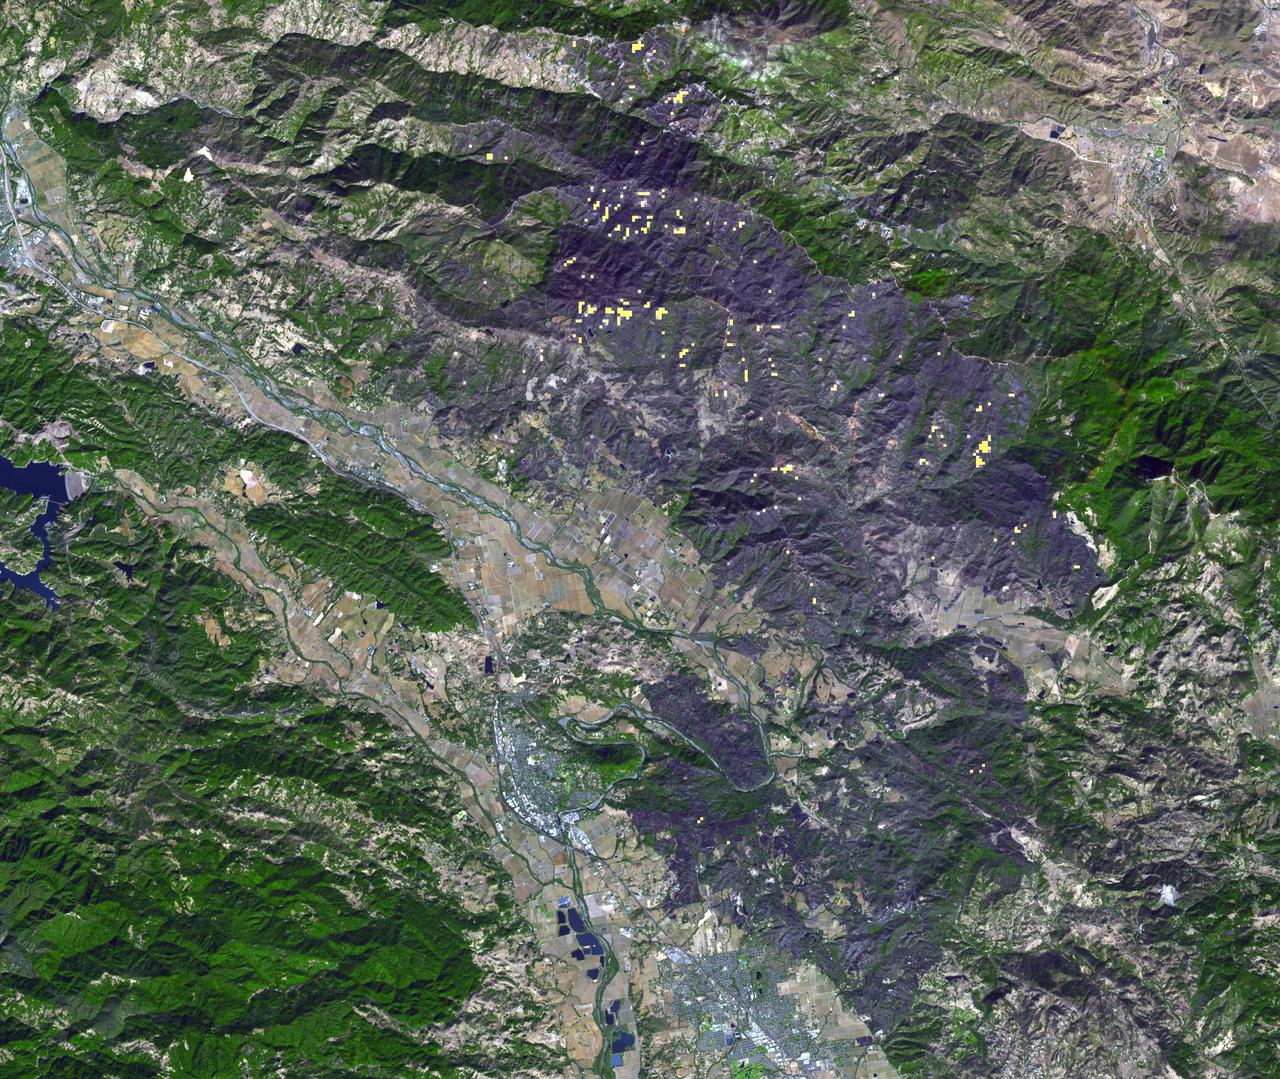
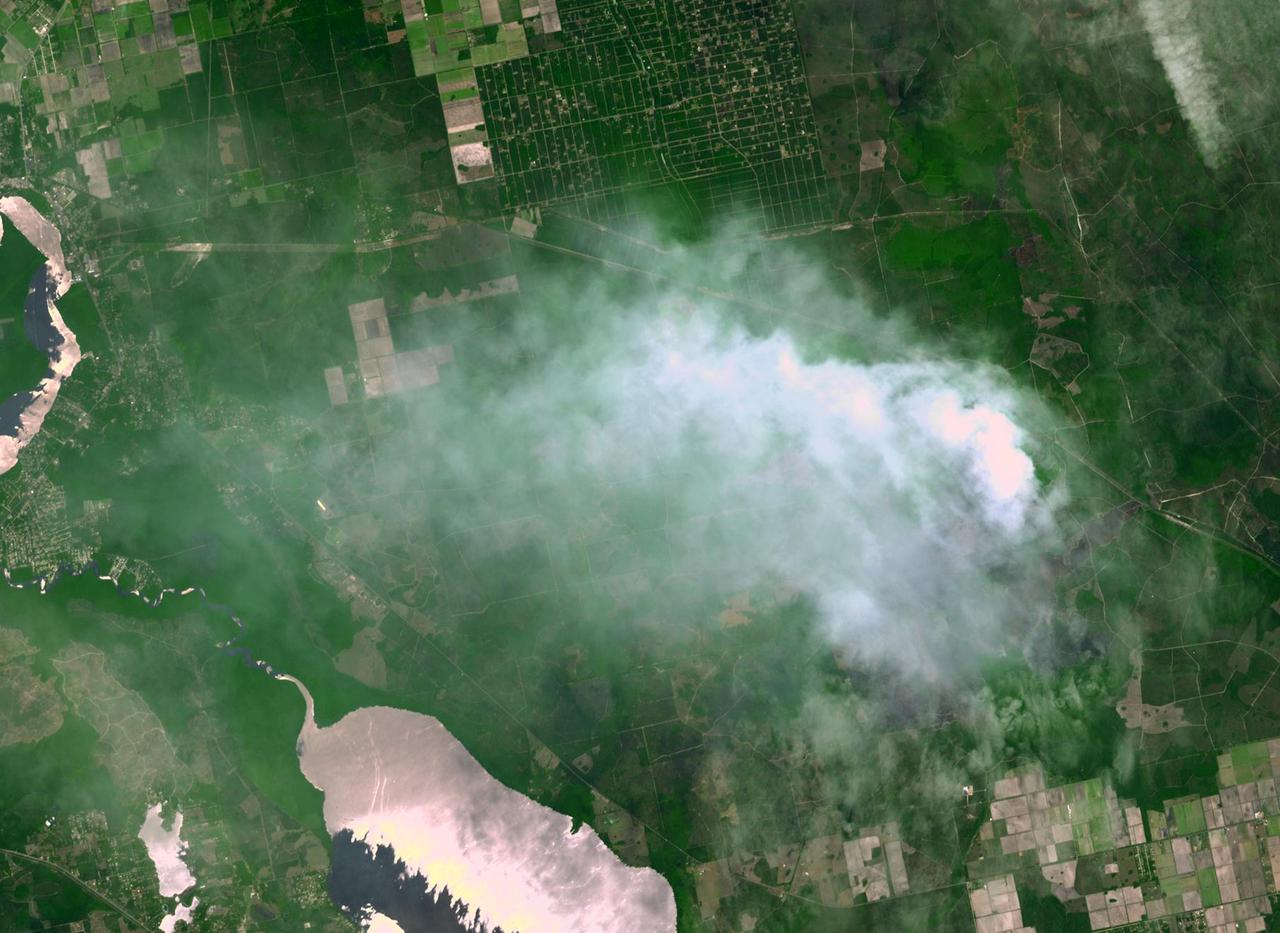
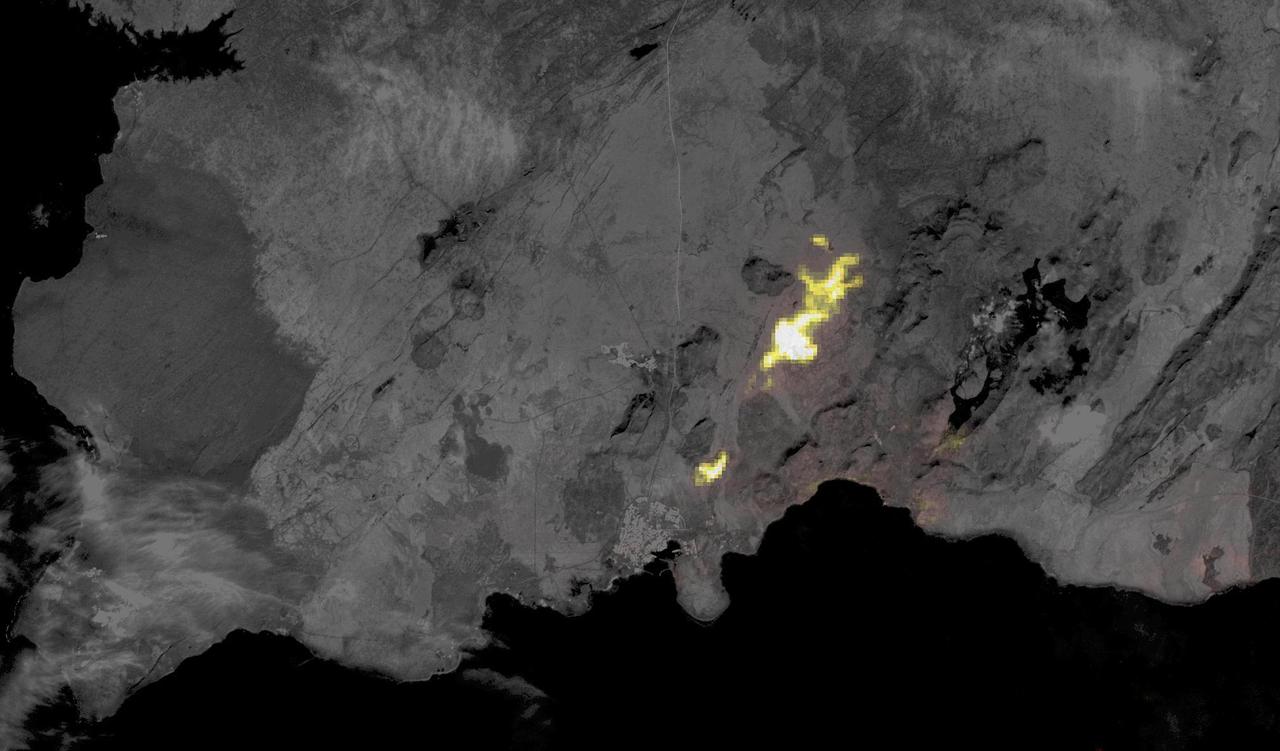
Thousands of acres damaged by the ongoing Kincade Fire in Northern California's Sonoma County are visible in this new image from the Advanced Spaceborne Thermal Emission and Reflection Radiometer (ASTER) instrument aboard NASA's Terra satellite. The image was taken at 11:01 a.m. PST (2:01 p.m. EST) on Nov. 3, 2019. The burned area appears dark gray in ASTER's visible channels. Hotspots, where the fire is still smoldering, appear as yellow dots in ASTER's heat-sensing, thermal infrared channels. After starting on Oct. 23, forcing residents to evacuate, the fire had burned 77,758 acres and destroyed 372 structures by Nov. 3, according to the California Department of Forestry and Fire Protection. It is now over 80% contained. The town of Healdsburg is in the center of the image, which covers an area of about 24 by 25 miles (39 by 40 kilometers). https://photojournal.jpl.nasa.gov/catalog/PIA23426
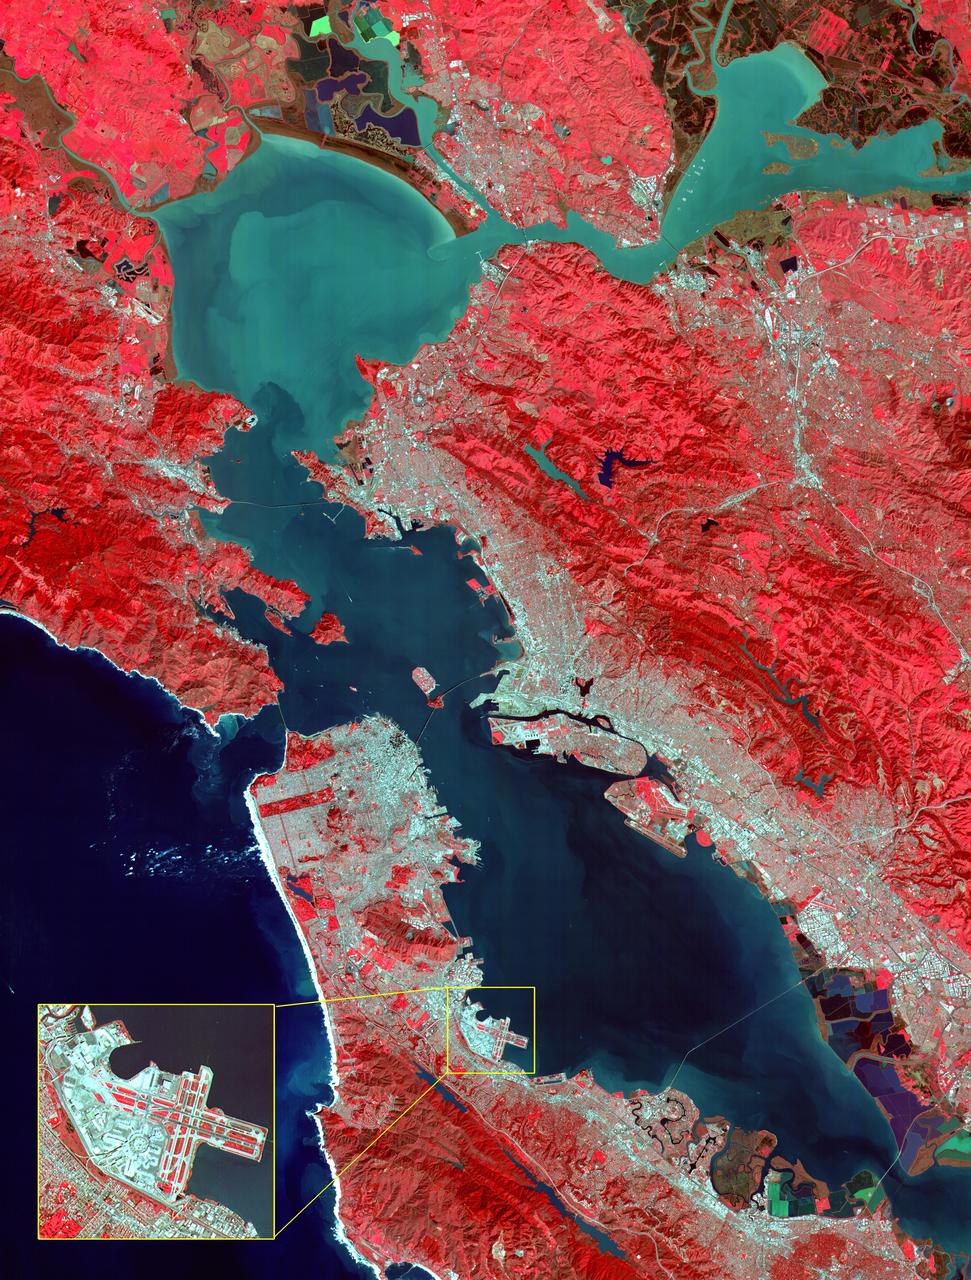
This image of the San Francisco Bay region was acquired on March 3, 2000 by the Advanced Spaceborne Thermal Emission and Reflection Radiometer (ASTER) on NASA's Terra satellite. With its 14 spectral bands from the visible to the thermal infrared wavelength region, and its high spatial resolution of 15 to 90 meters about 50 to 300 feet ), ASTER will image Earth for the next 6 years to map and monitor the changing surface of our planet. Image: This image covers an area 60 kilometers (37 miles) wide and 75 kilometers (47 miles) long in three bands of the reflected visible and infrared wavelength region. The combination of bands portrays vegetation in red, and urban areas in gray. Sediment in the Suisun Bay, San Pablo Bay, San Francisco Bay, and the Pacific Ocean shows up as lighter shades of blue. Along the west coast of the San Francisco Peninsula, strong surf can be seen as a white fringe along the shoreline. A powerful rip tide is visible extending westward from Daly City into the Pacific Ocean. In the lower right corner, the wetlands of the South San Francisco Bay National Wildlife Refuge appear as large dark blue and brown polygons. The high spatial resolution of ASTER allows fine detail to be observed in the scene. The main bridges of the area (San Mateo, San Francisco-Oakland Bay, Golden Gate, Richmond-San Rafael, Benicia-Martinez, and Carquinez) are easily picked out, connecting the different communities in the Bay area. Shadows of the towers along the Bay Bridge can be seen over the adjacent bay water. With enlargement the entire road network can be easily mapped; individual buildings are visible, including the shadows of the high-rises in downtown San Francisco. Inset: This enlargement of the San Francisco Airport highlights the high spatial resolution of ASTER. With further enlargement and careful examination, airplanes can be seen at the terminals. http://photojournal.jpl.nasa.gov/catalog/PIA02606

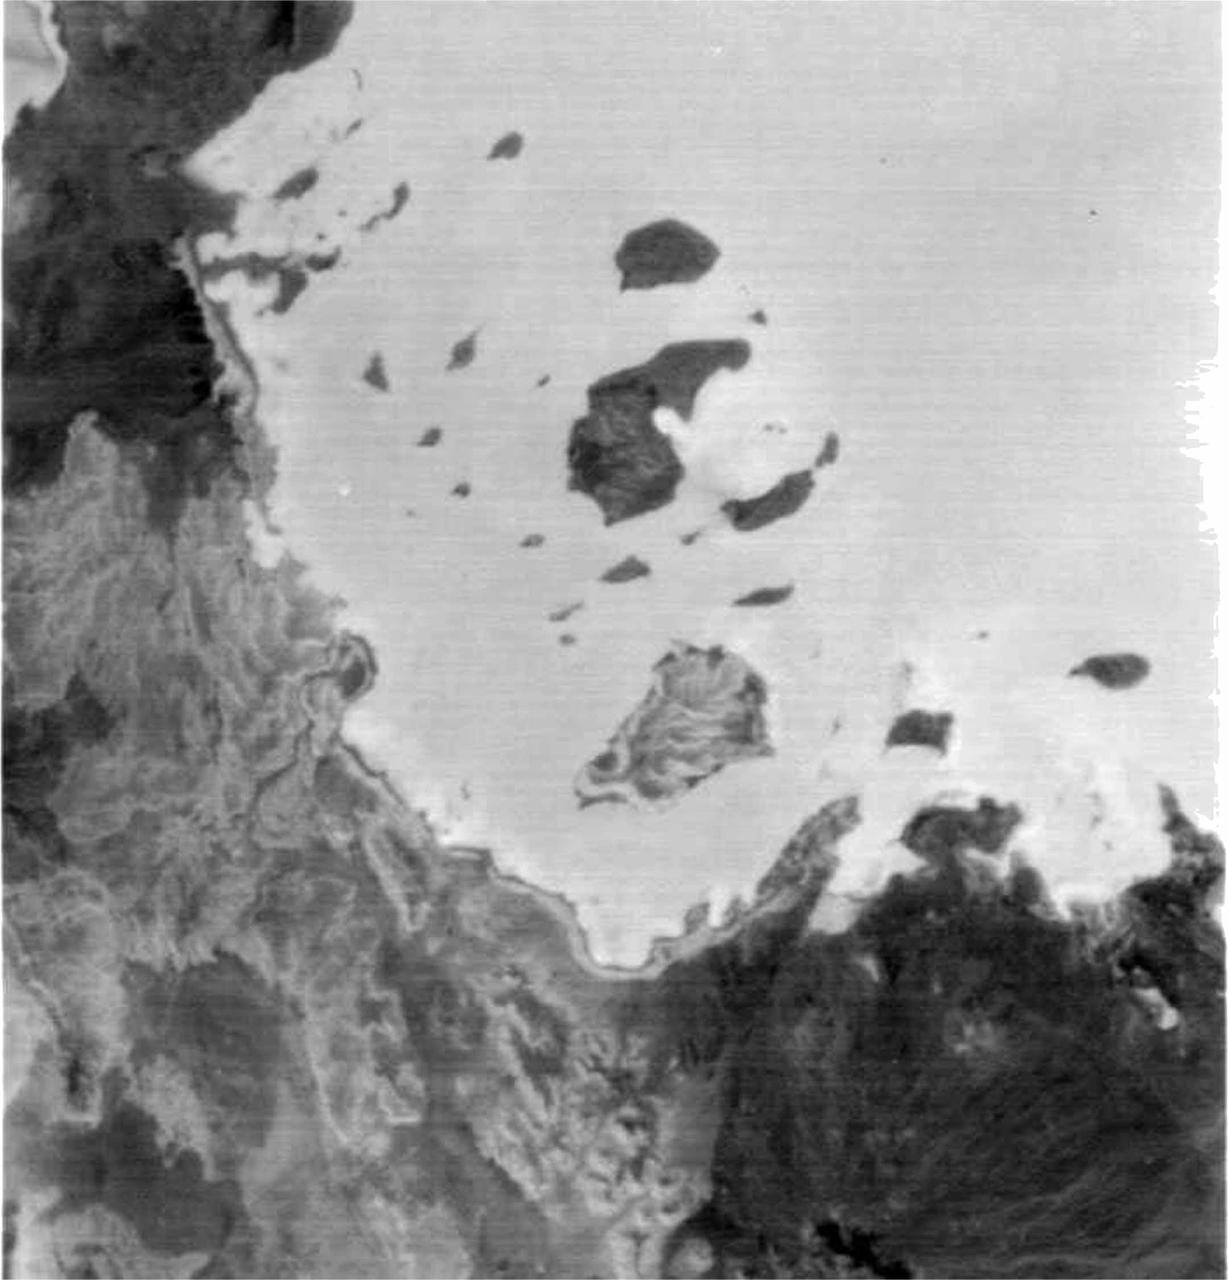
The pattern on the right half of this image of the Bay of Bengal is the result of two opposing wave trains colliding. This ASTER sub-scene, acquired on March 29, 2000, covers an area 18 kilometers (13 miles) wide and 15 kilometers (9 miles) long in three bands of the reflected visible and infrared wavelength region. The visible and near-infrared bands highlight surface waves due to specular reflection of sunlight off of the wave faces. http://photojournal.jpl.nasa.gov/catalog/PIA02662
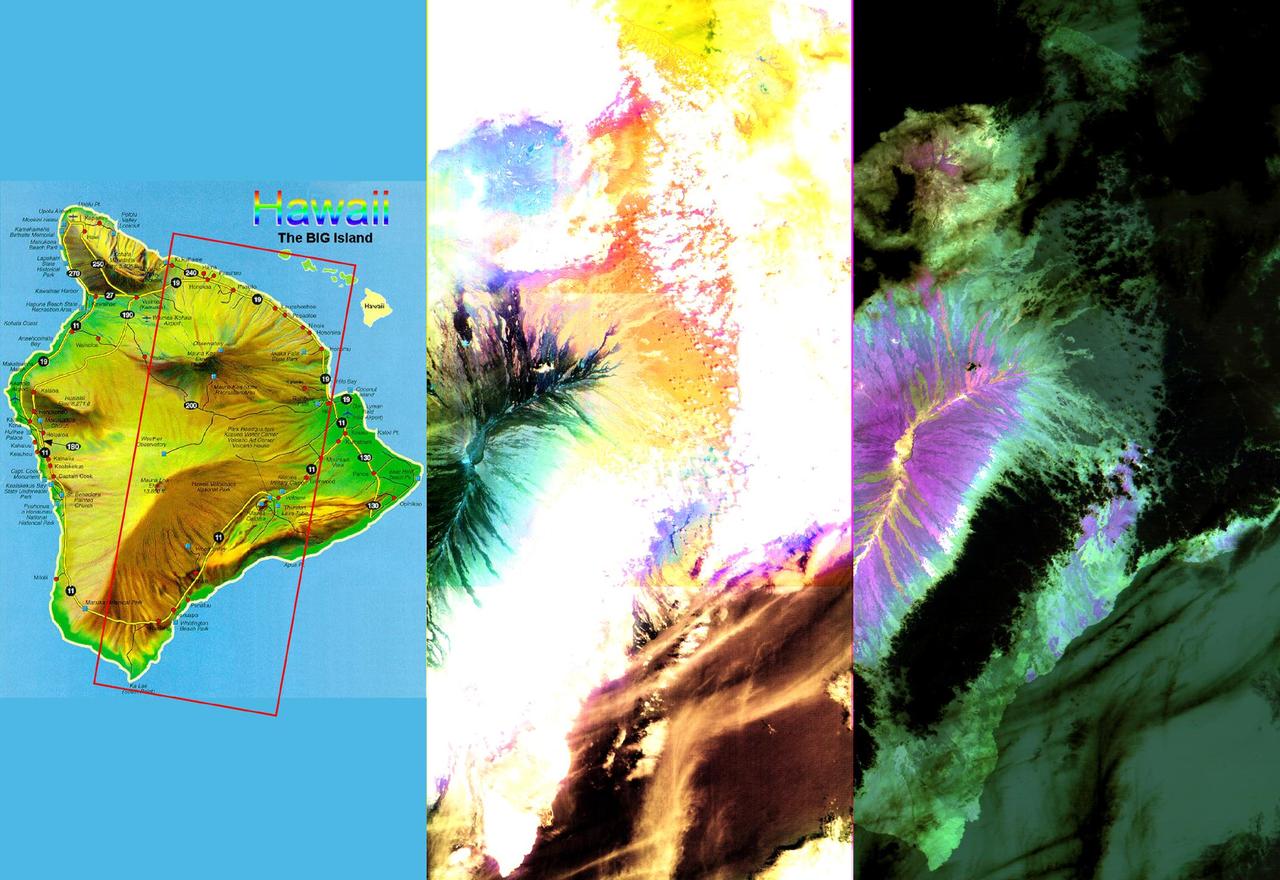
These images of the Island of Hawaii were acquired on March 19, 2000 by the Advanced Spaceborne Thermal Emission and Reflection Radiometer (ASTER) on NASA's Terra satellite. With its 14 spectral bands from the visible to the thermal infrared wavelength region, and its high spatial resolution of 15 to 90 meters (about 50 to 300 feet), ASTER will image Earth for the next 6 years to map and monitor the changing surface of our planet. Data are shown from the short wavelength and thermal infrared spectral regions, illustrating how different and complementary information is contained in different parts of the spectrum. Left image: This false-color image covers an area 60 kilometers (37 miles) wide and 120 kilometers (75 miles) long in three bands of the short wavelength infrared region. While, much of the island was covered in clouds, the dominant central Mauna Loa volcano, rising to an altitude of 4115 meters (13,500 feet), is cloud-free. Lava flows can be seen radiating from the central crater in green and black tones. As they reach lower elevations, the flows become covered with vegetation, and their image color changes to yellow and orange. Mauna Kea volcano to the north of Mauna Loa has a thin cloud-cover, producing a bluish tone on the image. The ocean in the lower right appears brown due to the color processing. Right image: This image is a false-color composite of three thermal infrared bands. The brightness of the colors is proportional to the temperature, and the hues display differences in rock composition. Clouds are black, because they are the coldest objects in the scene. The ocean and thick vegetation appear dark green because they are colder than bare rock surfaces, and have no thermal spectral features. Lava flows are shades of magenta, green, pink and yellow, reflecting chemical changes due to weathering and relative age differences. http://photojournal.jpl.nasa.gov/catalog/PIA02604
The Advanced Spaceborne Thermal Emission and Reflection Radiometer ASTER instrument aboard NASA Terra spacecraft captured this image of the Fourmile Canyon fire west of Boulder Colo., on Sept. 17, 2010; it was 100 percent contained.
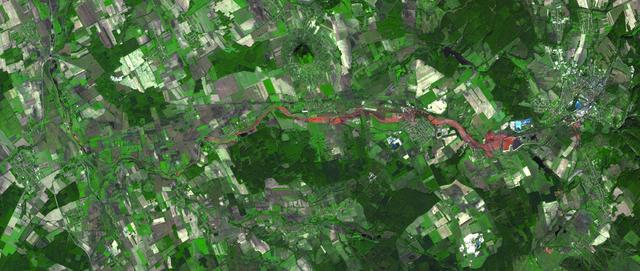
The ASTER instrument onboard Terra spacecraft imaged the toxic sludge spill in Hungary on Oct. 11, 2010. A million cubic meters 35 million cubic feet of red sludge spilled from a reservoir at an alumina plant in Ajka in western Hungary.
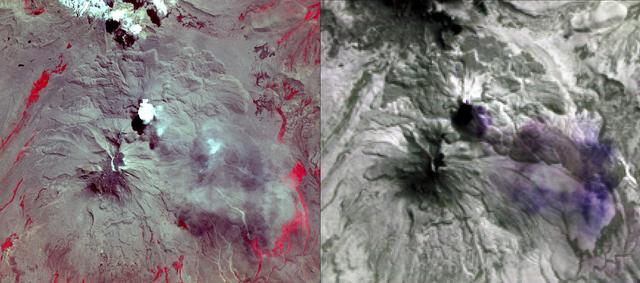
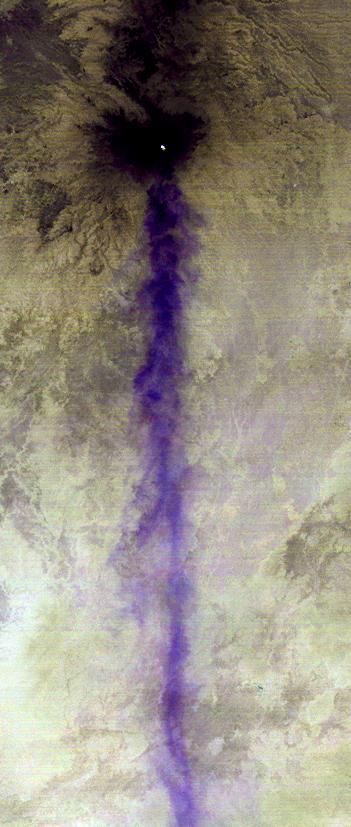
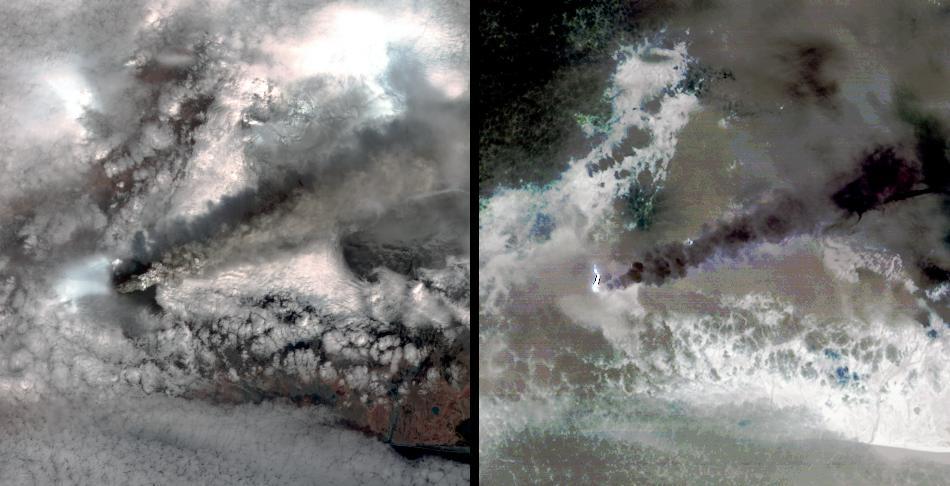
NASA's Advanced Spaceborne Thermal Emission and Reflection Radiometer (ASTER) acquired this image of Peru's Sabancaya stratovolcano on April 10, 2019. Sabancaya has been erupting regularly for several months, sending ash plumes high into the air. At the time this image was taken, the plume reached an altitude of 9100 meters (9950 yards) and was moving southeastward. In the left image, Sabancaya is under the bright round white cloud. The greyish clouds to the southeast are ash plumes. The Ampato volcano, with its prominent summit caldera, is to the south. The red areas are vegetation. The right thermal image shows the plume in purple, indicating that it is dominantly composed of sulfur dioxide gas. A bright hotspot can be seen directly north of the black (cold) cloud over Sabancaya. The image covers an area of 19.5 by 17.2 kilometers (12 miles by 11 miles), and is located at 15.8 degrees south, 71.9 degrees west. https://photojournal.jpl.nasa.gov/catalog/PIA23143
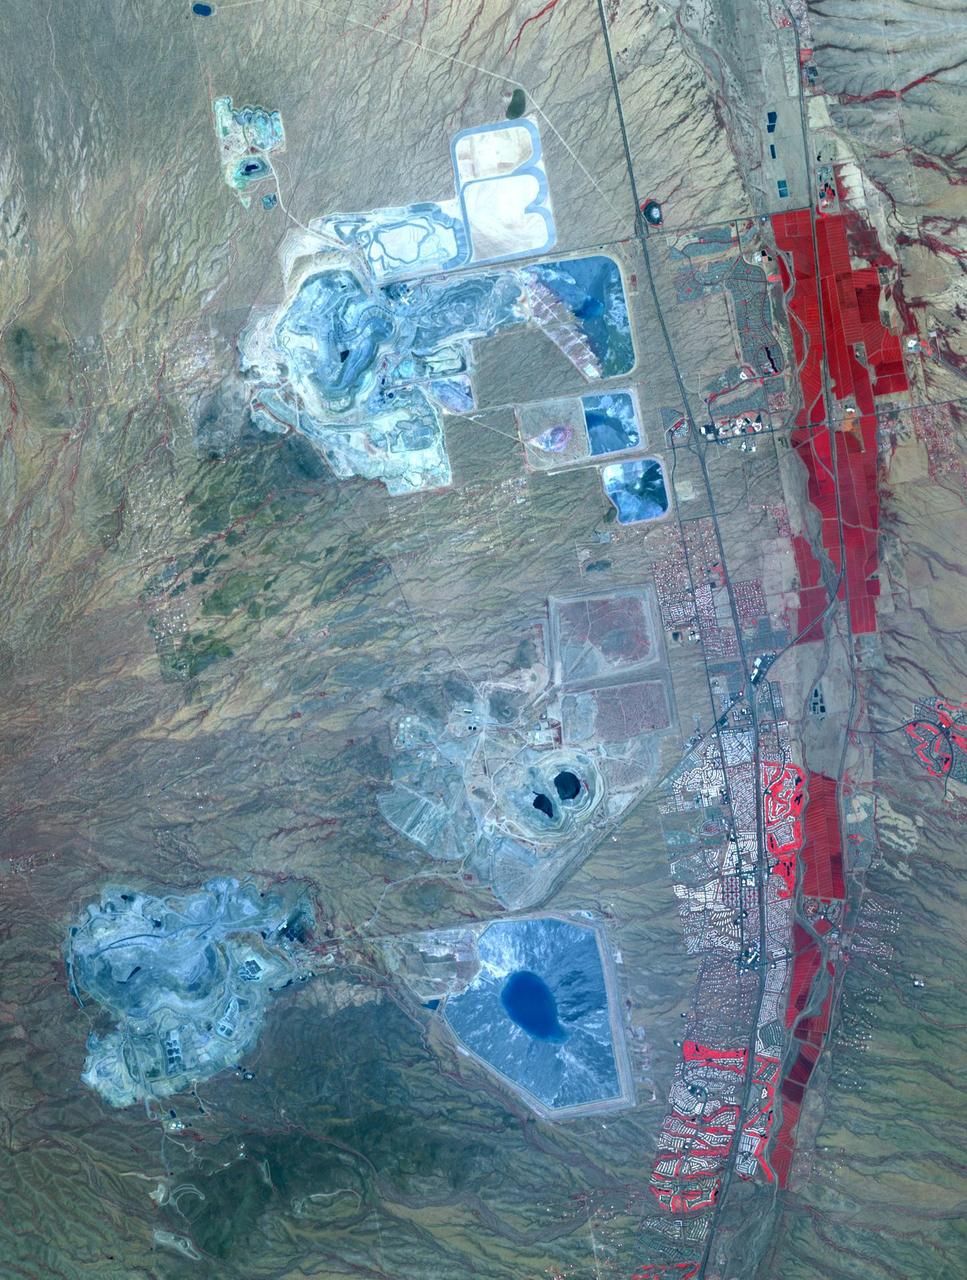
Arizona produces 60% of the total copper mined in the US; in 2007, 750,000 tons of copper came out of the state. One of the major mining districts is located about 30 km south of Tucson. Starting around 1950, open-pit mining replaced underground operations, and the ASARCO-Mission complex, Twin Buttes, and Sierrita mines became large open pit operations. Accompanying copper mineralization, silver, molybdenum, zinc, lead and gold are extracted. In addition to the pits themselves, enormous leach ponds and tailings piles surround the pits. The image was acquired May 31, 2012, covers an area of 22 by 28 km, and is located at 31.9 degrees north, 111 degrees west. With its 14 spectral bands from the visible to the thermal infrared wavelength region and its high spatial resolution of 15 to 90 meters (about 50 to 300 feet), ASTER images Earth to map and monitor the changing surface of our planet. ASTER is one of five Earth-observing instruments launched Dec. 18, 1999, on Terra. The instrument was built by Japan's Ministry of Economy, Trade and Industry. A joint U.S./Japan science team is responsible for validation and calibration of the instrument and data products. The broad spectral coverage and high spectral resolution of ASTER provides scientists in numerous disciplines with critical information for surface mapping and monitoring of dynamic conditions and temporal change. Example applications are: monitoring glacial advances and retreats; monitoring potentially active volcanoes; identifying crop stress; determining cloud morphology and physical properties; wetlands evaluation; thermal pollution monitoring; coral reef degradation; surface temperature mapping of soils and geology; and measuring surface heat balance. The U.S. science team is located at NASA's Jet Propulsion Laboratory, Pasadena, Calif. The Terra mission is part of NASA's Science Mission Directorate, Washington, D.C. More information about ASTER is available at <a href="http://asterweb.jpl.nasa.gov/" rel="nofollow">asterweb.jpl.nasa.gov/</a> Credit: NASA/GSFC/METI/ERSDAC/JAROS, and U.S./Japan ASTER Science Team <b><a href="http://www.nasa.gov/audience/formedia/features/MP_Photo_Guidelines.html" rel="nofollow">NASA image use policy.</a></b> <b><a href="http://www.nasa.gov/centers/goddard/home/index.html" rel="nofollow">NASA Goddard Space Flight Center</a></b> enables NASA’s mission through four scientific endeavors: Earth Science, Heliophysics, Solar System Exploration, and Astrophysics. Goddard plays a leading role in NASA’s accomplishments by contributing compelling scientific knowledge to advance the Agency’s mission. <b>Follow us on <a href="http://twitter.com/NASAGoddardPix" rel="nofollow">Twitter</a></b> <b>Like us on <a href="http://www.facebook.com/pages/Greenbelt-MD/NASA-Goddard/395013845897?ref=tsd" rel="nofollow">Facebook</a></b> <b>Find us on <a href="http://instagram.com/nasagoddard?vm=grid" rel="nofollow">Instagram</a></b>

Super typhoon Mangkhut slammed into the northern Philippines on September 15 with wind speeds equivalent to a category 5 hurricane. South of where the eye made landfall, the storm's effects could be seen clearly five days later. The ASTER image of Dagupan and the Lingayen Gulf shows flooded and water-saturated areas in dark blue. Sediment-laden waters from swollen rivers enter the ocean and appear as blue-green plumes. The image was acquired September 22, 2018, covers an area of 51.4 by 61.2 kilometers, and is located at 16.2 degrees north, 120.3 degrees east. With its 14 spectral bands from the visible to the thermal infrared wavelength region and its high spatial resolution of about 50 to 300 feet (15 to 90 meters), ASTER images Earth to map and monitor the changing surface of our planet. ASTER is one of five Earth-observing instruments launched Dec. 18, 1999, on Terra. The instrument was built by Japan's Ministry of Economy, Trade and Industry. A joint U.S./Japan science team is responsible for validation and calibration of the instrument and data products. The broad spectral coverage and high spectral resolution of ASTER provides scientists in numerous disciplines with critical information for surface mapping and monitoring of dynamic conditions and temporal change. Example applications are monitoring glacial advances and retreats; monitoring potentially active volcanoes; identifying crop stress; determining cloud morphology and physical properties; wetlands evaluation; thermal pollution monitoring; coral reef degradation; surface temperature mapping of soils and geology; and measuring surface heat balance. https://photojournal.jpl.nasa.gov/catalog/PIA22705

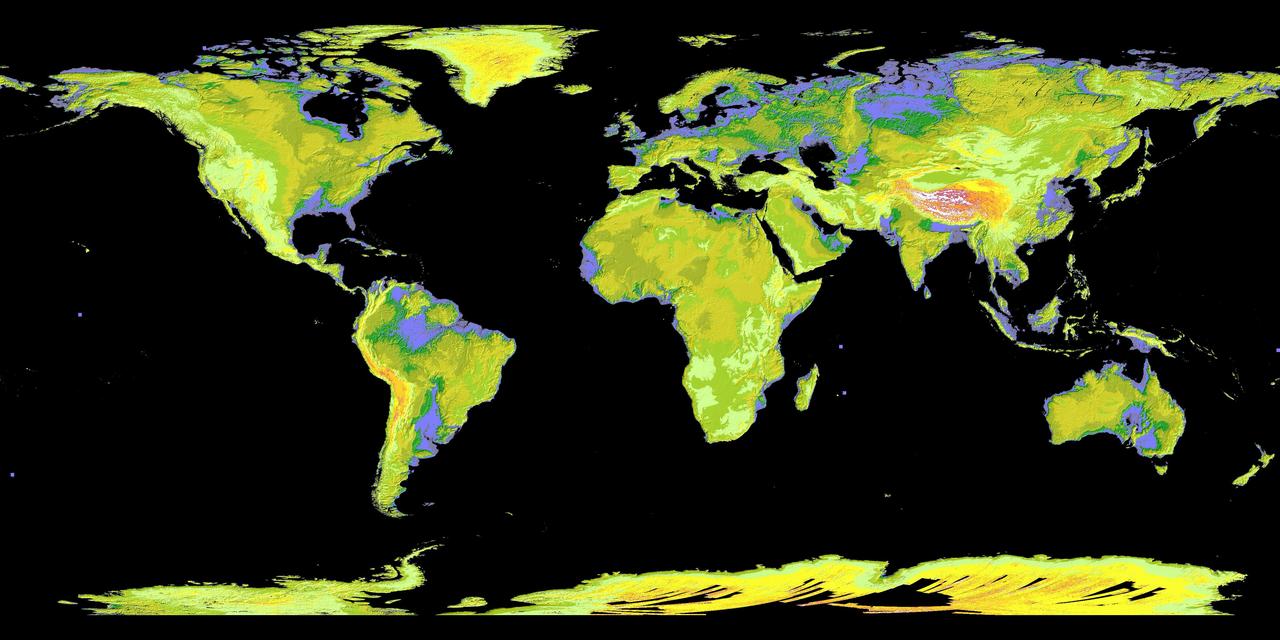
The ASTER instrument has been acquiring images since 2000. Currently the archive contains over 3.7 million images, including day and night thermal infrared data, and stereo pairs of the entire land surface of the Earth. This mosaic was created from thumbnail browse images, using bands 3, 2 and 1 displayed in red, green, and blue, respectively. The mosaic was also warped onto a spinning globe. https://photojournal.jpl.nasa.gov/catalog/PIA22979
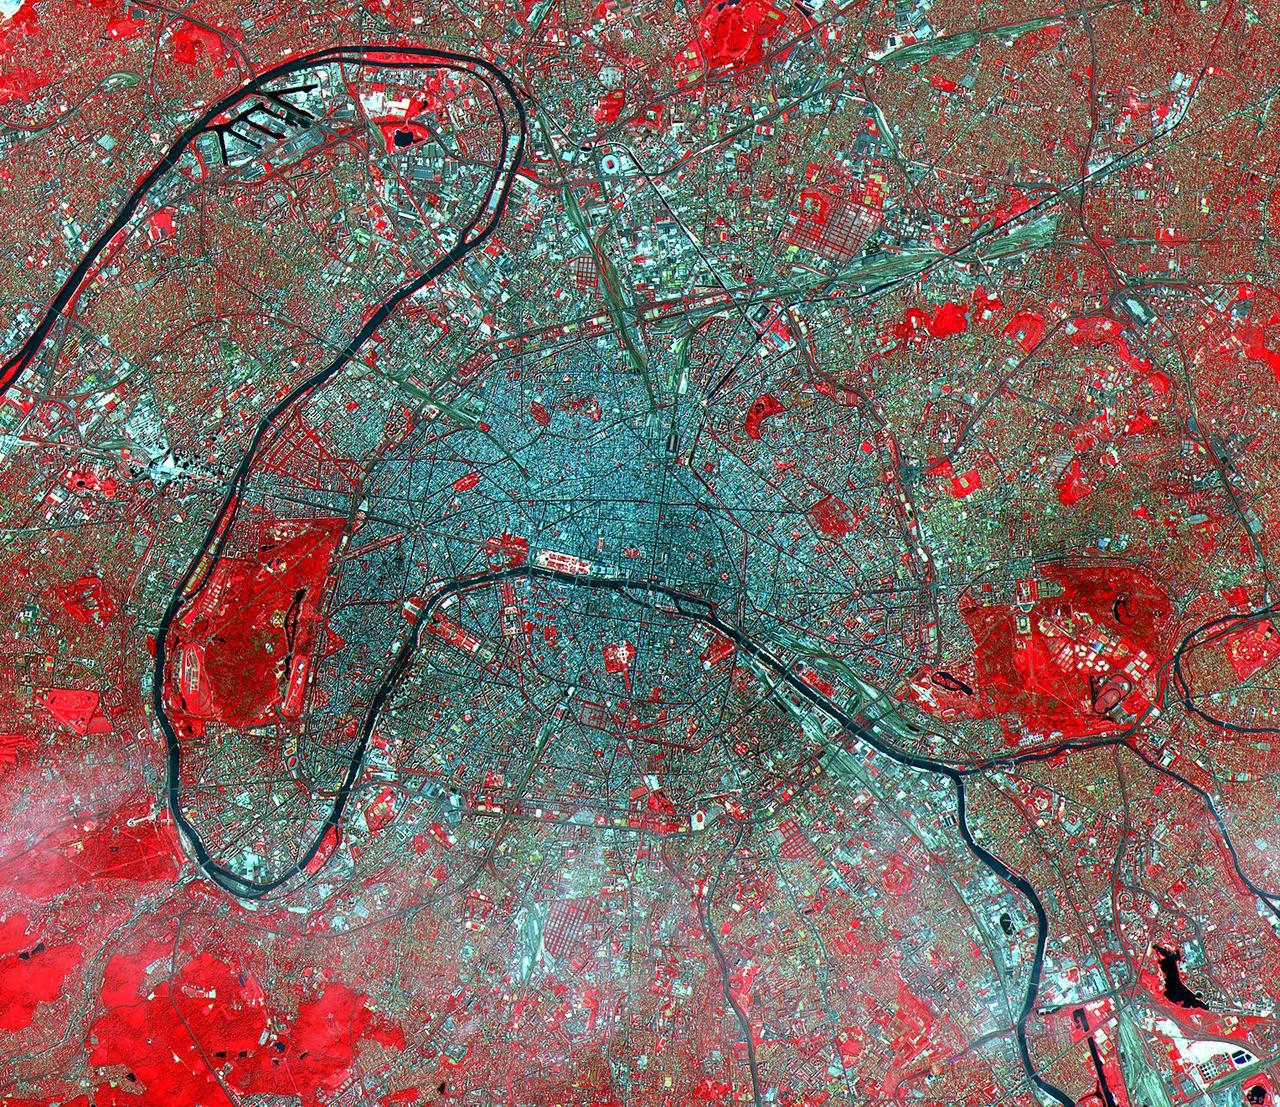
The Eiffel Tower and its shadow can be seen next to the Seine in the left middle of this ASTER image of Paris. Based on the length of the shadow and the solar elevation angle of 59 degrees, we can calculate its height as 324 meters (1,054 feet), compared to its actual height of 303 meters (985 feet). Acquired on July 23, 2000, this image covers an area 23 kilometers (15 miles) wide and 20 kilometers (13 miles) long in three bands of the reflected visible and infrared wavelength region. Known as the City of Light, Paris has been extolled for centuries as one of the great cities of the world. Its location on the Seine River, at a strategic crossroads of land and river routes, has been the key to its expansion since the Parisii tribe first settled here in the 3rd century B.C. http://photojournal.jpl.nasa.gov/catalog/PIA02660
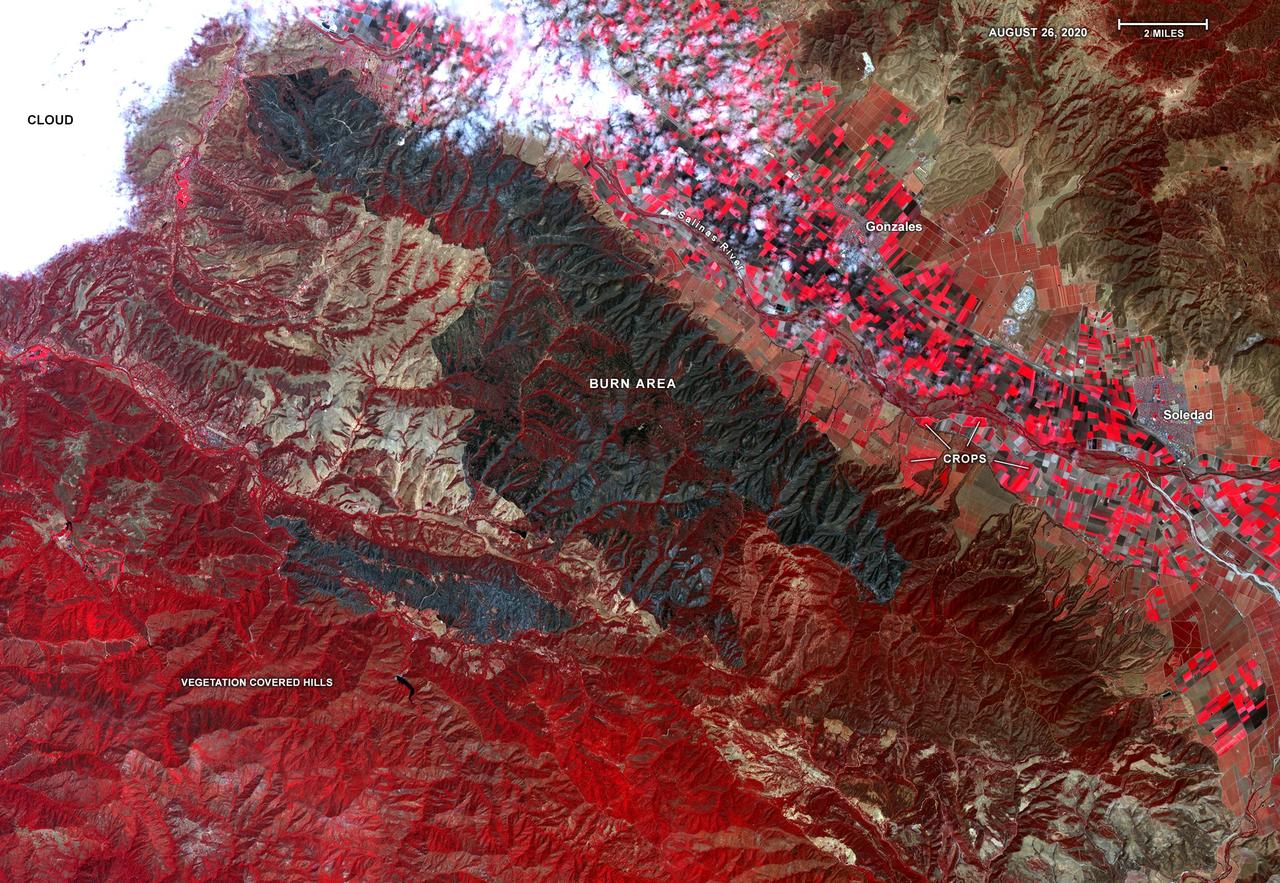
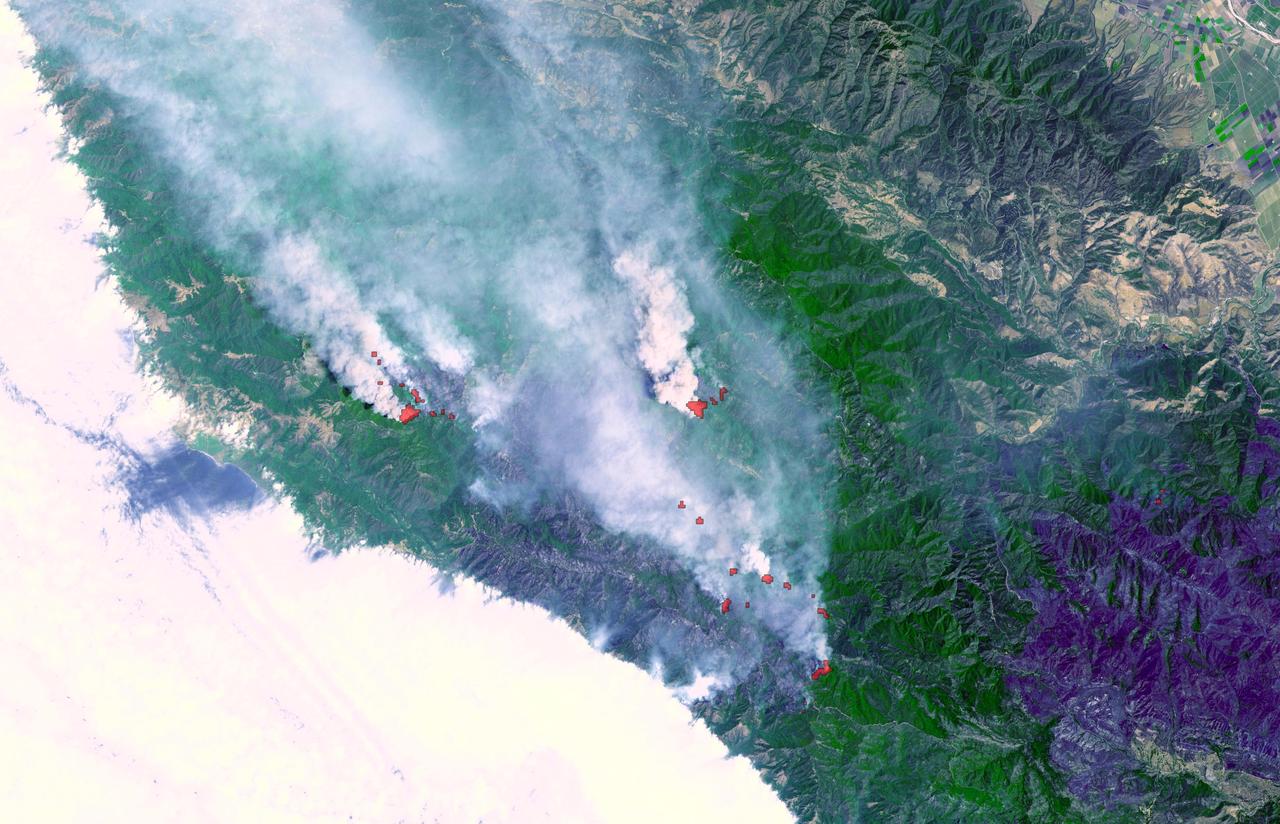
On Aug. 26, 2020, Advanced Spaceborne Thermal Emission and Reflection Radiometer (ASTER) instrument aboard NASA's Terra satellite passed over the River and Carmel fires in Monterey County, California, got a bird's eye view of the vast fire burn area. This false-color map shows the burn area as dark blue and gray, in the center of the image. Vegetation is in red, including agricultural crops along the Salinas River (bright red rectangles) surrounding the towns of Soledad and Gonzales; bare areas with no vegetation and rock are shown in tan and brown. The city of Salinas is in the upper left of the image, obscured by thick clouds. ASTER obtains high-resolution (15-90 square meters, or 161-969 square feet, per pixel) images of the Earth in 14 wavelengths of the electromagnetic spectrum, ranging from visible to thermal infrared light. Data from ASTER — which is managed by Japan Space Systems and NASA's Jet Propulsion Laboratory in Southern California — are used by scientists to create detailed maps of land surface temperature, how much infrared energy the land emits, how much light the land reflects and its elevation. On this occasion, ASTER was able to support NASA's Disaster Program response to the state's wildfires, providing data products that can be used by resources on the ground to fight the fires and for scientists to better understand their long-term effects. The area covered here is 21.4 by 31 miles (34.4 by 49.9 kilometers). https://photojournal.jpl.nasa.gov/catalog/PIA23800
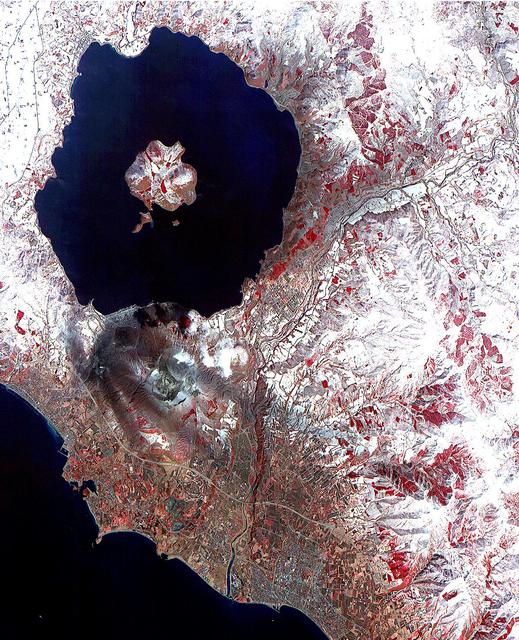
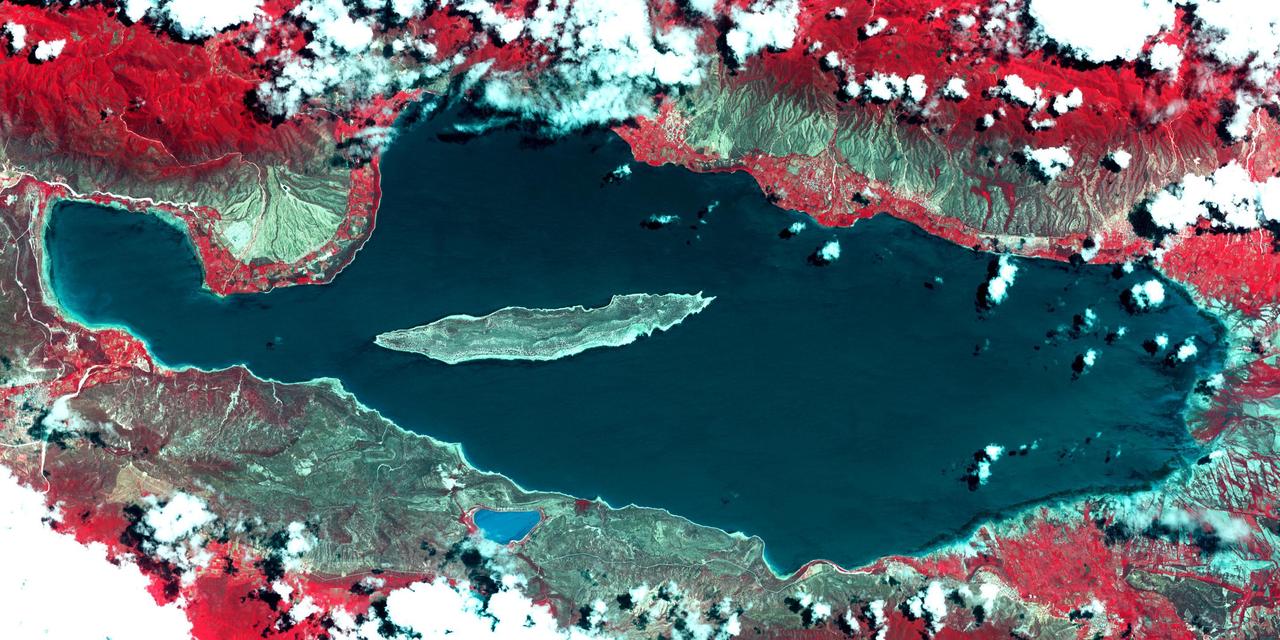
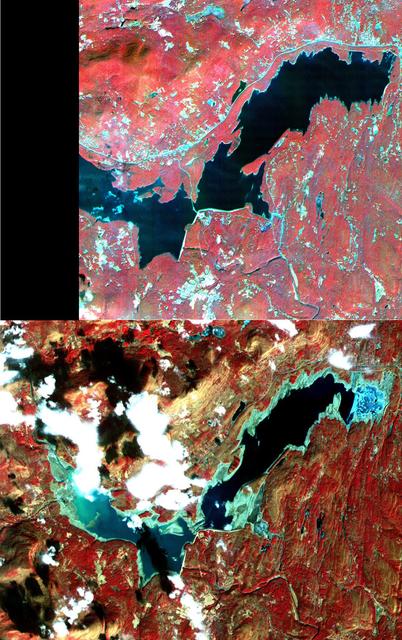
On April 3, the Advanced Spaceborne Thermal Emission and Reflection Radiometer (ASTER) on NASA's Terra Satellite captured this image of the erupting Mt. Usu volcano in Hokkaido, Japan. With its 14 spectral bands from the visible to the thermal infrared wavelength region, and its high spatial resolution of 15 to 90 meters (about 50 to 300 feet), ASTER will image the Earth for the next 6 years to map and monitor the changing surface of our planet. This false color infrared image of Mt Usu volcano is dominated by Lake Toya, an ancient volcanic caldera. On the south shore is the active Usu volcano. On Friday, March 31, more than 11,000 people were evacuated by helicopter, truck and boat from the foot of Usu, that began erupting from the northwest flank, shooting debris and plumes of smoke streaked with blue lightning thousands of feet in the air. Although no lava gushed from the mountain, rocks and ash continued to fall after the eruption. The region was shaken by thousands of tremors before the eruption. People said they could taste grit from the ash that was spewed as high as 2,700 meters (8,850 ft) into the sky and fell to coat surrounding towns with ash. "Mount Usu has had seven significant eruptions that we know of, and at no time has it ended quickly with only a small scale eruption," said Yoshio Katsui, a professor at Hokkaido University. This was the seventh major eruption of Mount Usu in the past 300 years. Fifty people died when the volcano erupted in 1822, its worst known eruption. In the image, most of the land is covered by snow. Vegetation, appearing red in the false color composite, can be seen in the agricultural fields, and forests in the mountains. Mt. Usu is crossed by three dark streaks. These are the paths of ash deposits that rained out from eruption plumes two days earlier. The prevailing wind was from the northwest, carrying the ash away from the main city of Date. Ash deposited can be traced on the image as far away as 10 kilometers (16 miles) from the volcano. http://photojournal.jpl.nasa.gov/catalog/PIA02608
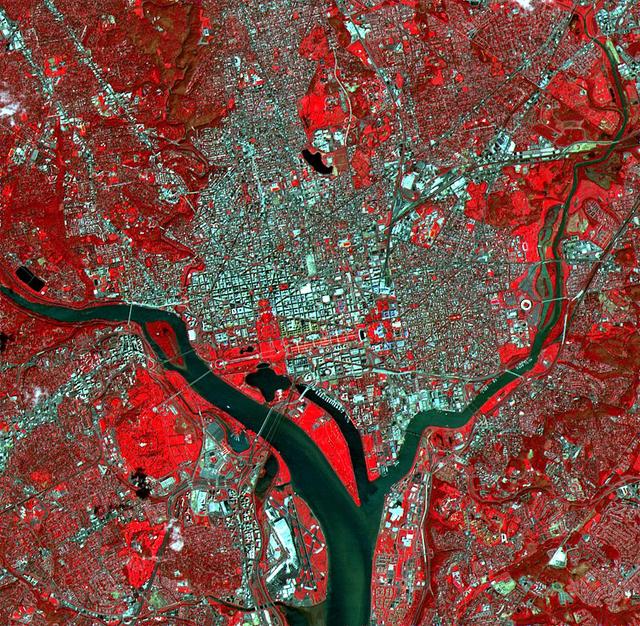
The White House, the Jefferson Memorial, and the Washington Monument with its shadow are all visible in this image of Washington, D.C. With its 15-meter spatial resolution, ASTER can see individual buildings. Taken on June 1, 2000, this image covers an area 14 kilometers (8.5 miles) wide and 13.7 kilometers (8.2 miles) long in three bands of the reflected visible and infrared wavelength region. The combination of visible and near infrared bands displays vegetation in red and water in dark grays. The Potomac River flows from the middle left to the bottom center. The large red area west of the river is Arlington National Cemetery. http://photojournal.jpl.nasa.gov/catalog/PIA02655
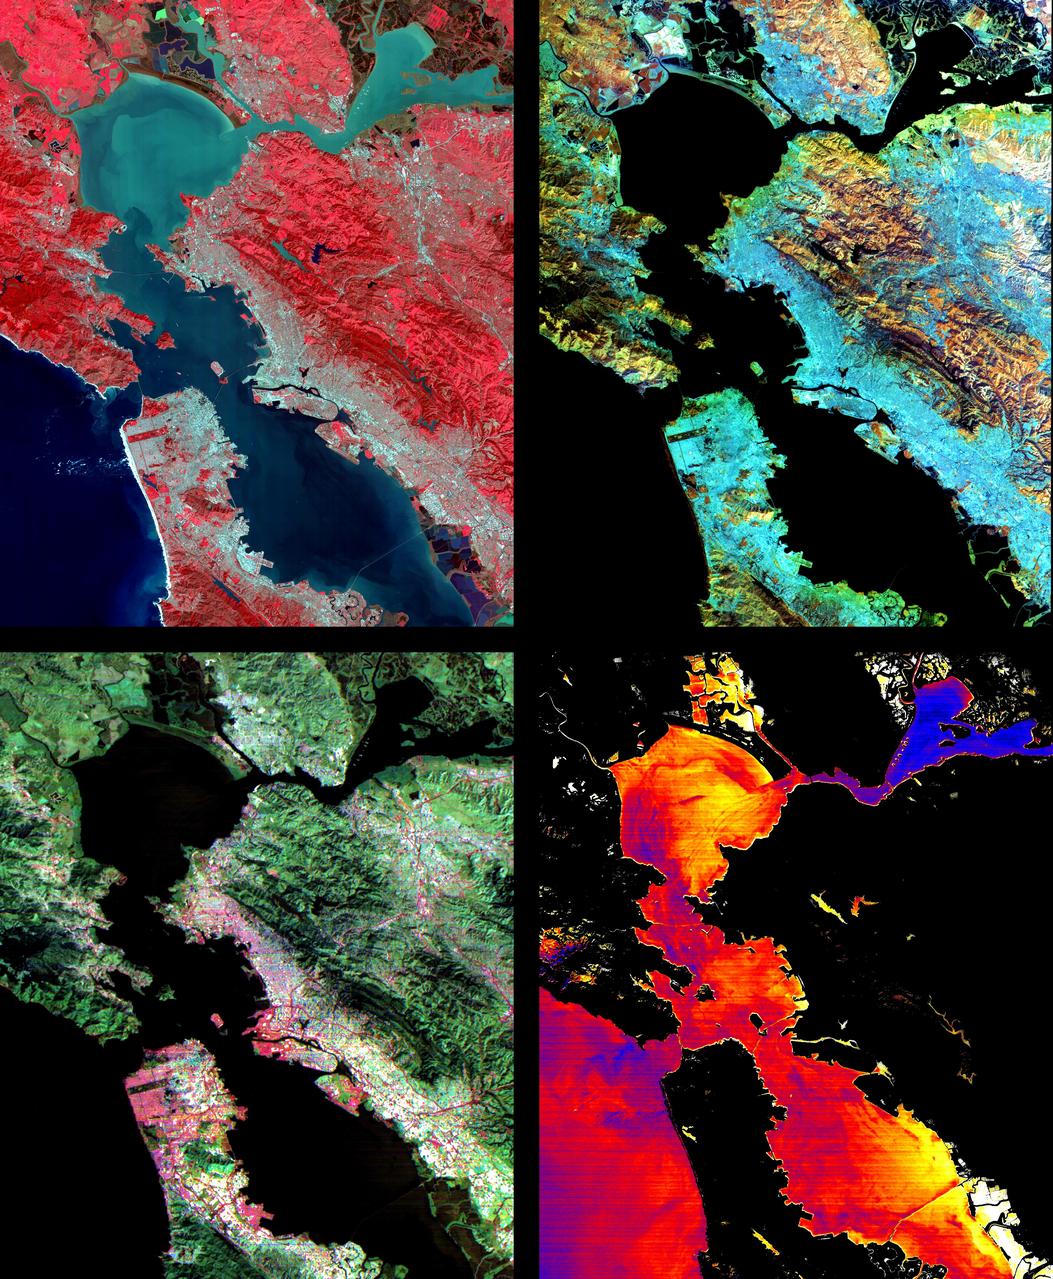
These images of the San Francisco Bay region were acquired on March 3, 2000 by the Advanced Spaceborne Thermal Emission and Reflection Radiometer (ASTER) on NASA's Terra satellite. Each covers an area 60 kilometers (37 miles) wide and 75 kilometers (47 miles) long. With its 14 spectral bands from the visible to the thermal infrared wavelength region, and its high spatial resolution of 15 to 90 meters (about 50 to 300 feet), ASTER will image the Earth for the next 6 years to map and monitor the changing surface of our planet. Upper Left: The color infrared composite uses bands in the visible and reflected infrared. Vegetation is red, urban areas are gray; sediment in the bays shows up as lighter shades of blue. Thanks to the 15 meter (50-foot) spatial resolution, shadows of the towers along the Bay Bridge can be seen. Upper right: A composite of bands in the short wave infrared displays differences in soils and rocks in the mountainous areas. Even though these regions appear entirely vegetated in the visible, enough surface shows through openings in the vegetation to allow the ground to be imaged. Lower left: This composite of multispectral thermal bands shows differences in urban materials in varying colors. Separation of materials is due to differences in thermal emission properties, analogous to colors in the visible. Lower right: This is a color coded temperature image of water temperature, derived from the thermal bands. Warm waters are in white and yellow, colder waters are blue. Suisun Bay in the upper right is fed directly from the cold Sacramento River. As the water flows through San Pablo and San Francisco Bays on the way to the Pacific, the waters warm up. http://photojournal.jpl.nasa.gov/catalog/PIA02605
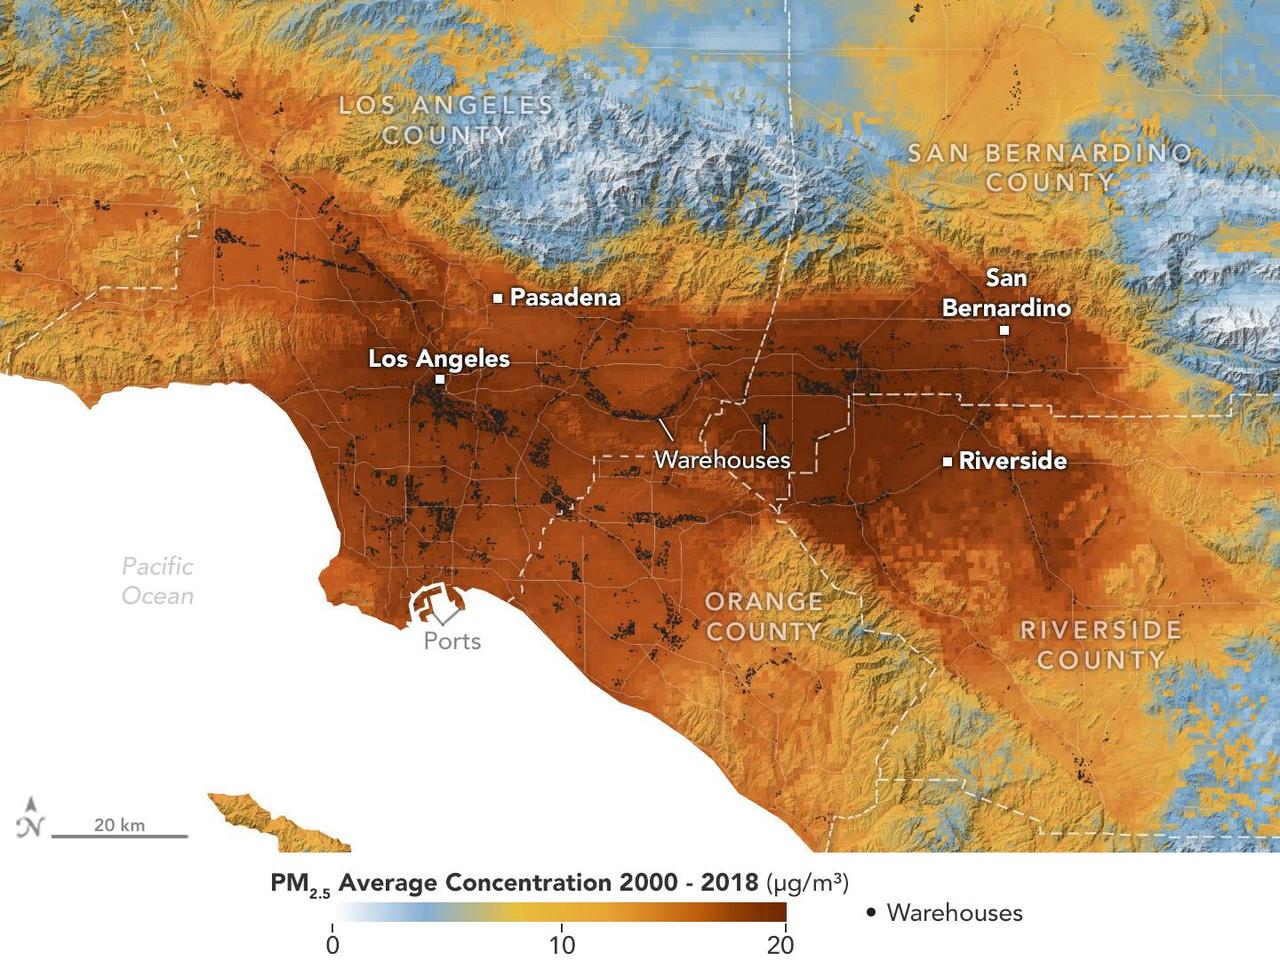
A data visualization shows the average concentration of PM2.5 particulate pollution in the Los Angeles region from 2000 to 2018, along with the locations of nearly 11,000 warehouses over the same time period. Particles measuring 2.5 micrometers or less, PM2.5 are pollutants that can be inhaled into the lungs and absorbed into the bloodstream. A NASA-funded study published in September 2024 in GeoHealth analyzed patterns and trends of atmospheric PM2.5 concentration and found that ZIP codes with more or larger warehouses had higher levels of PM2.5 and elemental carbon over time than those with fewer warehouses. Elemental carbon is a type of PM2.5 that is produced by heavy-duty diesel engines. In the visualization, areas with higher concentrations of PM2.5 are shown in darker red, and locations of warehouses are indicated by small black circles (many of them clustered closely together). The PM2.5 data came from models based on satellite observations, including from NASA's Moderate Resolution Imaging Spectroradiometer (MODIS) and Advanced Spaceborne Thermal Emission and Reflection Radiometer (ASTER) instruments. The PM2.5 warehouse locations were derived from a commercial real estate database. Particulate pollution has been linked to respiratory and cardiovascular diseases, some cancers, and adverse birth outcomes, including premature birth and low infant birth weight. As the e-commerce boom of recent decades has spurred warehouse construction, pollution in nearby neighborhoods has become a growing area for research. https://photojournal.jpl.nasa.gov/catalog/PIA26415
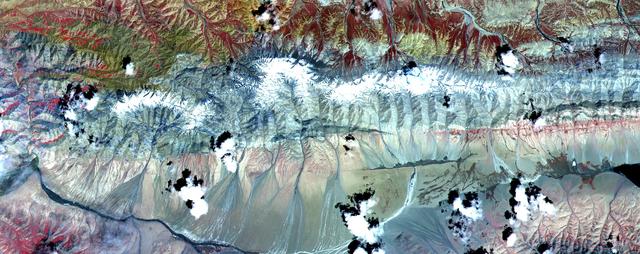
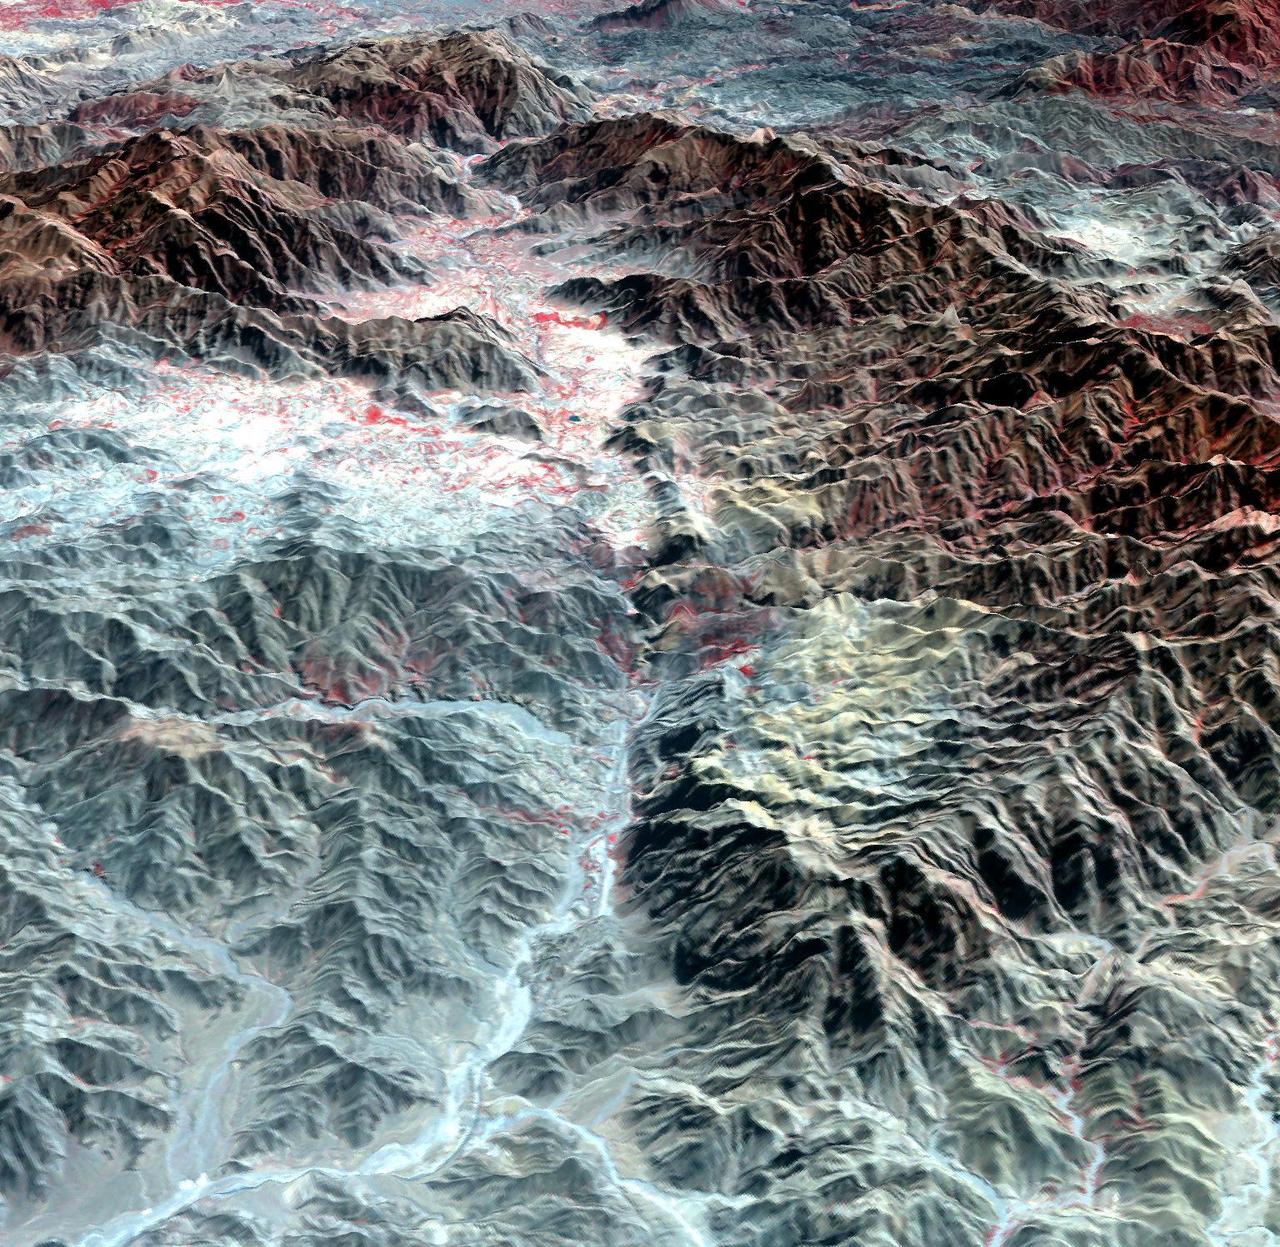
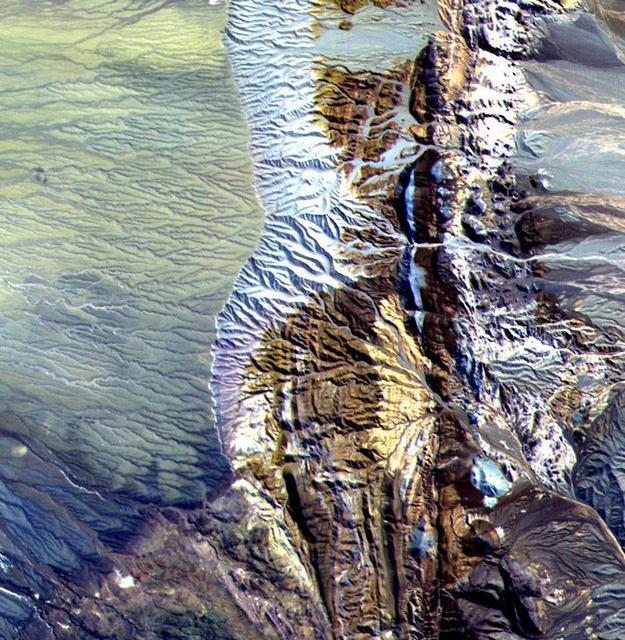
The Kunlun fault is one of the gigantic strike-slip faults that bound the north side of Tibet. Left-lateral motion along the 1,500-kilometer (932-mile) length of the Kunlun has occurred uniformly for the last 40,000 years at a rate of 1.1 centimeter per year, creating a cumulative offset of more than 400 meters (1300 feet). In this image, two splays of the fault are clearly seen crossing from east to west. The northern fault juxtaposes sedimentary rocks of the mountains against alluvial fans. Its trace is also marked by lines of vegetation, which appear red in the image. The southern, younger fault cuts through the alluvium. A dark linear area in the center of the image is wet ground where groundwater has pounded against the fault. Measurements from the image of displacements of young streams that cross the fault show 15 to 75 meters (16 to 82 yards) of left-lateral offset. This image of Tibet covers an area 40 kilometers (25 miles) wide and 15 kilometers (10 miles) long in three bands of the reflected visible and infrared wavelength region. ASTER acquired the scene on July 20, 2000. The image is located at 35.8 degrees north latitude and 93.6 degrees east longitude. http://photojournal.jpl.nasa.gov/catalog/PIA02658
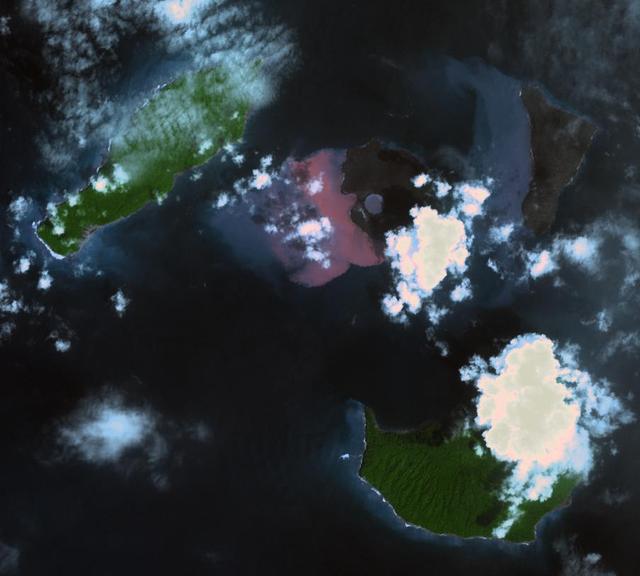
On Dec. 22, 2018, Indonesia's Anak Krakatau volcano erupted and partially collapsed. NASA's Advanced Spaceborne Thermal Emission and Reflection (ASTER) instrument imaged the volcano on Jan. 13 -- several weeks after the eruption. This image shows that the crater area has closed to become a lake and the forest on the island has been destroyed by ash falls. The reddish area in the water southwest of the island is likely due to either iron-rich ash in the water or the interaction of seawater with underwater volcanic eruption products. The image covers an area of 7.5 by 8.4 miles (12.2 by 13.5 kilometers), and is located at 6.1 degrees south, 105.4 degrees east. The tsunami that followed the eruption killed more than 400 people in western Indonesia. https://photojournal.jpl.nasa.gov/catalog/PIA22821

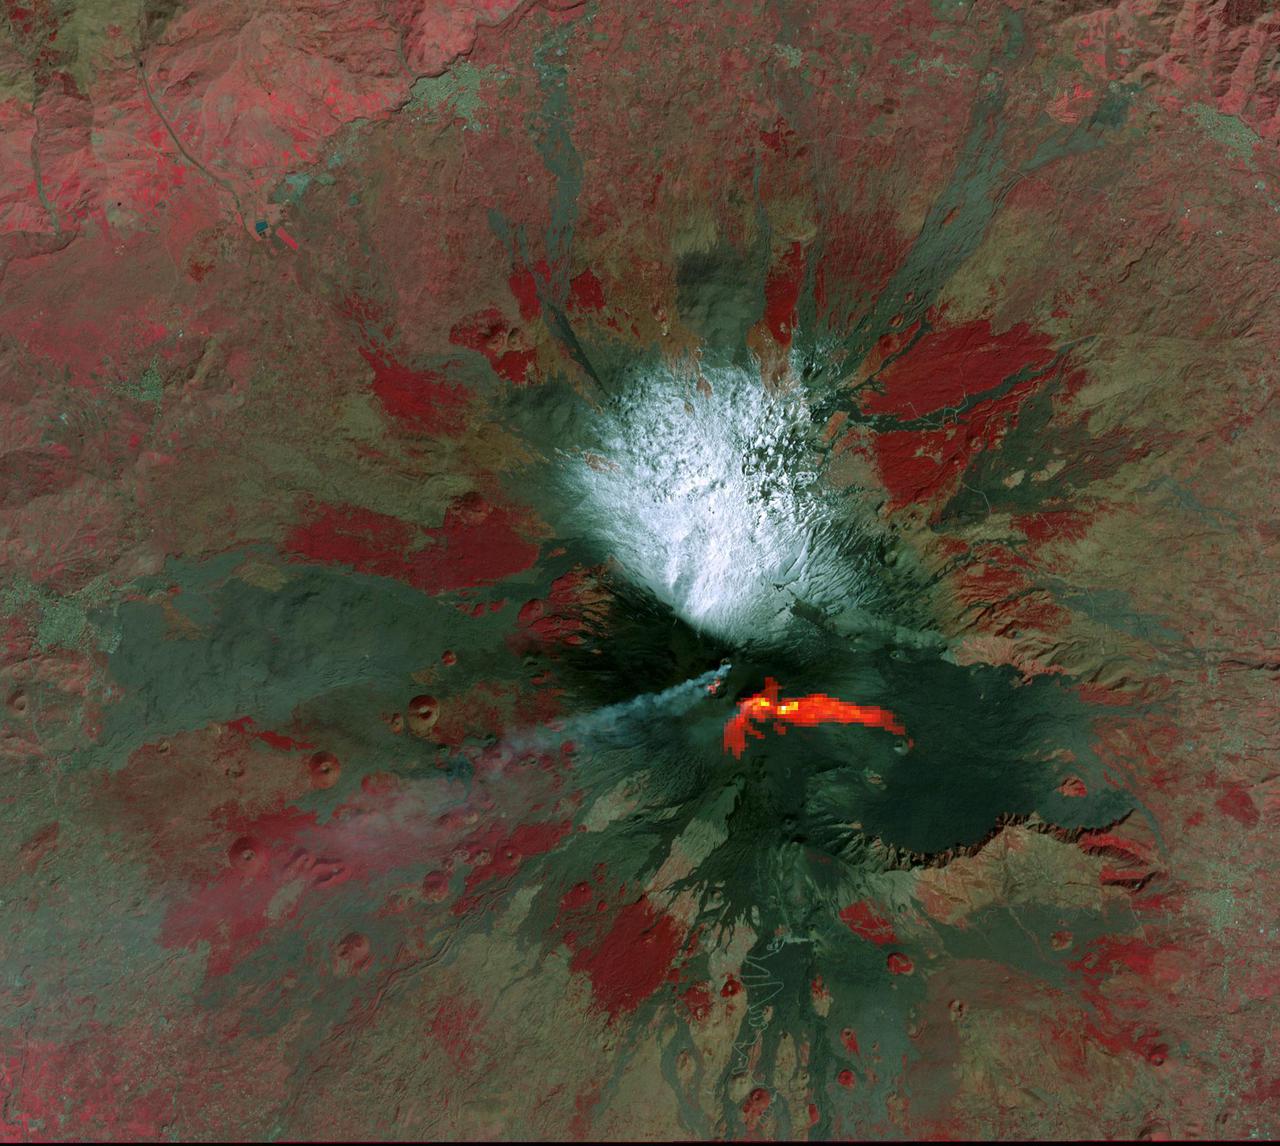
NASA's ASTER (Advanced Spaceborne Thermal Emission and Reflection Radiometer)captured these images of Guatemala's Fuego volcano on Nov. 24, following a recent eruption. The main image shows the lava flows on the flanks of Fuego (upper left corner) in light gray. Vegetation is shown in red, clouds in white, and city and fields in dark gray. A thick ash plume rising from the peak of the volcano and more diffuse ash clouds over the southern part of the scene are also visible. The thermal infrared composite highlights the ash clouds in orange, with a dark orange cloud over the summit where the ash is thickest. White areas are relatively warmer; Fuego's summit is bright white at the active crater. https://photojournal.jpl.nasa.gov/catalog/PIA22820
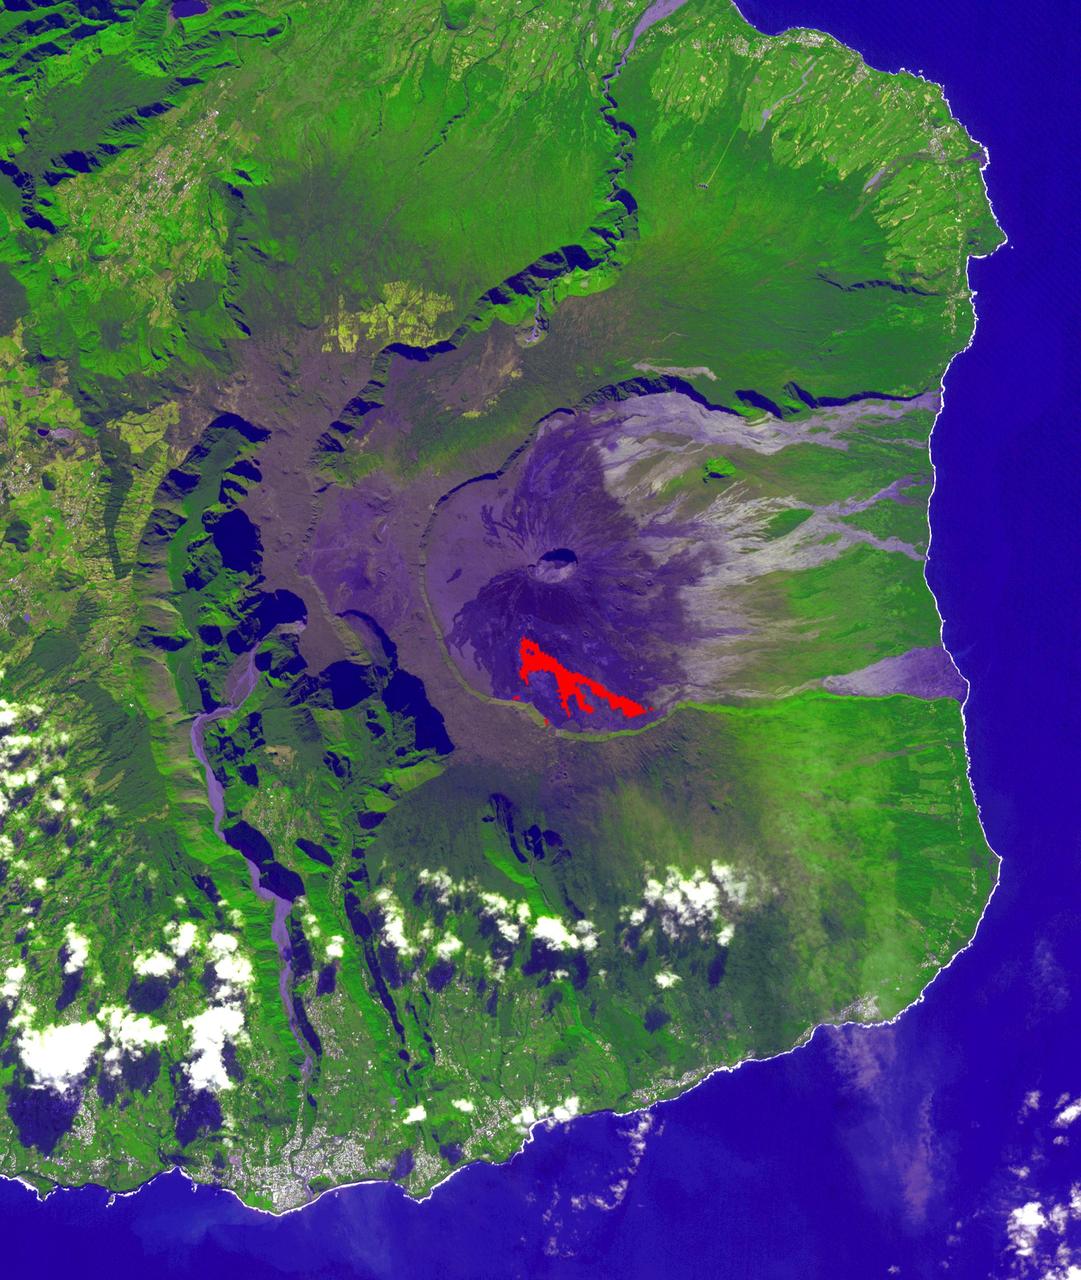
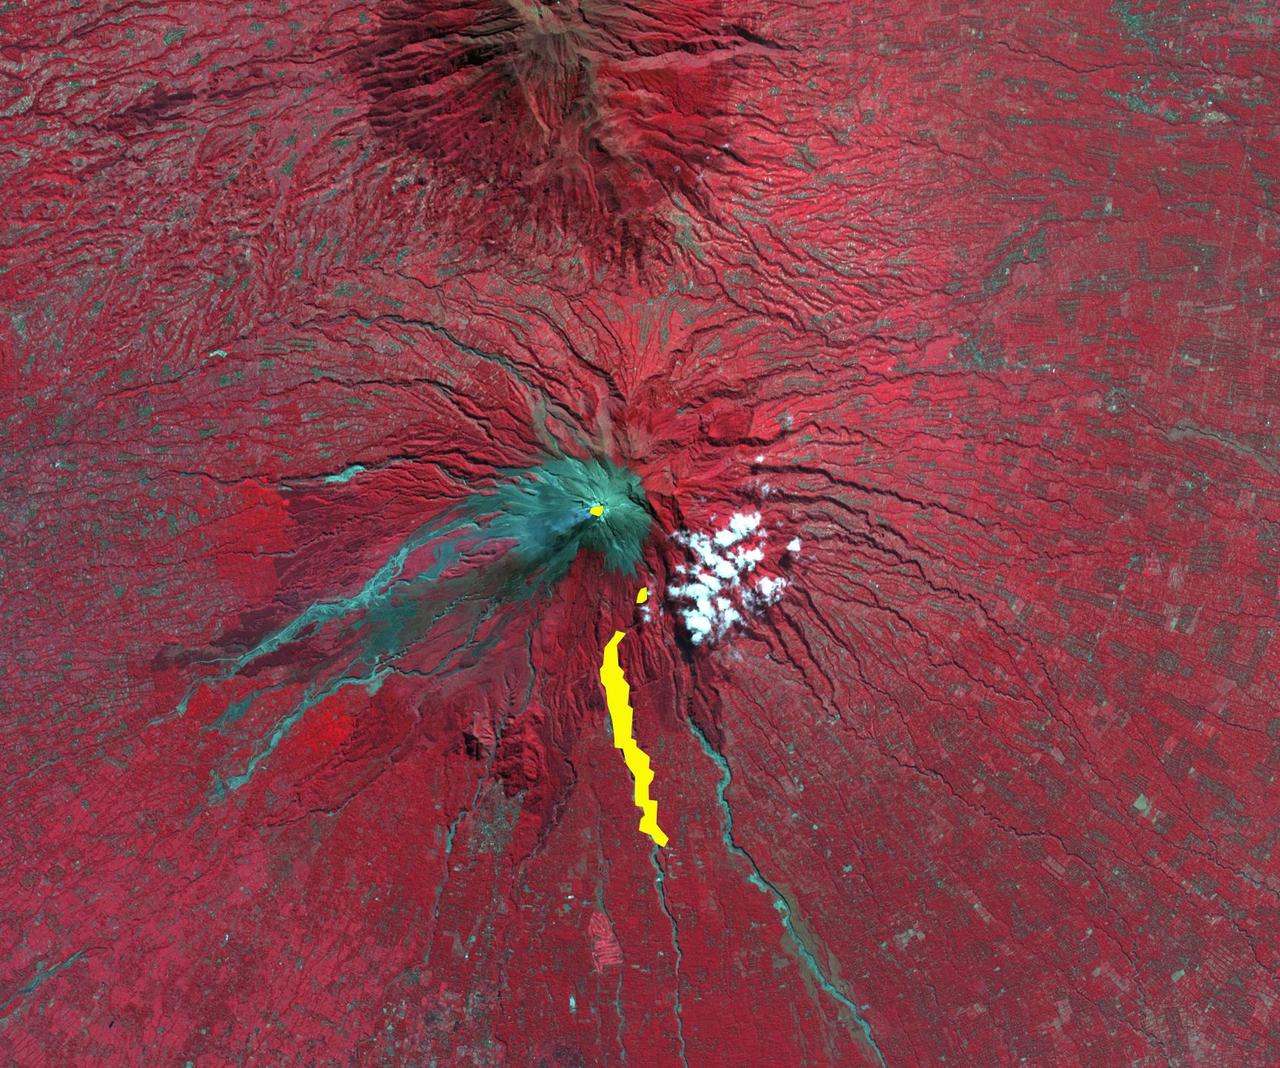
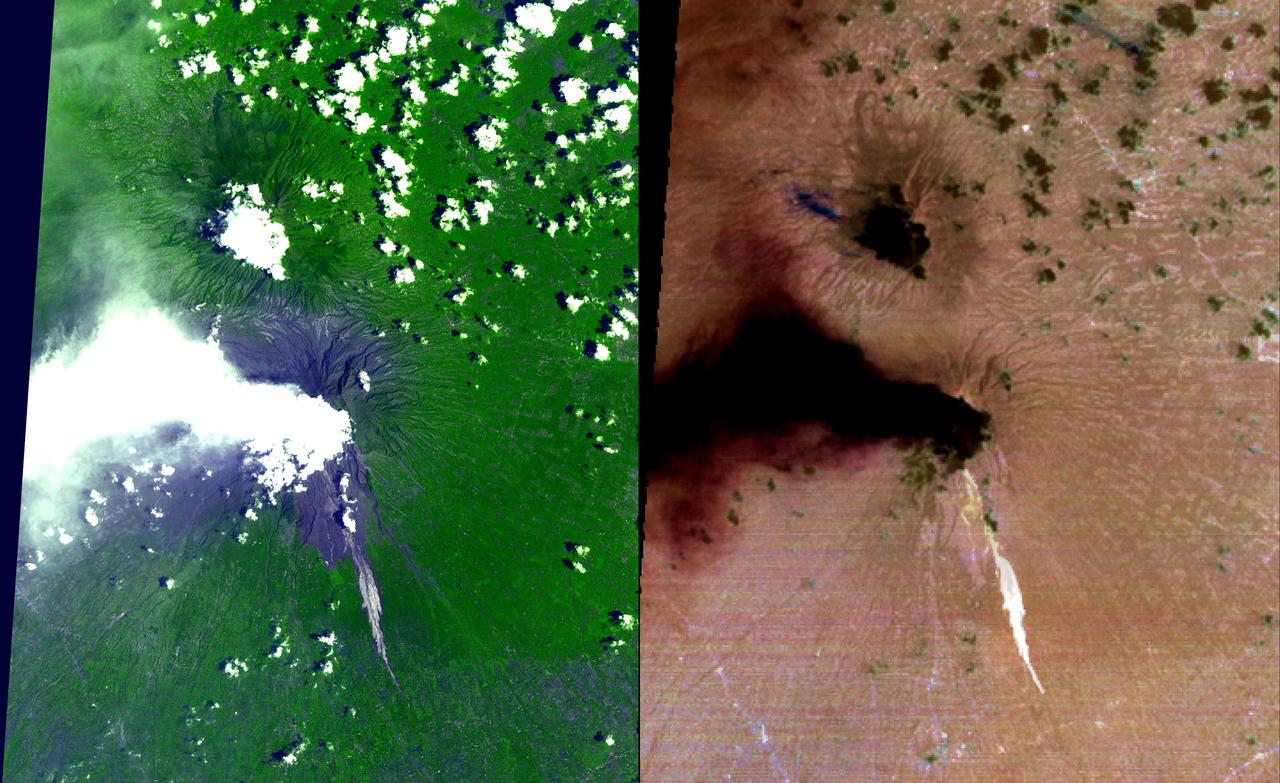
In July, 2018 an eruption began from Piton de la Fournaise volcano on Reunion Island in the western Indian Ocean. Activity continued through November, when these ASTER data were acquired. More than 150 eruptions have occurred since the 17th century. The active flow, derived from the thermal infrared band, is shown in red. The background is a pre-eruption image. The background image was acquired July 16, 2018, and the thermal image on November 1, 2018. The images cover an area of 18 miles by 21 miles (28.9 by 34.2 kilometers), and in the area of 21.3 degrees south, 55.8 degrees east. https://photojournal.jpl.nasa.gov/catalog/PIA22755
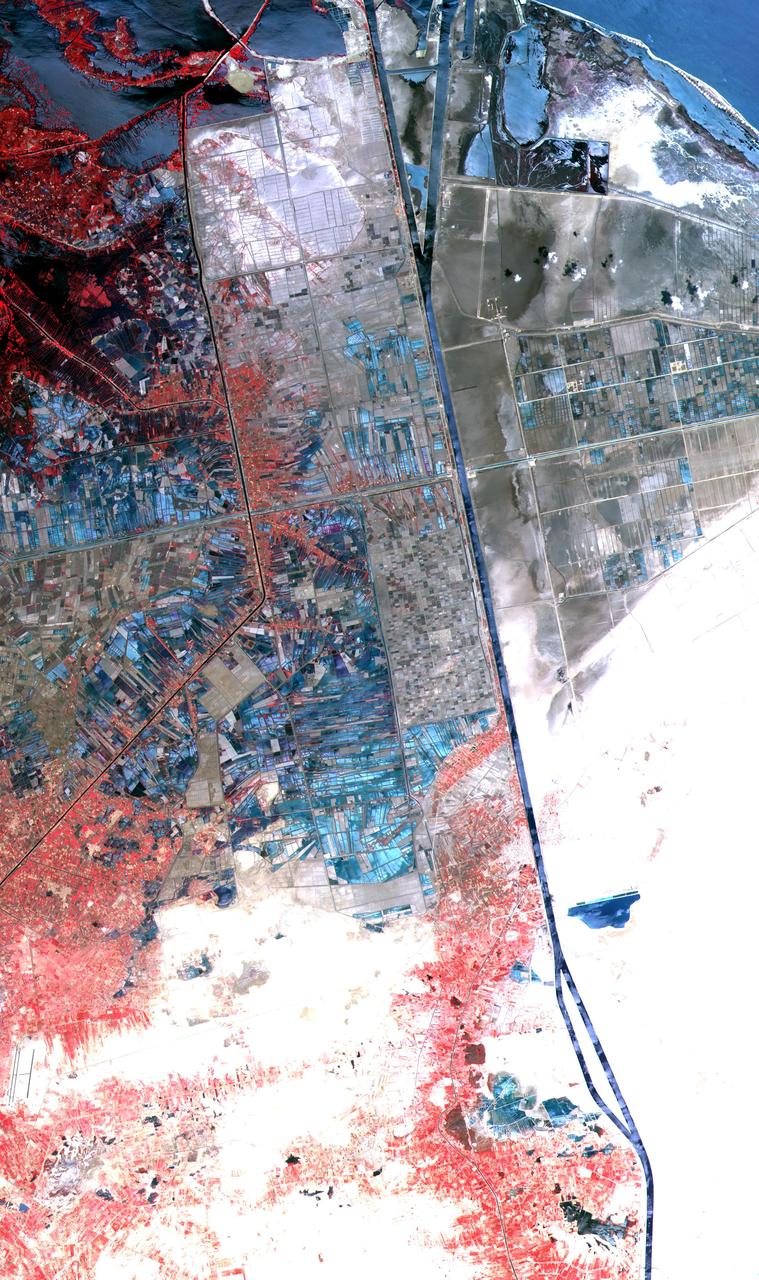
One of the most important waterways in the world, the Suez Canal runs north to south across the Isthmus of Suez in northeastern Egypt. This image of the canal covers an area 36 kilometers (22 miles) wide and 60 kilometers (47 miles) long in three bands of the reflected visible and infrared wavelength region. It shows the northern part of the canal, with the Mediterranean Sea just visible in the upper right corner. The Suez Canal connects the Mediterranean Sea with the Gulf of Suez, an arm of the Red Sea. The artificial canal provides an important shortcut for ships operating between both European and American ports and ports located in southern Asia, eastern Africa, and Oceania. With a length of about 195 kilometers (121 miles) and a minimum channel width of 60 meters (197 feet), the Suez Canal is able to accommodate ships as large as 150,000 tons fully loaded. Because no locks interrupt traffic on this sea level waterway, the transit time only averages about 15 hours. ASTER acquired this scene on May 19, 2000. http://photojournal.jpl.nasa.gov/catalog/PIA02661
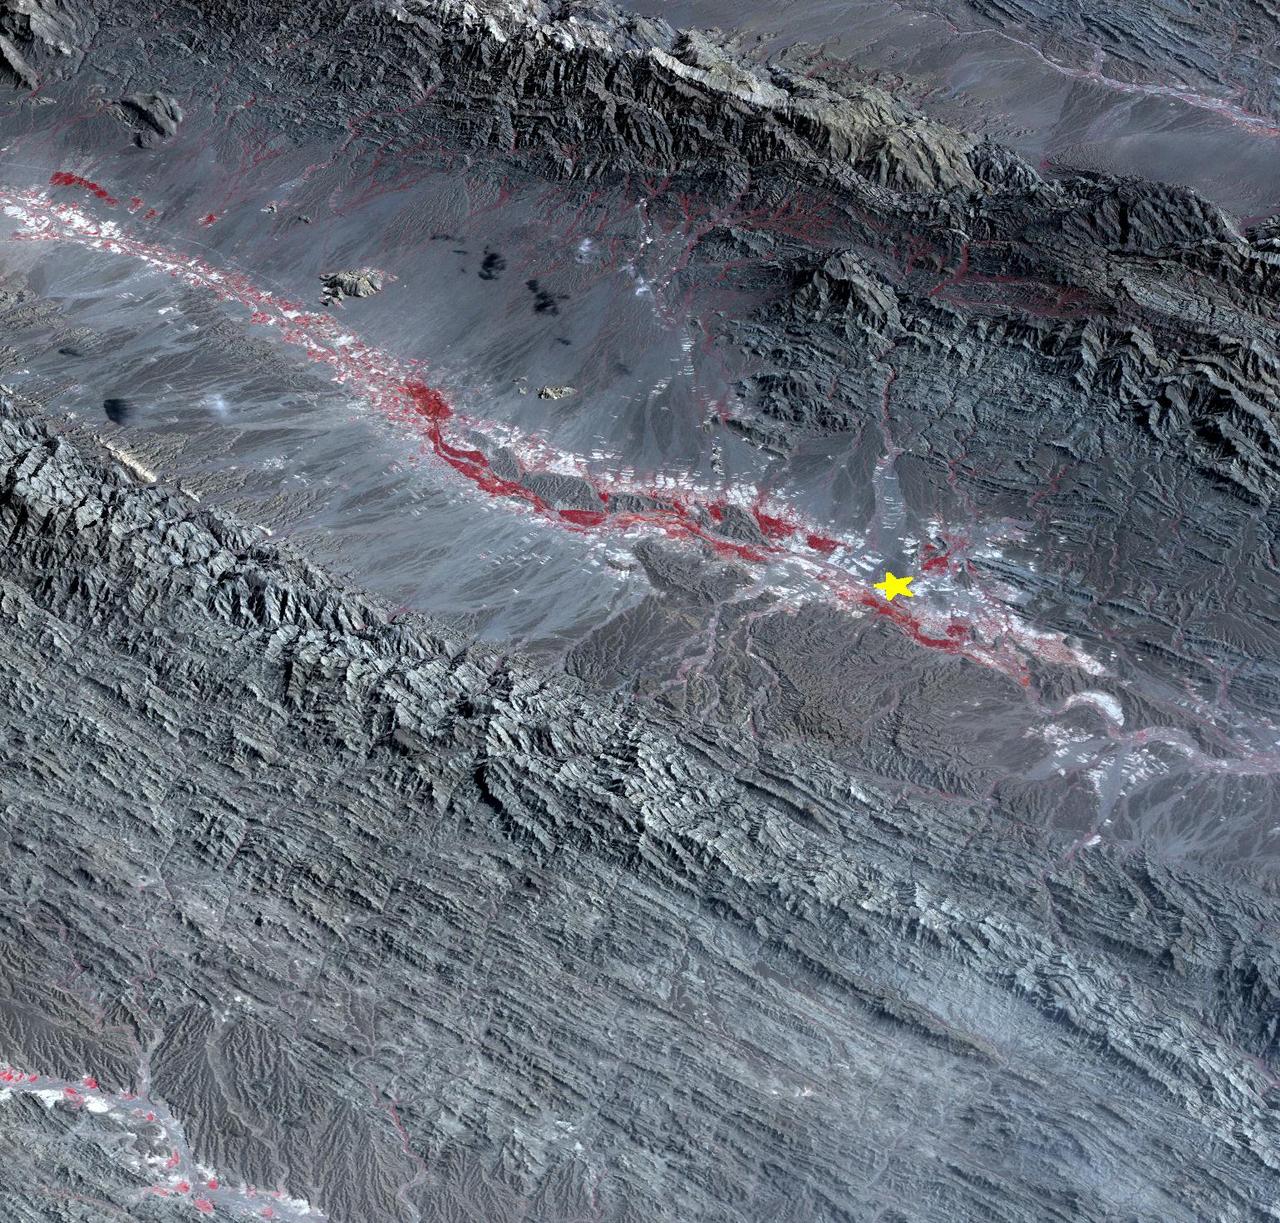
On September 24 at 11:29 GMT, a magnitude 7.7 earthquake struck in south-central Pakistan at a relatively shallow depth of 20 kilometers. The earthquake occurred as the result of oblique strike-slip motion, consistent with rupture within the Eurasian tectonic plate. Tremors were felt as far away as New Delhi as well as Karachi in Pakistan. Even though the immediate area to the epicenter is sparsely populated, the majority of houses are of mud brick construction and damage is expected to be extensive. The perspective view, looking to the east, shows the location of the epicenter in Pakistan's Makran fold belt. The image is centered near 27 degrees north latitude, 65.5 degrees east longitude, and was acquired December 13, 2012. With its 14 spectral bands from the visible to the thermal infrared wavelength region and its high spatial resolution of 15 to 90 meters (about 50 to 300 feet), ASTER images Earth to map and monitor the changing surface of our planet. ASTER is one of five Earth-observing instruments launched Dec. 18, 1999, on Terra. The instrument was built by Japan's Ministry of Economy, Trade and Industry. A joint U.S./Japan science team is responsible for validation and calibration of the instrument and data products. The broad spectral coverage and high spectral resolution of ASTER provides scientists in numerous disciplines with critical information for surface mapping and monitoring of dynamic conditions and temporal change. Example applications are: monitoring glacial advances and retreats; monitoring potentially active volcanoes; identifying crop stress; determining cloud morphology and physical properties; wetlands evaluation; thermal pollution monitoring; coral reef degradation; surface temperature mapping of soils and geology; and measuring surface heat balance. The U.S. science team is located at NASA's Jet Propulsion Laboratory, Pasadena, Calif. The Terra mission is part of NASA's Science Mission Directorate, Washington, D.C. More information about ASTER is available at <a href="http://asterweb.jpl.nasa.gov/" rel="nofollow">asterweb.jpl.nasa.gov/</a>. Image Credit: NASA/GSFC/METI/ERSDAC/JAROS, and U.S./Japan ASTER Science Team Image Addition Date: 2013-09-24 <b><a href="http://www.nasa.gov/audience/formedia/features/MP_Photo_Guidelines.html" rel="nofollow">NASA image use policy.</a></b> <b><a href="http://www.nasa.gov/centers/goddard/home/index.html" rel="nofollow">NASA Goddard Space Flight Center</a></b> enables NASA’s mission through four scientific endeavors: Earth Science, Heliophysics, Solar System Exploration, and Astrophysics. Goddard plays a leading role in NASA’s accomplishments by contributing compelling scientific knowledge to advance the Agency’s mission. <b>Follow us on <a href="http://twitter.com/NASA_GoddardPix" rel="nofollow">Twitter</a></b> <b>Like us on <a href="http://www.facebook.com/pages/Greenbelt-MD/NASA-Goddard/395013845897?ref=tsd" rel="nofollow">Facebook</a></b> <b>Find us on <a href="http://instagram.com/nasagoddard?vm=grid" rel="nofollow">Instagram</a></b>
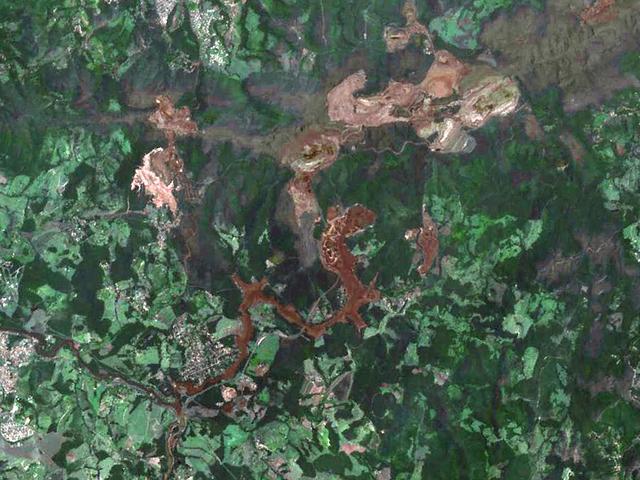
On January 25, 2019, a dam burst at a Brazilian iron ore mine. The dam's breach unleashed a torrent of mud and mine debris, covering the city of Brumadinho. The image was acquired by ASTER on February 1, 2019, covers an area of 10.8 by 14.8 kilometers, and is located at 20.1 degrees south, 44.1 degrees west. https://photojournal.jpl.nasa.gov/catalog/PIA22824
ASTER succeeded in acquiring this image at night, which is something Visible/Near Infrared VNIR) and Shortwave Infrared (SWIR) sensors cannot do. The scene covers the Red Sea coastline to an inland area of Ethiopia. White pixels represent areas with higher temperature material on the surface, while dark pixels indicate lower temperatures. This image shows ASTER's ability as a highly sensitive, temperature-discerning instrument and the first spaceborne TIR multi-band sensor in history. The size of image: 60 km x 60 km approx., ground resolution 90 m x 90 m approximately. http://photojournal.jpl.nasa.gov/catalog/PIA02452
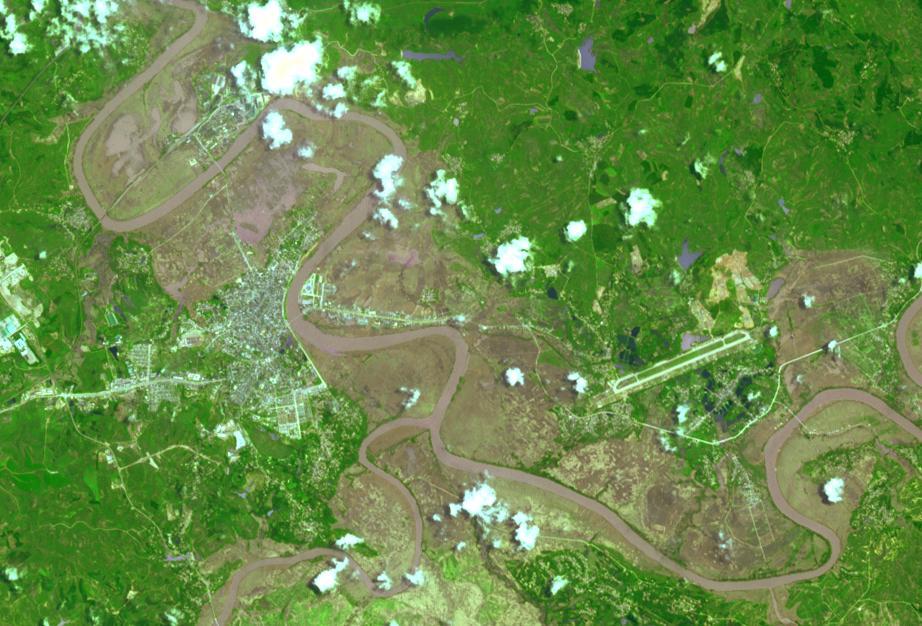
This image from the NASA Terra spacecraft shows extensive flooding resulting from Typhoon Rammasun in Ningming, China. This ASTER image was acquired on July 24, 2014.
On July 3, 2004, the Advanced Spaceborne Thermal Emission and Reflection Radiometer ASTER on NASA Terra satellite acquired this image of the Willow fire near Payson, Arizona.
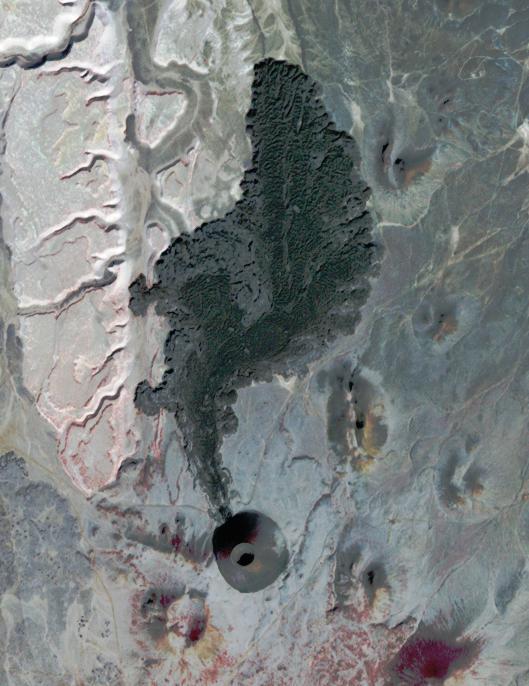
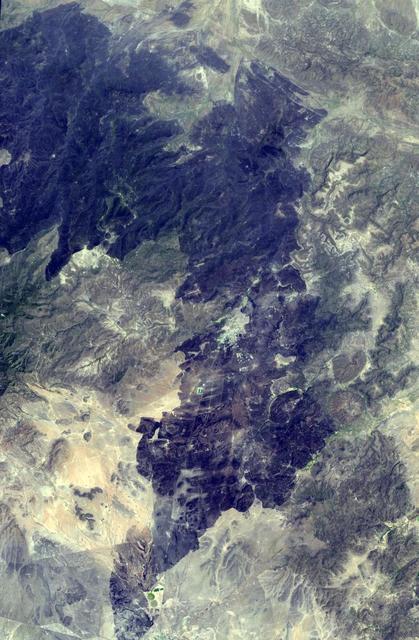
SP Crater, a volcanic cone and flow in Arizona, is visible in this image obtained by the Advanced Spaceborne Thermal Emission and Reflection Radiometer ASTER instrument on NASA Terra spacecraft.

The Tsugaru Iwaki Skyline is a toll road in northern Japan, which partially ascends Mount Iwaki stratovolcano, and is notable for its steep gradient and 69 hairpin turns. The road ascends 806 meters over an average gradient of 8.66%, with some sections going up to 10%. The Tsugaru Iwaki Skyline has been considered one of the most dangerous mountain roads in the world. (Wikipedia) The image was acquired May 26, 2015, and is located at 40.6 degrees north, 140.3 degrees east. https://photojournal.jpl.nasa.gov/catalog/PIA22385
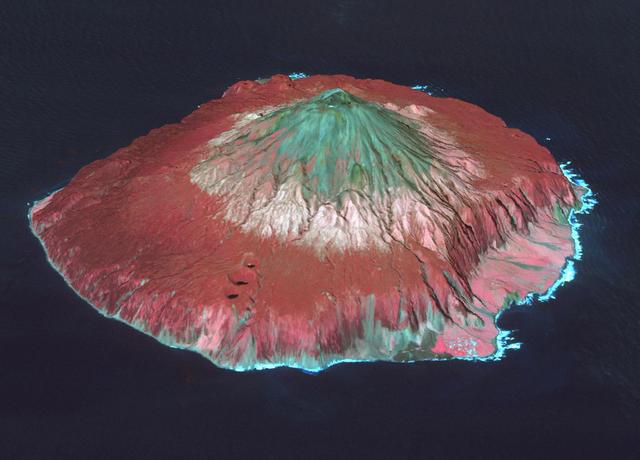
Tristan da Cunha is both a remote group of volcanic islands in the south Atlantic, and the main island. It is the most remote inhabited island group in the world, 2400 km from the nearest inhabited land. Tristan has a population of about 250 inhabitants, and is part of the British overseas territory of Saint Helena, Ascension and Tristan da Cunha. In 1961 the eruption of Queen Mary's Peak forced the evacuation of the entire population for two years. The image was acquired October 7, 2017, and is located at 37.1 degrees south, 12.3 degrees west. https://photojournal.jpl.nasa.gov/catalog/PIA22506
Lake Enriquillo is a hypersaline lake in the Dominican Republic. In 2004, the lake covered an area of 164 square kilometers; by 2011, it had doubled in size and grown to 350 km2, inundating farmland and homes. Various reasons for the flooding include increases in rainfall; increase of sediments going into the lake, raising the lakebed; and milder temperatures, reducing surface evaporation. The lake is home to the largest population of American crocodiles in the Caribbean. The images were acquired October 26, 2003 and June 10, 2017, cover an area of 22.7 by 45.4 km, and are located at 18.5 degrees north, 71.6 degrees west. An image of Lake Enriquillo taken in 2003 is available at https://photojournal.jpl.nasa.gov/catalog/PIA21815
This image was acquired on October 12, 2002 by the Advanced Spaceborne Thermal Emission and Reflection Radiometer (ASTER) on NASA's Terra satellite. With its 14 spectral bands from the visible to the thermal infrared wavelength region, and its high spatial resolution of 15 to 90 meters (about 50 to 300 feet), ASTER will image Earth for the next 6 years to map and monitor the changing surface of our planet. http://photojournal.jpl.nasa.gov/catalog/PIA03498
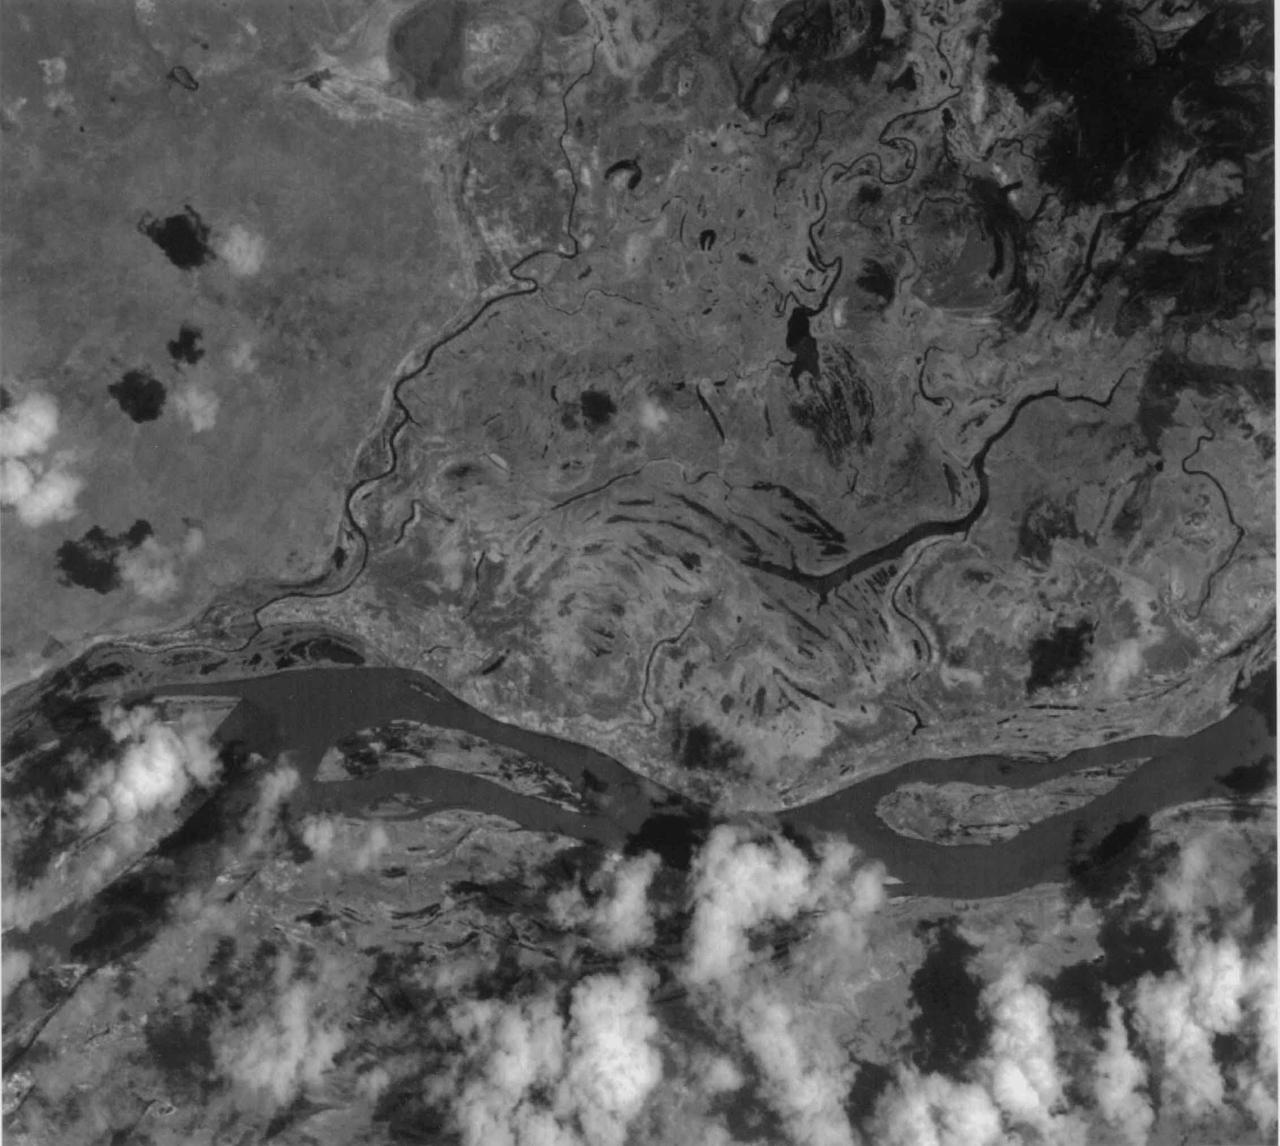
This image of the San Francisco River channel, and its surrounding flood zone, in Brazil was acquired by band 3N of ASTER's Visible/Near Infrared sensor. The surrounding area along the river channel in light gray to white could be covered by dense tropical rain forests. The water surface of the San Francisco River shows rather gray color as compared to small lakes and tributaries, which could indicate that the river water is contaminated by suspended material. The size of image: 20 km x 20 km approx., ground resolution 15 m x 15 m approximately. http://photojournal.jpl.nasa.gov/catalog/PIA02451
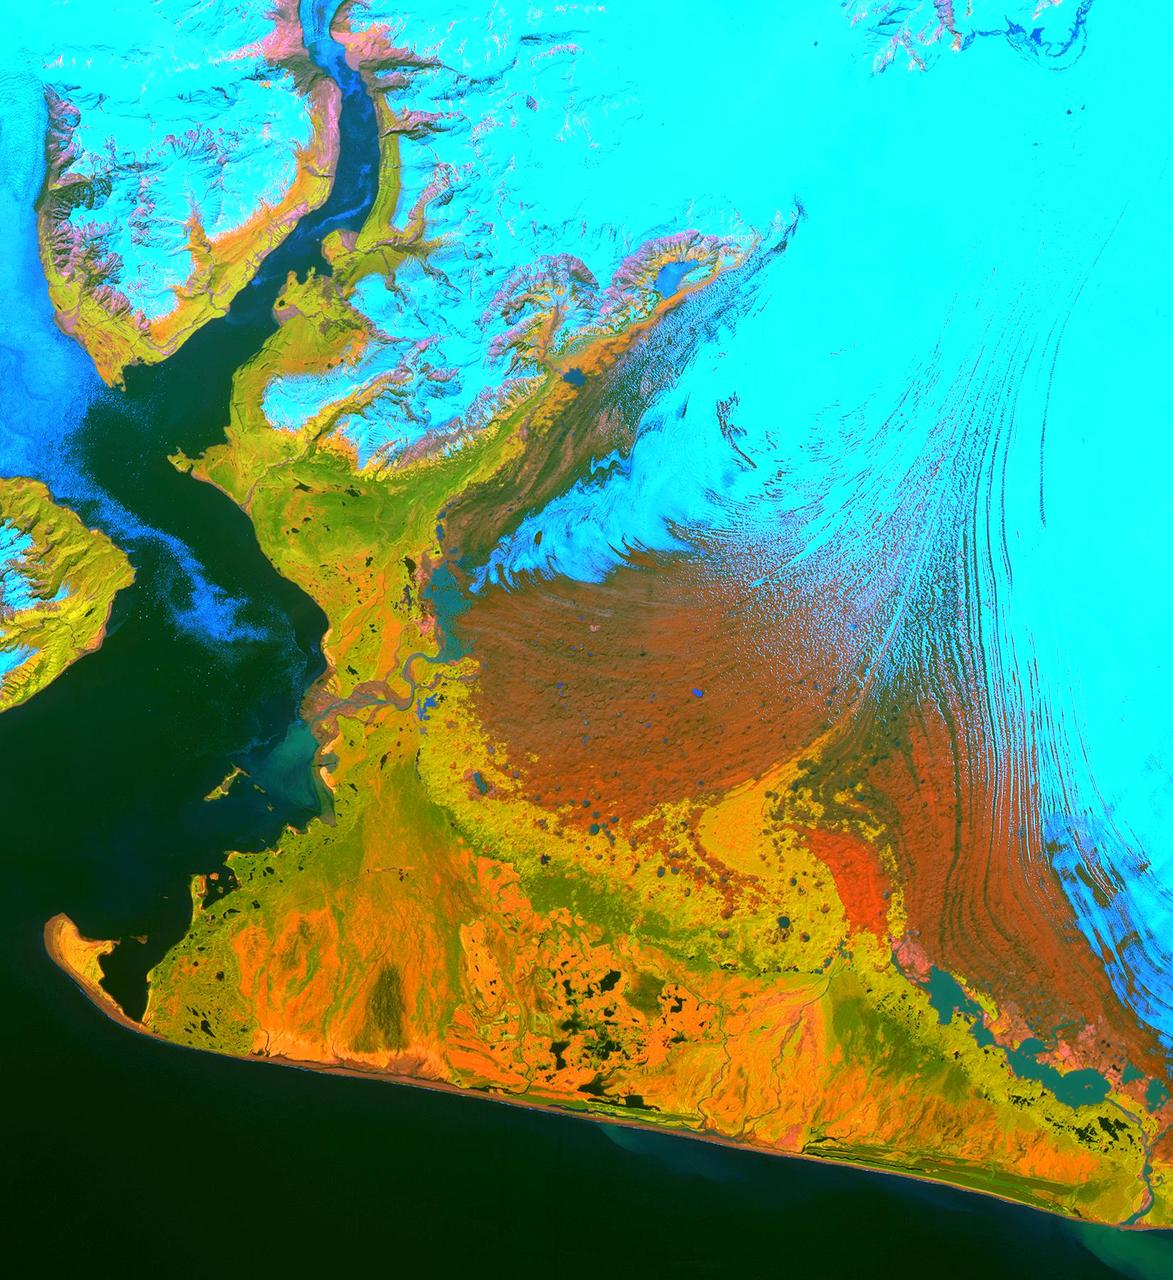
This image from the Advanced Spaceborne Thermal Emission and Reflection Radiometer (ASTER) instrument on NASA's Terra satellite covers an area of 55 by 40 kilometers (34 by 25 miles) over the southwest part of the Malaspina Glacier and Icy Bay in Alaska. The composite of infrared and visible bands results in the snow and ice appearing light blue, dense vegetation is yellow-orange and green, and less vegetated, gravelly areas are in orange. According to Dr. Dennis Trabant (U.S. Geological Survey, Fairbanks, Alaska), the Malaspina Glacier is thinning. Its terminal moraine protects it from contact with the open ocean; without the moraine, or if sea level rises sufficiently to reconnect the glacier with the ocean, the glacier would start calving and retreat significantly. ASTER data are being used to help monitor the size and movement of some 15,000 tidal and piedmont glaciers in Alaska. Evidence derived from ASTER and many other satellite and ground-based measurements suggests that only a few dozen Alaskan glaciers are advancing. The overwhelming majority of them are retreating. This ASTER image was acquired on June 8, 2001. With its 14 spectral bands from the visible to the thermal infrared wavelength region, and its high spatial resolution of 15 to 90 meters (about 50 to 300 feet), ASTER will image Earth for the next six years to map and monitor the changing surface of our planet. http://photojournal.jpl.nasa.gov/catalog/PIA03475
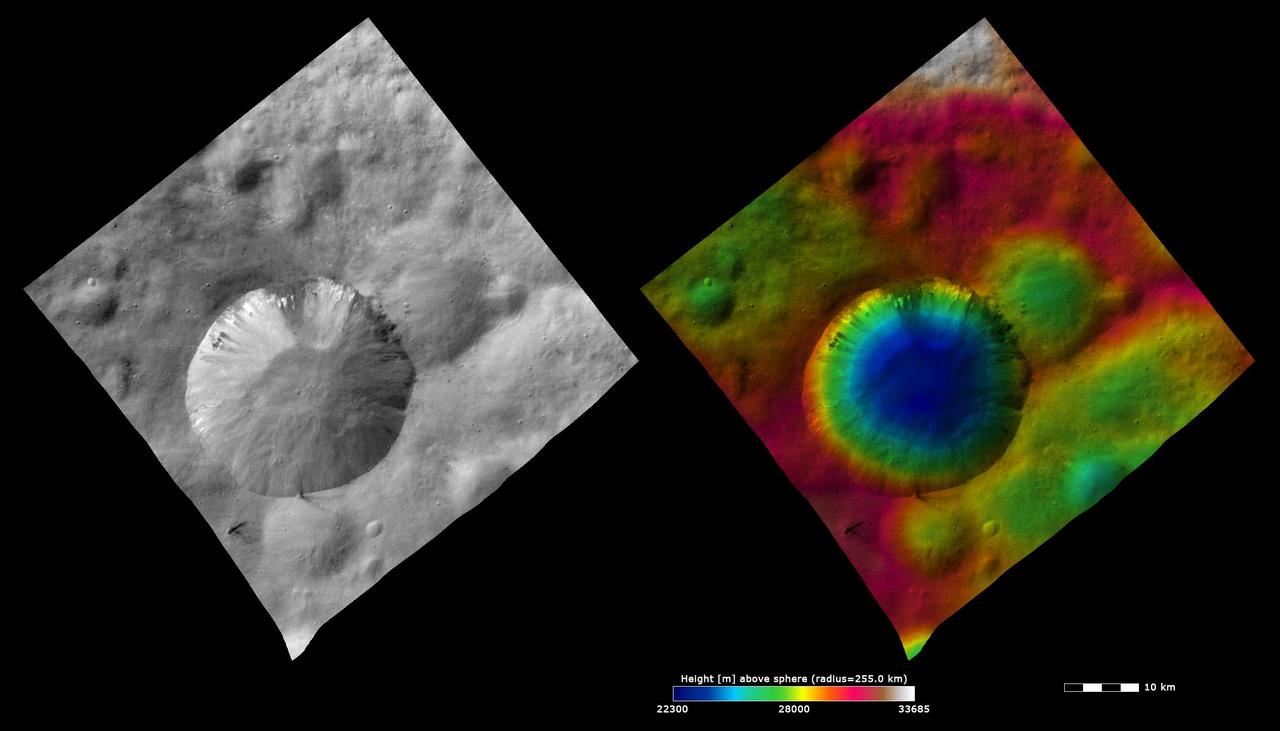
These images from NASA Dawn spacecraft show the ~20km diameter Numisia crater on asteroid Aster, after which Numisia quadrangle is named.
Fires near Big Sur, Calif., continued to burn unchecked when the Advanced Spaceborne Thermal Emission and Reflection Radiometer ASTER instrument on NASA Terra satellite captured this image on Sunday, June 29, 2008.
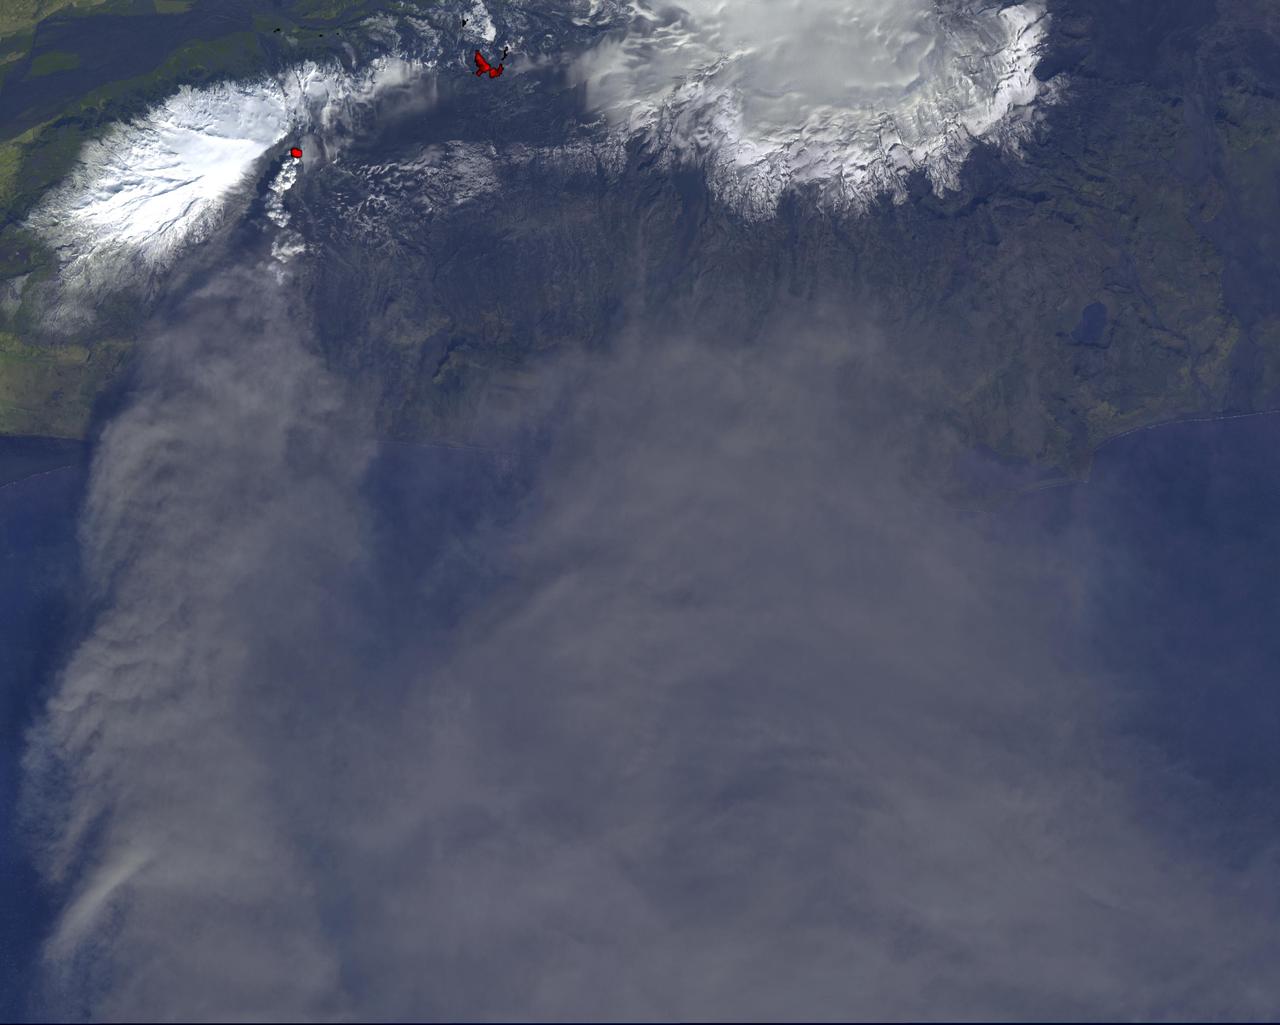
On Monday, April 19, 2010, the Advanced Spaceborne Thermal Emission and Reflection Radiometer ASTER instrument onboard NASA Terra spacecraft obtained this image of the continuing eruption of Iceland Eyjafjallajökull volcano.
On January 17, 2011, the Advanced Spaceborne Thermal Emission and Reflection Radiometer ASTER instrument on NASA Terra spacecraft captured this image of the inundation west of Brisbane, Queensland, Australia.
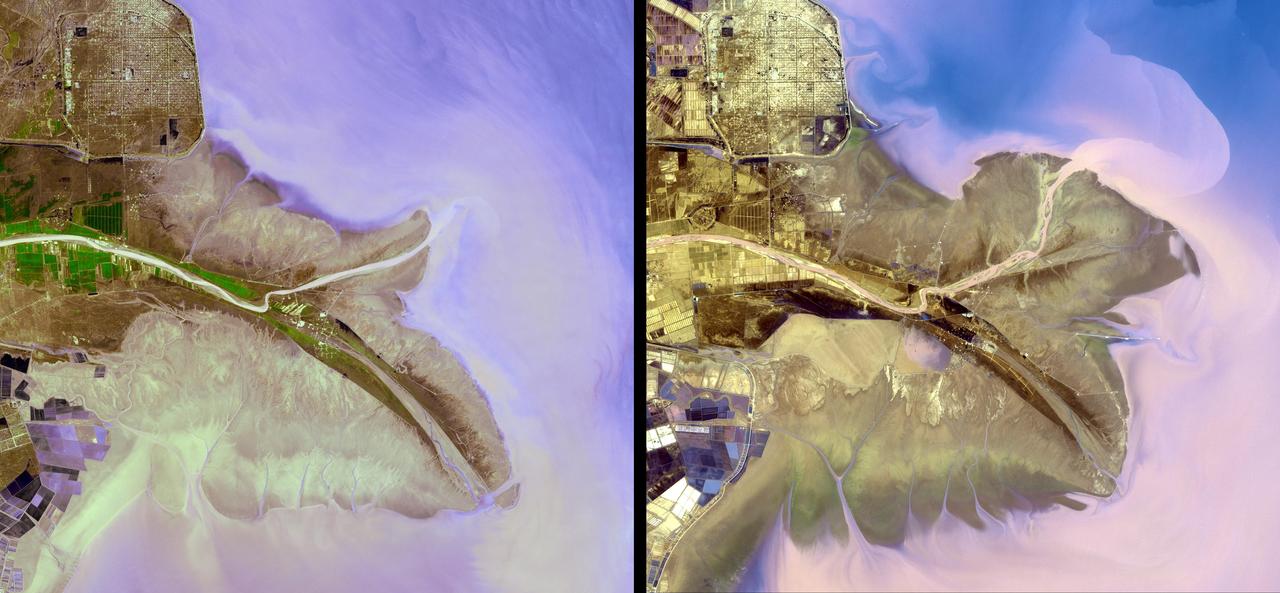
The Yellow River is the second-longest river in China, and the sixth longest in the world and makes many dramatic shifts over time. This image was taken with the ASTER instrument aboard NASA Terra spacecraft in 2009.
On Nov. 8, 2010, the ASTER instrument onboard NASA Terra spacecraft captured an image of the hot volcanic flows from Merapi volcano that resulted from continued collapse of the summit lava dome, and the ensuing release of ash plumes.
The ASTER instrument onboard NASA Terra spacecraft imaged the hot volcanic flow that resulted from collapse of the summit lava dome from the Merapi volcano in Indonesia that erupted on Oct. 26, 2010.
The ASTER instrument onboard NASA Terra spacecraft imaged the Khyber Pass, a mountain pass that links Afghanistan and Pakistan. Throughout its history it has been an important trade route between Central Asia and South Asia.
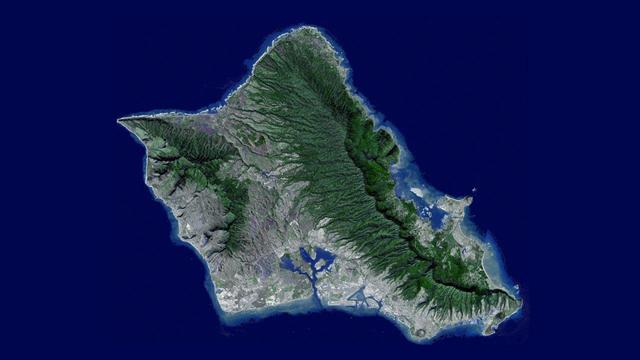
Sometimes called The Gathering Place, Oahu is the third largest of the Hawaiian Islands. This image was captured by NASA Terra spacecraft. A flyover was created by draping ASTER image data acquired January 13, 2010.
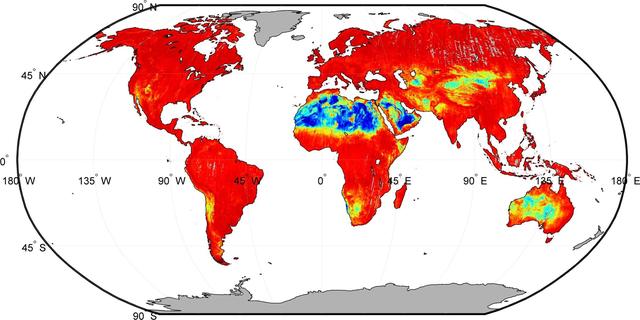
Our planet emits energy as thermal infrared radiation at wavelengths we cannot normally see but can feel -- for example, if we stand close to a hot surface. This map is from NASA ASTER GED.
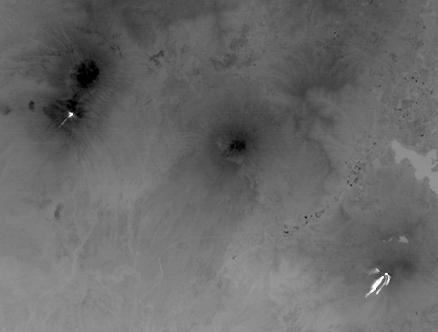
Two of Guatemala's active volcanoes, Fuego (upper left) and Pacaya (lower right) were erupting when the ASTER nighttime thermal infrared image was acquired on March 5, 2021. Pacaya's most recent eruption began Wednesday, with several lava flows and ash eruptions; surrounding villages were ordered evacuated. Since mid-February, Fuego continued to produce sporadic emissions of ash from its active central crater. In the ASTER image, the hottest areas are white, and coldest are black. The image covers an area of 29.8 by 40.3 km, and is centered at 14.4 degrees north, 90.8 degrees west. https://photojournal.jpl.nasa.gov/catalog/PIA24419
In this image of the Andes along the Chile-Bolivia border, the visible and infrared data have been computer enhanced to exaggerate the color differences of the different materials. The scene is dominated by the Pampa Luxsar lava complex, occupying the upper right two-thirds of the scene. Lava flows are distributed around remnants of large dissected cones, the largest of which is Cerro Luxsar. On the middle left edge of the image are the Olca and Parumastrato volcanoes, which appear in blue due to a lack of vegetation (colored red in this composite). This image covers an area 60 kilometers (37 miles) wide and 60 kilometers (37 miles) long in three bands of the reflected visible and infrared wavelength region. It was acquired on April 7, 2000. The image is located at 21 degrees south latitude, 68.3 degrees west longitude. http://photojournal.jpl.nasa.gov/catalog/PIA02654
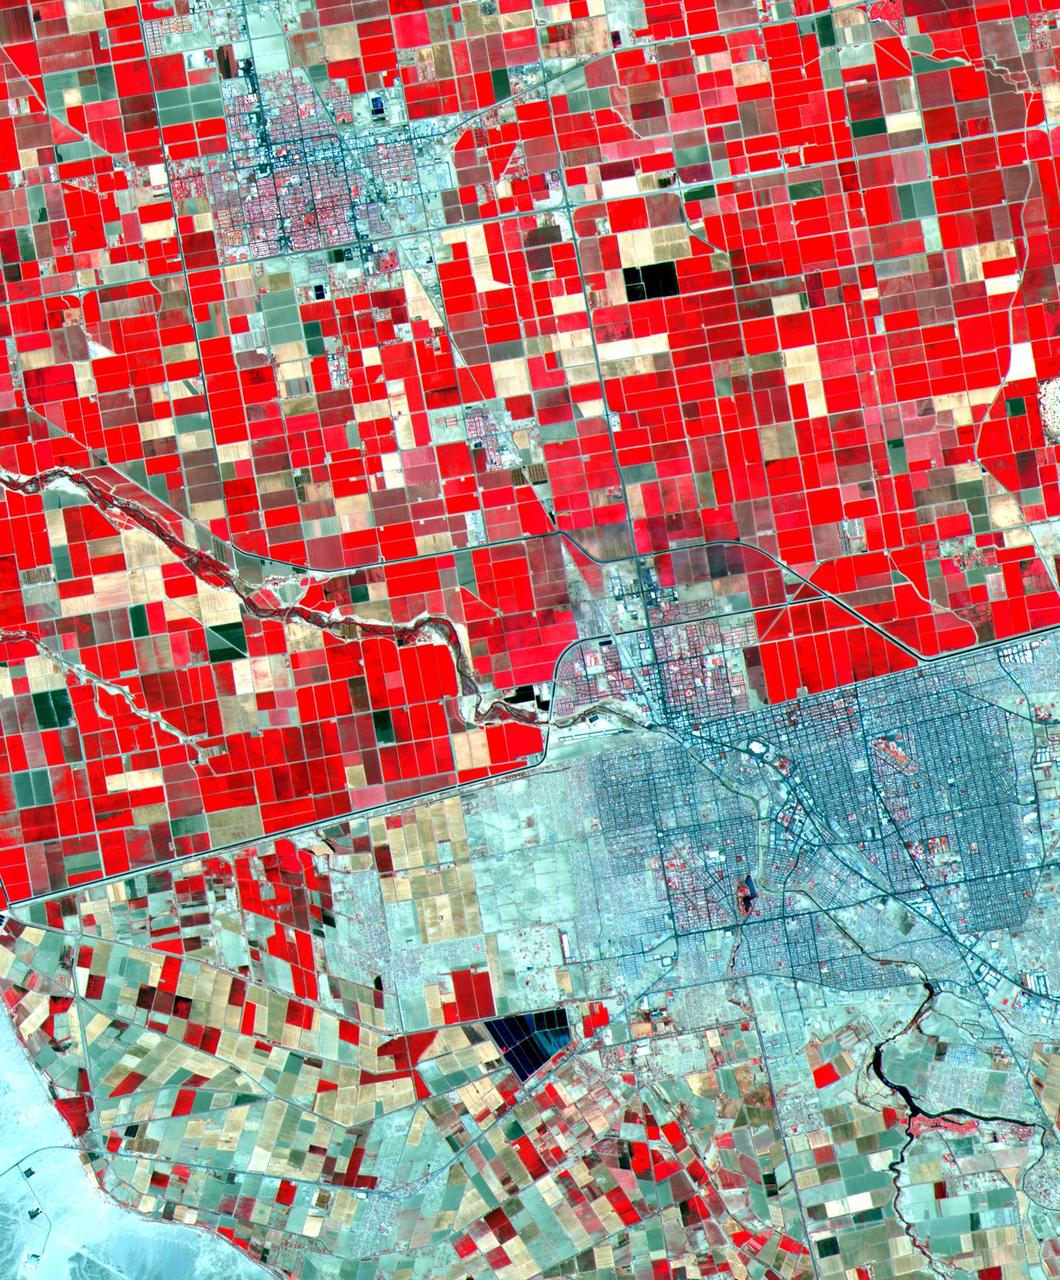
Dramatic differences in land use patterns are highlighted in this image of the U.S.-Mexico border. Lush, regularly gridded agricultural fields on the U.S. side contrast with the more barren fields of Mexico. This June 12, 2000, sub-scene combines visible and near infrared bands, displaying vegetation in red. The town of Mexicali-Calexico spans the border in the middle of the image; El Centro, California, is in the upper left. Watered by canals fed from the Colorado River, California's Imperial Valley is one of the country's major fruit and vegetable producers. This image covers an area 24 kilometers (15 miles) wide and 30 kilometers (19 miles) long in three bands of the reflected visible and infrared wavelength region. http://photojournal.jpl.nasa.gov/catalog/PIA02659
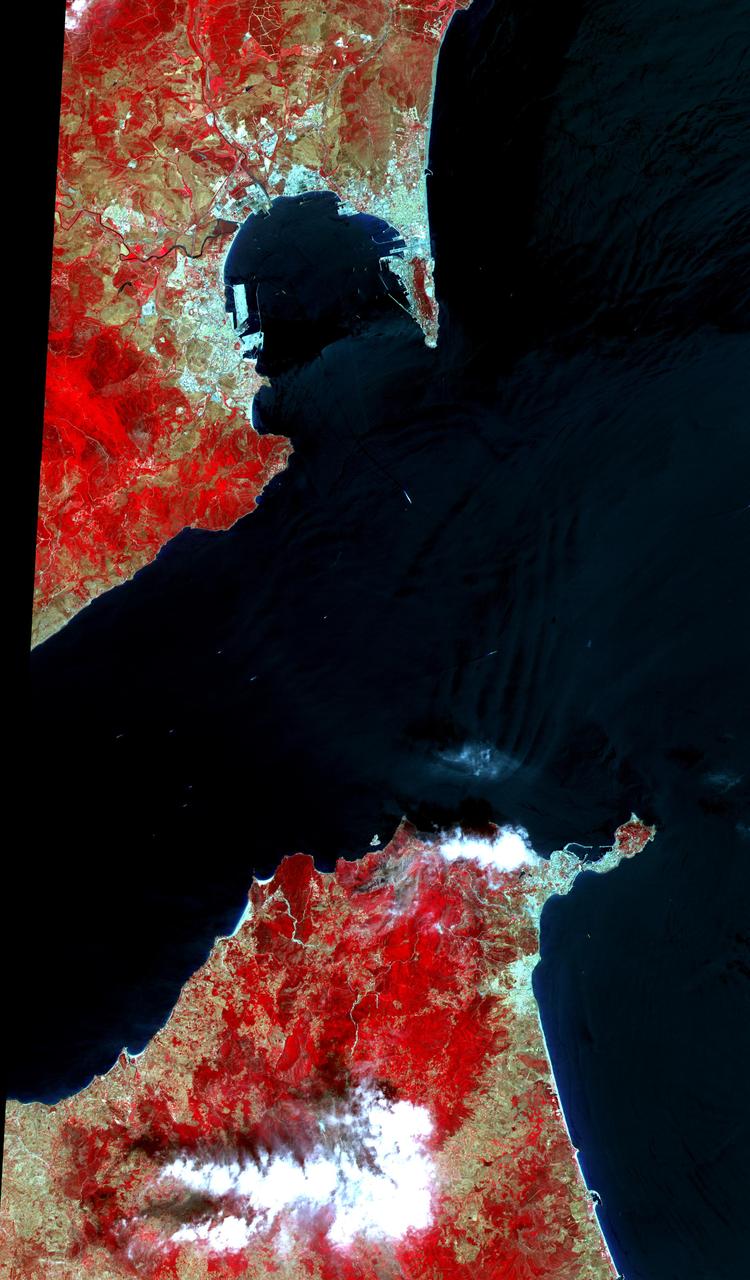
The Strait of Gibraltar separates Spain from Morocco. This image, acquired on July 5, 2000, covers an area 34 kilometers (21 miles) wide and 59 kilometers (37 miles) long in three bands of the reflected visible and infrared wavelength region. The promontory on the eastern side of the conspicuous Spanish port is the Rock of Gibraltar. Once one of the two classical Pillars of Hercules, the Rock was crowned with silver columns by Phoenician mariners to mark the limits of safe navigation for the ancient Mediterranean peoples. The rocky promontory still commands the western entrance to the Mediterranean Sea. The rocky limestone and shale ridge rises abruptly from the sea, to a maximum elevation of 426 meters (1,398 feet). A British colony, Gibraltar occupies a narrow strip of land at the southernmost tip of the Iberian Peninsula. It is separated from the Spanish mainland by a neutral zone contained on a narrow, sandy isthmus. Because of its strategic location and formidable topography, Gibraltar serves mainly as a British fortress. Most of its sparse land is taken up by air and naval installations, and the civilian population is small. http://photojournal.jpl.nasa.gov/catalog/PIA02657
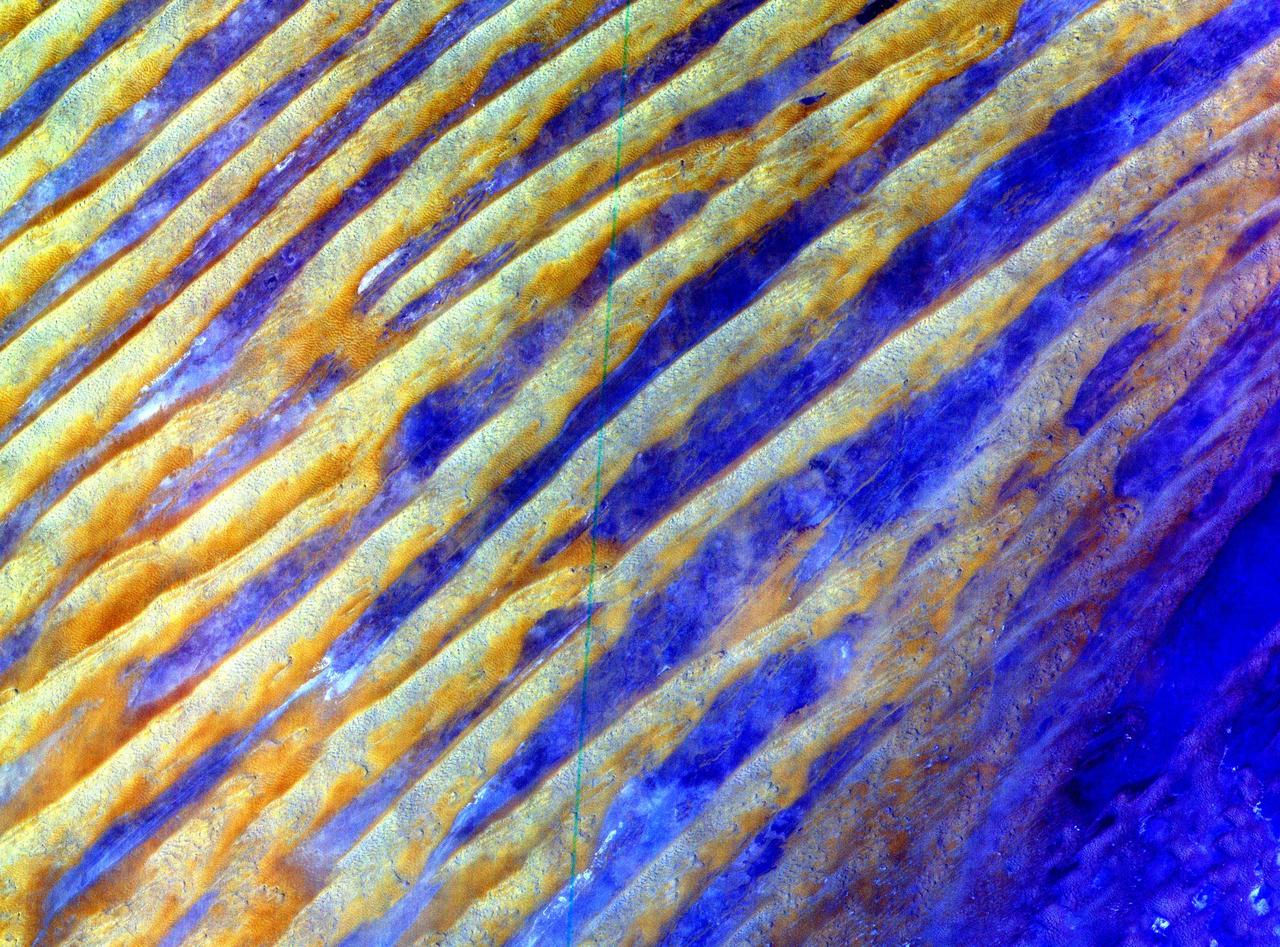
This image of Saudi Arabia shows a great sea of linear dunes in part of the Rub' al Khali, or the Empty Quarter. Acquired on June 25, 2000, the image covers an area 37 kilometers (23 miles) wide and 28 kilometers (17 miles) long in three bands of the reflected visible and infrared wavelength region. The dunes are yellow due to the presence of iron oxide minerals. The inter-dune area is made up of clays and silt and appears blue due to its high reflectance in band 1. The Rub' al Khali is the world's largest continuous sand desert. It covers about 650,000 square kilometers (250,966 square miles) and lies mainly in southern Saudi Arabia, though it does extend into the United Arab Emirates, Oman, and Yemen. One of the world's driest areas, it is uninhabited except for the Bedouin nomads who cross it. The first European to travel through the desert was Bertram Thomas in 1930. http://photojournal.jpl.nasa.gov/catalog/PIA02656
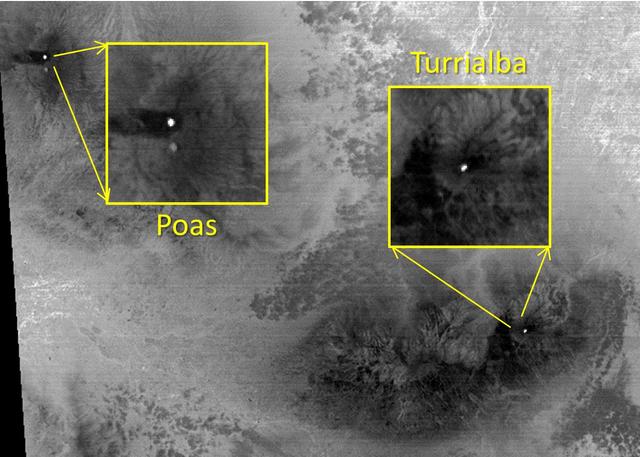
The March, 2015 eruption of Turrialba Volcano in Costa Rica caught everyone by surprise as seen in this image from the ASTER instrument onboard NASA Terra spacecraft. Activity had greatly diminished when the Advanced Spaceborne Thermal Emission and Reflection Radiometer (ASTER) instrument on NASA's Terra spacecraft acquired this nighttime thermal infrared image on April 2, 2015. The hot summit crater appears in white, indicating continued volcanic unrest. To the west, Poas Volcano's hot crater lake also appears white, though its temperature is considerably less than Turrialba's crater. The large image covers an area of 28 by 39 miles (45 by 63 kilometers); the insets 2 by 2 miles (3.1 by 3.1 kilometers). The image is centered at 10.1 degrees north, 84 degrees west. http://photojournal.jpl.nasa.gov/catalog/PIA19355
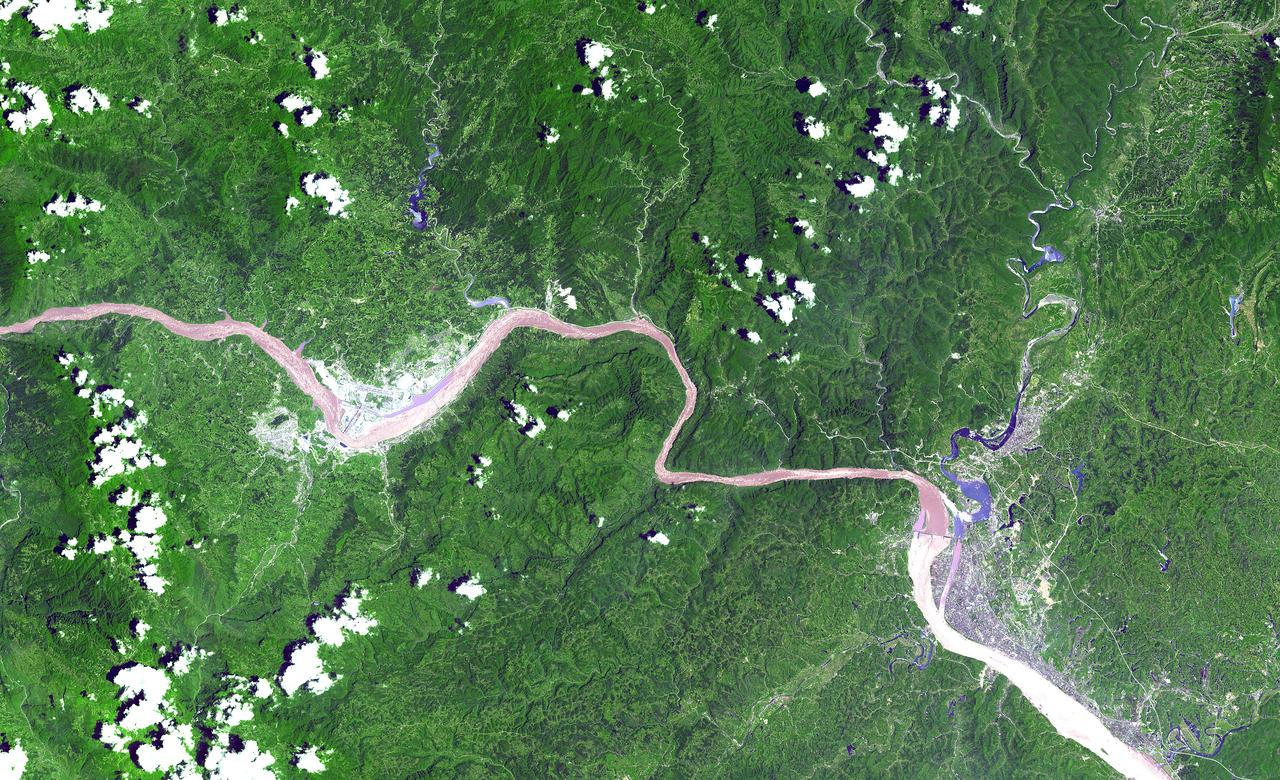
This ASTER image shows a 60 km stretch of the Yangtze River in China, including the Xiling Gorge, the eastern of the three gorges. In the left part of the image is the construction site of the Three Gorges Dam, the world's largest. This image was acquired on July 20, 2000 by the Advanced Spaceborne Thermal Emission and Reflection Radiometer (ASTER) on NASA's Terra satellite. With its 14 spectral bands from the visible to the thermal infrared wavelength region, and its high spatial resolution of 15 to 90 meters (about 50 to 300 feet), ASTER will image Earth for the next 6 years to map and monitor the changing surface of our planet. http://photojournal.jpl.nasa.gov/catalog/PIA03852
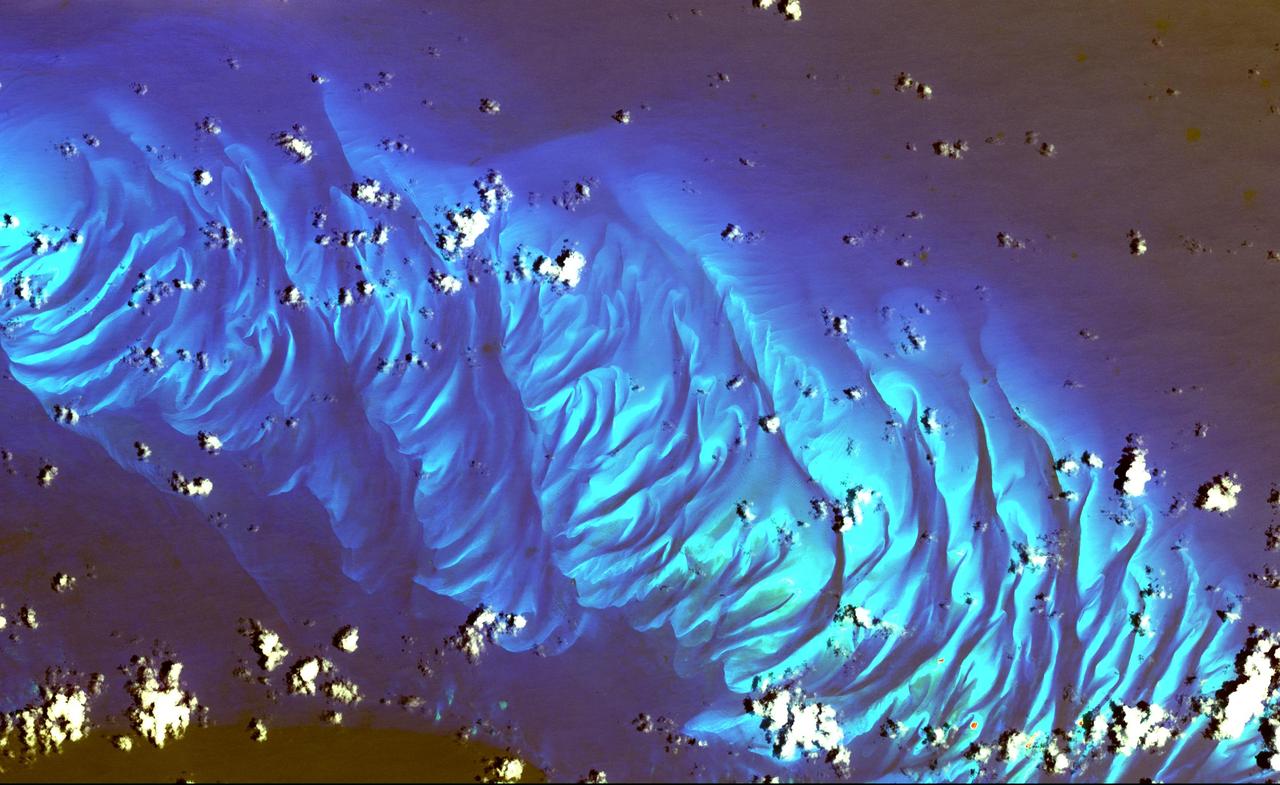
In this ASTER image the features that look like folded material are carbonate sand dunes in the shallow waters of Tarpum Bay, southwest of Eleuthera Island in the Bahamas. The sand making up the dunes comes from the erosion of limestone coral reefs, and has been shaped into dunes by ocean currents. This image was acquired on May 12, 2002 by the Advanced Spaceborne Thermal Emission and Reflection Radiometer (ASTER) on NASA's Terra satellite. With its 14 spectral bands from the visible to the thermal infrared wavelength region, and its high spatial resolution of 15 to 90 meters (about 50 to 300 feet), ASTER images Earth to map and monitor the changing surface of our planet. http://photojournal.jpl.nasa.gov/catalog/PIA03877
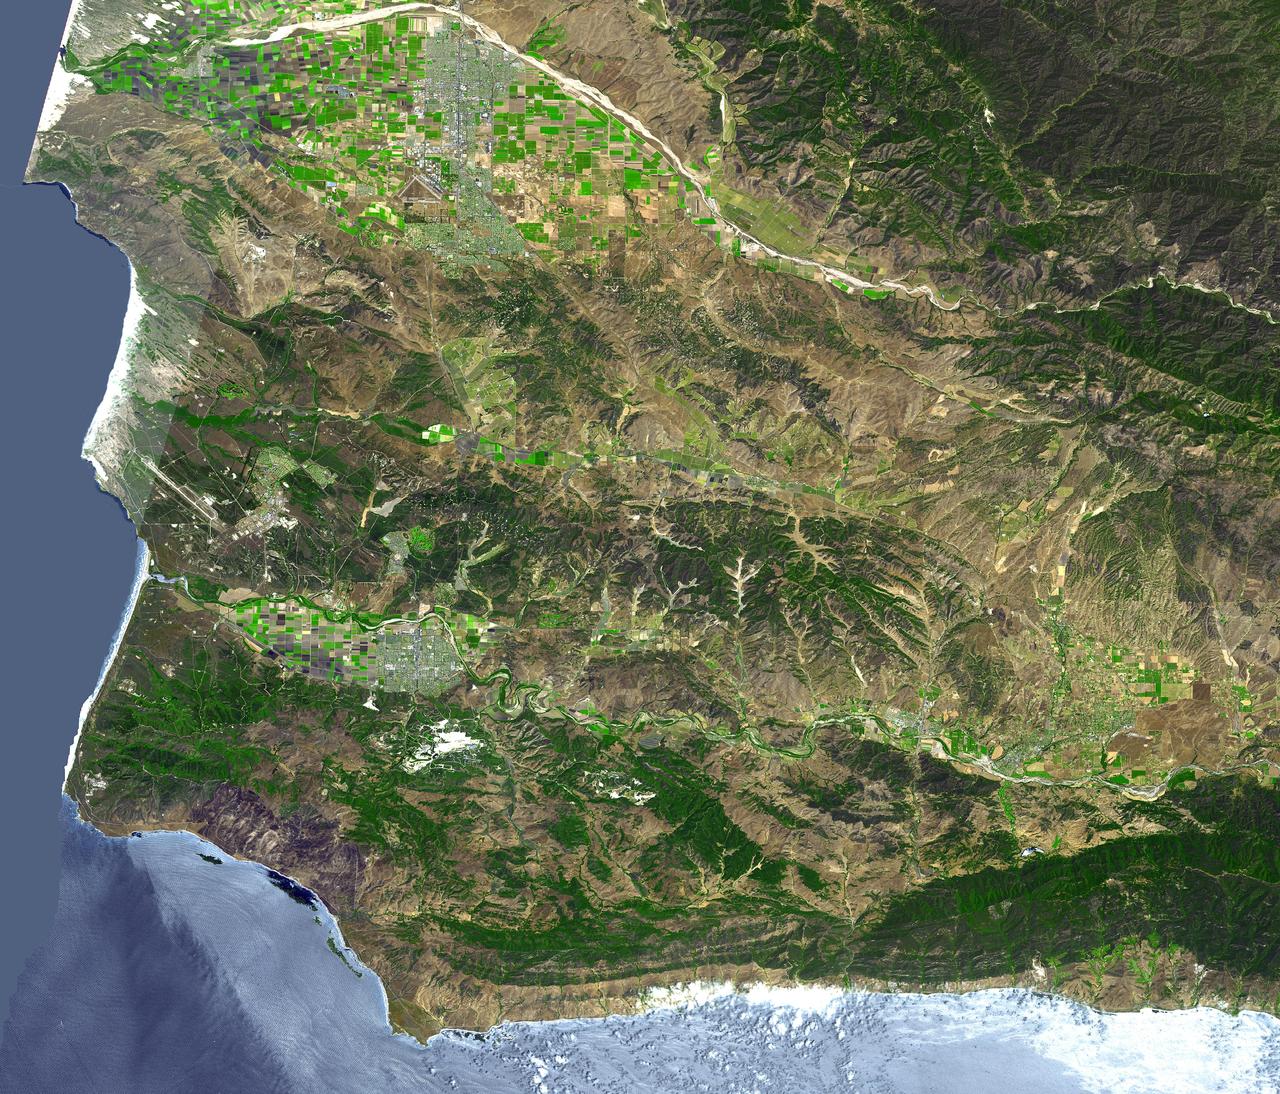
The area around Vandenberg Air Force Base, California is shown in this simulated natural color ASTER image. The city of Santa Maria is at the top left, and Lompoc is at the bottom left. Vandenberg includes the area along the coast and the prominent airport. This image was acquired on August 31, 2001 by the Advanced Spaceborne Thermal Emission and Reflection Radiometer (ASTER) on NASA's Terra satellite. With its 14 spectral bands from the visible to the thermal infrared wavelength region, and its high spatial resolution of 15 to 90 meters (about 50 to 300 feet), ASTER images Earth to map and monitor the changing surface of our planet. http://photojournal.jpl.nasa.gov/catalog/PIA03882
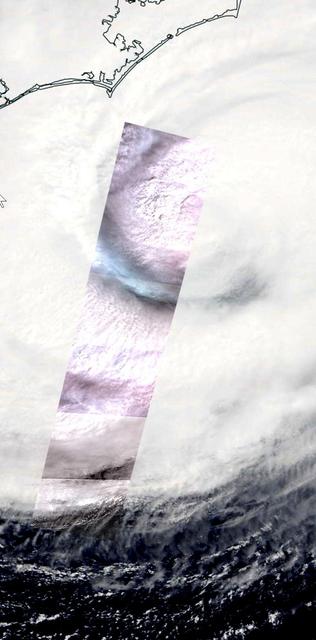
On Thursday, Sept. 13, 2018, the Advanced Spaceborne Thermal Emission and Reflection (ASTER) instrument onboard NASA's Terra spacecraft acquired this image swath over Hurricane Florence as the storm headed for the Eastern seaboard and the Carolinas. The image is a long strip of six individual ASTER scenes, taken in the visible wavelength region. The background is the simultaneously acquired MODIS visible image. The ASTER swath covers an area of 37 by 244 miles (60 by 360 kilometers) acquired at 11:48 am EDT, and is centered at 32.9 degrees north, 76.4 degrees west. https://photojournal.jpl.nasa.gov/catalog/PIA22651
The Espanola wildfire had consumed more than 4,300 acres when the Advanced Spaceborne Thermal Emission and Reflection Radiometer ASTER instrument aboard NASA Terra spacecraft acquired this image on June 16, 2011, over Flagler County, Fla.

In this ASTER image of Soufriere Hills Volcano on Montserrat in the Caribbean, continued eruptive activity is evident by the extensive smoke and ash plume streaming towards the west-southwest. Significant eruptive activity began in 1995, forcing the authorities to evacuate more than 7,000 of the island's original population of 11,000. The primary risk now is to the northern part of the island and to the airport. Small rockfalls and pyroclastic flows (ash, rock and hot gases) are common at this time due to continued growth of the dome at the volcano's summit. This image was acquired on October 29, 2002 by the Advanced Spaceborne Thermal Emission and Reflection Radiometer (ASTER) on NASA's Terra satellite. With its 14 spectral bands from the visible to the thermal infrared wavelength region, and its high spatial resolution of 15 to 90 meters (about 50 to 300 feet), ASTER images Earth to map and monitor the changing surface of our planet. http://photojournal.jpl.nasa.gov/catalog/PIA03880
Thirteen years after devastating forest fires burned over 1.6 million acres in Yellowstone National Park, the scars are still evident. In this simulated natural color ASTER image, burned areas appear gray, in contrast to the dark green of unburned forests. The image covers an area of 60 x 63 km. This image was acquired on July 2, 2001 by the Advanced Spaceborne Thermal Emission and Reflection Radiometer (ASTER) on NASA's Terra satellite. With its 14 spectral bands from the visible to the thermal infrared wavelength region, and its high spatial resolution of 15 to 90 meters (about 50 to 300 feet), ASTER images Earth to map and monitor the changing surface of our planet. http://photojournal.jpl.nasa.gov/catalog/PIA03875
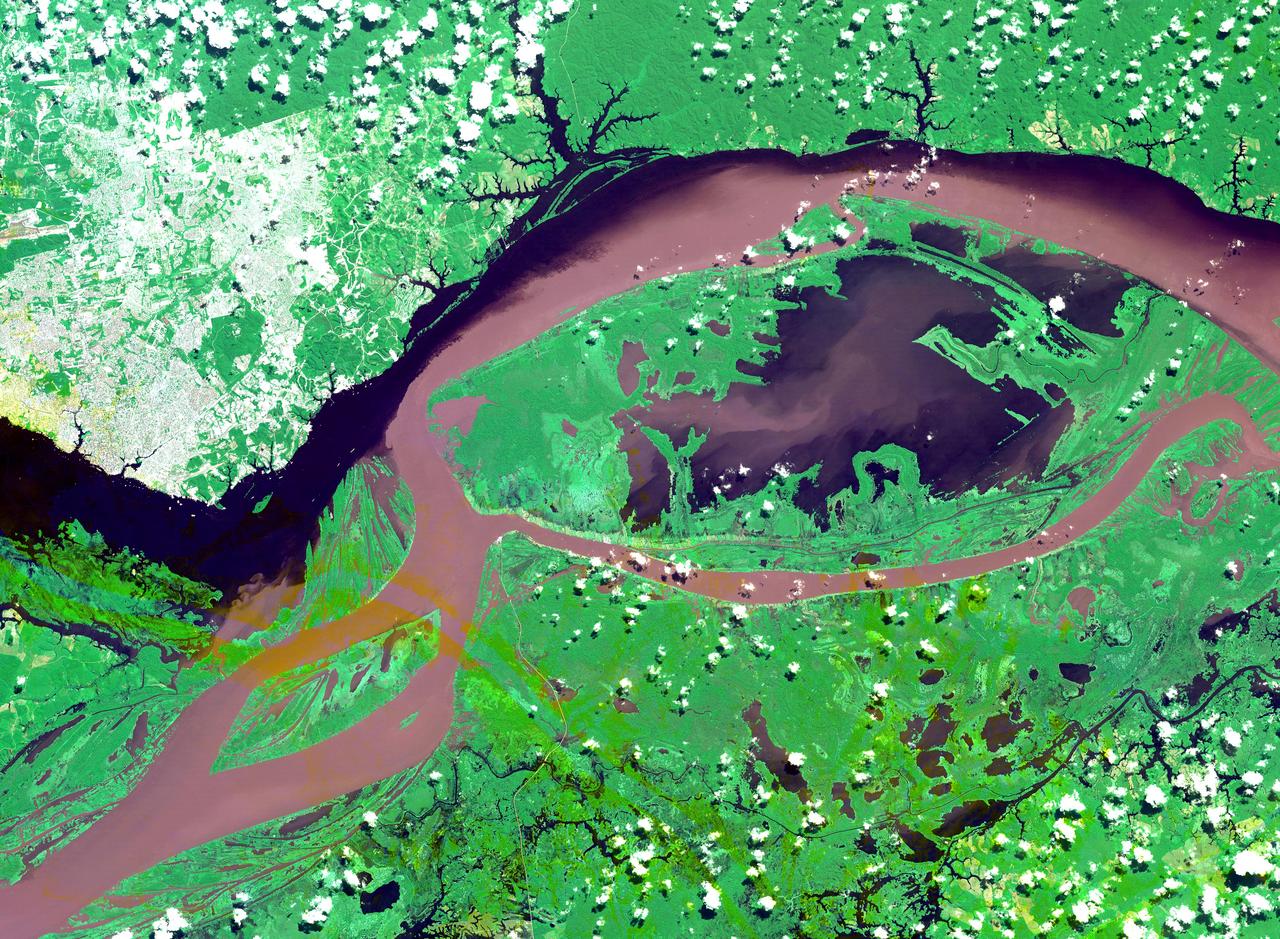
The junctions of the Amazon and the Rio Negro Rivers at Manaus, Brazil. The Rio Negro flows 2300 km from Columbia, and is the dark current forming the north side of the river. It gets its color from the high tannin content in the water. The Amazon is sediment laden, appearing brown in this simulated natural color image. Manaus is the capital of Amazonas state, and has a population in excess of one million. The ASTER image covers an area of 60 x 45 km. This image was acquired on July 16, 2000 by the Advanced Spaceborne Thermal Emission and Reflection Radiometer (ASTER) on NASA's Terra satellite. With its 14 spectral bands from the visible to the thermal infrared wavelength region, and its high spatial resolution of 15 to 90 meters (about 50 to 300 feet), ASTER will image Earth for the next 6 years to map and monitor the changing surface of our planet. http://photojournal.jpl.nasa.gov/catalog/PIA03851
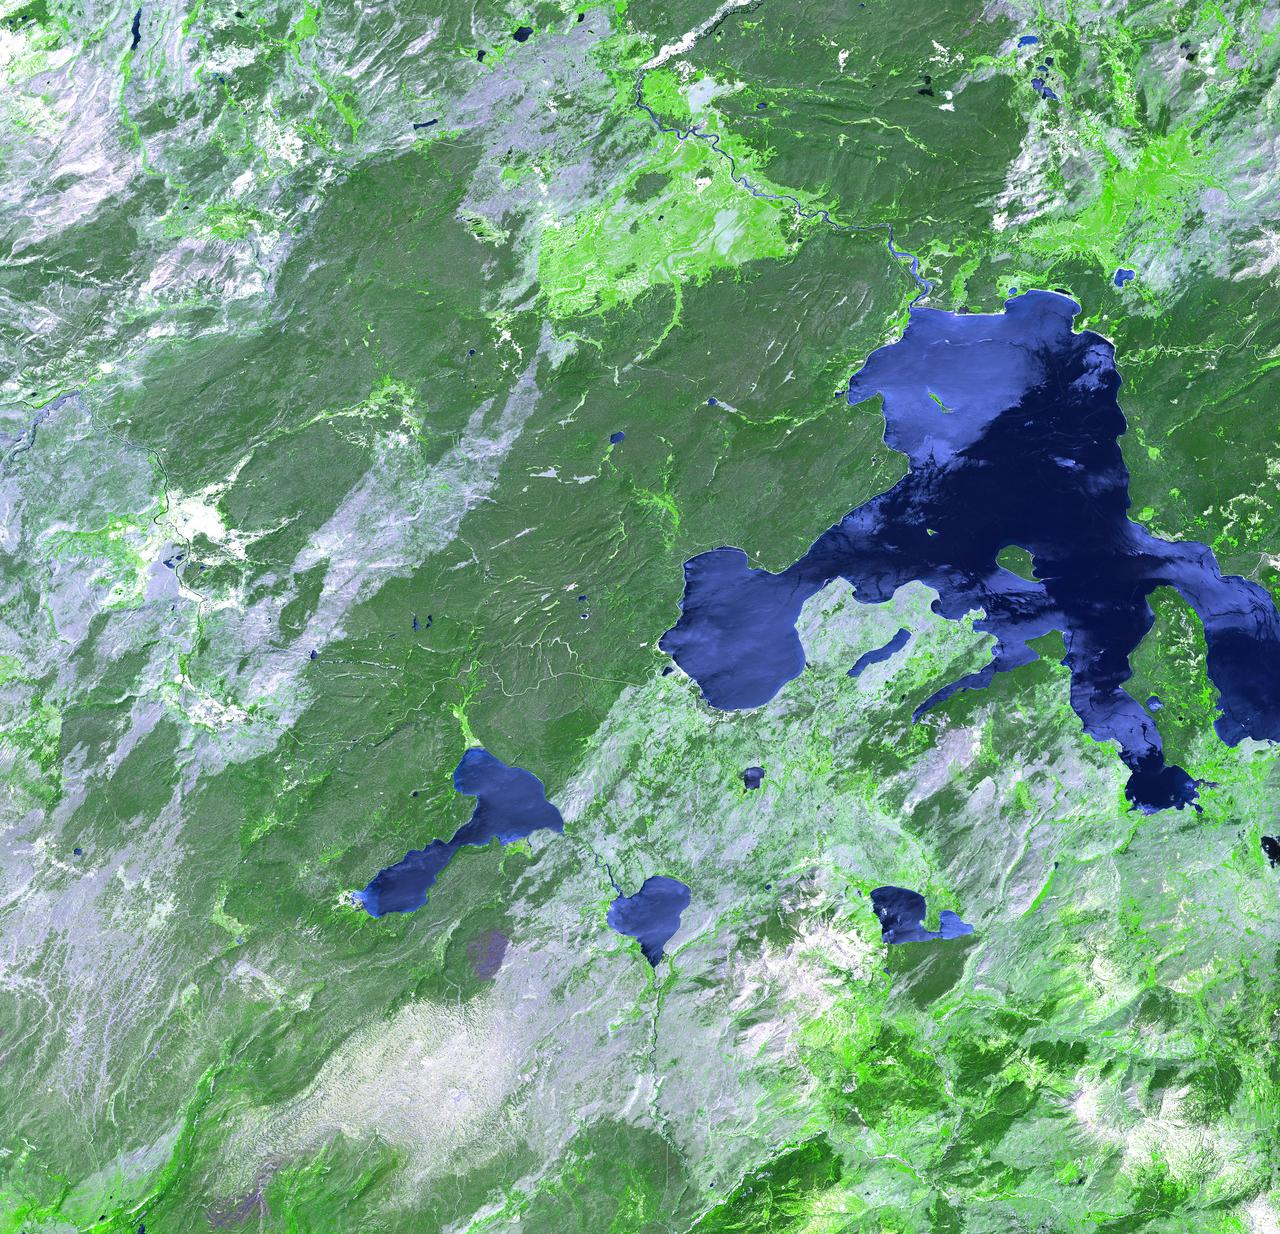
On March 26, New York Mayor Michael Bloomberg declared a drought emergency for the city and four upstate counties in response to the worst drought to hit the eastern United States in nearly 70 years. Restrictions on water use will affect more than 8 million residents of New York. The city's reservoirs, located in the Catskill Mountains, are at 52 percent capacity. One of these, Ashokan Reservoir, is seen in this pair of ASTER images acquired on September 18, 2000 and February 3, 2002. These images were acquired by the Advanced Spaceborne Thermal Emission and Reflection Radiometer (ASTER) on NASA's Terra satellite. With its 14spectral bands from the visible to the thermal infrared wavelength region, and its high spatial resolution of 15 to 90 meters (about 50 to 300 feet), ASTER will image Earth for the next 6 years to map and monitor the changing surface of our planet. http://photojournal.jpl.nasa.gov/catalog/PIA03491
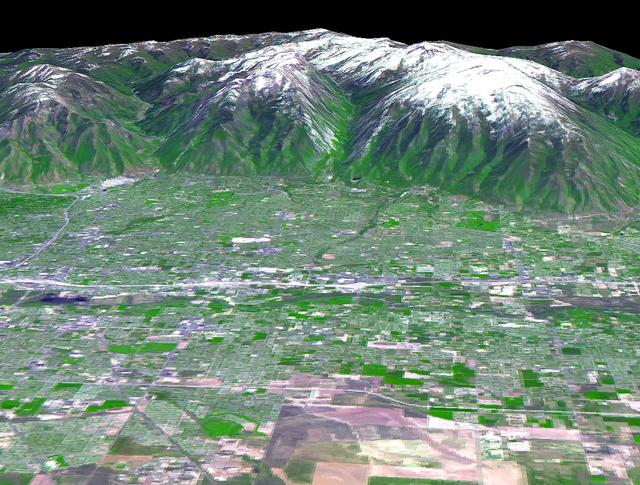
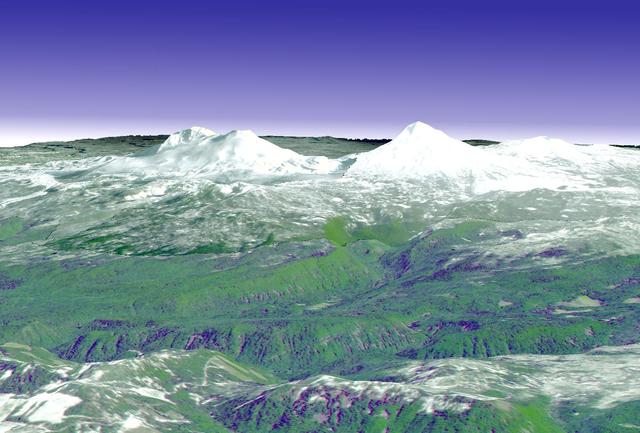
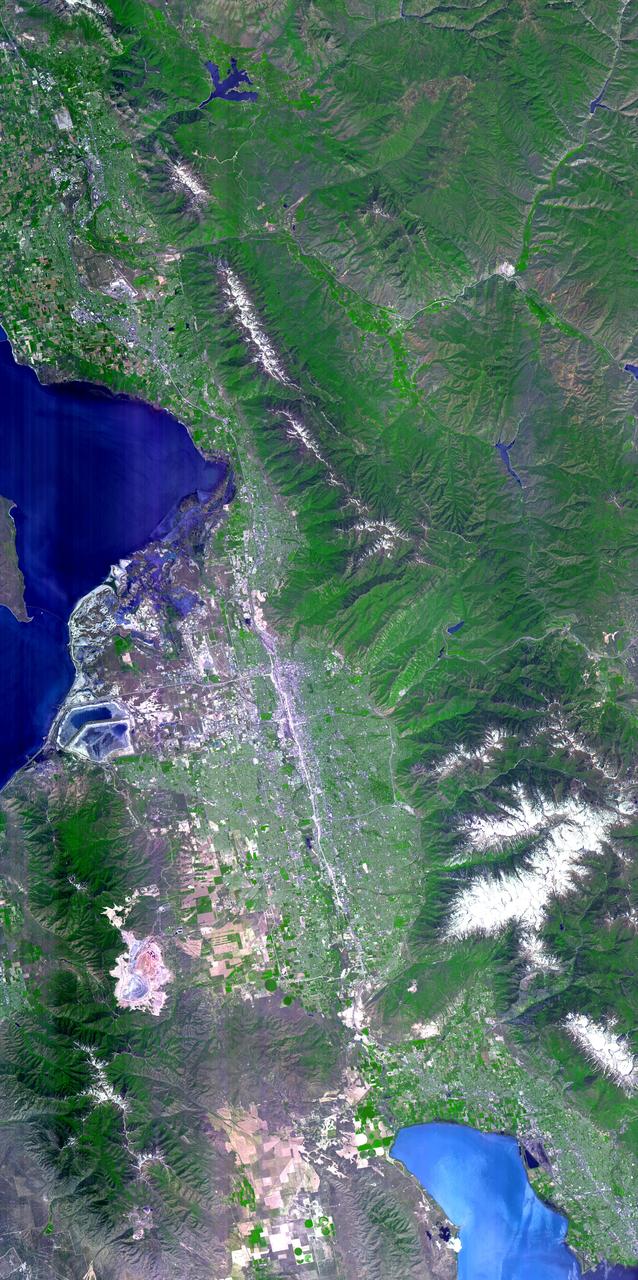
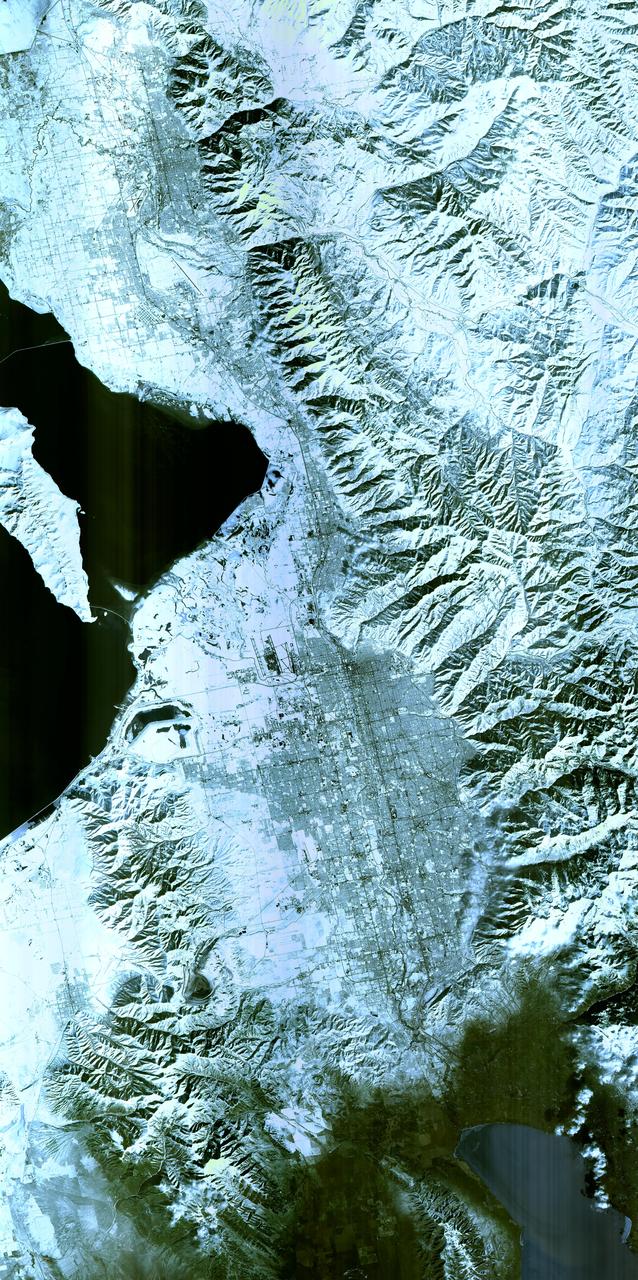
The 2002 Winter Olympics are hosted by Salt Lake City at several venues within the city, in nearby cities, and within the adjacent Wasatch Mountains. This 3-D perspective view, in simulated natural colors, presents a late spring view over Salt Lake City towards the snow-capped Wasatch Mountains to the east. The image was created by draping ASTER image data over digital topography data from the US Geological Survey's National Elevation Data. This image was acquired on May 28, 2000 by the Advanced Spaceborne Thermal Emission and Reflection Radiometer (ASTER) on NASA's Terra satellite. With its 14 spectral bands from the visible to the thermal infrared wavelength region, and its high spatial resolution of 15 to 90 meters (about 50 to 300 feet), ASTER will image Earth for the next 6 years to map and monitor the changing surface of our planet. http://photojournal.jpl.nasa.gov/catalog/PIA03466
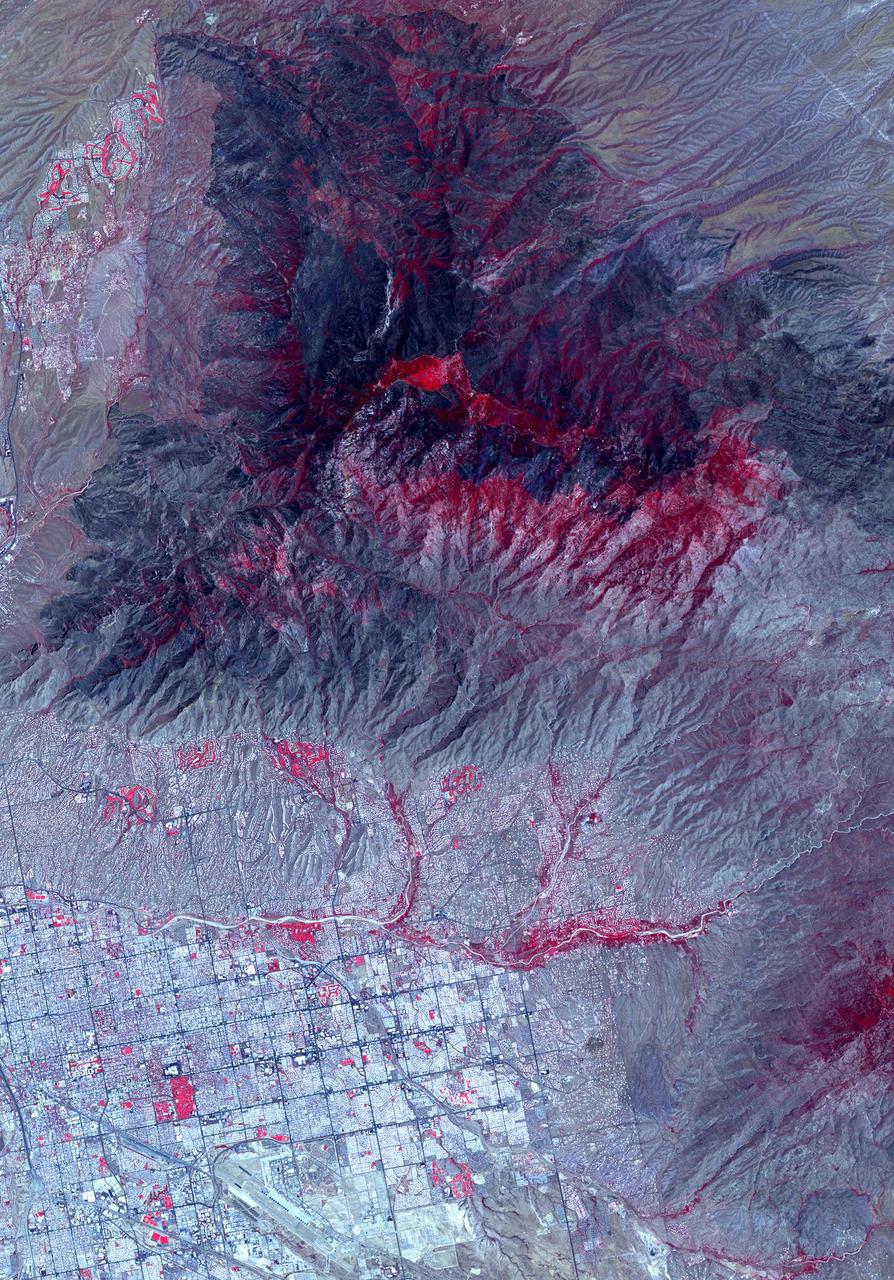
NASA's Advanced Spaceborne Thermal Emission and Reflection Radiometer (ASTER) instrument imaged areas burned by the Bighorn Fire north of Tucson, Arizona, on June 29. In the image, vegetation is shown in red and burned areas are shown in dark gray. It covers an area of 20 by 30 miles (33 by 48 kilometers). https://photojournal.jpl.nasa.gov/catalog/PIA23691
Volcanic activity resumed near the town of Grindavik, Iceland on January 14. A fissure eruption began several kilometers southwest of the 2023 fissure eruptions. This time, several houses were engulfed by lava. When this nighttime thermal image was captured by ASTER on January 24, the eruption had stopped. The background image is an earlier ASTER daytime scene acquired on August 15, 2022. The images cover an area of 17.8 by 30.2 km, and are located at 63.9 degrees north, 22 degrees west. https://photojournal.jpl.nasa.gov/catalog/PIA26283
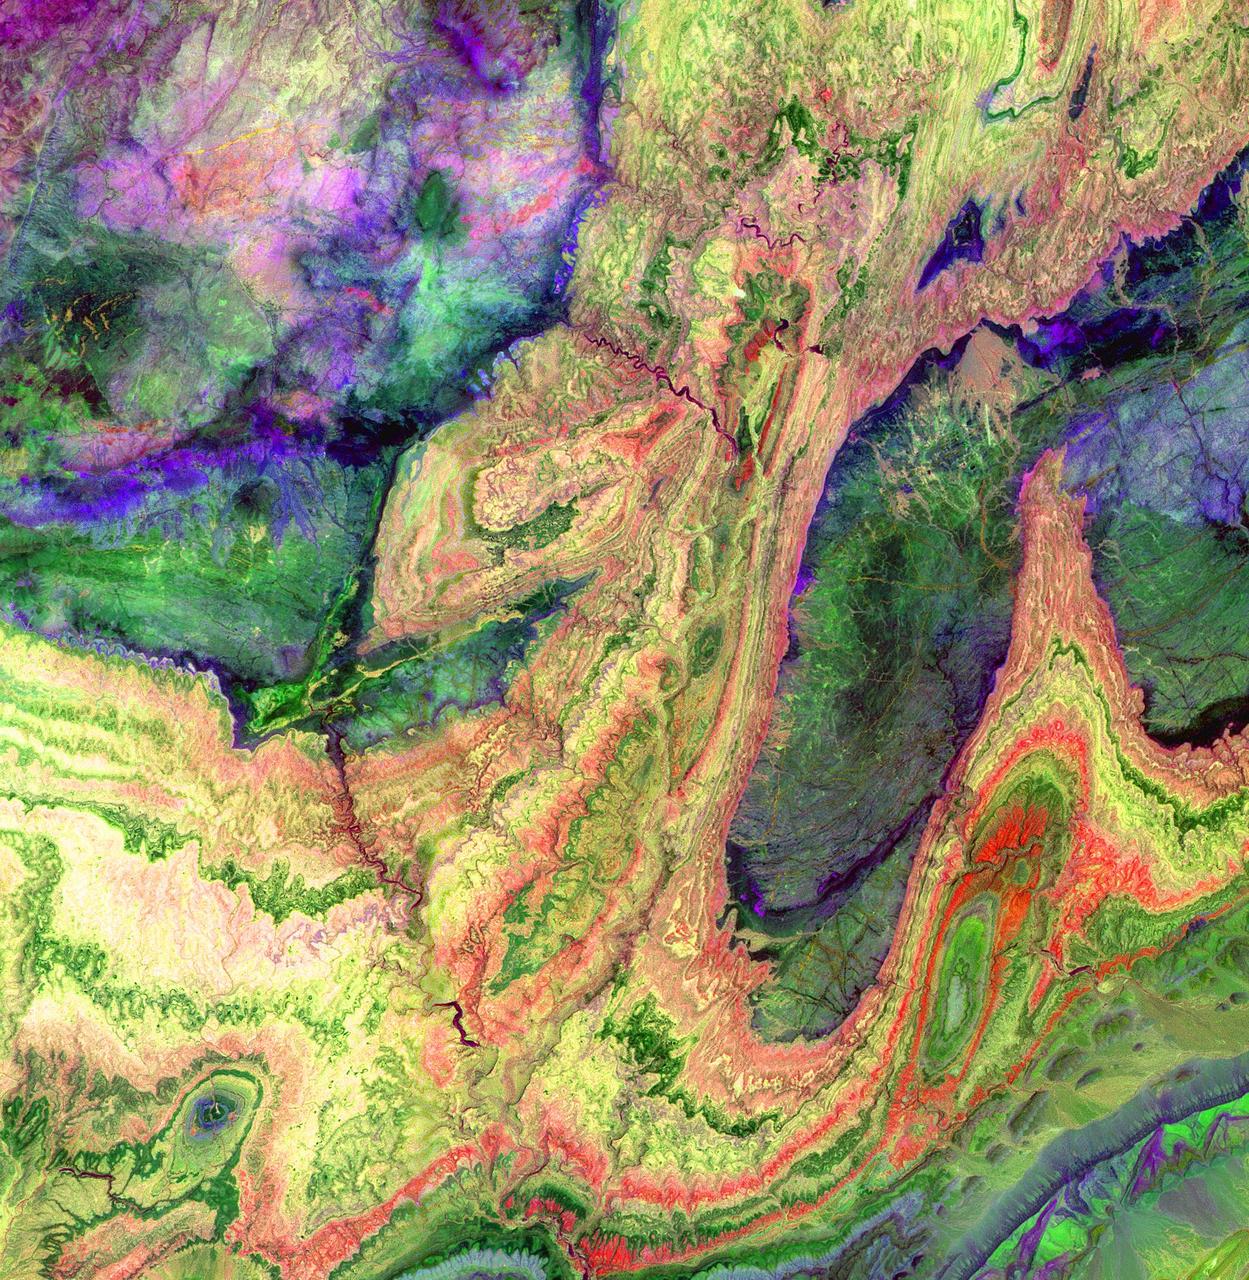
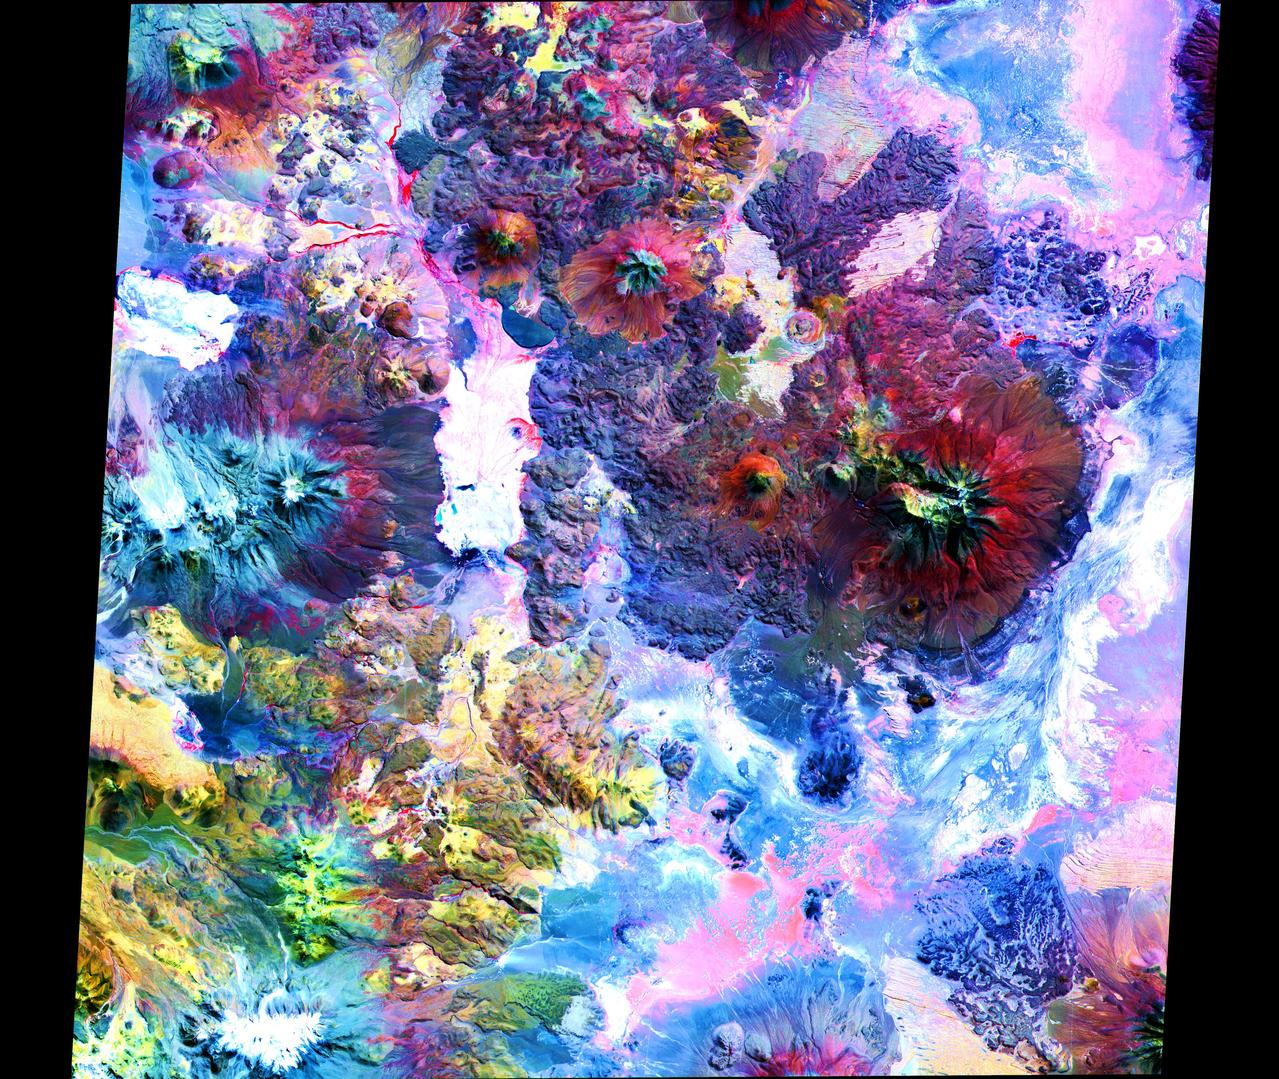
The Anti-Atlas Mountains of Morocco formed as a result of the collision of the African and Eurasian tectonic plates about 80 million years ago. This collision destroyed the Tethys Ocean; the limestone, sandstone, claystone, and gypsum layers that formed the ocean bed were folded and crumpled to create the Atlas and Anti-Atlas Mountains. In this ASTER image, short wavelength infrared bands are combined to dramatically highlight the different rock types, and illustrate the complex folding. The yellowish, orange and green areas are limestones, sandstones and gypsum; the dark blue and green areas are underlying granitic rocks. The ability to map geology using ASTER data is enhanced by the multiple short wavelength infrared bands, that are sensitive to differences in rock mineralogy. This image was acquired on June 13, 2001 by the Advanced Spaceborne Thermal Emission and Reflection Radiometer (ASTER) on NASA's Terra satellite. With its 14 spectral bands from the visible to the thermal infrared wavelength region, and its high spatial resolution of 15 to 90 meters (about 50 to 300 feet), ASTER images Earth to map and monitor the changing surface of our planet. http://photojournal.jpl.nasa.gov/catalog/PIA03893
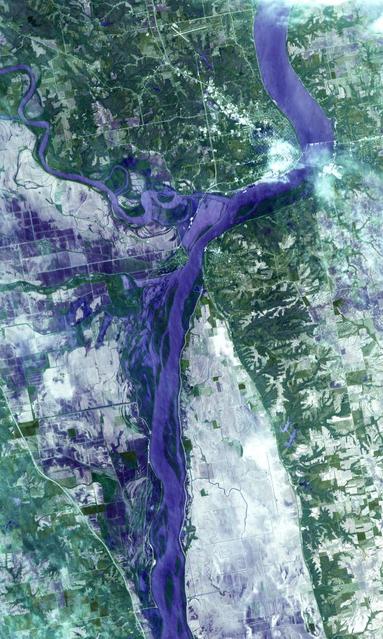
NASA Terra spacecraft acquired this image on April 30, 2011, showing flooding along the Mississippi River at its junction with the Des Moines River near Keokuk, Iowa.
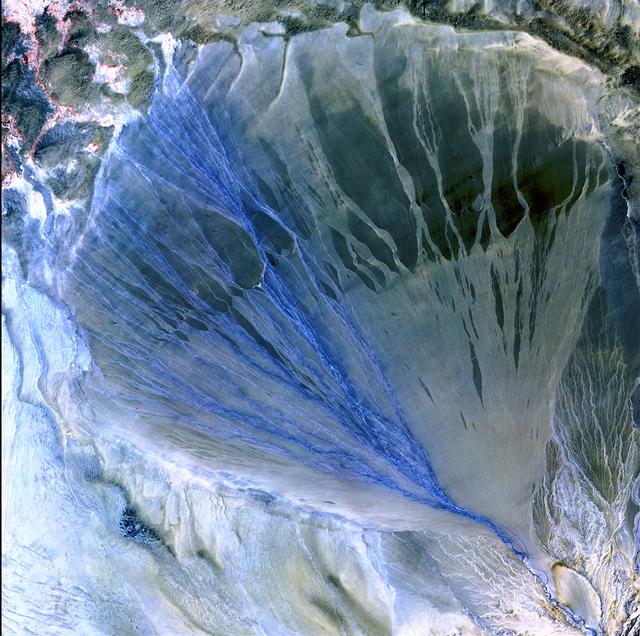
Image taken 5/2/2002 by ASTER: A vast alluvial fan blossoms across the desolate landscape between the Kunlun and Altun mountain ranges that form the southern border of the Taklimakan Desert in China's XinJiang Province. This image can be found on ASTER Path 143 Row 34, center: 37.43 N, 84.30 E. To learn more about the Landsat satellite go to: <a href="http://landsat.gsfc.nasa.gov/" rel="nofollow">landsat.gsfc.nasa.gov/</a>
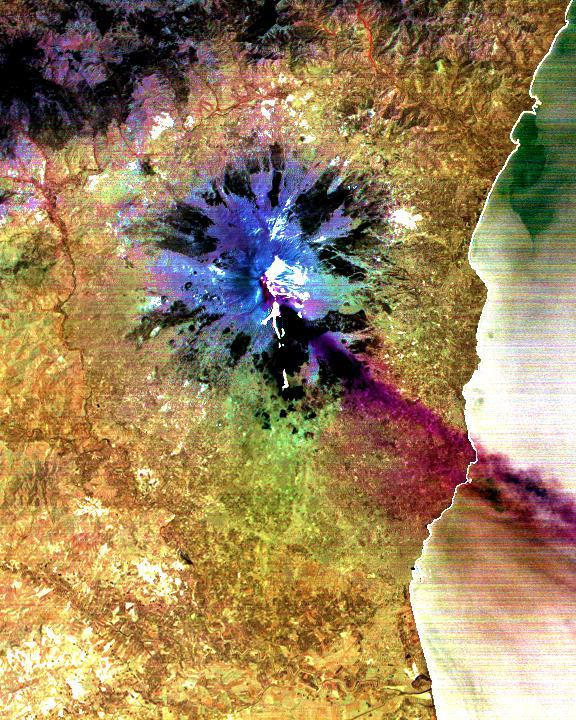
The current eruption of Mt. Etna started on July 17, and has continued to the present. This ASTER image was acquired on Sunday, July 29 and shows the sulfur dioxide plume (in purple) originating form the summit, drifting over the city of Catania, and continuing over the Ionian Sea. ASTER's unique combination of multiple thermal infrared channels and high spatial resolution allows the determination of the thickness and position of the SO2 plume. The image covers an area of 24 x 30 km. The image is centered at 37.7 degrees north latitude, 15 degrees east longitude. http://photojournal.jpl.nasa.gov/catalog/PIA02678
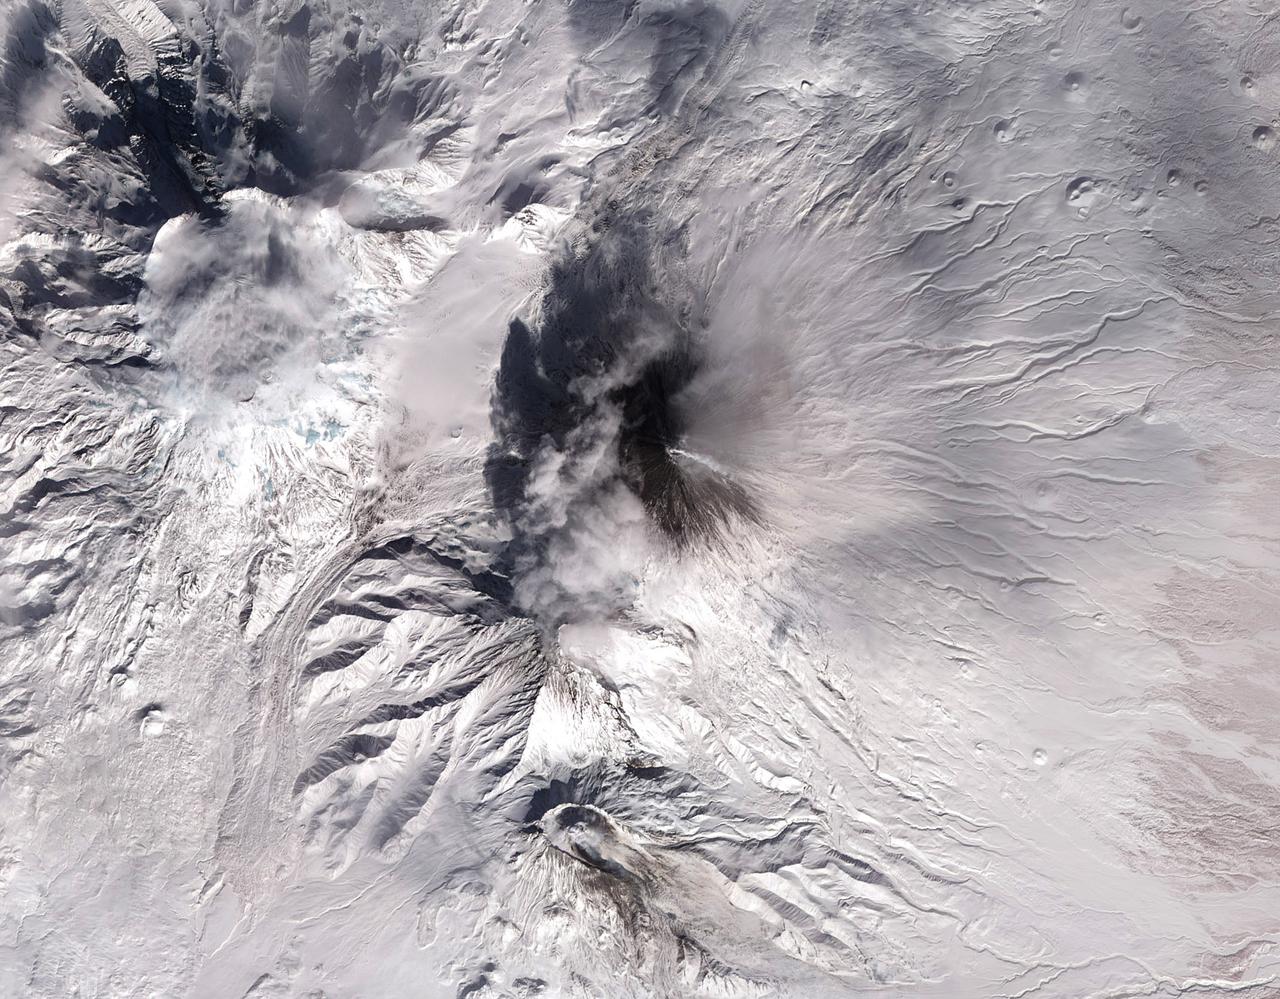
Shiveluch volcano on Russia’s Kamchatka Peninsula. This is a false-color satellite image, acquired by the Advanced Spaceborne Thermal Emission and Reflection Radiometer (ASTER) on March 10, 2010. To download a full high res version of this image and to learn more go to: <a href="http://earthobservatory.nasa.gov/NaturalHazards/view.php?id=43103" rel="nofollow">earthobservatory.nasa.gov/NaturalHazards/view.php?id=43103</a> Credit: NASA Earth Observatory image by Jesse Allen and Robert Simmon, based on data from the NASA/GSFC/METI/ERSDAC/JAROS, and U.S./Japan ASTER Science Team. Instrument: Terra - ASTER For more information about the Goddard Space Flight Center go here: <a href="http://www.nasa.gov/centers/goddard/home/index.html" rel="nofollow">www.nasa.gov/centers/goddard/home/index.html</a>

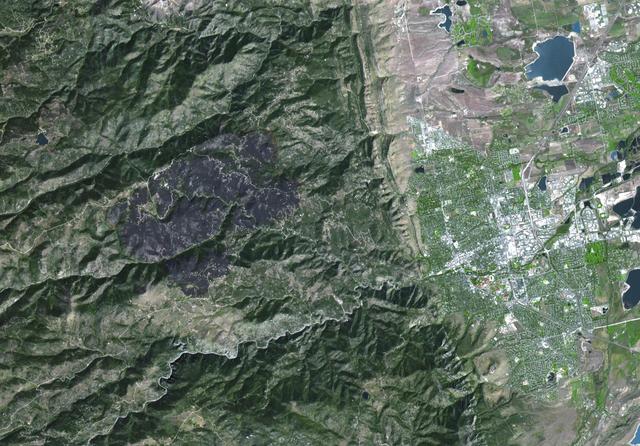
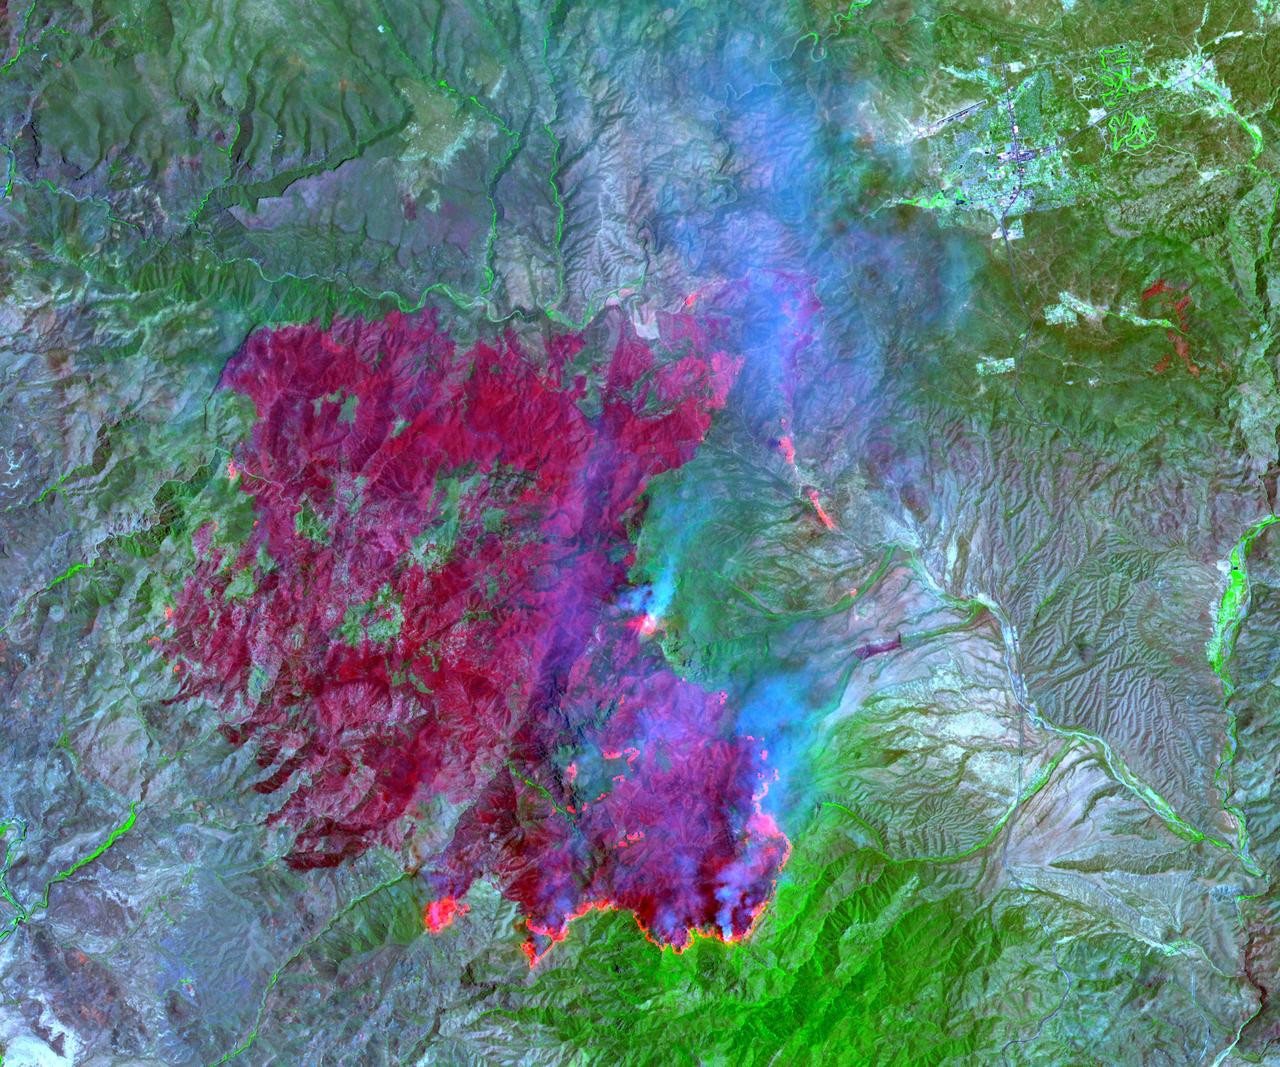
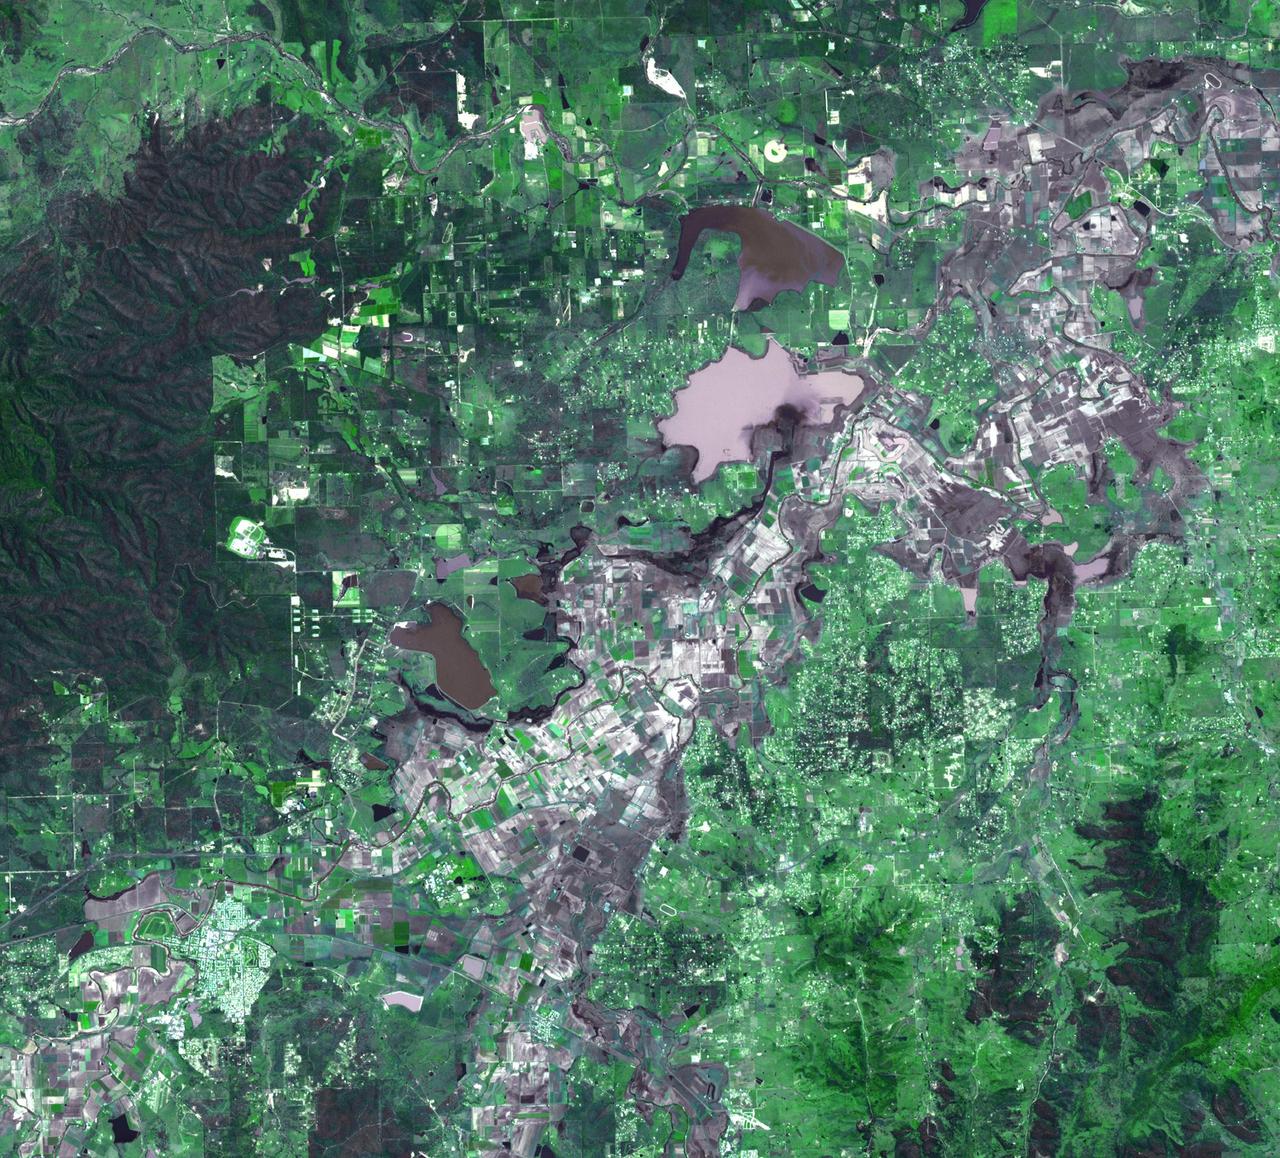
As firefighters continue to work toward full containment of the rash of wildfires burning in Northern California, a new image from the Advanced Spaceborne Thermal Emission and Reflection Radiometer (ASTER) instrument on NASA's Terra satellite shows the growing fire scar on the landscape. In this ASTER image, acquired Oct. 21, 2017, vegetation is red, while burned areas appear dark gray. The image covers an area of 38 by 39 miles (60.5 by 63 kilometers) and is located near 38.5 degrees north, 122.4 degrees west. https://photojournal.jpl.nasa.gov/catalog/PIA22049
Hawaii's Kilauea volcano continues to create new land as flows from fissure 8, one of the most active to break ground since the eruption began in early May, reach the ocean. The Advanced Spaceborne Thermal Emission and Reflection (ASTER) radiometer instrument on NASA's Terra satellite detected the lava flow of fissure 8 -- which extends from Leilani Estates to the Pacific Ocean -- on July 25. In the image, vegetation is displayed in red, clouds are white and the hot lava flows, detected by ASTER's thermal infrared channels, are overlaid in yellow. The image covers an area of 9.5 by 11.5 miles (15.3 by 18.6 kilometers). https://photojournal.jpl.nasa.gov/catalog/PIA22489
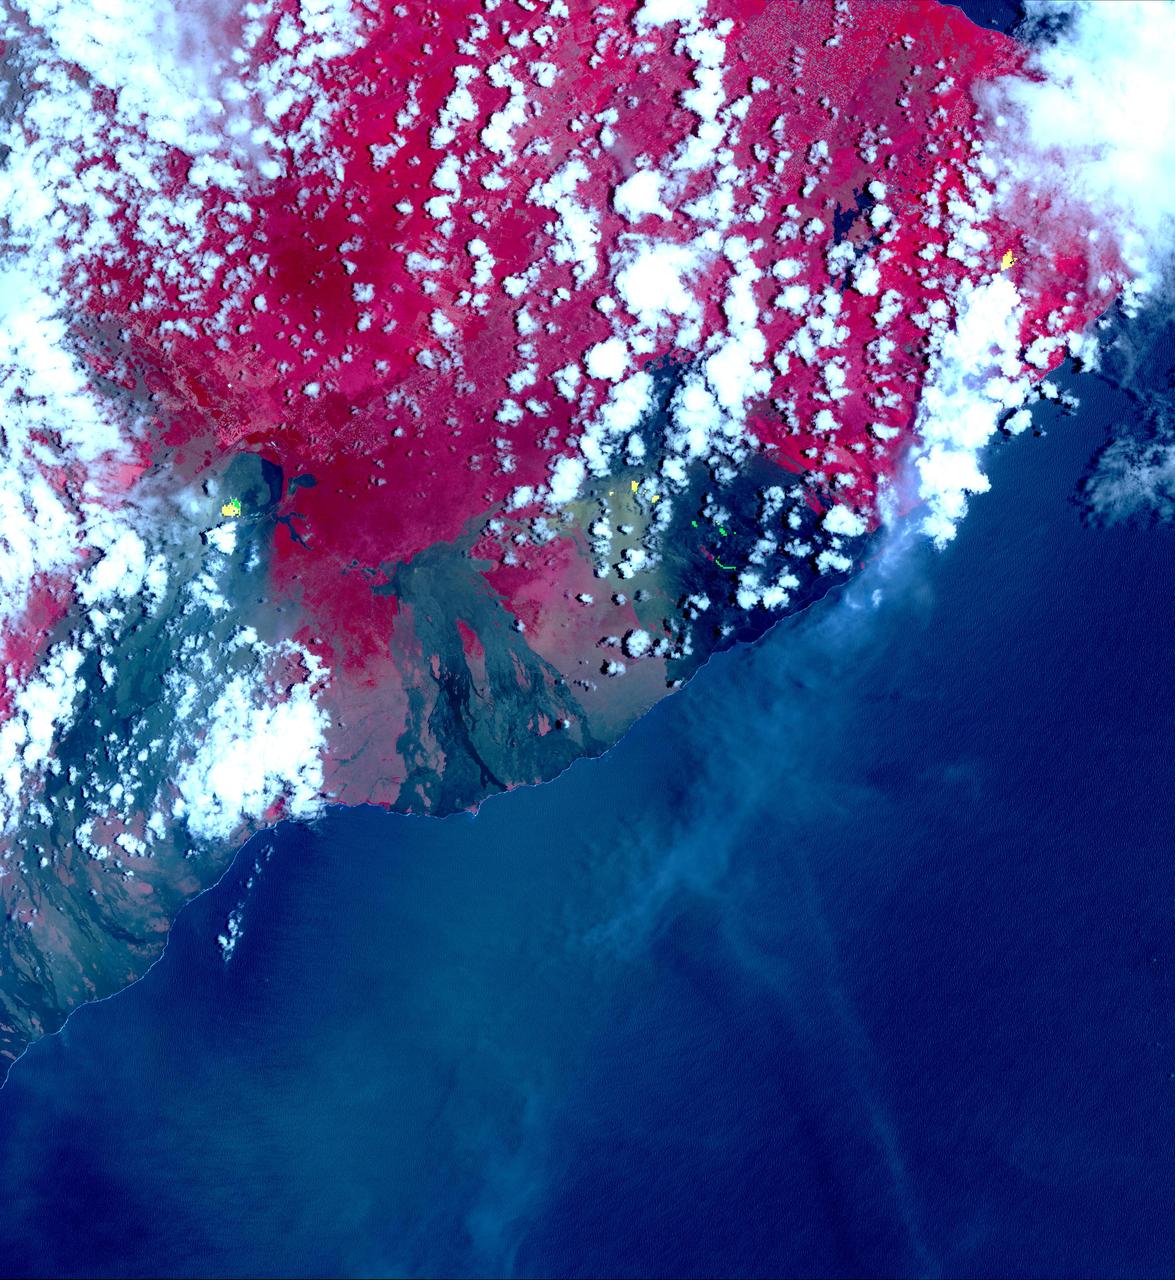
This image from NASA's Advanced Spaceborne Thermal Emission and Reflection Radiometer (ASTER) instrument on NASA's Terra spacecraft show recent eruptions of Kilauea volcano on the island of Hawaii (the Big Island). Following days of increased seismic activity, Kilauea erupted May 3, 2018, and triggered a number of additional fissure eruptions along the East Rift Zone. The eruptions and high level of sulfur dioxide gas (SO2) prompted evacuations in the area, including the Leilani Estates subdivision near the town of Pahoa. The ASTER images, acquired on May 6, 2018, show different aspects of the eruption. A color composite depicts vegetation in red, and old lava flows in black and gray. Superimposed on the image in yellow are hotspots detected on the thermal infrared bands. The easternmost hot spots show the newly formed fissures and the lava flow spilling to the northwest. The middle spots are Pu'u O'o crater, and lava flows descending the slopes to the southeast. The westernmost area is the crater and lava lake on Kilauea's summit. The greenish area southwest of Pu'u O'o is ash deposits from its short eruption on Friday. The inset shows the massive sulfur dioxide plume is shown in yellow and yellow-green, extracted from ASTER's multiple thermal bands. A smaller, but thicker, sulfur dioxide gas plume can be seen coming from Kilauea. The prevailing trade winds blow the plumes to the southwest, out over the ocean. The images cover an area of 57.8 by 63 kilometers, and are located at 19.3 degrees North, 155.1 degrees West. https://photojournal.jpl.nasa.gov/catalog/PIA22450
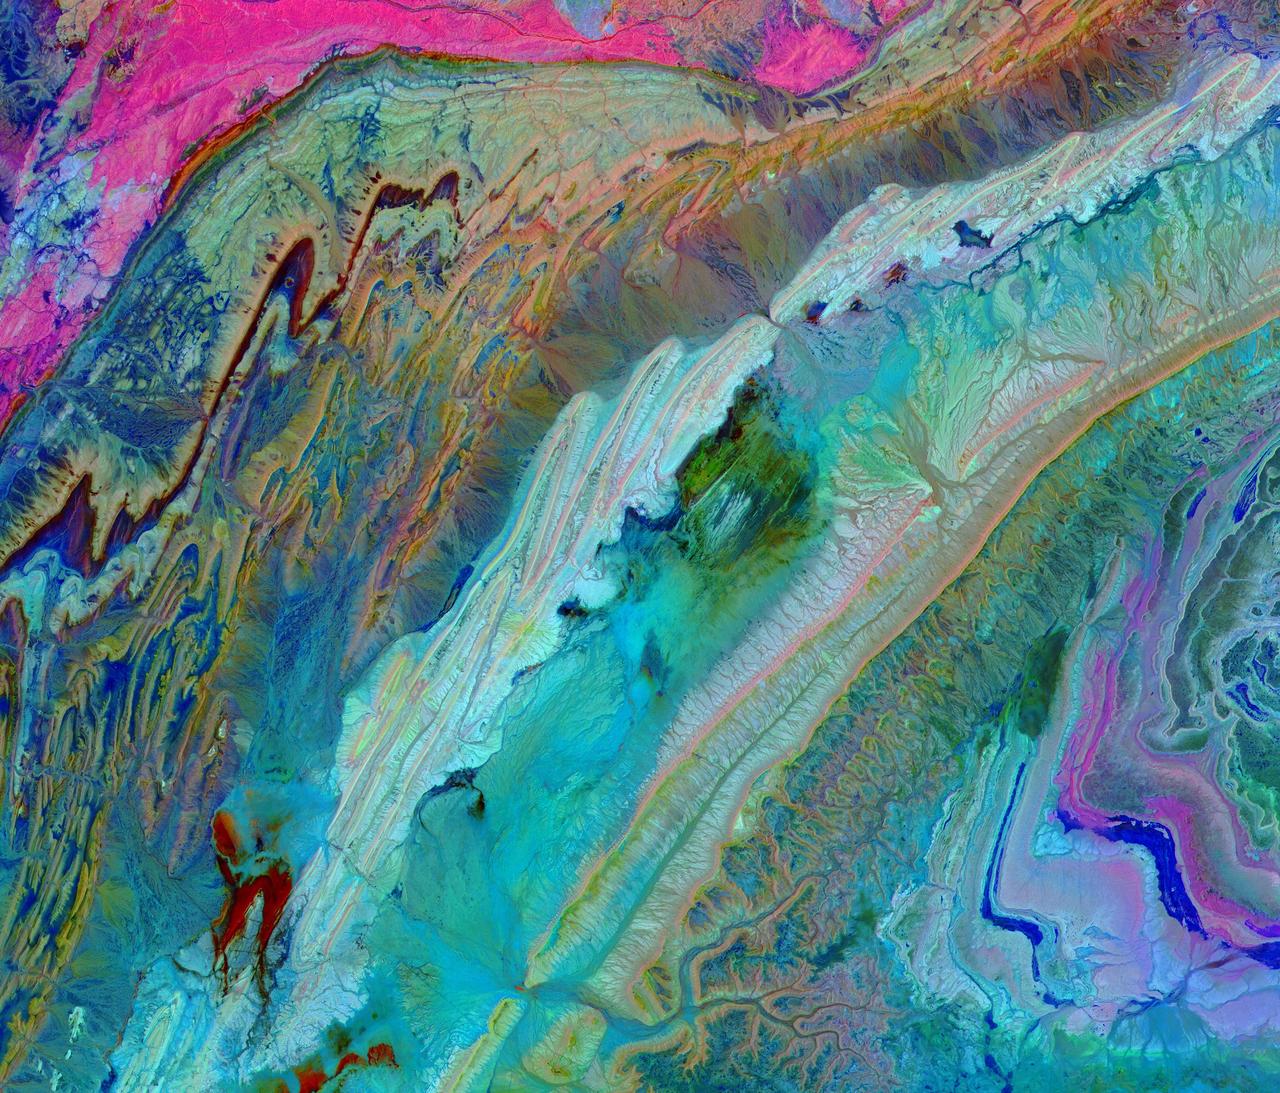
The Anti-Atlas Mountains of Morocco formed as a result of the collision of the African and Eurasian tectonic plates about 80 million years ago. This collision destroyed the Tethys Ocean; the limestone, sandstone, claystone, and gypsum layers that formed the ocean bed were folded and crumpled to create the Anti-Atlas Mountains. In this ASTER image of southwest Morocco, visible, near infrared, and short wavelength infrared bands are combined to dramatically highlight the different rock types, and illustrate the complex folding. The ability to map geology using ASTER data is enhanced by bands that are sensitive to differences in rock mineralogy. The image was acquired on November 5, 2007, covers an area of 51.9 by 60.8 km, and is located at 28.1 degrees north and 10.7 degrees west. With its 14 spectral bands from the visible to the thermal infrared wavelength region and its high spatial resolution of about 50 to 300 feet (15 to 90 meters), ASTER images Earth to map and monitor the changing surface of our planet. ASTER is one of five Earth-observing instruments launched Dec. 18, 1999, on Terra. The instrument was built by Japan's Ministry of Economy, Trade and Industry. A joint U.S./Japan science team is responsible for validation and calibration of the instrument and data products. The broad spectral coverage and high spectral resolution of ASTER provides scientists in numerous disciplines with critical information for surface mapping and monitoring of dynamic conditions and temporal change. Example applications are monitoring glacial advances and retreats; monitoring potentially active volcanoes; identifying crop stress; determining cloud morphology and physical properties; wetlands evaluation; thermal pollution monitoring; coral reef degradation; surface temperature mapping of soils and geology; and measuring surface heat balance. https://photojournal.jpl.nasa.gov/catalog/PIA23533
The ground near one of the long-dormant Three Sisters volcanoes in the Cascade Mountains of west-central Oregon has risen approximately 10centimeters in a 10-by-20-km parcel since 1996, meaning that magma or underground lava is slowly flowing into the area, according to a research team from the U.S. Geological Survey. The Three Sisters area -- which contains five volcanoes -- is only about 170 miles from Mount St. Helens, which erupted in 1980. Both are part of the Cascades Range, a line of 27volcanoes stretching from British Columbia in Canada to northern California. This perspective view was created by draping a simulated natural color ASTER image over digital topography from the U.S. Geological Survey National Elevation Dataset. This image was acquired on May 28, 2000 by the Advanced Spaceborne Thermal Emission and Reflection Radiometer (ASTER) on NASA's Terra satellite. With its 14 spectral bands from the visible to the thermal infrared wavelength region, and its high spatial resolution of 15 to 90 meters (about 50 to 300 feet), ASTER will image Earth for the next 6 years to map and monitor the changing surface of our planet. http://photojournal.jpl.nasa.gov/catalog/PIA03492
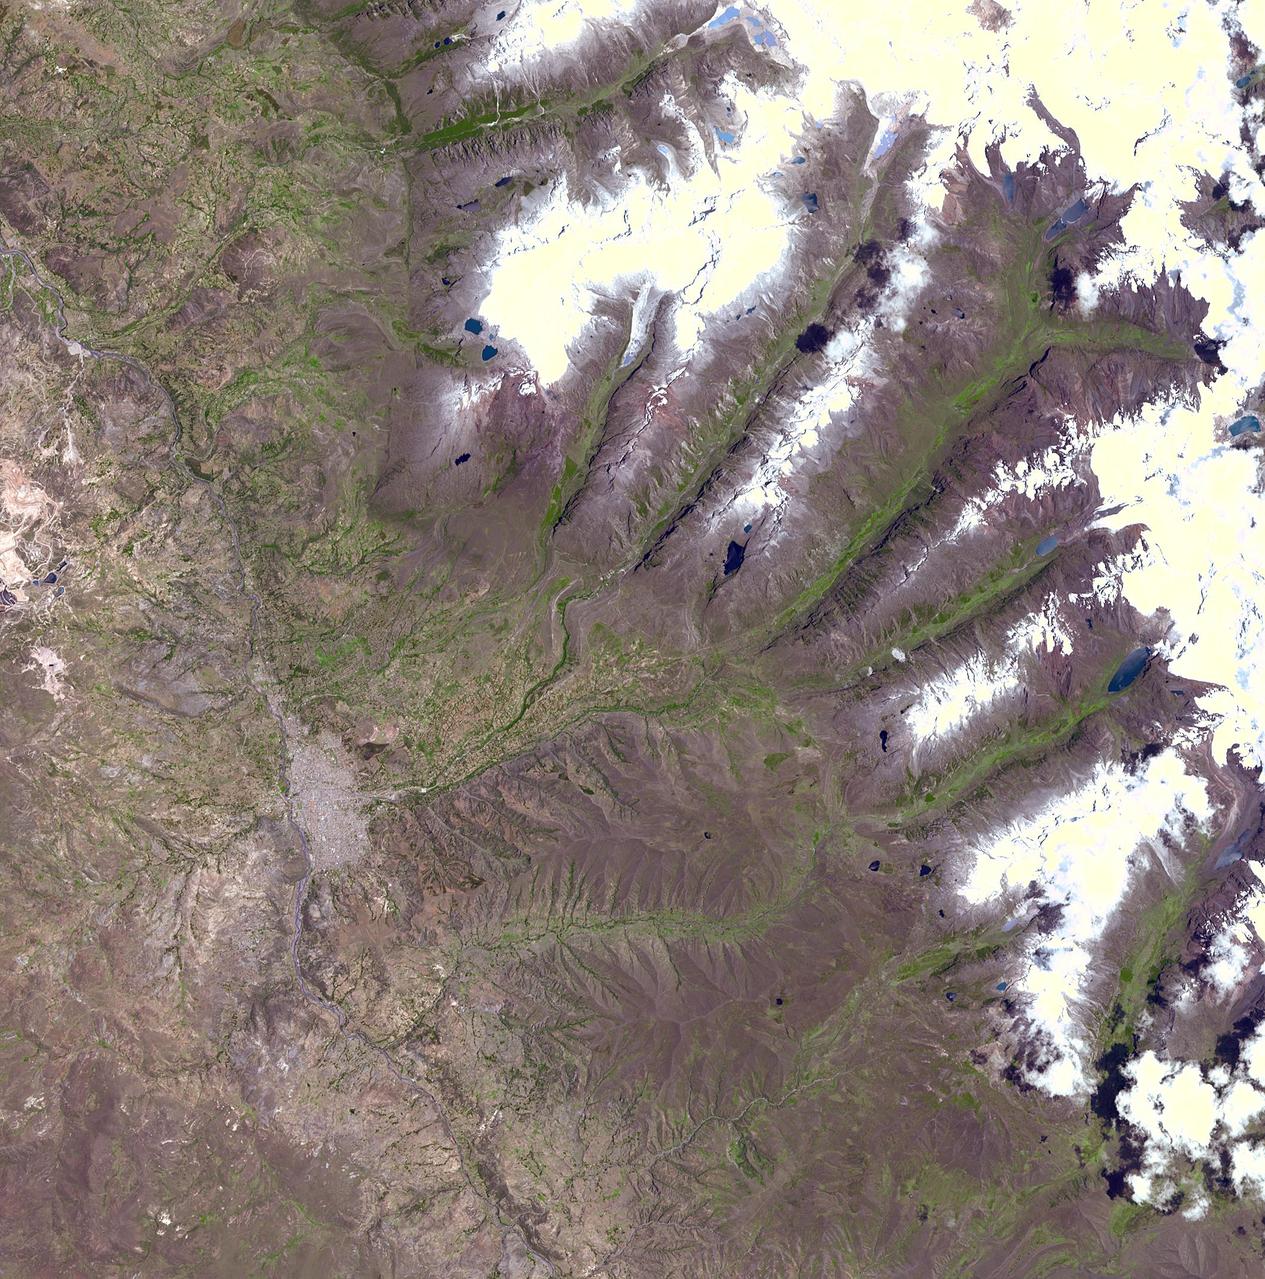
A chunk of glacier was threatening to fall into an Andean lake and cause major flooding in a Peruvian city of 60,000. A fissure has appeared in the glacier that feeds the Lake Palcacocha near the city of Huaraz, 270 km north of Lima. If the piece breaks off, ensuing floods would take 15 minutes to reach the city. In 1941, the lake overflowed and caused massive destruction, killing 7,000 people. The city can be seen in the left-center part of the image. Lake Palcacocha is in the upper right corner of the image at the head of a valley, below the snow and glacier cap. The ASTER instrument is being tasked to obtain current images of the glacier to help monitor the situation. This image was acquired on November 5, 2001 by the Advanced Spaceborne Thermal Emission and Reflection Radiometer (ASTER) on NASA's Terra satellite. With its 14 spectral bands from the visible to the thermal infrared wavelength region, and its high spatial resolution of 15 to 90 meters (about 50 to 300 feet), ASTER images Earth to map and monitor the changing surface of our planet. http://photojournal.jpl.nasa.gov/catalog/PIA03898
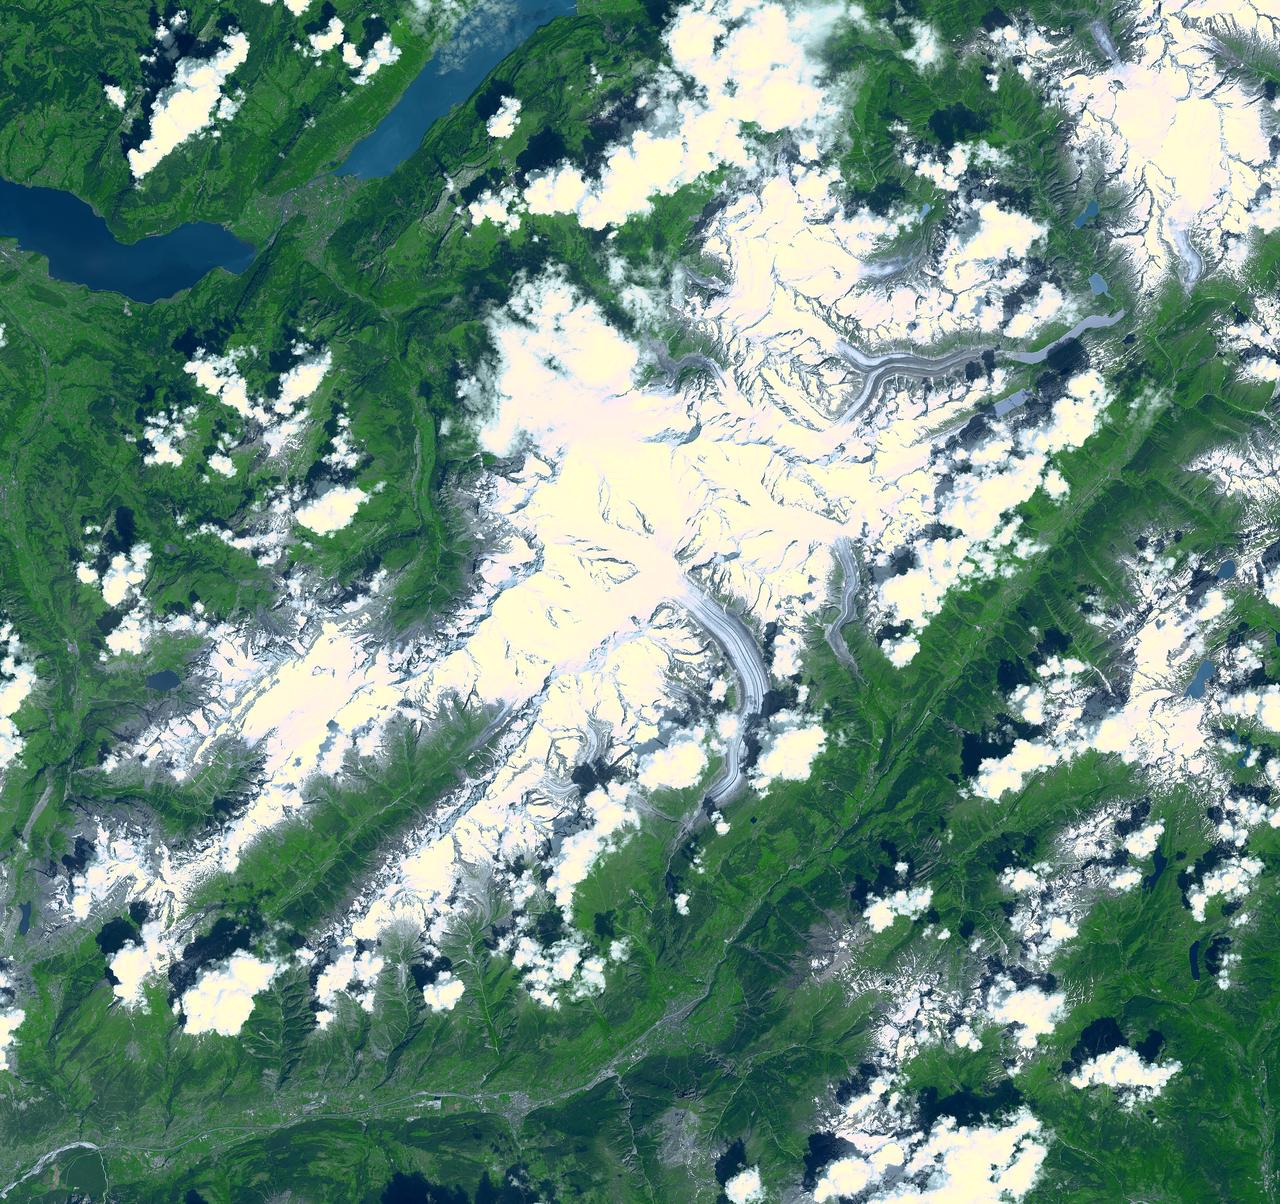
Aletsch Glacier, the largest glacier of Europe, covers more than 120 square kilometers (more than 45 square miles) in southern Switzerland. At its eastern extremity lies a glacierlake, Mdrjelensee (2,350 meters/7,711 feet above sea level). To the west rises Aletschhorn (4,195 meters/13,763 feet), which was first climbed in 1859. The Rhone River flows along the southern flank of the mountains. This image was acquired on July 23, 2001 by the Advanced Spaceborne Thermal Emission and Reflection Radiometer (ASTER) on NASA's Terra satellite. With its 14 spectral bands from the visible to the thermal infrared wavelength region, and its high spatial resolution of 15 to 90 meters (about 50 to 300 feet), ASTER will image Earth for the next 6 years to map and monitor the changing surface of our planet. ASTER is one of five Earth-observing instruments launched December 18, 1999, on NASA's Terra satellite. The instrument was built by Japan's Ministry of Economy, Trade and Industry. A joint U.S./Japan science team is responsible for validation and calibration of the instrument and the data products. http://photojournal.jpl.nasa.gov/catalog/PIA03857
This thermal infrared image from NASA Terra spacecraft of Merapi continuing eruption has been processed to reveal the dominant presence of volcanic ash in the eruption plume and clouds, displayed in dark red. The warm volcanic flow appears bright.

NASA Terra spacecraft captured this image of the wildfire near Palmdale, Calif. on August 1, 2010 called the Crown fire. The burned areas appear in shades of gray in this simulated natural color image.
NASA Terra spacecraft shows Popocatepetl, the nearly 18.000-foot-high volcano about 40 miles southeast of Mexico City, continuing to spew water vapor, gas, ashes and glowing rocks from its latest eruption, which started in mid-April 2012.
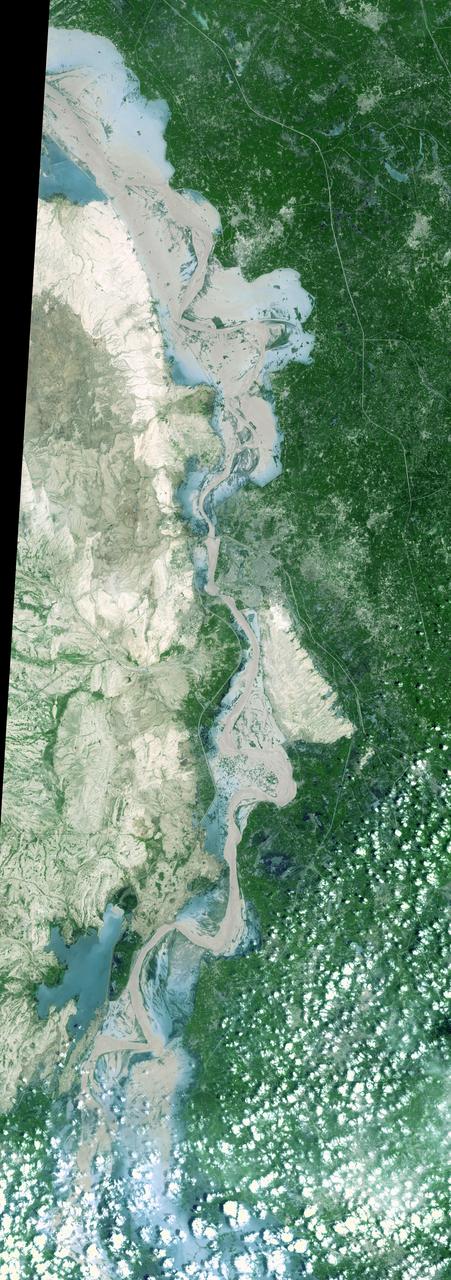
On Sept. 3, 2010, when NASA Terra spacecraft captured this image strip over the Indus River in Pakistan, severe flooding was still causing a major humanitarian crisis in Pakistan. The city of Hyderabad is near the middle of the image.
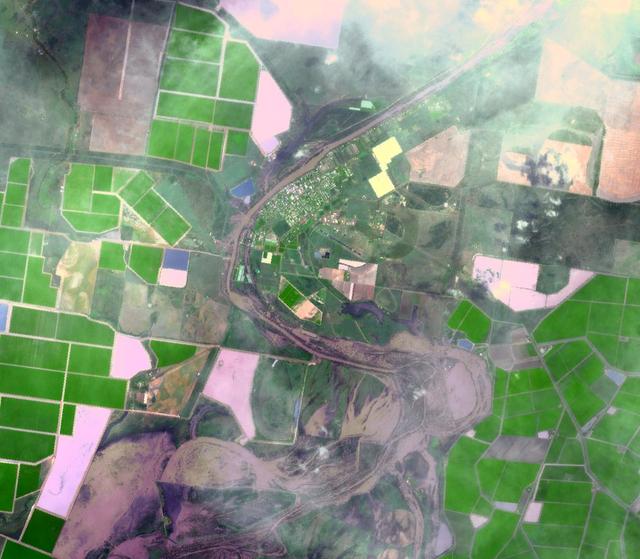
On Jan. 14, 2011, NASA Terra spacecraft captured this image of the inundated city of St. George, Queensland, Australia. Torrential rains in northeastern Australia caused the Balonne River to overflow its banks and flood much of the city.
This image, acquired by NASA Terra spacecraft on May 1, 2011, shows more than 314,000 acres burned in west Texas. The 2011 fire season in Texas is of historic proportions.
NASA Terra spacecraft captured this pair of images of Iceland Eyjafyallajökull volcano on May 3, 2010. On this day, Ireland closed its airspace for several hours due to presence of ash over the country.
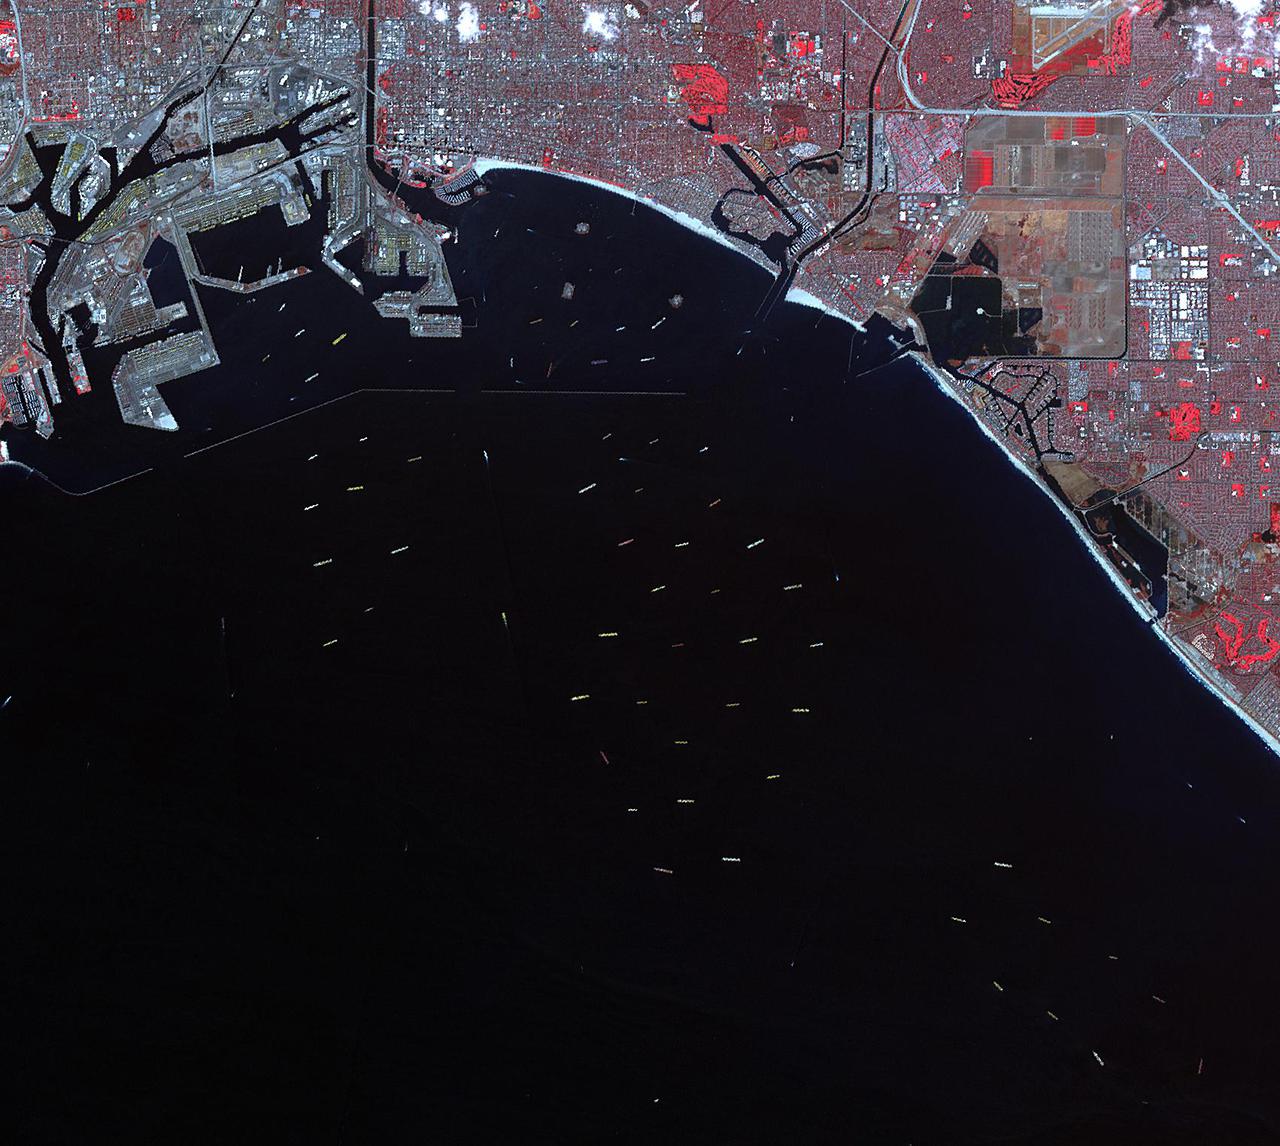
On Oct. 10, 2021, NASA's Advanced Spaceborne Thermal Emission and Reflection Radiometer (ASTER) instrument captured an image of over 70 ships waiting to dock and unload at the ports of Los Angeles and Long Beach, due to a supply-chain crunch. The image covers an area of 14 by 16 miles (23 by 25 kilometers). https://photojournal.jpl.nasa.gov/catalog/PIA24902
This 10.5 by 11 km sub-area in northern Chile was acquired by ASTER on April 7, 2000. Dramatically displayed is a geological angular unconformity: a contact between layers of rock at different angles. On the right side of the image, Cretaceous sediments were tilted upward to an angle of about 50 degrees, then eroded. On this surface volcanic pyroclastic deposits were deposited as a flat sheet. The section of rocks has been eroding from the east, exposing the tilted and flat rock layers. The image is located at 24.8 degrees south latitude and 69.1 degrees west longitude. http://photojournal.jpl.nasa.gov/catalog/PIA11159
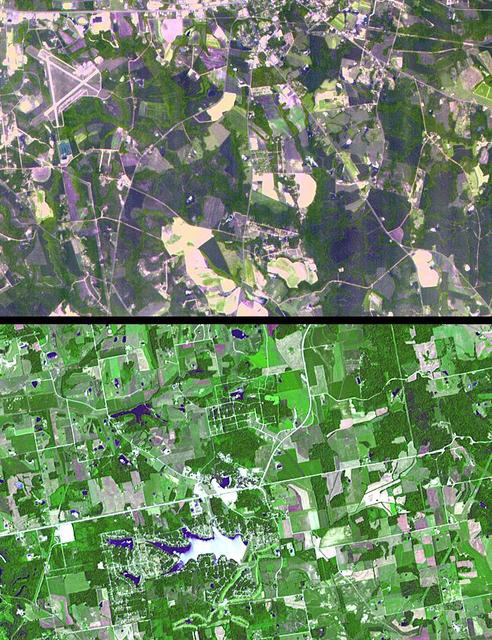
The towns of Santa Claus, Ga., (top) and Santa Claus, Ind. (bottom), are shown in these two images from the Advanced Spaceborne Thermal Emission and Reflection Radiometer (ASTER) instrument on NASA's Terra satellite. They are the only two Santa Claus towns in the United States with post offices and zip codes, although there are 11 towns with this name in the United States. Santa Claus, Ga. is located in Toombs County, and has a population of 237. Santa Claus, Ind. is located in Spencer County, and has a population of 2,041. Its name was accepted by the United States Postal Service in 1856. The images were acquired on July 3, 2000 (top) and June 16, 2001 (bottom), respectively. http://photojournal.jpl.nasa.gov/catalog/PIA03891
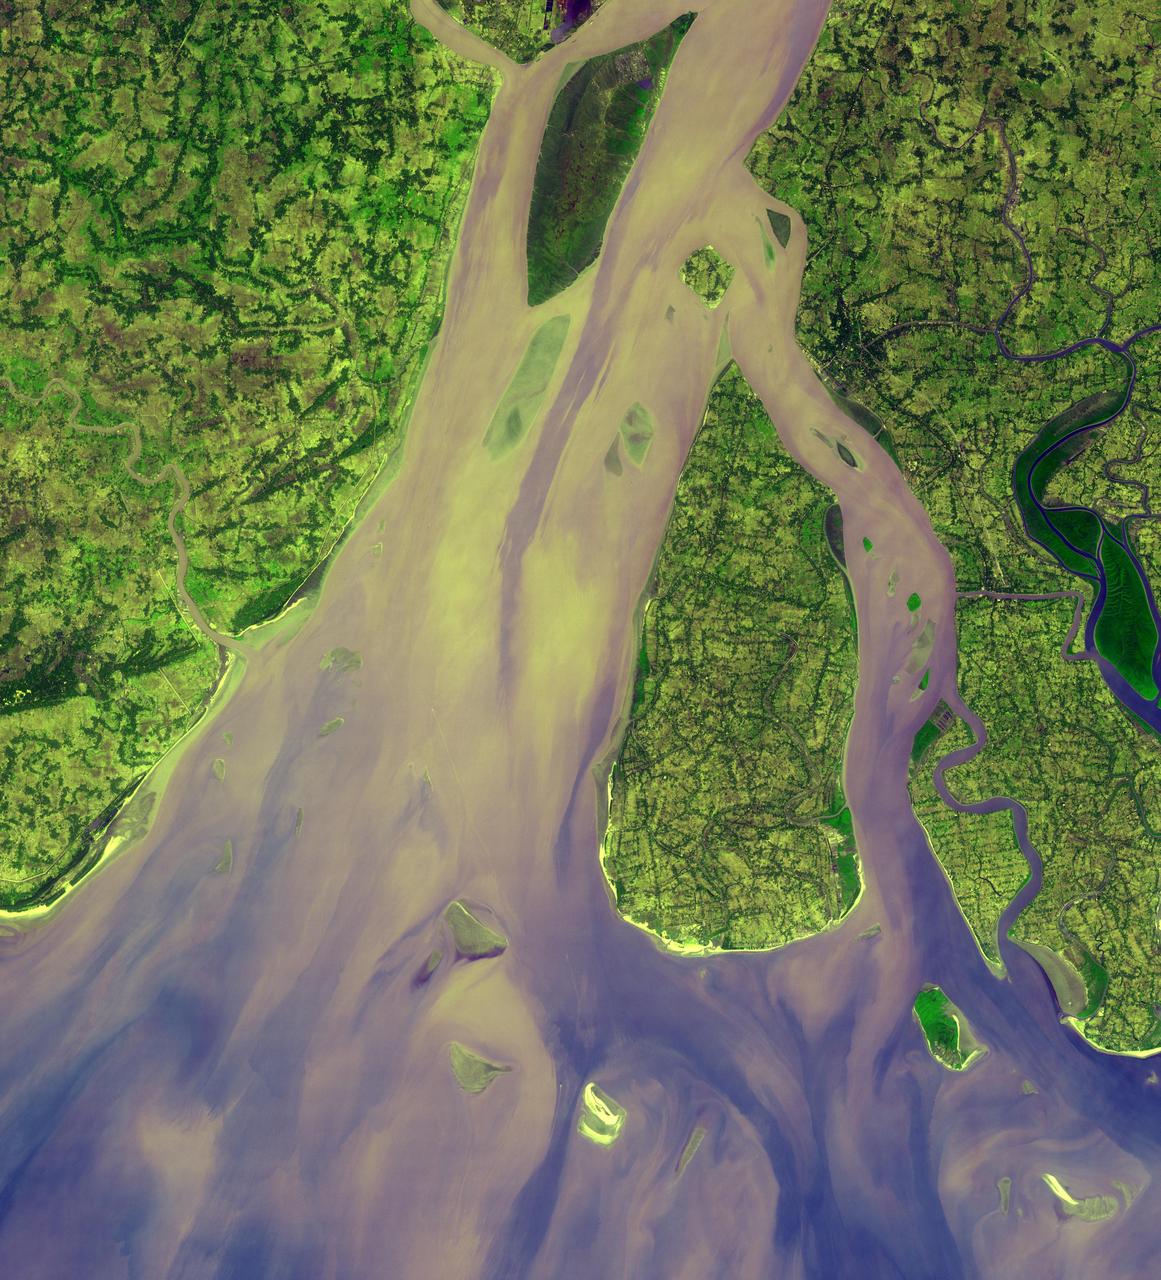
The western-most part of the Ganges Delta is seen in this 54.5 by 60 km ASTER sub-scene acquired on January 6, 2005. The Hugli River branches off from the Ganges River 300 km to the north, and flows by the city of Calcutta before emptying into the Bay of Bengal. High sediment load is evident by the light tan colors in the water, particularly downstream from off-shore islands. The deep green colors of some of these islands are mangrove swamps. The image is centered at 21.9 degrees north latitude, 88 degrees east longitude. http://photojournal.jpl.nasa.gov/catalog/PIA11158
Mt. Etna, Italy erupted February 17, 2021, sending rivers of lave down the southeast flank of the volcano, and spewing ashes and volcanic stones over nearby villages. Sicily's Catania Airport was temporarily closed due to an ash plume that rose to 3700 m altitude. By the following week, the eruption had waned. The ASTER visible image shows the extent of the active lava flows (derived from the thermal infrared data). The image was acquired February 26, 2021, covers an area of 25.5 by 27.0 km, and is located at 37.8 degrees north, 15 degrees east. https://photojournal.jpl.nasa.gov/catalog/PIA24418
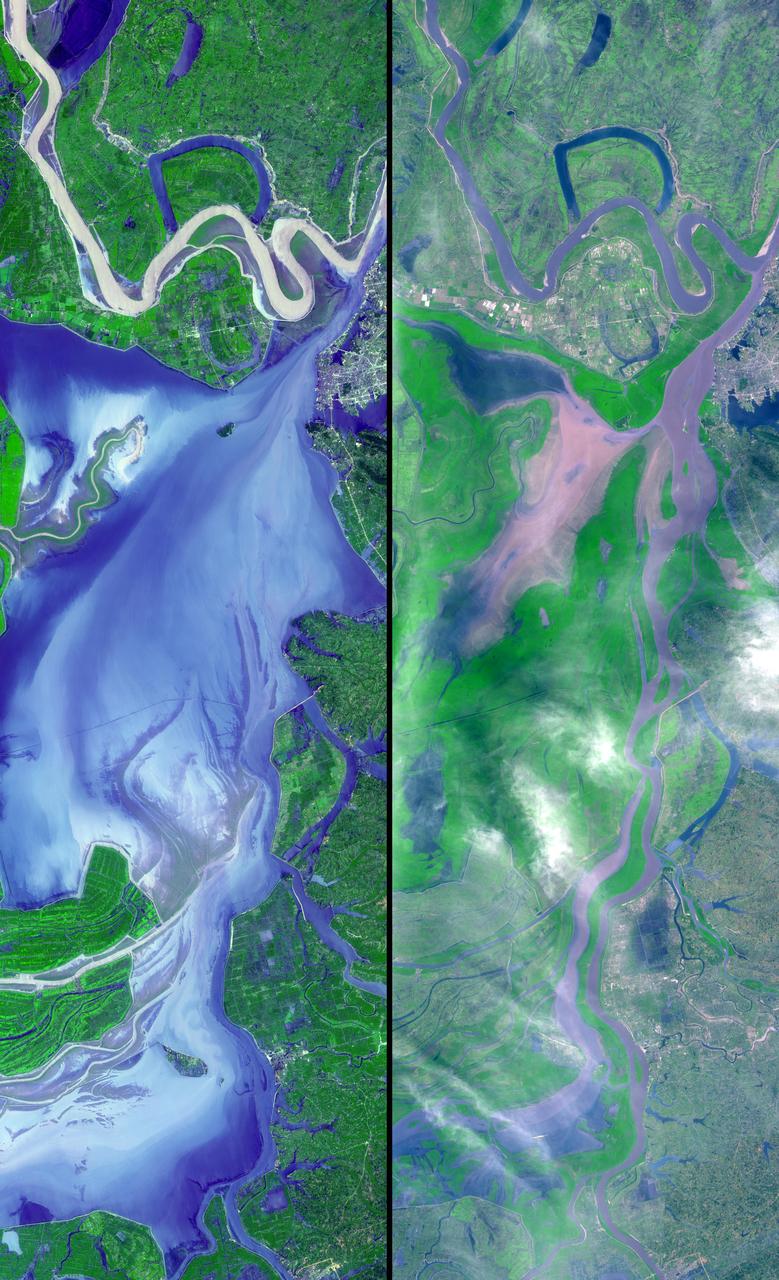
These images show dramatic change in the water at Dongting Lake in Hunan province, China. A flood crest surged down the Yangtze River in late August of this year, but the embankments made by residents there held. The left image was acquired on September 2, 2002 and shows the extent of the lake. The right image was obtained March 19, 2002 before the flooding began. These images were acquired on September 2, 2002 and March 19, 2002 by the Advanced Spaceborne Thermal Emission and Reflection Radiometer (ASTER) on NASA's Terra satellite. With its 14 spectral bands from the visible to the thermal infrared wavelength region, and its high spatial resolution of 15 to 90 meters (about 50 to 300 feet), ASTER will image Earth for the next 6 years to map and monitor the changing surface of our planet. http://photojournal.jpl.nasa.gov/catalog/PIA03858
The 2002 Winter Olympics are hosted by Salt Lake City at several venues within the city, in nearby cities, and within the adjacent Wasatch Mountains. This simulated natural color image presents a late spring view of north central Utah that includes all of the Olympic sites. The image extends from Ogden in the north, to Provo in the south; and includes the snow-capped Wasatch Mountains and the eastern part of the Great Salt Lake. This image was acquired on May 28, 2000 by the Advanced Spaceborne Thermal Emission and Reflection Radiometer (ASTER) on NASA's Terra satellite. With its 14 spectral bands from the visible to the thermal infrared wavelength region, and its high spatial resolution of 15 to 90 meters (about 50 to 300 feet), ASTER will image Earth for the next 6 years to map and monitor the changing surface of our planet. http://photojournal.jpl.nasa.gov/catalog/PIA03464
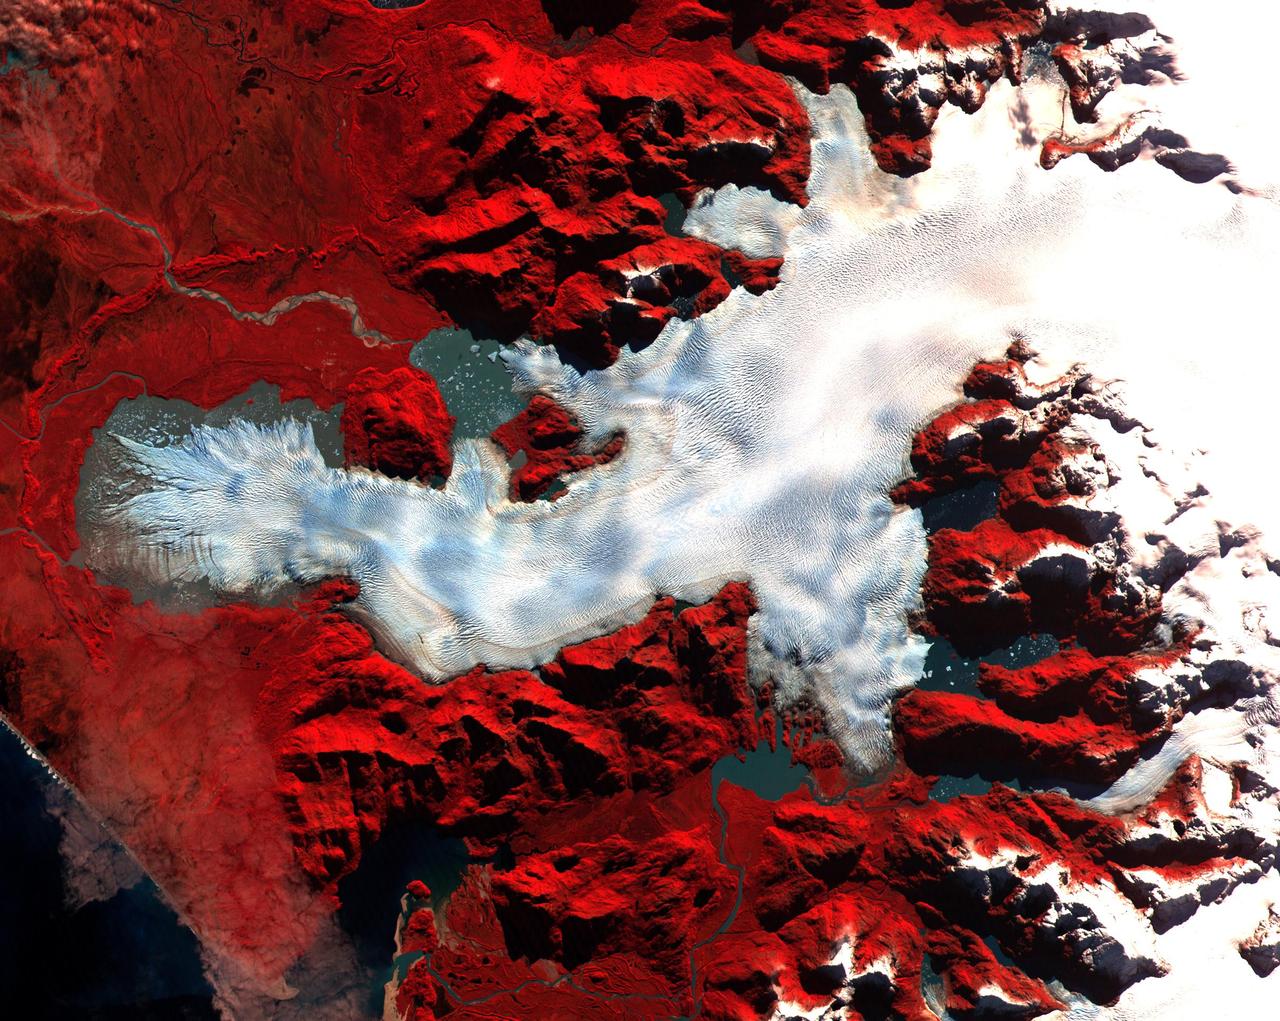
This ASTER image was acquired on May 2, 2000 over the North Patagonia Ice Sheet, Chile near latitude 47 degrees south, longitude 73 degrees west. The image covers 36 x 30 km. The false color composite displays vegetation in red. The image dramatically shows a single large glacier, covered with crevasses. A semi-circular terminal moraine indicates that the glacier was once more extensive than at present. ASTER data are being acquired over hundreds of glaciers worldwide to measure their changes over time. Since glaciers are sensitive indicators of warming or cooling, this program can provide global data set critical to understand climate change. This image is located at 46.5 degrees south latitude and 73.9 degrees west longitude. http://photojournal.jpl.nasa.gov/catalog/PIA02670
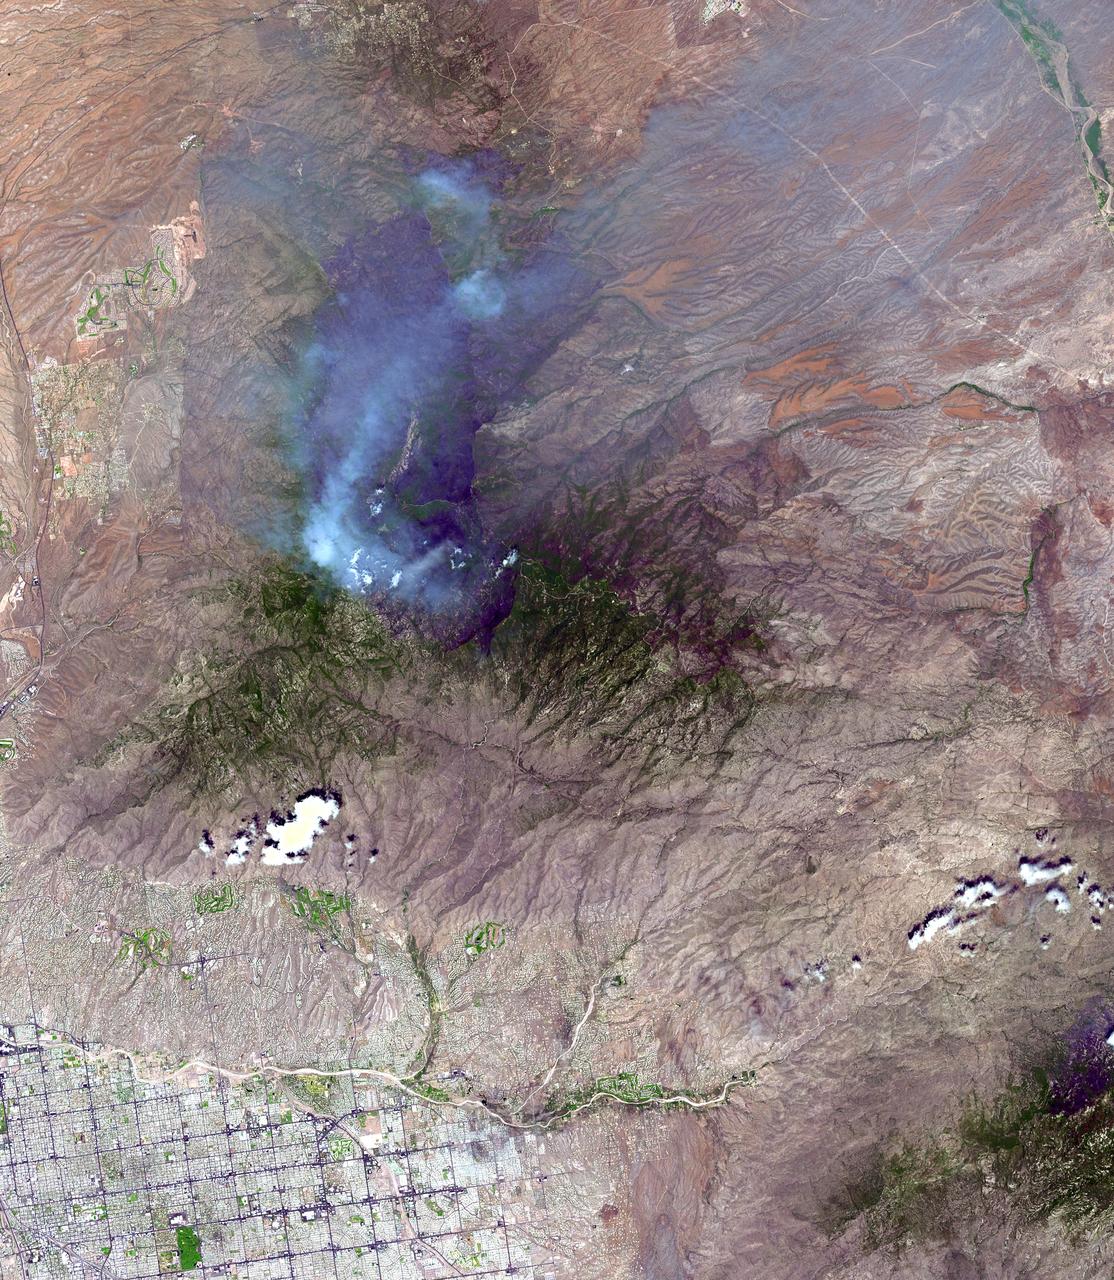
On June 26, NASA's Terra satellite acquired this image of the Aspen fire burning out of control north of Tucson, AZ. As of that date, the fire had consumed more than 27,000 acres and destroyed more than 300 homes, mostly in the resort community of Summerhaven, according to news reports. These data are being used by NASA's Wildfire Response Team and the US Forest Service to assess the intensity of the burn for future remediation efforts. This image was acquired on June 26, 2003 by the Advanced Spaceborne Thermal Emission and Reflection Radiometer (ASTER) on Terra. With its 14 spectral bands from the visible to the thermal infrared wavelength region, and its high spatial resolution of 15 to 90 meters (about 50 to 300 feet), ASTER images Earth to map and monitor the changing surface of our planet. http://photojournal.jpl.nasa.gov/catalog/PIA04602
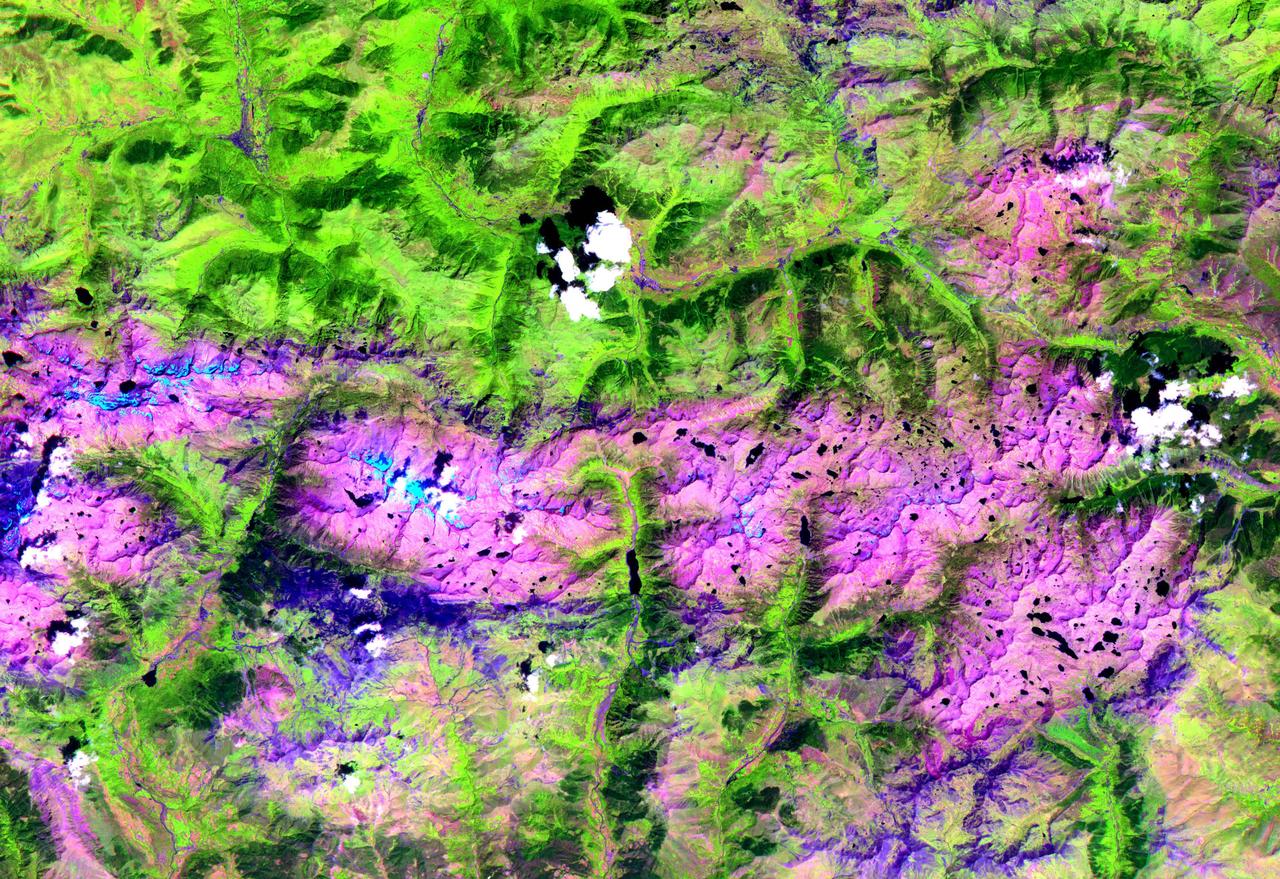
This ASTER image, acquired on August 1, 2000, covers an area of 57 by 29 km and covers part of the central Pyrenees in Spain. The Pyrenees in southwestern Europe extend for about 435 kilometers (about 270 miles) from the Bay of Biscay to the Mediterranean Sea, separating the Iberian Peninsula from the rest of Europe. The Pyrenees form most of the boundary between France and Spain, and encompass the tiny principality of Andorra. Approximately two-thirds of the mountains lie in Spain. The central Pyrenees extend to the Collines du Perche and contain the highest peaks of the system, including Pico de Aneto, the highest at 3,404 meters (11,168 feet). ASTER bands 4, 3 and 2 were displayed in red, green and blue. In this combination, snow is blue, vegetation is green, bare rocks are pink and dark blue, and clouds are white. The image is located at 42.6 degrees north latitude and 0.6 degrees east longitude. http://photojournal.jpl.nasa.gov/catalog/PIA11162
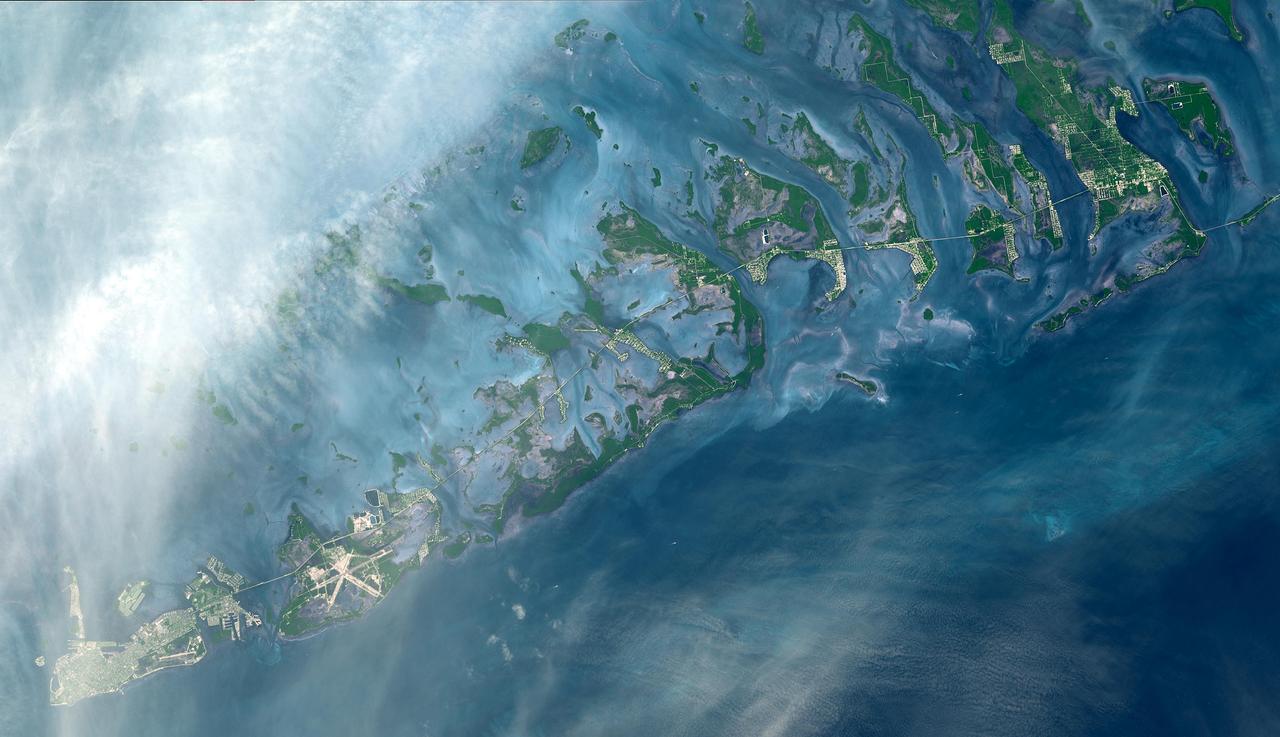
The Florida Keys are a chain of islands, islets and reefs extending from Virginia Key to the Dry Tortugas for about 309 kilometers (192 miles). The keys are chiefly limestone and coral formations. The larger islands of the group are Key West (with its airport), Key Largo, Sugarloaf Key, and Boca Chica Key. A causeway extends from the mainland to Key West. This image was acquired on October 28, 2001, by the Advanced Spaceborne Thermal Emission and Reflection Radiometer (ASTER) on NASA's Terra satellite. With its 14 spectral bands from the visible to the thermal infrared wavelength region, and its high spatial resolution of 15 to 90 meters (about 50 to 300 feet), ASTER images Earth to map and monitor the changing surface of our planet. http://photojournal.jpl.nasa.gov/catalog/PIA03890
The 2002 Winter Olympics are hosted by Salt Lake City at several venues within the city, in nearby cities, and within the adjacent Wasatch Mountains. This simulated natural color image presents a snowy, winter view of north central Utah that includes all of the Olympic sites. The image extends from Ogden in the north, to Provo in the south; and includes the snow-capped Wasatch Mountains and the eastern part of the Great Salt Lake. This image was acquired on February 8, 2001 by the Advanced Spaceborne Thermal Emission and Reflection Radiometer (ASTER) on NASA's Terra satellite. With its 14 spectral bands from the visible to the thermal infrared wavelength region, and its high spatial resolution of 15 to 90 meters (about 50 to 300 feet), ASTER will image Earth for the next 6 years to map and monitor the changing surface of our planet. http://photojournal.jpl.nasa.gov/catalog/PIA03465
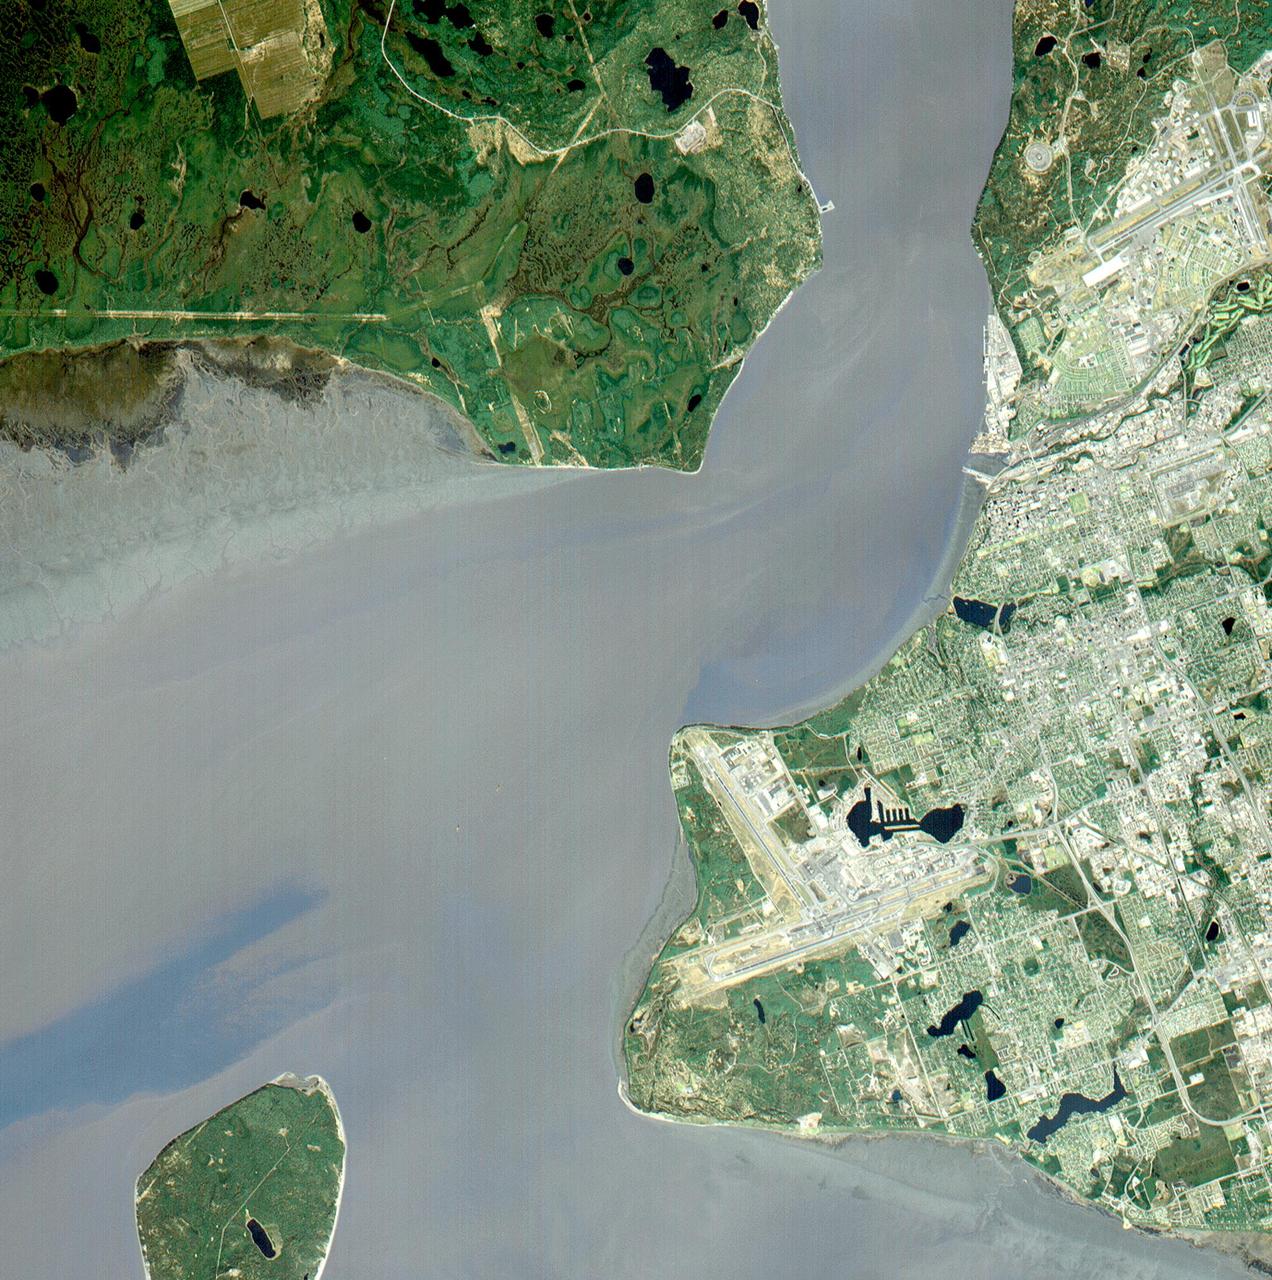
Anchorage, Alaska and Cook Inlet are seen in this 30 by 30 km (19 by 19 miles) sub-image, acquired May 12, 2000 by the Advanced Spaceborne Thermal Emission and Reflection Radiometer (ASTER). Orbiting at an altitude of 705 km (430 miles) on board NASA's Terra satellite, ASTER provides data at a resolution of 15 m (47 feet) and allows creation of this simulated natural color image. At the center of the image is the Ted Stevens Anchorage International Airport; in the upper right corner is Elmendorf Air Force Base. Dark green coniferous forests are seen in the northwest part of the image. A golf course, with its lush green fairways, is just south of the Air Force Base. The image covers an area of 30 by 30 km, was acquired May 12, 2000, and is located at 61.2 degrees north latitude and 149.9 degrees west longitude. http://photojournal.jpl.nasa.gov/catalog/PIA02675
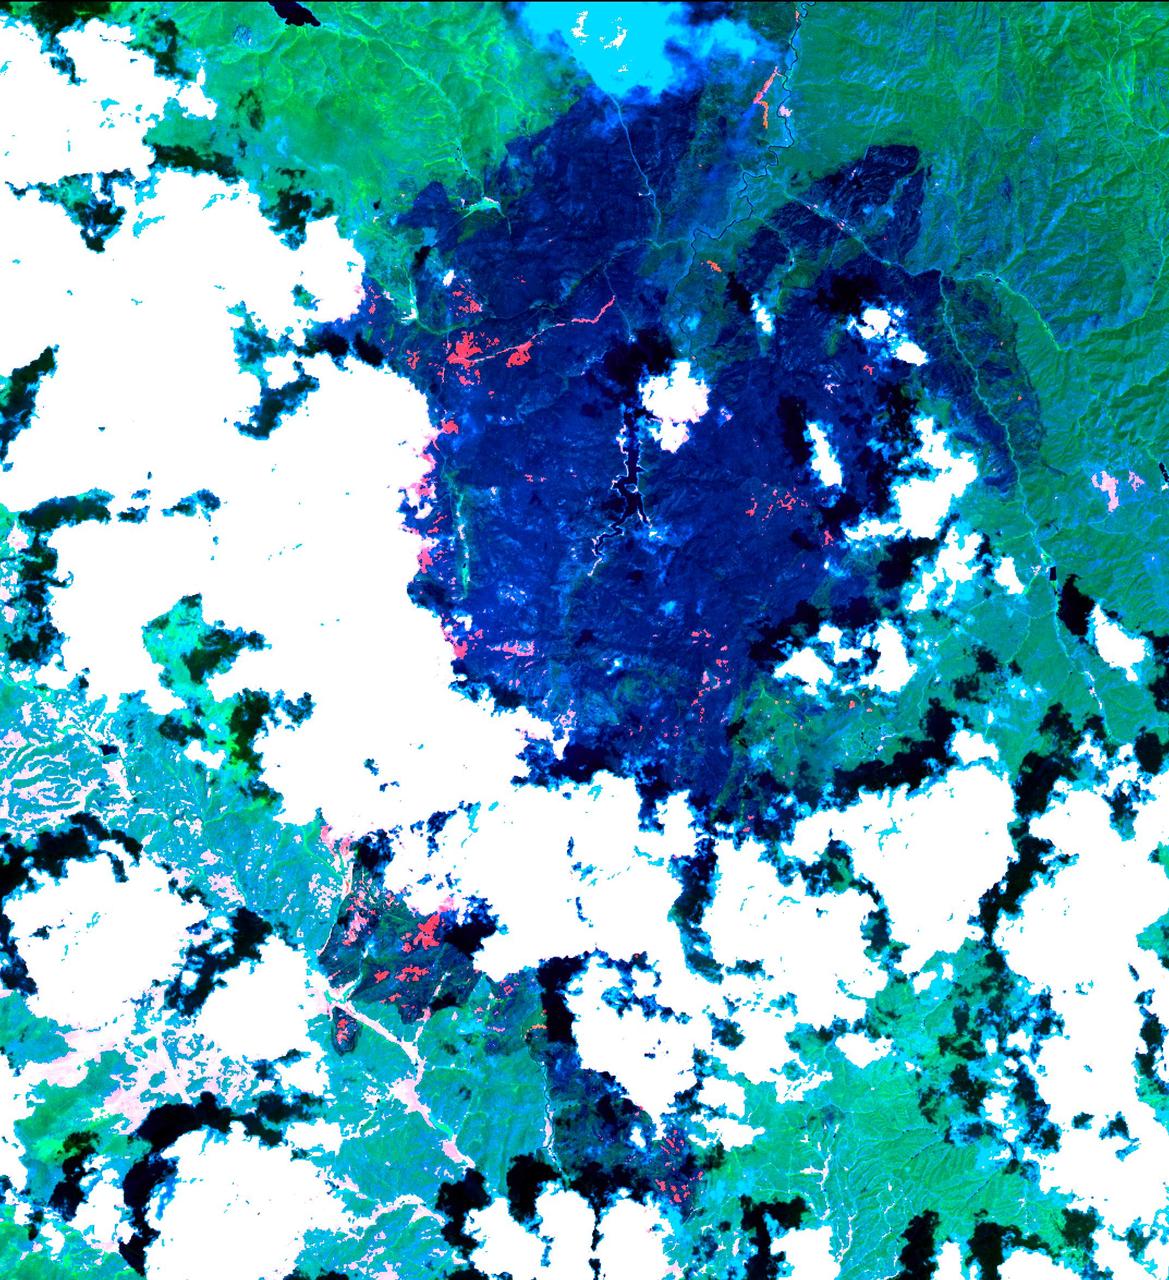
The Hayman forest fire, started on June 8, is continuing to burn in the Pike National Forest, 57 km (35 miles) south-southwest of Denver. According to the U.S. Forest Service, the fire has consumed more than 90,000 acres and has become Colorado's worst fire ever. In this ASTER image, acquired Sunday, June 16, 2002 at 10:30 am MST, the dark blue area is burned vegetation and the green areas are healthy vegetation. Red areas are active fires, and the blue cloud at the top center is smoke. Meteorological clouds are white. The image covers an area of 32.2 x 35.2 km (20.0 x 21.8 miles), and displays ASTER bands 8-3-2 in red, green and blue. http://photojournal.jpl.nasa.gov/catalog/PIA03499
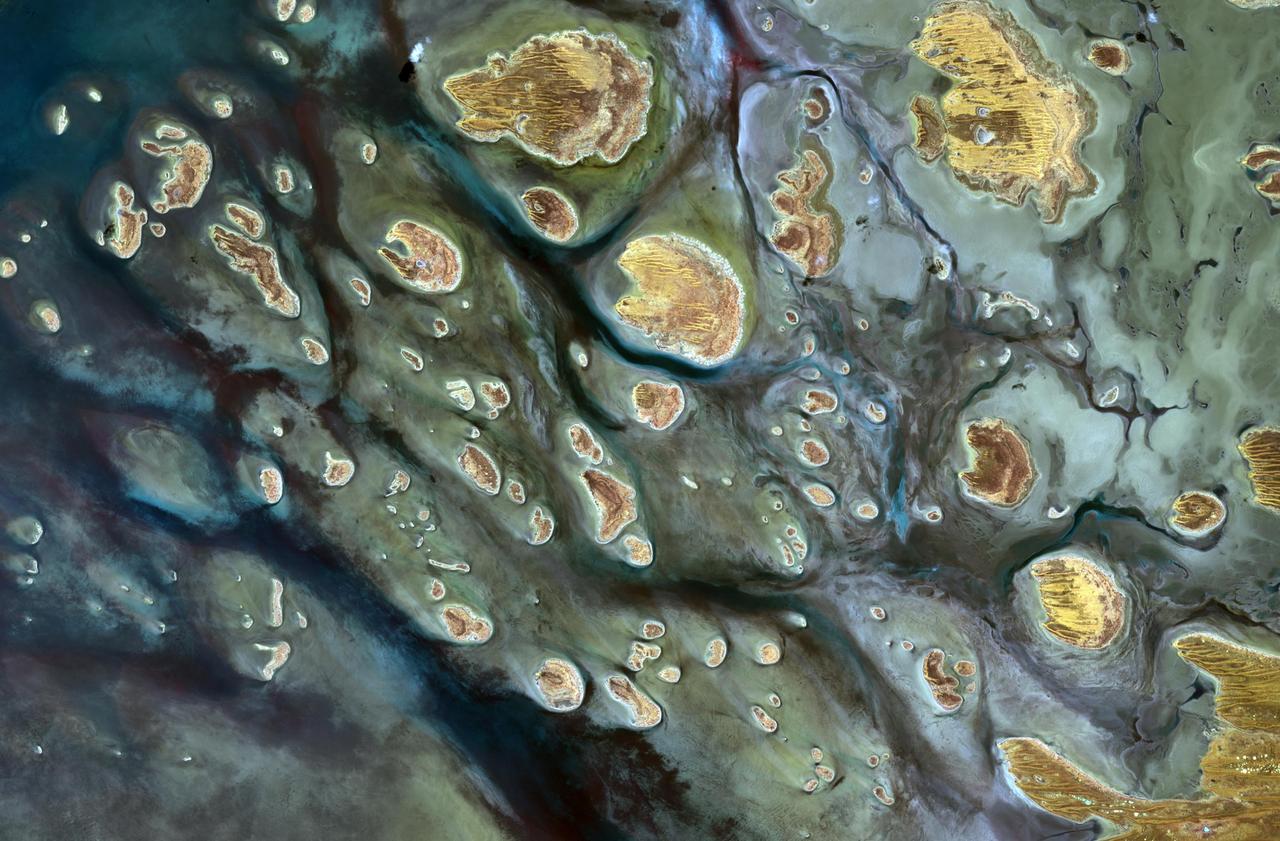
Lake Mackay is the largest of hundreds of ephemeral lakes scattered throughout Western Australia and the Northern Territory, and is the second largest lake in Australia. The darker areas indicate some form of desert vegetation or algae, moisture within the soils, and lowest elevations where water pools. The image was acquired on September 19, 2010 and covers an area of 27 x 41 km. With its 14 spectral bands from the visible to the thermal infrared wavelength region and its high spatial resolution of 15 to 90 meters (about 50 to 300 feet), ASTER images Earth to map and monitor the changing surface of our planet. ASTER is one of five Earth-observing instruments launched Dec. 18, 1999, on Terra. The instrument was built by Japan's Ministry of Economy, Trade and Industry. A joint U.S./Japan science team is responsible for validation and calibration of the instrument and data products. The broad spectral coverage and high spectral resolution of ASTER provides scientists in numerous disciplines with critical information for surface mapping and monitoring of dynamic conditions and temporal change. Example applications are: monitoring glacial advances and retreats; monitoring potentially active volcanoes; identifying crop stress; determining cloud morphology and physical properties; wetlands evaluation; thermal pollution monitoring; coral reef degradation; surface temperature mapping of soils and geology; and measuring surface heat balance. The U.S. science team is located at NASA's Jet Propulsion Laboratory, Pasadena, Calif. The Terra mission is part of NASA's Science Mission Directorate, Washington, D.C. More information about ASTER is available at <a href="http://asterweb.jpl.nasa.gov/" rel="nofollow">asterweb.jpl.nasa.gov/</a>. Image Credit: NASA/GSFC/METI/ERSDAC/JAROS, and U.S./Japan ASTER Science Team