
This image shows laser plasmas in a test lab at Los Alamos National Laboratory, N.M., under typical atmospheric pressures on Earth and Mars. A plasma is an ionized, glowing gas.

This graphic depicts what Mars atmosphere would have looked like to a viewer with ultraviolet-seeing eyes after a meteor shower on Oct. 19, 2014.
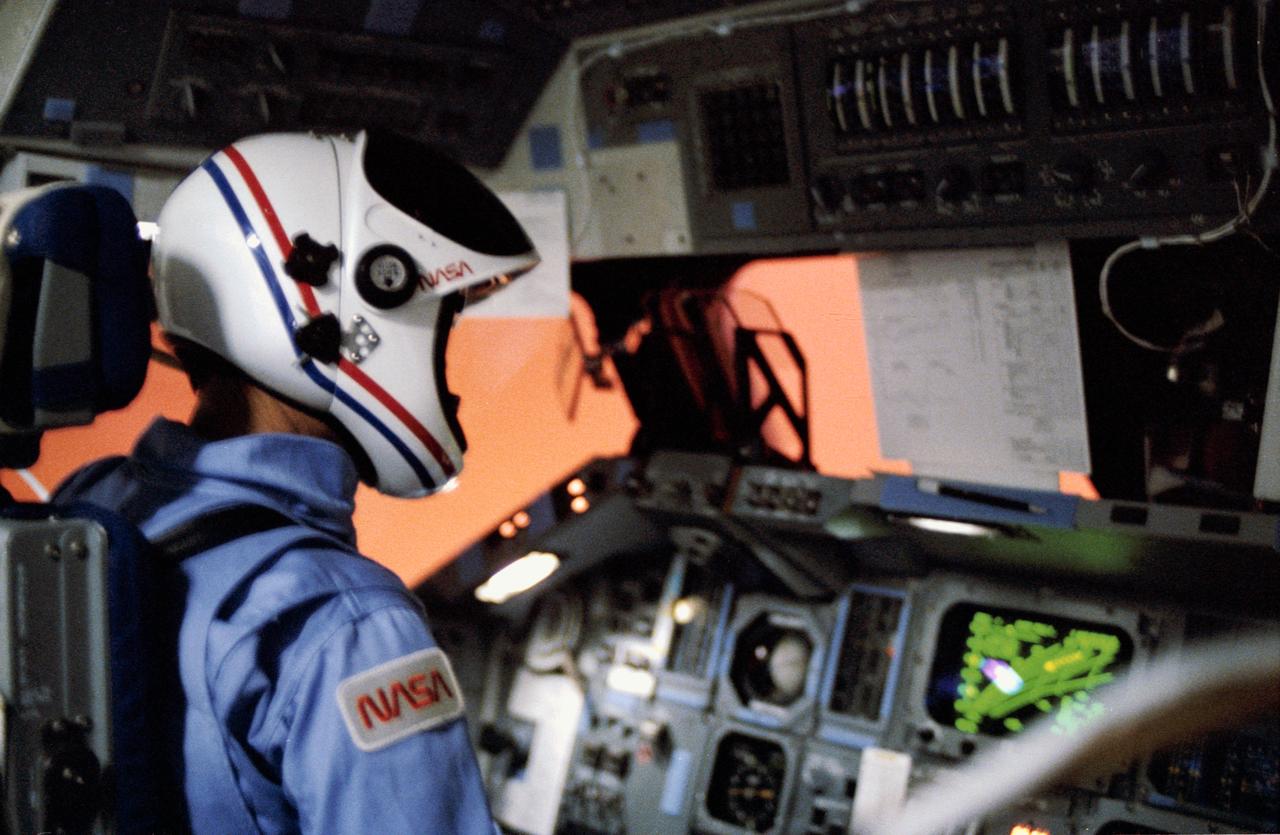
STS007-31-1614 & S83-35775 (24 June 1983) --- Astronaut Robert L. Crippen is seen at the commander’s station of the Space Shuttle Challenger as it passes through the Earth’s atmosphere on re-entry. The friction results in a pinkish glow visible through the forward windows on the flight deck. The scene was exposed with a 35mm camera.
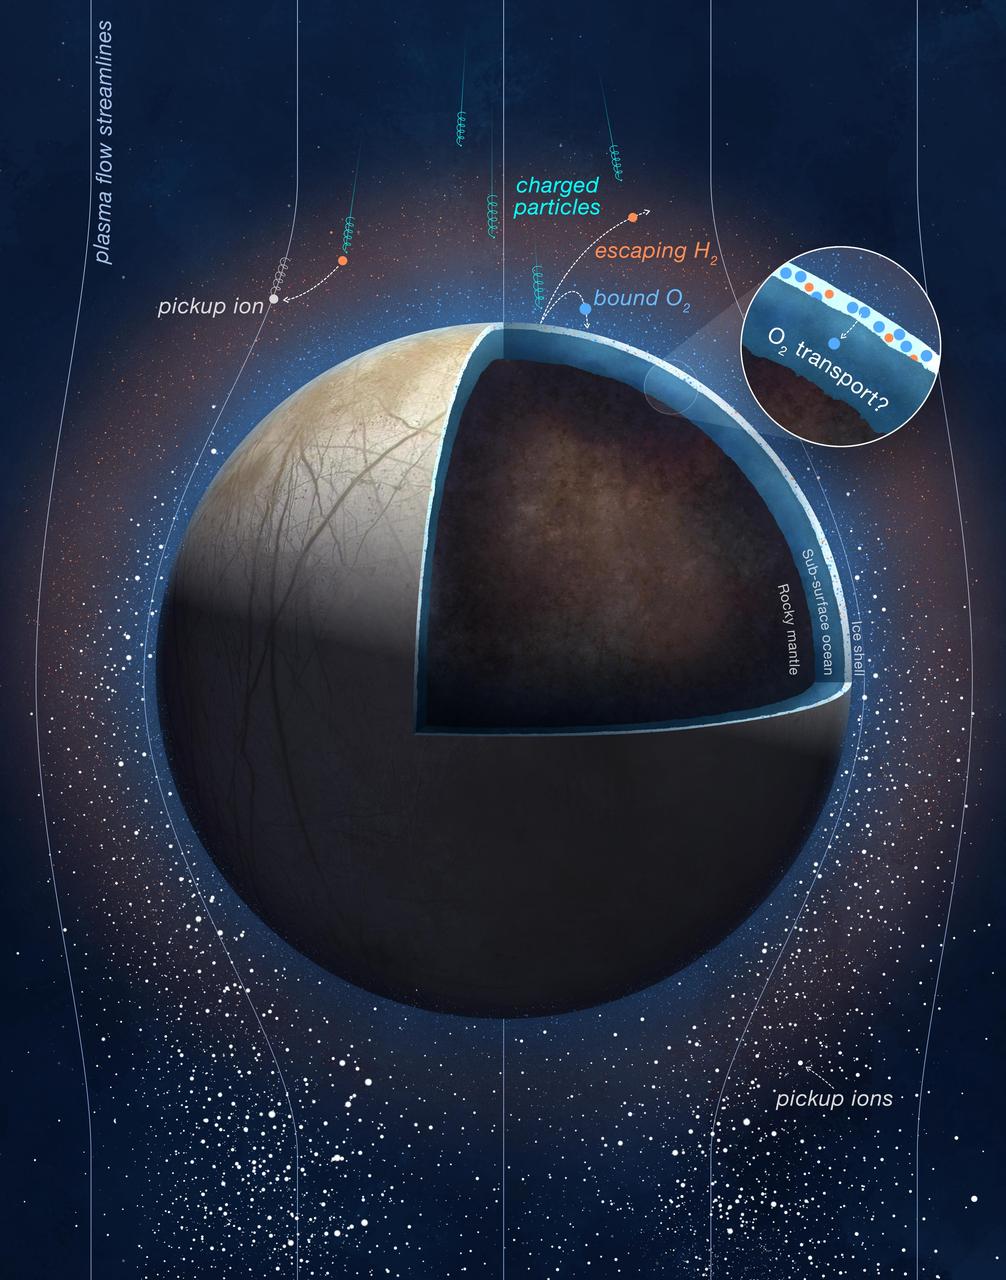
This illustration shows how oxygen is generated at Europa as a result of interaction between the Jovian moon's icy surface and Jupiter's plasma environment. A segment of Europa is cut away in the graphic to show its three layers – the icy shell, the ocean thought to be beneath the shell, and the moon's rocky mantle. Vertical "plasma flow streamlines" depict the flow of these charged particles in the vicinity of the moon. Some of the streamlines are oriented in such a way that their charged particles impact the moon's surface and split frozen water molecules present there into individual oxygen and hydrogen molecules. The newly created hydrogen molecules rise and form Europa's tenuous atmosphere. Because the newly created oxygen molecules are heavier than hydrogen, they remain closer to the surface. Scientists believe these "bound" oxygen gases could migrate inward toward the moon's subsurface ocean, as depicted in the inset image in the upper right of the illustration. The white specks surrounding Europa represent "pickup ions" – ionized particles that have been shed from Europa's atmosphere. When molecules in the atmosphere become charged, they are "picked up," or swept, into the stream of charged material flowing around Europa. Measurements of the composition and quantity of these pickup ions by NASA's Juno mission provided the data necessary to determine the oxygen and hydrogen generation processes at the surface of Europa. https://photojournal.jpl.nasa.gov/catalog/PIA26239
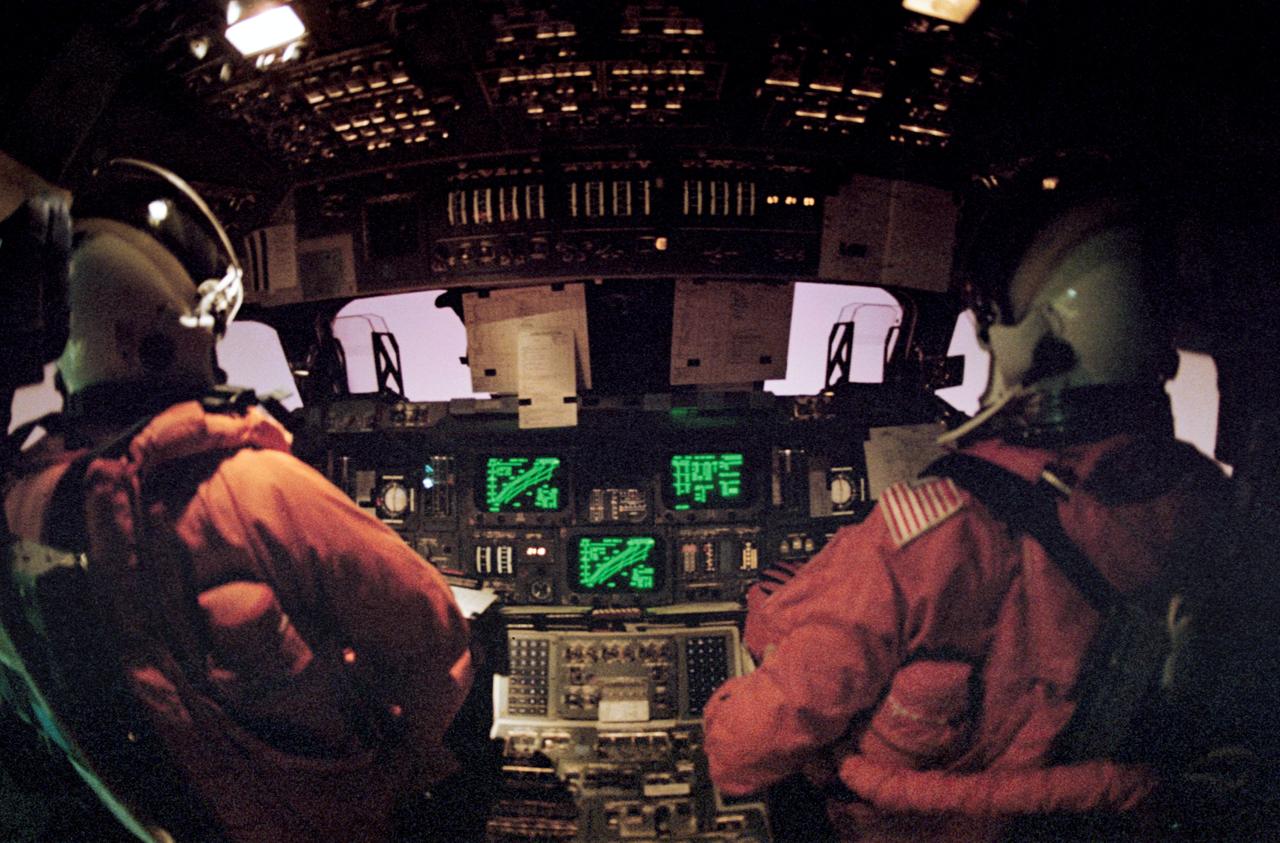
STS042-45-033 (30 Jan. 1992) --- Astronauts Ronald J. Grabe (left) and Stephen S. Oswald man the commander and pilot stations, respectively, during the entry phase of the STS-42 mission. The pink glow through the front windows telltale of friction caused heat encountered upon passing through Earth's atmosphere on the return trip home.
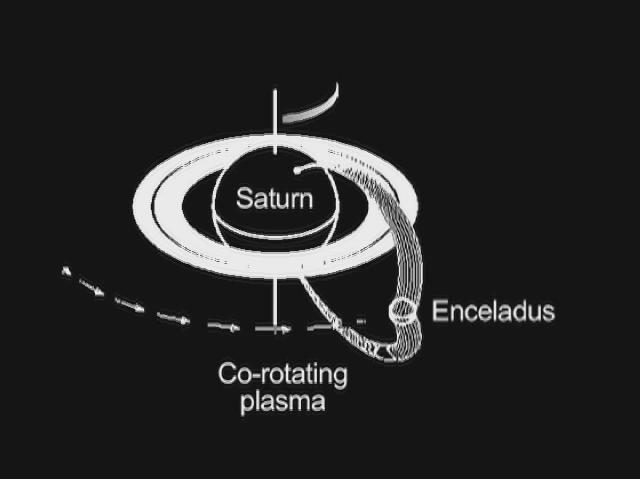
This graphic shows how Saturn and its moon Enceladus are electrically linked. Magnetic field lines, invisible to the human eye but detectable by the fields and particles instruments on NASA's Cassini spacecraft, arc from Saturn's north polar region to south polar region. Enceladus resides in the arc of a set of the field lines and feeds charged particles into the Saturn atmosphere. As Enceladus orbits around Saturn, the "footprint" of its connection to Saturn's north polar region, visible in ultraviolet light, also rotates. A doughnut of plasma, or hot ionized gas, revolves around Saturn at the same pace as the planet turns. The interaction of this plasma cloud with Enceladus shoots electrons along the magnetic field lines into the polar region of Saturn. The rain of electrons into Saturn's atmosphere creates an ultraviolet glow in an aurora-like phenomenon. Cassini's radio and plasma wave science instrument has detected a "hiss-like" radio noise generated by electrons moving along magnetic field lines from Enceladus to the glowing patch of ultraviolet light on Saturn. An animation is available at http://photojournal.jpl.nasa.gov/catalog/PIA13897
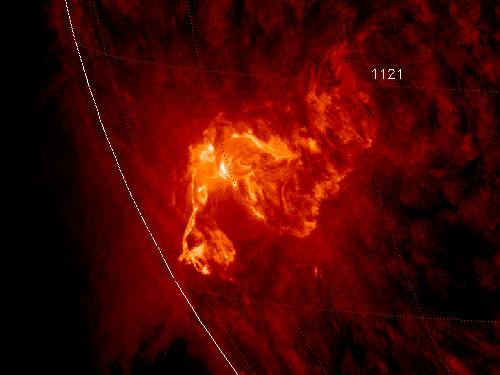
NASA image caputred November 6, 2010 <b>To see a really cool video of this event go here: <a href="http://www.flickr.com/photos/gsfc/5164627471/">www.flickr.com/photos/gsfc/5164627471/</a></b> Active sunspot 1121 has unleashed one of the brightest x-ray solar flares in years, an M5.4-class eruption at 15:36 UT on Nov. 6th. Radiation from the flare created a wave of ionization in Earth's upper atmosphere that altered the propagation of low-frequency radio waves. There was, however, no bright CME (plasma cloud) hurled in our direction, so the event is unlikely to produce auroras in the nights ahead. This is the third M-flare in as many days from this increasingly active sunspot. So far none of the eruptions has been squarely Earth-directed, but this could change in the days ahead as the sun's rotation turns the active region toward our planet. Credit: NASA/SDO/AIA To learn more about SDO go to: <a href="http://sdo.gsfc.nasa.gov/" rel="nofollow">sdo.gsfc.nasa.gov/</a> <b><a href="http://www.nasa.gov/centers/goddard/home/index.html" rel="nofollow">NASA Goddard Space Flight Center</a></b> enables NASA’s mission through four scientific endeavors: Earth Science, Heliophysics, Solar System Exploration, and Astrophysics. Goddard plays a leading role in NASA’s accomplishments by contributing compelling scientific knowledge to advance the Agency’s mission. <b>Follow us on <a href="http://twitter.com/NASA_GoddardPix" rel="nofollow">Twitter</a></b> <b>Join us on <a href="http://www.facebook.com/pages/Greenbelt-MD/NASA-Goddard/395013845897?ref=tsd" rel="nofollow">Facebook</a></b>

These mosaics of Jupiter's night side show the Jovian aurora at approximately 45 minute intervals as the auroral ring rotated with the planet below the spacecraft. The images were obtained by the Solid State Imaging (SSI) system on NASA's Galileo spacecraft. during its eleventh orbit of Jupiter. The auroral ring is offset from Jupiter's pole of rotation and reaches the lowest latitude near 165 degrees west longitude. The aurora is hundreds of kilometers wide, and when it crosses the edge of Jupiter, it is about 250 kilometers above the planet. As on Earth, the auroral emission is caused by electrically charged particles striking atoms in the upper atmosphere from above. The particles travel along Jupiter's magnetic field lines, but their origin is not fully understood. The field lines where the aurora is most intense cross the Jovian equator at large distances (many Jovian radii) from the planet. The faint background throughout the image is scattered light in the camera. This stray light comes from the sunlit portion of Jupiter, which is out of the image. In multispectral observations the aurora appears red, consistent with how atomic hydrogen in Jupiter's atmosphere would glow. Galileo's unique perspective allows it to view the night side of the planet at short range, revealing details that cannot be seen from Earth. These detailed features are time dependent, and can be followed in this sequence of Galileo images. In the first mosaic, the auroral ring is directly over Jupiter's limb and is seen "edge on." In the fifth mosaic, the auroral emission is coming from several distinct bands. This mosaic also shows the footprint of the Io flux tube. Volcanic eruptions on Jupiter's moon, Io, spew forth particles that become ionized and are pulled into Jupiter's magnetic field to form an invisible tube, the Io flux tube, between Jupiter and Io. The bright circular feature towards the lower right may mark the location where these energetic particles impact Jupiter. Stars which are visible in some of the images enable precise determination of where the camera is pointed. This has allowed the first three dimensional establishment of the position of the aurora. Surprisingly, the measured height is about half the altitude (above the one bar pressure level) predicted by magnetospheric models. The Universal Time, in Spacecraft Event Time (SCET), that the images were taken is listed beneath each mosaic. The first four frames were taken on November 5, 1997 (SCET 97.309) before the Galileo spacecraft reached perijove, the closest point to Jupiter. The latter four were taken three days later on November 8, 1997 (SCET 97.312), after perijove. Each image was taken at visible wavelengths and is displayed in shades of blue. North is at the top of the picture. A grid of planetocentric latitude and west longitude is overlain on the images. The resolution in the plane of the pictures is 15 kilometers per picture element. The images were taken at a range of 1.3 million kilometers. http://photojournal.jpl.nasa.gov/catalog/PIA01600
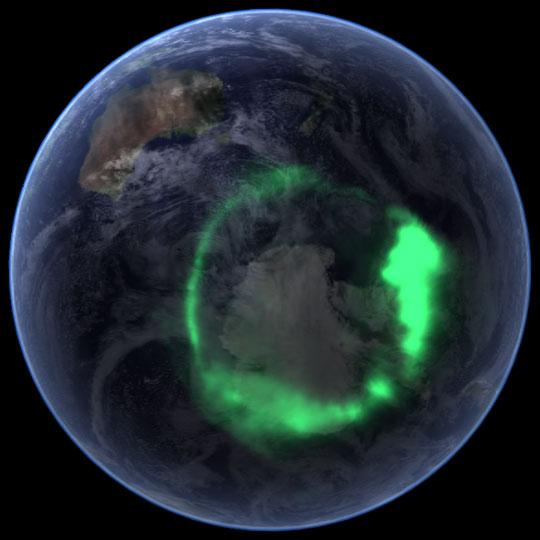
NASA file image acquired September 11, 2005 <b>To view a video of this event go here: <a href="http://www.flickr.com/photos/gsfc/6257608714">www.flickr.com/photos/gsfc/6257608714</a></b> From space, the aurora is a crown of light that circles each of Earth’s poles. The IMAGE satellite captured this view of the aurora australis (southern lights) on September 11, 2005, four days after a record-setting solar flare sent plasma—an ionized gas of protons and electrons—flying towards the Earth. The ring of light that the solar storm generated over Antarctica glows green in the ultraviolet part of the spectrum, shown in this image. The IMAGE observations of the aurora are overlaid onto NASA’s satellite-based Blue Marble image. From the Earth’s surface, the ring would appear as a curtain of light shimmering across the night sky. Like all solar storms, the September storm distorted the shape of the magnetic field that surrounds the Earth. Without buffeting from the solar wind (charged particles like protons and electrons that are ejected from the Sun), the Earth’s magnetic field would look something like a plump doughnut, with the North and South poles forming the slender hole in the center. In reality, the nearly constant solar winds flatten the space side of the “doughnut” into a long tail. The amount of distortion changes when solar storms, such as the flare on September 7, send stronger winds towards the Earth. Changes to the magnetic field release fast-moving particles, which flow with charged particles from the Sun towards the center of the “doughnut” at the Earth’s poles. As the particles sink into the atmosphere, they collide with oxygen and nitrogen, lighting the sky with Nature’s version of neon lights, the aurora. Though scientists knew that the aurora were caused by charged particles from the Sun and their interaction with the Earth’s magnetic field, they had no way to measure the interaction until NASA launched the Imager for Magnetopause-to-Aurora Global Exploration (IMAGE) satellite in 2000. The satellite’s mission was to collect data that would allow scientists to study the structure and dynamics of the Earth’s magnetic field for the first time. Designed to operate for two years, IMAGE sent its last data to Earth in December 2005 after a highly successful five-year mission. Since 2000, IMAGE has provided insight into how the Earth’s powerful magnetic field protects the planet from solar winds. Without the shield the magnetic field provides, the upper atmosphere would evaporate into space under the influence of solar winds. IMAGE has shown scientists what sort of changes the magnetic field undertakes as it diverts solar winds from the Earth. For a summary of the discoveries that IMAGE has made possible, see IMAGE Discovers. Instrument: IMAGE Credit: <a href="http://svs.gsfc.nasa.gov/index.html" rel="nofollow">NASA/Goddard Space Flight Center Scientific Visualization Studio</a> <b><a href="http://www.nasa.gov/audience/formedia/features/MP_Photo_Guidelines.html" rel="nofollow">NASA image use policy.</a></b> <b><a href="http://www.nasa.gov/centers/goddard/home/index.html" rel="nofollow">NASA Goddard Space Flight Center</a></b> enables NASA’s mission through four scientific endeavors: Earth Science, Heliophysics, Solar System Exploration, and Astrophysics. Goddard plays a leading role in NASA’s accomplishments by contributing compelling scientific knowledge to advance the Agency’s mission. <b>Follow us on <a href="http://twitter.com/NASAGoddardPix" rel="nofollow">Twitter</a></b> <b>Like us on <a href="http://www.facebook.com/pages/Greenbelt-MD/NASA-Goddard/395013845897?ref=tsd" rel="nofollow">Facebook</a></b> <b>Find us on <a href="http://instagrid.me/nasagoddard/?vm=grid" rel="nofollow">Instagram</a></b>

Matthew Mullin and Bobby Meazell, Orbital ATK/Columbia Scientific Balloon Facility technicians, conduct compatibility testing on NASA Langley Research Center’s Radiation Dosimetry Experiment payload Wednesday, Sept. 9, at Fort Sumner, N.M. The successful compatibility test was a key milestone in ensuring the flight readiness of RaD-X, which is scheduled to launch on an 11-million-cubic-foot NASA scientific balloon no earlier than Friday, Sept. 11, from the agency’s balloon launching facility in Fort Sumner. RaD-X will measure cosmic ray energy at two separate altitude regions in the stratosphere—above 110,000 feet and between 69,000 to 88,500 feet. The data is key to confirming Langley’s Nowcast of Atmospheric Ionizing Radiation for Aviation Safety (NAIRAS) model, which is a physics-based model that determines solar radiation and galactic cosmic ray exposure globally in real-time. The NAIRAS modeling tool will be used to help enhance aircraft safety as well as safety procedures for the International Space Station. In addition to the primary payload, 100 small student experiments will fly on the RaD-X mission as part of the Cubes in Space program. The program provides 11- to 18-year-old middle and high school students a no-cost opportunity to design and compete to launch an experiment into space or into the near-space environment. The cubes measure just 4 centimeters by 4 centimeters. NASA’s scientific balloons offer low-cost, near-space access for scientific payloads weighing up to 8,000 pounds for conducting scientific investigations in fields such as astrophysics, heliophysics and atmospheric research. NASA’s Wallops Flight Facility in Virginia manages the agency’s scientific balloon program with 10 to 15 flights each year from launch sites worldwide. Orbital ATK provides program management, mission planning, engineering services and field operations for NASA’s scientific balloon program. The program is executed from the Columbia Scientific Balloon Facility in Palestine, Texas. The Columbia team has launched more than 1,700 scientific balloons in over 35 years of operation. Anyone may track the progress of the Fort Sumner flights, which includes a map showing the balloon’s real-time location, at: <a href="http://towerfts.csbf.nasa.gov/" rel="nofollow">towerfts.csbf.nasa.gov/</a> For more information on the balloon program, see: <a href="http://www.nasa.gov/scientificballoons" rel="nofollow">www.nasa.gov/scientificballoons</a> <b><a href="http://www.nasa.gov/audience/formedia/features/MP_Photo_Guidelines.html" rel="nofollow">NASA image use policy.</a></b> <b><a href="http://www.nasa.gov/centers/goddard/home/index.html" rel="nofollow">NASA Goddard Space Flight Center</a></b> enables NASA’s mission through four scientific endeavors: Earth Science, Heliophysics, Solar System Exploration, and Astrophysics. Goddard plays a leading role in NASA’s accomplishments by contributing compelling scientific knowledge to advance the Agency’s mission. <b>Follow us on <a href="http://twitter.com/NASAGoddardPix" rel="nofollow">Twitter</a></b> <b>Like us on <a href="http://www.facebook.com/pages/Greenbelt-MD/NASA-Goddard/395013845897?ref=tsd" rel="nofollow">Facebook</a></b> <b>Find us on <a href="http://instagrid.me/nasagoddard/?vm=grid" rel="nofollow">Instagram</a></b>