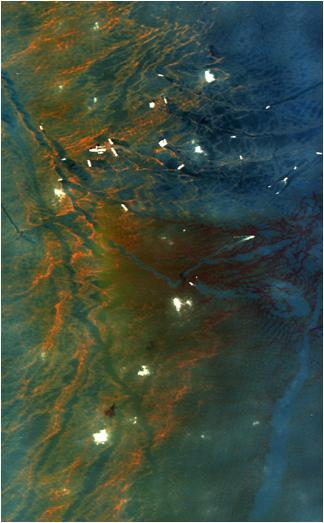
This image from NASA Airborne Visible/Infrared Imaging Spectrometer instrument AVIRIS was collected on May 17, 2010, over the site of the Deepwater Horizon BP oil spill disaster. In the image, crude oil on the surface appears orange to brown.

NASA’s DC-8 aircraft at Carlos Ibanez International Airport in Punta Arenas, Chile. A portion of AirSAR hardware is visible on the left rear fuselage. AirSAR 2004 is a three-week expedition in Central and South America by an international team of scientists that is using an all-weather imaging tool, called the Airborne Synthetic Aperture Radar (AirSAR), located onboard NASA's DC-8 airborne laboratory. Scientists from many parts of the world are combining ground research with NASA's AirSAR technology to improve and expand on the quality of research they are able to conduct.

NASA's Airborne Visible Infrared Imaging Spectrometer instrument (AVIRIS), flying aboard a NASA Armstrong Flight Research Center high-altitude ER-2 aircraft, observed wildfires burning in Southern California on Dec. 5-7, 2017. AVIRIS is an imaging spectrometer that observes light in visible and infrared wavelengths, measuring the full spectrum of radiated energy. Unlike regular cameras with three colors, AVIRIS has 224 spectral channels, measuring contiguously from the visible through the shortwave infrared. Data from these flights, compared against measurements acquired earlier in the year, show many ways this one instrument can improve both our understanding of fire risk and the response to fires in progress. The top row in this image compilation shows pre-fire data acquired from June 2017. At top left is a visible-wavelength image similar to what our own eyes would see. The top middle image is a map of surface composition based on analyzing the full electromagnetic spectrum, revealing green vegetated areas and non-photosynthetic vegetation that is potential fuel as well as non-vegetated surfaces that may slow an advancing fire. The image at top right is a remote measurement of the water in tree canopies, a proxy for how much moisture is in the vegetation. The bottom row in the compilation shows data acquired from the Thomas fire in progress in December 2017. At bottom left is a visible wavelength image. The bottom middle image is an infrared image, with red at 2,250 nanometers showing fire energy, green at 1,650 nanometers showing the surface through the smoke, and blue at 1,000 nanometers showing the smoke itself. The image at bottom right is a fire temperature map using spectroscopic analysis to measure fire thermal emission recorded in the AVIRIS spectra. https://photojournal.jpl.nasa.gov/catalog/PIA22194
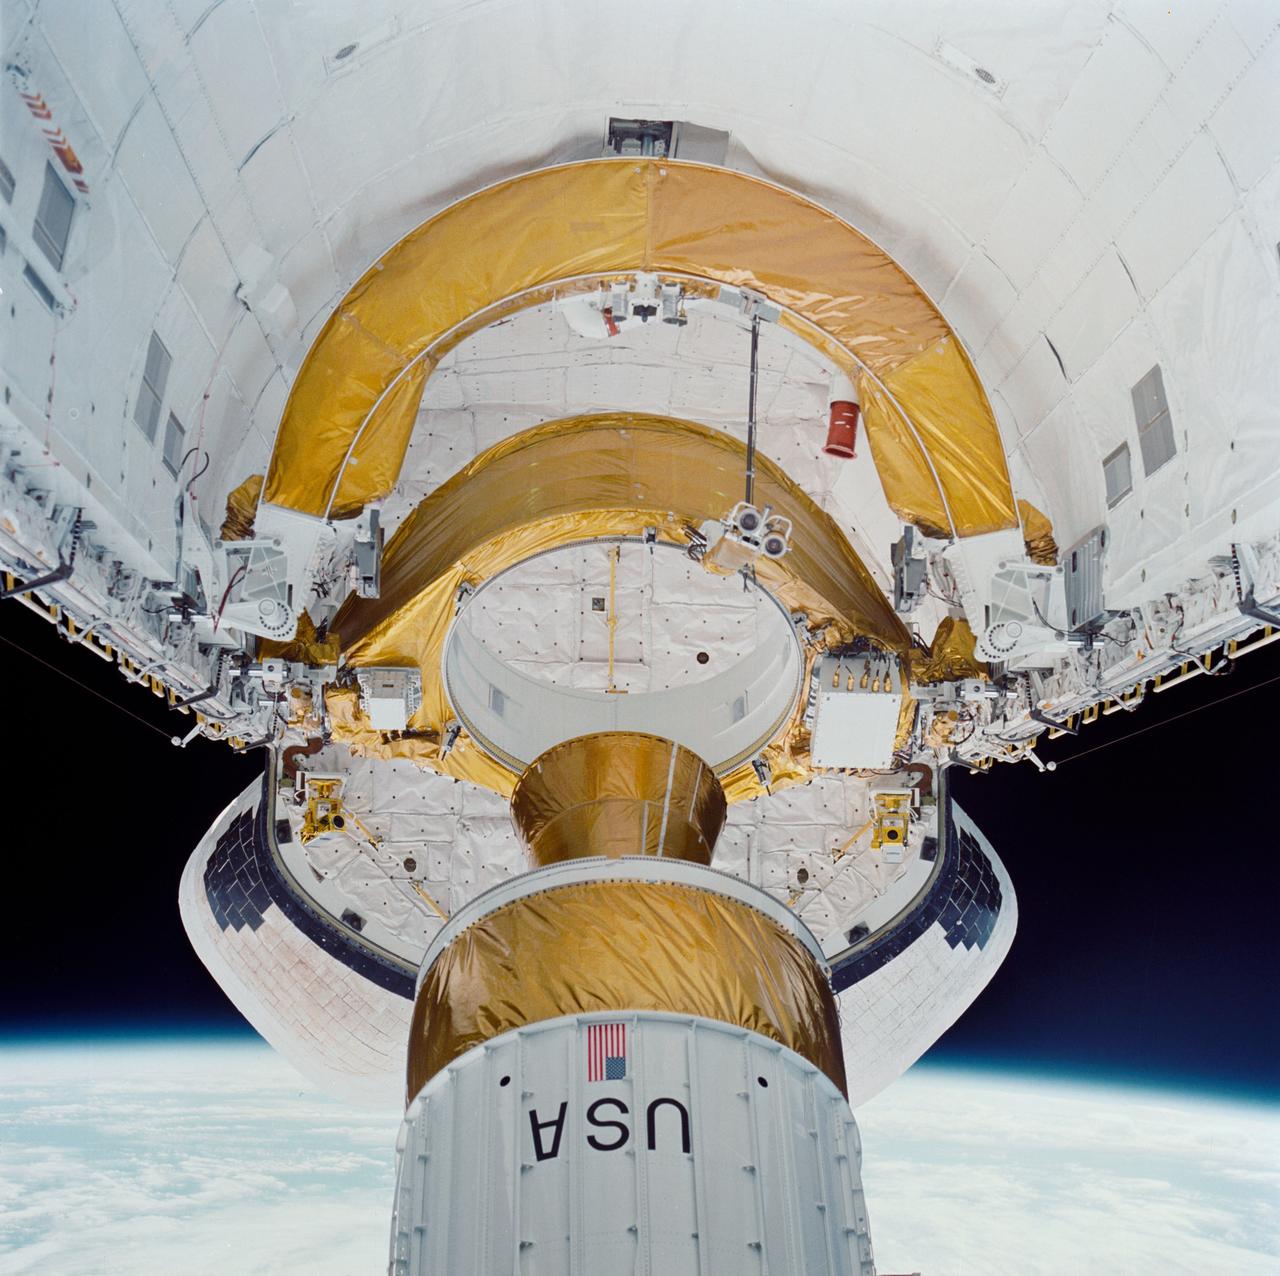
STS029-71-000AE (13-18 March 1989) --- STS-29 onboard view shows Space Shuttle Discovery's payload bay with tracking and data relay satellite D (TDRS-D) in stowed, pre-deployment position. In this head-on view, TDRS-D stowed components including single access #1 and #2, solar cell panels, SGL, S-Band omni antenna, and C-Band antenna are visible. TDRS-D rests in airborne support equipment (ASE) forward cradle and aft frame tilt actuator (AFTA). Discovery's aft bulkhead and orbital maneuvering system (OMS) pods are visible in the background.

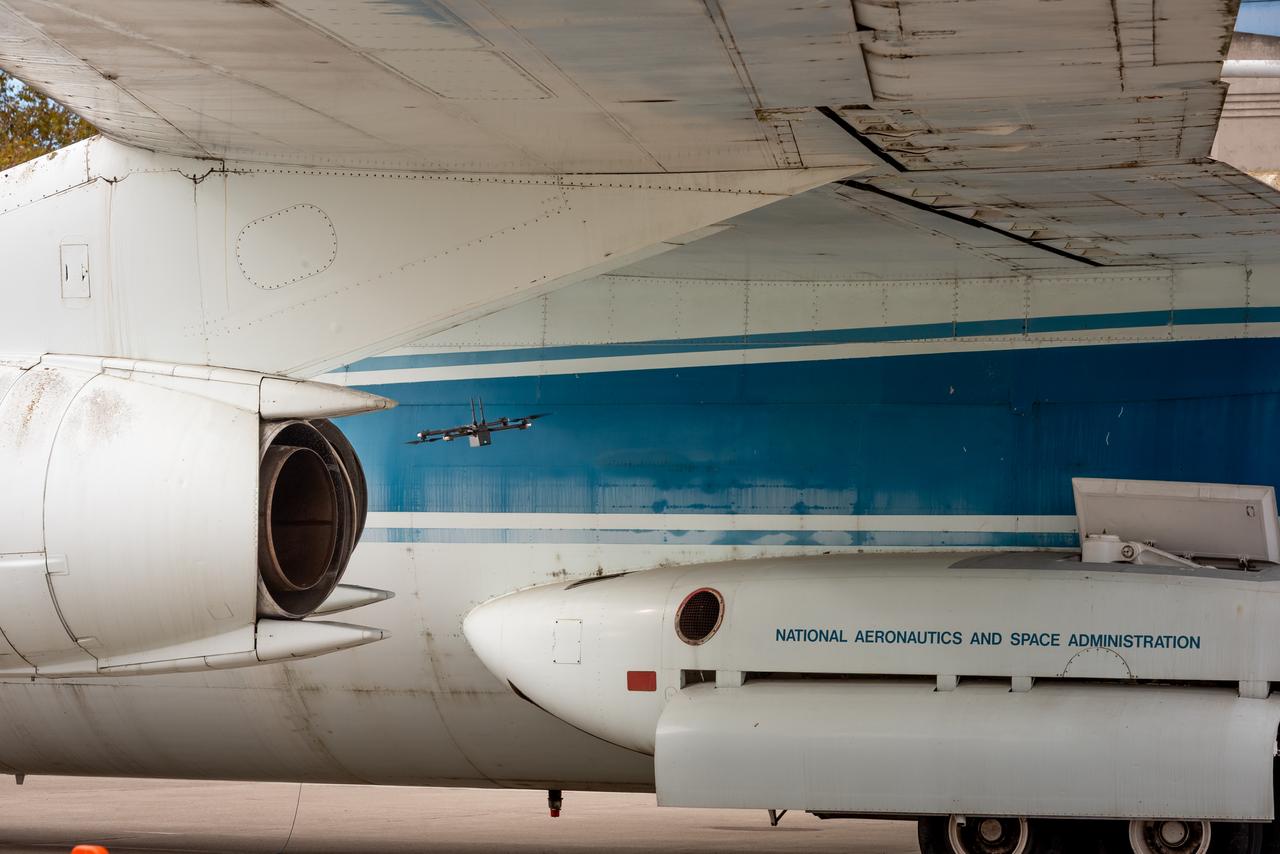
The drone follows an autonomously defined path around the modified C-141 Kuiper Airborne Observatory, (KAO) (NASA-714), on the N211 apron. The drone photographs the aircraft with a visible and infrared camera which are processed using a photogrammetry software package called Pix4D that converts them into a 3D model. Scanning the aircraft is the first phase of documenting the aircraft demolition as well as an opportunity to train pilots to operate the Pix4D software.

The drone follows an autonomously defined path around the modified C-141 Kuiper Airborne Observatory, (KAO) (NASA-714), on the N211 apron. The drone photographs the aircraft with a visible and infrared camera which are processed using a photogrammetry software package called Pix4D that converts them into a 3D model. Scanning the aircraft is the first phase of documenting the aircraft demolition as well as an opportunity to train pilots to operate the Pix4D software.

The drone follows an autonomously defined path around the modified C-141 Kuiper Airborne Observatory, (KAO) (NASA-714), on the N211 apron. The drone photographs the aircraft with a visible and infrared camera which are processed using a photogrammetry software package called Pix4D that converts them into a 3D model. Scanning the aircraft is the first phase of documenting the aircraft demolition as well as an opportunity to train pilots to operate the Pix4D software.

The drone follows an autonomously defined path around the modified C-141 Kuiper Airborne Observatory, (KAO) (NASA-714), on the N211 apron. The drone photographs the aircraft with a visible and infrared camera which are processed using a photogrammetry software package called Pix4D that converts them into a 3D model. Scanning the aircraft is the first phase of documenting the aircraft demolition as well as an opportunity to train pilots to operate the Pix4D software.
The drone follows an autonomously defined path around the modified C-141 Kuiper Airborne Observatory, (KAO) (NASA-714), on the N211 apron. The drone photographs the aircraft with a visible and infrared camera which are processed using a photogrammetry software package called Pix4D that converts them into a 3D model. Scanning the aircraft is the first phase of documenting the aircraft demolition as well as an opportunity to train pilots to operate the Pix4D software.

The drone follows an autonomously defined path around the modified C-141 Kuiper Airborne Observatory, (KAO) (NASA-714), on the N211 apron. The drone photographs the aircraft with a visible and infrared camera which are processed using a photogrammetry software package called Pix4D that converts them into a 3D model. Scanning the aircraft is the first phase of documenting the aircraft demolition as well as an opportunity to train pilots to operate the Pix4D software.
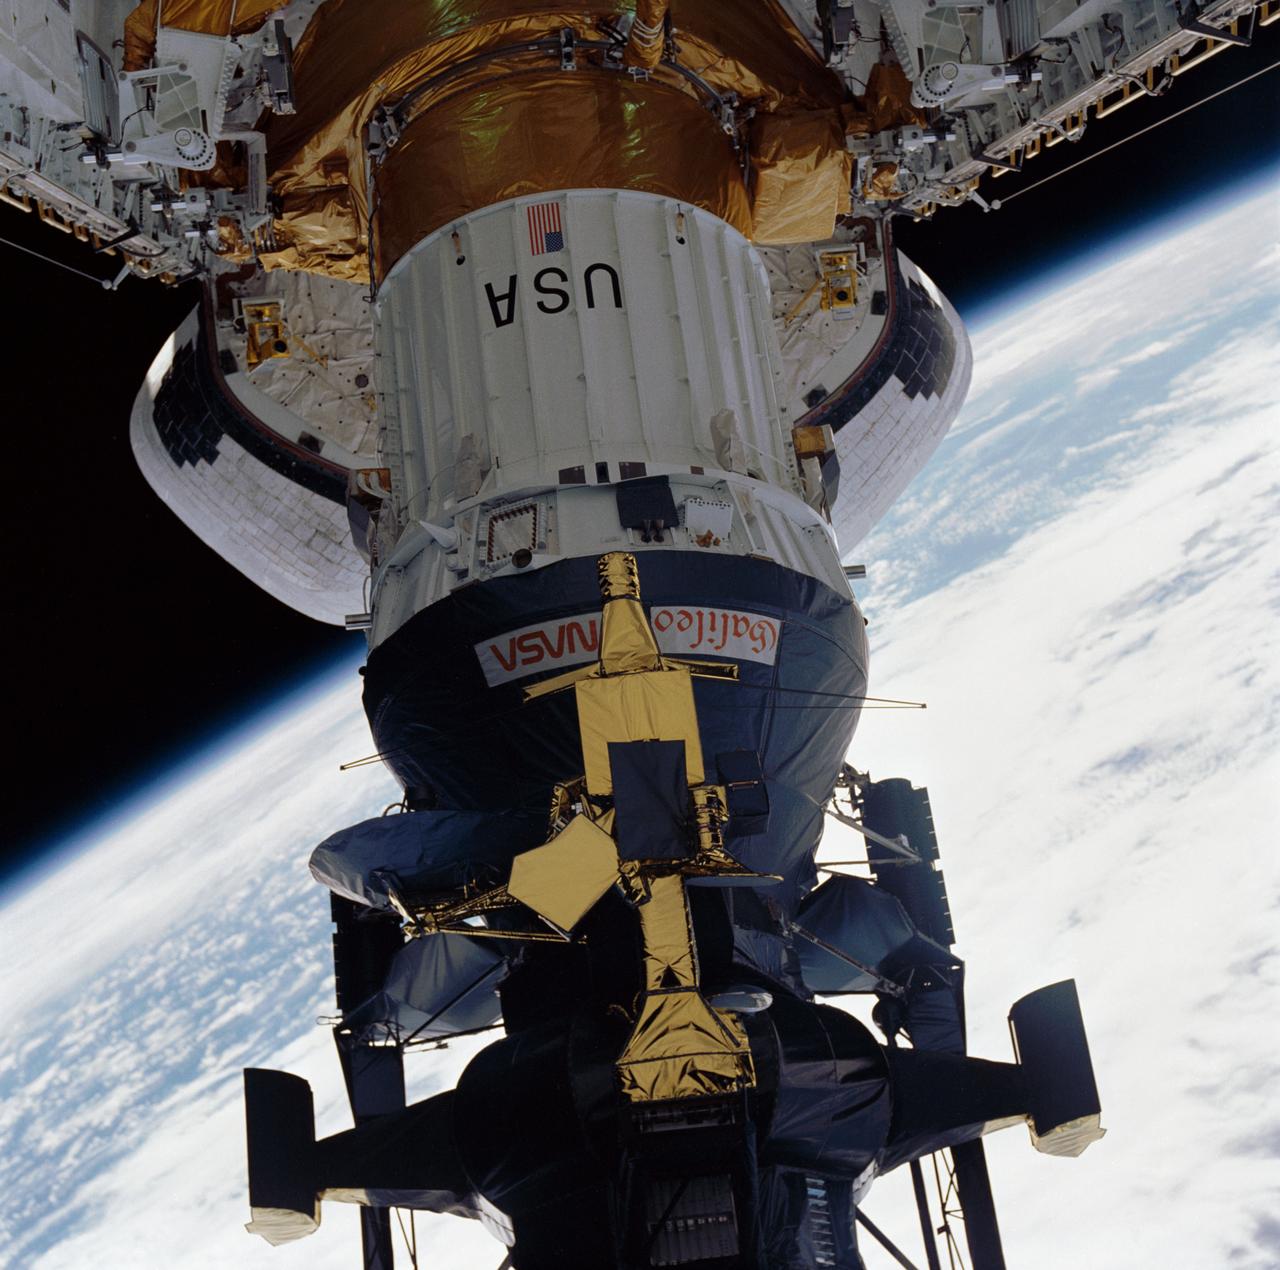
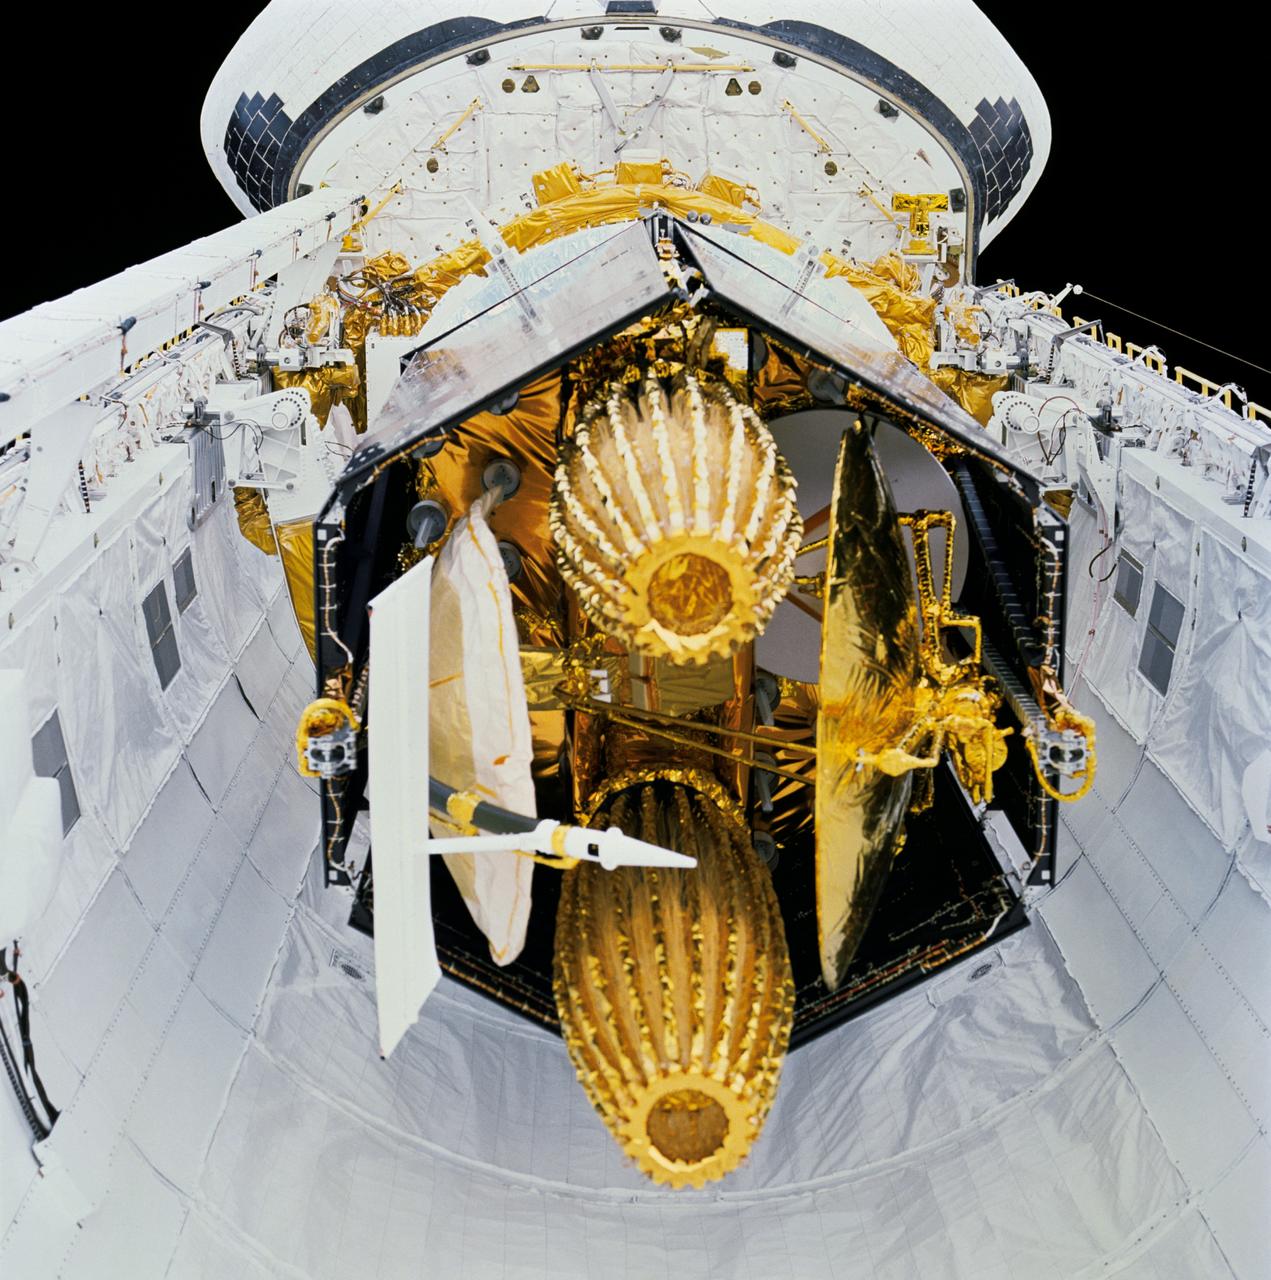
During STS-34 mission, the Galileo spacecraft mounted atop the inertial upper stage (IUS) is tilted to a 58-degree deployment position by the airborne support equipment (ASE) aft frame tilt actuator (AFTA) table in Atlantis', Orbiter Vehicle (OV) 104's, payload bay (PLB). Visible in the foreground is the ASE forward cradle and the umbilical boom which has fallen away from the IUS. OV-104's orbital maneuvering system (OMS) pods and the Earth's limb appear in the background.

The drone follows an autonomously defined path around the modified C-141 Kuiper Airborne Observatory, (KAO) (NASA-714), on the N211 apron. The drone photographs the aircraft with a visible and infrared camera which are processed using a photogrammetry software package called Pix4D that converts them into a 3D model. Scanning the aircraft is the first phase of documenting the aircraft demolition as well as an opportunity to train pilots to operate the Pix4D software.

The drone follows an autonomously defined path around the modified C-141 Kuiper Airborne Observatory, (KAO) (NASA-714), on the N211 apron. The drone photographs the aircraft with a visible and infrared camera which are processed using a photogrammetry software package called Pix4D that converts them into a 3D model. Scanning the aircraft is the first phase of documenting the aircraft demolition as well as an opportunity to train pilots to operate the Pix4D software.
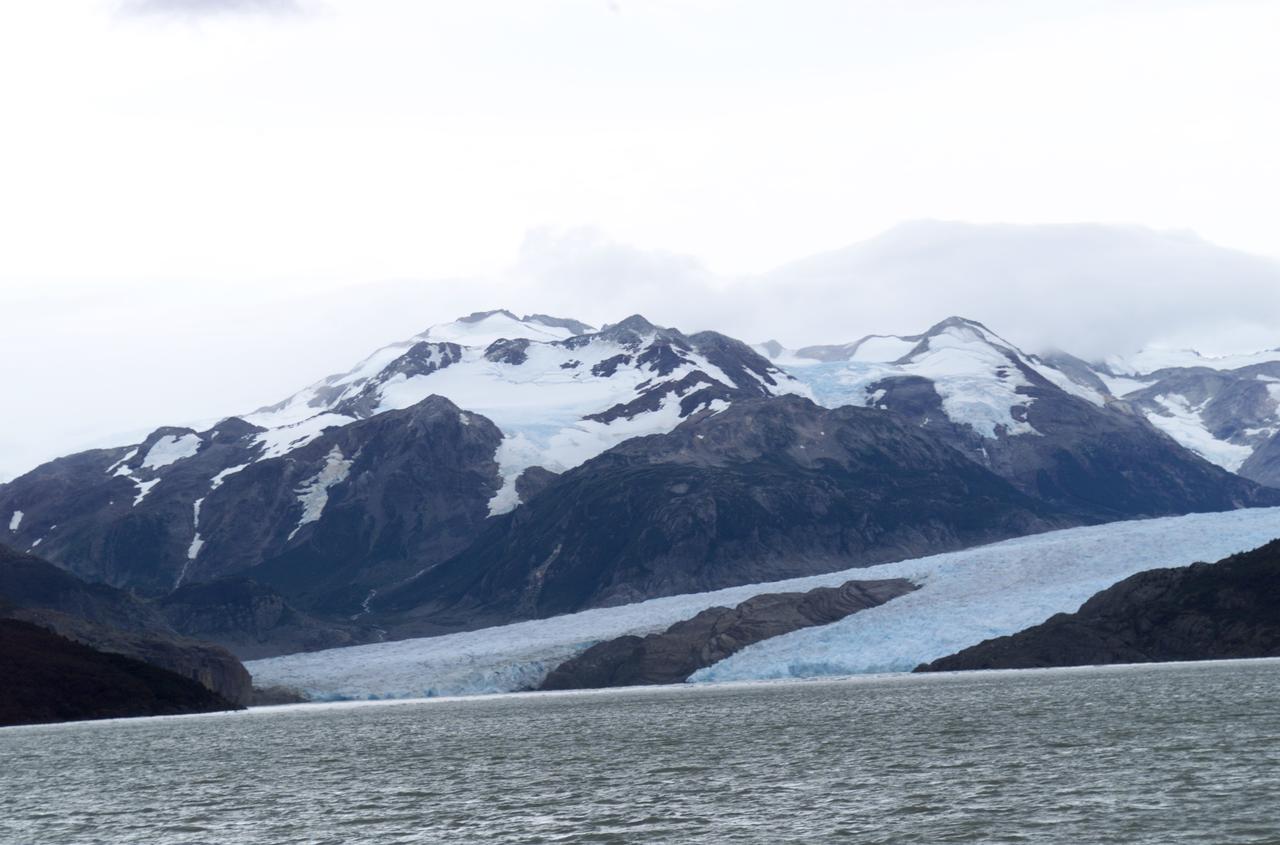
Glacier Grey view from Lago Grey (Grey Lake), photographed during NASA's AirSAR 2004 campaign in Chile. Land visible in this photo was covered by glacier just 6 years earlier. AirSAR 2004 is a three-week expedition in Central and South America by an international team of scientists that is using an all-weather imaging tool, called the Airborne Synthetic Aperture Radar (AirSAR), located onboard NASA's DC-8 airborne laboratory. Scientists from many parts of the world are combining ground research with NASA's AirSAR technology to improve and expand on the quality of research they are able to conduct. Founded in 1959, Torres del Paine National Park encompasses 450,000 acres in the Patagonia region of Chile. This region is being studied by NASA using a DC-8 equipped with an Airborne Synthetic Aperture Radar (AirSAR) developed by scientists from NASA’s Jet Propulsion Laboratory. This is a very sensitive region that is important to scientists because the temperature has been consistently rising causing a subsequent melting of the region’s glaciers. AirSAR will provide a baseline model and unprecedented mapping of the region. This data will make it possible to determine whether the warming trend is slowing, continuing or accelerating. AirSAR will also provide reliable information on ice shelf thickness to measure the contribution of the glaciers to sea level.
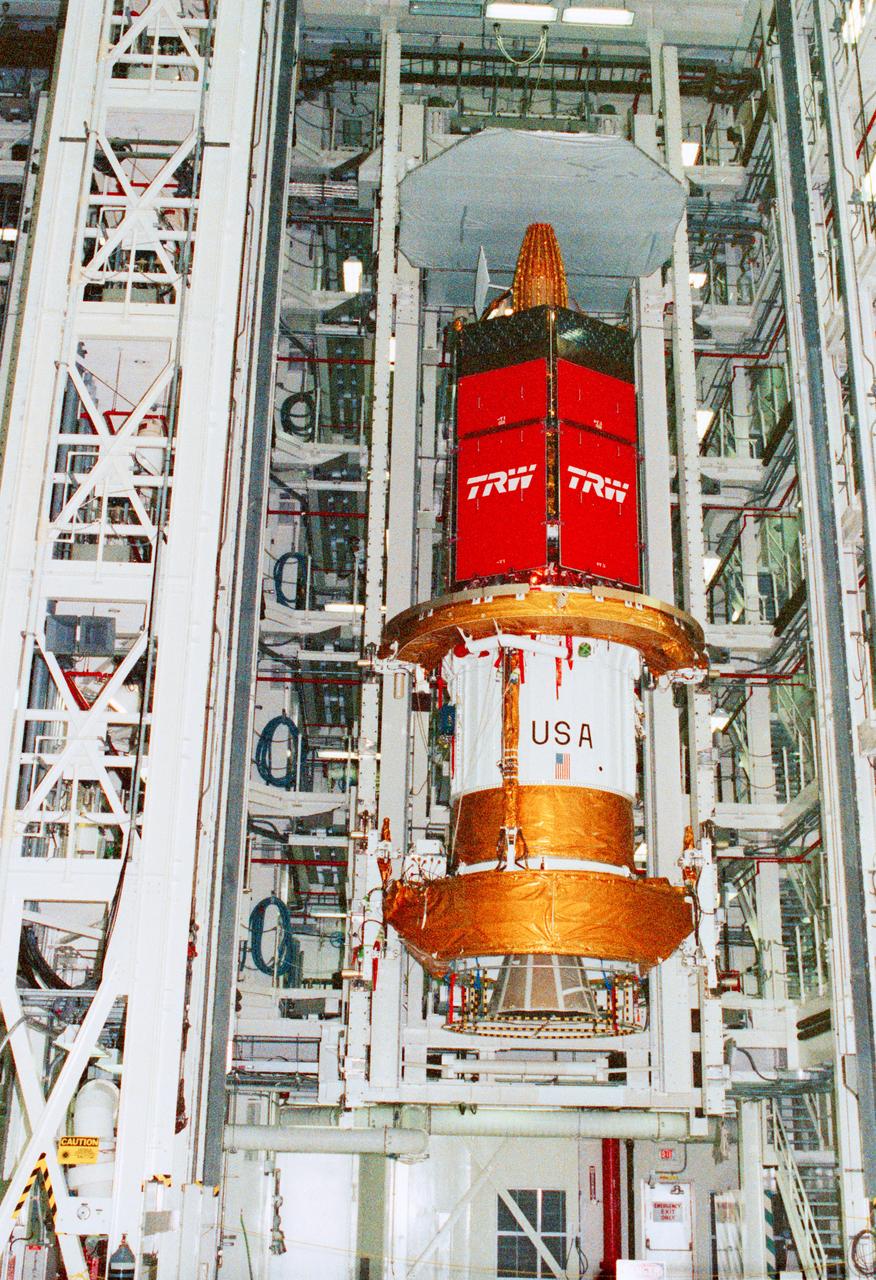
STS-43 Tracking and Data Relay Satellite E (TDRS-E) undergoes preflight processing in the Kennedy Space Center's (KSC's) Vertical Processing Facility (VPF) before being loaded into a payload canister for transfer to the launch pad and eventually into Atlantis', Orbiter Vehicle (OV) 104's, payload bay (PLB). This side of the TDRS-E will rest at the bottom of the PLB therefore the airborne support equipment (ASE) forward frame keel pin (at center of spacecraft) and the umbilical boom running between the two ASE frames are visible. The solar array panels are covered with protective TRW shields. Above the shields the stowed antenna and solar sail are visible. The inertial upper stage (IUS) booster is the white portion of the spacecraft and rests in the ASE forward frame and ASE aft frame tilt actuator (AFTA) frame (at the bottom of the IUS). The IUS booster nozzle extends beyond the AFTA frame. View provided by KSC with alternate number KSC-91PC-1079.
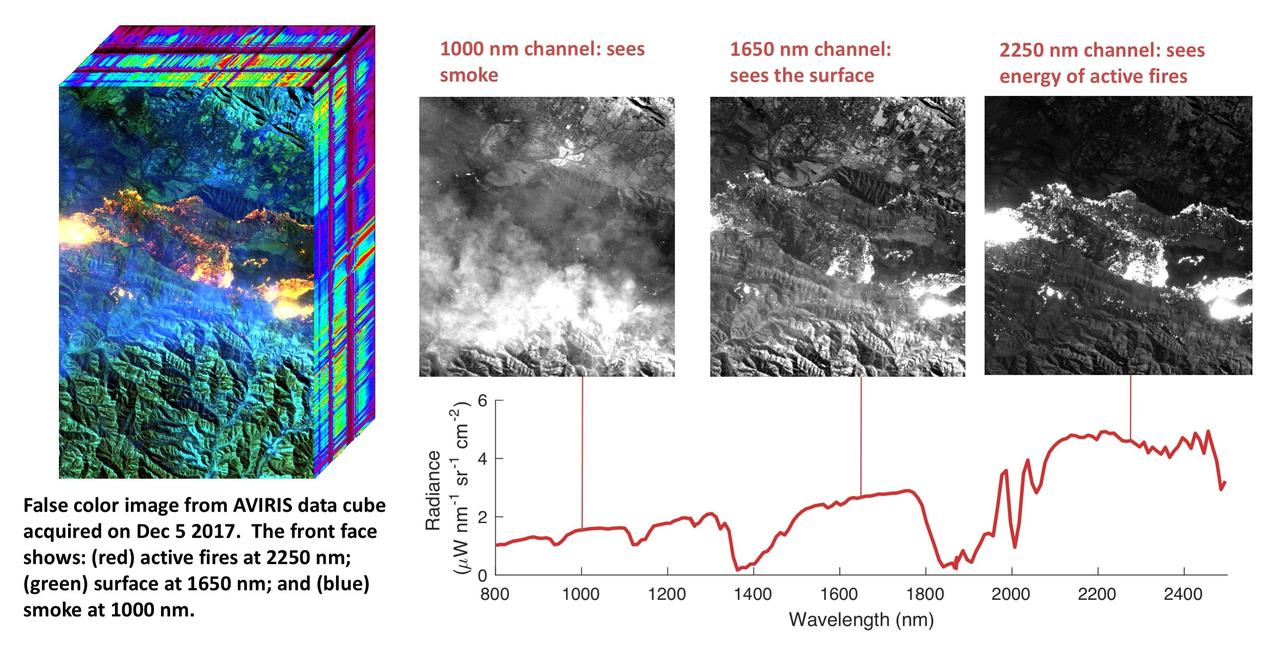
NASA's Airborne Visible Infrared Imaging Spectrometer instrument (AVIRIS), flying aboard a NASA Armstrong Flight Research Center high-altitude ER-2 aircraft, flew over the wildfires burning in Southern California on Dec. 5, 2017 and acquired this false-color image. Active fires are visible in red, ground surfaces are in green and smoke is in blue. AVIRIS is an imaging spectrometer that observes light in visible and infrared wavelengths, measuring the full spectrum of radiated energy. Unlike regular cameras with three colors, AVIRIS has 224 spectral channels from the visible through the shortwave infrared. This permits mapping of fire temperatures, fractional coverage, and surface properties, including how much fuel is available for a fire. Spectroscopy is also valuable for characterizing forest drought conditions and health to assess fire risk. AVIRIS has been observing fire-prone areas in Southern California for many years, forming a growing time series of before/after data cubes. These data are helping improve scientific understanding of fire risk and how ecosystems respond to drought and fire. https://photojournal.jpl.nasa.gov/catalog/PIA11243
During STS-26, inertial upper stage (IUS) with the tracking and data relay satellite C (TDRS-C) drifts above Discovery, Orbiter Vehicle (OV) 103, payload bay (PLB) after being positioned in deployment attitude (an angle of 50 degrees) by the airborne support equipment (ASE). IUS vacates the ASE aft frame tilt actuator (AFTA) table in the PLB while the disconnected ASE umbilical boom floats above ASE forward cradle. IUS first stage rocket motor and nozzle and the interstage are visible as the IUS is deployed. In the background are the orbital maneuvering system (OMS) pods and the Earth's limb.

During STS-26, inertial upper stage (IUS) with the tracking and data relay satellite C (TDRS-C) located in the payload bay (PLB) of Discovery, Orbiter Vehicle (OV) 103, is raised into deployment attitude (an angle of 50 degrees) by the airborne support equipment (ASE). ASE aft frame tilt actuator (AFTA) table supports the IUS as it is positioned in the PLB and the ASE umbilical boom drifts away from IUS toward ASE forward cradle. TDRS-C solar array panels (in stowed configuration) are visible on top of the IUS. In the background are the orbital maneuvering system (OMS) pods and the Earth's limb.

During STS-26, inertial upper stage (IUS) with tracking and data relay satellite C (TDRS-C) located in the payload bay (PLB) of Discovery, Orbiter Vehicle (OV) 103, is positioned into its proper deployment attitude (an angle of 50 degrees) by the airborne support equipment (ASE). In the foreground, the ASE forward cradle is visible. The IUS is mounted in the ASE aft frame tilt actuator (AFTA) table. TDRS-C components in stowed configuration include solar array panels, TDRS single access #1 and #2, TDRS SGL, and S-Band omni antenna. In the background are the orbital maneuvering system (OMS) pods, the Earth's cloud-covered surface, and the Earth's limb.
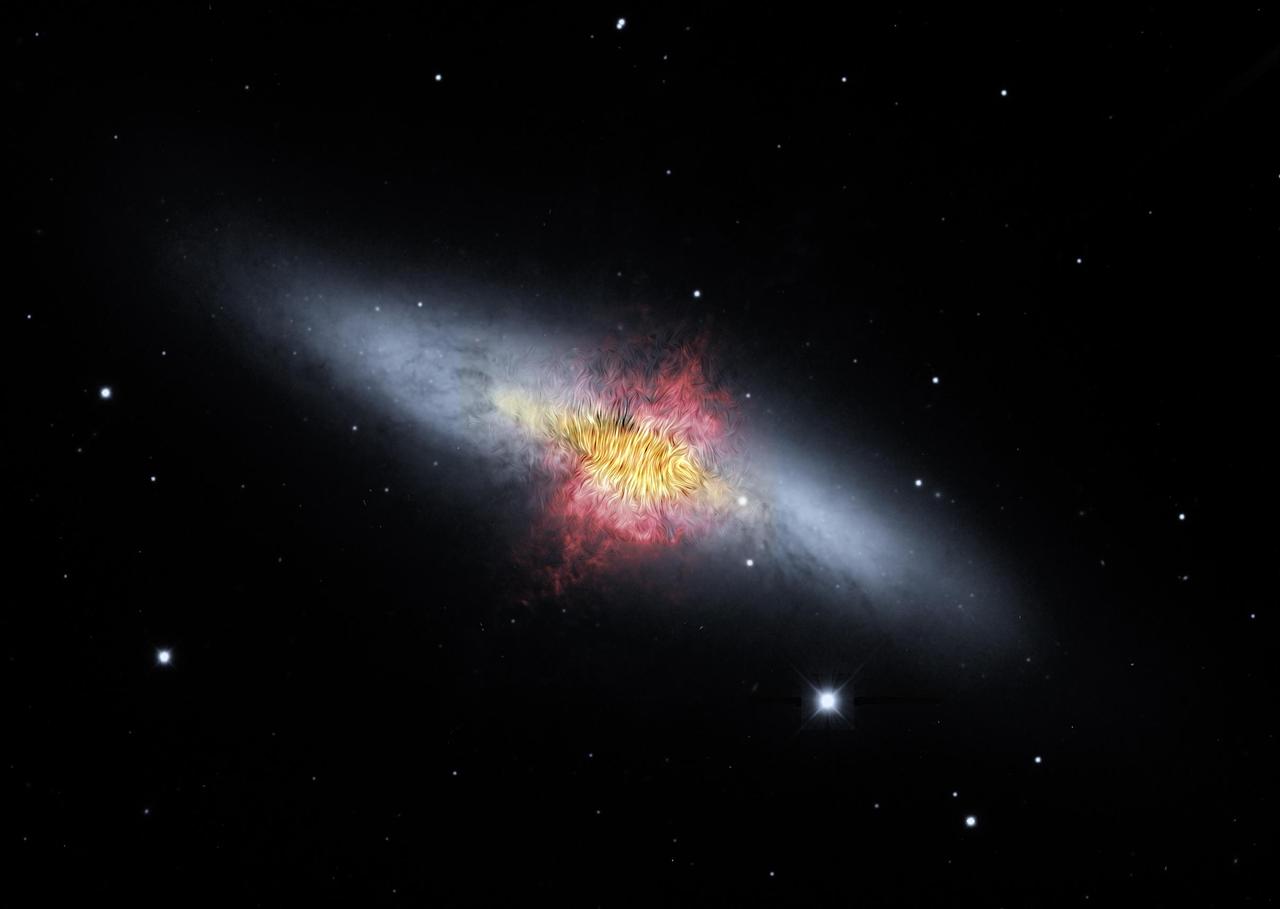
A composite image of the Cigar Galaxy (also called M82), a starburst galaxy about 12 million light-years away in the constellation Ursa Major. The magnetic field detected by the High-resolution Airborne Wideband Camera-Plus instrument (known as HAWC+) on SOFIA (the Stratospheric Observatory for Infrared Astronomy), shown as streamlines, appears to follow the bipolar outflows (red) generated by the intense nuclear starburst. The image combines visible starlight (gray) and a tracing of hydrogen gas (red) observed from the Kitt Peak Observatory, with near-infrared and mid-infrared starlight and dust (yellow) observed by SOFIA and the Spitzer Space Telescope. https://photojournal.jpl.nasa.gov/catalog/PIA23010
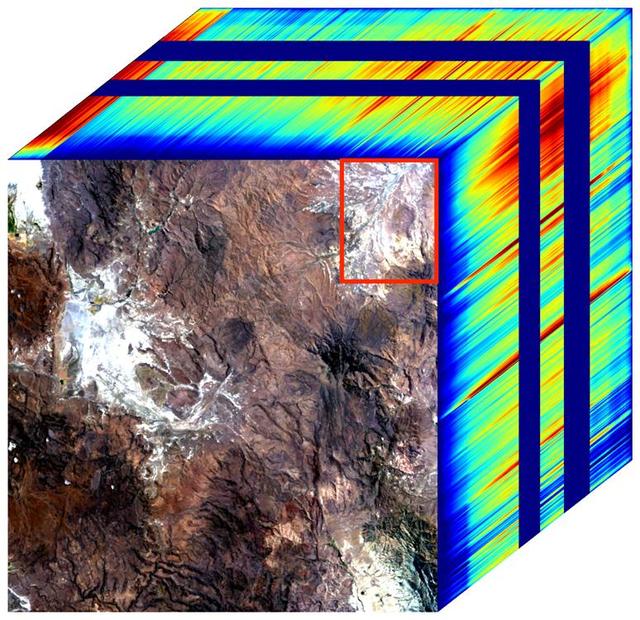
The front panel of this image cube shows the true-color view of an area in northwest Nevada observed by NASA's Earth Surface Mineral Dust Source Investigation (EMIT) imaging spectrometer. The side panels depict the spectral fingerprint for every point in the image, which shows an area about 130 miles (209 kilometers) northeast of Lake Tahoe. The instrument works by measuring reflected solar energy from Earth across hundreds of wavelengths from the visible to the infrared range of the spectrum. The intensity of the reflected light varies by wavelength based on the material. Scientists are using these patterns, called spectral fingerprints, to identify surface minerals and pinpoint their locations on a map. The cube was among the first created by EMIT scientists as they confirmed that the instrument was collecting data accurately before the start of science operations. Analysis of the patterns indicate areas dominated by kaolinite, a light-colored clay mineral. When dust from the kaolinite-dominated areas is lofted into the atmosphere, the particles tend to scatter sunlight and reflect it back to space, cooling the air. Over the course of its 12-month mission, EMIT will collect measurements of 10 important surface minerals – kaolinite, hematite, goethite, illite, vermiculite, calcite, dolomite, montmorillonite, chlorite, and gypsum – in arid regions between 50-degree south and north latitudes in Africa, Asia, North and South America, and Australia. The data EMIT collects will help scientists better understand the role of airborne dust particles in heating and cooling Earth's atmosphere on global and regional scales. Since EMIT was installed on the International Space Station in late July 2022, the science team has been validating the data it collects against data gathered in 2018 by the Airborne Visible/Infrared Imaging Spectrometer (AVIRIS). EMIT and AVIRIS were developed at NASA's Jet Propulsion Laboratory, which is managed for the agency by Caltech in Pasadena, California. https://photojournal.jpl.nasa.gov/catalog/PIA25427
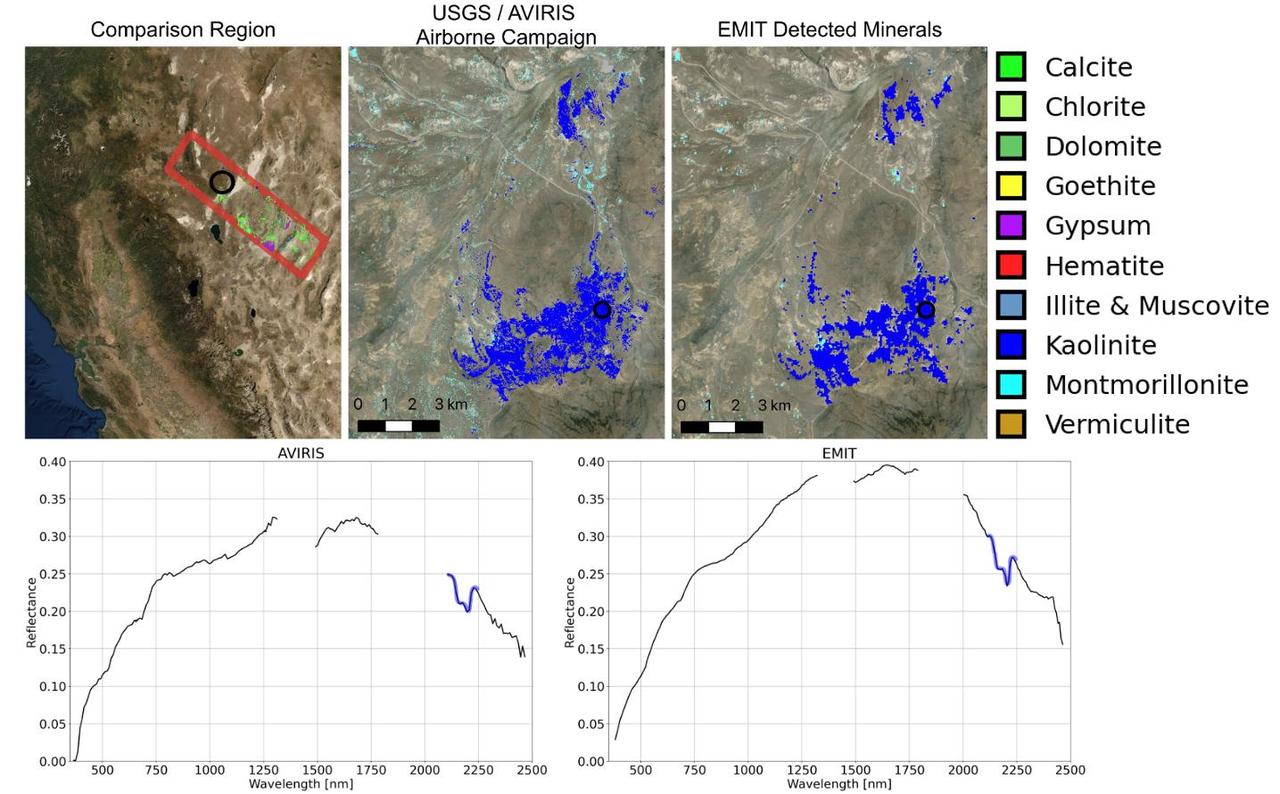
Since NASA's Earth Surface Mineral Dust Source Investigation (EMIT) imaging spectrometer was installed on the International Space Station in late July 2022, the EMIT science team has been validating its data against data gathered in 2018 by NASA's Airborne Visible/Infrared Imaging Spectrometer (AVIRIS). EMIT recently collected data from a mountainous area of Nevada about 130 miles (209 kilometers) northeast of Lake Tahoe. The instrument measures reflected solar energy from Earth across hundreds of wavelengths from the visible to the infrared range of the spectrum. The intensity of the reflected light varies by wavelength based on the material. Scientists use these patterns, called spectral fingerprints, to pinpoint the locations of surface minerals on a map. The top left map shows the region both the EMIT and AVIRIS data sets cover. The center image is a mineral map featuring AVIRIS data. At right is a map generated with EMIT data. The center and right images reveal portions of the landscape dominated by kaolinite, a light-colored clay mineral that scatters sunlight. This comparison, which shows a close match of the data, was one of many that confirmed the accuracy of EMIT's data. The bottom row features an AVIRIS spectral fingerprint, left, beside EMIT data for the same location. The graphs show agreement in the kaolinite fingerprint region, which is marked in blue. Over the course of its 12-month mission, EMIT will collect measurements of 10 important surface minerals – kaolinite, hematite, goethite, illite, vermiculite, calcite, dolomite, montmorillonite, chlorite, and gypsum – in arid regions between 50-degree south and north latitudes in Africa, Asia, North and South America, and Australia. The data EMIT collects will help scientists better understand the role of airborne dust particles in heating and cooling Earth's atmosphere on global and regional scales. https://photojournal.jpl.nasa.gov/catalog/PIA25428
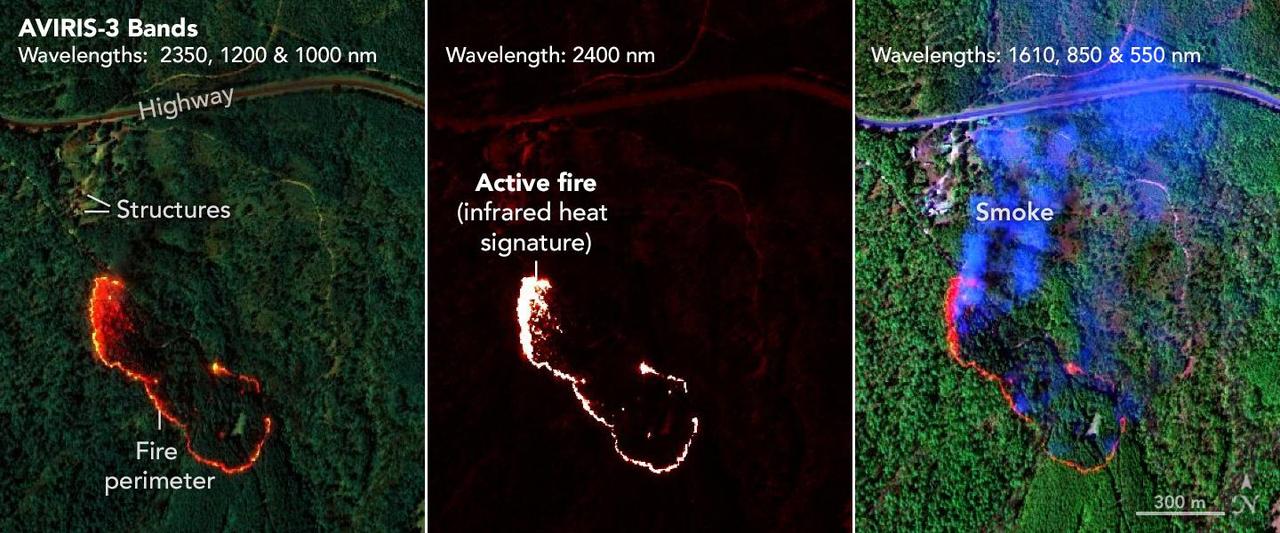
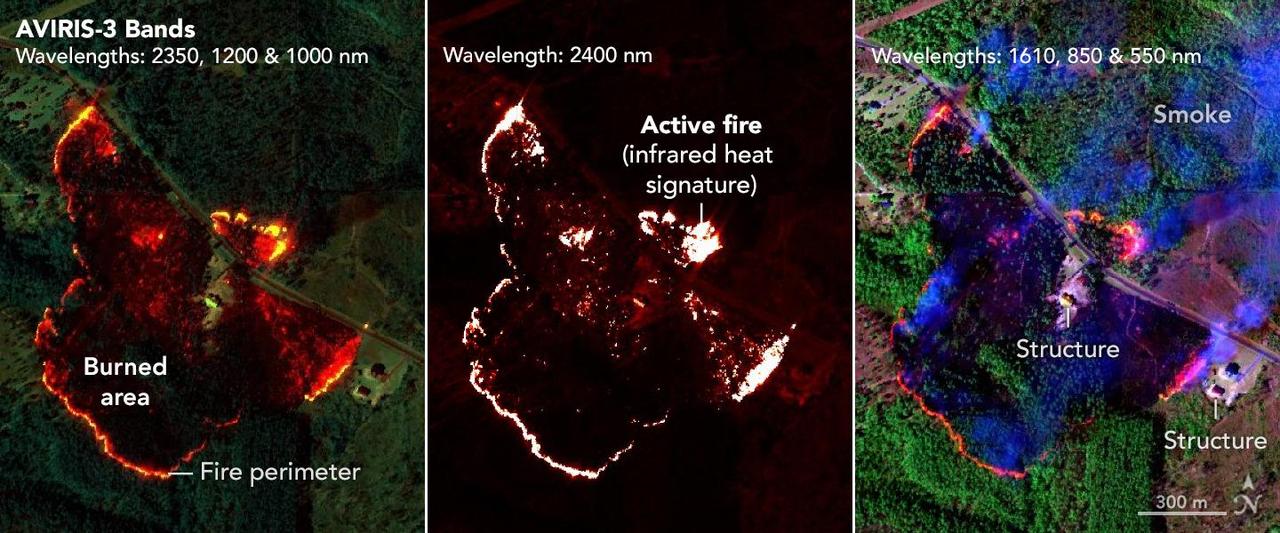
NASA's AVIRIS-3 sensor, an airborne imaging spectrometer built and operated by the agency's Jet Propulsion Laboratory in Southern California, captured infrared data on a wildfire about 3 miles (5 kilometers) west of the town of Mount Vernon, Alabama, on March 21, 2025. Within minutes of flying over, real-time maps of the fire were sent via satellite internet to firefighters with the Alabama Forestry Commission, who used it to contain the fire, preventing it from reaching four buildings. The first image in the series combines reflection data from AVIRIS-3 (Airborne Visible Infrared Imaging Spectrometer 3) at three infrared wavelengths that are invisible to the human eye – 2,350 nanometers, 1,200 nanometers, and 1,000 nanometers. In the resulting composite image, the colors indicate where the fire was burning most intensely. Orange and red areas show cooler-burning areas, while yellow indicates the most intense flames. Burned areas show up as dark red or brown. The second image in the series looks solely at the 2,400 nanometers wavelength. This wavelength is particularly useful for seeing hot spots and the perimeters of fires, which show brightly against a red background. The third image in the series combines light at 1,610 nanometers, 850 nanometers, and 550 nanometers. This view shows burn areas and smoke. The AVIRIS-3 sensor belongs to a line of imaging spectrometers built at JPL since 1986. The instruments have been used to study a wide range of phenomena – including fire – by measuring sunlight reflecting from the planet's surface. Data from imaging spectrometers like AVIRIS-3 typically takes days or weeks to be processed into highly detailed, multilayer image products used for research. By simplifying the calibration algorithms, researchers were able to process data on a computer aboard the plane in a sliver of the time it otherwise would have taken, and airborne satellite internet connectivity enabled the images to be distributed almost immediately, while the plane was still in flight, rather than after it landed. Flying about 9,000 feet (3,000 meters) in altitude aboard a NASA King Air B200 research plane, AVIRIS-3 collected data on the Castleberry Fire while preparing for prescribed burn experiments that took place in the Geneva State Forest in Alabama on March 28 and at Fort Stewart-Hunter Army Airfield in Georgia from April 14 to 20. The burns were part of a NASA 2025 FireSense Airborne Campaign. https://photojournal.jpl.nasa.gov/catalog/PIA26499
NASA's AVIRIS-3 sensor, an airborne imaging spectrometer built and operated by the agency's Jet Propulsion Laboratory in Southern California, captured infrared data of a wildfire 4 miles (2.5 kilometers) southwest of the unincorporated community of Perdido, Alabama, on March 21, 2025. Within minutes of flying over, real-time maps of the fire were sent via satellite internet to firefighters with the Alabama Forestry Commission, who used it to contain the fire, preventing it from reaching six buildings. The first image in the series combines reflection data from AVIRIS-3 (Airborne Visible Infrared Imaging Spectrometer 3) at three infrared wavelengths that are invisible to the human eye – 2,350 nanometers, 1,200 nanometers, and 1,000 nanometers. In the resulting composite image, the colors indicate where the fire was burning most intensely. Orange and red areas show cooler-burning areas, while yellow indicates the most intense flames. Burned areas show up as dark red or brown. The second image in the series looks solely at the 2,400 nanometers wavelength. The images are particularly useful for seeing hot spots and the perimeters of fires, which show brightly against a red background. The third image in the series combines light at 1,610 nanometers, 850 nanometers, and 550 nanometers. This view shows burn areas and smoke. The AVIRIS-3 sensor belongs to a line of imaging spectrometers built at JPL since 1986. The instruments have been used to study a wide range of phenomena – including fire – by measuring sunlight reflecting from the planet's surface. Data from imaging spectrometers like AVIRIS-3 typically takes days or weeks to be processed into highly detailed, multilayer image products used for research. By simplifying the calibration algorithms, researchers were able to process data on a computer aboard the plane in a sliver of the time it otherwise would have taken, and airborne satellite internet connectivity enabled the images to be distributed almost immediately, while the plane was still in flight, rather than after it landed. Flying about 9,000 feet (3,000 meters) in altitude aboard a NASA King Air B200 research plane, AVIRIS-3 collected data on the Castleberry Fire while preparing for prescribed burn experiments that took place in the Geneva State Forest in Alabama on March 28 and at Fort Stewart-Hunter Army Airfield in Georgia from April 14 to 20. The burns were part of a NASA 2025 FireSense Airborne Campaign. https://photojournal.jpl.nasa.gov/catalog/PIA26498
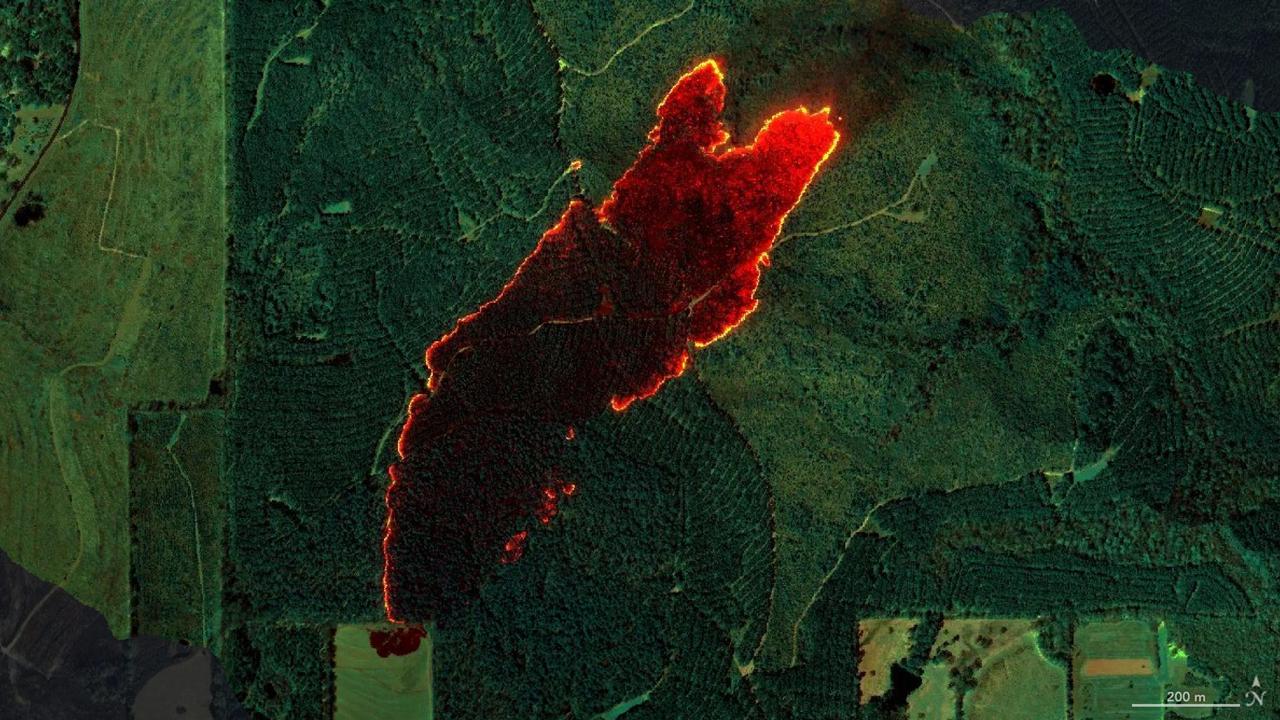
NASA's AVIRIS-3 sensor, an airborne imaging spectrometer built and operated by the agency's Jet Propulsion Laboratory in Southern California, captured infrared data of a roughly 120-acre wildfire about 3 miles (5 kilometers) east of the town of Castleberry, Alabama, on March 19, 2025. Within minutes of flying over the Castleberry Fire, which had not previously been reported to authorities, real-time maps of where burning was most intense were sent via satellite internet to firefighters with the Alabama Forestry Commission, who used it to decide how to deploy their personnel and firefighting equipment. The image combines reflection data from AVIRIS-3 (Airborne Visible Infrared Imaging Spectrometer 3) at three infrared wavelengths that are invisible to the human eye: 2,350 nanometers, 1,200 nanometers, and 1,000 nanometers. In the resulting composite image, the colors indicate where the fire was burning most intensely. Orange and red areas show cooler-burning areas, while yellow indicates the most intense flames. Burned areas show up as dark red or brown. The AVIRIS-3 sensor belongs to a line of imaging spectrometers built at JPL since 1986. The instruments have been used to study a wide range of phenomena – including fire – by measuring sunlight reflecting from the planet's surface. Data from imaging spectrometers like AVIRIS-3 typically takes days or weeks to be processed into highly detailed, multilayer image products used for research. By simplifying the calibration algorithms, researchers were able to process data on a computer aboard the plane in a sliver of the time it otherwise would have taken, and airborne satellite internet connectivity enabled the images to be distributed almost immediately, while the plane was still in flight, rather than after it landed. Flying about 9,000 feet (3,000 meters) in altitude aboard a NASA King Air B200 research plane, AVIRIS-3 collected data on the Castleberry Fire while preparing for prescribed burn experiments that took place in the Geneva State Forest in Alabama on March 28 and at Fort Stewart-Hunter Army Airfield in Georgia from April 14 to 20. The burns were part of a NASA 2025 FireSense Airborne Campaign. https://photojournal.jpl.nasa.gov/catalog/PIA26497
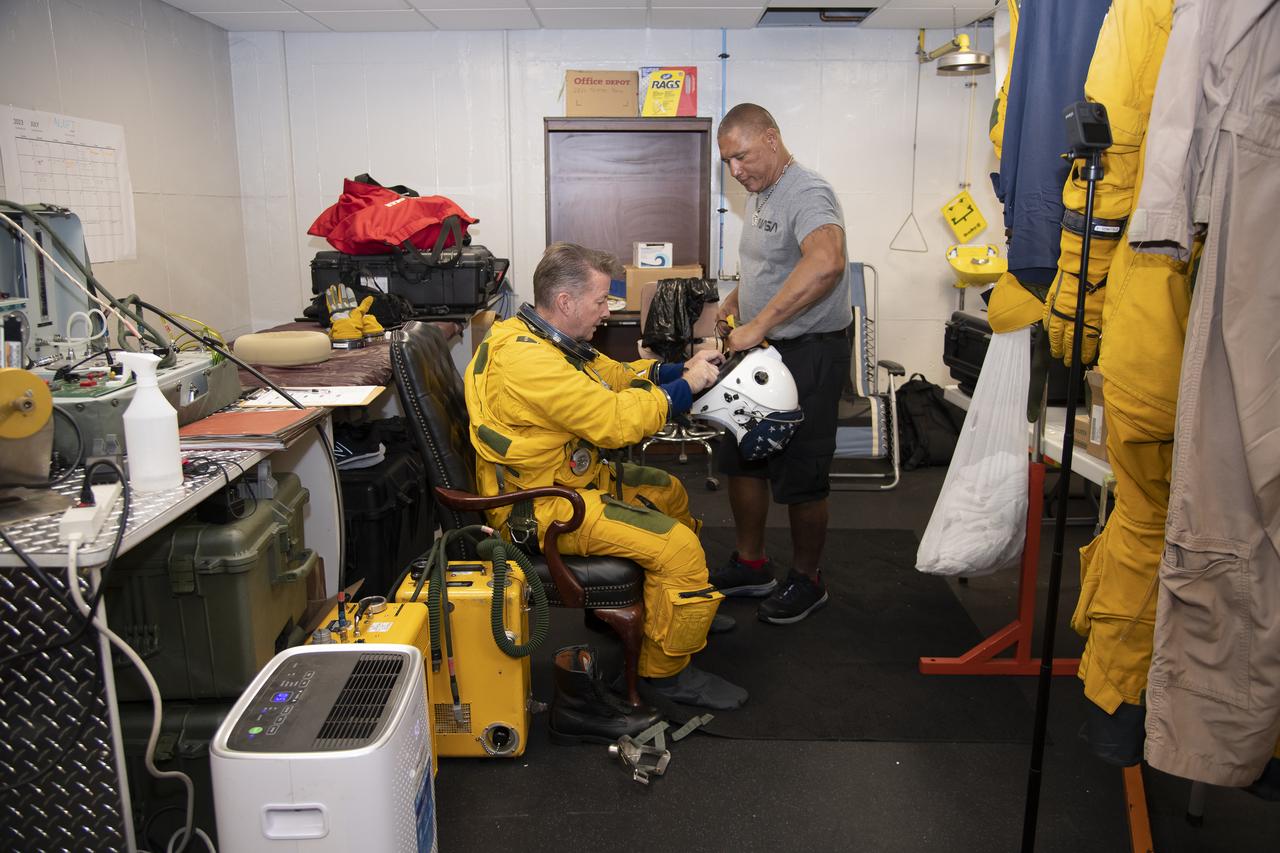
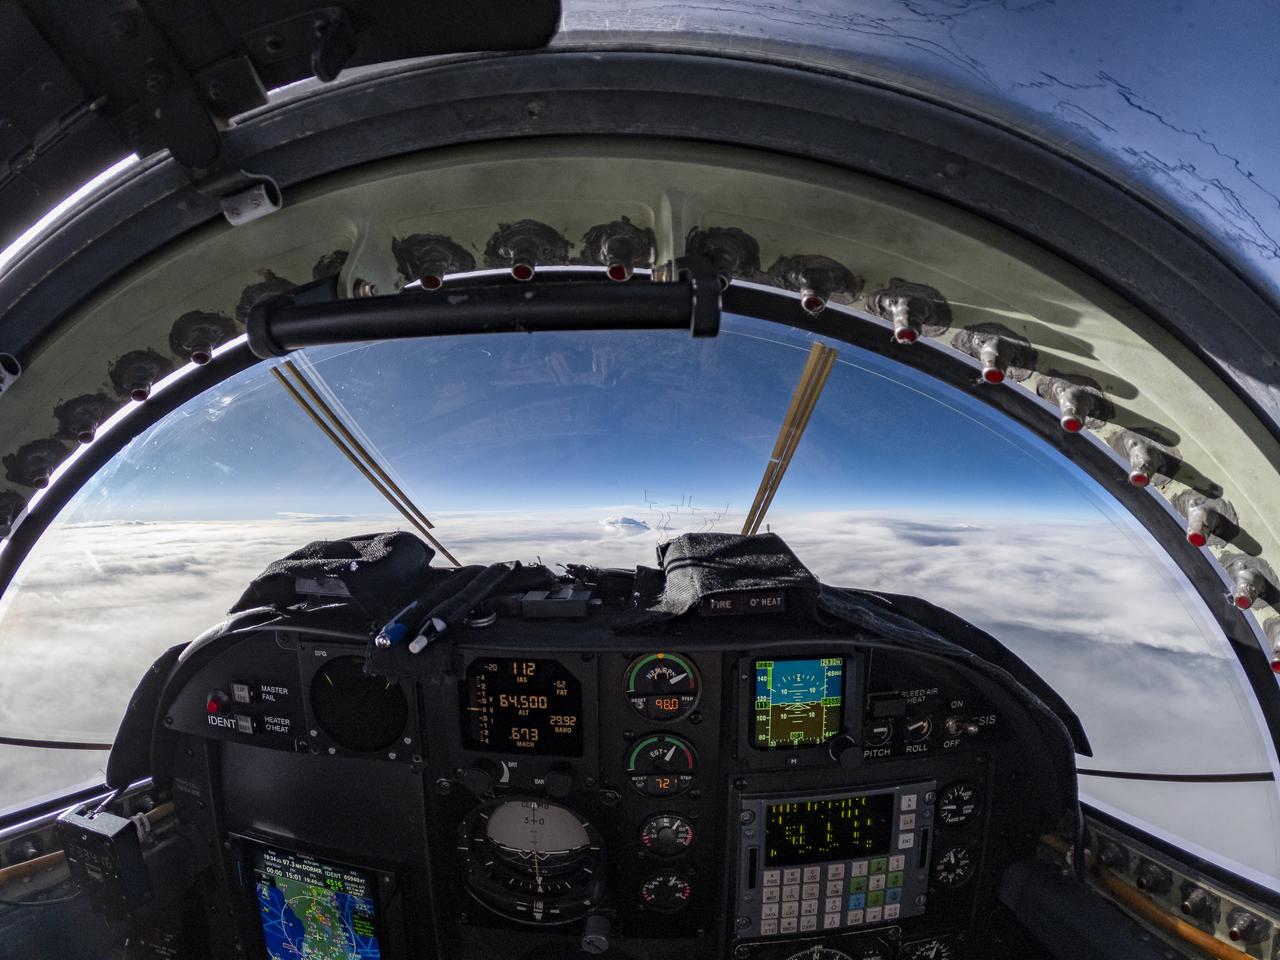
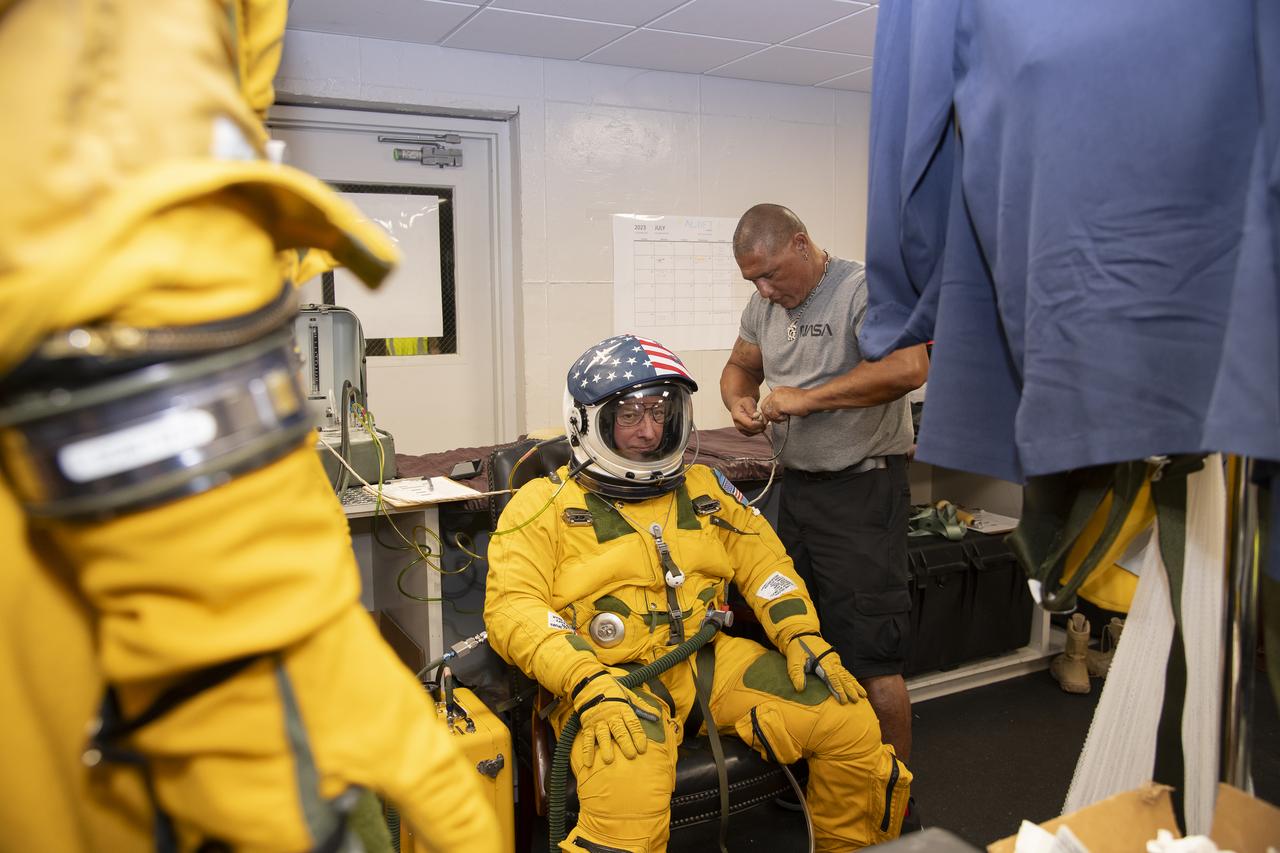
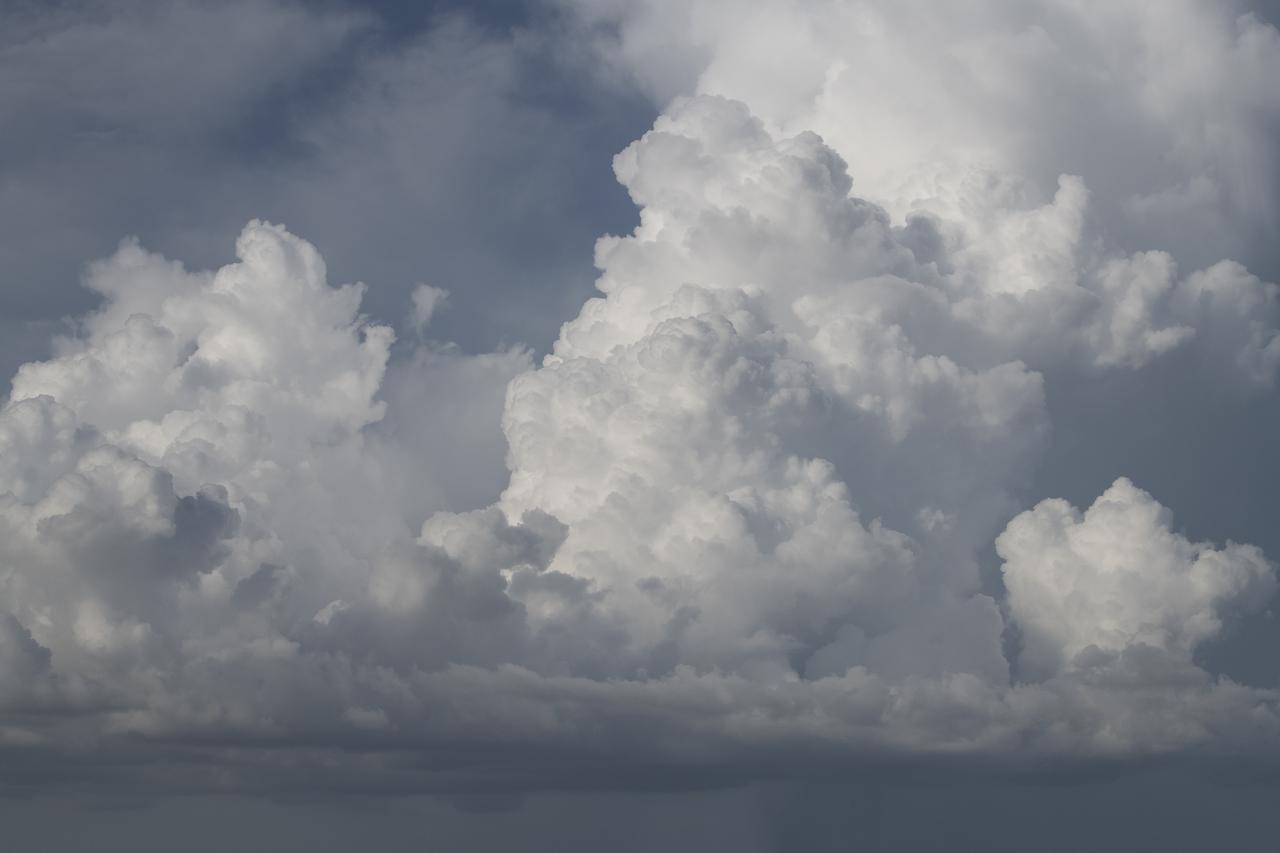
The ALOFT mission, Airborne Lightning Observatory for Fly’s eye simulator and Terrestrial gamma ray flashes, is a collaboration between NASA and the University of Bergen, Norway. NASA Armstrong Flight Research Center’s ER-2 aircraft flies just above the height of thunderclouds over the Floridian and Caribbean coastlines to collect data about lightning glows and terrestrial gamma ray flashes. Scientists expect to collect more accurate data than ever before that can advance the study of high-energy radiation emissions from thunderstorms.
The ALOFT mission, Airborne Lightning Observatory for Fly’s eye simulator and Terrestrial gamma ray flashes, is a collaboration between NASA and the University of Bergen, Norway. NASA Armstrong Flight Research Center’s ER-2 aircraft flies just above the height of thunderclouds over the Floridian and Caribbean coastlines to collect data about lightning glows and terrestrial gamma ray flashes. Scientists expect to collect more accurate data than ever before that can advance the study of high-energy radiation emissions from thunderstorms.

The ALOFT mission, Airborne Lightning Observatory for Fly’s eye simulator and Terrestrial gamma ray flashes, is a collaboration between NASA and the University of Bergen, Norway. NASA Armstrong Flight Research Center’s ER-2 aircraft flies just above the height of thunderclouds over the Floridian and Caribbean coastlines to collect data about lightning glows and terrestrial gamma ray flashes. Scientists expect to collect more accurate data than ever before that can advance the study of high-energy radiation emissions from thunderstorms.

The ALOFT mission, Airborne Lightning Observatory for Fly’s eye simulator and Terrestrial gamma ray flashes, is a collaboration between NASA and the University of Bergen, Norway. NASA Armstrong Flight Research Center’s ER-2 aircraft flies just above the height of thunderclouds over the Floridian and Caribbean coastlines to collect data about lightning glows and terrestrial gamma ray flashes. Scientists expect to collect more accurate data than ever before that can advance the study of high-energy radiation emissions from thunderstorms.

The ALOFT mission, Airborne Lightning Observatory for Fly’s eye simulator and Terrestrial gamma ray flashes, is a collaboration between NASA and the University of Bergen, Norway. NASA Armstrong Flight Research Center’s ER-2 aircraft flies just above the height of thunderclouds over the Floridian and Caribbean coastlines to collect data about lightning glows and terrestrial gamma ray flashes. Scientists expect to collect more accurate data than ever before that can advance the study of high-energy radiation emissions from thunderstorms.

The ALOFT mission, Airborne Lightning Observatory for Fly’s eye simulator and Terrestrial gamma ray flashes, is a collaboration between NASA and the University of Bergen, Norway. NASA Armstrong Flight Research Center’s ER-2 aircraft flies just above the height of thunderclouds over the Floridian and Caribbean coastlines to collect data about lightning glows and terrestrial gamma ray flashes. Scientists expect to collect more accurate data than ever before that can advance the study of high-energy radiation emissions from thunderstorms.
The ALOFT mission, Airborne Lightning Observatory for Fly’s eye simulator and Terrestrial gamma ray flashes, is a collaboration between NASA and the University of Bergen, Norway. NASA Armstrong Flight Research Center’s ER-2 aircraft flies just above the height of thunderclouds over the Floridian and Caribbean coastlines to collect data about lightning glows and terrestrial gamma ray flashes. Scientists expect to collect more accurate data than ever before that can advance the study of high-energy radiation emissions from thunderstorms.
The ALOFT mission, Airborne Lightning Observatory for Fly’s eye simulator and Terrestrial gamma ray flashes, is a collaboration between NASA and the University of Bergen, Norway. NASA Armstrong Flight Research Center’s ER-2 aircraft flies just above the height of thunderclouds over the Floridian and Caribbean coastlines to collect data about lightning glows and terrestrial gamma ray flashes. Scientists expect to collect more accurate data than ever before that can advance the study of high-energy radiation emissions from thunderstorms.
The ALOFT mission, Airborne Lightning Observatory for Fly’s eye simulator and Terrestrial gamma ray flashes, is a collaboration between NASA and the University of Bergen, Norway. NASA Armstrong Flight Research Center’s ER-2 aircraft flies just above the height of thunderclouds over the Floridian and Caribbean coastlines to collect data about lightning glows and terrestrial gamma ray flashes. Scientists expect to collect more accurate data than ever before that can advance the study of high-energy radiation emissions from thunderstorms.

The ALOFT mission, Airborne Lightning Observatory for Fly’s eye simulator and Terrestrial gamma ray flashes, is a collaboration between NASA and the University of Bergen, Norway. NASA Armstrong Flight Research Center’s ER-2 aircraft flies just above the height of thunderclouds over the Floridian and Caribbean coastlines to collect data about lightning glows and terrestrial gamma ray flashes. Scientists expect to collect more accurate data than ever before that can advance the study of high-energy radiation emissions from thunderstorms.

The ALOFT mission, Airborne Lightning Observatory for Fly’s eye simulator and Terrestrial gamma ray flashes, is a collaboration between NASA and the University of Bergen, Norway. NASA Armstrong Flight Research Center’s ER-2 aircraft flies just above the height of thunderclouds over the Floridian and Caribbean coastlines to collect data about lightning glows and terrestrial gamma ray flashes. Scientists expect to collect more accurate data than ever before that can advance the study of high-energy radiation emissions from thunderstorms.

The ALOFT mission, Airborne Lightning Observatory for Fly’s eye simulator and Terrestrial gamma ray flashes, is a collaboration between NASA and the University of Bergen, Norway. NASA Armstrong Flight Research Center’s ER-2 aircraft flies just above the height of thunderclouds over the Floridian and Caribbean coastlines to collect data about lightning glows and terrestrial gamma ray flashes. Scientists expect to collect more accurate data than ever before that can advance the study of high-energy radiation emissions from thunderstorms.
The ALOFT mission, Airborne Lightning Observatory for Fly’s eye simulator and Terrestrial gamma ray flashes, is a collaboration between NASA and the University of Bergen, Norway. NASA Armstrong Flight Research Center’s ER-2 aircraft flies just above the height of thunderclouds over the Floridian and Caribbean coastlines to collect data about lightning glows and terrestrial gamma ray flashes. Scientists expect to collect more accurate data than ever before that can advance the study of high-energy radiation emissions from thunderstorms.

The ALOFT mission, Airborne Lightning Observatory for Fly’s eye simulator and Terrestrial gamma ray flashes, is a collaboration between NASA and the University of Bergen, Norway. NASA Armstrong Flight Research Center’s ER-2 aircraft flies just above the height of thunderclouds over the Floridian and Caribbean coastlines to collect data about lightning glows and terrestrial gamma ray flashes. Scientists expect to collect more accurate data than ever before that can advance the study of high-energy radiation emissions from thunderstorms.

The ALOFT mission, Airborne Lightning Observatory for Fly’s eye simulator and Terrestrial gamma ray flashes, is a collaboration between NASA and the University of Bergen, Norway. NASA Armstrong Flight Research Center’s ER-2 aircraft flies just above the height of thunderclouds over the Floridian and Caribbean coastlines to collect data about lightning glows and terrestrial gamma ray flashes. Scientists expect to collect more accurate data than ever before that can advance the study of high-energy radiation emissions from thunderstorms.
The ALOFT mission, Airborne Lightning Observatory for Fly’s eye simulator and Terrestrial gamma ray flashes, is a collaboration between NASA and the University of Bergen, Norway. NASA Armstrong Flight Research Center’s ER-2 aircraft flies just above the height of thunderclouds over the Floridian and Caribbean coastlines to collect data about lightning glows and terrestrial gamma ray flashes. Scientists expect to collect more accurate data than ever before that can advance the study of high-energy radiation emissions from thunderstorms.
The ALOFT mission, Airborne Lightning Observatory for Fly’s eye simulator and Terrestrial gamma ray flashes, is a collaboration between NASA and the University of Bergen, Norway. NASA Armstrong Flight Research Center’s ER-2 aircraft flies just above the height of thunderclouds over the Floridian and Caribbean coastlines to collect data about lightning glows and terrestrial gamma ray flashes. Scientists expect to collect more accurate data than ever before that can advance the study of high-energy radiation emissions from thunderstorms.

The ALOFT mission, Airborne Lightning Observatory for Fly’s eye simulator and Terrestrial gamma ray flashes, is a collaboration between NASA and the University of Bergen, Norway. NASA Armstrong Flight Research Center’s ER-2 aircraft flies just above the height of thunderclouds over the Floridian and Caribbean coastlines to collect data about lightning glows and terrestrial gamma ray flashes. Scientists expect to collect more accurate data than ever before that can advance the study of high-energy radiation emissions from thunderstorms.
The ALOFT mission, Airborne Lightning Observatory for Fly’s eye simulator and Terrestrial gamma ray flashes, is a collaboration between NASA and the University of Bergen, Norway. NASA Armstrong Flight Research Center’s ER-2 aircraft flies just above the height of thunderclouds over the Floridian and Caribbean coastlines to collect data about lightning glows and terrestrial gamma ray flashes. Scientists expect to collect more accurate data than ever before that can advance the study of high-energy radiation emissions from thunderstorms.
The ALOFT mission, Airborne Lightning Observatory for Fly’s eye simulator and Terrestrial gamma ray flashes, is a collaboration between NASA and the University of Bergen, Norway. NASA Armstrong Flight Research Center’s ER-2 aircraft flies just above the height of thunderclouds over the Floridian and Caribbean coastlines to collect data about lightning glows and terrestrial gamma ray flashes. Scientists expect to collect more accurate data than ever before that can advance the study of high-energy radiation emissions from thunderstorms.

The ALOFT mission, Airborne Lightning Observatory for Fly’s eye simulator and Terrestrial gamma ray flashes, is a collaboration between NASA and the University of Bergen, Norway. NASA Armstrong Flight Research Center’s ER-2 aircraft flies just above the height of thunderclouds over the Floridian and Caribbean coastlines to collect data about lightning glows and terrestrial gamma ray flashes. Scientists expect to collect more accurate data than ever before that can advance the study of high-energy radiation emissions from thunderstorms.
The ALOFT mission, Airborne Lightning Observatory for Fly’s eye simulator and Terrestrial gamma ray flashes, is a collaboration between NASA and the University of Bergen, Norway. NASA Armstrong Flight Research Center’s ER-2 aircraft flies just above the height of thunderclouds over the Floridian and Caribbean coastlines to collect data about lightning glows and terrestrial gamma ray flashes. Scientists expect to collect more accurate data than ever before that can advance the study of high-energy radiation emissions from thunderstorms.
The ALOFT mission, Airborne Lightning Observatory for Fly’s eye simulator and Terrestrial gamma ray flashes, is a collaboration between NASA and the University of Bergen, Norway. NASA Armstrong Flight Research Center’s ER-2 aircraft flies just above the height of thunderclouds over the Floridian and Caribbean coastlines to collect data about lightning glows and terrestrial gamma ray flashes. Scientists expect to collect more accurate data than ever before that can advance the study of high-energy radiation emissions from thunderstorms.
The ALOFT mission, Airborne Lightning Observatory for Fly’s eye simulator and Terrestrial gamma ray flashes, is a collaboration between NASA and the University of Bergen, Norway. NASA Armstrong Flight Research Center’s ER-2 aircraft flies just above the height of thunderclouds over the Floridian and Caribbean coastlines to collect data about lightning glows and terrestrial gamma ray flashes. Scientists expect to collect more accurate data than ever before that can advance the study of high-energy radiation emissions from thunderstorms.
The ALOFT mission, Airborne Lightning Observatory for Fly’s eye simulator and Terrestrial gamma ray flashes, is a collaboration between NASA and the University of Bergen, Norway. NASA Armstrong Flight Research Center’s ER-2 aircraft flies just above the height of thunderclouds over the Floridian and Caribbean coastlines to collect data about lightning glows and terrestrial gamma ray flashes. Scientists expect to collect more accurate data than ever before that can advance the study of high-energy radiation emissions from thunderstorms.

ISS023-E-057948 (25 May 2010) --- A sunset on the Indian Ocean is featured in this image photographed by an Expedition 23 crew member on the International Space Station (ISS). The image presents an edge-on, or limb view, of Earth’s atmosphere as seen from orbit. The Earth’s curvature is visible along the horizon line, or limb, that extends across the image from center left to lower right. Above the darkened surface of Earth, a brilliant sequence of colors roughly denotes several layers of the atmosphere. Deep oranges and yellows are visible in the troposphere that extends from Earth’s surface to 6-20 kilometers high. This layer contains over 80 percent of the mass of the atmosphere and almost all of the water vapor, clouds, and precipitation – several dark cloud layers are visible within this layer. Variations in the colors are due mainly to varying concentrations of either clouds or aerosols (airborne particles or droplets). The pink to white region above the clouds appears to be the stratosphere; this atmospheric layer generally has little or no clouds and extends up to approximately 50 kilometers above Earth’s surface. Above the stratosphere blue layers mark the upper atmosphere (including the mesosphere, thermosphere, ionosphere, and exosphere) as it gradually fades into the blackness of outer space. The ISS was located over the southern Indian Ocean when this image was taken, with the observer looking towards the west. Crew members aboard the space station see 16 sunrises and sunsets per day due to their high orbital velocity (greater than 28,000 kilometers per hour). The multiple chances for photography are fortunate, as at that speed each sunrise/sunset event only lasts a few seconds.
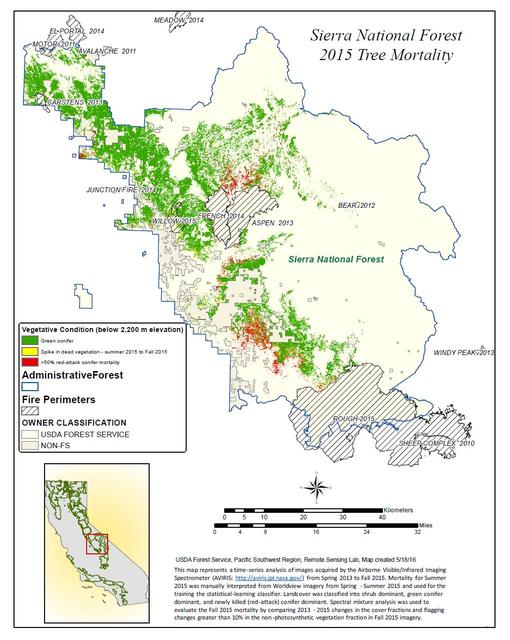
California, reveals the devastating effect of California's ongoing drought on Sierra Nevada conifer forests. The map will be used to help the U.S. Forest Service assess and respond to the impacts of increased tree mortality caused by the drought, particularly where wildlands meet urban areas within the Sierra National Forest. After several years of extreme drought, the highly stressed conifers (trees or bushes that produce cones and are usually green year-round) of the Sierra Nevada are now more susceptible to bark beetles (Dendroctonus spp.). While bark beetles killing trees in the Sierra Nevada is a natural phenomenon, the scale of mortality in the last couple of years is far greater than previously observed. The U.S. Forest Service is using recent airborne spectroscopic measurements from NASA's Airborne Visible/Infrared Imaging Spectrometer (AVIRIS) instrument aboard NASA's ER-2 aircraft, together with new advanced algorithms, to quantify this impact over this large region of rugged terrain. The high-altitude ER-2 aircraft is based at NASA's Armstrong Flight Research Center, Edwards, California. The image was created by scientists at the USFS's Pacific Southwest Region Remote Sensing Lab, McClellan, California, by performing a time series analysis of AVIRIS images. Scientists evaluated baseline tree mortality on public lands in the summer of 2015 using a machine learning algorithm called "random forest." This algorithm classifies the AVIRIS measurements as dominated by either shrubs, healthy trees or newly dead conifer trees. To quantify how much the amount of dead vegetation increased during the fall of 2015, the Forest Service scientists conducted an advanced spectral mixture analysis. This analysis evaluates each spectrum to determine the fraction of green vegetation, dead vegetation and soil. The full spectral range of AVIRIS is important to separate the signatures of soil and dead vegetation. To produce this comprehensive Sierra National Forest tree mortality map, the result from the summer of 2015 was evaluated to look for increases of more than 10 percent in dead vegetation during the fall of 2015. AVIRIS measures spectra of the Earth system to conduct advanced science research. These western U.S. AVIRIS measurements were acquired as part of NASA's Hyperspectral Infrared Imager (HyspIRI) preparatory airborne campaign. HyspIRI was one of the space missions suggested to NASA by the National Academy of Sciences in its 2007 decadal survey for Earth Science. In the future, HyspIRI could provide spectral and thermal measurements of this type globally for ecosystem research and additional science objectives. http://photojournal.jpl.nasa.gov/catalog/PIA20717
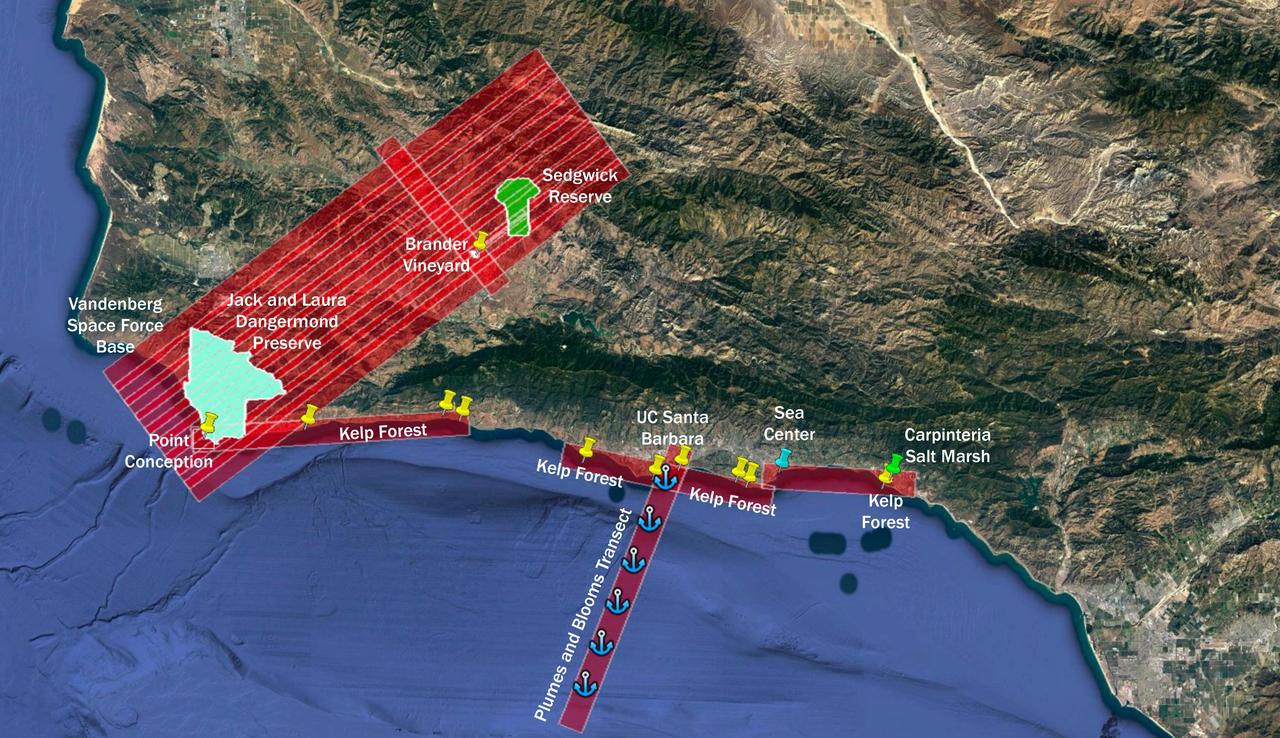
The Surface Biology and Geology High-Frequency Time Series (SHIFT) campaign employs a research plane carrying the AVIRIS-NG (Airborne Visible/Infrared Imaging Spectrometer-Next Generation) instrument. From late February to late May 2022, the plane is collecting spectral data of land and aquatic plant communities over a 640-square-mile (1,656-square-kilometer) study area in Santa Barbara County and the nearby ocean. SHIFT is jointly led by NASA's Jet Propulsion Laboratory, the University of California, Santa Barbara (UCSB), and The Nature Conservancy. The aerial portion of SHIFT flies on an approximately weekly basis over the study area, which includes the Jack and Laura Dangermond Preserve, owned by The Nature Conservancy, and the Sedgwick Reserve, operated by UCSB. SHIFT combines the ability of airborne science instruments to gather data over widespread areas with the more concentrated observations scientists conduct in the field to study the functional characteristics, health, and resilience of plant communities. The sampling and analysis done by researchers on the ground and in the ocean is intended to validate data taken by AVIRIS-NG and help scientists design data collection and processing algorithms for NASA's proposed Surface Biology and Geology (SBG) mission, which would launch no earlier than 2028. The data is also intended to support the research and conservation objectives of The Nature Conservancy, which owns the Dangermond Preserve, and UCSB, which operates the Sedgwick Reserve, another nature preserve within the study area. More than 60 scientists from institutions around the U.S. have indicated they intend to use the SHIFT data in their research. https://photojournal.jpl.nasa.gov/catalog/PIA25144
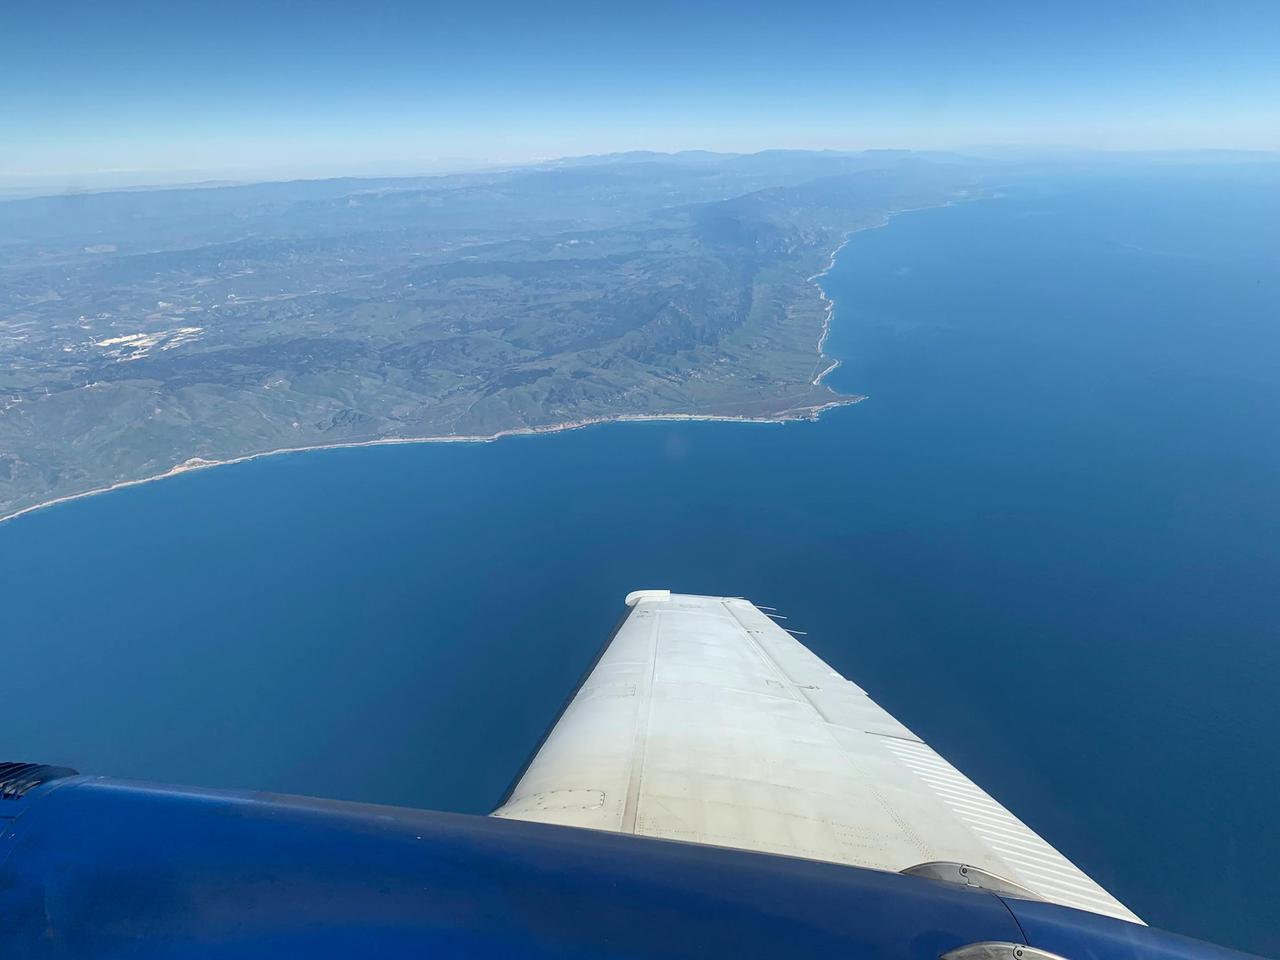
A research plane carrying the AVIRIS-NG (Airborne Visible/Infrared Imaging Spectrometer-Next Generation) instrument flies off the Central Coast of California near Point Conception and the Jack and Laura Dangermond Preserve on Feb. 24, 2022. The flight is part of the Surface Biology and Geology High-Frequency Time Series (SHIFT) campaign, which is jointly led by NASA's Jet Propulsion Laboratory, the University of California, Santa Barbara (UCSB), and The Nature Conservancy. Operating between late February and late May 2022, the aerial portion of SHIFT flies on an approximately weekly basis over a 640-square-mile (1,656-square-kilometer) study area in Santa Barbara County and the nearby ocean, collecting spectral data of plant communities it observes below. SHIFT combines the ability of airborne science instruments to gather data over widespread areas with the more concentrated observations scientists conduct in the field to study the functional characteristics, health, and resilience of plant communities. The sampling and analysis done by researchers on the ground and in the ocean is intended to validate data taken by AVIRIS-NG and help scientists design data collection and processing algorithms for NASA's proposed Surface Biology and Geology (SBG) mission, which would launch no earlier than 2028. The data is also intended to support the research and conservation objectives of The Nature Conservancy, which owns the Dangermond Preserve, and UCSB, which operates the Sedgwick Reserve, another nature preserve within the study area. More than 60 scientists from institutions around the U.S. have indicated they intend to use the SHIFT data in their research. AVIRIS-NG, which was designed at JPL, flies aboard Dynamic Aviation's King Air B-200. https://photojournal.jpl.nasa.gov/catalog/PIA25143
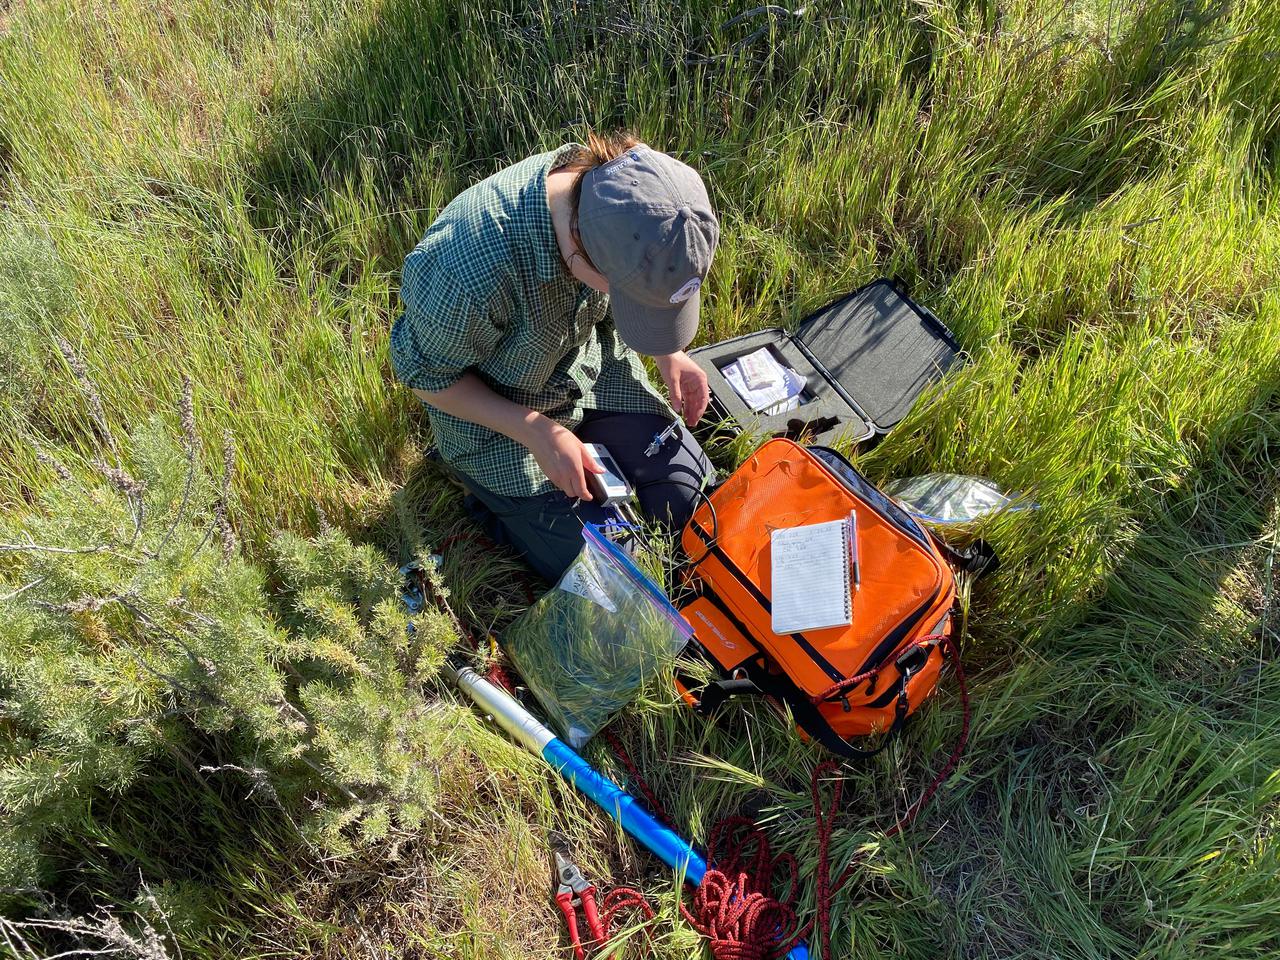
University of California, Santa Barbara (UCSB) student Piper Lovegreen calibrates a sensor to measure leaf chlorophyl content of vegetation at the Jack and Laura Dangermond Preserve in Santa Barbara County on March 23, 2022. Lovegreen is among the researchers working on the Surface Biology and Geology High-Frequency Time Series (SHIFT) campaign, which is jointly led by NASA's Jet Propulsion Laboratory, UCSB, and The Nature Conservancy. Operating between late February and late May 2022, SHIFT combines the ability of airborne science instruments to gather data over widespread areas with the more concentrated observations scientists conduct in the field to study the functional characteristics, health, and resilience of plant communities. The sampling and analysis done by researchers on the ground and in the ocean is intended to validate data taken by AVIRIS-NG (Airborne Visible/Infrared Imaging Spectrometer-Next Generation). The instrument, designed at JPL, is collecting spectral data of vegetation it observes during weekly flights in an aircraft over a 640-square-mile (1,656-square-kilometer) study area in Santa Barbara County and coastal Pacific waters. The campaign is a pathfinder for NASA's proposed Surface Biology and Geology (SBG) mission. SHIFT will help scientists design data collection and processing algorithms for that mission, which would launch no earlier than 2028. The SHIFT data is also intended to support the research and conservation objectives of The Nature Conservancy, which owns the Dangermond Preserve, and UCSB, which operates the Sedgwick Reserve, another nature preserve within the study area. More than 60 scientists from institutions around the U.S. have indicated they intend to use the SHIFT data in their research. https://photojournal.jpl.nasa.gov/catalog/PIA25142
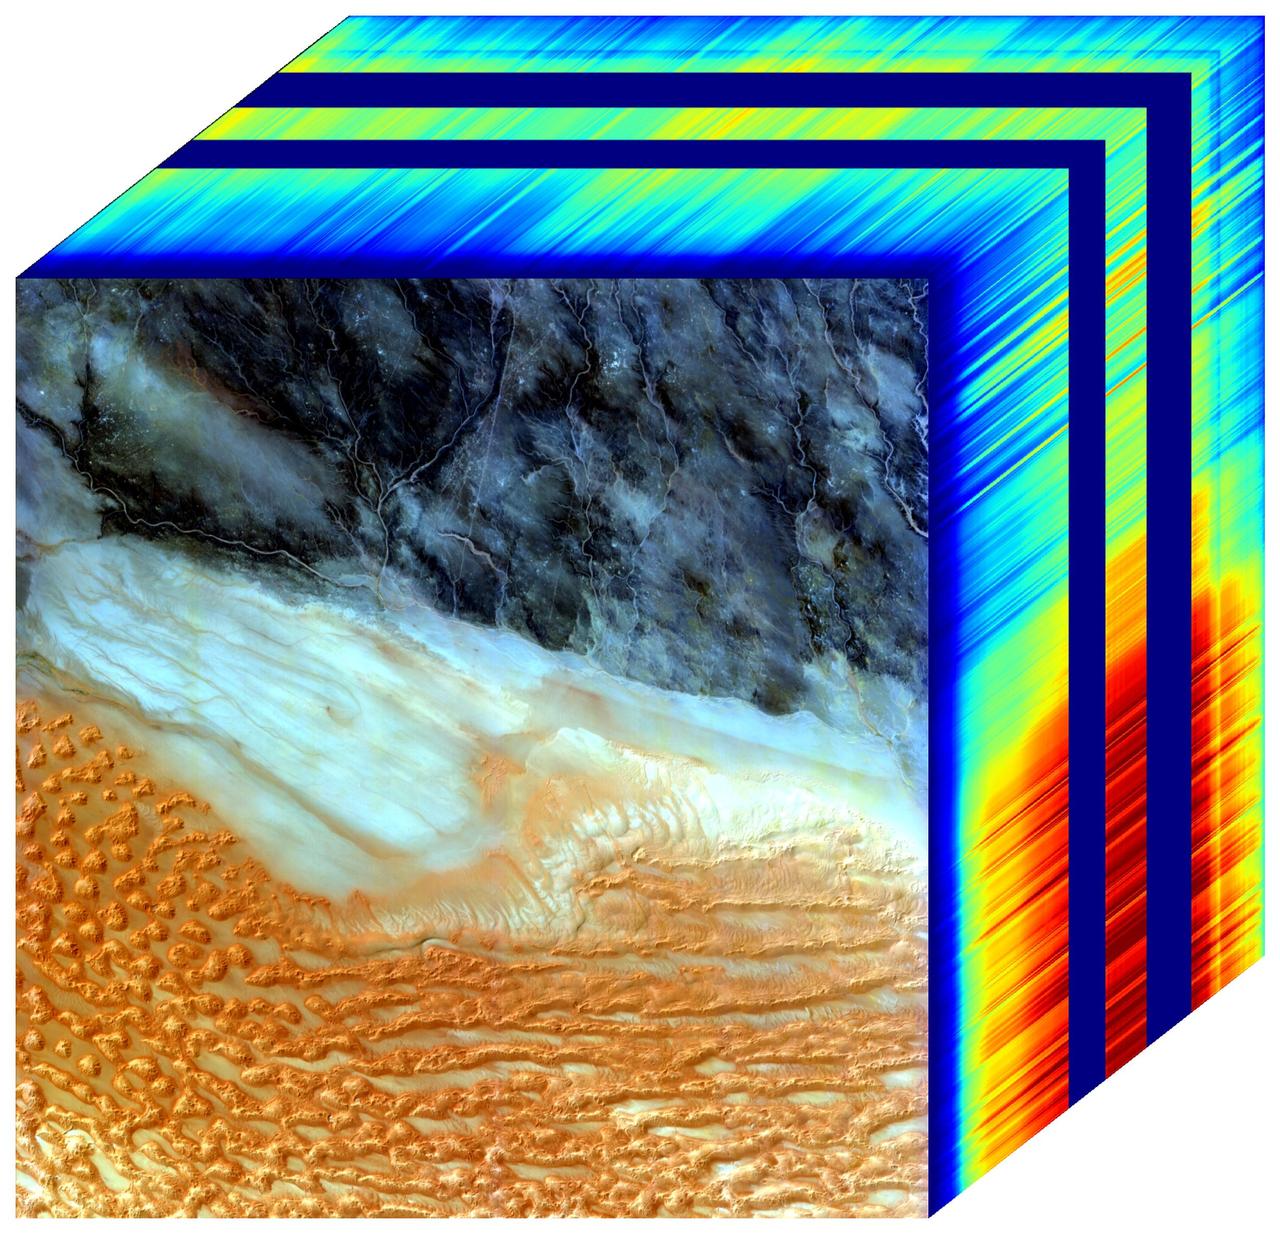
The front panel of this image cube features the true-color view of an area in southwest Libya observed by NASA's Earth Surface Mineral Dust Source Investigation (EMIT) imaging spectrometer, which orbits the planet aboard the International Space Station. The side panels depict the spectral fingerprint for every point in the image, which shows an area about 500 miles (800 kilometers) south of Tripoli. The instrument works by measuring reflected solar energy from Earth across hundreds of wavelengths, from the visible to the infrared range of the spectrum. The intensity of the reflected light varies by wavelength based on the material. Scientists use these patterns, called spectral fingerprints, to identify surface minerals and pinpoint their locations on a map. The cube is among the first created by scientists with EMIT data. Analysis of the patterns indicated that the surface contains kaolinite, a light-colored clay mineral, and goethite and hematite, two varieties of iron oxide, which is darker. When dust from the kaolinite-dominated areas is lofted into the atmosphere, the particles tend to scatter sunlight and reflect it back to space, cooling the air. The opposite effect occurs with airborne particles of iron oxide, which tend to absorb heat and warm the surrounding air. Over the course of its 12-month mission, EMIT will collect measurements of 10 important surface minerals – kaolinite, hematite, goethite, illite, vermiculite, calcite, dolomite, montmorillonite, chlorite, and gypsum – in arid regions between 50-degree south and north latitudes in Africa, Asia, North and South America, and Australia. The data EMIT collects will help scientists better understand the role of airborne dust particles in heating and cooling Earth's atmosphere on global and regional scales. https://photojournal.jpl.nasa.gov/catalog/PIA25430
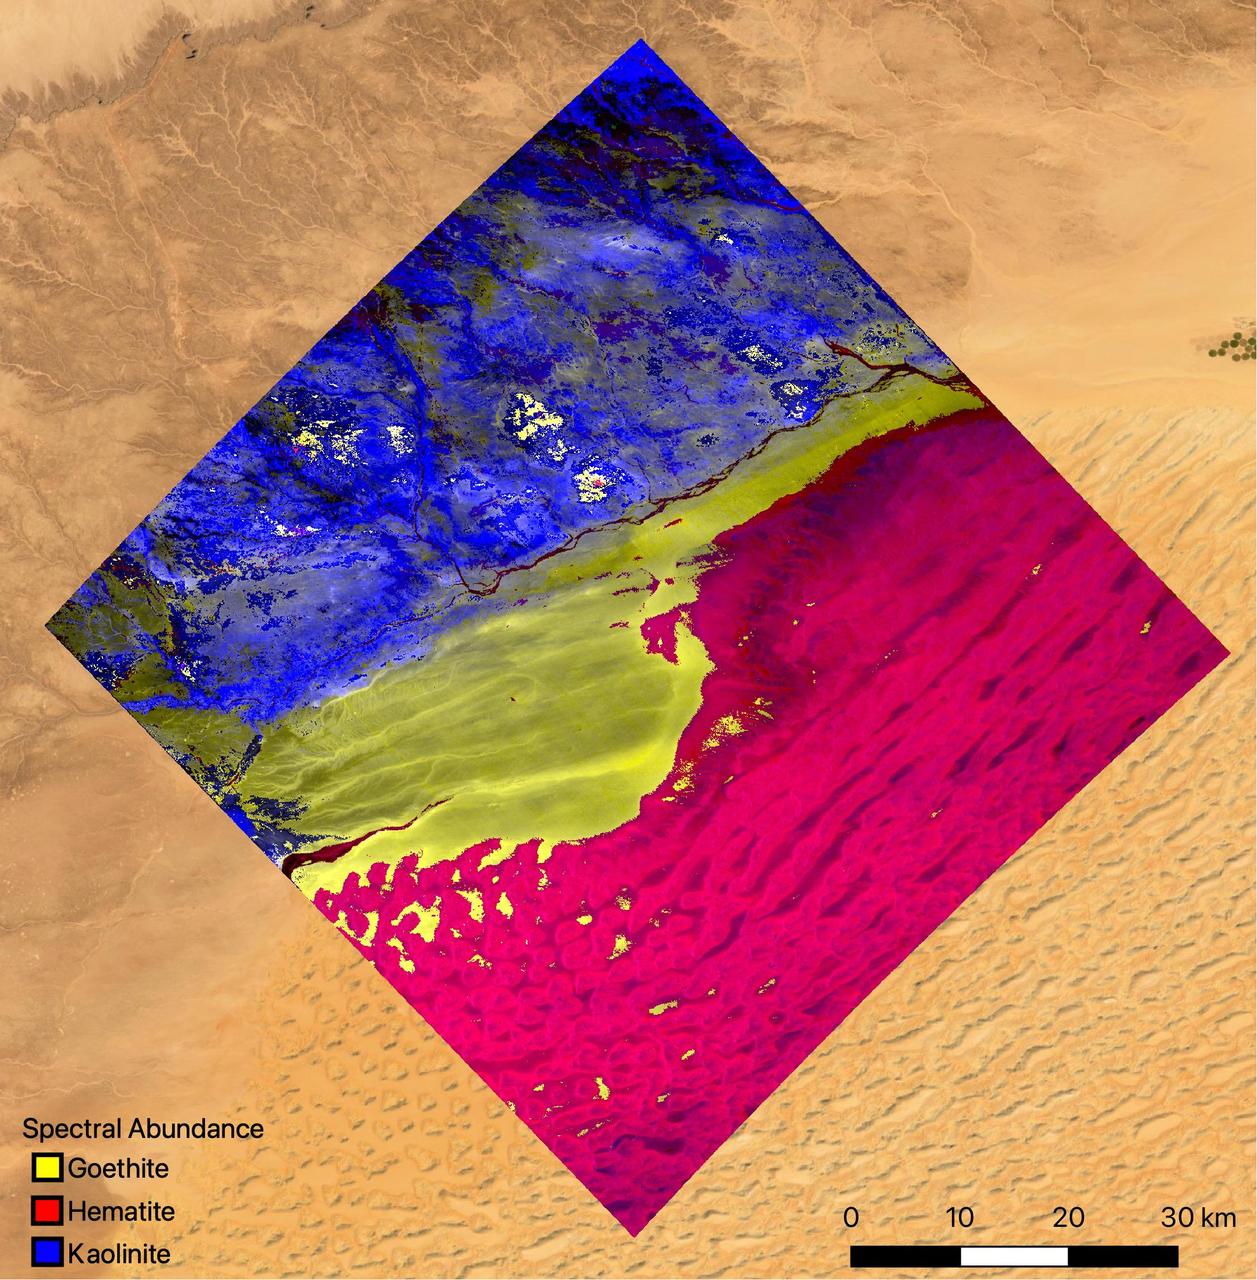
The mineral map shows an area of southwestern Libya in the Sahara Desert observed by NASA's Earth Surface Mineral Dust Source Investigation (EMIT) mission as it maps the world's mineral dust sources, gathering information about surface composition as the instrument, designed at NASA's Jet Propulsion Laboratory in Southern California, orbits aboard the International Space Station. The instrument works by measuring reflected solar energy from Earth across hundreds of wavelengths from the visible to the infrared range of the spectrum. The intensity of the reflected light varies by wavelength based on the material. Scientists are using these patterns, called spectral fingerprints, to identify surface minerals and pinpoint their locations on a map. The map is among the first produced by scientists with EMIT data. Analysis of the patterns indicate that the surface contains kaolinite, a light-colored clay mineral, and goethite and hematite, two varieties of iron oxide, which is darker. When dust from the kaolinite-dominated areas is lofted into the atmosphere, the particles tend to scatter sunlight and reflect it back to space, cooling the air. The opposite effect occurs with airborne particles of iron oxide, which tend to absorb heat and warm the surrounding air. Over the course of its 12-month mission, EMIT will collect measurements of 10 important surface minerals – kaolinite, hematite, goethite, illite, vermiculite, calcite, dolomite, montmorillonite, chlorite, and gypsum – in arid regions between 50-degree south and north latitudes in Africa, Asia, North and South America, and Australia. The data EMIT collects will help scientists better understand the role of airborne dust particles in heating and cooling Earth's atmosphere on global and regional scales. EMIT was developed at NASA's Jet Propulsion Laboratory, which is managed for the agency by Caltech in Pasadena, California. It launched to the space station in July 2022. https://photojournal.jpl.nasa.gov/catalog/PIA25424

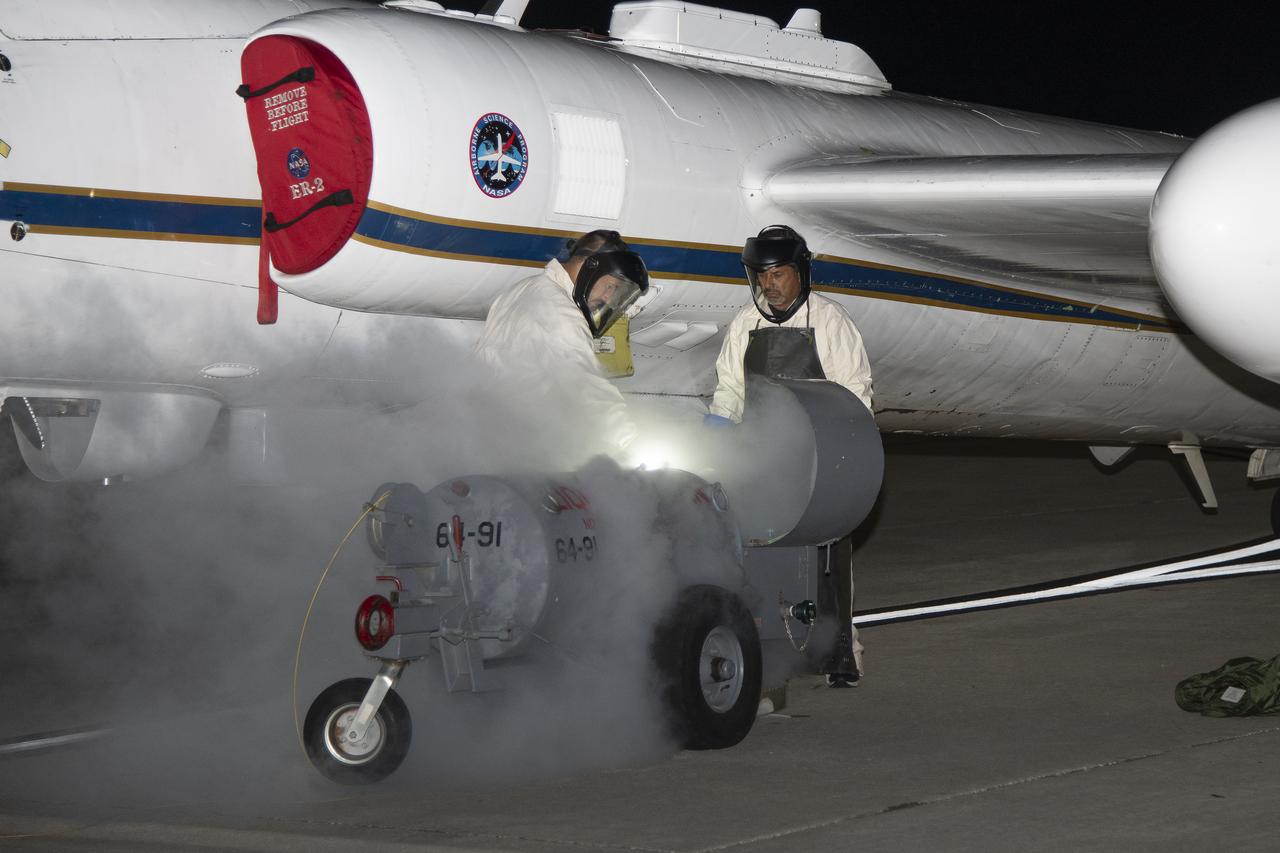
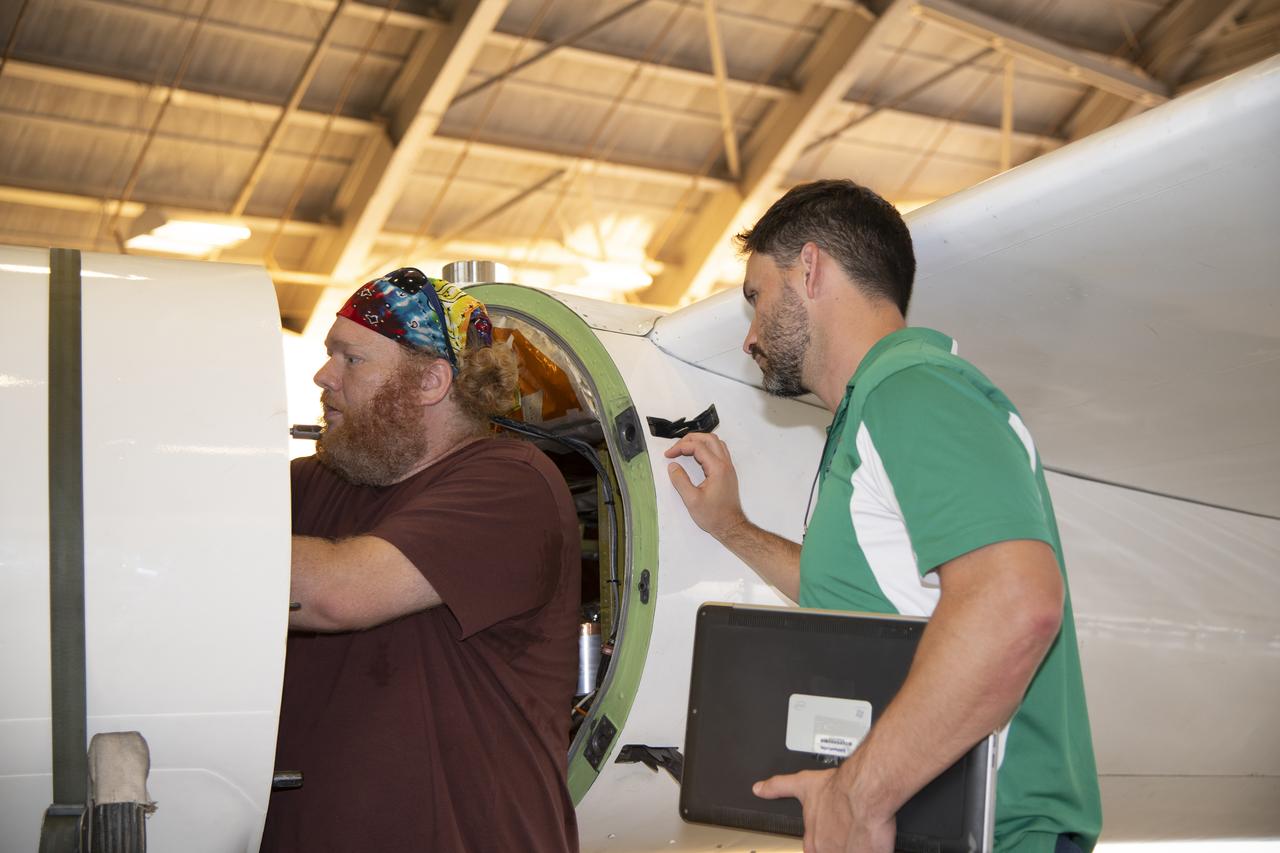
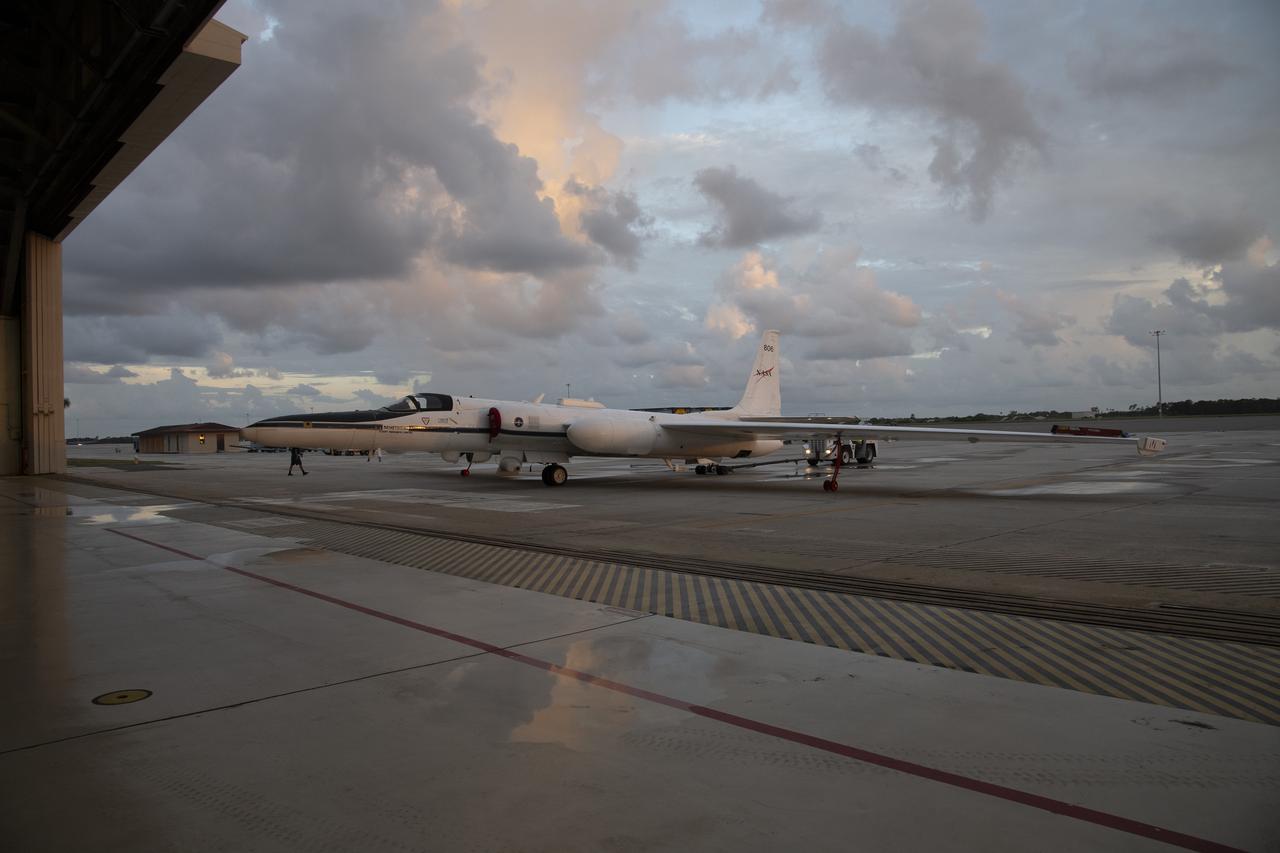
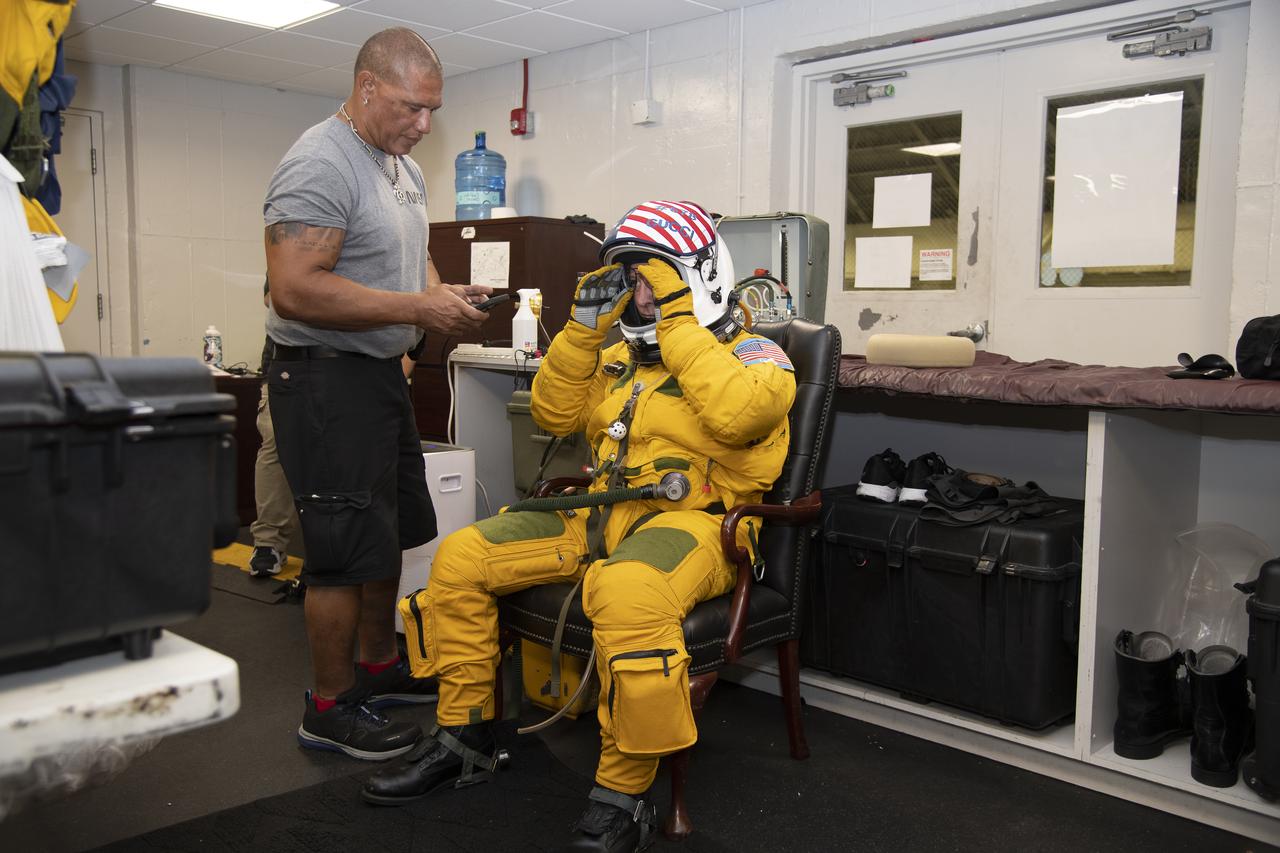
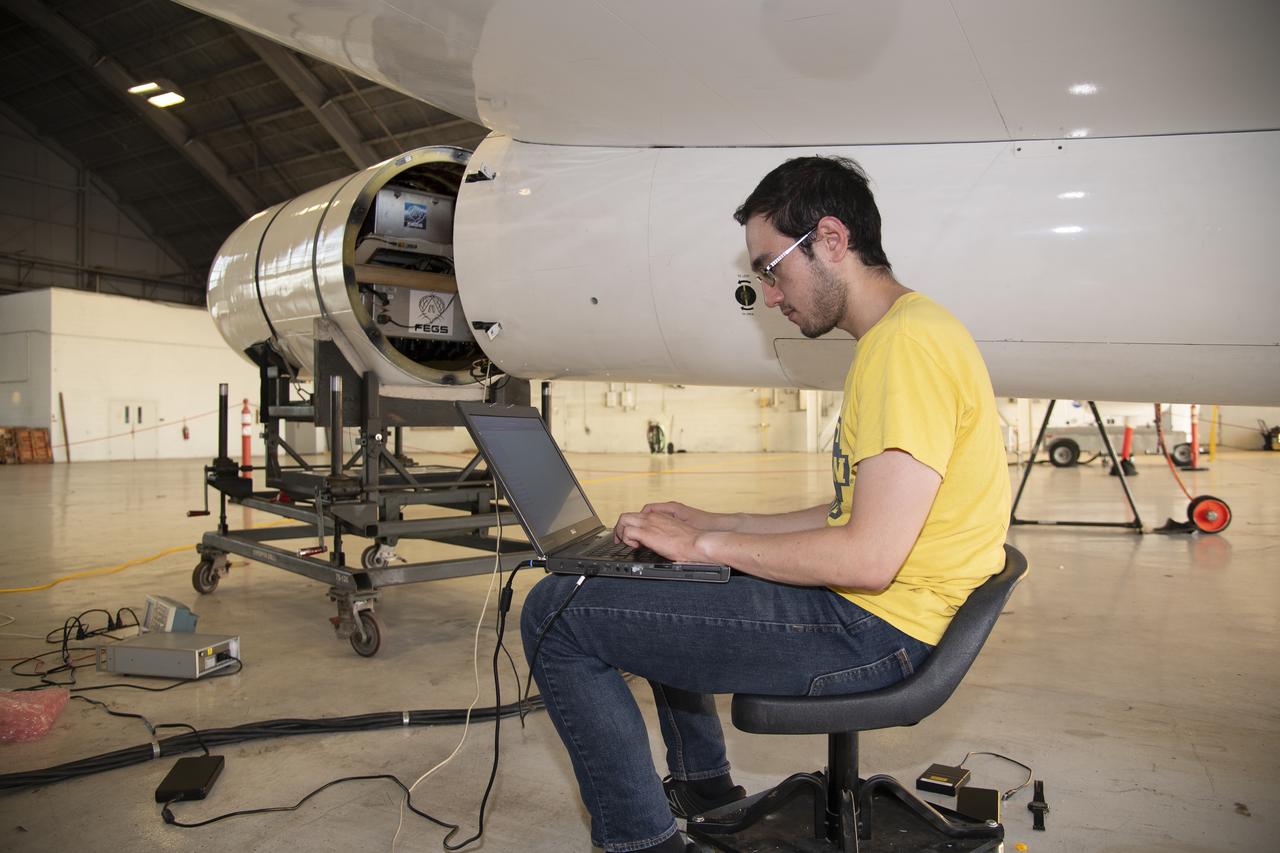
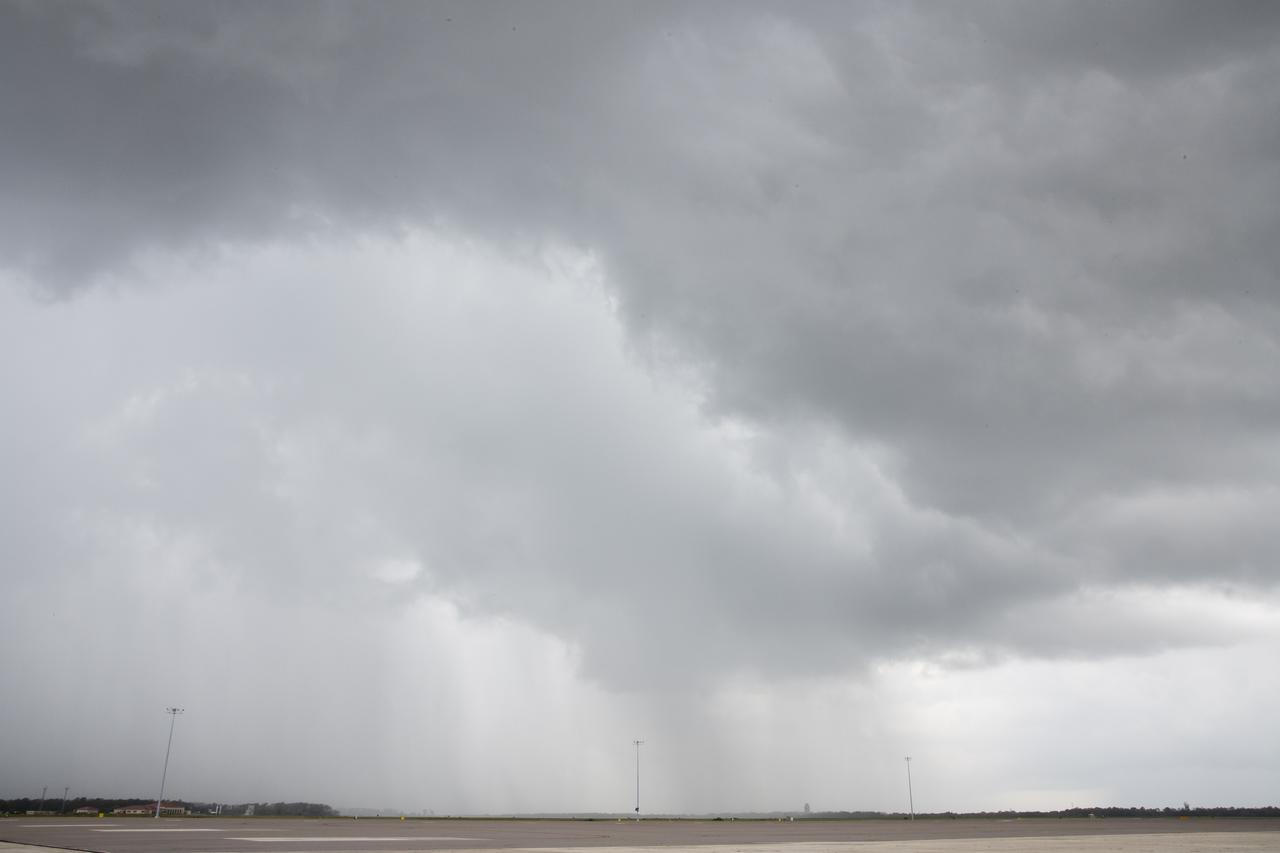
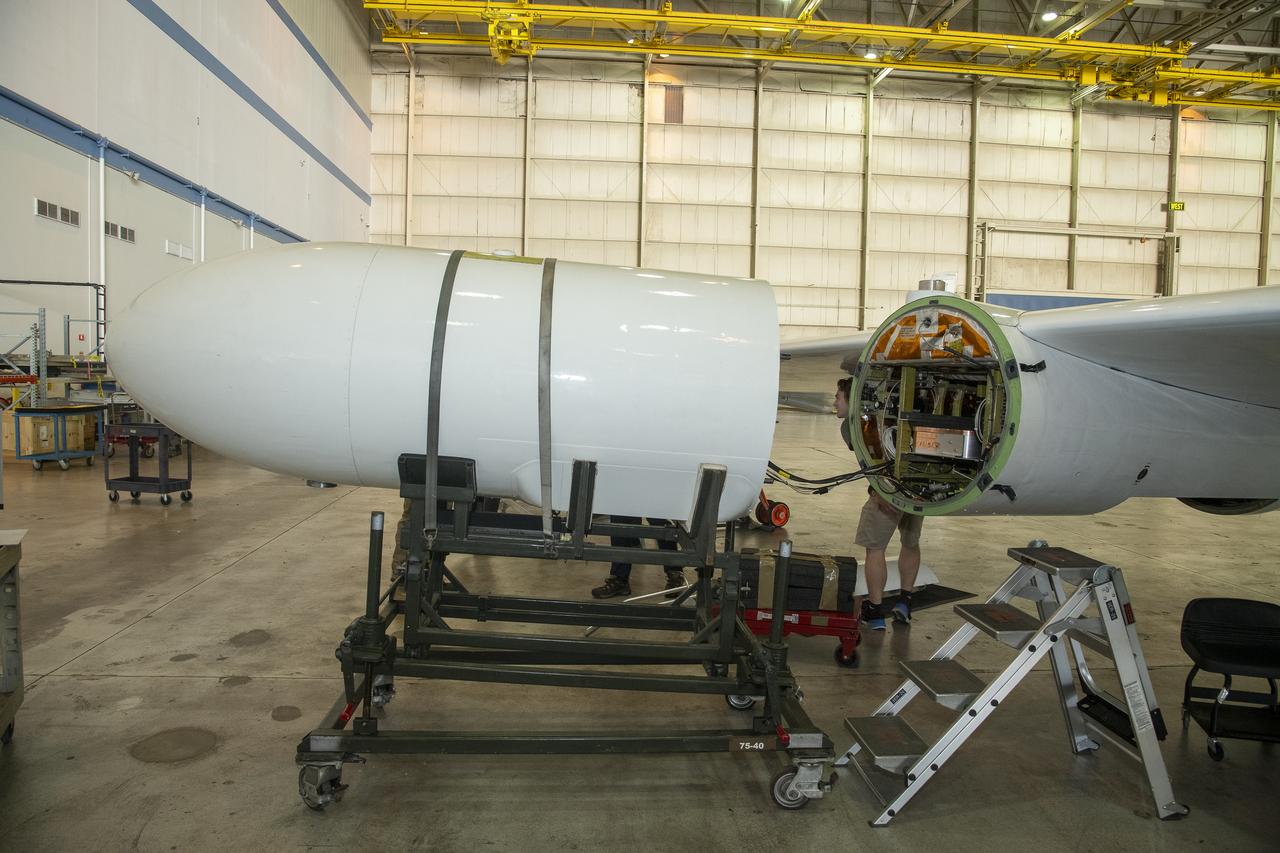
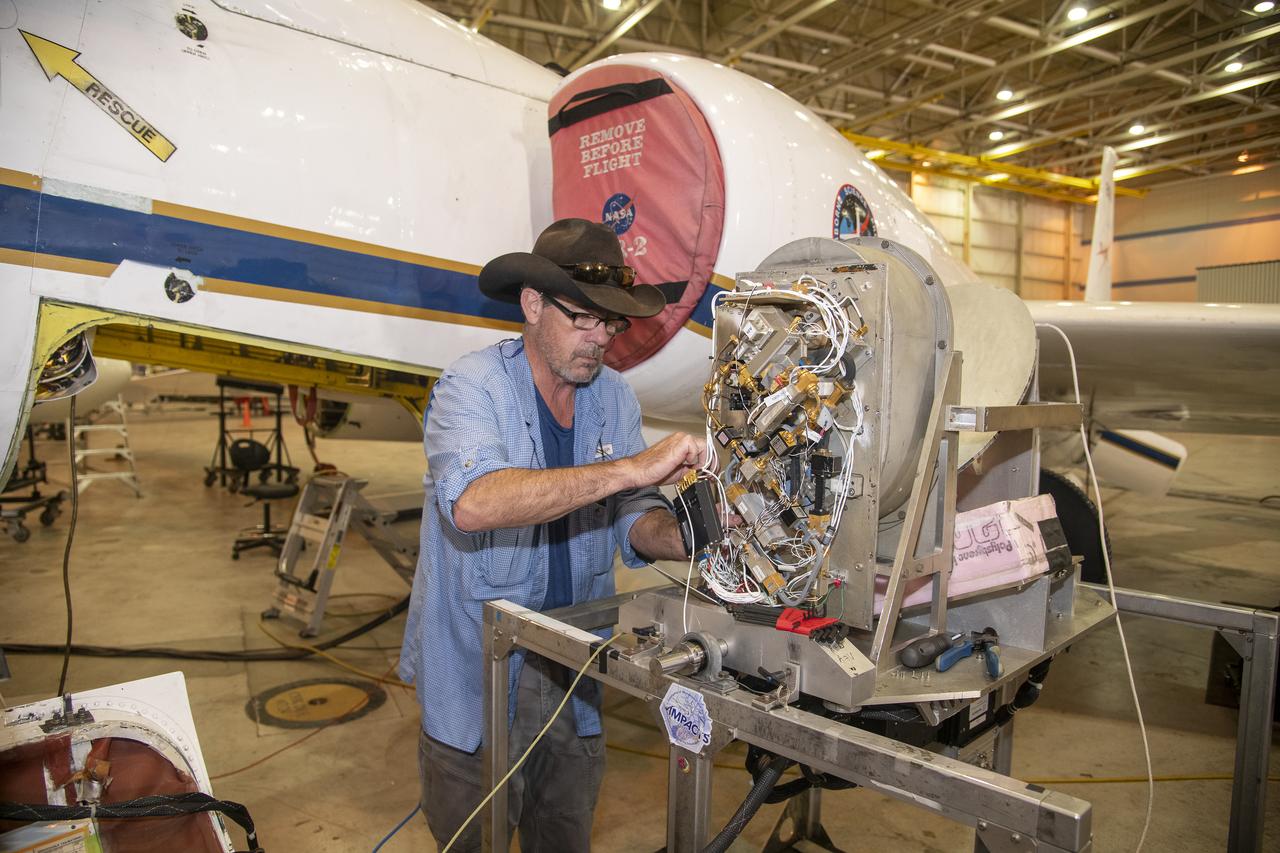
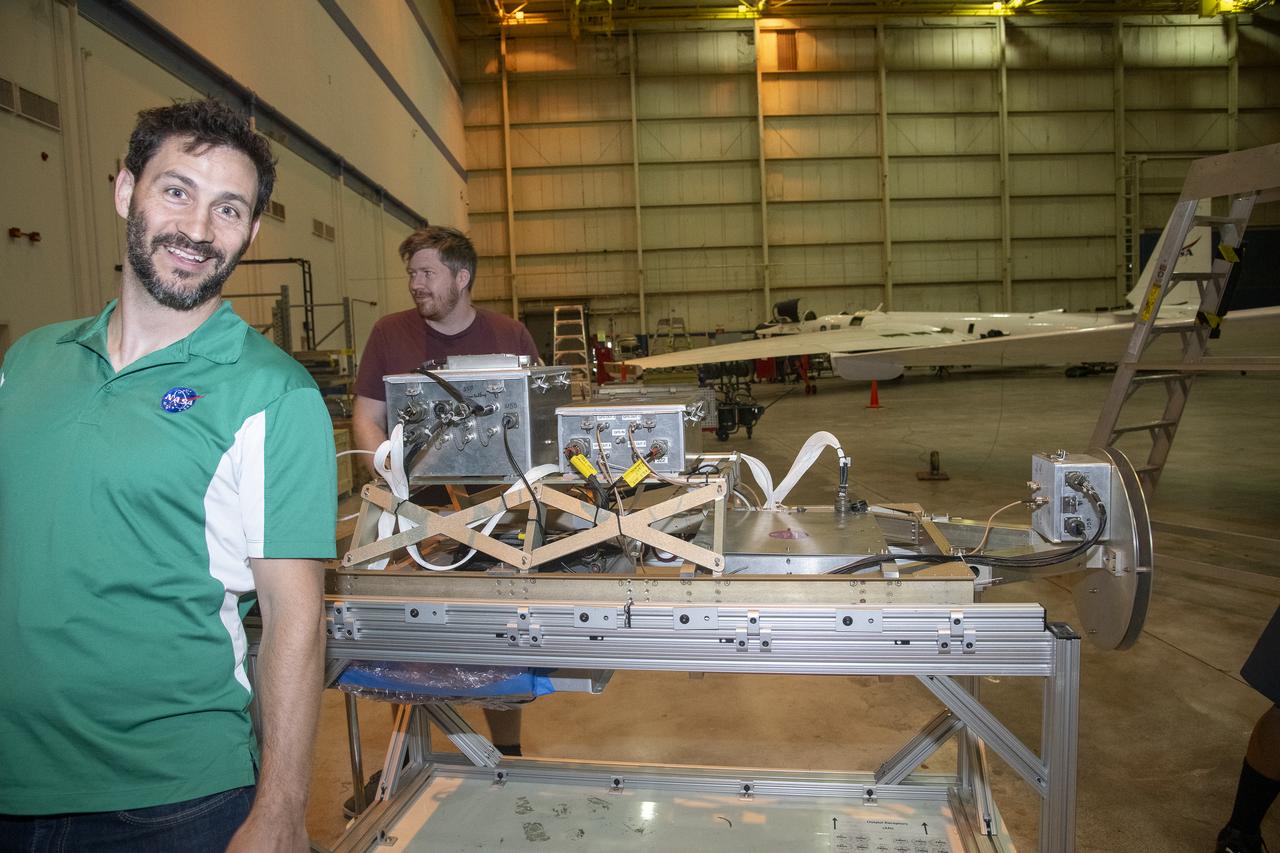
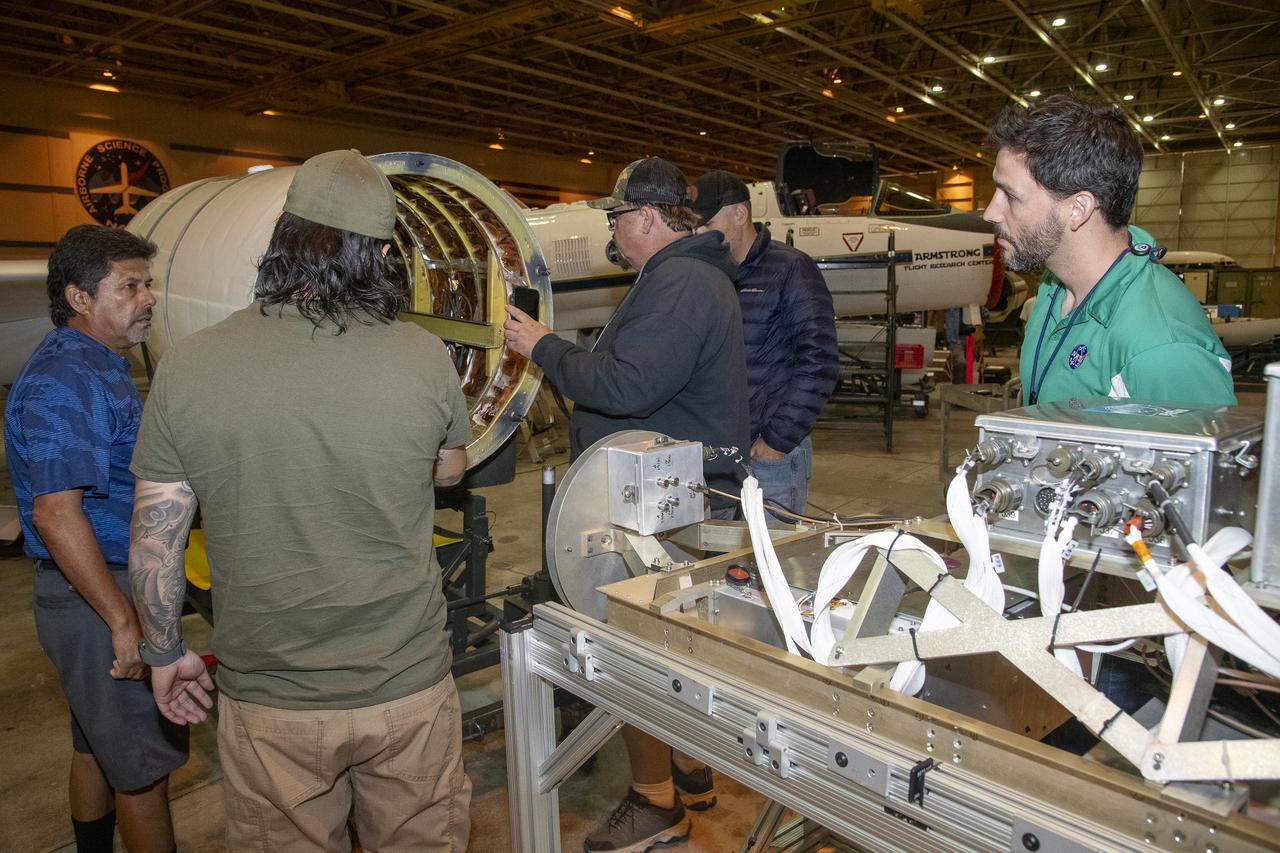
NASA Armstrong’s ER-2 aircraft is uploaded with instruments for its ALOFT mission. The ER-2 will fly at high altitudes above the Floridian coastline to collect data about the energetic characteristics and behavior of lightning and thunderclouds. Scientists from the University of Bergen, Norway will interpret that data from the ground and collaborate with NASA pilots to safely collect the most accurate data for this project about the power of lightning.
NASA Armstrong’s ER-2 aircraft is uploaded with instruments for its ALOFT mission. The ER-2 will fly at high altitudes above the Floridian coastline to collect data about the energetic characteristics and behavior of lightning and thunderclouds. Scientists from the University of Bergen, Norway will interpret that data from the ground and collaborate with NASA pilots to safely collect the most accurate data for this project about the power of lightning.
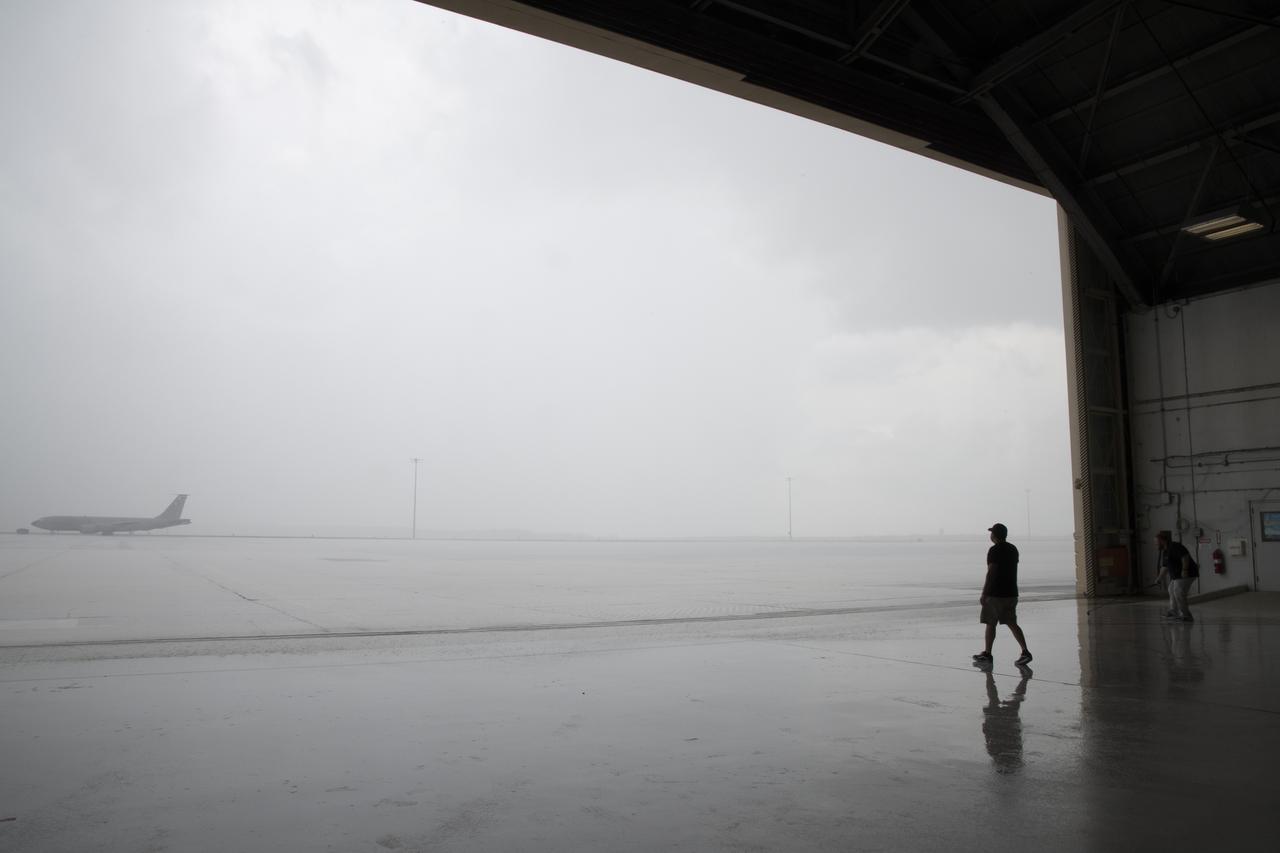
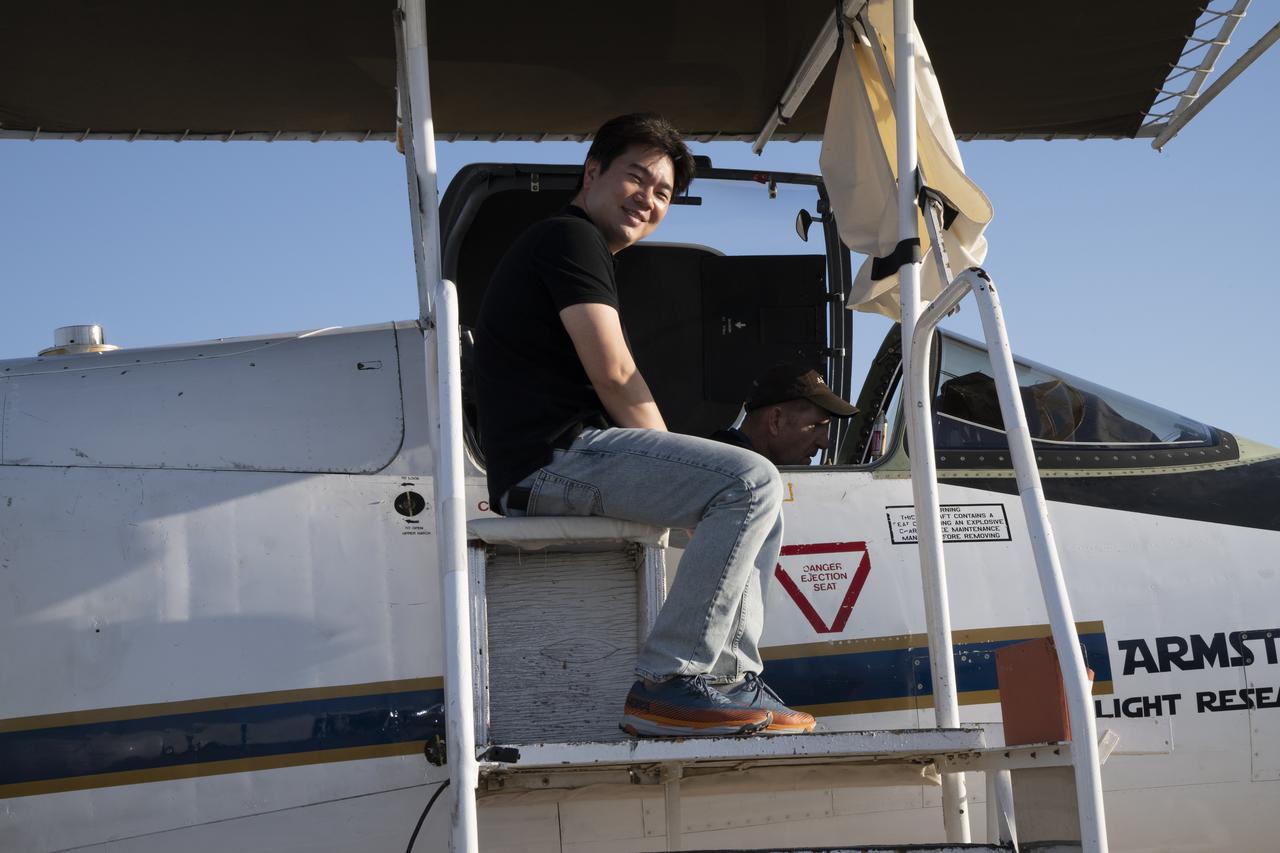
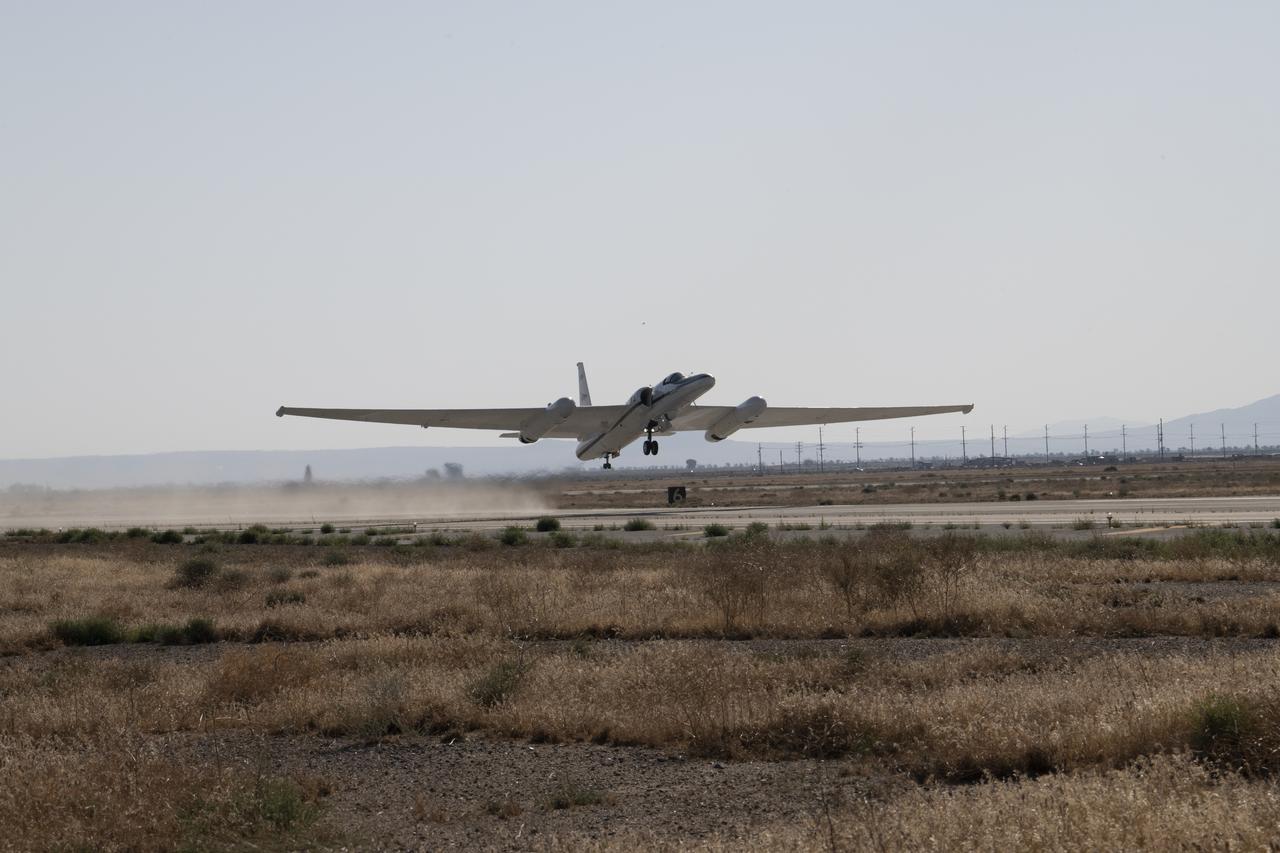
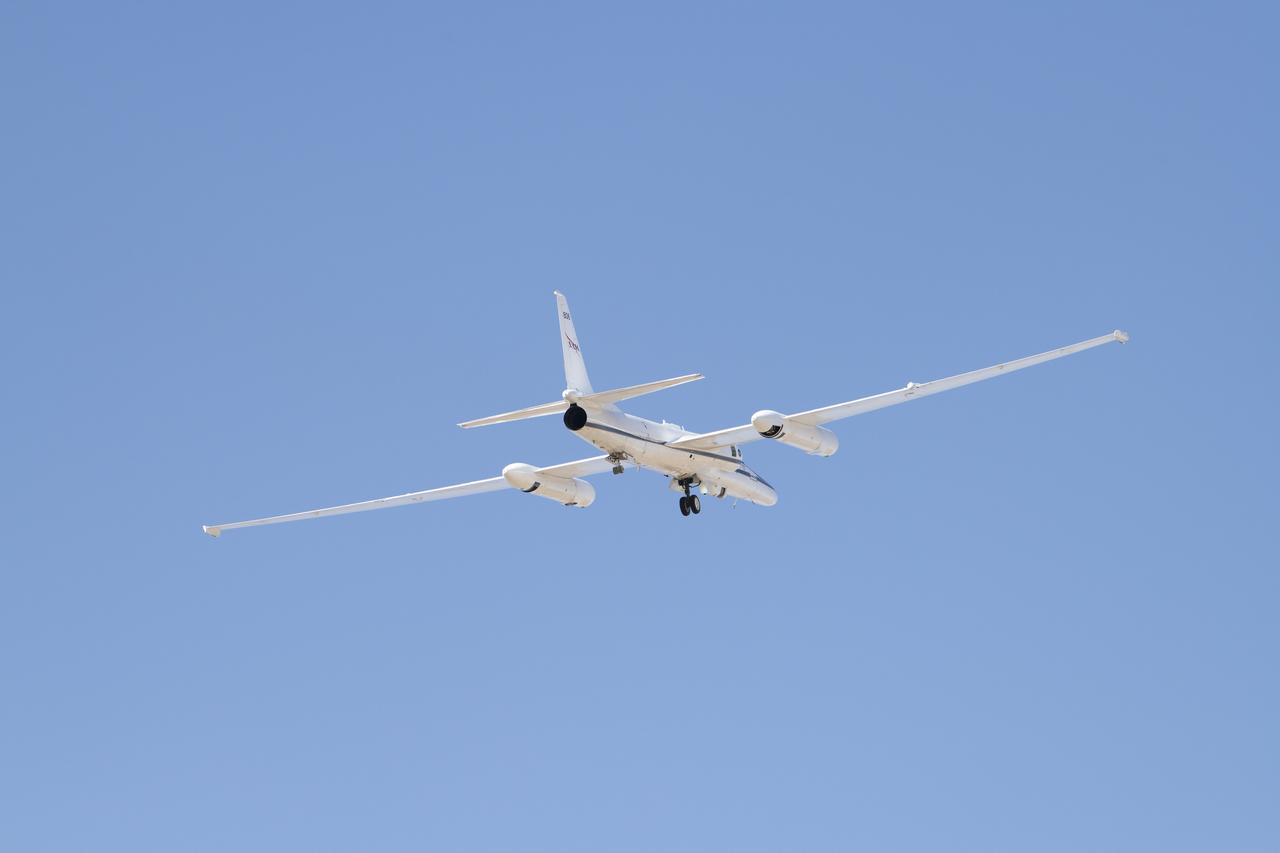
NASA Armstrong’s ER-2 aircraft deploys for its ALOFT mission. The ER-2 will fly at high altitudes above the Floridian coastline to collect data about the energetic characteristics and behavior of lightning and thunderclouds. A NASA pilot will operate the aircraft while scientists from the University of Bergen, Norway will interpret the data from the ground.
NASA Armstrong’s ER-2 aircraft is uploaded with instruments for its ALOFT mission. The ER-2 will fly at high altitudes above the Floridian coastline to collect data about the energetic characteristics and behavior of lightning and thunderclouds. Scientists from the University of Bergen, Norway will interpret that data from the ground and collaborate with NASA pilots to safely collect the most accurate data for this project about the power of lightning.
NASA Armstrong’s ER-2 aircraft is uploaded with instruments for its ALOFT mission. The ER-2 will fly at high altitudes above the Floridian coastline to collect data about the energetic characteristics and behavior of lightning and thunderclouds. Scientists from the University of Bergen, Norway will interpret that data from the ground and collaborate with NASA pilots to safely collect the most accurate data for this project about the power of lightning.
NASA Armstrong’s ER-2 aircraft is uploaded with instruments for its ALOFT mission. The ER-2 will fly at high altitudes above the Floridian coastline to collect data about the energetic characteristics and behavior of lightning and thunderclouds. Scientists from the University of Bergen, Norway will interpret that data from the ground and collaborate with NASA pilots to safely collect the most accurate data for this project about the power of lightning.
NASA Armstrong’s ER-2 aircraft deploys for its ALOFT mission. The ER-2 will fly at high altitudes above the Floridian coastline to collect data about the energetic characteristics and behavior of lightning and thunderclouds. A NASA pilot will operate the aircraft while scientists from the University of Bergen, Norway will interpret the data from the ground.
NASA Armstrong’s ER-2 aircraft deploys for its ALOFT mission. The ER-2 will fly at high altitudes above the Floridian coastline to collect data about the energetic characteristics and behavior of lightning and thunderclouds. A NASA pilot will operate the aircraft while scientists from the University of Bergen, Norway will interpret the data from the ground.
NASA Armstrong’s ER-2 aircraft is uploaded with instruments for its ALOFT mission. The ER-2 will fly at high altitudes above the Floridian coastline to collect data about the energetic characteristics and behavior of lightning and thunderclouds. Scientists from the University of Bergen, Norway will interpret that data from the ground and collaborate with NASA pilots to safely collect the most accurate data for this project about the power of lightning.
NASA Armstrong’s ER-2 aircraft is uploaded with instruments for its ALOFT mission. The ER-2 will fly at high altitudes above the Floridian coastline to collect data about the energetic characteristics and behavior of lightning and thunderclouds. Scientists from the University of Bergen, Norway will interpret that data from the ground and collaborate with NASA pilots to safely collect the most accurate data for this project about the power of lightning.
NASA Armstrong’s ER-2 aircraft deploys for its ALOFT mission. The ER-2 will fly at high altitudes above the Floridian coastline to collect data about the energetic characteristics and behavior of lightning and thunderclouds. A NASA pilot will operate the aircraft while scientists from the University of Bergen, Norway will interpret the data from the ground.
NASA Armstrong’s ER-2 aircraft is uploaded with instruments for its ALOFT mission. The ER-2 will fly at high altitudes above the Floridian coastline to collect data about the energetic characteristics and behavior of lightning and thunderclouds. Scientists from the University of Bergen, Norway will interpret that data from the ground and collaborate with NASA pilots to safely collect the most accurate data for this project about the power of lightning.
NASA Armstrong’s ER-2 aircraft deploys for its ALOFT mission. The ER-2 will fly at high altitudes above the Floridian coastline to collect data about the energetic characteristics and behavior of lightning and thunderclouds. A NASA pilot will operate the aircraft while scientists from the University of Bergen, Norway will interpret the data from the ground.
NASA Armstrong’s ER-2 aircraft deploys for its ALOFT mission. The ER-2 will fly at high altitudes above the Floridian coastline to collect data about the energetic characteristics and behavior of lightning and thunderclouds. A NASA pilot will operate the aircraft while scientists from the University of Bergen, Norway will interpret the data from the ground.
NASA Armstrong’s ER-2 aircraft is uploaded with instruments for its ALOFT mission. The ER-2 will fly at high altitudes above the Floridian coastline to collect data about the energetic characteristics and behavior of lightning and thunderclouds. Scientists from the University of Bergen, Norway will interpret that data from the ground and collaborate with NASA pilots to safely collect the most accurate data for this project about the power of lightning.
NASA Armstrong’s ER-2 aircraft is uploaded with instruments for its ALOFT mission. The ER-2 will fly at high altitudes above the Floridian coastline to collect data about the energetic characteristics and behavior of lightning and thunderclouds. Scientists from the University of Bergen, Norway will interpret that data from the ground and collaborate with NASA pilots to safely collect the most accurate data for this project about the power of lightning.
NASA Armstrong’s ER-2 aircraft is uploaded with instruments for its ALOFT mission. The ER-2 will fly at high altitudes above the Floridian coastline to collect data about the energetic characteristics and behavior of lightning and thunderclouds. Scientists from the University of Bergen, Norway will interpret that data from the ground and collaborate with NASA pilots to safely collect the most accurate data for this project about the power of lightning.
NASA Armstrong’s ER-2 aircraft is uploaded with instruments for its ALOFT mission. The ER-2 will fly at high altitudes above the Floridian coastline to collect data about the energetic characteristics and behavior of lightning and thunderclouds. Scientists from the University of Bergen, Norway will interpret that data from the ground and collaborate with NASA pilots to safely collect the most accurate data for this project about the power of lightning.
NASA Armstrong’s ER-2 aircraft is uploaded with instruments for its ALOFT mission. The ER-2 will fly at high altitudes above the Floridian coastline to collect data about the energetic characteristics and behavior of lightning and thunderclouds. Scientists from the University of Bergen, Norway will interpret that data from the ground and collaborate with NASA pilots to safely collect the most accurate data for this project about the power of lightning.
NASA Armstrong’s ER-2 aircraft deploys for its ALOFT mission. The ER-2 will fly at high altitudes above the Floridian coastline to collect data about the energetic characteristics and behavior of lightning and thunderclouds. A NASA pilot will operate the aircraft while scientists from the University of Bergen, Norway will interpret the data from the ground.
NASA Armstrong’s ER-2 aircraft is uploaded with instruments for its ALOFT mission. The ER-2 will fly at high altitudes above the Floridian coastline to collect data about the energetic characteristics and behavior of lightning and thunderclouds. Scientists from the University of Bergen, Norway will interpret that data from the ground and collaborate with NASA pilots to safely collect the most accurate data for this project about the power of lightning.

NASA's Dryden Flight Research Center marked its 60th anniversary as the aerospace agency's lead center for atmospheric flight research and operations in 2006. In connection with that milestone, hundreds of the center's staff and retirees gathered in nearby Lancaster, Calif., in November 2006 to reflect on the center's challenges and celebrate its accomplishments over its six decades of advancing the state-of-the-art in aerospace technology. The center had its beginning in 1946 when a few engineers from the National Advisory Committee for Aeronautics' Langley Memorial Aeronautical Laboratory were detailed to Muroc Army Air Base (now Edwards Air Force Base) in Southern California's high desert to support the joint Army Air Force / NACA / Bell Aircraft XS-1 research airplane program. Since that inauspicious beginning, the center has been at the forefront of many of the advances in aerospace technology by validating advanced concepts through actual in-flight research and testing. Dryden is uniquely situated to take advantage of the excellent year-round flying weather, remote area, and visibility to test some of the nation�s most exciting aerospace vehicles. Today, NASA Dryden is NASA's premier flight research and test organization, continuing to push the envelope in the validation of high-risk aerospace technology and space exploration concepts, and in conducting airborne environmental and space science missions in the 21st century.

The SOFIA flight crew, consisting of Co-pilot Gordon Fullerton; DFRC, Pilot Bill Brocket; DFRC, Test Conductor Marty Trout; DFRC, Test Engineer Don Stonebrook; L-3, and Flight Engineer Larry Larose; JSC, descend the stairs after ferrying the 747SP airborne observatory from Waco, Texas, to its new home at NASA's Dryden Flight Research Center in California. NASA's Stratospheric Observatory for Infrared Astronomy, or SOFIA, arrived at NASA's Dryden Flight Research Center at Edwards Air Force Base, Calif. on May 31, 2007. The heavily modified Boeing 747SP was ferried to Dryden from Waco, Texas, where L-3 Communications Integrated Systems installed a German-built 2.5-meter infrared telescope and made other major modifications over the past several years. SOFIA is scheduled to undergo installation and integration of mission systems and a multi-phase flight test program at Dryden over the next three years that is expected to lead to a full operational capability to conduct astronomy missions in about 2010. During its expected 20-year lifetime, SOFIA will be capable of "Great Observatory" class astronomical science, providing astronomers with access to the visible, infrared and sub-millimeter spectrum with optimized performance in the mid-infrared to sub-millimeter range.

NASA's SOFIA airborne observatory lands at Edwards AFB after being flown from Waco, Texas to NASA Dryden for systems installation, integration and flight test. NASA's Stratospheric Observatory for Infrared Astronomy, or SOFIA, arrived at NASA's Dryden Flight Research Center at Edwards Air Force Base, Calif. on May 31, 2007. The heavily modified Boeing 747SP was ferried to Dryden from Waco, Texas, where L-3 Communications Integrated Systems installed a German-built 2.5-meter infrared telescope and made other major modifications over the past several years. SOFIA is scheduled to undergo installation and integration of mission systems and a multi-phase flight test program at Dryden over the next three years that is expected to lead to a full operational capability to conduct astronomy missions in about 2010. During its expected 20-year lifetime, SOFIA will be capable of "Great Observatory" class astronomical science, providing astronomers with access to the visible, infrared and sub-millimeter spectrum with optimized performance in the mid-infrared to sub-millimeter range.
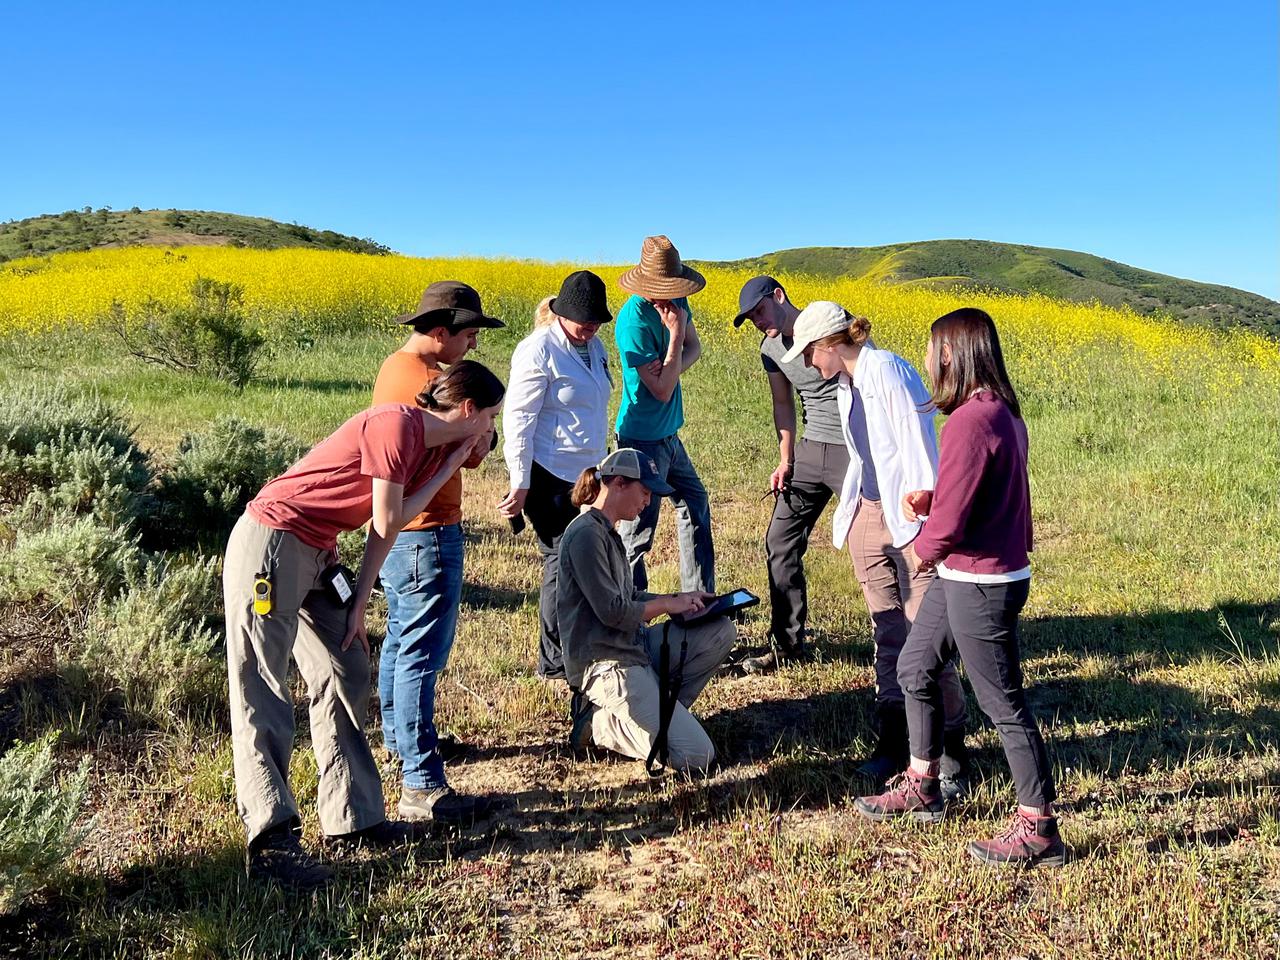
Dana Chadwick, a scientist in the water and ecosystems group at NASA's Jet Propulsion Laboratory, center, advises a field team of researchers from JPL; University of Wisconsin, Madison (UWM); University of California, Los Angeles (UCLA); University of Maryland, Baltimore County (UMBC); and University of California, Santa Barbara (UCSB) on vegetation-sampling locations at the Jack and Laura Dangermond Preserve in Santa Barbara County, California, on March 24, 2022. Chadwick and the team are working on the Surface Biology and Geology High-Frequency Time Series (SHIFT) campaign, which is jointly led by JPL, UCSB, and The Nature Conservancy. Chadwick is surrounded by, from left: Natalie Queally, a forest and wildlife ecology graduate student at UWM; Francisco Ochoa, a geography graduate student at UCLA; Petya Campbell, a research associate professor at UMBC and a research associate at NASA's Goddard Space Flight Center; Brendan Heberlein, a research intern at UWM; Renato Braghiere, a postdoctoral research scientist at JPL; Cassandra Nickles, a postdoctoral fellow at JPL; and Clare Saiki, a doctoral student at UCSB. Operating between late February and late May 2022, SHIFT combines the ability of airborne science instruments to gather data over widespread areas with the more concentrated observations scientists conduct in the field to study the functional characteristics, health, and resilience of plant communities. The sampling and analysis done by researchers on the ground and in the ocean is intended to validate data taken by AVIRIS-NG (Airborne Visible/Infrared Imaging Spectrometer-Next Generation). The instrument, designed at JPL, is collecting spectral data of vegetation it observes during weekly flights in an aircraft over a 640-square-mile (1,656-square-kilometer) study area in Santa Barbara County and coastal Pacific waters. The campaign is a pathfinder for NASA's proposed Surface Biology and Geology (SBG) mission. SHIFT will help scientists design data collection and processing algorithms for that mission, which would launch no earlier than 2028. The SHIFT data is also intended to support the research and conservation objectives of The Nature Conservancy, which owns the Dangermond Preserve, and UCSB, which operates the Sedgwick Reserve, another nature preserve within the study area. More than 60 scientists from institutions around the U.S. have indicated they intend to use the SHIFT data in their research. https://photojournal.jpl.nasa.gov/catalog/PIA25141
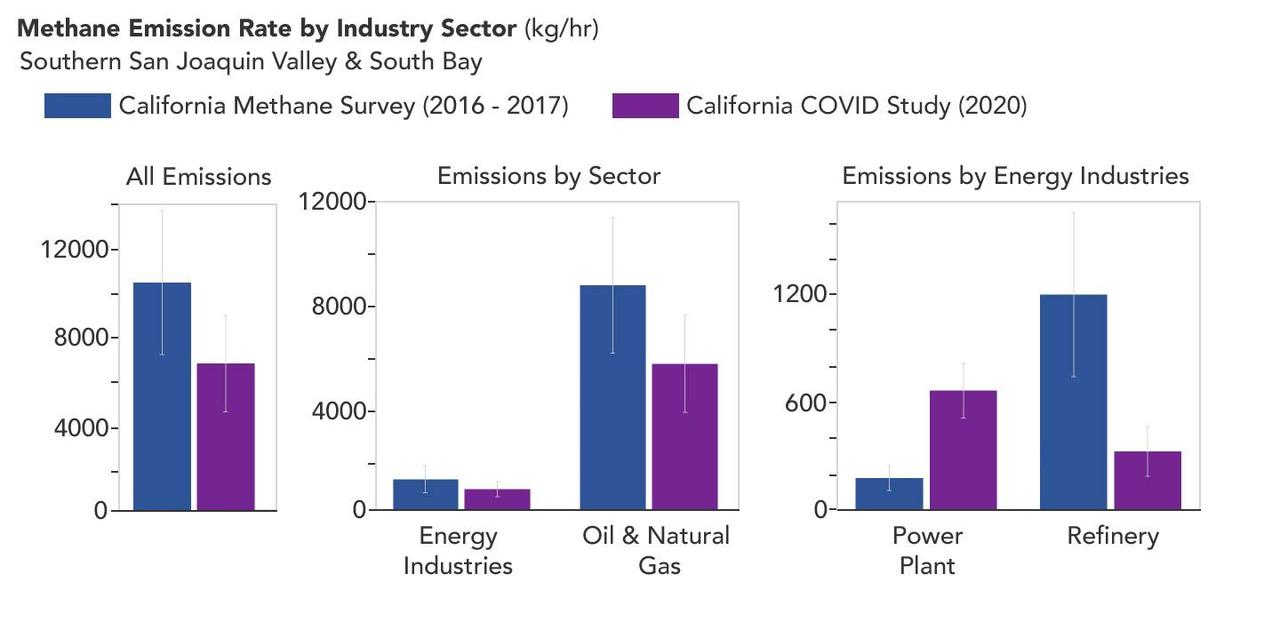
A March 2023 study by researchers at NASA's Jet Propulsion Laboratory in Southern California compared emissions from a belt of oil refineries across the South Bay area of Los Angeles during the first summer of the COVID-19 pandemic to those observed three years earlier. Using data from a NASA airborne instrument, researchers saw that most of the facilities they identified as methane sources in 2016-17 were no longer emitting the greenhouse gas in 2020, leading to a 73% reduction in measured emissions. The study uses measurements made by an imaging spectrometer called AVIRIS-NG (Airborne Visible/Infrared Imaging Spectrometer-Next Generation). Attached to the bottom of an aircraft, the instrument can detect greenhouse gas emissions from individual facilities or even pieces of equipment by looking at how the gases absorb sunlight. In 2016 and 2017, AVIRIS-NG was flown over 22,000 square miles (57,000 square kilometers) of the state as part of the California Methane Survey. From July to September 2020, researchers retraced some of those flight paths over refineries and power plants in Los Angeles County and over oil fields in central California's San Joaquin Valley. The flights were funded by NASA's Earth Science Division, the California Air Resources Board, and the California Energy Commission. The 2020 surveys over Los Angeles identified only 11 plumes from five refinery sources, with a total emissions rate of about 712 pounds (323 kilograms) methane per hour. The 2016 and 2017 flights had found 48 plumes from 33 sources, with a total emissions rate of roughly 2,639 pounds (1,197 kilograms) methane per hour. The drop correlates with an 18% decrease in monthly production in Southern California refineries between the two flight campaigns, the scientists noted, citing data from the California Energy Commission. The study also found that emissions from oil fields in and around the city of Bakersfield in central California fell 34.2%, correlating with a 24.2% drop in oil production. Reduced production during the pandemic due to lower demand for fuel and lower gas prices could have led to the drop in methane emissions, as oil fields and refineries emitted less methane as part of operations. However, researchers said, improved equipment maintenance and mitigation efforts at those facilities between 2016 and 2020 can't be ruled out as a factor. https://photojournal.jpl.nasa.gov/catalog/PIA25864
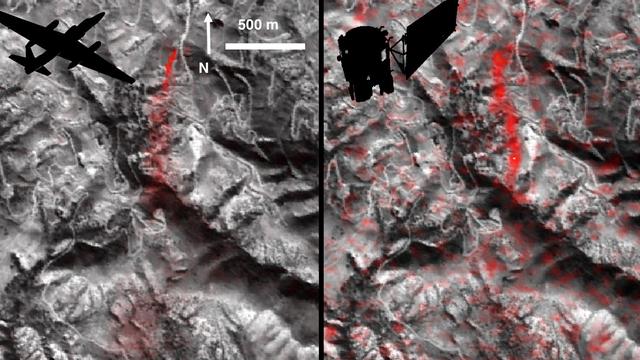
Atmospheric methane is a potent greenhouse gas, but the percentage of it produced through human activities is still poorly understood. Future instruments on orbiting satellites can help address this issue by surveying human-produced methane emissions. Recent data from the Aliso Canyon event, a large accidental methane release near Porter Ranch, California, demonstrates this capability. The Hyperion imaging spectrometer onboard NASA's EO-1 satellite successfully detected this release event on three different overpasses during the winter of 2015-2016. This is the first time the methane plume from a single facility has been observed from space. The orbital observations were consistent with airborne measurements. This image pair shows a comparison of detected methane plumes over Aliso Canyon, California, acquired 11 days apart in Jan. 2016 by: (left) NASA's AVIRIS instrument on a NASA ER-2 aircraft at 4.1 miles (6.6 kilometers) altitude and (right) by the Hyperion instrument on NASA's Earth Observing-1 satellite in low-Earth orbit. The additional red streaks visible in the EO-1 Hyperion image result from measurement noise -- Hyperion was not specifically designed for methane sensing and is not as sensitive as AVIRIS-NG. Additionally, the EO-1 satellite's current orbit provided poor illumination conditions. Future instruments with much greater sensitivity on orbiting satellites can survey the biggest sources of human-produced methane around the world. http://photojournal.jpl.nasa.gov/catalog/PIA20716
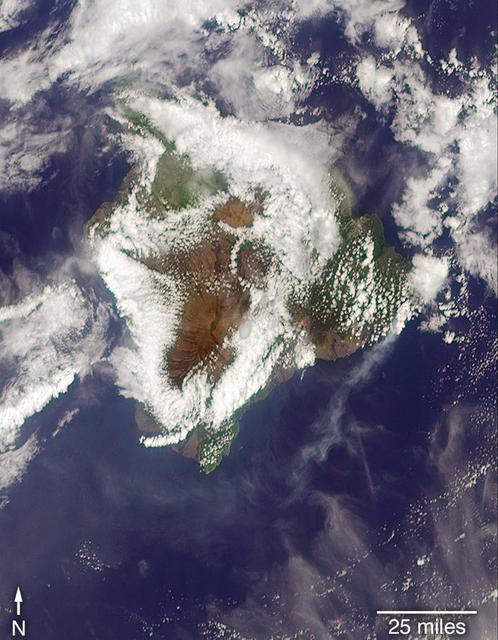
On May 3, 2018, a new eruption began at a fissure of the Kilauea volcano on the Island of Hawaii. Kilauea is the most active volcano in the world, having erupted almost continuously since 1983. Advancing lava and dangerous sulfur dioxide gas have forced thousands of residents in the neighborhood of Leilani Estates to evacuate. A number of homes have been destroyed, and no one can say how soon the eruption will abate and evacuees can return home. On May 6, 2018, at approximately 11 a.m. local time, the Multi-angle Imaging SpectroRadiometer (MISR) instrument on NASA's Terra satellite captured this view of the island as it passed overhead. Much of the island was shrouded by clouds, including the fissure on its eastern point. However, an eruption plume is visible streaming southwest over the ocean. The MISR instrument is unique in that it has nine cameras that view Earth at different angles: one pointing downward, four at various angles in the forward direction, and four in the backward direction. This image shows the view from one of MISR's forward-pointing cameras (60 degrees), which shows the plume more distinctly than the near-vertical views. The information from the images acquired at different view angles is used to calculate the height of the plume, results of which are superimposed on the right-hand image. The top of the plume near the fissure is at approximately 6,500 feet (2,000 meters) altitude, and the height of the plume decreases as it travels south and west. These relatively low altitudes mean that the ash and sulfur dioxide remained near the ground, which can cause health issues for people on the island downwind of the eruption. The "Ocean View" air quality monitor operated by the Clean Air Branch of the State of Hawaii Department of Health recorded a concentration of 18 μg/m3 of airborne particles less than 2.5 micrometers in diameter at 11 a.m. local time. This amount corresponds to an air quality rating of "moderate" and supports the MISR results indicating that ash was most likely present at ground level on this side of the island. These data were acquired during Terra orbit 97780. An annotated version is available at https://photojournal.jpl.nasa.gov/catalog/PIA22451
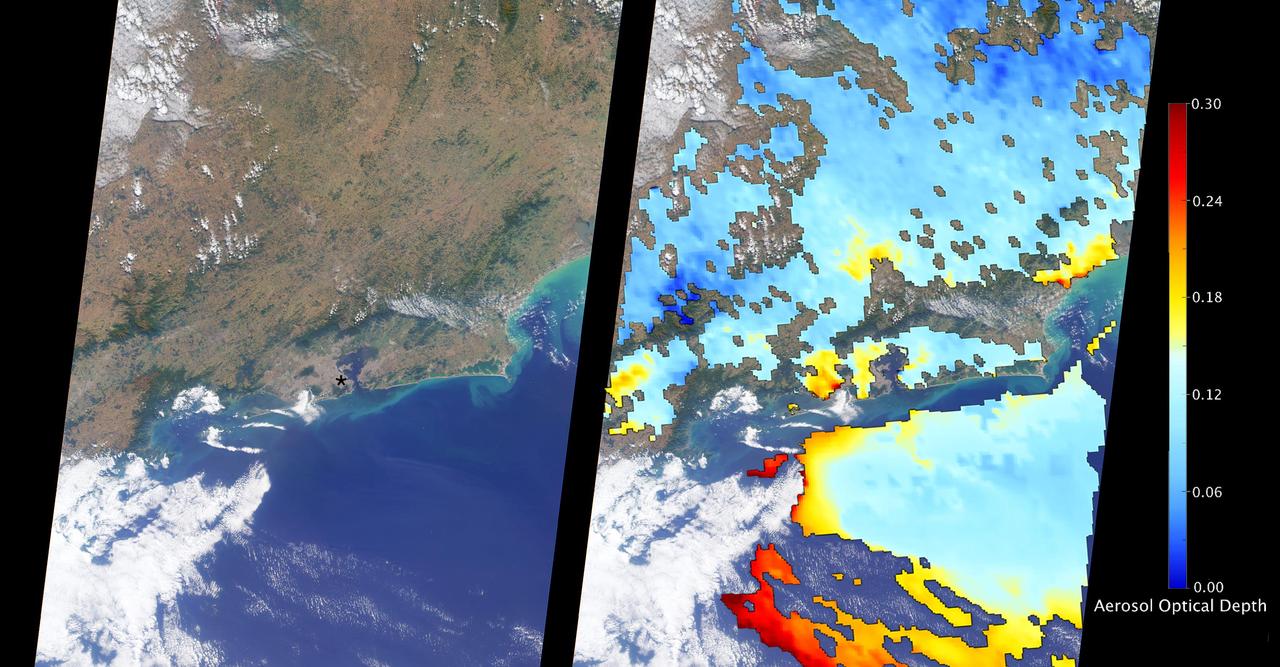
The Multi-angle Imaging SpectroRadiometer (MISR) instrument aboard NASA's Terra satellite passed directly over Rio de Janeiro, Brazil, on Aug. 2, 2016, just prior to the opening of the Summer Olympic Games. On the left is an image from MISR's nadir (downward-looking) camera; the width of the image is 235 miles (378 kilometers), and Rio de Janeiro is visible as the large gray area on the coast in the center. The black asterisk marks the location of the Maracanã Stadium in downtown, where the opening ceremonies were held. In the weeks leading up to the Aug. 5 opening ceremonies in Rio de Janeiro, there have been reports of elevated levels of particulate matter in the region. Particulate matter refers to tiny airborne droplets or pieces of soot and dust that can end up in the lungs, comprising an all-too-common problem for many cities around the world. MISR data are routinely used to estimate the amount of air pollution via measurements of aerosol optical depth, which is a measure of how much incoming light from the sun is blocked by particles in the atmosphere. On the right, a map of aerosol optical depth is superimposed on the image. Individual squares making up this map measure 2.7 miles (4.4 kilometers) on a side, and holes in the map occur where an aerosol amount could not be determined, such as where clouds are present. Optical depth over Rio is slightly elevated compared to its surroundings, most likely due to the presence of air pollution, with values from 0.15-0.25. For reference, an optical depth of 0.2 corresponds to light haze. The product shown here is a prototype of a new version of the MISR aerosol product to be publicly released in the near future, and increases the spatial resolution of the aerosol information by a factor of 16 compared to the currently available product, making it possible to observe the fine details of optical depth over urban areas. These data were captured during Terra orbit 88426. http://photojournal.jpl.nasa.gov/catalog/PIA20885
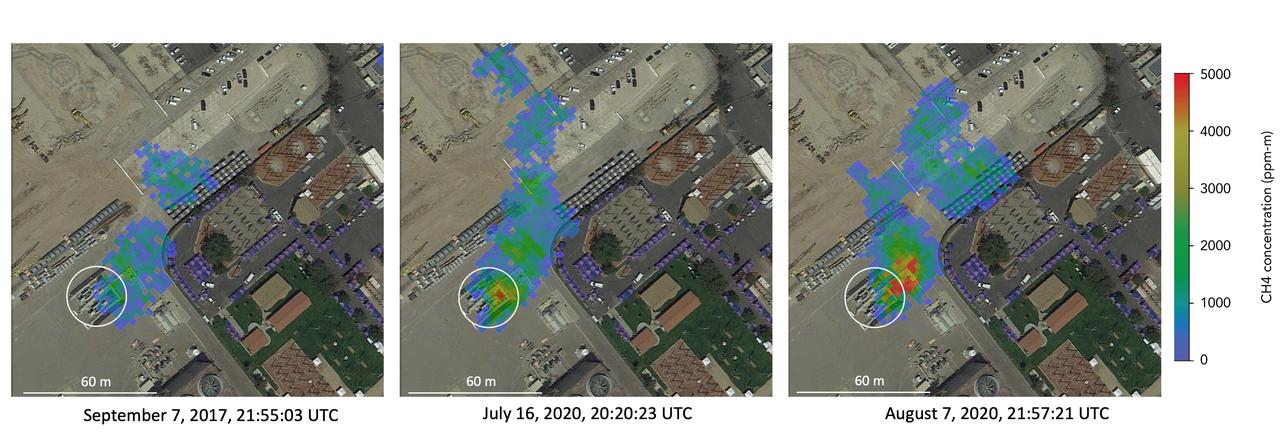
Atmospheric methane is a potent greenhouse gas and an important contributor to air quality. Future instruments on orbiting satellites can help improve our understanding of important methane emission sources. NASA conducts periodic methane studies using the next-generation Airborne Visible/Infrared Imaging Spectrometer (AVIRIS-NG) instrument. These studies are determining the locations and magnitudes of the largest methane emission sources across California, including those associated with landfills, refineries, dairies, wastewater treatment plants, oil and gas fields, power plants, and natural gas infrastructure. These three images show concentrations of methane in a natural gas plume relative to background air measured by AVIRIS-NG, overlaid on true-color land surface images (source: Google Earth). The aircraft was flying at an altitude of about 10,000 feet (3,000 meters) above ground level and the AVIRIS-NG image pixels are each about 10 feet (3 meters) across. The plume shape varies with changing emission rate, wind speed and direction. The methane plume originates from a compressor — circled in each image — at Valley Generating Station, a natural gas-fired power plant near Los Angeles. The color scale indicates the concentration of methane in each pixel relative to background methane concentrations in the surrounding atmosphere. The plume was initially detected by a single overflight in September 2017 but assumed at the time to be due to normal operations (intermittent venting). The plume was detected by AVIRIS-NG again on six flights in July-August 2020. https://photojournal.jpl.nasa.gov/catalog/PIA24019

For five years, Jeremy Harbeck has worked as a support scientist for NASA’s Operation IceBridge, an airborne mission to study polar ice. The data processing that he does typically takes place in an office at NASA’s Goddard Space Flight Center in Maryland. However, to speed the process of delivering data to the Arctic sea ice forecasting community, Harbeck traveled to Greenland for the first time in spring 2015. He had just arrived at Greenland’s Thule Air Base on March 20 when a mechanical issue grounded the aircraft. No science flight could happen for a few days. As teams in the United States and Greenland scrambled to locate and deliver a replacement part, researchers on the ground waited. Some of them hiked to what was locally known as “the iceberg.” The unnamed berg pictured above has been frozen in place by sea ice in North Star Bay. Harbeck shot the photograph—a composite of four 49-second images—on March 21 at about 2:30 a.m. local time. The sun never fully sets at this time of year in the Arctic, so sunlight appears on the left side of the image. Lights from Thule are visible on the right side. Look for the Milky Way (top left) and a few very faint meteors visible in the early morning sky. Harbeck left the dock at Thule with sea ice scientist (and current IceBridge project scientist) Nathan Kurtz and a local recreation officer at about 10 p.m. From there, the group hiked 2.4 kilometers (1.5 miles) across the still-thick sea ice in weather that Harbeck called a “pleasant” minus 18 degrees Celsius (0 degrees Fahrenheit). They paused frequently on the way, and they even circled the berg to check for polar bears. “You don’t have a sense of scale of this berg until you get up to it,” Harbeck said. “It’s about the size of my apartment building, and that’s only the part protruding from the water.” Assuming the berg is ungrounded (which is uncertain), about one-tenth of its mass is above water. Photograph by Jeremy Harbeck, support scientist for NASA's Operation IceBridge mission. Caption by Kathryn Hansen. Credit: <b><a href="http://www.earthobservatory.nasa.gov/" rel="nofollow"> NASA Earth Observatory</a></b> <b><a href="http://www.nasa.gov/audience/formedia/features/MP_Photo_Guidelines.html" rel="nofollow">NASA image use policy.</a></b> <b><a href="http://www.nasa.gov/centers/goddard/home/index.html" rel="nofollow">NASA Goddard Space Flight Center</a></b> enables NASA’s mission through four scientific endeavors: Earth Science, Heliophysics, Solar System Exploration, and Astrophysics. Goddard plays a leading role in NASA’s accomplishments by contributing compelling scientific knowledge to advance the Agency’s mission. <b>Follow us on <a href="http://twitter.com/NASAGoddardPix" rel="nofollow">Twitter</a></b> <b>Like us on <a href="http://www.facebook.com/pages/Greenbelt-MD/NASA-Goddard/395013845897?ref=tsd" rel="nofollow">Facebook</a></b> <b>Find us on <a href="http://instagrid.me/nasagoddard/?vm=grid" rel="nofollow">Instagram</a></b>
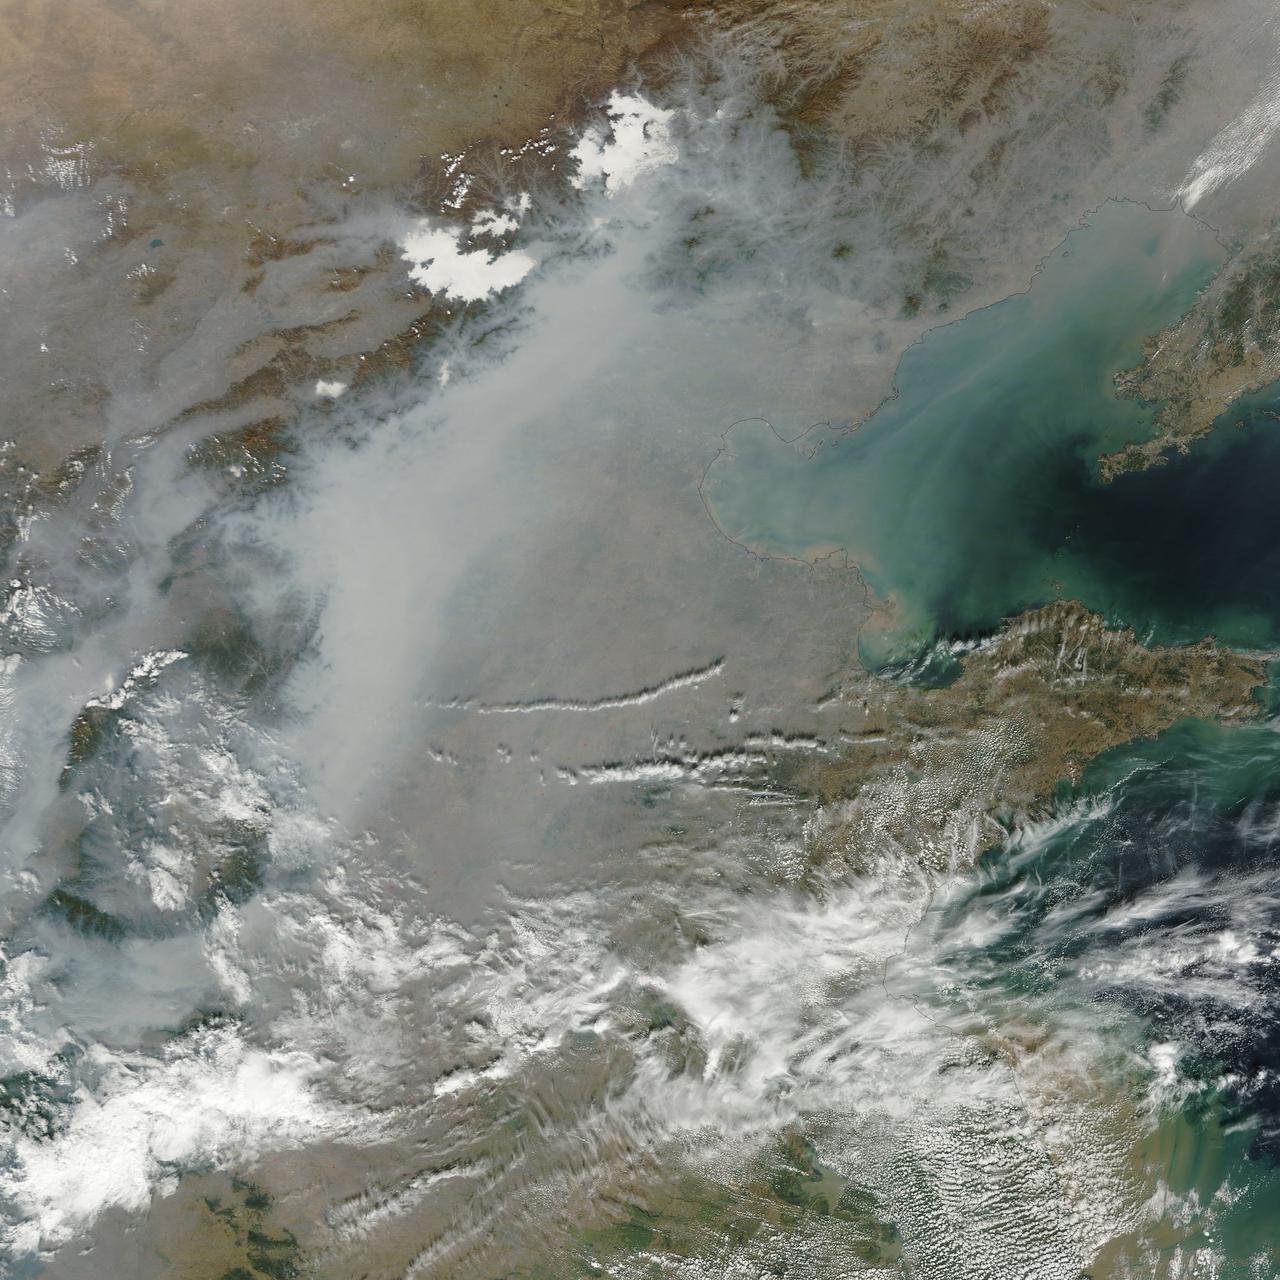
A thick layer of haze blanketed the North China Plain on October 9, 2014, when the Moderate Resolution Imaging Spectroradiometer (MODIS) on NASA’s Terra satellite acquired this natural-color image at 2:50 Coordinated Universal Time (10:50 a.m. local time). The haze obscured many features usually visible in MODIS imagery of the area, including China’s largest city, Beijing. On the day this image was acquired, measurements from ground-based sensors at the U.S. Consulate in Beijing reported PM2.5 measurements of 334 micrograms per cubic meter of air. Fine, airborne particulate matter (PM) that is smaller than 2.5 microns (about one thirtieth the width of a human hair) is considered dangerous because it is small enough to enter the passages of the human lungs. Most PM2.5 aerosol particles come from the burning of fossil fuels and biomass (wood fires and agricultural burning). The World Health Organization considers PM2.5 to be safe when it is below 25. Haze in this region tends to worsen in the fall and winter, when cold, heavy air traps pollutants near the surface. In this case, the haze was likely trapped by a temperature inversion. Normally, air is warmest near the surface of the Earth. Occasionally, a mass of warm air will move over cooler air so that the atmosphere actually warms with altitude. Since the cool air does not have the energy to rise through the warm air, vertical circulation slows and air becomes trapped near the surface. Any pollutant that enters the air gets trapped as well, and haze builds up over time. Daily satellite images of the North China Plain show that visible haze began to accumulate on October 7, 2014. NASA image courtesy Jeff Schmaltz, LANCE MODIS Rapid Response. Caption by Adam Voiland. Read more: <a href="http://earthobservatory.nasa.gov/NaturalHazards/view.php?id=84530&eocn=home&eoci=nh" rel="nofollow">earthobservatory.nasa.gov/NaturalHazards/view.php?id=8453...</a> Credit: <b><a href="http://www.earthobservatory.nasa.gov/" rel="nofollow"> NASA Earth Observatory</a></b> <b><a href="http://www.nasa.gov/audience/formedia/features/MP_Photo_Guidelines.html" rel="nofollow">NASA image use policy.</a></b> <b><a href="http://www.nasa.gov/centers/goddard/home/index.html" rel="nofollow">NASA Goddard Space Flight Center</a></b> enables NASA’s mission through four scientific endeavors: Earth Science, Heliophysics, Solar System Exploration, and Astrophysics. Goddard plays a leading role in NASA’s accomplishments by contributing compelling scientific knowledge to advance the Agency’s mission. <b>Follow us on <a href="http://twitter.com/NASAGoddardPix" rel="nofollow">Twitter</a></b> <b>Like us on <a href="http://www.facebook.com/pages/Greenbelt-MD/NASA-Goddard/395013845897?ref=tsd" rel="nofollow">Facebook</a></b> <b>Find us on <a href="http://instagram.com/nasagoddard?vm=grid" rel="nofollow">Instagram</a></b>