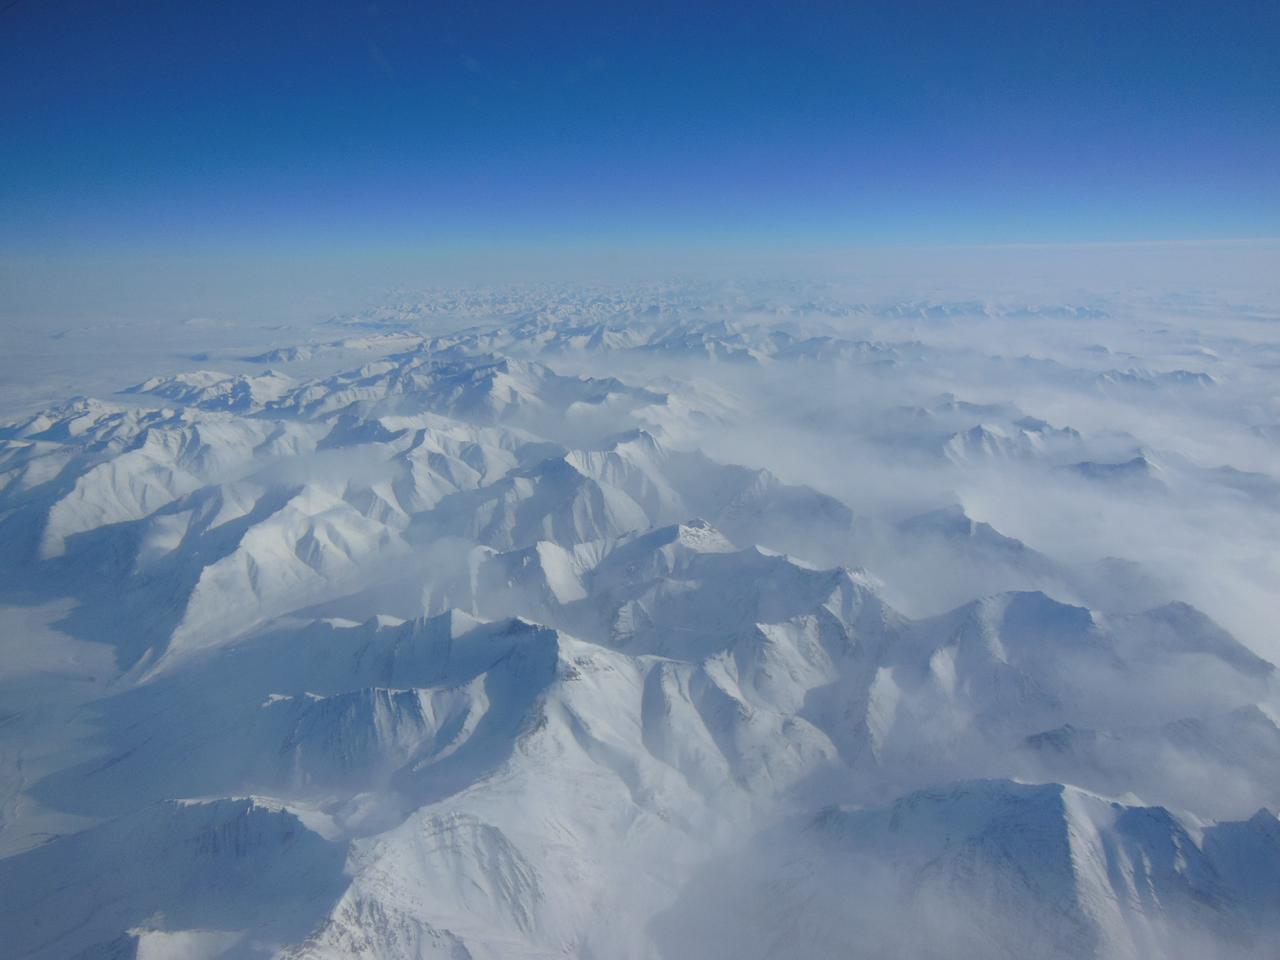
Alaskan mountains seen from high altitude aboard the NASA P-3B during the IceBridge transit flight from Thule to Fairbanks on Mar. 21, 2013. NASA's Operation IceBridge is an airborne science mission to study Earth's polar ice. For more information about IceBridge, visit: <a href="http://www.nasa.gov/icebridge" rel="nofollow">www.nasa.gov/icebridge</a> Credit: NASA/Goddard/Christy Hansen <b><a href="http://www.nasa.gov/audience/formedia/features/MP_Photo_Guidelines.html" rel="nofollow">NASA image use policy.</a></b> <b><a href="http://www.nasa.gov/centers/goddard/home/index.html" rel="nofollow">NASA Goddard Space Flight Center</a></b> enables NASA’s mission through four scientific endeavors: Earth Science, Heliophysics, Solar System Exploration, and Astrophysics. Goddard plays a leading role in NASA’s accomplishments by contributing compelling scientific knowledge to advance the Agency’s mission. <b>Follow us on <a href="http://twitter.com/NASA_GoddardPix" rel="nofollow">Twitter</a></b> <b>Like us on <a href="http://www.facebook.com/pages/Greenbelt-MD/NASA-Goddard/395013845897?ref=tsd" rel="nofollow">Facebook</a></b> <b>Find us on <a href="http://instagram.com/nasagoddard?vm=grid" rel="nofollow">Instagram</a></b>
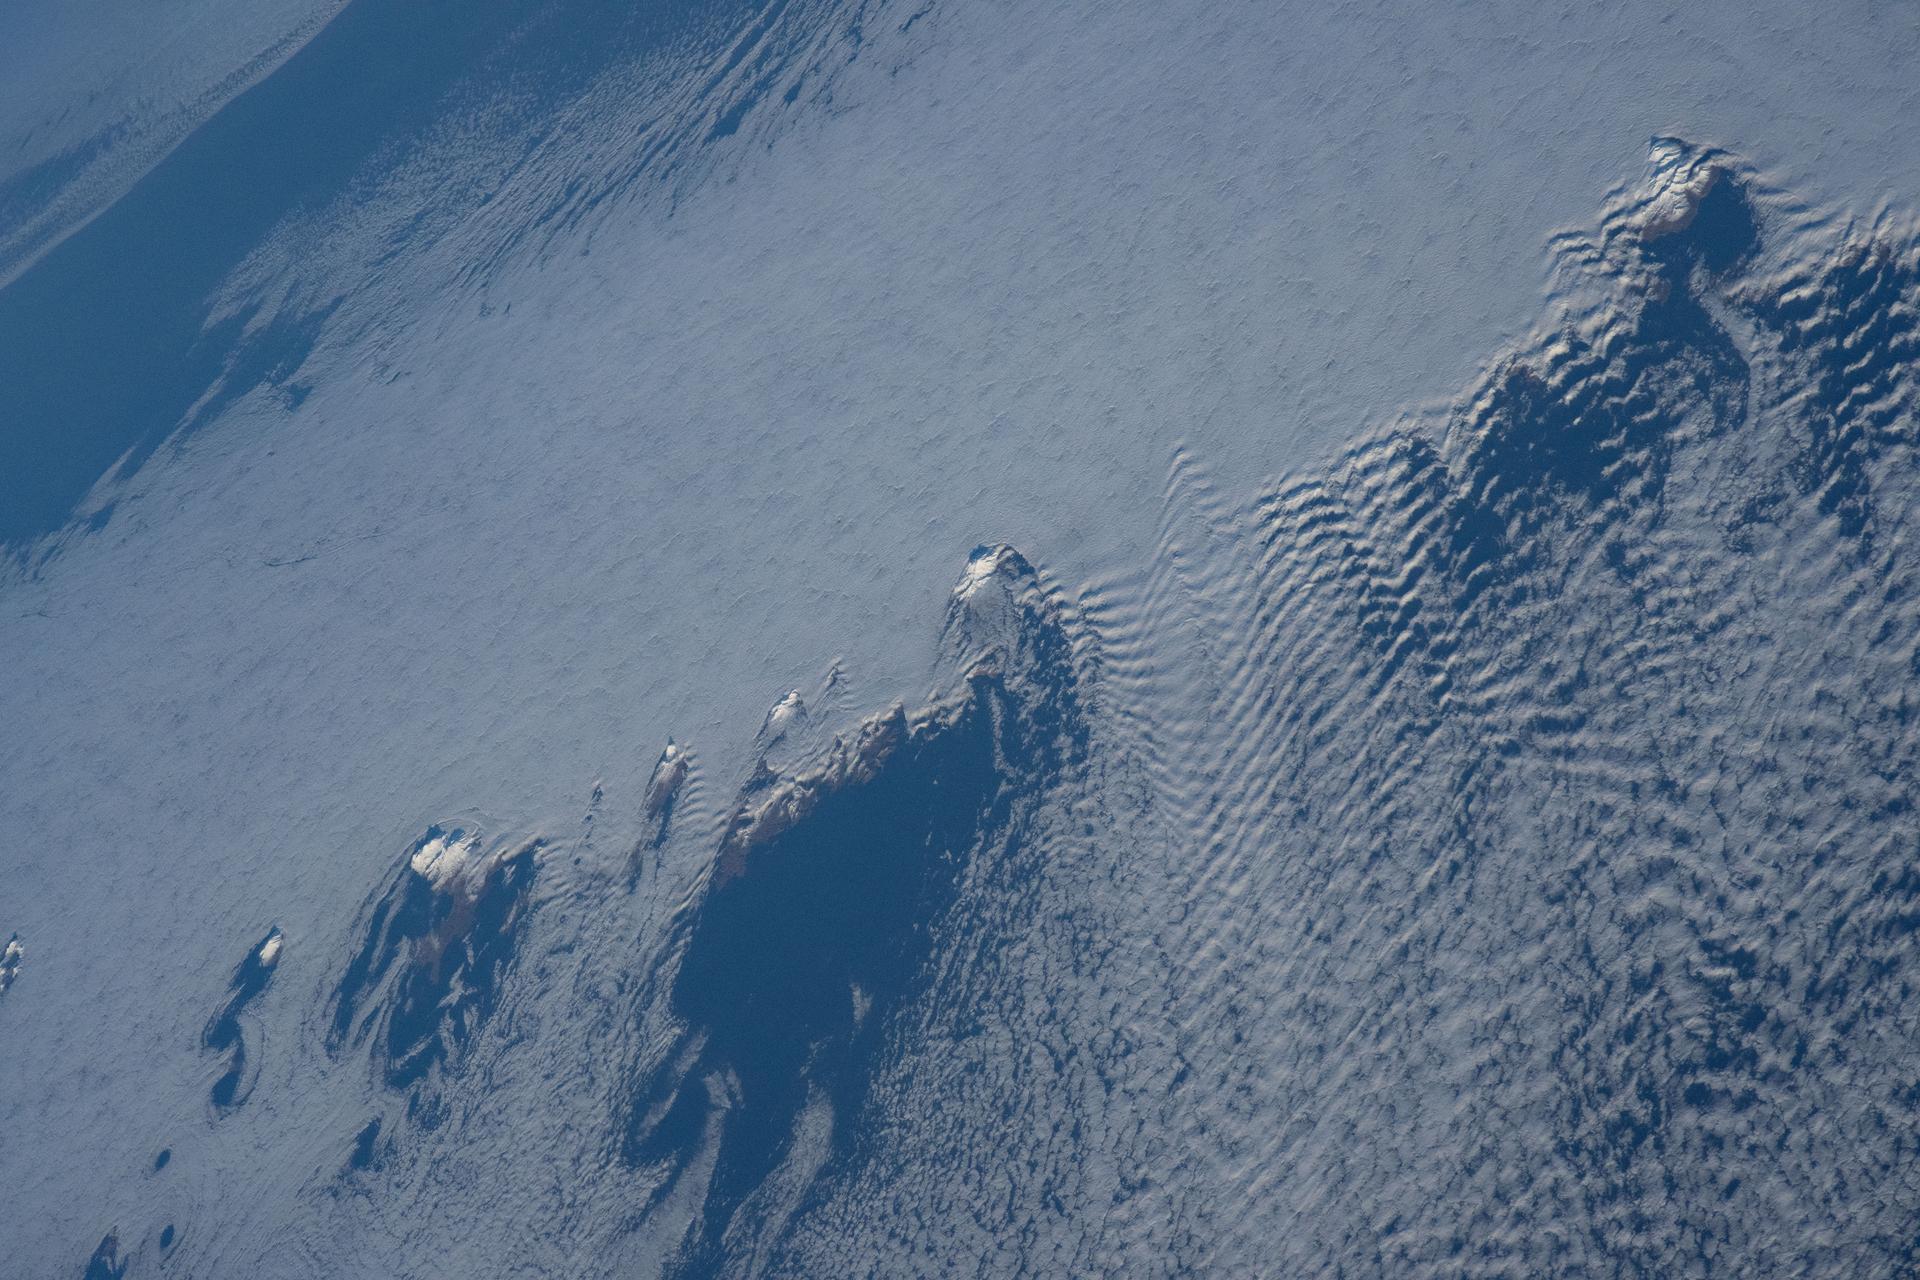
iss074e0008922 (Dec. 12, 2025) --- Snow-capped mountain tops of Alaska's Aleutian Islands pierce through the clouds, disturbing the air and creating wave-like patterns known as altocumulus clouds. This photograph was taken from the International Space Station as it orbited 264 miles above the North Pacific Ocean.
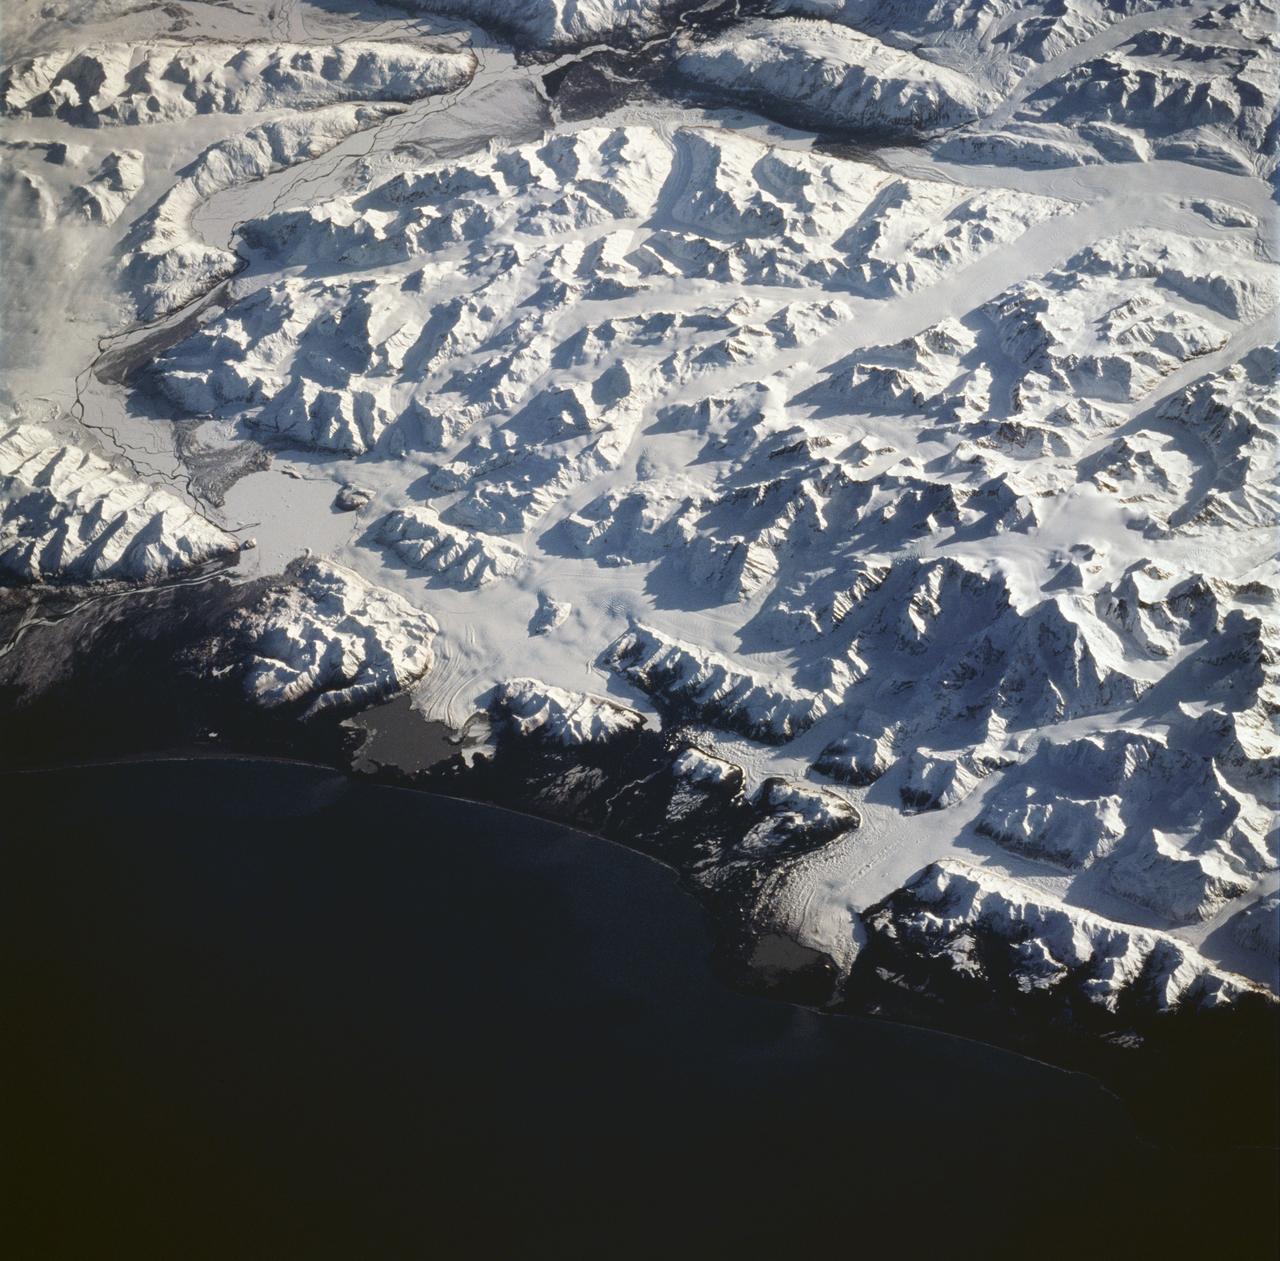
STS059-228-094 (9-20 April 1994) --- The spring thaw along the coast of the Gulf of Alaska has not touched the St. Elias Mountains, southeast of Yakutat Bay and Malaspina Glacier. A prominent glacier flows from Mt. Fairweather (15,300 feet) at right center, to form Cape Fairweather. Another glacier to the northwest almost reaches the sea; the valley of the Alsek River forms a broad, braided plan at upper left. The low sun elevation and oblique angle of this photograph provide a striking 3-dimensional appearance to the black-and-white landscape. SRL investigators will study microwave response to varying depths and conditions of ice and snow along this coast, in Spring and Summer. Hasselblad photograph.
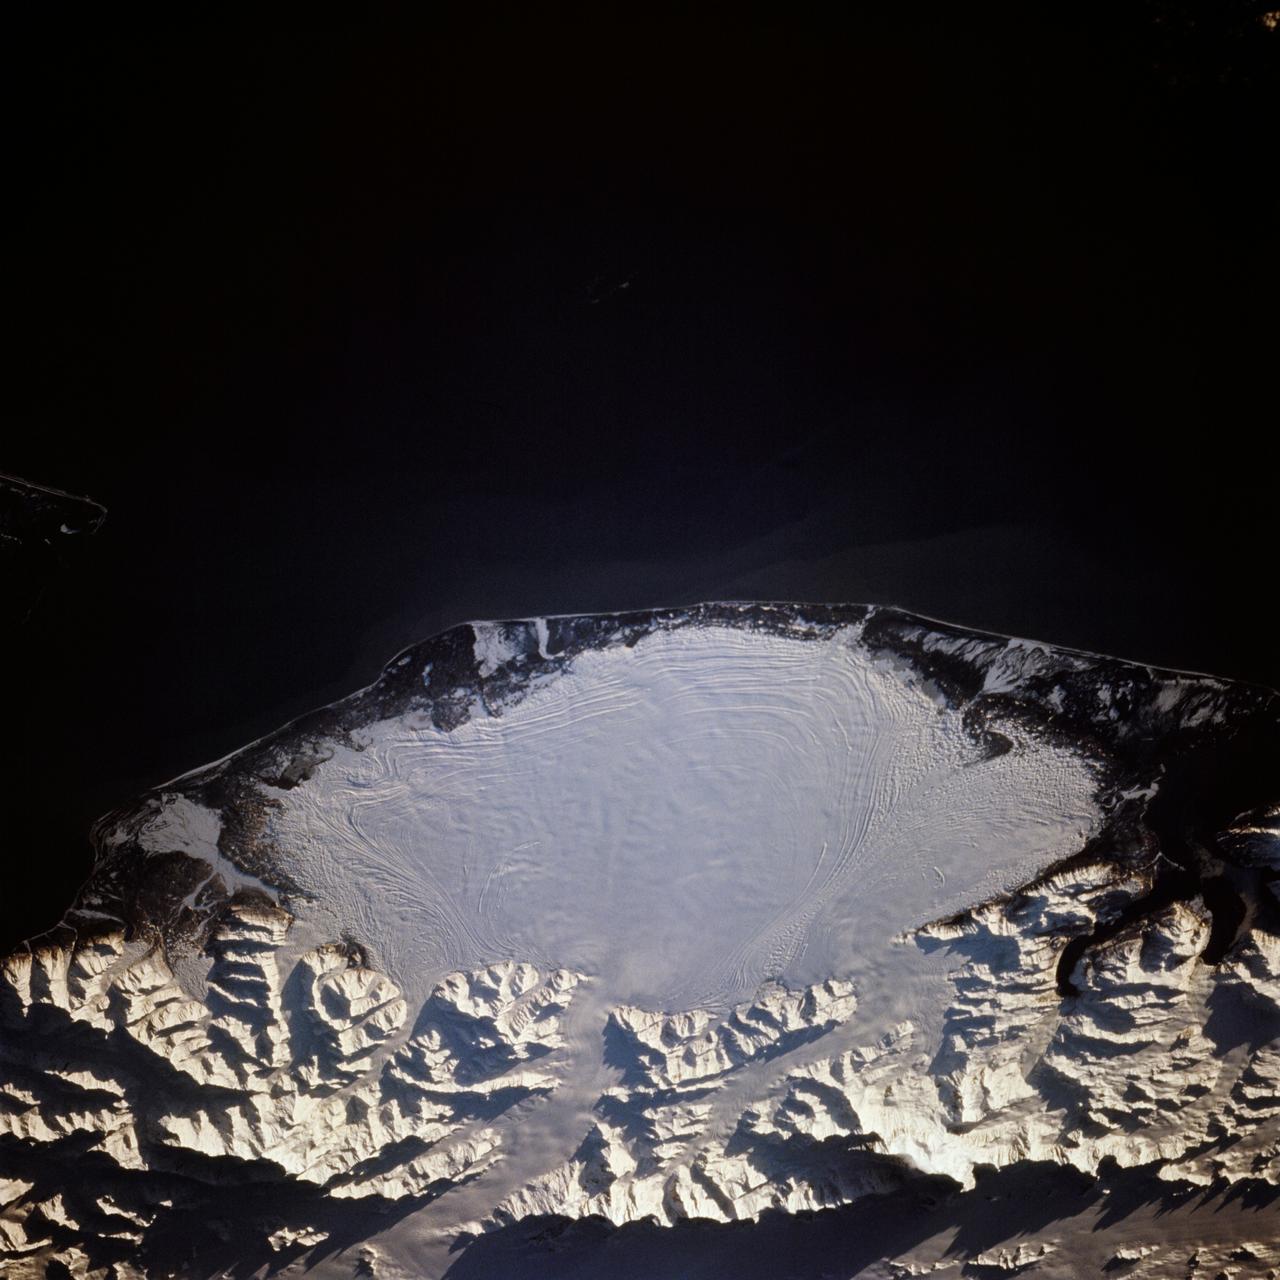
STS066-117-014 (3-14 Nov. 1994) --- Malaspina Glacier can be seen in this north-northeastern photograph taken in November, 1994. The glacier, located in the south shore of Alaska is a classic example of a piedmont glacier lying along the foot of a mountain range. The principal source of ice for the glacier is provided by the Seward Ice Field to the north (top portion of the view) which flows through three narrow outlets onto the coastal plain. The glacier moves in surges that rush earlier-formed moraines outward into the expanding concentric patterns along the flanks of the ice mass.
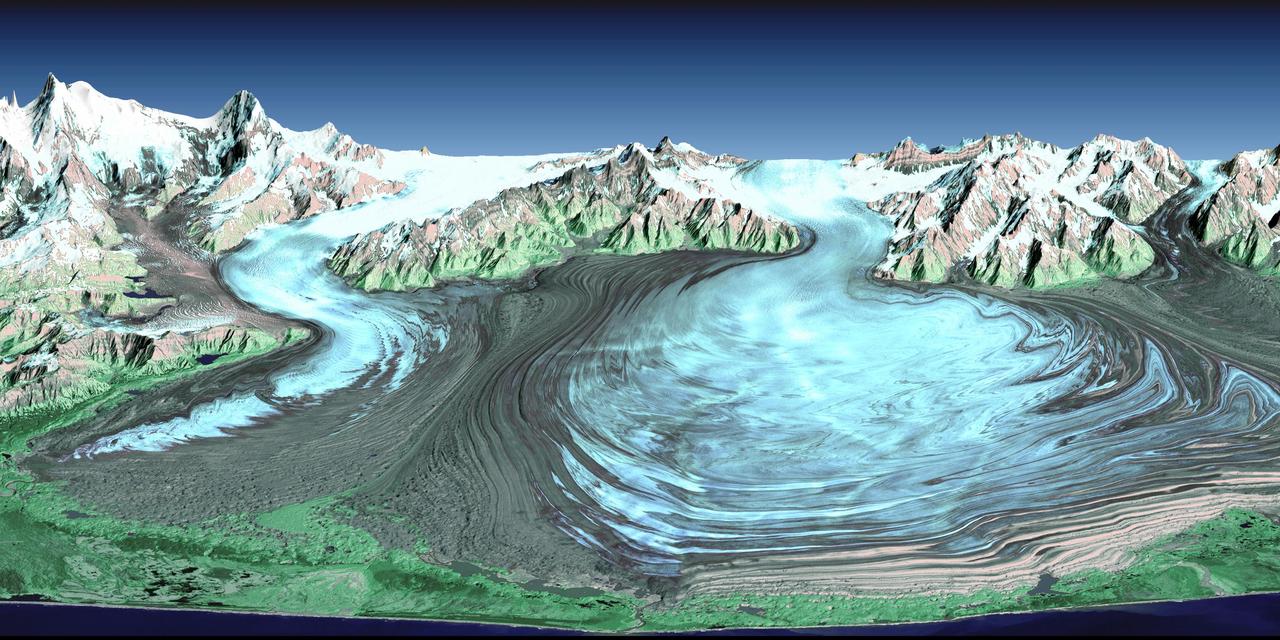
Malaspina Glacier in southeastern Alaska is considered the classic example of a piedmont glacier. Piedmont glaciers occur where valley glaciers exit a mountain range onto broad lowlands, are no longer laterally confined, and spread to become wide lobes.
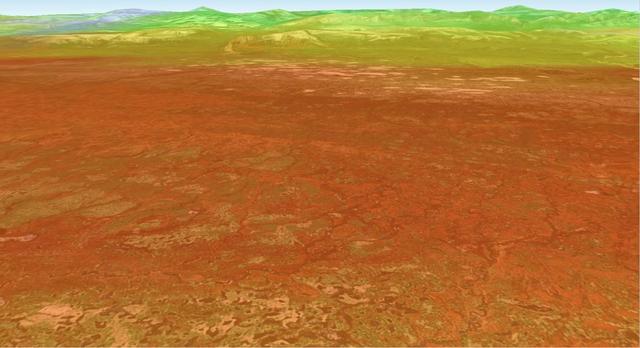
JPL-led study shows bromine explosion on March 13, 2008 across the western Northwest Territories in Canada looking toward the Mackenzie Mountains at the horizon, which prevented the bromine from crossing over into Alaska.
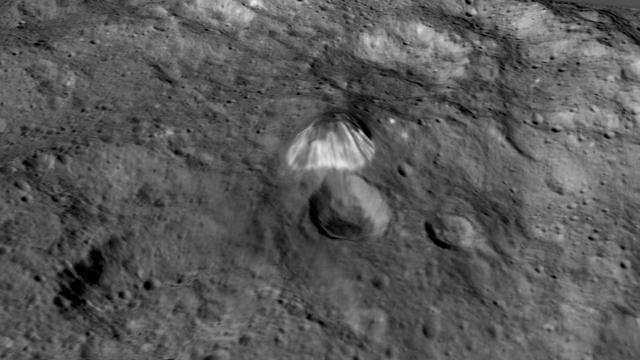
Among the highest features seen on Ceres so far is a mountain about 4 miles (6 kilometers) high, which is roughly the elevation of Mount McKinley in Alaska's Denali National Park. This image comes from an animation, shown in PIA19619, generated using data from NASA's Dawn spacecraft. Vertical relief has been exaggerated by a factor of five. Exaggerating the relief helps scientists understand and visualize the topography much more easily, and highlights features that are sometimes subtle. http://photojournal.jpl.nasa.gov/catalog/PIA19618
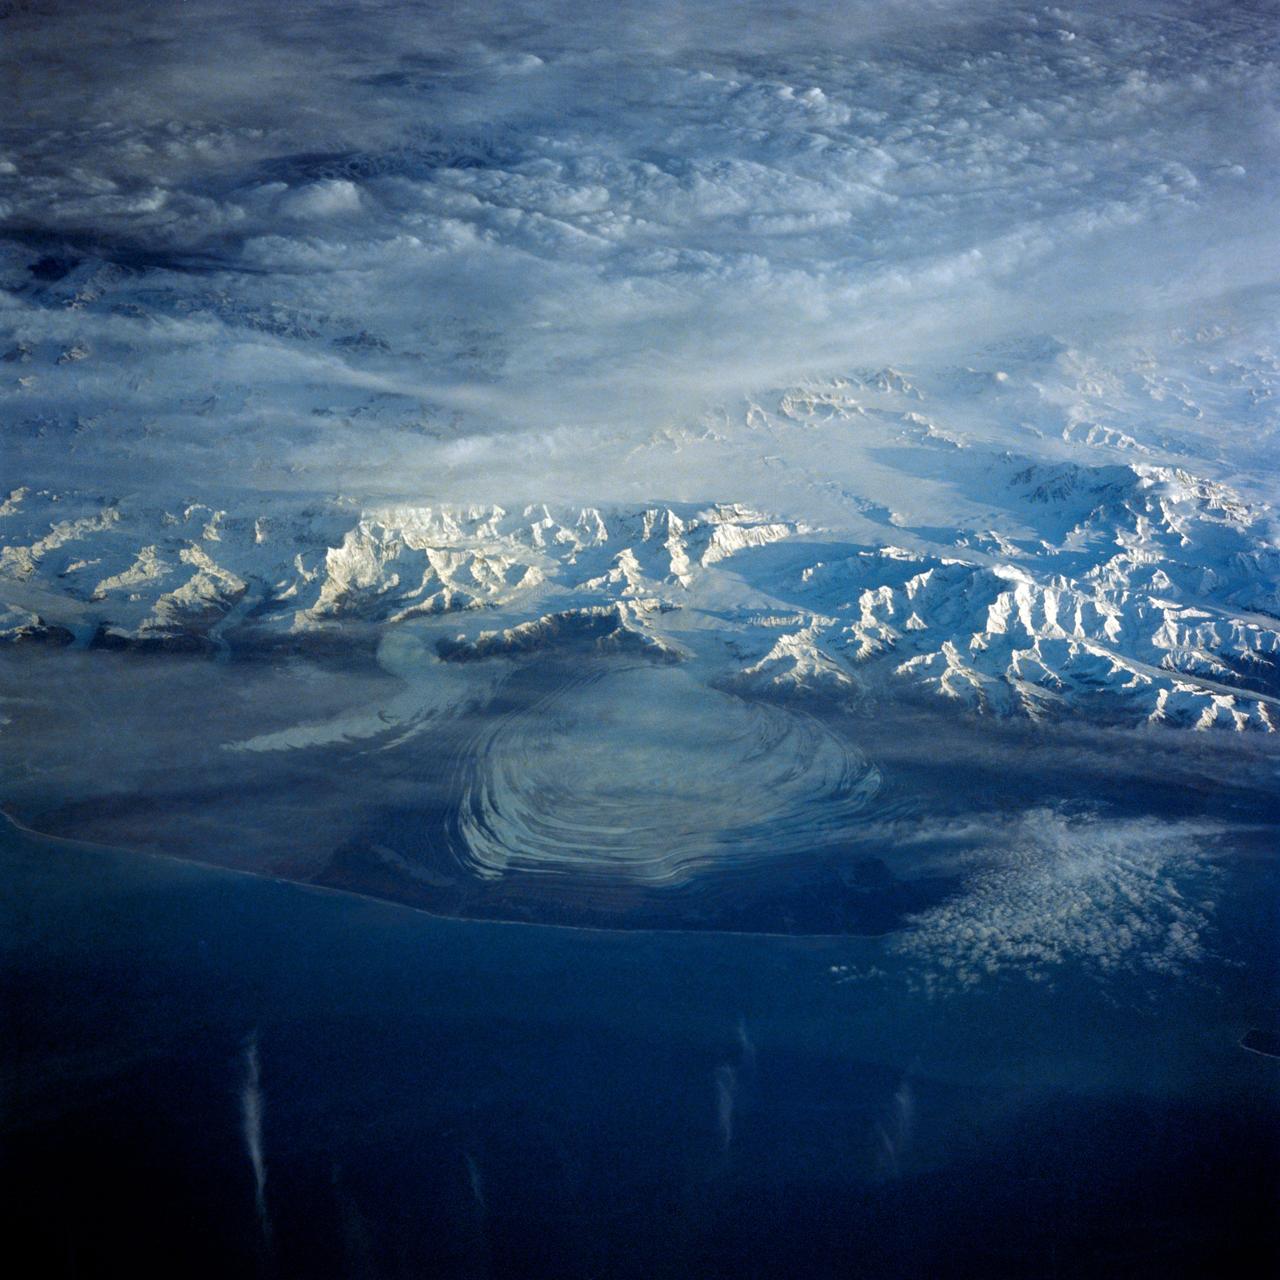
41G-43-016 (5-13 Oct 1984) --- The Gulf of Alaska, with the great peaks of the Saint Elias Range of Alaska, Yukon, and British Columbia. Mount Logan, Canada's highest mountain peak at 19,850 feet, is to the left of the center of the photograph. Between Saint Elias Peak and Mount Vancouver, right of center, flows the great Malaspina Glacier in a great lobe of ice shaped like a human ear.
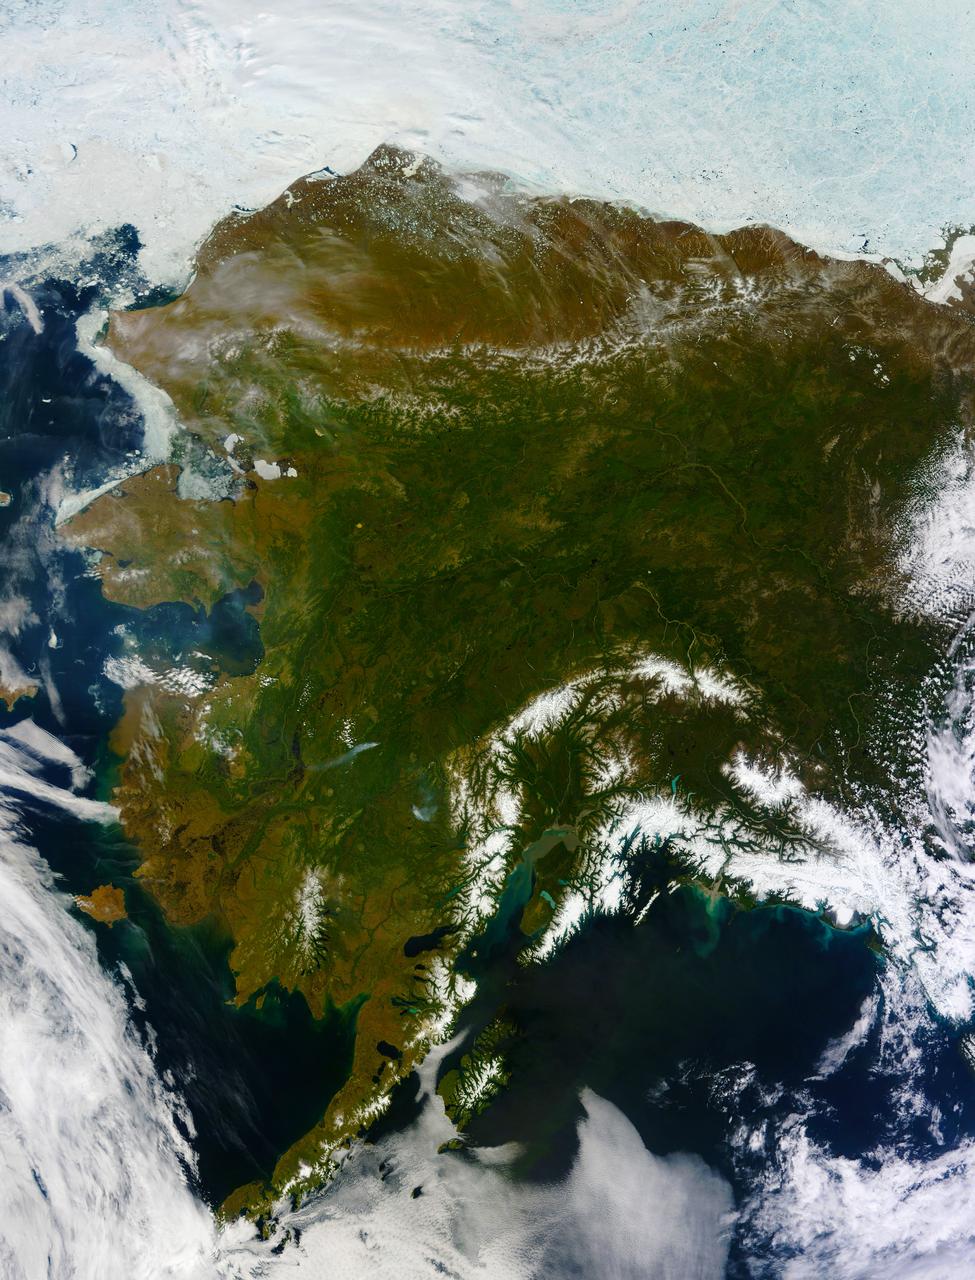
On most days, relentless rivers of clouds wash over Alaska, obscuring most of the state’s 6,640 miles (10,690 kilometers) of coastline and 586,000 square miles (1,518,000 square kilometers) of land. The south coast of Alaska even has the dubious distinction of being the cloudiest region of the United States, with some locations averaging more than 340 cloudy days per year. That was certainly not the case on June 17, 2013, the date that the Moderate Resolution Imaging Spectroradiometer (MODIS) on NASA’s Terra satellite acquired this rare, nearly cloud-free view of the state. The absence of clouds exposed a striking tapestry of water, ice, land, forests, and even wildfires. Snow-covered mountains such as the Alaska Range and Chugach Mountains were visible in southern Alaska, while the arc of mountains that make up the Brooks Range dominated the northern part of the state. The Yukon River—the longest in Alaska and the third longest in the United States—wound its way through the green boreal forests that inhabit the interior of the state. Plumes of sediment and glacial dust poured into the Gulf of Alaska from the Copper River. And Iliamna Lake, the largest in Alaska, was ice free. The same ridge of high pressure that cleared Alaska’s skies also brought stifling temperatures to many areas accustomed to chilly June days. Talkeetna, a town about 100 miles north of Anchorage, saw temperatures reach 96°F (36°C) on June 17. Other towns in southern Alaska set all-time record highs, including Cordova, Valez, and Seward. The high temperatures also helped fuel wildfires and hastened the breakup of sea ice in the Chukchi Sea. NASA image courtesy Jeff Schmaltz, LANCE MODIS Rapid Response Team at NASA GSFC. Caption by Adam Voiland. Instrument: Terra - MODIS More info: <a href="http://1.usa.gov/102MAEj" rel="nofollow">1.usa.gov/102MAEj</a> Credit: <b><a href="http://www.earthobservatory.nasa.gov/" rel="nofollow"> NASA Earth Observatory</a></b> <b><a href="http://www.nasa.gov/audience/formedia/features/MP_Photo_Guidelines.html" rel="nofollow">NASA image use policy.</a></b> <b><a href="http://www.nasa.gov/centers/goddard/home/index.html" rel="nofollow">NASA Goddard Space Flight Center</a></b> enables NASA’s mission through four scientific endeavors: Earth Science, Heliophysics, Solar System Exploration, and Astrophysics. Goddard plays a leading role in NASA’s accomplishments by contributing compelling scientific knowledge to advance the Agency’s mission. <b>Follow us on <a href="http://twitter.com/NASA_GoddardPix" rel="nofollow">Twitter</a></b> <b>Like us on <a href="http://www.facebook.com/pages/Greenbelt-MD/NASA-Goddard/395013845897?ref=tsd" rel="nofollow">Facebook</a></b> <b>Find us on <a href="http://instagram.com/nasagoddard?vm=grid" rel="nofollow">Instagram</a></b>
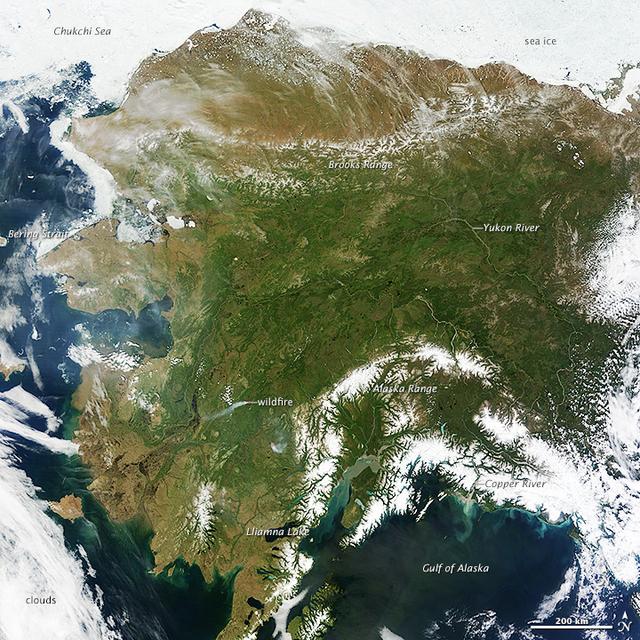
On most days, relentless rivers of clouds wash over Alaska, obscuring most of the state’s 6,640 miles (10,690 kilometers) of coastline and 586,000 square miles (1,518,000 square kilometers) of land. The south coast of Alaska even has the dubious distinction of being the cloudiest region of the United States, with some locations averaging more than 340 cloudy days per year. That was certainly not the case on June 17, 2013, the date that the Moderate Resolution Imaging Spectroradiometer (MODIS) on NASA’s Terra satellite acquired this rare, nearly cloud-free view of the state. The absence of clouds exposed a striking tapestry of water, ice, land, forests, and even wildfires. Snow-covered mountains such as the Alaska Range and Chugach Mountains were visible in southern Alaska, while the arc of mountains that make up the Brooks Range dominated the northern part of the state. The Yukon River—the longest in Alaska and the third longest in the United States—wound its way through the green boreal forests that inhabit the interior of the state. Plumes of sediment and glacial dust poured into the Gulf of Alaska from the Copper River. And Iliamna Lake, the largest in Alaska, was ice free. The same ridge of high pressure that cleared Alaska’s skies also brought stifling temperatures to many areas accustomed to chilly June days. Talkeetna, a town about 100 miles north of Anchorage, saw temperatures reach 96°F (36°C) on June 17. Other towns in southern Alaska set all-time record highs, including Cordova, Valez, and Seward. The high temperatures also helped fuel wildfires and hastened the breakup of sea ice in the Chukchi Sea. NASA image courtesy Jeff Schmaltz, LANCE MODIS Rapid Response Team at NASA GSFC. Caption by Adam Voiland. Instrument: Terra - MODIS More info: <a href="http://1.usa.gov/102MAEj" rel="nofollow">1.usa.gov/102MAEj</a> Credit: <b><a href="http://www.earthobservatory.nasa.gov/" rel="nofollow"> NASA Earth Observatory</a></b> <b><a href="http://www.nasa.gov/audience/formedia/features/MP_Photo_Guidelines.html" rel="nofollow">NASA image use policy.</a></b> <b><a href="http://www.nasa.gov/centers/goddard/home/index.html" rel="nofollow">NASA Goddard Space Flight Center</a></b> enables NASA’s mission through four scientific endeavors: Earth Science, Heliophysics, Solar System Exploration, and Astrophysics. Goddard plays a leading role in NASA’s accomplishments by contributing compelling scientific knowledge to advance the Agency’s mission. <b>Follow us on <a href="http://twitter.com/NASA_GoddardPix" rel="nofollow">Twitter</a></b> <b>Like us on <a href="http://www.facebook.com/pages/Greenbelt-MD/NASA-Goddard/395013845897?ref=tsd" rel="nofollow">Facebook</a></b> <b>Find us on <a href="http://instagram.com/nasagoddard?vm=grid" rel="nofollow">Instagram</a></b>

SL4-140-4111 (14 Jan. 1974) --- The Aleutian Islands area of Alaska, as photographed from the Skylab space station in Earth orbit by one of the Skylab 4 crewmen. The camera used was a hand-held Hasselblad, with SO-368 medium-speed Ektachrome. Here is another macro scale phenomenon which is difficult to observe except from a space platform. The Aleutian Islands and clouds with very elaborate van Karman vortices was photographed on Jan. 14, 1974. In addition to the vortices the waves in the clouds due to the mountains on the islands are very evident. In fact, the easiest way to find the mountains is to start with their atmospheric disturbance and work back to the mountain. Photo credit: NASA
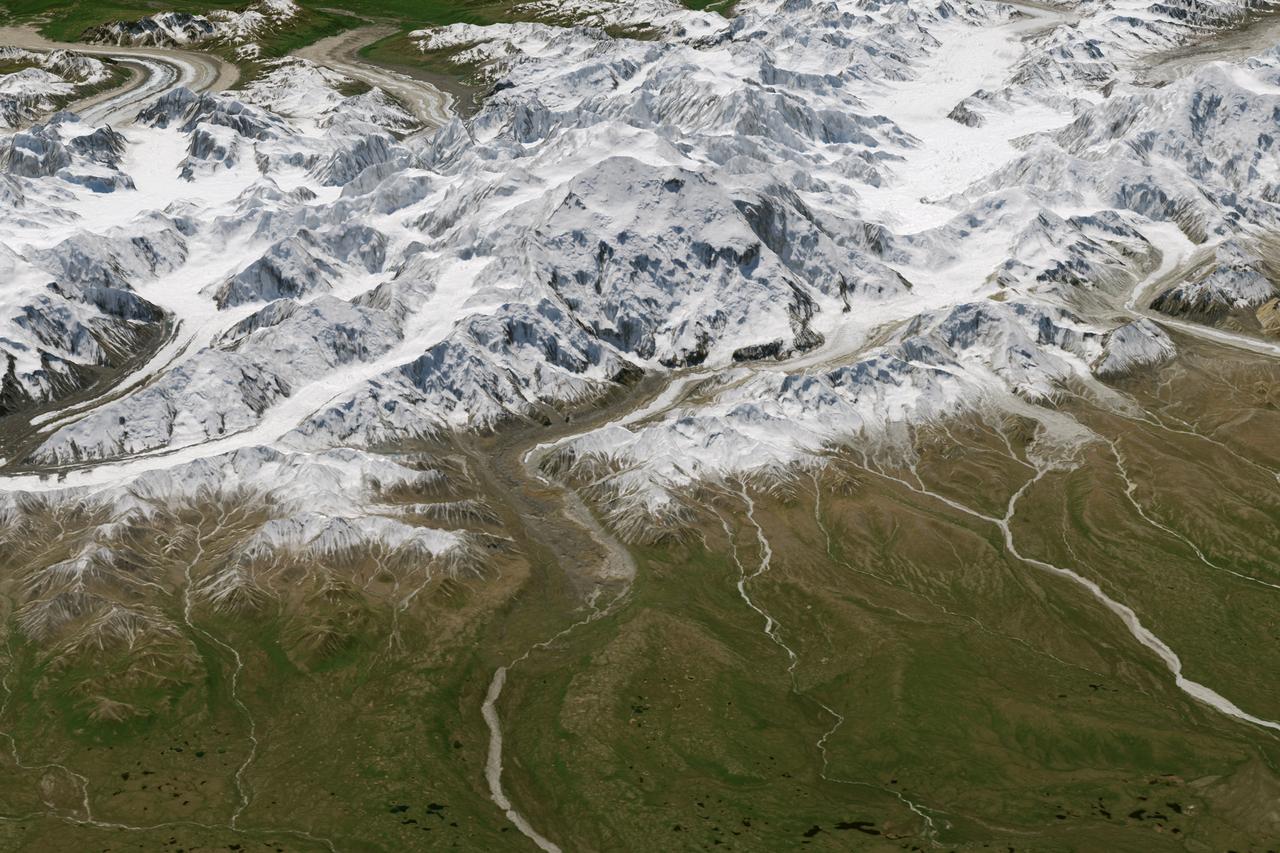
Physically, not too much has changed on Denali, North America’s highest peak. What did change in 2015 is how people describe and measure Alaska’s majestic mountain. On August 30, 2015, U.S. Secretary of the Interior Sally Jewell announced that the mountain’s official name would be Denali, not Mount McKinley. Restoration of the traditional Koyukon Athabascan name of Denali, which means “the tall one,” resolved a request by former Alaska Gov. Jay Hammond that dates back to 1975. But the mountain’s name was not the only change. On September 2, its elevation was also revised. The U.S. Geological Survey announced that Denali’s summit had a new, official elevation of 20,310 feet (6,190 meters)—10 feet shorter than surveyors had determined in the 1950s. The mountain has not shrunk. Instead, technology has improved. The images on this page offer two views of Denali as observed on June 15, 2015, by the Operational Land Imager (OLI) on Landsat 8. The natural-color Landsat 8 images were draped over an ASTER-derived Global Digital Elevation Model, which helps show the topography of the area. Read more: <a href="http://1.usa.gov/1QbmOFP" rel="nofollow">1.usa.gov/1QbmOFP</a> <b><a href="http://www.nasa.gov/audience/formedia/features/MP_Photo_Guidelines.html" rel="nofollow">NASA image use policy.</a></b> <b><a href="http://www.nasa.gov/centers/goddard/home/index.html" rel="nofollow">NASA Goddard Space Flight Center</a></b> enables NASA’s mission through four scientific endeavors: Earth Science, Heliophysics, Solar System Exploration, and Astrophysics. Goddard plays a leading role in NASA’s accomplishments by contributing compelling scientific knowledge to advance the Agency’s mission. <b>Follow us on <a href="http://twitter.com/NASAGoddardPix" rel="nofollow">Twitter</a></b> <b>Like us on <a href="http://www.facebook.com/pages/Greenbelt-MD/NASA-Goddard/395013845897?ref=tsd" rel="nofollow">Facebook</a></b> <b>Find us on <a href="http://instagrid.me/nasagoddard/?vm=grid" rel="nofollow">Instagram</a></b>
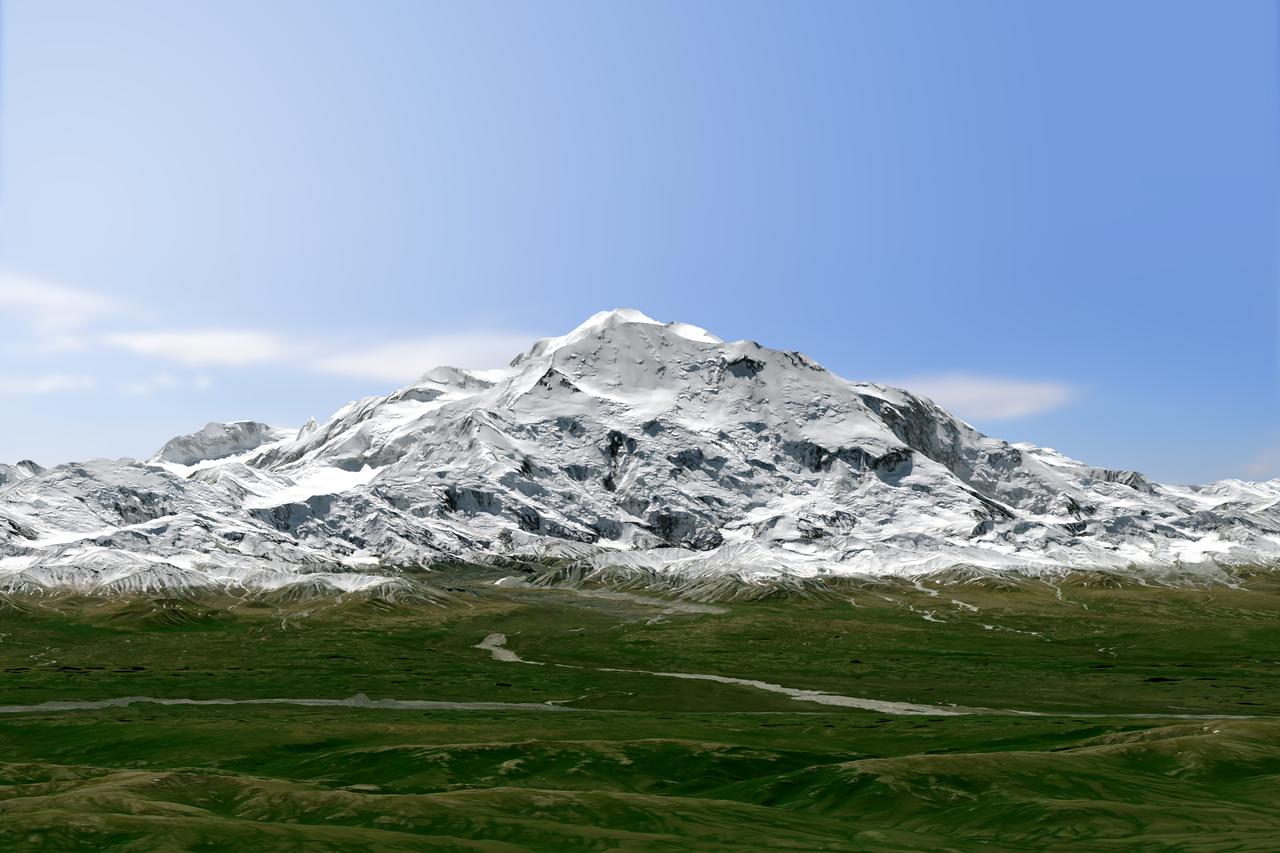
Physically, not too much has changed on Denali, North America’s highest peak. What did change in 2015 is how people describe and measure Alaska’s majestic mountain. On August 30, 2015, U.S. Secretary of the Interior Sally Jewell announced that the mountain’s official name would be Denali, not Mount McKinley. Restoration of the traditional Koyukon Athabascan name of Denali, which means “the tall one,” resolved a request by former Alaska Gov. Jay Hammond that dates back to 1975. But the mountain’s name was not the only change. On September 2, its elevation was also revised. The U.S. Geological Survey announced that Denali’s summit had a new, official elevation of 20,310 feet (6,190 meters)—10 feet shorter than surveyors had determined in the 1950s. The mountain has not shrunk. Instead, technology has improved. The images on this page offer two views of Denali as observed on June 15, 2015, by the Operational Land Imager (OLI) on Landsat 8. The natural-color Landsat 8 images were draped over an ASTER-derived Global Digital Elevation Model, which helps show the topography of the area. Read more: <a href="http://1.usa.gov/1QbmOFP" rel="nofollow">1.usa.gov/1QbmOFP</a> <b><a href="http://www.nasa.gov/audience/formedia/features/MP_Photo_Guidelines.html" rel="nofollow">NASA image use policy.</a></b> <b><a href="http://www.nasa.gov/centers/goddard/home/index.html" rel="nofollow">NASA Goddard Space Flight Center</a></b> enables NASA’s mission through four scientific endeavors: Earth Science, Heliophysics, Solar System Exploration, and Astrophysics. Goddard plays a leading role in NASA’s accomplishments by contributing compelling scientific knowledge to advance the Agency’s mission. <b>Follow us on <a href="http://twitter.com/NASAGoddardPix" rel="nofollow">Twitter</a></b> <b>Like us on <a href="http://www.facebook.com/pages/Greenbelt-MD/NASA-Goddard/395013845897?ref=tsd" rel="nofollow">Facebook</a></b> <b>Find us on <a href="http://instagrid.me/nasagoddard/?vm=grid" rel="nofollow">Instagram</a></b>
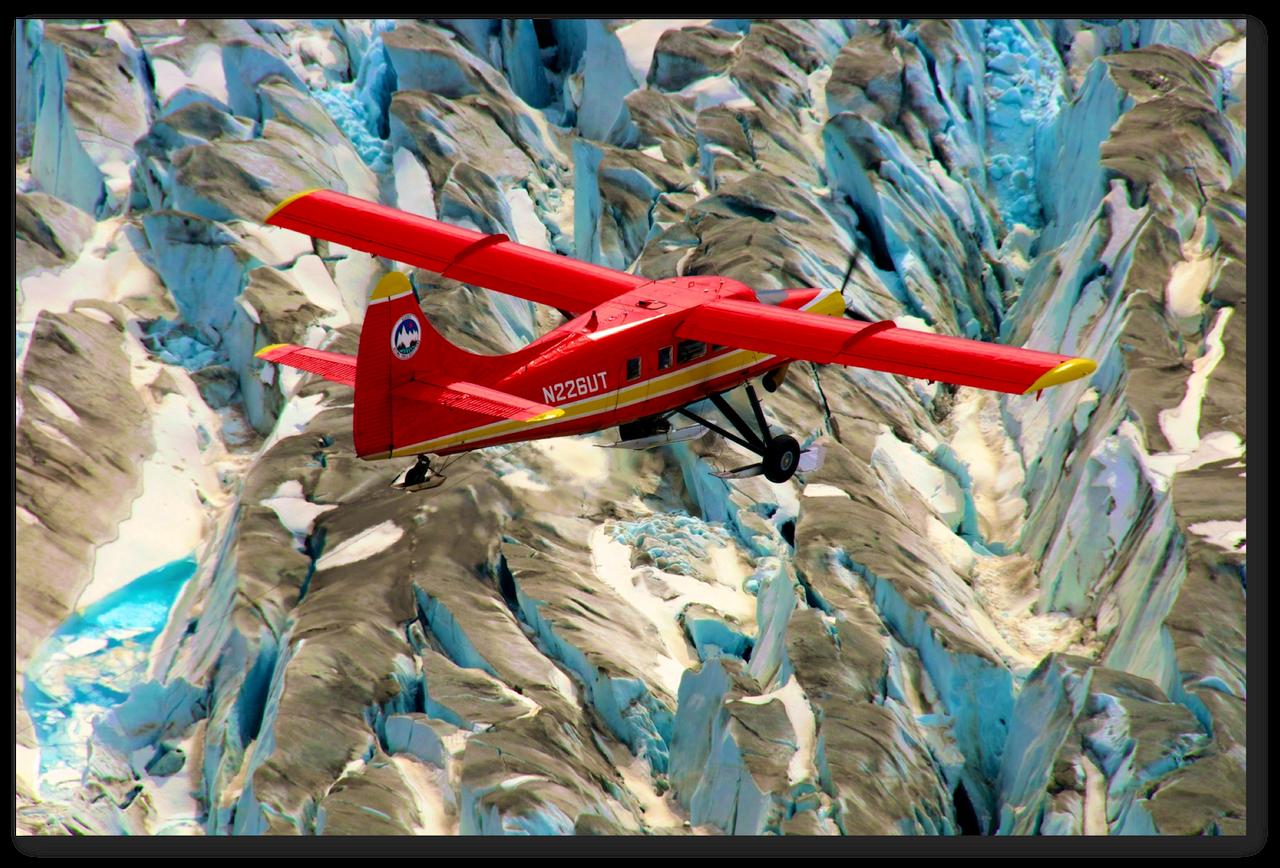
This red plane is a DHC-3 Otter, the plane flown in NASA's Operation IceBridge-Alaska surveys of mountain glaciers in Alaska. Credit: Chris Larsen, University of Alaska-Fairbanks Over the past few decades, average global temperatures have been on the rise, and this warming is happening two to three times faster in the Arctic. As the region’s summer comes to a close, NASA is hard at work studying how rising temperatures are affecting the Arctic. NASA researchers this summer and fall are carrying out three Alaska-based airborne research campaigns aimed at measuring greenhouse gas concentrations near Earth’s surface, monitoring Alaskan glaciers, and collecting data on Arctic sea ice and clouds. Observations from these NASA campaigns will give researchers a better understanding of how the Arctic is responding to rising temperatures. The Arctic Radiation – IceBridge Sea and Ice Experiment, or ARISE, is a new NASA airborne campaign to collect data on thinning sea ice and measure cloud and atmospheric properties in the Arctic. The campaign was designed to address questions about the relationship between retreating sea ice and the Arctic climate. Arctic sea ice reflects sunlight away from Earth, moderating warming in the region. Loss of sea ice means more heat from the sun is absorbed by the ocean surface, adding to Arctic warming. In addition, the larger amount of open water leads to more moisture in the air, which affects the formation of clouds that have their own effect on warming, either enhancing or reducing it. Read more: <a href="http://www.nasa.gov/earthrightnow" rel="nofollow">www.nasa.gov/earthrightnow</a> <b><a href="http://www.nasa.gov/audience/formedia/features/MP_Photo_Guidelines.html" rel="nofollow">NASA image use policy.</a></b> <b><a href="http://www.nasa.gov/centers/goddard/home/index.html" rel="nofollow">NASA Goddard Space Flight Center</a></b> enables NASA’s mission through four scientific endeavors: Earth Science, Heliophysics, Solar System Exploration, and Astrophysics. Goddard plays a leading role in NASA’s accomplishments by contributing compelling scientific knowledge to advance the Agency’s mission. <b>Follow us on <a href="http://twitter.com/NASAGoddardPix" rel="nofollow">Twitter</a></b> <b>Like us on <a href="http://www.facebook.com/pages/Greenbelt-MD/NASA-Goddard/395013845897?ref=tsd" rel="nofollow">Facebook</a></b> <b>Find us on <a href="http://instagram.com/nasagoddard?vm=grid" rel="nofollow">Instagram</a></b>
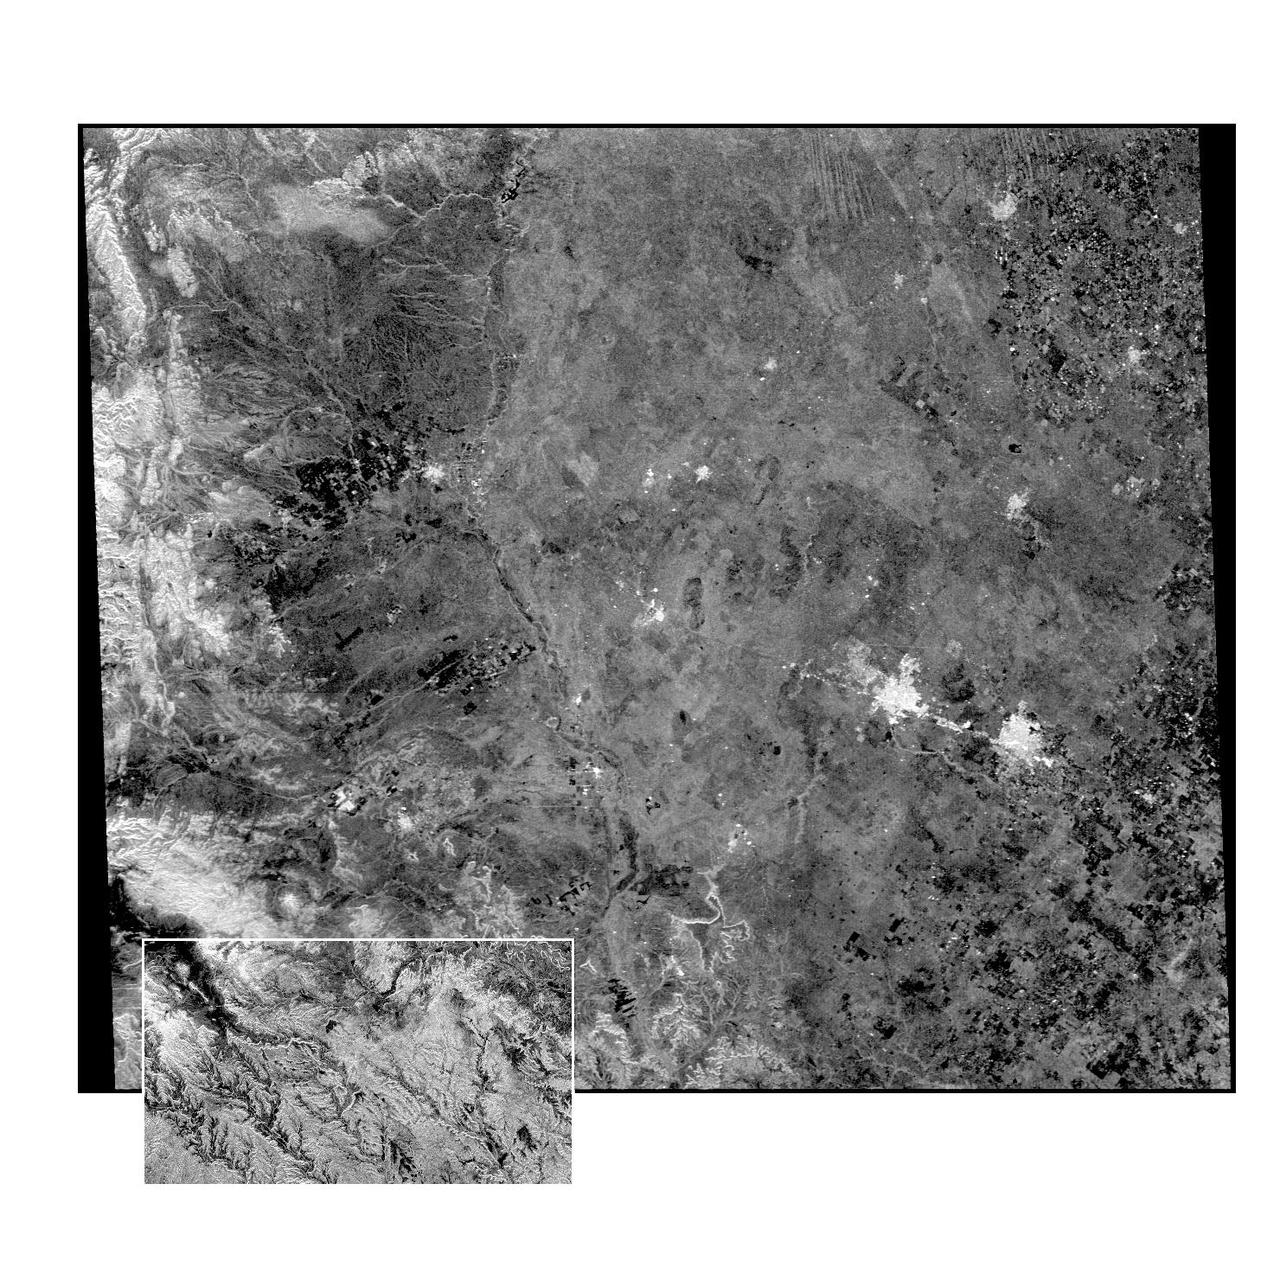
This radar image of the Midland/Odessa region of West Texas, demonstrates an experimental technique, called ScanSAR, that allows scientists to rapidly image large areas of the Earth's surface. The large image covers an area 245 kilometers by 225 kilometers (152 miles by 139 miles). It was obtained by the Spaceborne Imaging Radar-C/X-Band Synthetic Aperture Radar (SIR-C/X-SAR) flying aboard the space shuttle Endeavour on October 5, 1994. The smaller inset image is a standard SIR-C image showing a portion of the same area, 100 kilometers by 57 kilometers (62 miles by 35 miles) and was taken during the first flight of SIR-C on April 14, 1994. The bright spots on the right side of the image are the cities of Odessa (left) and Midland (right), Texas. The Pecos River runs from the top center to the bottom center of the image. Along the left side of the image are, from top to bottom, parts of the Guadalupe, Davis and Santiago Mountains. North is toward the upper right. Unlike conventional radar imaging, in which a radar continuously illuminates a single ground swath as the space shuttle passes over the terrain, a Scansar radar illuminates several adjacent ground swaths almost simultaneously, by "scanning" the radar beam across a large area in a rapid sequence. The adjacent swaths, typically about 50 km (31 miles) wide, are then merged during ground processing to produce a single large scene. Illumination for this L-band scene is from the top of the image. The beams were scanned from the top of the scene to the bottom, as the shuttle flew from left to right. This scene was acquired in about 30 seconds. A normal SIR-C image is acquired in about 13 seconds. The ScanSAR mode will likely be used on future radar sensors to construct regional and possibly global radar images and topographic maps. The ScanSAR processor is being designed for 1996 implementation at NASA's Alaska SAR Facility, located at the University of Alaska Fairbanks, and will produce digital images from the forthcoming Canadian RADARSAT satellite. http://photojournal.jpl.nasa.gov/catalog/PIA01787
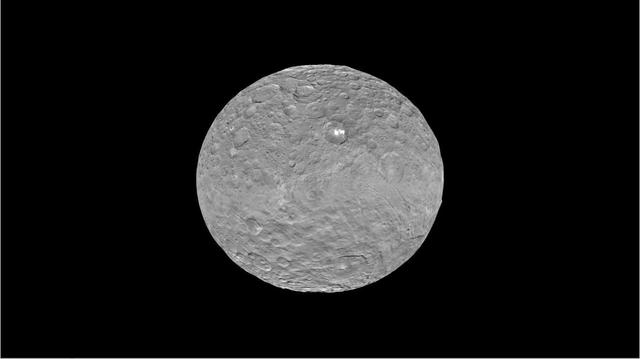
This frame from a video shows the bright spots in Occator crater on dwarf planet Ceres, generated from data from NASA Dawn spacecraft. The global view uses data collected by NASA's Dawn mission in April and May 2015. The highest-resolution parts of the map have a resolution of 1,600 feet (480 meters) per pixel. The second portion of the video shows the bright spots in Occator crater, which is about 60 miles (90 kilometers) across and 2 miles (4 kilometers) deep. Vertical relief has been exaggerated by a factor of five. Exaggerating the relief helps scientists understand and visualize the topography more easily, and highlights features that are sometimes subtle. The third portion of the video shows a mountain about 4 miles (6 kilometers) high, which is roughly the elevation of Mount McKinley in Alaska's Denali National Park. Vertical relief has been exaggerated by a factor of five. Exaggerating the relief helps scientists understand and visualize the topography much more easily, and highlights features that are sometimes subtle. The fourth section of the video shows the global view from the first section in 3-D view. A pair of 3-D glasses reveals striking detail in the topography of the dwarf planet. http://photojournal.jpl.nasa.gov/catalog/PIA19619
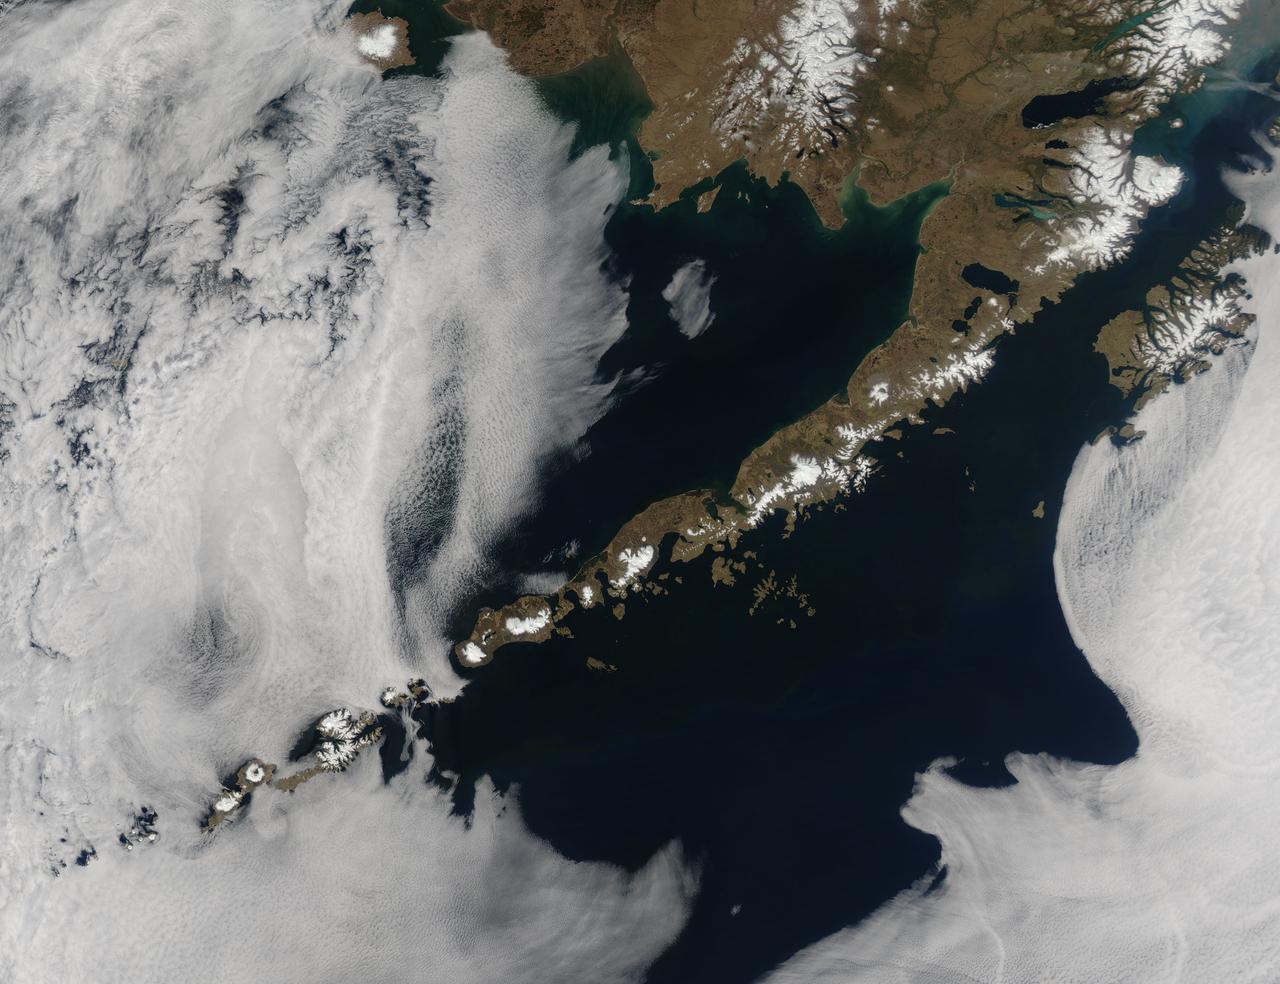
Remote, rugged and extraordinarily beautiful, Alaska’s Aleutian Islands are best known for wildlife reserves, military bases, fishing, furs and fog. The sprawling volcanic archipelago was brought into the spotlight by the Russian-supported expedition of Alexey Chirikov and Vitus Bering in 1741, and soon became controlled by the Russian-American Fur Company. In 1867 the United States purchased Alaska, including the Aleutian Islands, from Russia. By 1900 the port in Unalaska was well established as a shipping port for Alaska gold. The archipelago sweeps about 1,200 miles (1,800 km) from the tip of the Alaskan Peninsula to Attu, the most westward island. Four major island groups hold 14 large islands, about 55 smaller islands, and a large number of islets, adding up to roughly 150 islands/islets in total. This chain separates the Bering Sea (north) from the Pacific Ocean (south) and the islands are connected by the Marine Highway Ferry – at least as far as Unalaska. For the most remote islands, such as birding paradise of Attu, the western-most Aleutian Island, travel becomes trickier and relies primarily on custom charter. The Moderate Resolution Imaging Spectroradiometer (MODIS) flew over the region and captured this spectacular true-color image of the eastern Aleutian Islands on May 15, 2014. In this image, the Alaskan Peninsula protrudes from the mainland and sweeps to the southwest. The first set of islands are called the Fox Island group. Unalaska Island is part of this group and can be identified, with some imagination, as an island formed in the shape of a flying cherub, with two arms (peninsulas) outstretched towards the northeast, seemingly reaching for the round “balls” of Akutan and Akun Islands. The smallest islands in the west of the image belong to the group known as the Islands of Four Mountains. The Aleutians continue far to the west of this image. Fog surrounds the Aleutians, stretching from just off the southwestern Alaska mainland to the western Fox Islands group, then further southwest across the Pacific Ocean. It appears to give way to marine stratocumulus clouds in the west. Fog is common in the area, and can be a hazard to shipping. Credit: NASA/GSFC/Jeff Schmaltz/MODIS Land Rapid Response Team <b><a href="http://www.nasa.gov/audience/formedia/features/MP_Photo_Guidelines.html" rel="nofollow">NASA image use policy.</a></b> <b><a href="http://www.nasa.gov/centers/goddard/home/index.html" rel="nofollow">NASA Goddard Space Flight Center</a></b> enables NASA’s mission through four scientific endeavors: Earth Science, Heliophysics, Solar System Exploration, and Astrophysics. Goddard plays a leading role in NASA’s accomplishments by contributing compelling scientific knowledge to advance the Agency’s mission. <b>Follow us on <a href="http://twitter.com/NASAGoddardPix" rel="nofollow">Twitter</a></b> <b>Like us on <a href="http://www.facebook.com/pages/Greenbelt-MD/NASA-Goddard/395013845897?ref=tsd" rel="nofollow">Facebook</a></b> <b>Find us on <a href="http://instagram.com/nasagoddard?vm=grid" rel="nofollow">Instagram</a></b>
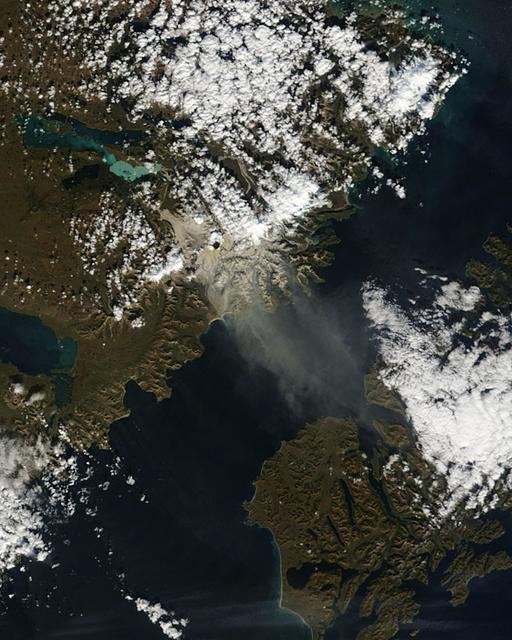
The Valley of Ten Thousand Smokes, located in Katmai National Park, forms a unique and ashen landscape. Encircled by volcanoes – both active and inactive – it has served as a perfect collection area for huge amounts of volcanic ash. According to the Alaska Historical Society (AHS), 2012 marked the centennial anniversary of the volcanic eruption that formed the valley, and led to the establishment, in 1918, of Katmai National Park. A massive eruption rocked the region on June 6, 1912 as the then-unknown volcano, Novarupta, became suddenly and violently active. According to the AHS, it erupted with “such force that mountains collapsed, ash darkened summer skies, earthquakes rocked population centers and were recorded as far away as Washington, D.C.” Glowing hot ash was reported to have smothered an area covering 40 square miles, and up to 700 feet deep. While the active volcanoes surrounding the valley - Novarupta, Mt. Mageik, Trident Volcano, Mt. Griggs, Mt. Martin and Mt. Katmai - have remained relatively quiescent, their ashen legacy continues to affect the landscape – and air traffic - even a century after it was laid down. The Moderate Resolution Imaging Spectroradiometer (MODIS) aboard NASA’s Terra satellite captured this true-color image on September 29, 2014. Volcanic ash from the Katmai region has been lifted aloft by strong winds, and is blowing to the southeast, over Shelikof Strait, Kodiak Island, and the Gulf of Alaska. Although such clouds are not from active volcanoes, the remobilized volcanic ash still provides a potential hazard to aircraft flying through the region. Credit: NASA/GSFC/Jeff Schmaltz/MODIS Land Rapid Response Team <b><a href="http://www.nasa.gov/audience/formedia/features/MP_Photo_Guidelines.html" rel="nofollow">NASA image use policy.</a></b> <b><a href="http://www.nasa.gov/centers/goddard/home/index.html" rel="nofollow">NASA Goddard Space Flight Center</a></b> enables NASA’s mission through four scientific endeavors: Earth Science, Heliophysics, Solar System Exploration, and Astrophysics. Goddard plays a leading role in NASA’s accomplishments by contributing compelling scientific knowledge to advance the Agency’s mission. <b>Follow us on <a href="http://twitter.com/NASAGoddardPix" rel="nofollow">Twitter</a></b> <b>Like us on <a href="http://www.facebook.com/pages/Greenbelt-MD/NASA-Goddard/395013845897?ref=tsd" rel="nofollow">Facebook</a></b> <b>Find us on <a href="http://instagram.com/nasagoddard?vm=grid" rel="nofollow">Instagram</a></b>
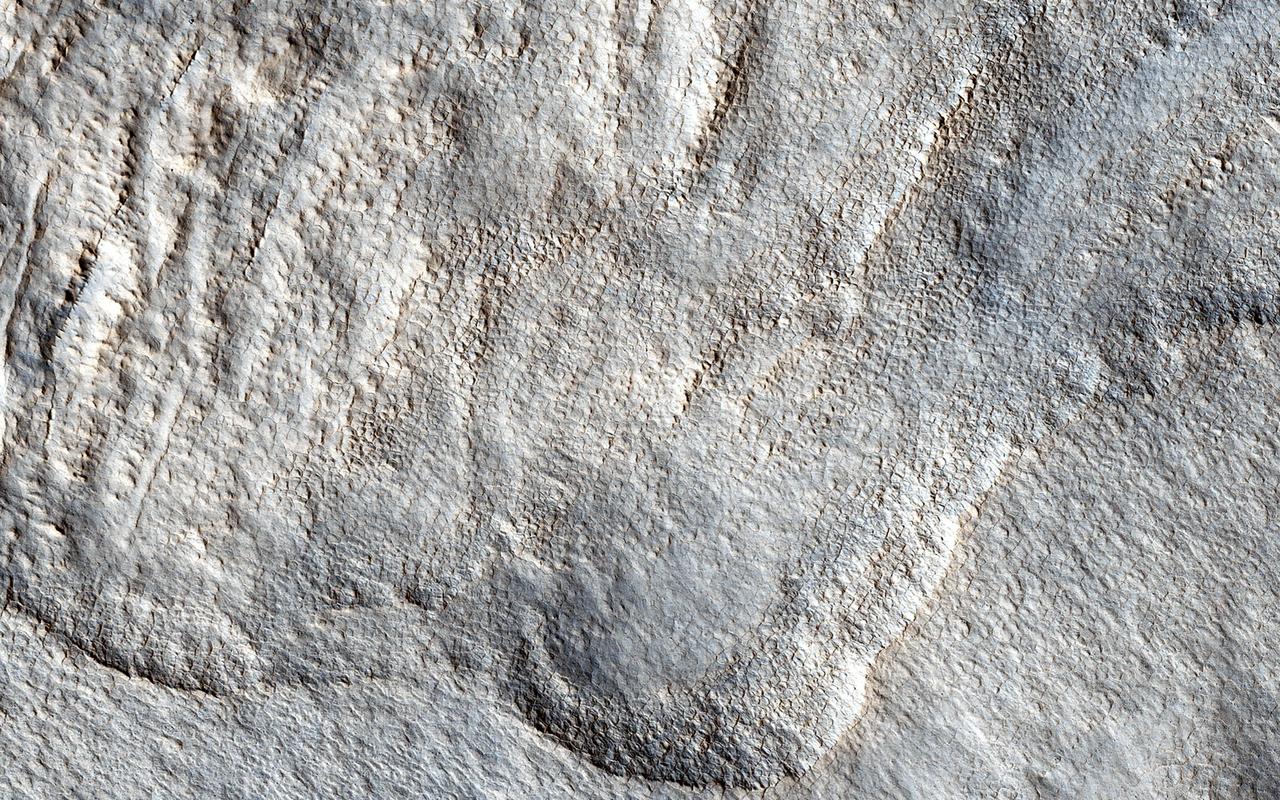
The rotational axis of Mars is currently tilted by about 25 degrees, very similar to that of the Earth (at 23.4 degrees). However, while Earth's axial tilt (also known as "obliquity") tends to change very slightly over time (almost 3 degrees in 40,000 year-cycles), the obliquity of Mars is much more chaotic and varies widely from 0 to almost 60 degrees! The fact that it is currently similar to that of the Earth is merely a coincidence. Currently, water-ice is stable on the Martian surface only in the polar regions. However, during times of "high obliquity," that stability shifts towards the equatorial regions. We see evidence for recent periods of high obliquity on Mars in the form of features common in the mid-latitude regions, which planetary scientists call "viscous flow features," "lobate debris aprons," or "lineated valley fills." These are all scientifically conservative ways of describing features on Mars that resemble mountain glaciers on Earth. We now know from radar observations, particularly using the SHARAD instrument on board the Mars Reconnaissance Orbiter, that these features are really composed of mixtures of pure ice and dust, and as a result, many scientists have started using the term "glacier-like forms" (GLF) to describe some of them. The main reason that these feature are still present for us to observe nowadays-despite the inhospitable conditions for water ice in these latitudes-is that these "glaciers" are covered by thin layers of dust, which protect them from the atmosphere of Mars and prevents, or significantly slows down, the loss of ice through sublimation to the atmosphere. However, if we were to take a look at this image of a "lobate debris apron," we will see that some areas show numerous depressions, which suggests that these areas have lost some of the ice creating these "deflation features." In addition, if we zoom in on one of these depressions, we will see surface polygonal patterns, which are common in cold regions on Earth (such as Alaska, northern Canada, and Siberia) and are indicators of shallow sub-surface water-ice. http://photojournal.jpl.nasa.gov/catalog/PIA21065
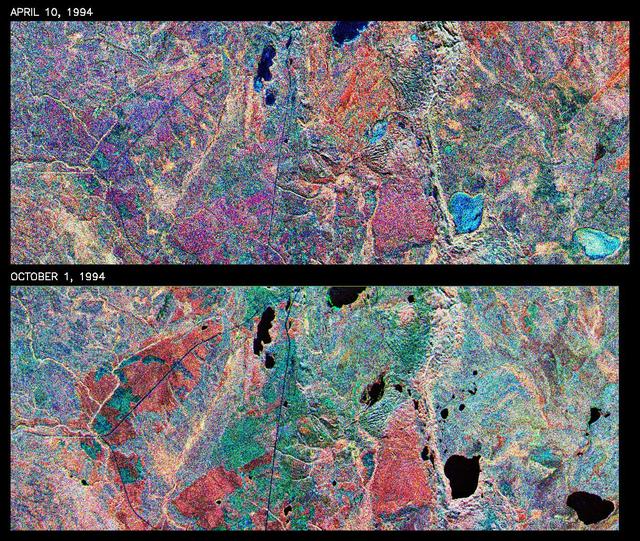
This is a comparison of images over Prince Albert, produced by NASA Spaceborne Imaging Radar-C and X-band Synthetic Aperture Radar aboard the space shuttle Endeavour on its 20th orbit on April 10, 1994. The area is centered at 53.91 degrees north latitude and 104.69 degrees west longitude and is located 40 kilometers (25 miles) north and 30 kilometers (18.5 miles) east of the town of Prince Albert in the Saskatchewan province of Canada. The image covers the area east of Candle Lake, between the gravel highway of 120 and west of highway 106. The area imaged is near the southern limit of the boreal forest. The boreal forest of North America is a continuous vegetation belt at high latitudes stretching across the continent from the Atlantic shoreline of central Labrador and then westward across Canada to the interior mountains and central coastal plains of Alaska. The forest is also part of a larger northern hemisphere circumpolar boreal forest belt. Coniferous trees dominate the entire forest but deciduous trees are also present. During the month of April, the forest experiences seasonal changes from a frozen condition to a thawed condition. The trees are completely frozen over the winter season and the forest floor is covered by snow. As the average temperature rises in the spring, the trees are thawed and the snow melts. This transition has an impact on the rate of moisture evaporation and release of carbon dioxide into the atmosphere. In late September and early October, the boreal forest experiences a relatively different seasonal change. At this time, the leaves on deciduous trees start changing color and dropping off. The soil and trees are quite often moist due to frequent rainfall and cloud cover. The evaporation of moisture and carbon dioxide into the atmosphere also diminishes at this time. SIR-C/X-SAR is sensitive to the moisture of soil and vegetation and can sense this freeze-thaw cycle and the summer-fall seasonal transition over forested areas in particular. Optical sensors, by contrast, are blind to these regions, which are perpetually obscured by thick cloud cover. These changes were detected by comparing the April and October color composite images of L-band data in red, C-band data in green and X-band (vertically received and transmitted) in blue. The changes in intensity of each color over lakes, various forest stands and clear cuts in the two images is striking. Lakes such as Lake Heiberg, Crabtree Lake and Williams Lake, in the right middle part of the image, are frozen in April (appearing in bright blue) and melted (appearing in black) in October. The higher intensity of blue over lakes in April is due to low penetration of the X-band (vertically received and transmitted) and the radar's high sensitivity to surface features. Forest stands also exhibit major changes between the two images. The red areas in the October image are old jack pine canopies that cause higher return at L-band because of their moist condition in late summer compared to their partially frozen condition in April (in purple). Similarly, in the areas near the middle of the image, where black spruce and mixed aspen and jack pine trees dominate, the contrast between blue in October and red and green in April is an indication that the top of the canopy (needles and branches) were frozen in April and moist in October. The changes due to deforestation by logging companies or natural fires can also be detected by comparing the images. For example, the small blue area near the intersection of Harding Road and Highway 120 is the result of logging which occurred after the April data was acquired. The surface area of clear cut is approximately 4 hectares, which is calculated from the high-resolution capability of the radar images and verified by scientists participating in field work during the mission. http://photojournal.jpl.nasa.gov/catalog/PIA01732
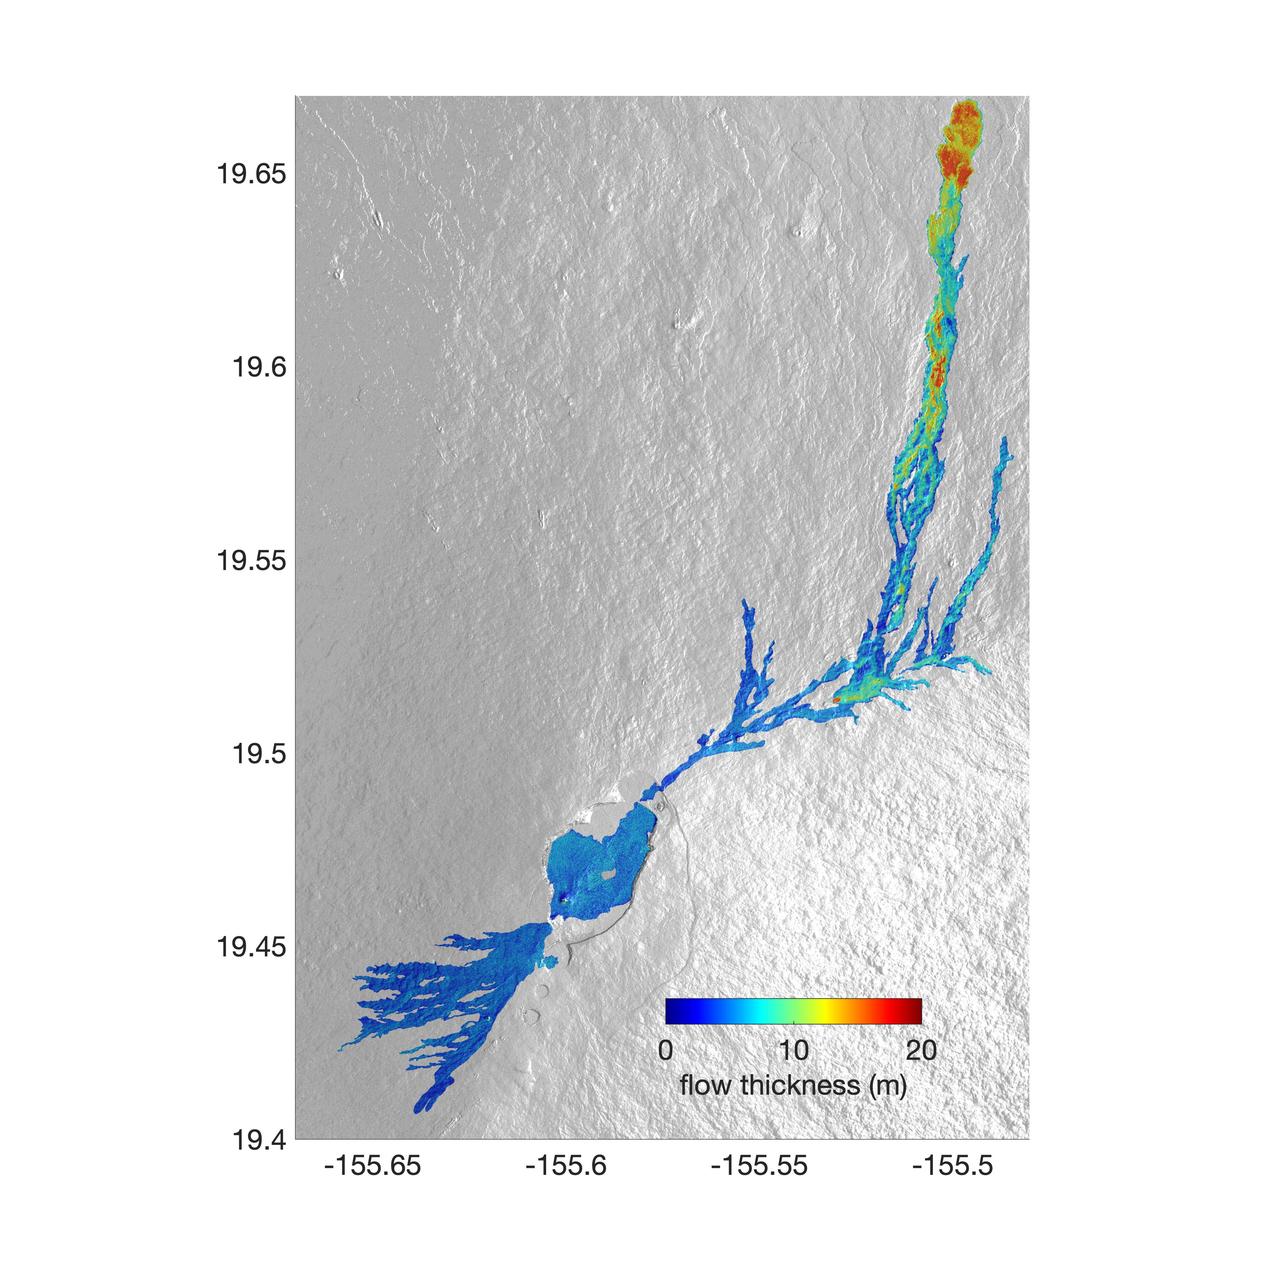
The world's largest active volcano – Hawaii's Mauna Loa – had been quiet for 38 years. But in 2022, the volcano began to stir, showing increased numbers of small earthquakes and subtle swelling of certain land surfaces in September. On November 27, fountains of lava began spurting from the mountain's Northeast Rift Zone and streams of molten rock flowed to the north. Ten days into the eruption, a NASA aircraft conducted its first flight over the erupting volcano. It carried NASA's Uninhabited Aerial Vehicle Synthetic Aperture Radar (UAVSAR) system, which was used to map the volcano's topography in fine detail with a Ka-band instrument called GLISTIN-A. Teams from NASA's Jet Propulsion Laboratory and the United States Geological Survey (USGS) used data from that sensor to map the thickness of those flows during a series of flights on December 7, 8, and 10. The map above shows the thickness of the lava flows during the flight on December 7, the day before USGS scientists noticed a significant decline in the pace of the eruption. A few days later, they declared the eruption had stopped. The map shows the thickness of the lava flows in the summit caldera, where the eruption began, and of lava flows on Mauna Loa's northeastern flank. The color variation from blue to orange indicates increasing lava flow thickness. A maximum thickness of roughly 25 meters (82 feet) is shown, though values exceeding 40 meters (131 feet) were observed in some areas. The thickening at the northern end of the flow is due to lava accumulating away from the vent, along with a flattening of the terrain at the saddle between the Mauna Loa and Mauna Kea volcanoes. By comparing to pre-eruption maps of this area's topography, including GLISTIN-A data collected in 2017, the USGS researchers were able to calculate the size and volume of the lava flow. Over the roughly 14-day eruption, Mauna Loa erupted more than 8.8 billion cubic feet (230 million cubic meters) along a lava flow that extended up to 16.5 miles (19.5 kilometers) from the vent, according to the USGS. The UAVSAR operates from a pod mounted beneath a crewed Gulfstream III jet from NASA's Armstrong Flight Research Center in California. Repeated topographic maps generated with each flight reveal the progression and thickening of lava with time – important information for scientific understanding of volcano processes and for emergency response. For the Mauna Loa science flights, the instrument suite featured an additional state-of-the-art imaging tool: the synthetic aperture radar-fusion optical short-wave infrared (SAR-Fusion Optical/SWIR) camera system. SAR-Fusion collects data over the same ground swath as GLISTIN-A to map land surface changes using optical/SWIR photogrammetry methods. GLISTIN-A was designed to provide all-weather, high-resolution surface topography not available through existing lidar or radar sensors. GLISTIN-A was originally demonstrated as a new radar technique for mapping ice surfaces. Science demonstration flights began in 2013 over alpine glaciers and sea ice in Alaska, and a floodplain in California. Its applications have since expanded to other areas, such as snow accumulation and volcano dynamics. The first time the instrument was deployed for volcano response was in 2018 during the three-month eruption of Kilauea. The success of that operation paved the way for deployment to Mauna Loa. https://photojournal.jpl.nasa.gov/catalog/PIA25526