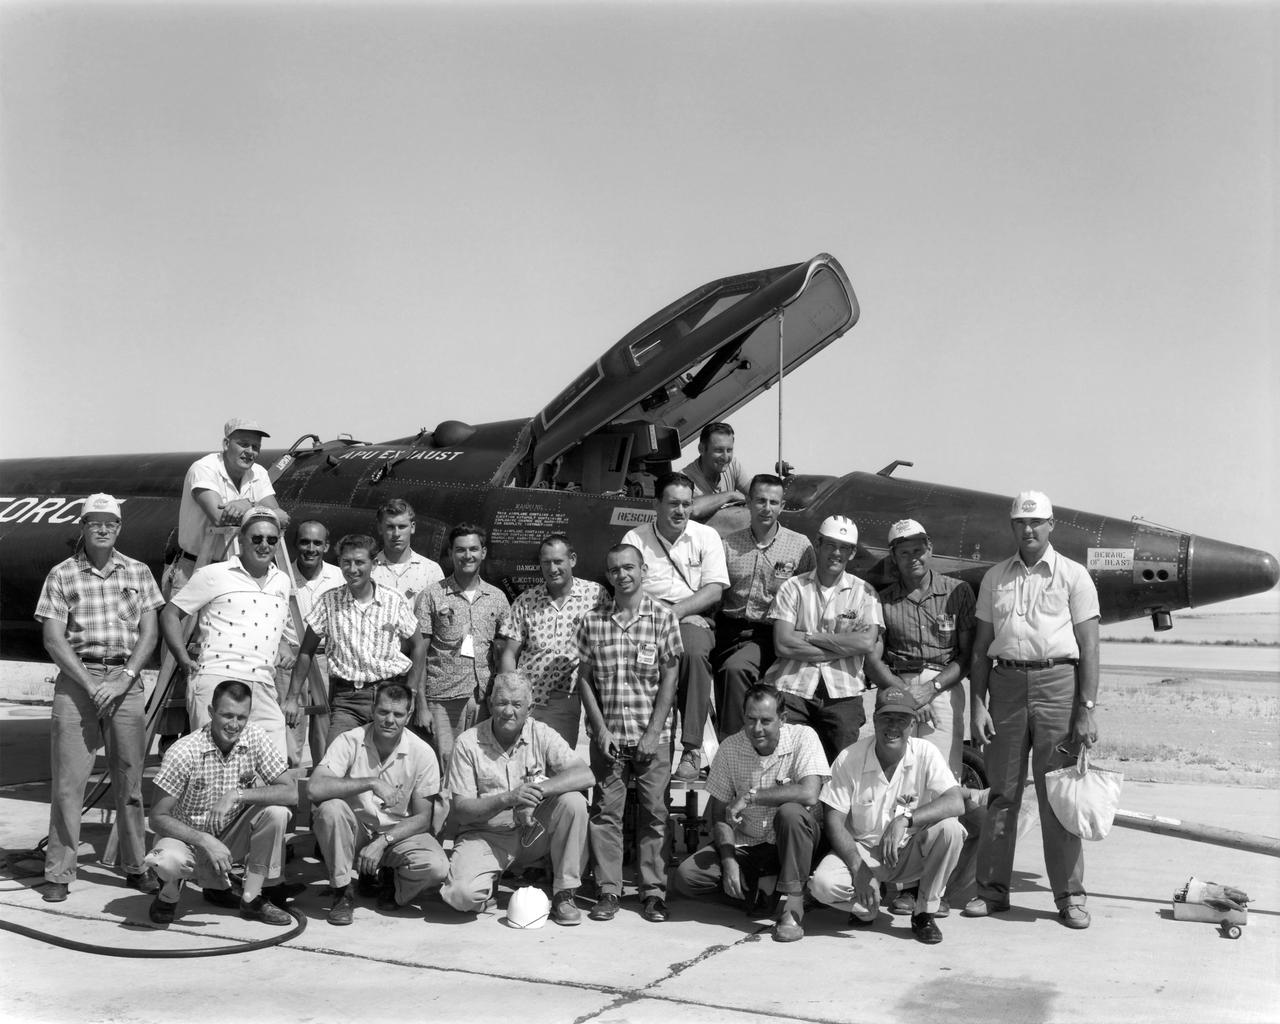
X-15 personnel July 1962 Cockpit: Edward "Ed" Nice Ladder: Thomas "Tom" McAlister Back Row, left to right: William Clark, Edward "Ed" Sabo, Donald "Don" Hall, Billy Furr, Allen Dustin, Raymond "Ray" White, George E. Trott, Alfred "Al" Grieshaber, Merle Curtis, LeRoy "Lee" Adelsbach, Allen Lowe, Jay L. King, Lorenzo "Larry" Barnett. Kneeling, left to right: Byron Gibbs, Price "Bob" Workman, Ira Cupp, unidentified, John Gordon.
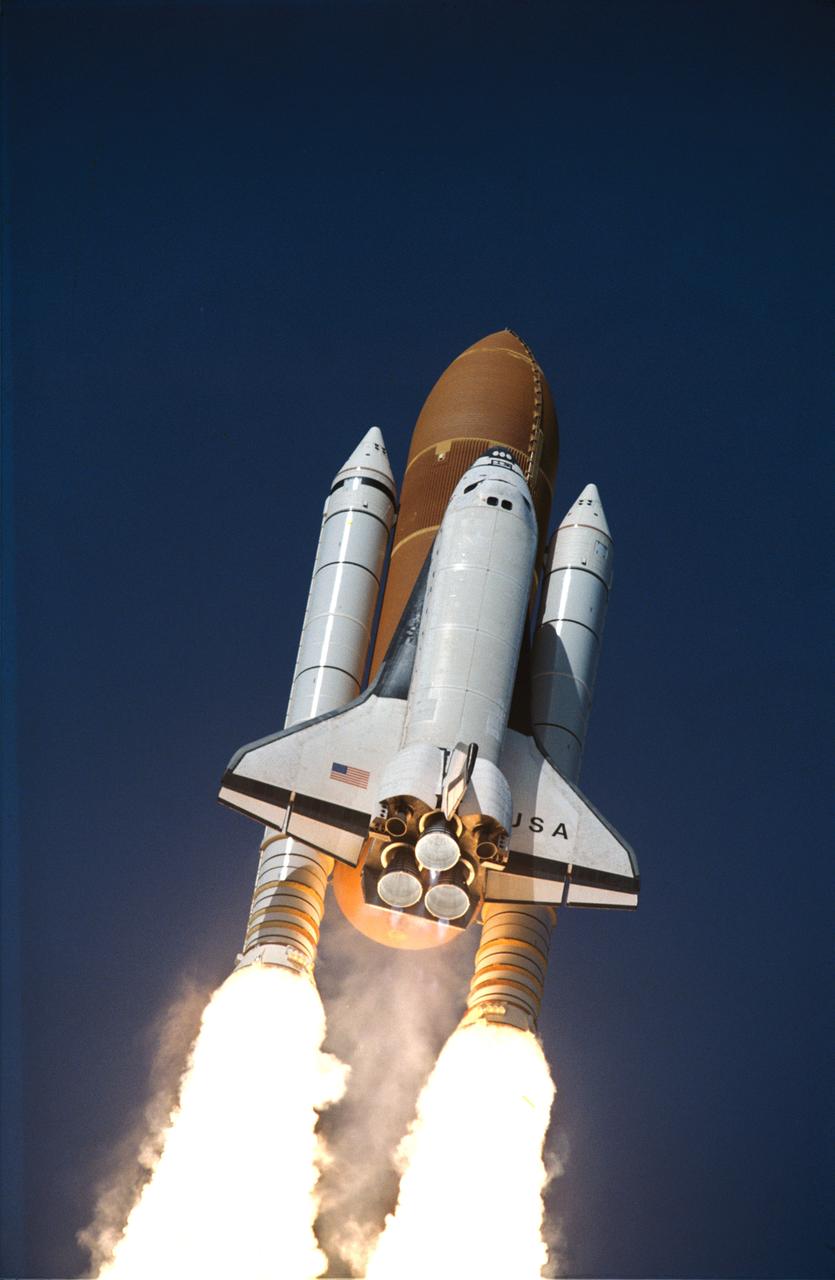
STS062-S-055 (4 March 1994) --- A low-angle view captures early stages of the sixteenth launch of Space Shuttle Columbia. Launch occurred at 8:53 a.m. (EST), March 4, 1994. Onboard were astronauts John H. Casper, Andrew M. Allen, Marsha S. Ivins, Charles D. (Sam) Gemar and Pierre J. Thuot.
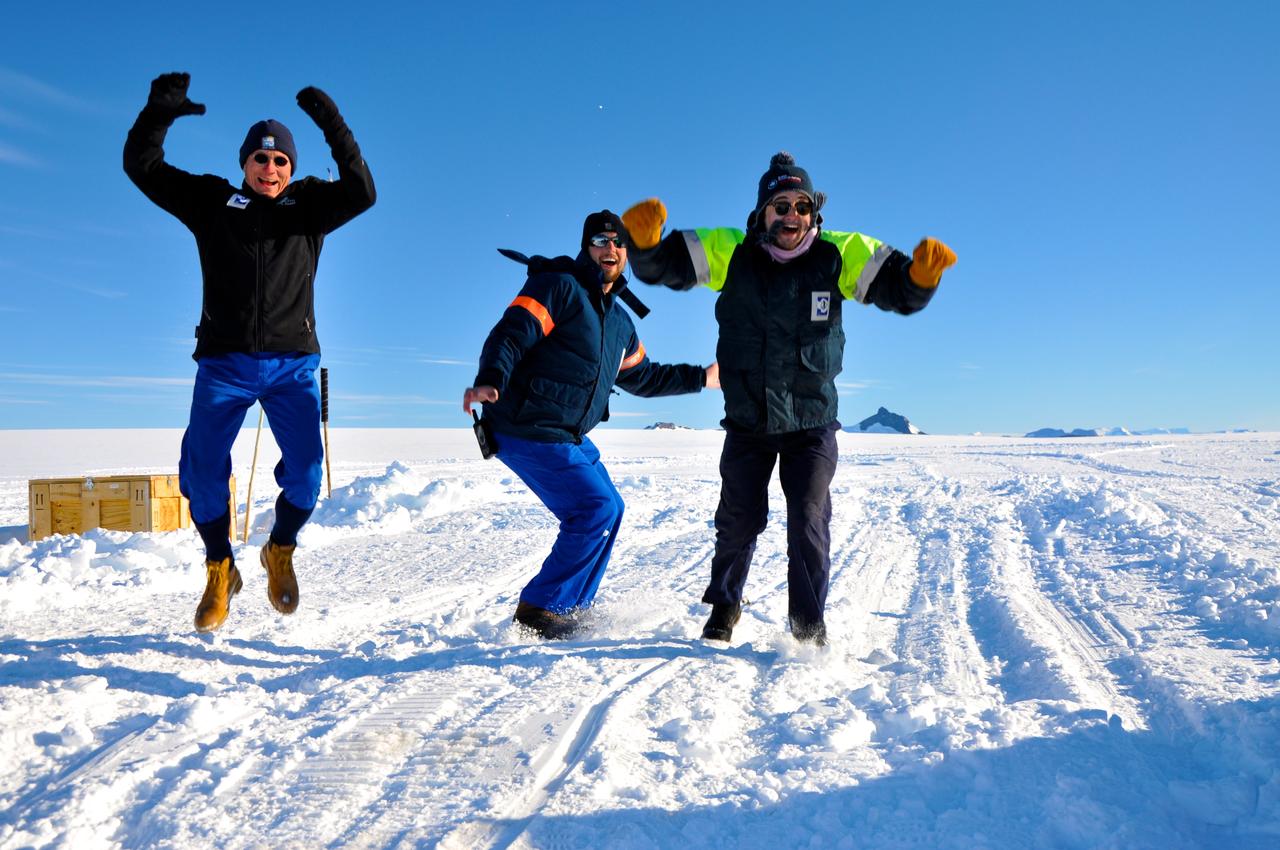
Members of the BARREL team in Antarctica jump up and down in what they call the Low Wind Dance as they hope for the low wind conditions needed to launch another balloon. Credit: NASA/Goddard/BARREL/Brett Anderson Read more: <a href="http://www.nasa.gov/content/goddard/nasas-barrel-returns-successful-from-antarctica" rel="nofollow">www.nasa.gov/content/goddard/nasas-barrel-returns-success...</a> -- Three months, 20 balloons, and one very successful campaign. The team for NASA's BARREL – short for Balloon Array for Radiation belt Relativistic Electron Losses -- mission returned from Antarctica in March 2014. BARREL's job is to help unravel the mysterious Van Allen belts, two gigantic donuts of radiation that surround Earth, which can shrink and swell in response to incoming energy and particles from the sun and sometimes expose satellites to harsh radiation. While in Antarctica, the team launched 20 balloons carrying instruments that sense charged particles that are scattered into the atmosphere from the belts, spiraling down the magnetic fields near the South Pole. Each balloon traveled around the pole for up to three weeks. The team will coordinate the BARREL data with observations from NASA's two Van Allen Probes to better understand how occurrences in the belts relate to bursts of particles funneling down toward Earth. BARREL team members will be on hand at the USA Science and Engineering Festival in DC on April 26 and 27, 2014 for the exhibit Space Balloons: Exploring the Extremes of Space Weather. <b><a href="http://www.nasa.gov/audience/formedia/features/MP_Photo_Guidelines.html" rel="nofollow">NASA image use policy.</a></b> <b><a href="http://www.nasa.gov/centers/goddard/home/index.html" rel="nofollow">NASA Goddard Space Flight Center</a></b> enables NASA’s mission through four scientific endeavors: Earth Science, Heliophysics, Solar System Exploration, and Astrophysics. Goddard plays a leading role in NASA’s accomplishments by contributing compelling scientific knowledge to advance the Agency’s mission. <b>Follow us on <a href="http://twitter.com/NASAGoddardPix" rel="nofollow">Twitter</a></b> <b>Like us on <a href="http://www.facebook.com/pages/Greenbelt-MD/NASA-Goddard/395013845897?ref=tsd" rel="nofollow">Facebook</a></b> <b>Find us on <a href="http://instagram.com/nasagoddard?vm=grid" rel="nofollow">Instagram</a></b>
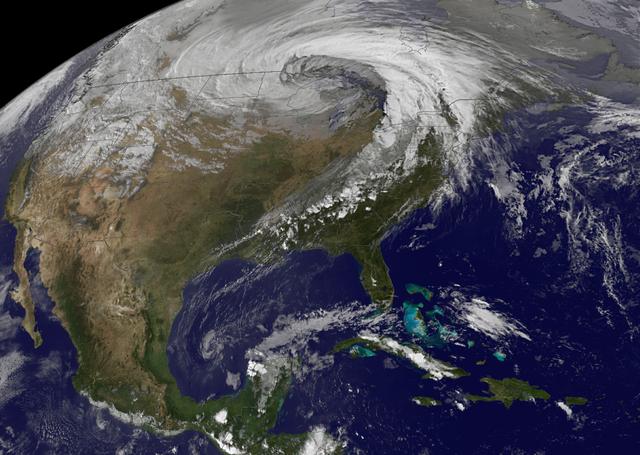
NASA image acquired October 26, 2010 The storm that swept across the center of the United States on October 26 and October 27, 2010, was memorable to those who experienced it because of its strong winds, rain, hail, and widespread tornadoes. Meteorologists get excited about the storm because it set a record for the lowest pressure (not associated with a hurricane) measured over land in the continental United States. At 5:13 p.m. CDT, the weather station in Bigfork, Minnesota recorded 955.2 millibars (28.21 inches of pressure). Pressure is one indicator of a storm’s strength, and this measurement corresponds to the pressure seen in a Category 3 hurricane. This image, taken by the GOES satellite on October 26, shows the storm system circling around the area of extreme low pressure. Such extratropical cyclones form over the United States in the spring and fall, when the temperature difference from north to south is large. Warm, high-pressure air rushes toward the cooler, low-pressure air in the north. Because the Earth is rotating, the air moving in ends up circling the area of low pressure, creating the cyclone shown in the image. The intensity of the storm is determined by the pressure difference between the center and the outer edges. Extreme low pressure in the center of the storm, therefore, is an indicator that the storm was very intense. The animation shows the storm developing starting late on October 25 and running through October 27. The cyclone formed very quickly on October 26, taking a distinctive comma shape as the day went on. The storm developed so quickly, in fact, that it is classified as a bomb, an extremely fast developing storm (dropping at least one millibar of pressure per hour for 24 hours), more common over water than land. The storm was also huge. Though the area of low pressure is centered over the Upper Midwest, the storm reached from the Gulf of Mexico into Canada, and from the Rocky Mountains to the Atlantic Ocean. Extratropical cyclones bring an array of unsettled weather, including strong wind, rain, hail, and tornadoes, and this cyclone brought all of that. On October 26–27, winds gusted up to 78 miles per hour in Michigan, with high winds throughout the Midwest. The National Weather Service reported 61 tornadoes over the two days. Heavy snow also fell in the north. NASA Earth Observatory imagery created by Jesse Allen, using imagery provided courtesy of the NASA GOES Project Science Office. Caption by Holli RIebeek. Instrument: GOES Credit: <b><a href="http://www.earthobservatory.nasa.gov/" rel="nofollow"> NASA Earth Observatory</a></b> <b><a href="http://www.nasa.gov/centers/goddard/home/index.html" rel="nofollow">NASA Goddard Space Flight Center</a></b> enables NASA’s mission through four scientific endeavors: Earth Science, Heliophysics, Solar System Exploration, and Astrophysics. Goddard plays a leading role in NASA’s accomplishments by contributing compelling scientific knowledge to advance the Agency’s mission. <b>Follow us on <a href="http://twitter.com/NASA_GoddardPix" rel="nofollow">Twitter</a></b> <b>Join us on <a href="http://www.facebook.com/pages/Greenbelt-MD/NASA-Goddard/395013845897?ref=tsd" rel="nofollow">Facebook</a></b>
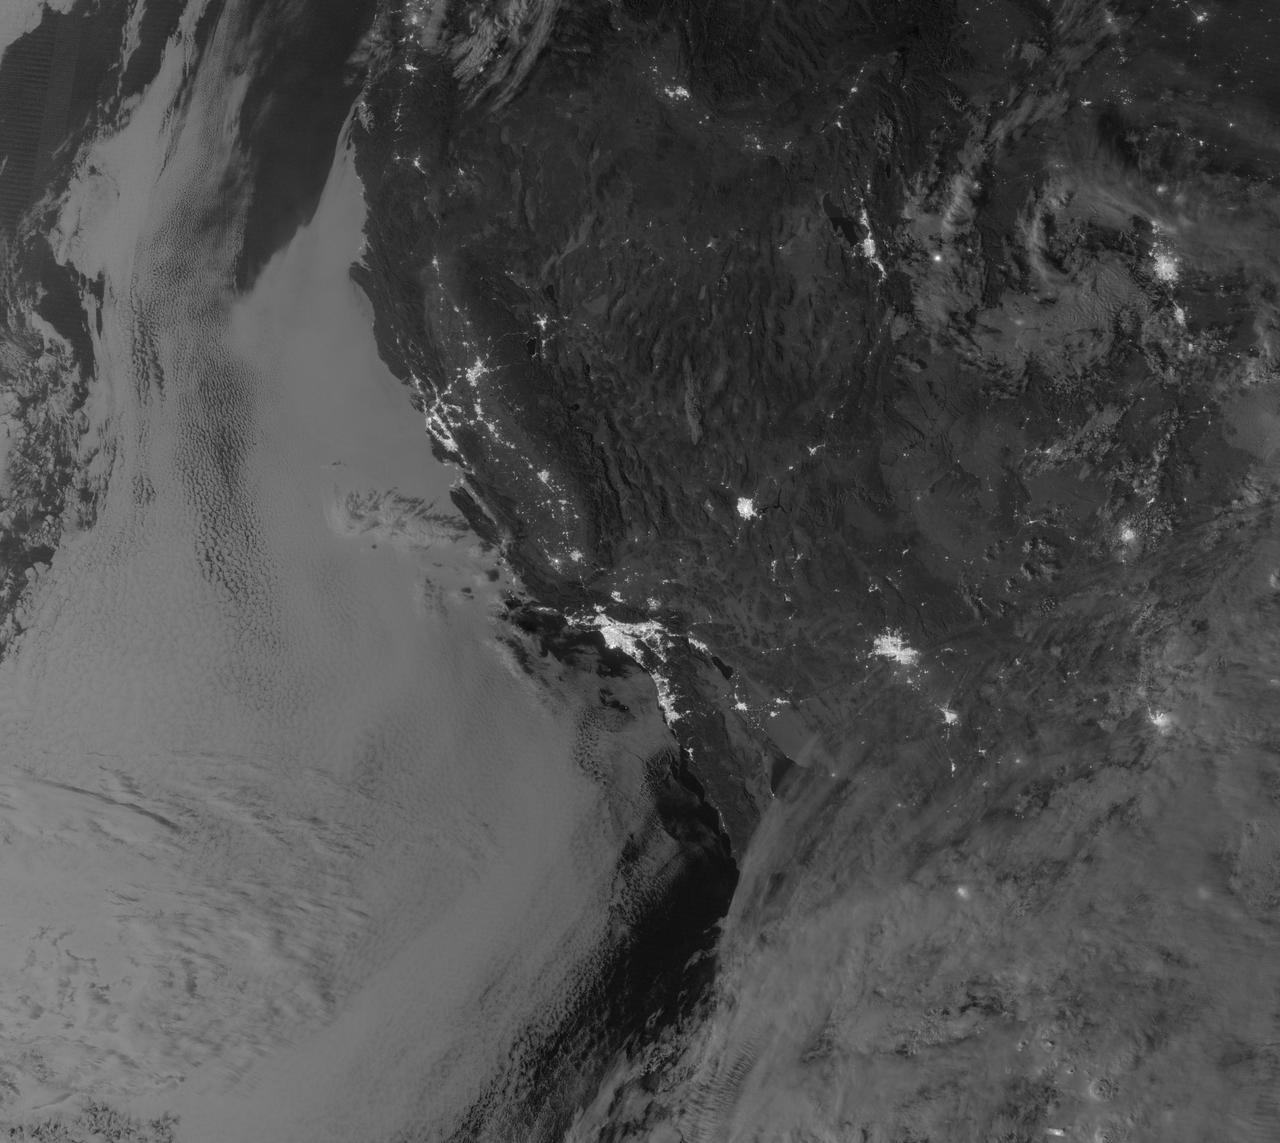
NASA image acquired September 27, 2012 On September 27, 2012, the Visible Infrared Imaging Radiometer Suite (VIIRS) on the Suomi NPP satellite captured this nighttime view of low-lying marine layer clouds along the coast of California. The image was captured by the VIIRS “day-night band,” which detects light in a range of wavelengths from green to near-infrared and uses filtering techniques to observe signals such as gas flares, auroras, wildfires, city lights, and reflected moonlight. An irregularly-shaped patch of high clouds hovers off the coast of California, and moonlight caused the high clouds to cast distinct shadows on the marine layer clouds below. VIIRS acquired the image when the Moon was in its waxing gibbous phase, meaning it was more than half-lit, but less than full. Low clouds pose serious hazards for air and ship traffic, but satellites have had difficulty detecting them in the past. To illustrate this, the second image shows the same scene in thermal infrared, the band that meteorologists generally use to monitor clouds at night. Only high clouds are visible; the low clouds do not show up at all because they are roughly the same temperature as the ground. NASA Earth Observatory image by Jesse Allen and Robert Simmon, using VIIRS Day-Night Band data from the Suomi National Polar-orbiting Partnership. Suomi NPP is the result of a partnership between NASA, the National Oceanic and Atmospheric Administration, and the Department of Defense. Caption by Adam Voiland. Instrument: Suomi NPP - VIIRS Credit: <b><a href="http://www.earthobservatory.nasa.gov/" rel="nofollow"> NASA Earth Observatory</a></b> <b>Click here to view all of the <a href="http://earthobservatory.nasa.gov/Features/NightLights/" rel="nofollow"> Earth at Night 2012 images </a></b> <b>Click here to <a href="http://earthobservatory.nasa.gov/NaturalHazards/view.php?id=79758" rel="nofollow"> read more </a> about this image </b> <b><a href="http://www.nasa.gov/audience/formedia/features/MP_Photo_Guidelines.html" rel="nofollow">NASA image use policy.</a></b> <b><a href="http://www.nasa.gov/centers/goddard/home/index.html" rel="nofollow">NASA Goddard Space Flight Center</a></b> enables NASA’s mission through four scientific endeavors: Earth Science, Heliophysics, Solar System Exploration, and Astrophysics. Goddard plays a leading role in NASA’s accomplishments by contributing compelling scientific knowledge to advance the Agency’s mission. <b>Follow us on <a href="http://twitter.com/NASA_GoddardPix" rel="nofollow">Twitter</a></b> <b>Like us on <a href="http://www.facebook.com/pages/Greenbelt-MD/NASA-Goddard/395013845897?ref=tsd" rel="nofollow">Facebook</a></b> <b>Find us on <a href="http://instagram.com/nasagoddard?vm=grid" rel="nofollow">Instagram</a></b>
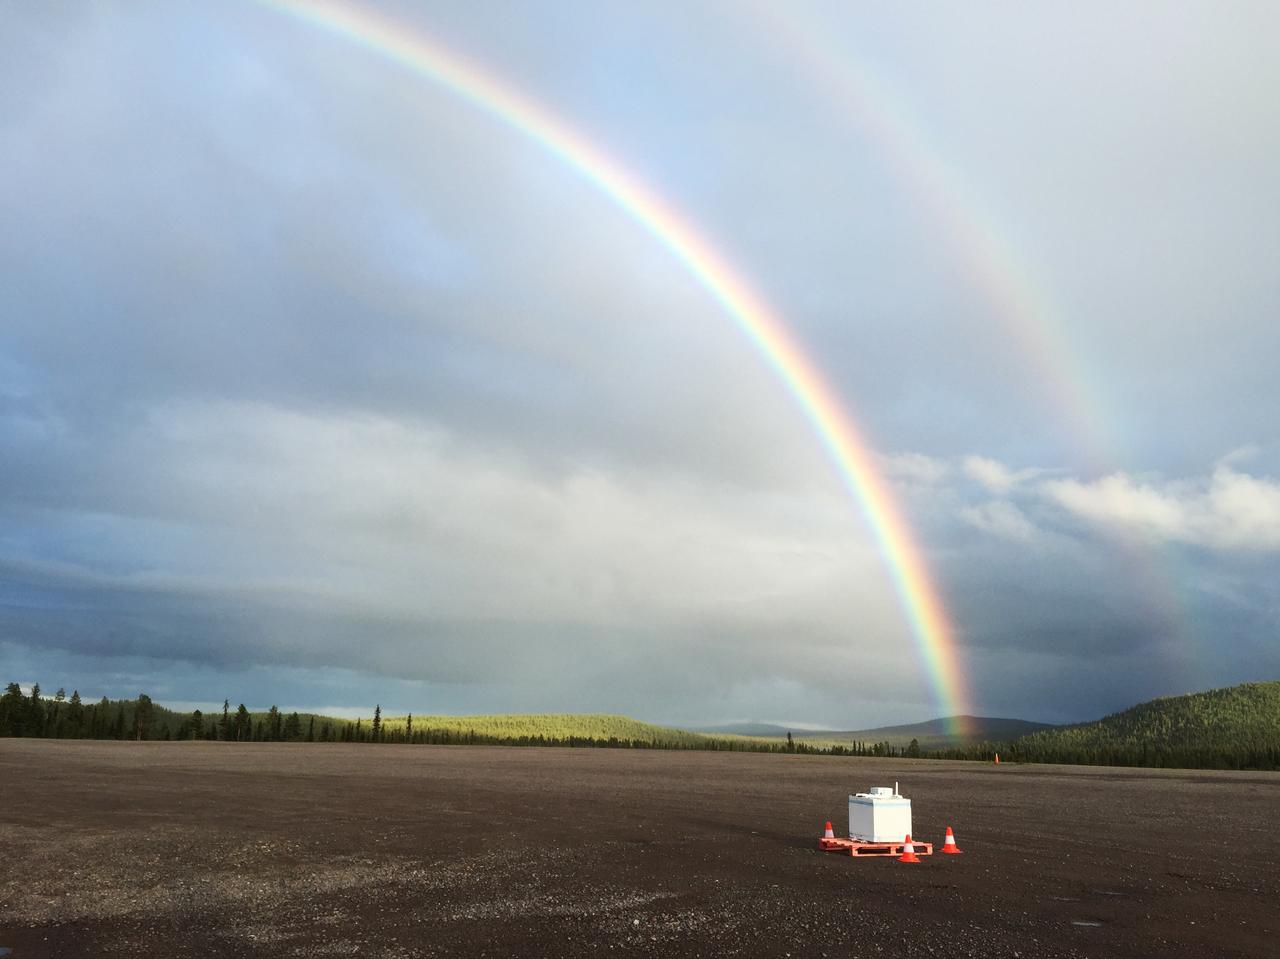
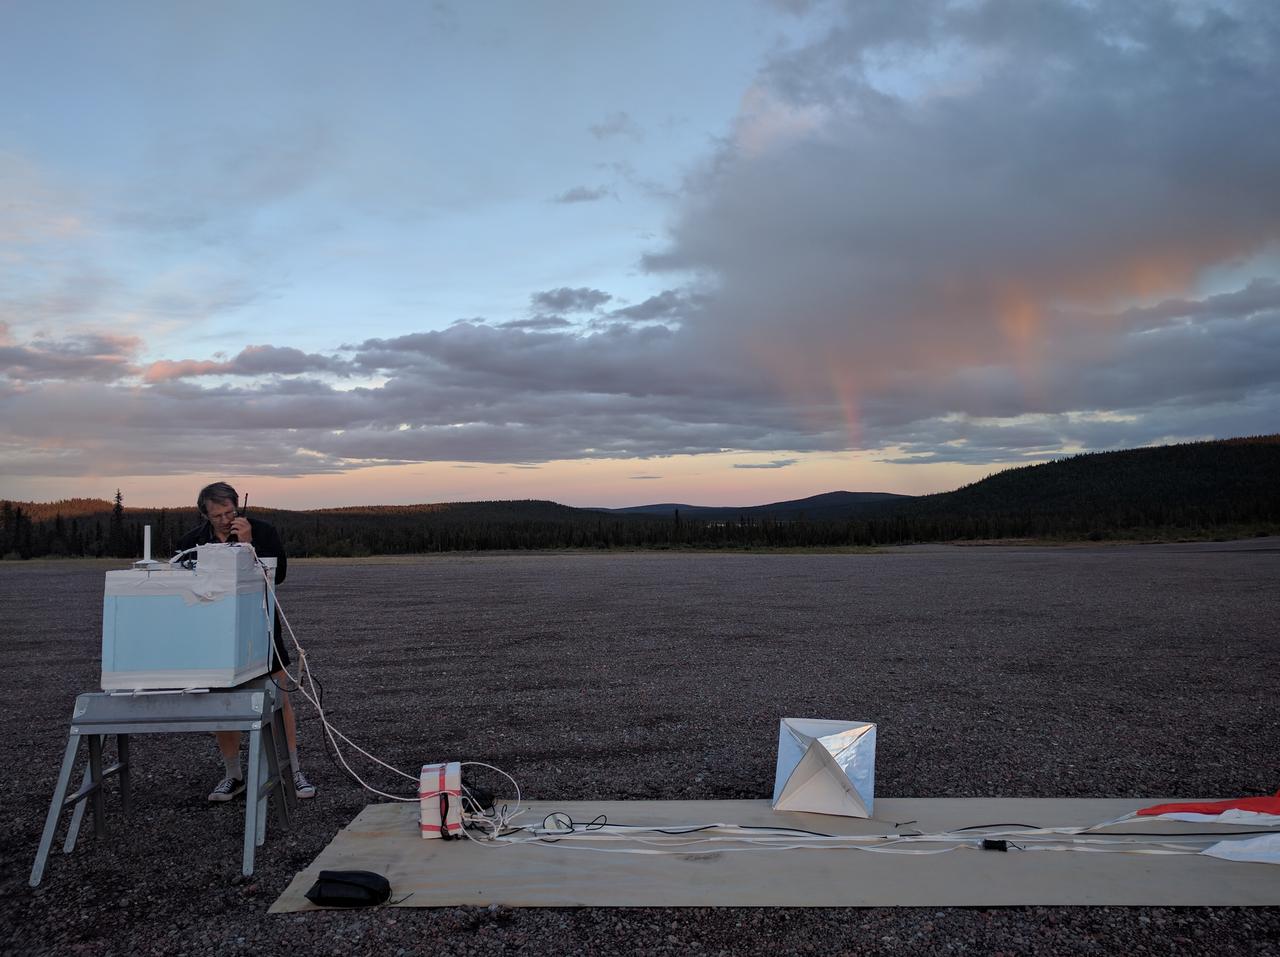
A BARREL payload sits on the launch pad at Esrange Space Center near Kiruna, Sweden. The BARREL team is at Esrange Space Center launching a series of six scientific payloads on miniature scientific balloons. The NASA-funded BARREL – which stands for Balloon Array for Radiation-belt Relativistic Electron Losses – primarily measures X-rays in Earth’s atmosphere near the North and South Poles. These X-rays are produced by electrons raining down into the atmosphere from two giant swaths of radiation that surround Earth, called the Van Allen belts. Learning about the radiation near Earth helps us to better protect our satellites. Several of the BARREL balloons also carry instruments built by undergraduate students to measure the total electron content of Earth’s ionosphere, as well as the low-frequency electromagnetic waves that help to scatter electrons into Earth’s atmosphere. Though about 90 feet in diameter, the BARREL balloons are much smaller than standard football stadium-sized scientific balloons. This is the fourth campaign for the BARREL mission. BARREL is led by Dartmouth College in Hanover, New Hampshire. The undergraduate student instrument team is led by the University of Houston and funded by the Undergraduate Student Instrument Project out of NASA’s Wallops Flight Facility. For more information on NASA’s scientific balloon program, visit: <a href="http://www.nasa.gov/scientificballoons" rel="nofollow">www.nasa.gov/scientificballoons</a>. Image credit: NASA/Dartmouth/Robyn Millan <b><a href="http://www.nasa.gov/audience/formedia/features/MP_Photo_Guidelines.html" rel="nofollow">NASA image use policy.</a></b> <b><a href="http://www.nasa.gov/centers/goddard/home/index.html" rel="nofollow">NASA Goddard Space Flight Center</a></b> enables NASA’s mission through four scientific endeavors: Earth Science, Heliophysics, Solar System Exploration, and Astrophysics. Goddard plays a leading role in NASA’s accomplishments by contributing compelling scientific knowledge to advance the Agency’s mission. <b>Follow us on <a href="http://twitter.com/NASAGoddardPix" rel="nofollow">Twitter</a></b> <b>Like us on <a href="http://www.facebook.com/pages/Greenbelt-MD/NASA-Goddard/395013845897?ref=tsd" rel="nofollow">Facebook</a></b> <b>Find us on <a href="http://instagrid.me/nasagoddard/?vm=grid" rel="nofollow">Instagram</a></b>
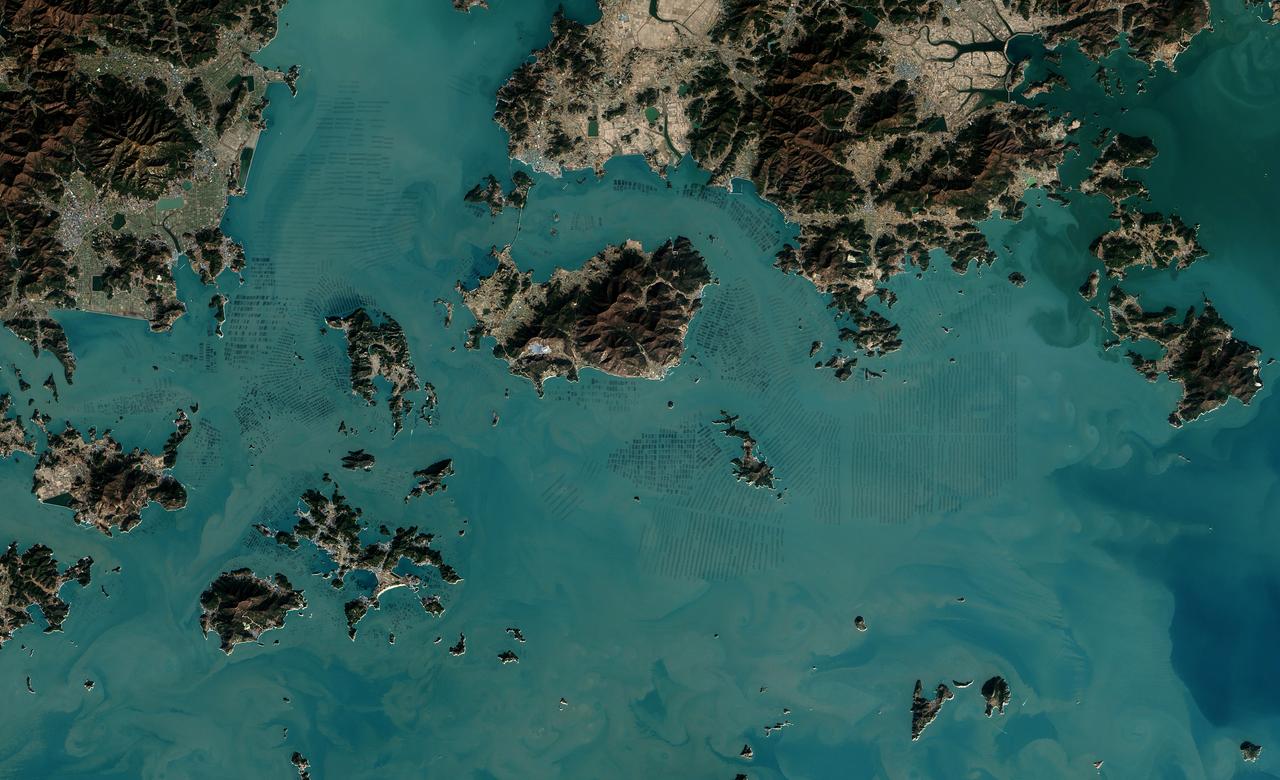
The dark squares that make up the checkerboard pattern in this image are fields of a sort—fields of seaweed. Along the south coast of South Korea, seaweed is often grown on ropes, which are held near the surface with buoys. This technique ensures that the seaweed stays close enough to the surface to get enough light during high tide but doesn’t scrape against the bottom during low tide. The Operational Land Imager (OLI) on Landsat 8 acquired this image of seaweed cultivation in the shallow waters around Sisan Island on January 31, 2014. Home to a thriving aquaculture industry, the south coast of South Korea produces about 90 percent of the country’s seaweed crop. The waters around Sisan are not the only place where aquaculture is common. View the large image to see how ubiquitous seaweed aquaculture is along the coast in Jeollanam-do, the southernmost province on the Korean peninsula. Two main types of seaweed are cultivated in South Korea: Undaria (known as miyeok in Korean, wakame in Japanese) and Pyropia (gim in Korean, nori in Japanese). Both types are used generously in traditional Korean, Japanese, and Chinese food. Since 1970, farmed seaweed production has increased by approximately 8 percent per year. Today, about 90 percent of all the seaweed that humans consume globally is farmed. That may be good for the environment. In comparison to other types of food production, seaweed farming has a light environmental footprint because it does not require fresh water or fertilizer. NASA Earth Observatory image by Jesse Allen, using Landsat data from the U.S. Geological Survey. Caption by Adam Voiland. Credit: <b><a href="http://www.earthobservatory.nasa.gov/" rel="nofollow"> NASA Earth Observatory</a></b> <b><a href="http://www.nasa.gov/audience/formedia/features/MP_Photo_Guidelines.html" rel="nofollow">NASA image use policy.</a></b> <b><a href="http://www.nasa.gov/centers/goddard/home/index.html" rel="nofollow">NASA Goddard Space Flight Center</a></b> enables NASA’s mission through four scientific endeavors: Earth Science, Heliophysics, Solar System Exploration, and Astrophysics. Goddard plays a leading role in NASA’s accomplishments by contributing compelling scientific knowledge to advance the Agency’s mission. <b>Follow us on <a href="http://twitter.com/NASAGoddardPix" rel="nofollow">Twitter</a></b> <b>Like us on <a href="http://www.facebook.com/pages/Greenbelt-MD/NASA-Goddard/395013845897?ref=tsd" rel="nofollow">Facebook</a></b> <b>Find us on <a href="http://instagrid.me/nasagoddard/?vm=grid" rel="nofollow">Instagram</a></b>

The fourth BARREL balloon of this campaign sits on the launch pad shortly before it launched on Aug. 21, 2016. The BARREL team is at Esrange Space Center near Kiruna, Sweden, launching a series of six scientific payloads on miniature scientific balloons. The NASA-funded BARREL – which stands for Balloon Array for Radiation-belt Relativistic Electron Losses – primarily measures X-rays in Earth’s atmosphere near the North and South Poles. These X-rays are produced by electrons raining down into the atmosphere from two giant swaths of radiation that surround Earth, called the Van Allen belts. Learning about the radiation near Earth helps us to better protect our satellites. Several of the BARREL balloons also carry instruments built by undergraduate students to measure the total electron content of Earth’s ionosphere, as well as the low-frequency electromagnetic waves that help to scatter electrons into Earth’s atmosphere. Though about 90 feet in diameter, the BARREL balloons are much smaller than standard football stadium-sized scientific balloons. This is the fourth campaign for the BARREL mission. BARREL is led by Dartmouth College in Hanover, New Hampshire. The undergraduate student instrument team is led by the University of Houston and funded by the Undergraduate Student Instrument Project out of NASA’s Wallops Flight Facility. For more information on NASA’s scientific balloon program, visit: <a href="http://www.nasa.gov/scientificballoons" rel="nofollow">www.nasa.gov/scientificballoons</a>. Credit: NASA/University of Houston/Michael Greer <b><a href="http://www.nasa.gov/audience/formedia/features/MP_Photo_Guidelines.html" rel="nofollow">NASA image use policy.</a></b> <b><a href="http://www.nasa.gov/centers/goddard/home/index.html" rel="nofollow">NASA Goddard Space Flight Center</a></b> enables NASA’s mission through four scientific endeavors: Earth Science, Heliophysics, Solar System Exploration, and Astrophysics. Goddard plays a leading role in NASA’s accomplishments by contributing compelling scientific knowledge to advance the Agency’s mission. <b>Follow us on <a href="http://twitter.com/NASAGoddardPix" rel="nofollow">Twitter</a></b> <b>Like us on <a href="http://www.facebook.com/pages/Greenbelt-MD/NASA-Goddard/395013845897?ref=tsd" rel="nofollow">Facebook</a></b> <b>Find us on <a href="http://instagrid.me/nasagoddard/?vm=grid" rel="nofollow">Instagram</a></b>
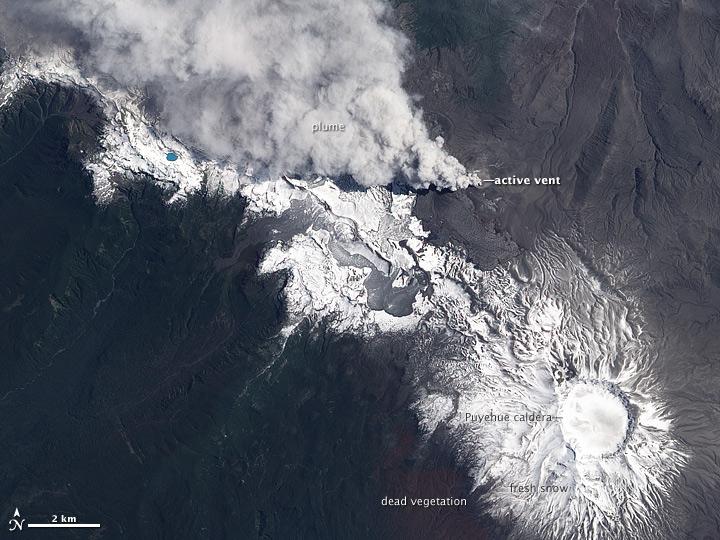
NASA image acquired December 23, 2011 In early June 2011, Chile’s Puyehue-Cordón Caulle Volcano erupted explosively, sending volcanic ash around the Southern Hemisphere. In late December 2011, activity at the volcano had calmed, but volcanic ash and steam continued to pour through the fissure that opened several months earlier. The Advanced Land Imager (ALI) on NASA’s Earth Observing-1 (EO-1) satellite captured this natural-color image on December 23, 2011. The active fissure lies northwest of the Puyehue caldera, and a plume blows from the fissure toward the west and north. This image shows not just ash but also snow on the volcano surface, including the caldera. Because volcanic ash regularly coats the land surface, the pristine snow probably fell recently. In a bulletin issued December 26, 2011, Chile’s Servicio Nacional de Geología y Minería (SERNAGEOMIN) characterized the activity over the previous 24 hours as a minor eruption of low intensity. Reaching an altitude of 2,236 meters (7,336 feet), Puyehue-Cordón Caulle is a stratovolcano, a steep-sloped, conical volcano composed of layers of ash, lava, and rocks released by previous eruptions. This volcano comprises part of the largest active geothermal area in the southern Andes. NASA Earth Observatory image created by Jesse Allen, using EO-1 ALI data provided courtesy of the NASA EO-1 team. Caption by Michon Scott. Instrument: EO-1 - ALI To view more images from this event go here: <a href="http://earthobservatory.nasa.gov/NaturalHazards/event.php?id=50859" rel="nofollow">earthobservatory.nasa.gov/NaturalHazards/event.php?id=50859</a> Credit: <b><a href="http://www.earthobservatory.nasa.gov/" rel="nofollow"> NASA Earth Observatory</a></b> <b><a href="http://www.nasa.gov/audience/formedia/features/MP_Photo_Guidelines.html" rel="nofollow">NASA image use policy.</a></b> <b><a href="http://www.nasa.gov/centers/goddard/home/index.html" rel="nofollow">NASA Goddard Space Flight Center</a></b> enables NASA’s mission through four scientific endeavors: Earth Science, Heliophysics, Solar System Exploration, and Astrophysics. Goddard plays a leading role in NASA’s accomplishments by contributing compelling scientific knowledge to advance the Agency’s mission. <b>Follow us on <a href="http://twitter.com/NASA_GoddardPix" rel="nofollow">Twitter</a></b> <b>Like us on <a href="http://www.facebook.com/pages/Greenbelt-MD/NASA-Goddard/395013845897?ref=tsd" rel="nofollow">Facebook</a></b> <b>Find us on <a href="http://instagrid.me/nasagoddard/?vm=grid" rel="nofollow">Instagram</a></b>
A BARREL team member watches as one of their payloads launches from Esrange Space Center on Aug. 29, 2016. Throughout August 2016, the BARREL team was at Esrange Space Center near Kiruna, Sweden, launching a series of six scientific payloads on miniature scientific balloons. The NASA-funded BARREL – which stands for Balloon Array for Radiation-belt Relativistic Electron Losses – primarily measures X-rays in Earth’s atmosphere near the North and South Poles. These X-rays are produced by electrons raining down into the atmosphere from two giant swaths of radiation that surround Earth, called the Van Allen belts. Learning about the radiation near Earth helps us to better protect our satellites. Several of the BARREL balloons also carried instruments built by undergraduate students to measure the total electron content of Earth’s ionosphere, as well as the low-frequency electromagnetic waves that help to scatter electrons into Earth’s atmosphere. Though about 90 feet in diameter, the BARREL balloons are much smaller than standard football stadium-sized scientific balloons. This is the fourth campaign for the BARREL mission. BARREL is led by Dartmouth College in Hanover, New Hampshire. The undergraduate student instrument team is led by the University of Houston and funded by the Undergraduate Student Instrument Project out of NASA’s Wallops Flight Facility. For more information on NASA’s scientific balloon program, visit: <a href="http://www.nasa.gov/scientificballoons" rel="nofollow">www.nasa.gov/scientificballoons</a>. Credit: NASA/Dartmouth/Alexa Halford <b><a href="http://www.nasa.gov/audience/formedia/features/MP_Photo_Guidelines.html" rel="nofollow">NASA image use policy.</a></b> <b><a href="http://www.nasa.gov/centers/goddard/home/index.html" rel="nofollow">NASA Goddard Space Flight Center</a></b> enables NASA’s mission through four scientific endeavors: Earth Science, Heliophysics, Solar System Exploration, and Astrophysics. Goddard plays a leading role in NASA’s accomplishments by contributing compelling scientific knowledge to advance the Agency’s mission. <b>Follow us on <a href="http://twitter.com/NASAGoddardPix" rel="nofollow">Twitter</a></b> <b>Like us on <a href="http://www.facebook.com/pages/Greenbelt-MD/NASA-Goddard/395013845897?ref=tsd" rel="nofollow">Facebook</a></b> <b>Find us on <a href="http://instagrid.me/nasagoddard/?vm=grid" rel="nofollow">Instagram</a></b>
The BARREL team prepares to launch their third payload from Esrange Space Center near Kiruna, Sweden, on Aug. 21, 2016. The BARREL team is at Esrange Space Center launching a series of six scientific payloads on miniature scientific balloons. The NASA-funded BARREL – which stands for Balloon Array for Radiation-belt Relativistic Electron Losses – primarily measures X-rays in Earth’s atmosphere near the North and South Poles. These X-rays are produced by electrons raining down into the atmosphere from two giant swaths of radiation that surround Earth, called the Van Allen belts. Learning about the radiation near Earth helps us to better protect our satellites. Several of the BARREL balloons also carry instruments built by undergraduate students to measure the total electron content of Earth’s ionosphere, as well as the low-frequency electromagnetic waves that help to scatter electrons into Earth’s atmosphere. Though about 90 feet in diameter, the BARREL balloons are much smaller than standard football stadium-sized scientific balloons. This is the fourth campaign for the BARREL mission. BARREL is led by Dartmouth College in Hanover, New Hampshire. The undergraduate student instrument team is led by the University of Houston and funded by the Undergraduate Student Instrument Project out of NASA’s Wallops Flight Facility. For more information on NASA’s scientific balloon program, visit: <a href="http://www.nasa.gov/scientificballoons" rel="nofollow">www.nasa.gov/scientificballoons</a>. Credit: NASA/University of Houston/Michael Greer <b><a href="http://www.nasa.gov/audience/formedia/features/MP_Photo_Guidelines.html" rel="nofollow">NASA image use policy.</a></b> <b><a href="http://www.nasa.gov/centers/goddard/home/index.html" rel="nofollow">NASA Goddard Space Flight Center</a></b> enables NASA’s mission through four scientific endeavors: Earth Science, Heliophysics, Solar System Exploration, and Astrophysics. Goddard plays a leading role in NASA’s accomplishments by contributing compelling scientific knowledge to advance the Agency’s mission. <b>Follow us on <a href="http://twitter.com/NASAGoddardPix" rel="nofollow">Twitter</a></b> <b>Like us on <a href="http://www.facebook.com/pages/Greenbelt-MD/NASA-Goddard/395013845897?ref=tsd" rel="nofollow">Facebook</a></b> <b>Find us on <a href="http://instagrid.me/nasagoddard/?vm=grid" rel="nofollow">Instagram</a></b>
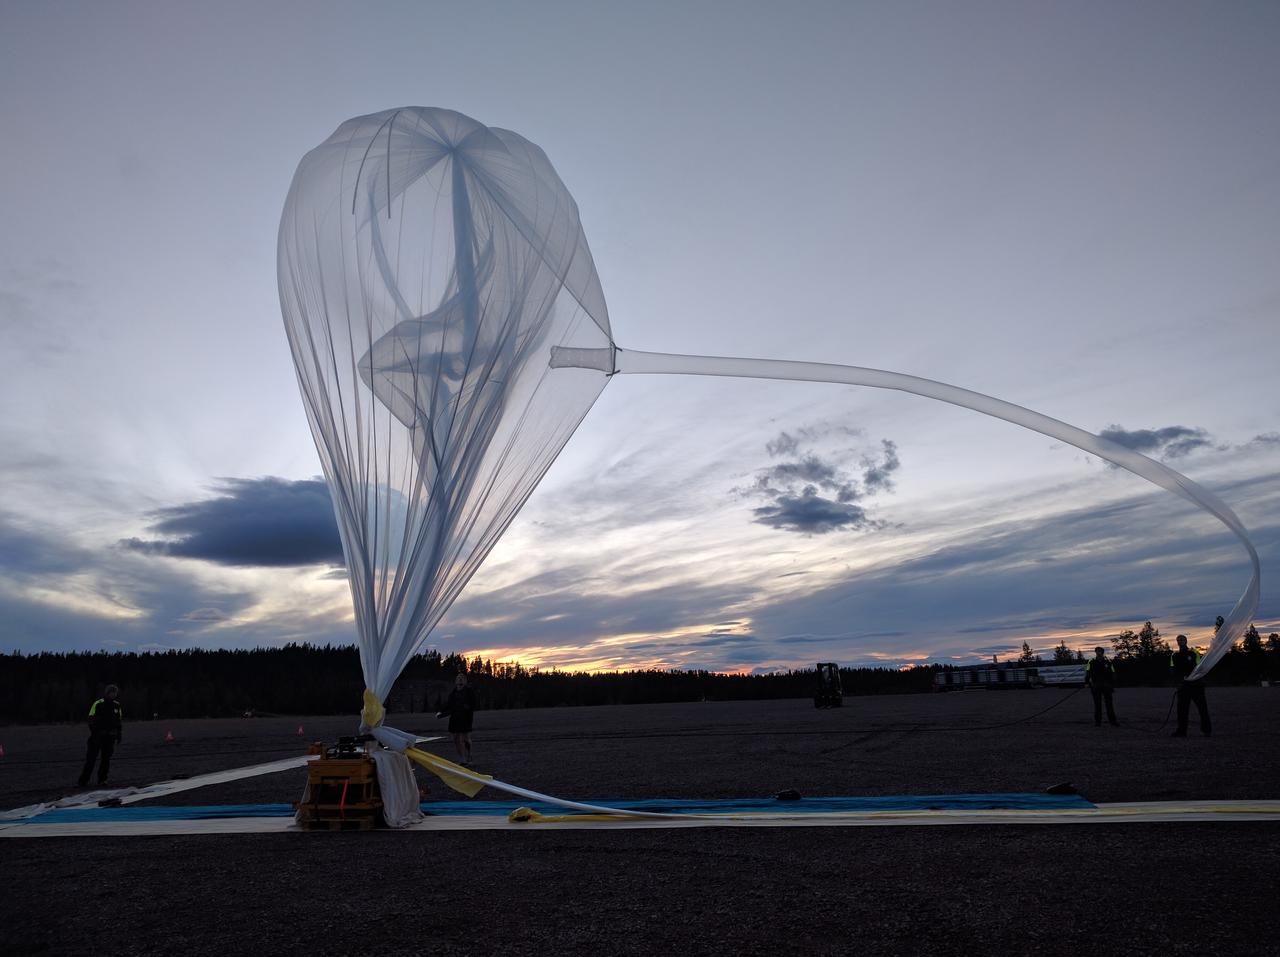
A BARREL balloon inflates on the launch pad at Esrange Space Center on Aug. 29, 2016. Throughout August 2016, the BARREL team was at Esrange Space Center near Kiruna, Sweden, launching a series of six scientific payloads on miniature scientific balloons. The NASA-funded BARREL – which stands for Balloon Array for Radiation-belt Relativistic Electron Losses – primarily measures X-rays in Earth’s atmosphere near the North and South Poles. These X-rays are produced by electrons raining down into the atmosphere from two giant swaths of radiation that surround Earth, called the Van Allen belts. Learning about the radiation near Earth helps us to better protect our satellites. Several of the BARREL balloons also carried instruments built by undergraduate students to measure the total electron content of Earth’s ionosphere, as well as the low-frequency electromagnetic waves that help to scatter electrons into Earth’s atmosphere. Though about 90 feet in diameter, the BARREL balloons are much smaller than standard football stadium-sized scientific balloons. This is the fourth campaign for the BARREL mission. BARREL is led by Dartmouth College in Hanover, New Hampshire. The undergraduate student instrument team is led by the University of Houston and funded by the Undergraduate Student Instrument Project out of NASA’s Wallops Flight Facility. For more information on NASA’s scientific balloon program, visit: <a href="http://www.nasa.gov/scientificballoons" rel="nofollow">www.nasa.gov/scientificballoons</a>. Credit: NASA/Dartmouth/Alexa Halford <b><a href="http://www.nasa.gov/audience/formedia/features/MP_Photo_Guidelines.html" rel="nofollow">NASA image use policy.</a></b> <b><a href="http://www.nasa.gov/centers/goddard/home/index.html" rel="nofollow">NASA Goddard Space Flight Center</a></b> enables NASA’s mission through four scientific endeavors: Earth Science, Heliophysics, Solar System Exploration, and Astrophysics. Goddard plays a leading role in NASA’s accomplishments by contributing compelling scientific knowledge to advance the Agency’s mission. <b>Follow us on <a href="http://twitter.com/NASAGoddardPix" rel="nofollow">Twitter</a></b> <b>Like us on <a href="http://www.facebook.com/pages/Greenbelt-MD/NASA-Goddard/395013845897?ref=tsd" rel="nofollow">Facebook</a></b> <b>Find us on <a href="http://instagrid.me/nasagoddard/?vm=grid" rel="nofollow">Instagram</a></b>
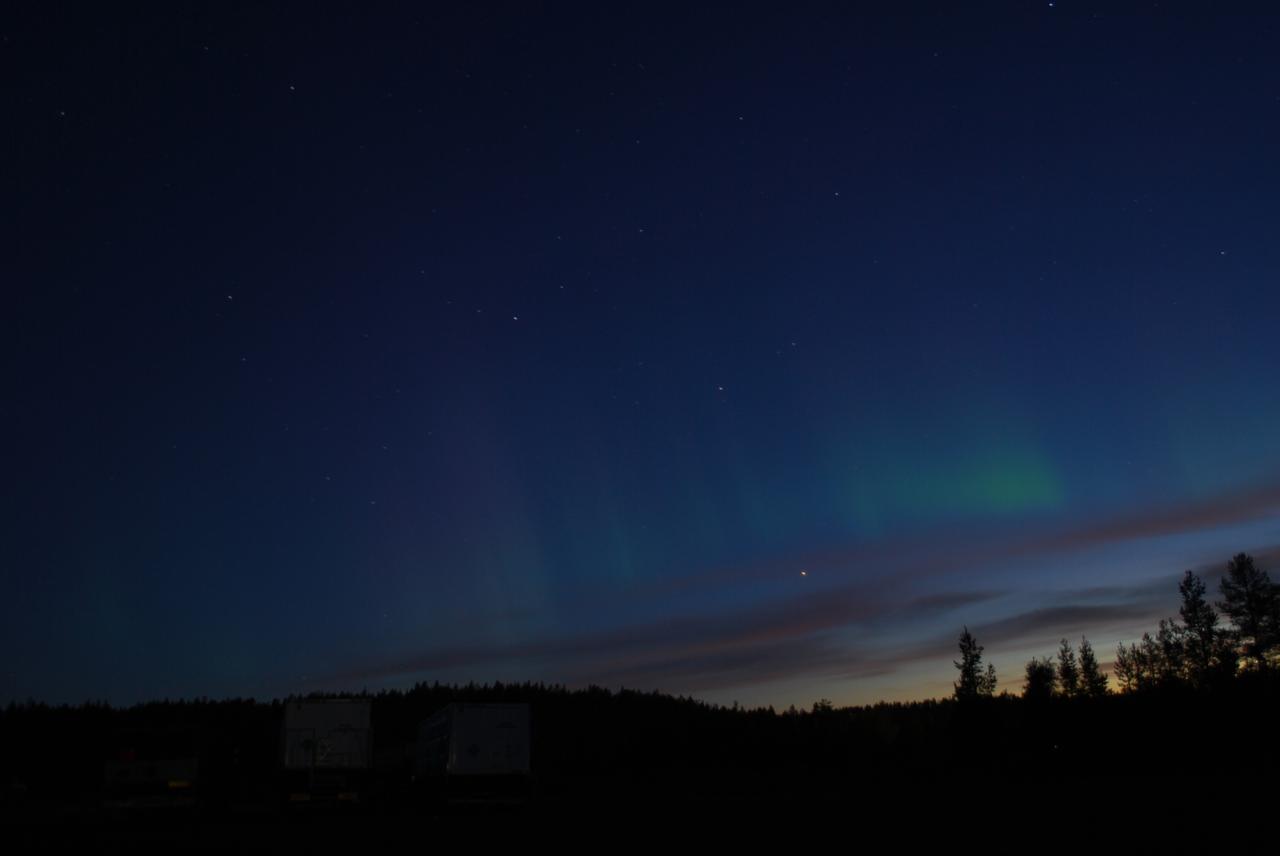
The faint green glow of aurora can be seen above the clouds at Esrange Space Center in this photo from Aug. 23, 2016. Auroras are created by energetic electrons, which rain down from Earth’s magnetic bubble and interact with particles in the upper atmosphere to create glowing lights that stretch across the sky. The BARREL team is at Esrange Space Center near Kiruna, Sweden, launching a series of six scientific payloads on miniature scientific balloons. The NASA-funded BARREL – which stands for Balloon Array for Radiation-belt Relativistic Electron Losses – primarily measures X-rays in Earth’s atmosphere near the North and South Poles. These X-rays are produced by electrons raining down into the atmosphere from two giant swaths of radiation that surround Earth, called the Van Allen belts. Learning about the radiation near Earth helps us to better protect our satellites. Several of the BARREL balloons also carry instruments built by undergraduate students to measure the total electron content of Earth’s ionosphere, as well as the low-frequency electromagnetic waves that help to scatter electrons into Earth’s atmosphere. Though about 90 feet in diameter, the BARREL balloons are much smaller than standard football stadium-sized scientific balloons. This is the fourth campaign for the BARREL mission. BARREL is led by Dartmouth College in Hanover, New Hampshire. The undergraduate student instrument team is led by the University of Houston and funded by the Undergraduate Student Instrument Project out of NASA’s Wallops Flight Facility. For more information on NASA’s scientific balloon program, visit: <a href="http://www.nasa.gov/scientificballoons" rel="nofollow">www.nasa.gov/scientificballoons</a>. Credit: NASA/University of Houston/Michael Greer <b><a href="http://www.nasa.gov/audience/formedia/features/MP_Photo_Guidelines.html" rel="nofollow">NASA image use policy.</a></b> <b><a href="http://www.nasa.gov/centers/goddard/home/index.html" rel="nofollow">NASA Goddard Space Flight Center</a></b> enables NASA’s mission through four scientific endeavors: Earth Science, Heliophysics, Solar System Exploration, and Astrophysics. Goddard plays a leading role in NASA’s accomplishments by contributing compelling scientific knowledge to advance the Agency’s mission. <b>Follow us on <a href="http://twitter.com/NASAGoddardPix" rel="nofollow">Twitter</a></b> <b>Like us on <a href="http://www.facebook.com/pages/Greenbelt-MD/NASA-Goddard/395013845897?ref=tsd" rel="nofollow">Facebook</a></b> <b>Find us on <a href="http://instagrid.me/nasagoddard/?vm=grid" rel="nofollow">Instagram</a></b>

NASA image acquired September 6, 2010 The Matusevich Glacier flows toward the coast of East Antarctica, pushing through a channel between the Lazarev Mountains and the northwestern tip of the Wilson Hills. Constrained by surrounding rocks, the river of ice holds together. But stresses resulting from the glacier’s movement make deep crevasses, or cracks, in the ice. After passing through the channel, the glacier has room to spread out as it floats on the ocean. The expanded area and the jostling of ocean waves prompts the ice to break apart, which it often does along existing crevasses. On September 6, 2010, the Advanced Land Imager (ALI) on NASA’s Earth Observing-1 (EO-1) satellite captured this natural-color image of the margin of Matusevich Glacier. Shown here just past the rock-lined channel, the glacier is calving large icebergs. Low-angled sunlight illuminates north-facing surfaces and casts long shadows to the south. Fast ice anchored to the shore surrounds both the glacier tongue and the icebergs it has calved. Compared to the glacier and icebergs, the fast ice is thinner with a smoother surface. Out to sea (image left), the sea ice is even thinner and moves with winds and currents. Matusevich Glacier does not drain a significant amount of ice off of the Antarctic continent, so the glacier’s advances and retreats lack global significance. Like other Antarctic glaciers, however, Matusevich helps glaciologists form a larger picture of Antarctica’s glacial health and ice sheet volume. NASA Earth Observatory image created by Jesse Allen and Robert Simmon, using EO-1 ALI data provided courtesy of the NASA EO-1 team. Caption by Michon Scott based on image interpretation by Robert Bindschadler, NASA Goddard Space Flight Center, and Walt Meier, National Snow and Ice Data Center. Instrument: EO-1 - ALI Credit: <b><a href="http://www.earthobservatory.nasa.gov/" rel="nofollow"> NASA Earth Observatory</a></b> <b><a href="http://www.nasa.gov/centers/goddard/home/index.html" rel="nofollow">NASA Goddard Space Flight Center</a></b> enables NASA’s mission through four scientific endeavors: Earth Science, Heliophysics, Solar System Exploration, and Astrophysics. Goddard plays a leading role in NASA’s accomplishments by contributing compelling scientific knowledge to advance the Agency’s mission. <b>Follow us on <a href="http://twitter.com/NASA_GoddardPix" rel="nofollow">Twitter</a></b> <b>Join us on <a href="http://www.facebook.com/pages/Greenbelt-MD/NASA-Goddard/395013845897?ref=tsd" rel="nofollow">Facebook</a></b> To download the full resolution image go to: <a href="http://earthobservatory.nasa.gov/IOTD/view.php?id=46840" rel="nofollow">earthobservatory.nasa.gov/IOTD/view.php?id=46840</a>

The BARREL team inflates the balloon to launch their fifth scientific payload from Esrange Space Center near Kiruna, Sweden, on Aug. 24, 2016. The BARREL team is at Esrange Space Center launching a series of six scientific payloads on miniature scientific balloons. The NASA-funded BARREL – which stands for Balloon Array for Radiation-belt Relativistic Electron Losses – primarily measures X-rays in Earth’s atmosphere near the North and South Poles. These X-rays are produced by electrons raining down into the atmosphere from two giant swaths of radiation that surround Earth, called the Van Allen belts. Learning about the radiation near Earth helps us to better protect our satellites. Several of the BARREL balloons also carry instruments built by undergraduate students to measure the total electron content of Earth’s ionosphere, as well as the low-frequency electromagnetic waves that help to scatter electrons into Earth’s atmosphere. Though about 90 feet in diameter, the BARREL balloons are much smaller than standard football stadium-sized scientific balloons. This is the fourth campaign for the BARREL mission. BARREL is led by Dartmouth College in Hanover, New Hampshire. The undergraduate student instrument team is led by the University of Houston and funded by the Undergraduate Student Instrument Project out of NASA’s Wallops Flight Facility. For more information on NASA’s scientific balloon program, visit: <a href="http://www.nasa.gov/scientificballoons" rel="nofollow">www.nasa.gov/scientificballoons</a>. Credit: NASA/University of Houston/Michael Greer <b><a href="http://www.nasa.gov/audience/formedia/features/MP_Photo_Guidelines.html" rel="nofollow">NASA image use policy.</a></b> <b><a href="http://www.nasa.gov/centers/goddard/home/index.html" rel="nofollow">NASA Goddard Space Flight Center</a></b> enables NASA’s mission through four scientific endeavors: Earth Science, Heliophysics, Solar System Exploration, and Astrophysics. Goddard plays a leading role in NASA’s accomplishments by contributing compelling scientific knowledge to advance the Agency’s mission. <b>Follow us on <a href="http://twitter.com/NASAGoddardPix" rel="nofollow">Twitter</a></b> <b>Like us on <a href="http://www.facebook.com/pages/Greenbelt-MD/NASA-Goddard/395013845897?ref=tsd" rel="nofollow">Facebook</a></b> <b>Find us on <a href="http://instagrid.me/nasagoddard/?vm=grid" rel="nofollow">Instagram</a></b>
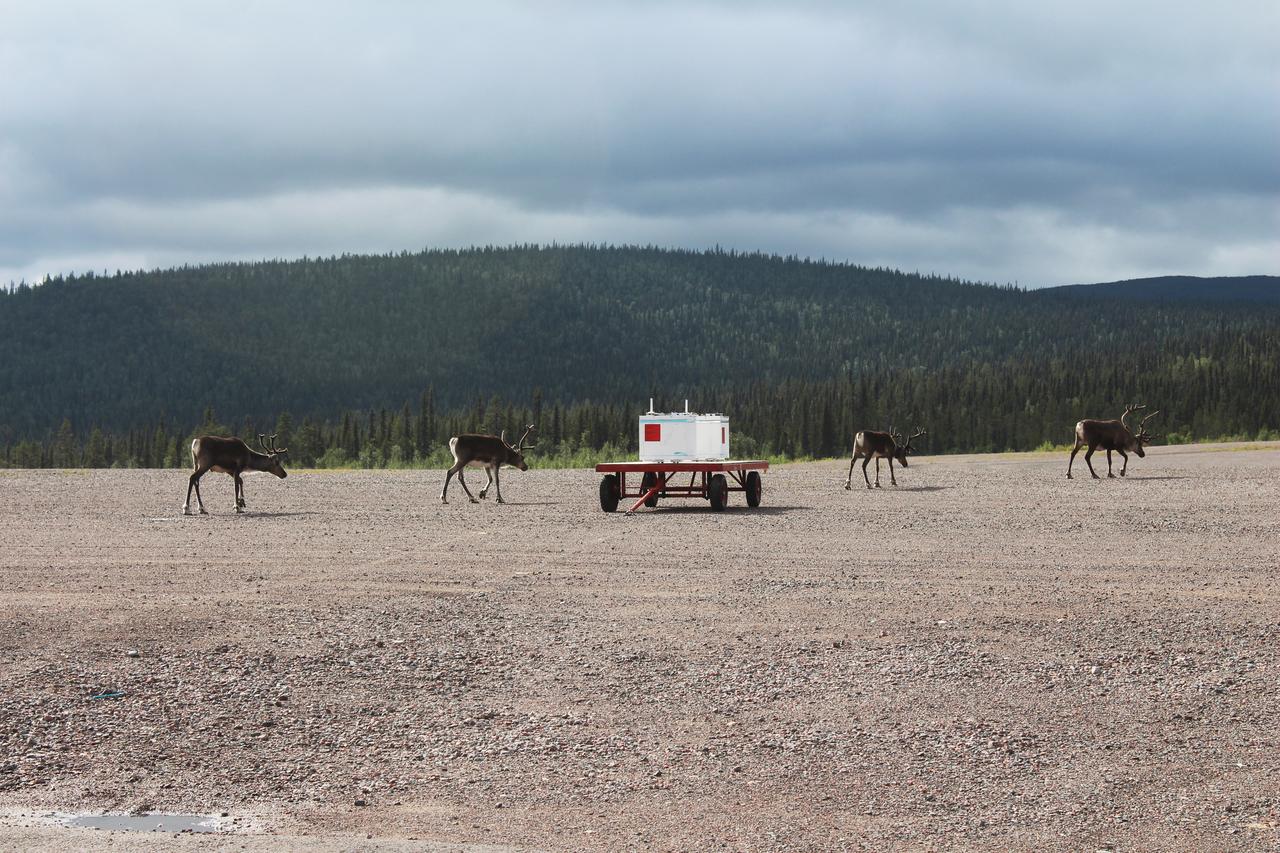
Four reindeer walk past the BARREL payload on the launch pad at Esrange Space Center near Kiruna, Sweden. The BARREL team is at Esrange Space Center launching a series of six scientific payloads on miniature scientific balloons. The NASA-funded BARREL – which stands for Balloon Array for Radiation-belt Relativistic Electron Losses – primarily measures X-rays in Earth’s atmosphere near the North and South Poles. These X-rays are produced by electrons raining down into the atmosphere from two giant swaths of radiation that surround Earth, called the Van Allen belts. Learning about the radiation near Earth helps us to better protect our satellites. Several of the BARREL balloons also carry instruments built by undergraduate students to measure the total electron content of Earth’s ionosphere, as well as the low-frequency electromagnetic waves that help to scatter electrons into Earth’s atmosphere. Though about 90 feet in diameter, the BARREL balloons are much smaller than standard football stadium-sized scientific balloons. This is the fourth campaign for the BARREL mission. BARREL is led by Dartmouth College in Hanover, New Hampshire. The undergraduate student instrument team is led by the University of Houston and funded by the Undergraduate Student Instrument Project out of NASA’s Wallops Flight Facility. For more information on NASA’s scientific balloon program, visit: <a href="http://www.nasa.gov/scientificballoons" rel="nofollow">www.nasa.gov/scientificballoons</a>. Image credit: NASA/University of Houston/Samar Mathur <b><a href="http://www.nasa.gov/audience/formedia/features/MP_Photo_Guidelines.html" rel="nofollow">NASA image use policy.</a></b> <b><a href="http://www.nasa.gov/centers/goddard/home/index.html" rel="nofollow">NASA Goddard Space Flight Center</a></b> enables NASA’s mission through four scientific endeavors: Earth Science, Heliophysics, Solar System Exploration, and Astrophysics. Goddard plays a leading role in NASA’s accomplishments by contributing compelling scientific knowledge to advance the Agency’s mission. <b>Follow us on <a href="http://twitter.com/NASAGoddardPix" rel="nofollow">Twitter</a></b> <b>Like us on <a href="http://www.facebook.com/pages/Greenbelt-MD/NASA-Goddard/395013845897?ref=tsd" rel="nofollow">Facebook</a></b> <b>Find us on <a href="http://instagrid.me/nasagoddard/?vm=grid" rel="nofollow">Instagram</a></b>
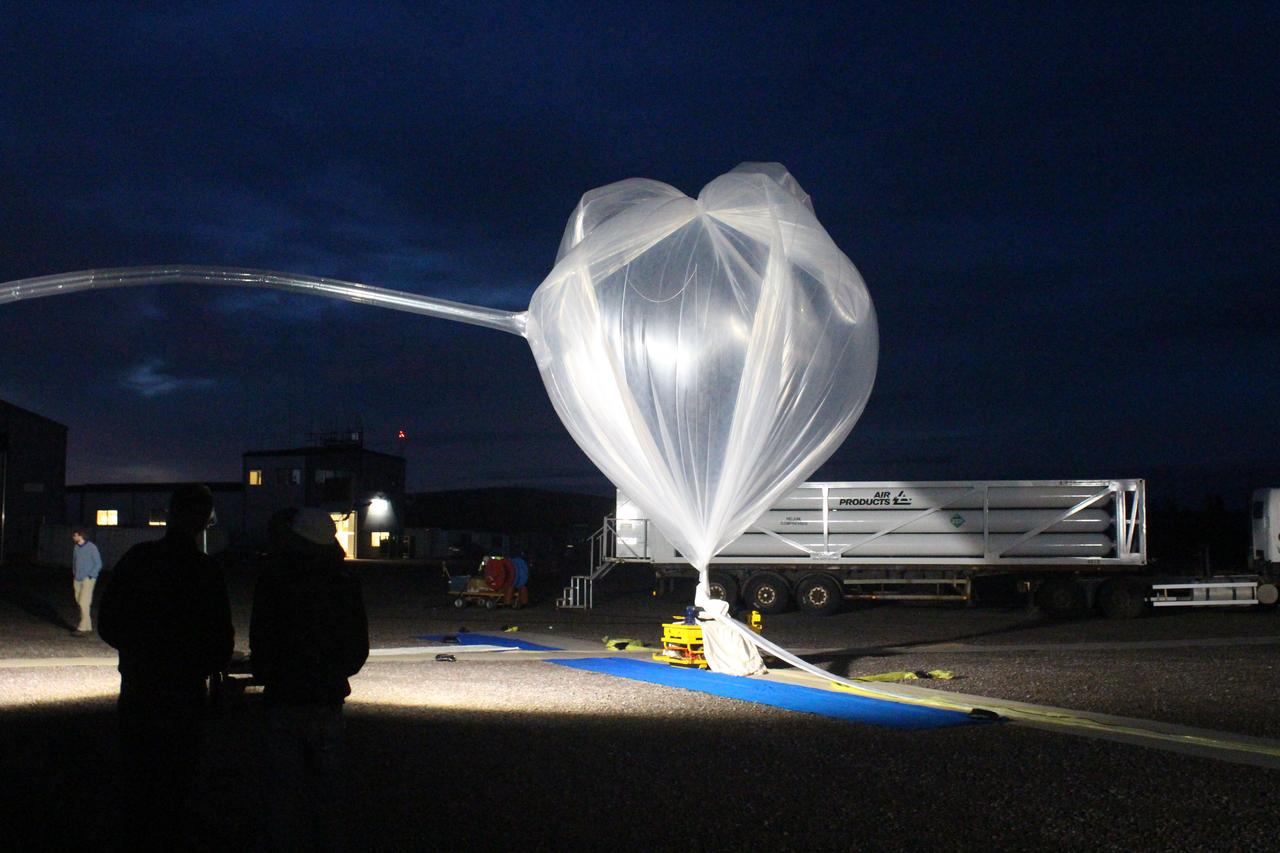
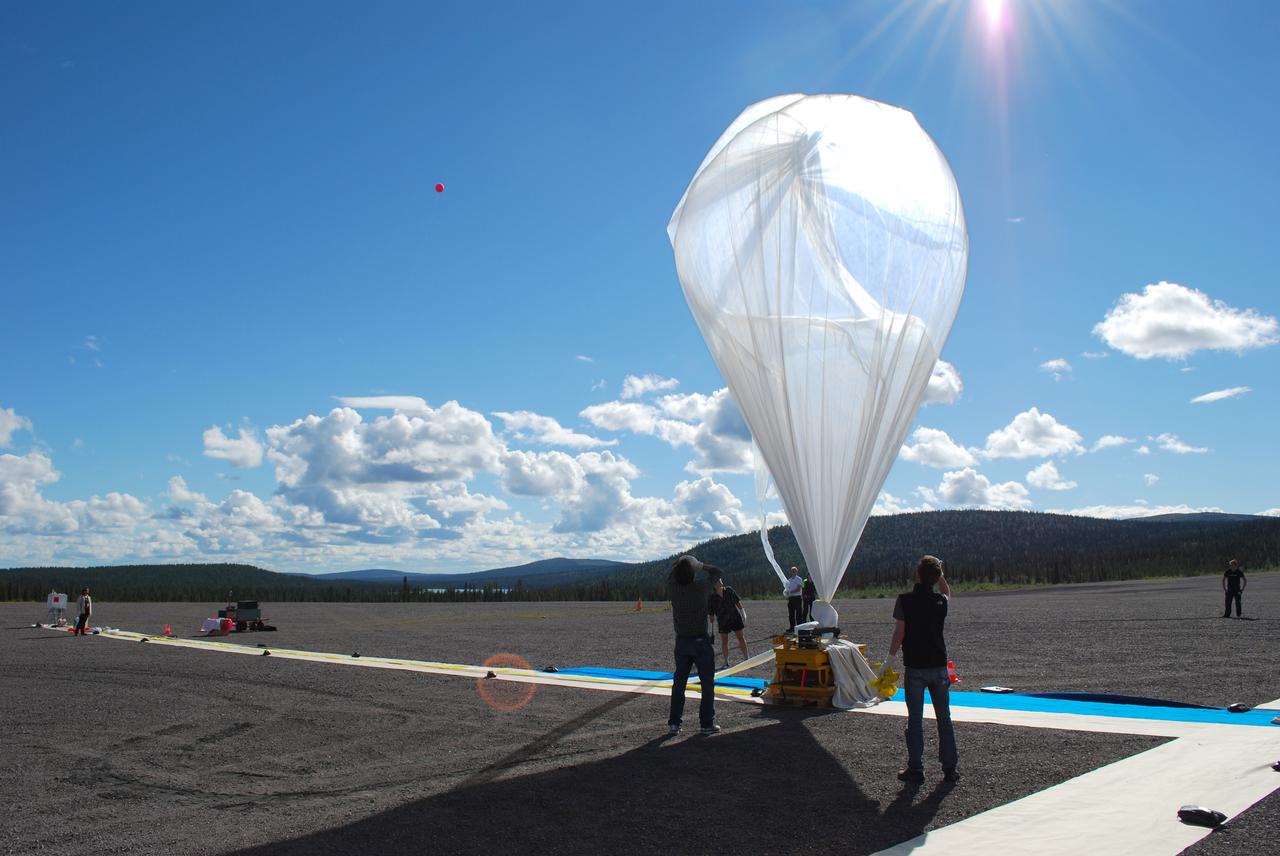
The first BARREL balloon is inflated just before its launch on Aug. 13, 2016, from Esrange Space Center near Kiruna, Sweden. The BARREL team is at Esrange Space Center launching a series of six scientific payloads on miniature scientific balloons. The NASA-funded BARREL – which stands for Balloon Array for Radiation-belt Relativistic Electron Losses – primarily measures X-rays in Earth’s atmosphere near the North and South Poles. These X-rays are produced by electrons raining down into the atmosphere from two giant swaths of radiation that surround Earth, called the Van Allen belts. Learning about the radiation near Earth helps us to better protect our satellites. Several of the BARREL balloons also carry instruments built by undergraduate students to measure the total electron content of Earth’s ionosphere, as well as the low-frequency electromagnetic waves that help to scatter electrons into Earth’s atmosphere. Though about 90 feet in diameter, the BARREL balloons are much smaller than standard football stadium-sized scientific balloons. This is the fourth campaign for the BARREL mission. BARREL is led by Dartmouth College in Hanover, New Hampshire. The undergraduate student instrument team is led by the University of Houston and funded by the Undergraduate Student Instrument Project out of NASA’s Wallops Flight Facility. For more information on NASA’s scientific balloon program, visit: <a href="http://www.nasa.gov/scientificballoons" rel="nofollow">www.nasa.gov/scientificballoons</a>. Image credit: NASA/University of Houston/Edgar Bering <b><a href="http://www.nasa.gov/audience/formedia/features/MP_Photo_Guidelines.html" rel="nofollow">NASA image use policy.</a></b> <b><a href="http://www.nasa.gov/centers/goddard/home/index.html" rel="nofollow">NASA Goddard Space Flight Center</a></b> enables NASA’s mission through four scientific endeavors: Earth Science, Heliophysics, Solar System Exploration, and Astrophysics. Goddard plays a leading role in NASA’s accomplishments by contributing compelling scientific knowledge to advance the Agency’s mission. <b>Follow us on <a href="http://twitter.com/NASAGoddardPix" rel="nofollow">Twitter</a></b> <b>Like us on <a href="http://www.facebook.com/pages/Greenbelt-MD/NASA-Goddard/395013845897?ref=tsd" rel="nofollow">Facebook</a></b> <b>Find us on <a href="http://instagrid.me/nasagoddard/?vm=grid" rel="nofollow">Instagram</a></b>
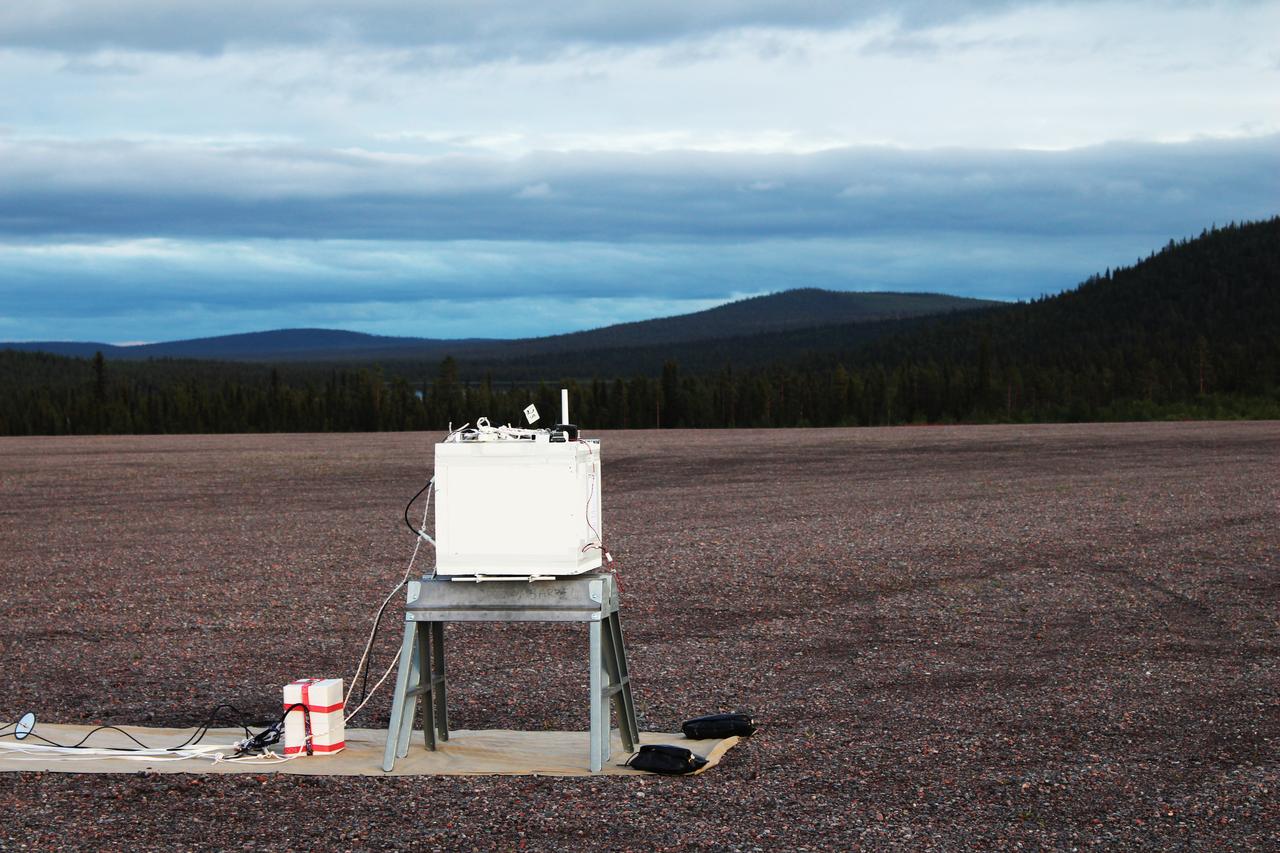
A BARREL payload sits on the launch pad at Esrange Space Center near Kiruna, Sweden. The BARREL team is at Esrange Space Center launching a series of six scientific payloads on miniature scientific balloons. The NASA-funded BARREL – which stands for Balloon Array for Radiation-belt Relativistic Electron Losses – primarily measures X-rays in Earth’s atmosphere near the North and South Poles. These X-rays are produced by electrons raining down into the atmosphere from two giant swaths of radiation that surround Earth, called the Van Allen belts. Learning about the radiation near Earth helps us to better protect our satellites. Several of the BARREL balloons also carry instruments built by undergraduate students to measure the total electron content of Earth’s ionosphere, as well as the low-frequency electromagnetic waves that help to scatter electrons into Earth’s atmosphere. Though about 90 feet in diameter, the BARREL balloons are much smaller than standard football stadium-sized scientific balloons. This is the fourth campaign for the BARREL mission. BARREL is led by Dartmouth College in Hanover, New Hampshire. The undergraduate student instrument team is led by the University of Houston and funded by the Undergraduate Student Instrument Project out of NASA’s Wallops Flight Facility. For more information on NASA’s scientific balloon program, visit: <a href="http://www.nasa.gov/scientificballoons" rel="nofollow">www.nasa.gov/scientificballoons</a>. Image credit: NASA/University of Houston/Edgar Bering <b><a href="http://www.nasa.gov/audience/formedia/features/MP_Photo_Guidelines.html" rel="nofollow">NASA image use policy.</a></b> <b><a href="http://www.nasa.gov/centers/goddard/home/index.html" rel="nofollow">NASA Goddard Space Flight Center</a></b> enables NASA’s mission through four scientific endeavors: Earth Science, Heliophysics, Solar System Exploration, and Astrophysics. Goddard plays a leading role in NASA’s accomplishments by contributing compelling scientific knowledge to advance the Agency’s mission. <b>Follow us on <a href="http://twitter.com/NASAGoddardPix" rel="nofollow">Twitter</a></b> <b>Like us on <a href="http://www.facebook.com/pages/Greenbelt-MD/NASA-Goddard/395013845897?ref=tsd" rel="nofollow">Facebook</a></b> <b>Find us on <a href="http://instagrid.me/nasagoddard/?vm=grid" rel="nofollow">Instagram</a></b>
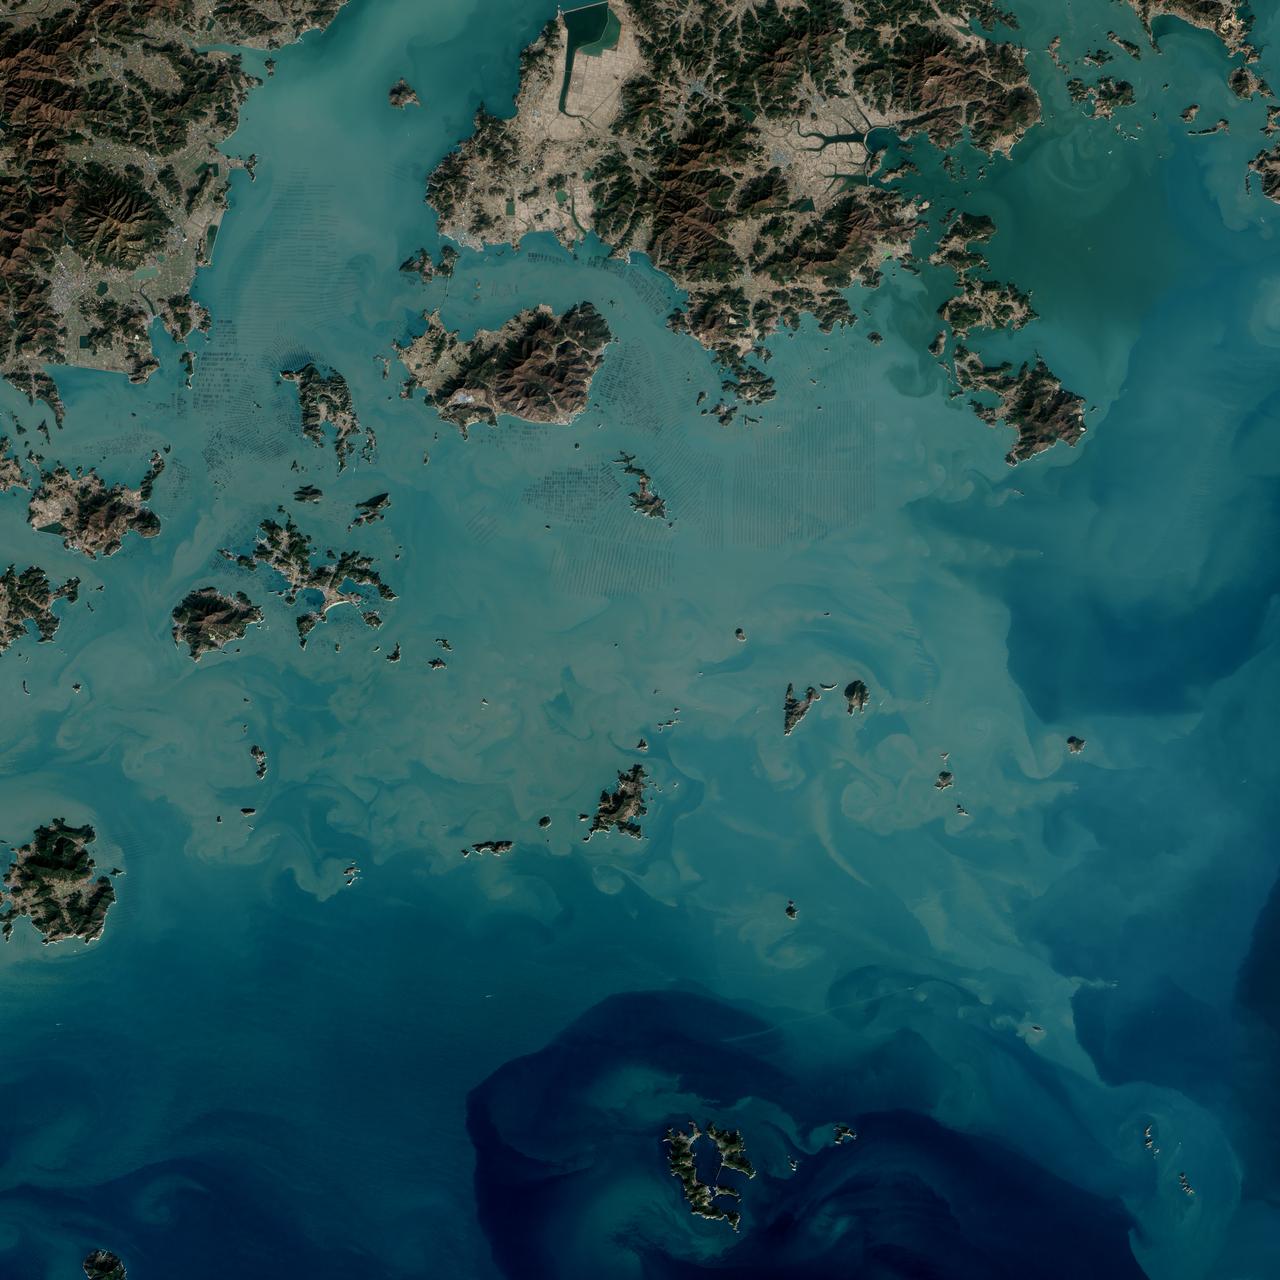
The dark squares that make up the checkerboard pattern in this image are fields of a sort—fields of seaweed. Along the south coast of South Korea, seaweed is often grown on ropes, which are held near the surface with buoys. This technique ensures that the seaweed stays close enough to the surface to get enough light during high tide but doesn’t scrape against the bottom during low tide. The Operational Land Imager (OLI) on Landsat 8 acquired this image of seaweed cultivation in the shallow waters around Sisan Island on January 31, 2014. Home to a thriving aquaculture industry, the south coast of South Korea produces about 90 percent of the country’s seaweed crop. The waters around Sisan are not the only place where aquaculture is common. View the large image to see how ubiquitous seaweed aquaculture is along the coast in Jeollanam-do, the southernmost province on the Korean peninsula. Two main types of seaweed are cultivated in South Korea: Undaria (known as miyeok in Korean, wakame in Japanese) and Pyropia (gim in Korean, nori in Japanese). Both types are used generously in traditional Korean, Japanese, and Chinese food. Since 1970, farmed seaweed production has increased by approximately 8 percent per year. Today, about 90 percent of all the seaweed that humans consume globally is farmed. That may be good for the environment. In comparison to other types of food production, seaweed farming has a light environmental footprint because it does not require fresh water or fertilizer. NASA Earth Observatory image by Jesse Allen, using Landsat data from the U.S. Geological Survey. Caption by Adam Voiland. Credit: <b><a href="http://www.earthobservatory.nasa.gov/" rel="nofollow"> NASA Earth Observatory</a></b> <b><a href="http://www.nasa.gov/audience/formedia/features/MP_Photo_Guidelines.html" rel="nofollow">NASA image use policy.</a></b> <b><a href="http://www.nasa.gov/centers/goddard/home/index.html" rel="nofollow">NASA Goddard Space Flight Center</a></b> enables NASA’s mission through four scientific endeavors: Earth Science, Heliophysics, Solar System Exploration, and Astrophysics. Goddard plays a leading role in NASA’s accomplishments by contributing compelling scientific knowledge to advance the Agency’s mission. <b>Follow us on <a href="http://twitter.com/NASAGoddardPix" rel="nofollow">Twitter</a></b> <b>Like us on <a href="http://www.facebook.com/pages/Greenbelt-MD/NASA-Goddard/395013845897?ref=tsd" rel="nofollow">Facebook</a></b> <b>Find us on <a href="http://instagrid.me/nasagoddard/?vm=grid" rel="nofollow">Instagram</a></b>
A member of the BARREL team prepares a payload for launch from Esrange Space Center on Aug. 29, 2016. Throughout August 2016, the BARREL team was at Esrange Space Center near Kiruna, Sweden, launching a series of six scientific payloads on miniature scientific balloons. The NASA-funded BARREL – which stands for Balloon Array for Radiation-belt Relativistic Electron Losses – primarily measures X-rays in Earth’s atmosphere near the North and South Poles. These X-rays are produced by electrons raining down into the atmosphere from two giant swaths of radiation that surround Earth, called the Van Allen belts. Learning about the radiation near Earth helps us to better protect our satellites. Several of the BARREL balloons also carried instruments built by undergraduate students to measure the total electron content of Earth’s ionosphere, as well as the low-frequency electromagnetic waves that help to scatter electrons into Earth’s atmosphere. Though about 90 feet in diameter, the BARREL balloons are much smaller than standard football stadium-sized scientific balloons. This is the fourth campaign for the BARREL mission. BARREL is led by Dartmouth College in Hanover, New Hampshire. The undergraduate student instrument team is led by the University of Houston and funded by the Undergraduate Student Instrument Project out of NASA’s Wallops Flight Facility. For more information on NASA’s scientific balloon program, visit: <a href="http://www.nasa.gov/scientificballoons" rel="nofollow">www.nasa.gov/scientificballoons</a>. Credit: NASA/Dartmouth/Alexa Halford <b><a href="http://www.nasa.gov/audience/formedia/features/MP_Photo_Guidelines.html" rel="nofollow">NASA image use policy.</a></b> <b><a href="http://www.nasa.gov/centers/goddard/home/index.html" rel="nofollow">NASA Goddard Space Flight Center</a></b> enables NASA’s mission through four scientific endeavors: Earth Science, Heliophysics, Solar System Exploration, and Astrophysics. Goddard plays a leading role in NASA’s accomplishments by contributing compelling scientific knowledge to advance the Agency’s mission. <b>Follow us on <a href="http://twitter.com/NASAGoddardPix" rel="nofollow">Twitter</a></b> <b>Like us on <a href="http://www.facebook.com/pages/Greenbelt-MD/NASA-Goddard/395013845897?ref=tsd" rel="nofollow">Facebook</a></b> <b>Find us on <a href="http://instagrid.me/nasagoddard/?vm=grid" rel="nofollow">Instagram</a></b>
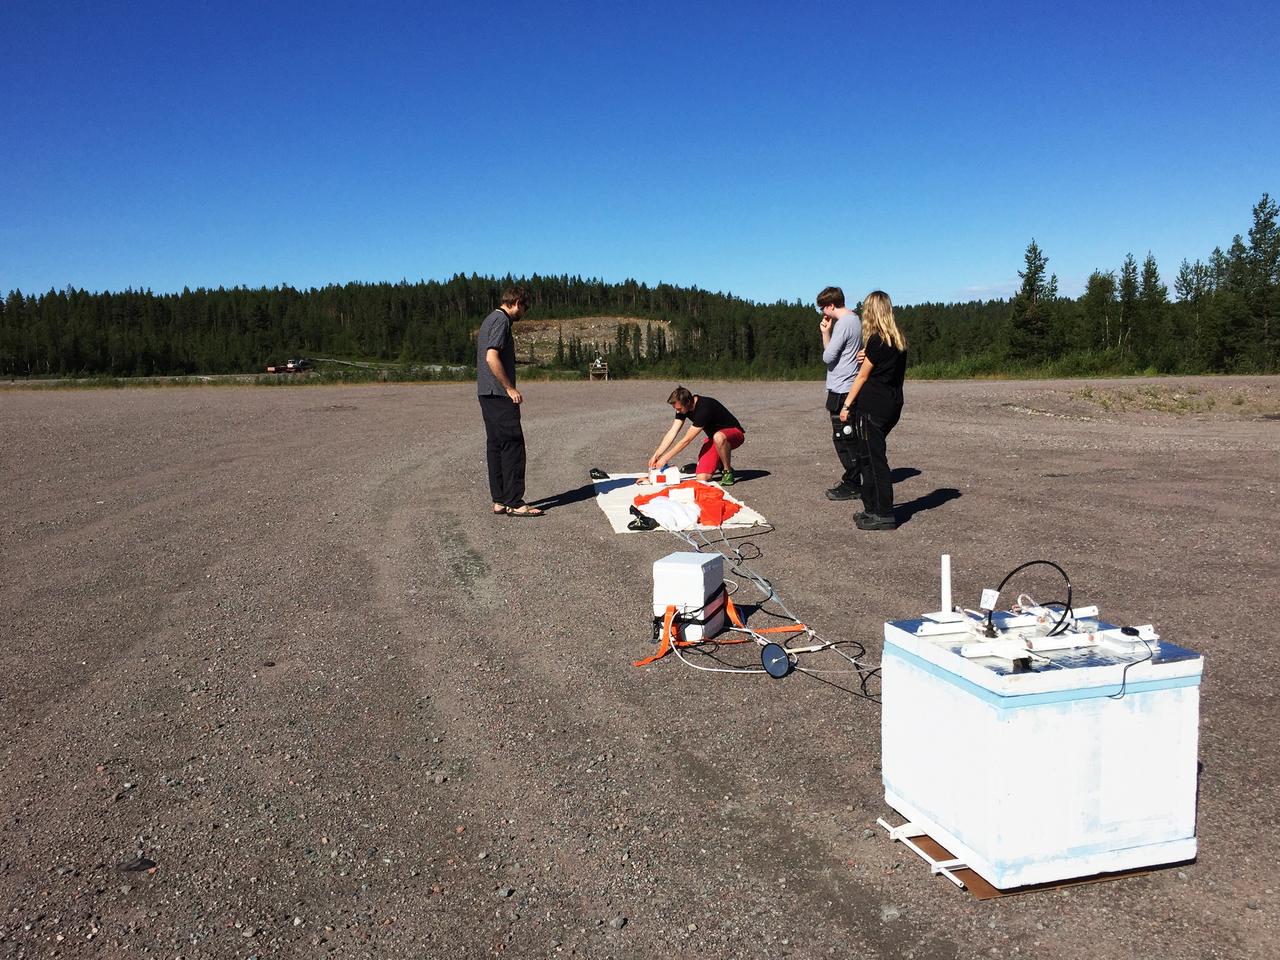
Prior to launch, the BARREL team works on the payload from the launch pad at Esrange Space Center near Kiruna, Sweden. The BARREL team is at Esrange Space Center launching a series of six scientific payloads on miniature scientific balloons. The NASA-funded BARREL – which stands for Balloon Array for Radiation-belt Relativistic Electron Losses – primarily measures X-rays in Earth’s atmosphere near the North and South Poles. These X-rays are produced by electrons raining down into the atmosphere from two giant swaths of radiation that surround Earth, called the Van Allen belts. Learning about the radiation near Earth helps us to better protect our satellites. Several of the BARREL balloons also carry instruments built by undergraduate students to measure the total electron content of Earth’s ionosphere, as well as the low-frequency electromagnetic waves that help to scatter electrons into Earth’s atmosphere. Though about 90 feet in diameter, the BARREL balloons are much smaller than standard football stadium-sized scientific balloons. This is the fourth campaign for the BARREL mission. BARREL is led by Dartmouth College in Hanover, New Hampshire. The undergraduate student instrument team is led by the University of Houston and funded by the Undergraduate Student Instrument Project out of NASA’s Wallops Flight Facility. For more information on NASA’s scientific balloon program, visit: <a href="http://www.nasa.gov/scientificballoons" rel="nofollow">www.nasa.gov/scientificballoons</a>. Image credit: NASA/Dartmouth/Robyn Millan <b><a href="http://www.nasa.gov/audience/formedia/features/MP_Photo_Guidelines.html" rel="nofollow">NASA image use policy.</a></b> <b><a href="http://www.nasa.gov/centers/goddard/home/index.html" rel="nofollow">NASA Goddard Space Flight Center</a></b> enables NASA’s mission through four scientific endeavors: Earth Science, Heliophysics, Solar System Exploration, and Astrophysics. Goddard plays a leading role in NASA’s accomplishments by contributing compelling scientific knowledge to advance the Agency’s mission. <b>Follow us on <a href="http://twitter.com/NASAGoddardPix" rel="nofollow">Twitter</a></b> <b>Like us on <a href="http://www.facebook.com/pages/Greenbelt-MD/NASA-Goddard/395013845897?ref=tsd" rel="nofollow">Facebook</a></b> <b>Find us on <a href="http://instagrid.me/nasagoddard/?vm=grid" rel="nofollow">Instagram</a></b>
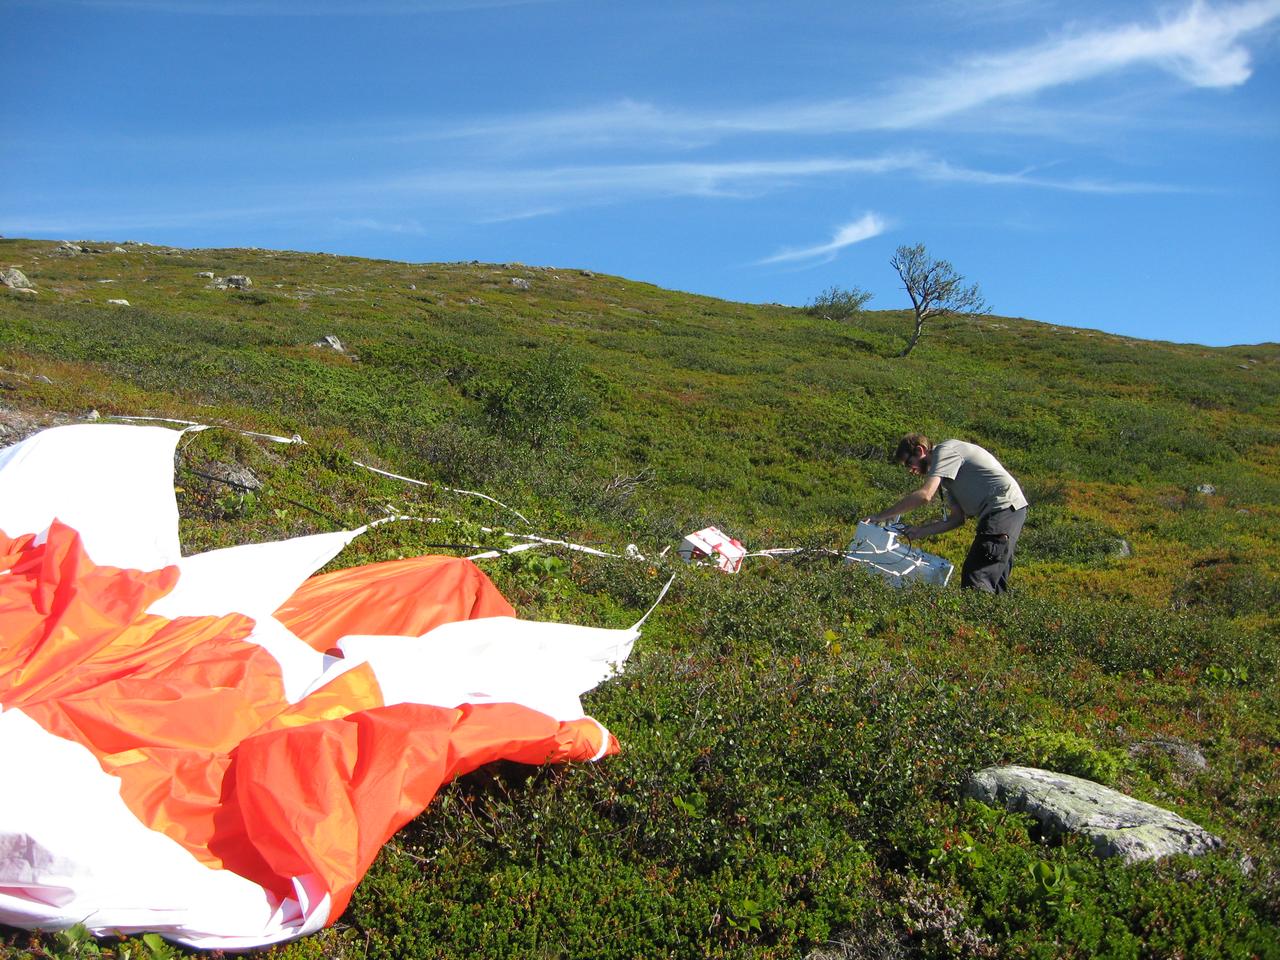
A BARREL team member recovers the second payload after it landed. The BARREL team is at Esrange Space Center near Kiruna, Sweden, launching a series of six scientific payloads on miniature scientific balloons. The NASA-funded BARREL – which stands for Balloon Array for Radiation-belt Relativistic Electron Losses – primarily measures X-rays in Earth’s atmosphere near the North and South Poles. These X-rays are produced by electrons raining down into the atmosphere from two giant swaths of radiation that surround Earth, called the Van Allen belts. Learning about the radiation near Earth helps us to better protect our satellites. Several of the BARREL balloons also carry instruments built by undergraduate students to measure the total electron content of Earth’s ionosphere, as well as the low-frequency electromagnetic waves that help to scatter electrons into Earth’s atmosphere. Though about 90 feet in diameter, the BARREL balloons are much smaller than standard football stadium-sized scientific balloons. This is the fourth campaign for the BARREL mission. BARREL is led by Dartmouth College in Hanover, New Hampshire. The undergraduate student instrument team is led by the University of Houston and funded by the Undergraduate Student Instrument Project out of NASA’s Wallops Flight Facility. For more information on NASA’s scientific balloon program, visit: <a href="http://www.nasa.gov/scientificballoons" rel="nofollow">www.nasa.gov/scientificballoons</a>. Image credit: NASA/Montana State University/Arlo Johnson <b><a href="http://www.nasa.gov/audience/formedia/features/MP_Photo_Guidelines.html" rel="nofollow">NASA image use policy.</a></b> <b><a href="http://www.nasa.gov/centers/goddard/home/index.html" rel="nofollow">NASA Goddard Space Flight Center</a></b> enables NASA’s mission through four scientific endeavors: Earth Science, Heliophysics, Solar System Exploration, and Astrophysics. Goddard plays a leading role in NASA’s accomplishments by contributing compelling scientific knowledge to advance the Agency’s mission. <b>Follow us on <a href="http://twitter.com/NASAGoddardPix" rel="nofollow">Twitter</a></b> <b>Like us on <a href="http://www.facebook.com/pages/Greenbelt-MD/NASA-Goddard/395013845897?ref=tsd" rel="nofollow">Facebook</a></b> <b>Find us on <a href="http://instagrid.me/nasagoddard/?vm=grid" rel="nofollow">Instagram</a></b>
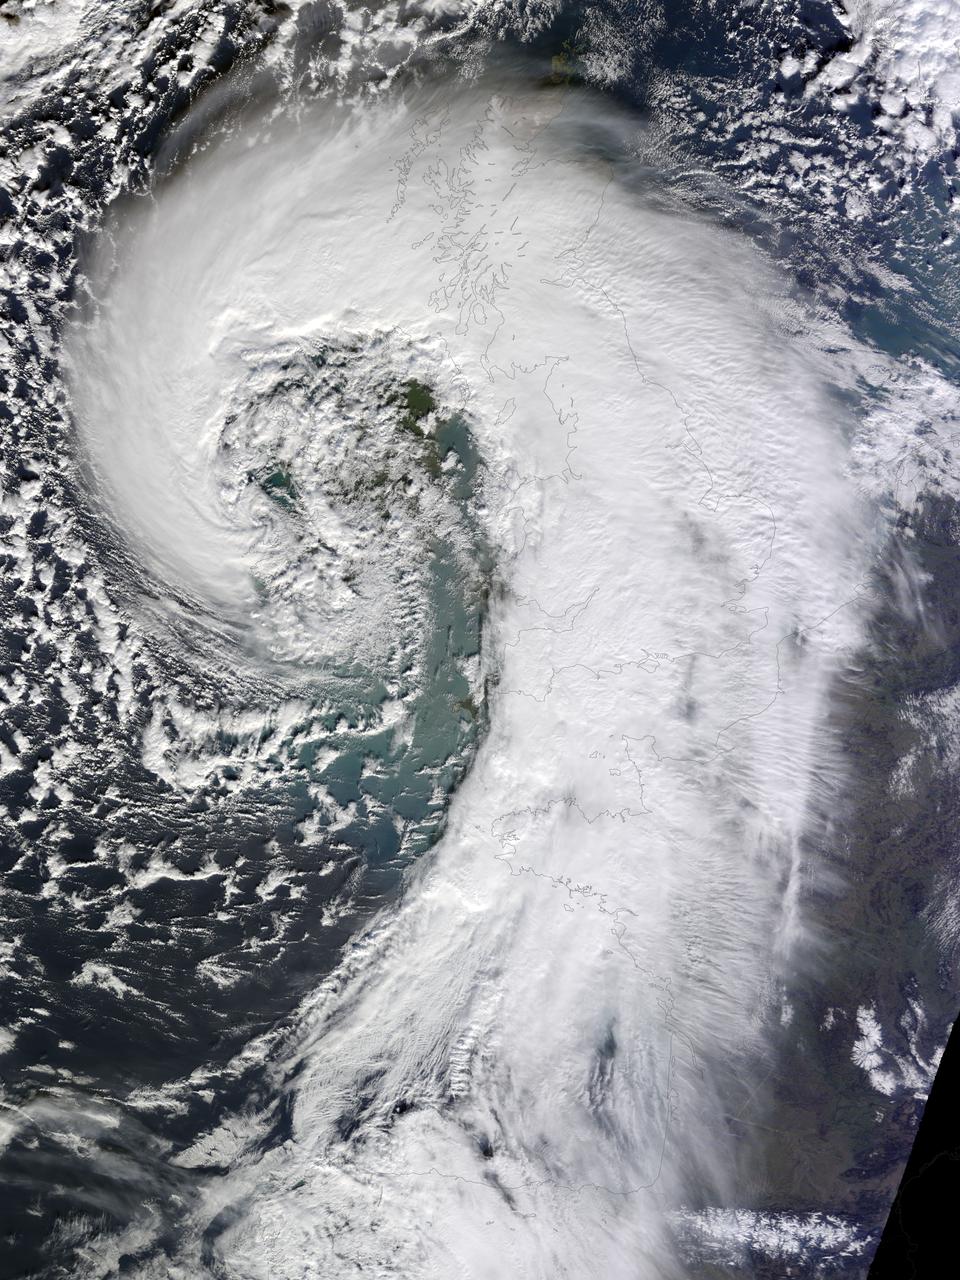
Soggy winters are not unusual in the United Kingdom, but this winter has been in a category of its own. UK Met Office meteorologists had just declared January 2014 the wettest month on record for parts of southern Britain when another series of storms swept across the area in early February. The Moderate Resolution Imaging Spectroradiometer (MODIS) on NASA’s Terra satellite captured this image of an extratropical cyclone bearing down on the United Kingdom on February 12, 2014. Mature extratropical cyclones often feature comma-shaped cloud patterns that are the product of “conveyor belt” circulation. While heavy precipitation is often present near the low-pressure head of the comma, a slot of dry air usually trails the west side of the tail. The storm brought the United Kingdom yet another round of heavy rain, as well as winds that exceeded 160 kilometers (100 miles) per hour. It snarled traffic, disrupted train service, and caused power outages for more than 700,000 people. The also exacerbated severe flooding in southern England. More than 5,800 homes have flooded since early December, according to media reports. Authorities have deployed thousands of soldiers to towns and cities in southern England to help with flood recovery. Meanwhile, the Met Office was forecasting more of the same. They warned that another system bearing heavy rain and winds was lining up to push into the United Kingdom from the southeast on Friday morning. NASA Earth Observatory image by Jesse Allen, using data from the Land Atmosphere Near real-time Capability for EOS (LANCE). Caption by Adam Voiland. More info: <a href="http://earthobservatory.nasa.gov/NaturalHazards/view.php?id=83127" rel="nofollow">earthobservatory.nasa.gov/NaturalHazards/view.php?id=83127</a> Instrument: Terra - MODIS Credit: <b><a href="http://www.earthobservatory.nasa.gov/" rel="nofollow"> NASA Earth Observatory</a></b> <b><a href="http://www.nasa.gov/audience/formedia/features/MP_Photo_Guidelines.html" rel="nofollow">NASA image use policy.</a></b> <b><a href="http://www.nasa.gov/centers/goddard/home/index.html" rel="nofollow">NASA Goddard Space Flight Center</a></b> enables NASA’s mission through four scientific endeavors: Earth Science, Heliophysics, Solar System Exploration, and Astrophysics. Goddard plays a leading role in NASA’s accomplishments by contributing compelling scientific knowledge to advance the Agency’s mission. <b>Follow us on <a href="http://twitter.com/NASAGoddardPix" rel="nofollow">Twitter</a></b> <b>Like us on <a href="http://www.facebook.com/pages/Greenbelt-MD/NASA-Goddard/395013845897?ref=tsd" rel="nofollow">Facebook</a></b> <b>Find us on <a href="http://instagrid.me/nasagoddard/?vm=grid" rel="nofollow">Instagram</a></b>

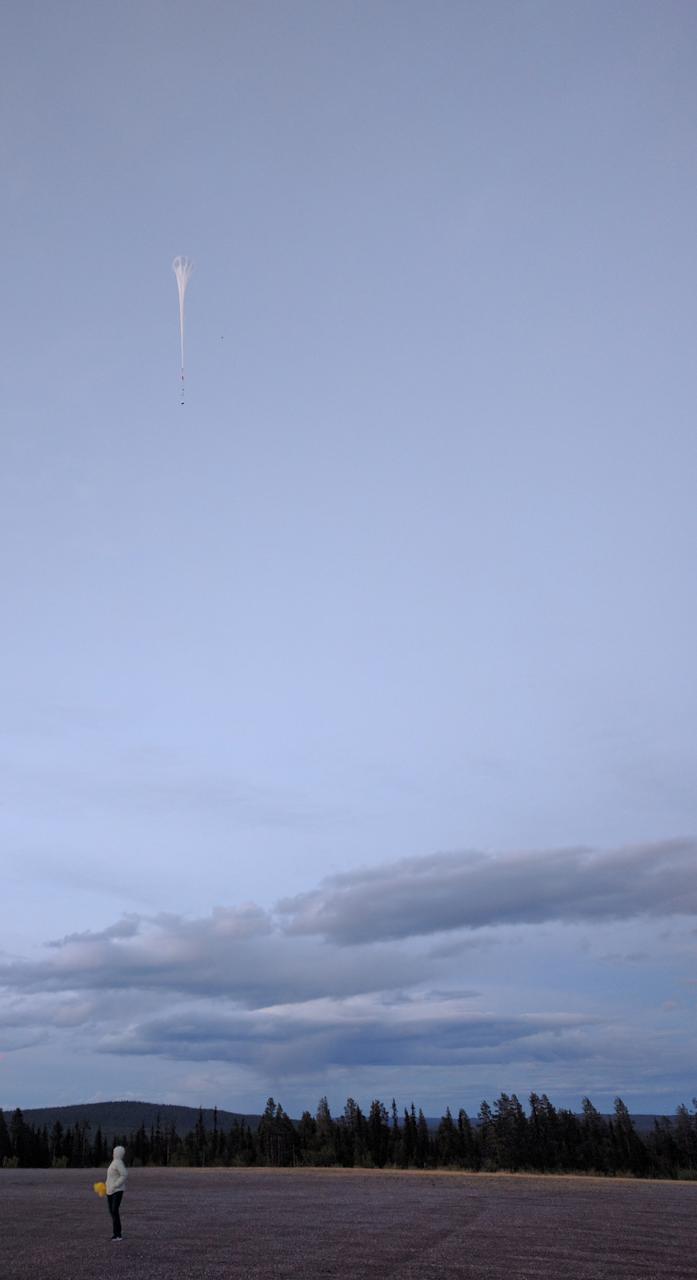
The third BARREL balloon floats towards the stratosphere on Aug. 21, 2016. This payload flew for nearly 30 hours, measuring X-rays in Earth’s atmosphere. The BARREL team is at Esrange Space Center near Kiruna, Sweden, launching a series of six scientific payloads on miniature scientific balloons. The NASA-funded BARREL – which stands for Balloon Array for Radiation-belt Relativistic Electron Losses – primarily measures X-rays in Earth’s atmosphere near the North and South Poles. These X-rays are produced by electrons raining down into the atmosphere from two giant swaths of radiation that surround Earth, called the Van Allen belts. Learning about the radiation near Earth helps us to better protect our satellites. Several of the BARREL balloons also carry instruments built by undergraduate students to measure the total electron content of Earth’s ionosphere, as well as the low-frequency electromagnetic waves that help to scatter electrons into Earth’s atmosphere. Though about 90 feet in diameter, the BARREL balloons are much smaller than standard football stadium-sized scientific balloons. This is the fourth campaign for the BARREL mission. BARREL is led by Dartmouth College in Hanover, New Hampshire. The undergraduate student instrument team is led by the University of Houston and funded by the Undergraduate Student Instrument Project out of NASA’s Wallops Flight Facility. For more information on NASA’s scientific balloon program, visit: <a href="http://www.nasa.gov/scientificballoons" rel="nofollow">www.nasa.gov/scientificballoons</a>. Credit: NASA/University of Houston/Michael Greer <b><a href="http://www.nasa.gov/audience/formedia/features/MP_Photo_Guidelines.html" rel="nofollow">NASA image use policy.</a></b> <b><a href="http://www.nasa.gov/centers/goddard/home/index.html" rel="nofollow">NASA Goddard Space Flight Center</a></b> enables NASA’s mission through four scientific endeavors: Earth Science, Heliophysics, Solar System Exploration, and Astrophysics. Goddard plays a leading role in NASA’s accomplishments by contributing compelling scientific knowledge to advance the Agency’s mission. <b>Follow us on <a href="http://twitter.com/NASAGoddardPix" rel="nofollow">Twitter</a></b> <b>Like us on <a href="http://www.facebook.com/pages/Greenbelt-MD/NASA-Goddard/395013845897?ref=tsd" rel="nofollow">Facebook</a></b> <b>Find us on <a href="http://instagrid.me/nasagoddard/?vm=grid" rel="nofollow">Instagram</a></b>
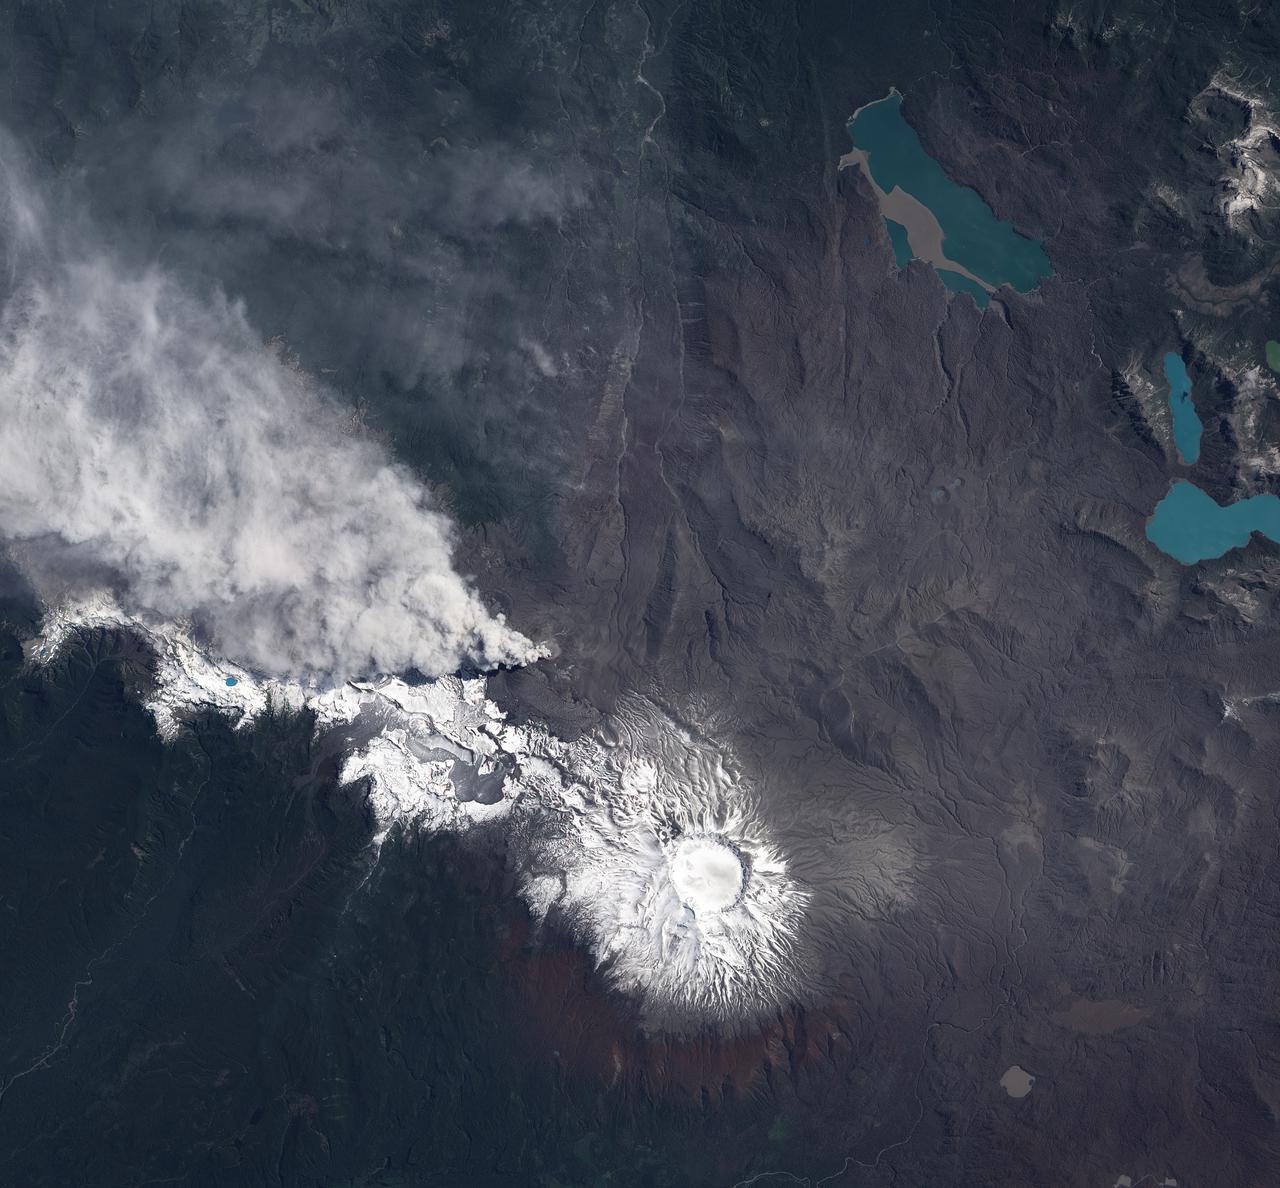
NASA image acquired December 23, 2011 In early June 2011, Chile’s Puyehue-Cordón Caulle Volcano erupted explosively, sending volcanic ash around the Southern Hemisphere. In late December 2011, activity at the volcano had calmed, but volcanic ash and steam continued to pour through the fissure that opened several months earlier. The Advanced Land Imager (ALI) on NASA’s Earth Observing-1 (EO-1) satellite captured this natural-color image on December 23, 2011. The active fissure lies northwest of the Puyehue caldera, and a plume blows from the fissure toward the west and north. This image shows not just ash but also snow on the volcano surface, including the caldera. Because volcanic ash regularly coats the land surface, the pristine snow probably fell recently. In a bulletin issued December 26, 2011, Chile’s Servicio Nacional de Geología y Minería (SERNAGEOMIN) characterized the activity over the previous 24 hours as a minor eruption of low intensity. Reaching an altitude of 2,236 meters (7,336 feet), Puyehue-Cordón Caulle is a stratovolcano, a steep-sloped, conical volcano composed of layers of ash, lava, and rocks released by previous eruptions. This volcano comprises part of the largest active geothermal area in the southern Andes. NASA Earth Observatory image created by Jesse Allen, using EO-1 ALI data provided courtesy of the NASA EO-1 team. Caption by Michon Scott. Instrument: EO-1 - ALI To view more images from this event go here: <a href="http://earthobservatory.nasa.gov/NaturalHazards/event.php?id=50859" rel="nofollow">earthobservatory.nasa.gov/NaturalHazards/event.php?id=50859</a> Credit: <b><a href="http://www.earthobservatory.nasa.gov/" rel="nofollow"> NASA Earth Observatory</a></b> <b><a href="http://www.nasa.gov/audience/formedia/features/MP_Photo_Guidelines.html" rel="nofollow">NASA image use policy.</a></b> <b><a href="http://www.nasa.gov/centers/goddard/home/index.html" rel="nofollow">NASA Goddard Space Flight Center</a></b> enables NASA’s mission through four scientific endeavors: Earth Science, Heliophysics, Solar System Exploration, and Astrophysics. Goddard plays a leading role in NASA’s accomplishments by contributing compelling scientific knowledge to advance the Agency’s mission. <b>Follow us on <a href="http://twitter.com/NASA_GoddardPix" rel="nofollow">Twitter</a></b> <b>Like us on <a href="http://www.facebook.com/pages/Greenbelt-MD/NASA-Goddard/395013845897?ref=tsd" rel="nofollow">Facebook</a></b> <b>Find us on <a href="http://instagrid.me/nasagoddard/?vm=grid" rel="nofollow">Instagram</a></b>
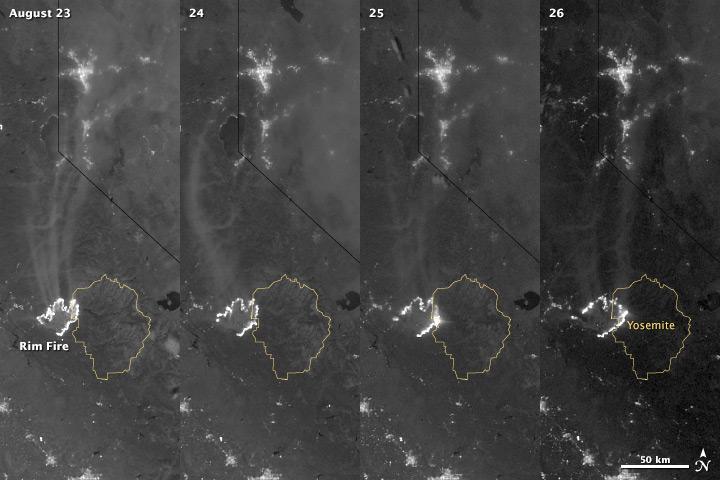
The winter of 2013 was among the driest on record for California, setting the stage for an active fire season. By August 26, the Rim Fire had made its way into the record books. At just 15 percent contained, the fire is now the 13th largest in California since records began in 1932. Apart from being large, the fire is also threatening one of the United States’ greatest natural treasures: Yosemite National Park. The Visible Infrared Imaging Radiometer Suite (VIIRS) on the Suomi NPP satellite tracked the growth of the fire between August 23 and August 26 in this series of nighttime images. The VIIRS day-night band is extremely sensitive to low light, making it possible to see the fire front from space. The brightest, most intense parts of the fire glow white, exceeding the brightness of the lights of Reno, Nevada to the north. Pale gray smoke streams north away from the fire throughout the sequence. The perimeter of the fire grows from day to day along different fronts, depending on winds and fire fighting efforts. On August 24, fire fighters focused their efforts on containing the western edge of the fire to prevent it from burning into Tuolumne City and the populated Highway 108 corridor. They also fought the eastern edge of the fire to protect Yosemite National Park. These efforts are evident in the image: Between August 23 and 24, the eastern edge of the fire held steady, and the western edge receded. The fire grew in the southeast. On the morning of August 25 fire managers reported that the fire was growing in the north and east. In the image, the most intense activity is just inside Yosemite National Park. Fire fighters reported that the Rim Fire continued to be extremely active on its eastern front on the morning of August 26, and this activity is visible in the image. By 8:00 a.m., the fire had burned 149,780 acres. The fire forced firefighters in Yosemite National Park to take measures to protect the Merced and Tuolumne Groves of Giant Sequoias, but the National Park Service reported that the trees were not in imminent danger. While parts of the park are closed, webcams show that most of the park has not been impacted. The Rim Fire started on the afternoon of August 17. It has destroyed 23 structures and threatened 4,500 other buildings. Its cause is under investigation. More details: <a href="http://1.usa.gov/18ilEAA" rel="nofollow">1.usa.gov/18ilEAA</a> NASA Earth Observatory image by Jesse Allen and Robert Simmon, using VIIRS Day Night Band data. Caption by Holli Riebeek. Instrument: Suomi NPP - VIIRS <b><a href="http://www.nasa.gov/audience/formedia/features/MP_Photo_Guidelines.html" rel="nofollow">NASA image use policy.</a></b> <b><a href="http://www.nasa.gov/centers/goddard/home/index.html" rel="nofollow">NASA Goddard Space Flight Center</a></b> enables NASA’s mission through four scientific endeavors: Earth Science, Heliophysics, Solar System Exploration, and Astrophysics. Goddard plays a leading role in NASA’s accomplishments by contributing compelling scientific knowledge to advance the Agency’s mission. <b>Follow us on <a href="http://twitter.com/NASA_GoddardPix" rel="nofollow">Twitter</a></b> <b>Like us on <a href="http://www.facebook.com/pages/Greenbelt-MD/NASA-Goddard/395013845897?ref=tsd" rel="nofollow">Facebook</a></b> <b>Find us on <a href="http://instagram.com/nasagoddard?vm=grid" rel="nofollow">Instagram</a></b>
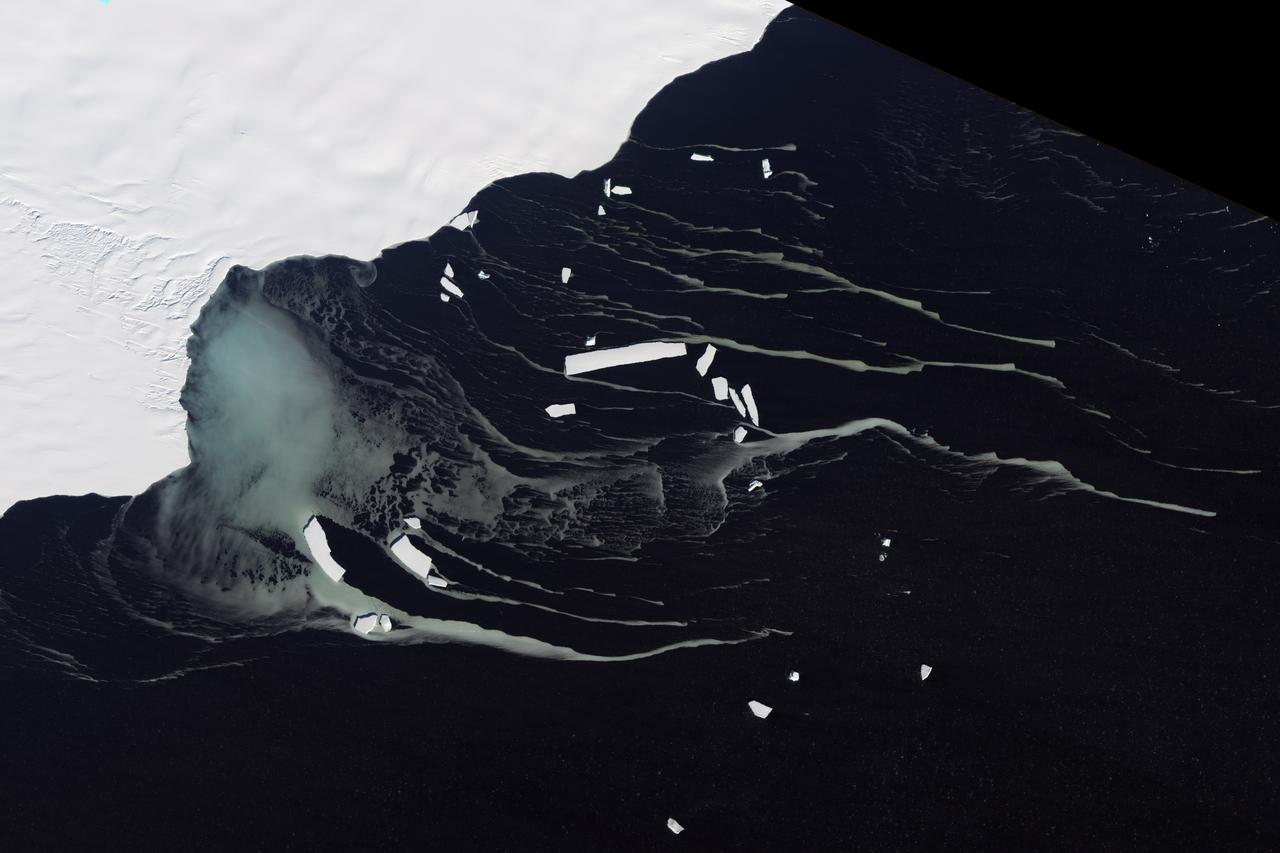
Off the northeastern edge of Antarctica’s Amery Ice Shelf lies Mackenzie Bay, which was painted with a ghostly blue-green mass in early February 2012. Similarly colored tendrils also streamed northward across the ocean, their flow sometimes interrupted by icebergs. Multiple factors might account for the ghostly shapes, including low-lying clouds or katabatic winds—downslope winds blowing toward the coast, which can freeze the water at the ocean surface. But an intriguing and perhaps more likely explanation involves processes occurring below the ice shelf. An ice shelf is a thick slab of ice often fed by glaciers attached to the coastline. The shelf floats on the ocean surface, with seawater circulating underneath. Like most ice shelves, the Amery is very thick in the upstream area near the shore. It thins significantly as it stretches northward away from the continent. Water at depth is subject to much greater pressure than water at the surface, and one effect of this intense pressure is that it effectively lowers the freezing point. So water circulating at depth beneath the Amery Ice Shelf may be slightly below the temperature at which it would normally begin to freeze. As some that water wells up along the underbelly of the shelf, the pressure is reduced and the water begins to freeze even though the temperature may not change. As it freezes, this deep-ocean water forms needle-like crystals known as frazil. The crystals are only 3 to 4 millimeters (0.12 to 0.16 inches) wide, but a sufficient concentration of frazil can change the appearance of the water. A frazil-rich plume probably accounts for the blue-green waters off the Amery Ice Shelf in the image above. Modeling of ocean circulation beneath the shelf indicates just such a plume emerging in that location. Frazil-rich water explains the plume, and wind transport of the surface water explains the long streams extending northward. As the sub-iceshelf water mixes with surface water around the Antarctic coastline, the frazil is gradually melted and the streams disappear. The Advanced Land Imager (ALI) on NASA’s Earth Observing-1 (EO-1) satellite captured this natural-color image of Mackenzie Bay and the ice shelf on February 12, 2012. NASA Earth Observatory image created by Jesse Allen and Robert Simmon, using EO-1 ALI data provided courtesy of the NASA EO-1 team. Caption by Michon Scott with information from Helen A. Fricker, Scripps Institution of Oceanography; Robert Massom, Australian Antarctic Division; Ben Galton-Fenzi, University of Tasmania, Australia; and Florence Fetterer, Walt Meier, and Ted Scambos, National Snow and Ice Data Center. Credit: <b><a href="http://www.earthobservatory.nasa.gov/" rel="nofollow"> NASA Earth Observatory</a></b> <b><a href="http://www.nasa.gov/audience/formedia/features/MP_Photo_Guidelines.html" rel="nofollow">NASA image use policy.</a></b> <b><a href="http://www.nasa.gov/centers/goddard/home/index.html" rel="nofollow">NASA Goddard Space Flight Center</a></b> enables NASA’s mission through four scientific endeavors: Earth Science, Heliophysics, Solar System Exploration, and Astrophysics. Goddard plays a leading role in NASA’s accomplishments by contributing compelling scientific knowledge to advance the Agency’s mission. <b>Follow us on <a href="http://twitter.com/NASA_GoddardPix" rel="nofollow">Twitter</a></b> <b>Like us on <a href="http://www.facebook.com/pages/Greenbelt-MD/NASA-Goddard/395013845897?ref=tsd" rel="nofollow">Facebook</a></b> <b>Find us on <a href="http://instagrid.me/nasagoddard/?vm=grid" rel="nofollow">Instagram</a></b> Instrument: EO-1 - ALI
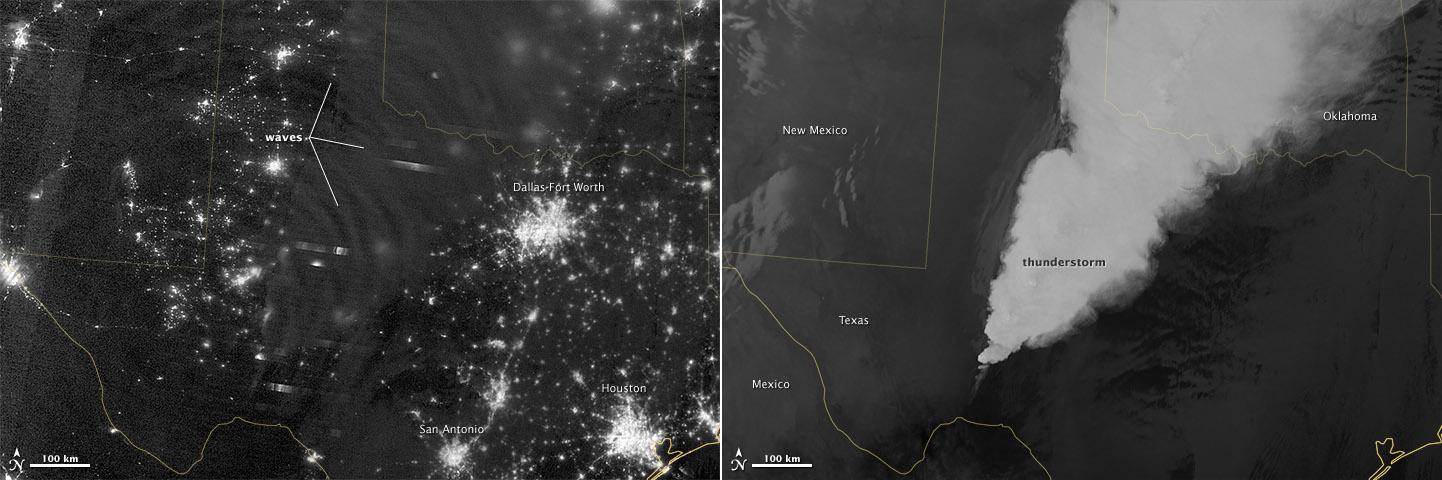
In April 2012, waves in Earth’s “airglow” spread across the nighttime skies of northern Texas like ripples in a pond. In this case, the waves were provoked by a massive thunderstorm. Airglow is a layer of nighttime light emissions caused by chemical reactions high in Earth’s atmosphere. A variety of reactions involving oxygen, sodium, ozone and nitrogen result in the production of a very faint amount of light. In fact, it’s approximately one billion times fainter than sunlight (~10-11 to 10-9 W·cm-2· sr-1). This chemiluminescence is similar to the chemical reactions that light up a glow stick or glow-in-the-dark silly putty. The “day-night band,” of the Visible Infrared Imaging Radiometer Suite (VIIRS) on the Suomi NPP satellite captured these glowing ripples in the night sky on April 15, 2012 (top image). The day-night band detects lights over a range of wavelengths from green to near-infrared and uses highly sensitive electronics to observe low light signals. (The absolute minimum signals detectable are at the levels of nightglow emission.) The lower image shows the thunderstorm as observed by a thermal infrared band on VIIRS. This thermal band, which is sensitive only to heat emissions (cold clouds appear white), is not sensitive to the subtle visible-light wave structures seen by the day-night band. Technically speaking, airglow occurs at all times. During the day it is called “dayglow,” at twilight “twilightglow,” and at night “nightglow.” There are slightly different processes taking place in each case, but in the image above the source of light is nightglow. The strongest nightglow emissions are mostly constrained to a relatively thin layer of atmosphere between 85 and 95 kilometers (53 and 60 miles) above the Earth’s surface. Little emission occurs below this layer since there’s a higher concentration of molecules, allowing for dissipation of chemical energy via collisions rather than light production. Likewise, little emission occurs above that layer because the atmospheric density is so tenuous that there are too few light-emitting reactions to yield an appreciable amount of light. Suomi NPP is in orbit around Earth at 834 kilometers (about 518 miles), well above the nightglow layer. The day-night band imagery therefore contains signals from the direction upward emission of the nightglow layer and the reflection of the downward nightglow emissions by clouds and the Earth’s surface. The presence of these nightglow waves is a graphic visualization of the usually unseen energy transfer processes that occur continuously between the lower and upper atmosphere. While nightglow is a well-known phenomenon, it’s not typically considered by Earth-viewing meteorological sensors. In fact, scientists were surprised at Suomi NPP’s ability to detect it. During the satellite’s check-out procedure, this unanticipated source of visible light was thought to indicate a problem with the sensor until scientists realized that what they were seeing was the faintest of light in the darkness of night. NASA Earth Observatory image by Jesse Allen and Robert Simmon, using VIIRS Day-Night Band data from the Suomi National Polar-orbiting Partnership. Suomi NPP is the result of a partnership between NASA, the National Oceanic and Atmospheric Administration, and the Department of Defense. Caption by Aries Keck and Steve Miller. Instrument: Suomi NPP - VIIRS Credit: <b><a href="http://www.earthobservatory.nasa.gov/" rel="nofollow"> NASA Earth Observatory</a></b> <b>Click here to view all of the <a href="http://earthobservatory.nasa.gov/Features/NightLights/" rel="nofollow"> Earth at Night 2012 images </a></b> <b>Click here to <a href="http://earthobservatory.nasa.gov/NaturalHazards/view.php?id=79817" rel="nofollow"> read more </a> about this image </b> <b><a href="http://www.nasa.gov/audience/formedia/features/MP_Photo_Guidelines.html" rel="nofollow">NASA image use policy.</a></b> <b><a href="http://www.nasa.gov/centers/goddard/home/index.html" rel="nofollow">NASA Goddard Space</a></b>
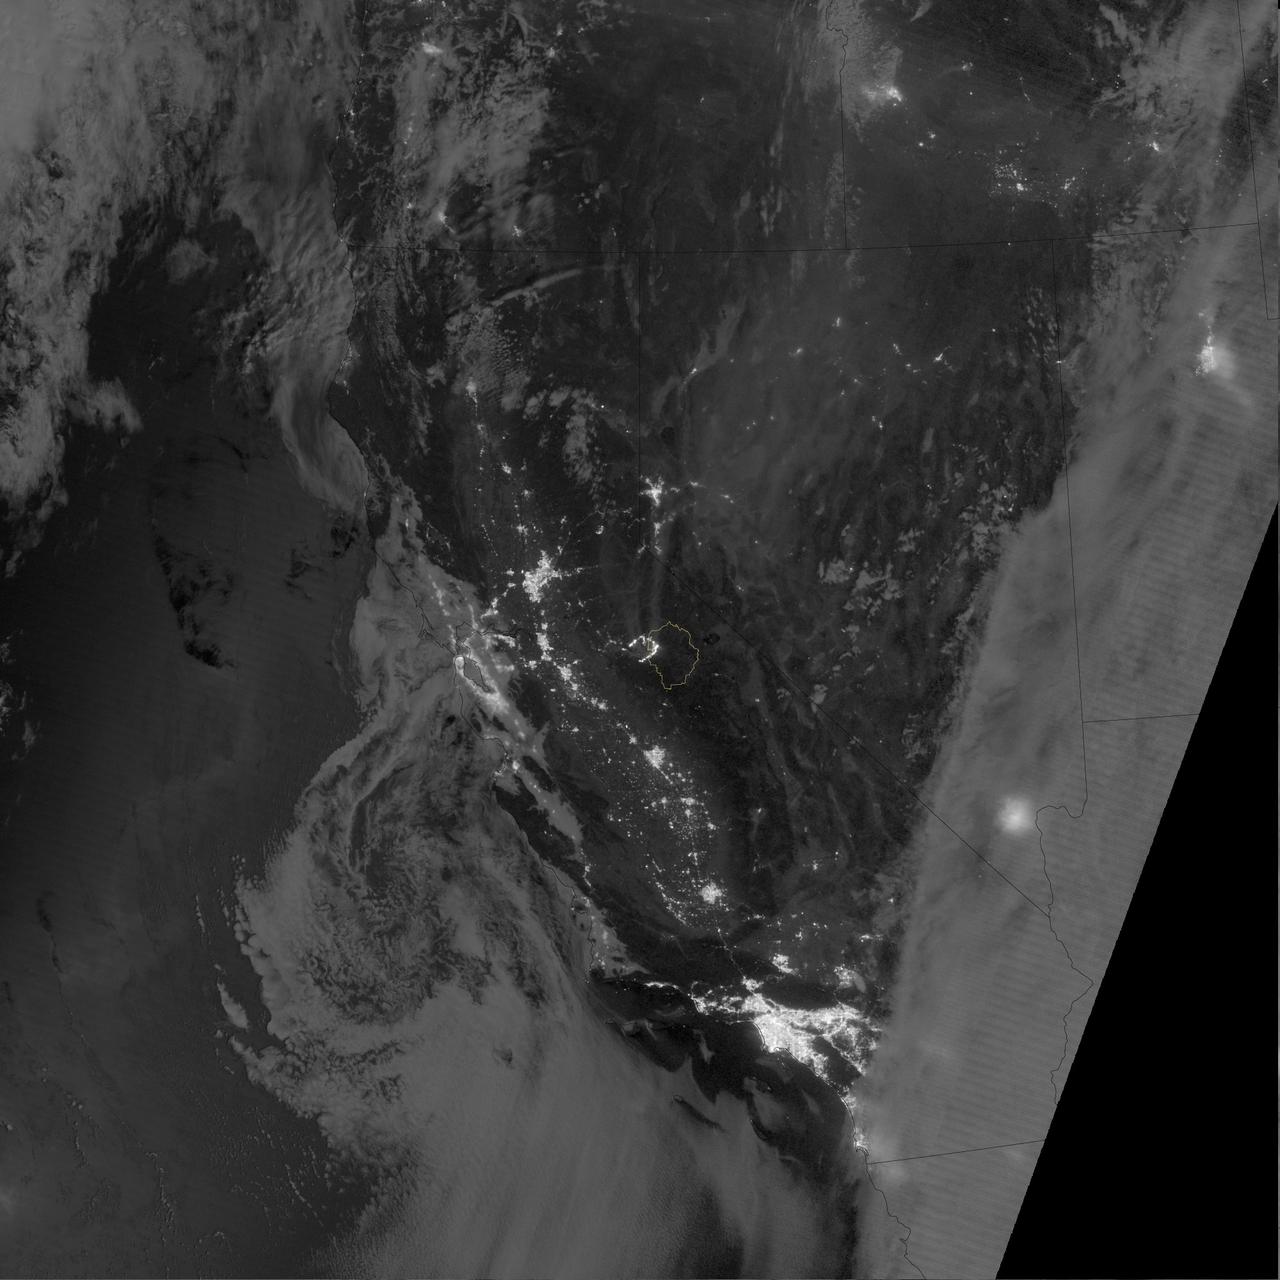
The winter of 2013 was among the driest on record for California, setting the stage for an active fire season. By August 26, the Rim Fire had made its way into the record books. At just 15 percent contained, the fire is now the 13th largest in California since records began in 1932. Apart from being large, the fire is also threatening one of the United States’ greatest natural treasures: Yosemite National Park. The Visible Infrared Imaging Radiometer Suite (VIIRS) on the Suomi NPP satellite tracked the growth of the fire between August 23 and August 26 in a series of nighttime images. The VIIRS day-night band is extremely sensitive to low light, making it possible to see the fire front from space. The brightest, most intense parts of the fire glow white, exceeding the brightness of the lights of Reno, Nevada to the north. Pale gray smoke streams north away from the fire throughout the sequence. The perimeter of the fire grows from day to day along different fronts, depending on winds and fire fighting efforts. On August 24, fire fighters focused their efforts on containing the western edge of the fire to prevent it from burning into Tuolumne City and the populated Highway 108 corridor. They also fought the eastern edge of the fire to protect Yosemite National Park. These efforts are evident in the image: Between August 23 and 24, the eastern edge of the fire held steady, and the western edge receded. The fire grew in the southeast. On the morning of August 25 fire managers reported that the fire was growing in the north and east. In the image, the most intense activity is just inside Yosemite National Park. Fire fighters reported that the Rim Fire continued to be extremely active on its eastern front on the morning of August 26, and this activity is visible in the image. By 8:00 a.m., the fire had burned 149,780 acres. The fire forced firefighters in Yosemite National Park to take measures to protect the Merced and Tuolumne Groves of Giant Sequoias, but the National Park Service reported that the trees were not in imminent danger. While parts of the park are closed, webcams show that most of the park has not been impacted. The Rim Fire started on the afternoon of August 17. It has destroyed 23 structures and threatened 4,500 other buildings. Its cause is under investigation. More details: <a href="http://1.usa.gov/18ilEAA" rel="nofollow">1.usa.gov/18ilEAA</a> NASA Earth Observatory image by Jesse Allen and Robert Simmon, using VIIRS Day Night Band data. Caption by Holli Riebeek. Instrument: Suomi NPP - VIIRS <b><a href="http://www.nasa.gov/audience/formedia/features/MP_Photo_Guidelines.html" rel="nofollow">NASA image use policy.</a></b> <b><a href="http://www.nasa.gov/centers/goddard/home/index.html" rel="nofollow">NASA Goddard Space Flight Center</a></b> enables NASA’s mission through four scientific endeavors: Earth Science, Heliophysics, Solar System Exploration, and Astrophysics. Goddard plays a leading role in NASA’s accomplishments by contributing compelling scientific knowledge to advance the Agency’s mission. <b>Follow us on <a href="http://twitter.com/NASA_GoddardPix" rel="nofollow">Twitter</a></b> <b>Like us on <a href="http://www.facebook.com/pages/Greenbelt-MD/NASA-Goddard/395013845897?ref=tsd" rel="nofollow">Facebook</a></b> <b>Find us on <a href="http://instagram.com/nasagoddard?vm=grid" rel="nofollow">Instagram</a></b>
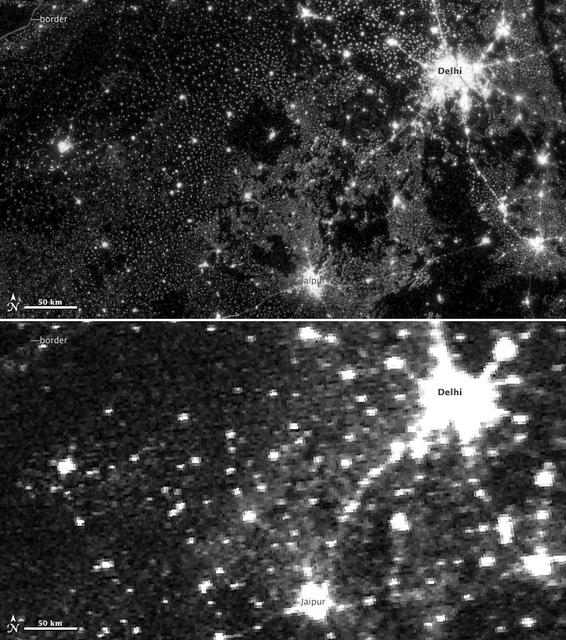
NASA image acquired November 11-12, 2012. On November 12, 2012, the Visible Infrared Imaging Radiometer Suite (VIIRS) on the Suomi NPP satellite captured the top nighttime image of city, village, and highway lights near Delhi, India. For comparison, the lower image shows the same area one night earlier, as observed by the Operational Line Scan (OLS) system on a Defense Meteorological Satellite Program (DMSP) spacecraft. Since the 1960s, the U.S. Air Force has operated DMSP in order to observe clouds and other weather variables in key wavelengths of infrared and visible light. Since 1972, the DMSP satellites have included the Operational Linescan System (OLS), which gives weather forecasters some ability to see in the dark. It has been a highly successful sensor, but it is dependent on older technology with lower resolution than most scientists would like. And for many years, DMSP data were classified. Through improved optics and “smart” sensing technology, the VIIRS “day-night band,” is ten to fifteen times better than the OLS system at resolving the relatively dim lights of human settlements and reflected moonlight. Each VIIRS pixel shows roughly 740 meters (0.46 miles) across, compared to the 3-kilometer footprint (1.86 miles) of DMSP. Beyond the resolution, the new sensor can detect dimmer light sources. And since the VIIRS measurements are fully calibrated (unlike DMSP), scientists now have the precision required to make quantitative measurements of clouds and other features. “In contrast to the Operational Line Scan system, the imagery from the new day-night band is almost like a nearsighted person putting on glasses for the first time and looking at the Earth anew,” says Steve Miller, an atmospheric scientist at Colorado State University. “VIIRS has allowed us to bring this coarse, blurry view of night lights into clearer focus. Now we can see things in such great detail and at such high precision that we’re really talking about a new kind of measurement.” Unlike a film camera that captures a photograph in one exposure, VIIRS produces an image by repeatedly scanning a scene and resolving it as millions of individual picture elements, or pixels. The day-night band goes a step further, determining on-the-fly whether to use its low, medium, or high-gain mode. If a pixel is very bright, a low-gain mode on the sensor prevents the pixel from over-saturating. If the pixel is dark, the signal will be amplified. “On a hand-held camera, there’s a nighttime setting where the shutter will stay open much longer than it would under daylight imaging conditions,” says Chris Elvidge, who leads the Earth Observation Group at NOAA’s National Geophysical Data Center. “The day-night band is similar. It increases the exposure time—the amount of time that it’s collecting photons for pixels.” NASA Earth Observatory image by Jesse Allen and Robert Simmon, using Suomi NPP VIIRS and DMSP OLS data provided courtesy of Chris Elvidge (NOAA National Geophysical Data Center). Suomi NPP is the result of a partnership between NASA, NOAA, and the Department of Defense. Caption by Mike Carlowicz. Instrument: Suomi NPP - VIIRS Credit: <b><a href="http://www.earthobservatory.nasa.gov/" rel="nofollow"> NASA Earth Observatory</a></b> <b>Click here to view all of the <a href="http://earthobservatory.nasa.gov/Features/NightLights/" rel="nofollow"> Earth at Night 2012 images </a></b> <b>Click here to <a href="http://earthobservatory.nasa.gov/NaturalHazards/view.php?id=79846" rel="nofollow"> read more </a> about this image </b> <b><a href="http://www.nasa.gov/audience/formedia/features/MP_Photo_Guidelines.html" rel="nofollow">NASA image use policy.</a></b> <b><a href="http://www.nasa.gov/centers/goddard/home/index.html" rel="nofollow">NASA Goddard Space Flight Center</a></b> enables NASA’s mission through four scientific endeavors: Earth Science, Heliophysics, Solar System Exploration, and Astrophysics. Goddard plays a leading role in NASA’s accomplishments by contributing compelling scientific
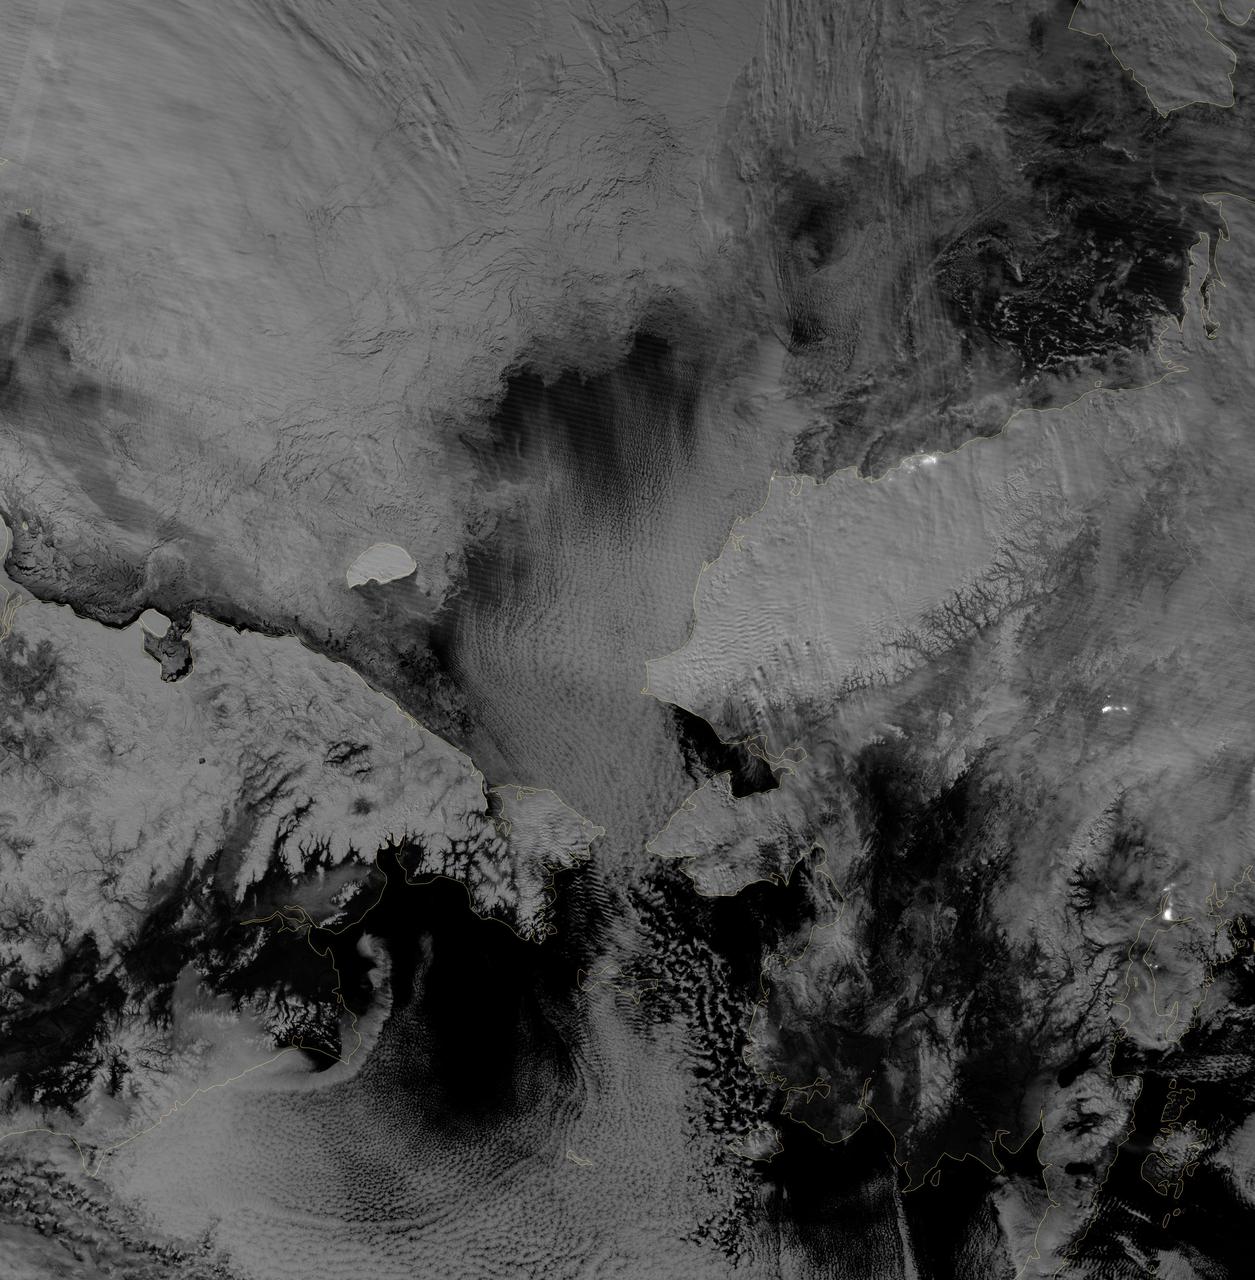
Image acquired October 30, 2012 Scientists watched the Arctic with particular interest in the summer of 2012, when Arctic sea ice set a new record low. The behavior of sea ice following such a low extent also interests scientists, but as Arctic sea ice was advancing in the autumn of 2012, so was polar darkness. Fortunately, the Visible Infrared Imaging Radiometer Suite (VIIRS) on the Suomi NPP satellite can see in the dark. The VIIRS “day-night band” detects light in a range of wavelengths from green to near-infrared and uses filtering techniques to observe signals such as gas flares, auroras, wildfires, city lights, and reflected moonlight. VIIRS acquired this nighttime view of sea ice north of Russia and Alaska on October 30, 2012. The day-night band takes advantage of moonlight, airglow (the atmosphere’s self-illumination through chemical reactions), zodiacal light (sunlight scattered by interplanetary dust), and starlight from the Milky Way. By using these dim light sources, the day-night band can detect changes in clouds, snow cover, and sea ice. The VIIRS day-night band offers a unique perspective because once polar night has descended, satellite sensors relying on visible light can no longer produce photo-like images. And although passive microwave sensors can monitor sea ice through the winter, they offer much lower resolution. Steve Miller of the Cooperative Institute for Research in the Atmosphere at Colorado State University has used the day-night band to study nighttime behavior of weather systems and sees advantages in studying the polar regions. “There’s a lot of use with these measurements as we look back at a season of record ice melt in the Arctic,” Miller says. “We can observe areas where there is ice melt and reformation, where there’s clear water and ships can pass through—especially as the ‘great darkness’ approaches with winter.” Ted Scambos of the National Snow and Ice Data Center at the University of Colorado concurs. “Things start changing rapidly in the late fall: sea ice formation and snow cover extent at the highest latitudes. This lets us see rapid-growth areas in detail.” The day-night band is also useful for following weather systems, including severe storms, which can develop and strike populous areas at night as well as day. Geostationary Operational Environmental Satellites orbit the Earth’s equator. The satellites offer uninterrupted observations of North America, but high-latitude areas such as Alaska may benefit more from polar-orbiting satellites. Miller explains, “In the high latitudes, the orbits begin to overlap considerably, which gives you a lot more passes in Alaska. If you start to look at multiple passes and stitch them together, you can get a version of a poor man’s geostationary time loop of the weather.” Day-night band imagery at high latitudes has already proven useful for tracking rapid ice movement and diagnosing Gulf of Alaska circulations. The day-night band is even useful at tracking ship movement at high latitudes. NASA Earth Observatory image by Jesse Allen and Robert Simmon, using VIIRS Day-Night Band data from the Suomi National Polar-orbiting Partnership. Suomi NPP is the result of a partnership between NASA, the National Oceanic and Atmospheric Administration, and the Department of Defense. Caption by Michon Scott. Instrument: Suomi NPP - VIIRS Credit: <b><a href="http://www.earthobservatory.nasa.gov/" rel="nofollow"> NASA Earth Observatory</a></b> <b>Click here to view all of the <a href="http://earthobservatory.nasa.gov/Features/NightLights/" rel="nofollow"> Earth at Night 2012 images </a></b> <b>Click here to <a href="http://earthobservatory.nasa.gov/NaturalHazards/view.php?id=79825" rel="nofollow"> read more </a> about this image </b> <b><a href="http://www.nasa.gov/audience/formedia/features/MP_Photo_Guidelines.html" rel="nofollow">NASA image use policy.</a></b> <b><a href="http://www.nasa.gov/centers/goddard/home/index.html" rel="nofollow">NASA Goddard Space Flight Center</a></b> enables NASA
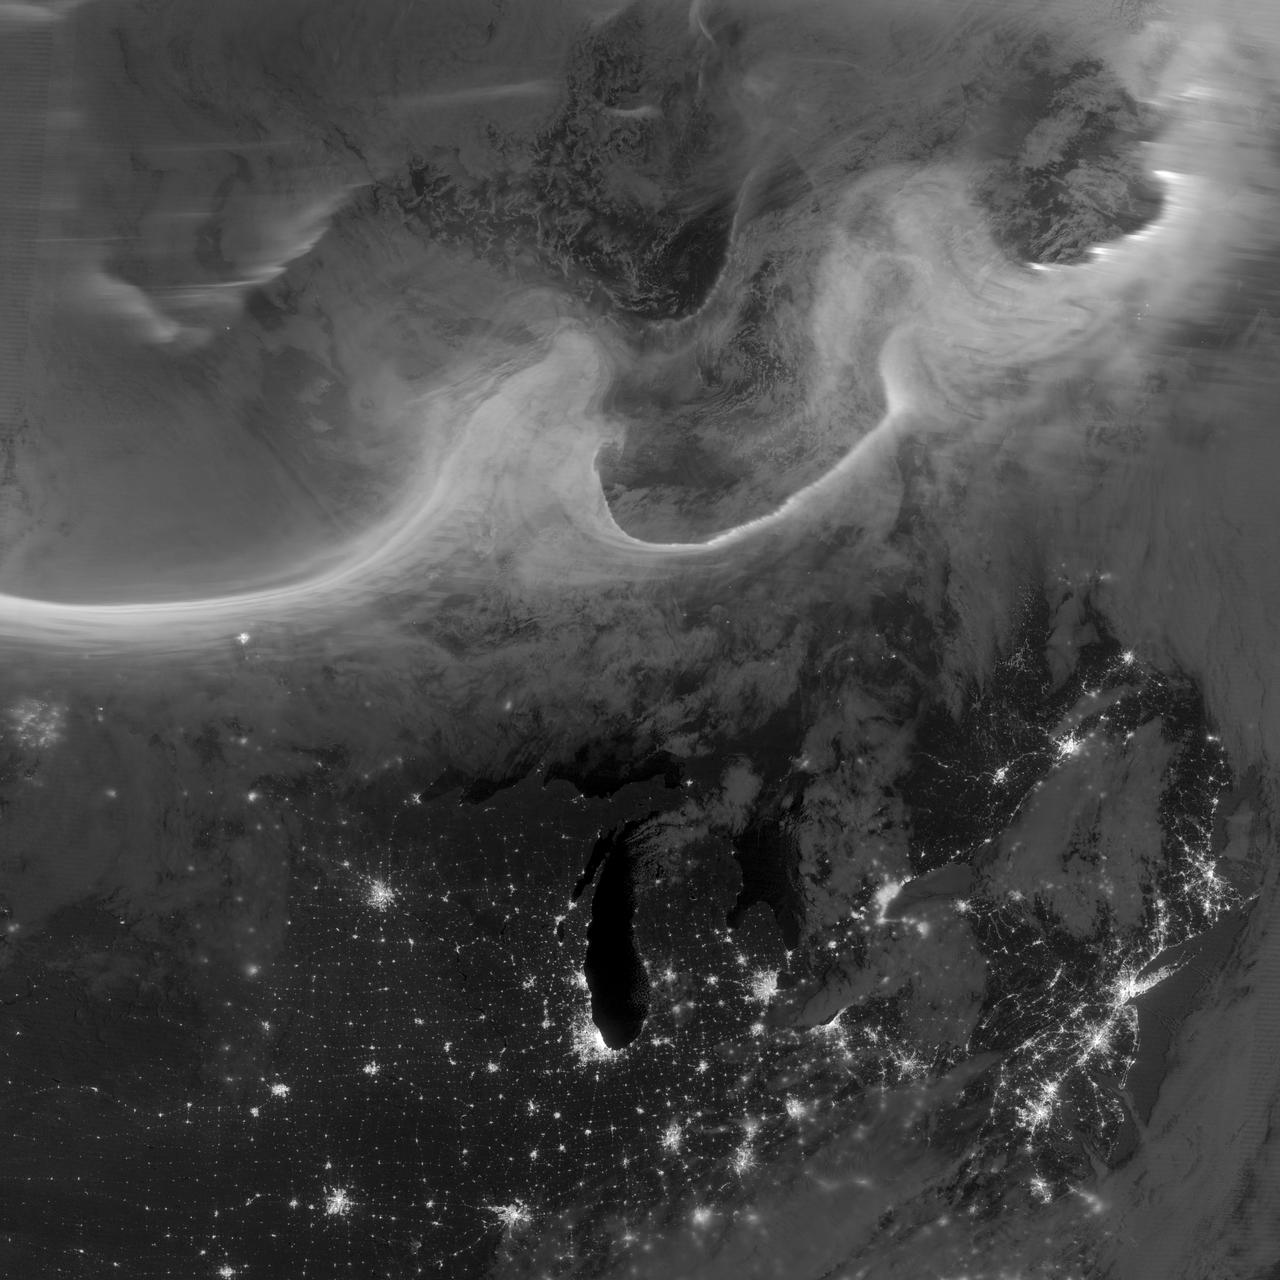
Overnight on October 4-5, 2012, a mass of energetic particles from the atmosphere of the Sun were flung out into space, a phenomenon known as a coronal mass ejection. Three days later, the storm from the Sun stirred up the magnetic field around Earth and produced gorgeous displays of northern lights. NASA satellites track such storms from their origin to their crossing of interplanetary space to their arrival in the atmosphere of Earth. Using the “day-night band” (DNB) of the Visible Infrared Imaging Radiometer Suite (VIIRS), the Suomi National Polar-orbiting Partnership (Suomi NPP) satellite acquired this view of the aurora borealis early on the morning of October 8, 2012. The northern lights stretch across Canada’s Quebec and Ontario provinces in the image, and are part of the auroral oval that expanded to middle latitudes because of a geomagnetic storm. The DNB sensor detects dim light signals such as auroras, airglow, gas flares, city lights, and reflected moonlight. In the case of the image above, the sensor detected the visible light emissions as energetic particles rained down from Earth’s magnetosphere and into the gases of the upper atmosphere. The images are similar to those collected by the Operational Linescan System flown on U.S. Defense Meteorological Satellite Program (DMSP) satellites for the past three decades. “When I first saw images like this as a graduate student, I was immediately struck by the fluid dynamic characteristics of the aurora,” said Tom Moore, a space physicist at NASA's Goddard Space Flight Center. “Viewing the aurora in this way makes it immediately clear that space weather is an interaction of fluids from the Sun with those of the Earth's upper atmosphere. The electrodynamics make for important differences between plasmas and ordinary fluids, but familiar behaviors (for example, waves and vortices) are still very apparent. It makes me wonder at the ability of apparently empty space to behave like a fluid.” Auroras typically occur when solar flares and coronal mass ejections—or even an active solar wind stream—disturb and distort the magnetosphere, the cocoon of space protected by Earth’s magnetic field. The collision of solar particles and pressure into our planet’s magnetosphere accelerates particles trapped in the space around Earth (such as in the radiation belts). Those particles are sent crashing down into Earth’s upper atmosphere—at altitudes of 100 to 400 kilometers (60 to 250 miles)—where they excite oxygen and nitrogen molecules and release photons of light. The results are rays, sheets, and curtains of dancing light in the sky. Auroras are a beautiful expression of the connection between Sun and Earth, but not all of the connections are benign. Auroras are connected to geomagnetic storms, which can distort radio communications (particularly high frequencies), disrupt electric power systems on the ground, and give slight but detectable doses of radiation to flight crews and passengers on high-latitude airplane flights and on spacecraft. The advantage of images like those from VIIRS and DMSP is resolution, according to space physicist Patrick Newell of the Johns Hopkins University Applied Physics Laboratory. “You can see very fine detail in the aurora because of the low altitude and the high resolution of the camera,” he said. Most aurora scientists prefer to use images from missions dedicated to aurora studies (such as Polar, IMAGE, and ground-based imagers), which can offer many more images of a storm (rather than one per orbit) and can allow researchers to calculate the energy moving through the atmosphere. There are no science satellites flying right now that provide such a view, though astronauts regularly photograph and film auroras from the International Space Station. NASA Earth Observatory image by Jesse Allen and Robert Simmon, using VIIRS Day-Night Band data from the Suomi National Polar-orbiting Partnership (Suomi NPP) and the University of Wisconsin's Community Satellite Processing Package. Suomi NPP is the result of a partnership between NASA, the National Oceanic and Atmospheric Administration, and the Department of Defense. Caption by Mike Carlowicz. Instrument: Suomi NPP - VIIRS Credit: <b><a href="http://www.earthobservatory.nasa.gov/" rel="nofollow"> NASA Earth Observatory</a></b> <b><a href="http://www.nasa.gov/audience/formedia/features/MP_Photo_Guidelines.html" rel="nofollow">NASA image use policy.</a></b> <b><a href="http://www.nasa.gov/centers/goddard/home/index.html" rel="nofollow">NASA Goddard Space Flight Center</a></b> enables NASA’s mission through four scientific endeavors: Earth Science, Heliophysics, Solar System Exploration, and Astrophysics. Goddard plays a leading role in NASA’s accomplishments by contributing compelling scientific knowledge to advance the Agency’s mission. <b>Follow us on <a href="http://twitter.com/NASA_GoddardPix" rel="nofollow">Twitter</a></b> <b>Like us on <a href="http://www.facebook.com/pages/Greenbelt-MD/NASA-Goddard/395013845897?ref=tsd" rel="nofollow">Facebook</a></b> <b>Find us on <a href="http://instagrid.me/nasagoddard/?vm=grid" rel="nofollow">Instagram</a></b>