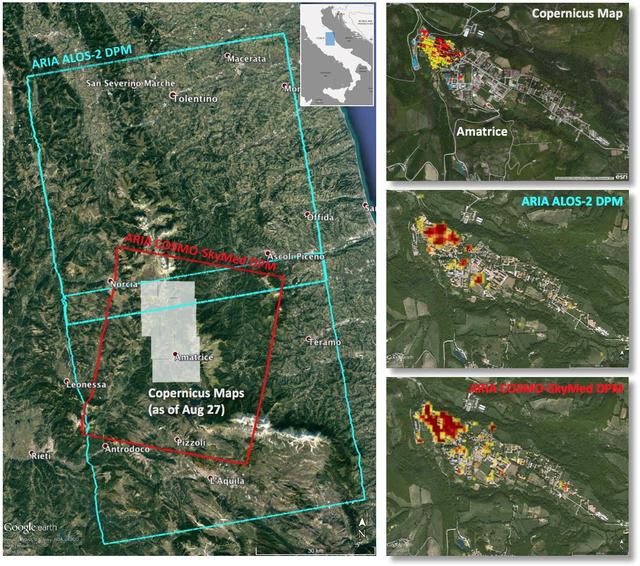
Italy earthquake. The quake has caused significant damage in the historic town of Amatrice. To assist in the disaster response efforts, scientists at NASA's Jet Propulsion Laboratory, Pasadena, California, and the California Institute of Technology in Pasadena, in collaboration with the Italian Space Agency (ASI), generated this image of the earthquake's hardest-hit region. The 40-by-75 mile (65-by-120 kilometer) Damage Proxy Map (DPM) was derived from two consecutive frames of the Japan Aerospace Exploration Agency's (JAXA's) L-band interferometric synthetic aperture radar (InSAR) data from the ALOS-2 satellite (cyan rectangles), and the 25-by-31 mile (40-by-50 kilometer) DPM was derived from InSAR data from the Agenzia Spaciale Italiana's (ASI's) X-band COSMO-SkyMed satellite (red rectangle). Both DPMs cover the historic town of Amatrice, revealing severe damage in the western side of the town (right panels). The time span of the data for the change is Jan. 27, 2016 to Aug. 24, 2016 for ALOS-2 and Aug. 20, 2016 to Aug. 28, 2016 for COSMO-SkyMed. Each pixel in the damage proxy map is about 100 feet (30 meters) across. The SAR data were processed by the Advanced Rapid Imaging and Analysis (ARIA) team at JPL and Caltech. The technique uses a prototype algorithm to rapidly detect surface changes caused by natural or human-produced damage. The assessment technique is most sensitive to destruction of the built environment. When the radar images areas with little to no destruction, its image pixels are transparent. Increased opacity of the radar image pixels reflects damage, with areas in red reflecting the heaviest damage to cities and towns. The color variations from yellow to red indicate increasingly more significant ground surface change. Preliminary validation was done by comparing the DPMs to a damage assessment map produced by the Copernicus Emergency Management Service, which is based on visual inspection of before and after high-resolution aerial imagery -- the extent indicated with gray boxes in the left panel. http://photojournal.jpl.nasa.gov/catalog/PIA20897
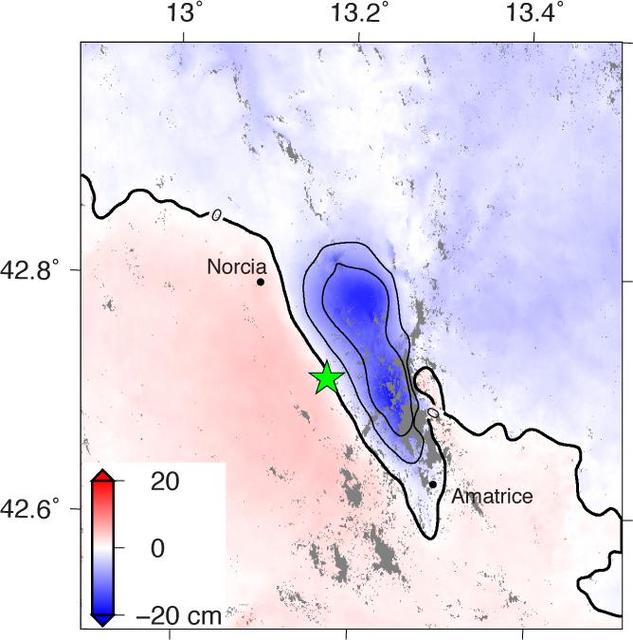
Amatrice earthquake in central Italy, which caused widespread building damage to several towns throughout the region. This earthquake was the strongest in that area since the 2009 earthquake that destroyed the city of L'Aquila. The Advanced Rapid Imaging and Analysis (ARIA) data system, a collaborative project between NASA's Jet Propulsion Laboratory, Pasadena, California, and the California Institute of Technology in Pasadena, automatically generated interferometric synthetic aperture radar images from the Copernicus Sentinel 1A satellite operated by the European Space Agency (ESA) for the European Commission to calculate a map of the deformation of Earth's surface caused by the quake. This false-color map shows the amount of permanent surface movement, as viewed by the satellite, during a 12-day interval between two Sentinel 1 images acquired on Aug. 15, 2016, and Aug. 27, 2016. The movement was caused almost entirely by the earthquake. In this map, the colors of the surface displacements are proportional to the surface motion. The red and pink tones show the areas where the land moved toward the satellite by up to 2 inches (5 centimeters). The area with various shades of blue moved away from the satellite, mostly downward, by as much as 8 inches (20 centimeters). Contours on the surface motion are 2 inches (5 centimeters) The green star shows the epicenter where the earthquake started as located by the U.S. Geological Survey National Earthquake Information Center. Black dots show town locations. Scientists use these maps to build detailed models of the fault slip at depth and associated land movements to better understand the impact on future earthquake activity. The map shows the fault or faults that moved in the earthquake is about 14 miles (22 kilometers) long between Amatrice and Norcia and slopes to the west beneath the area that moved downward. http://photojournal.jpl.nasa.gov/catalog/PIA20896
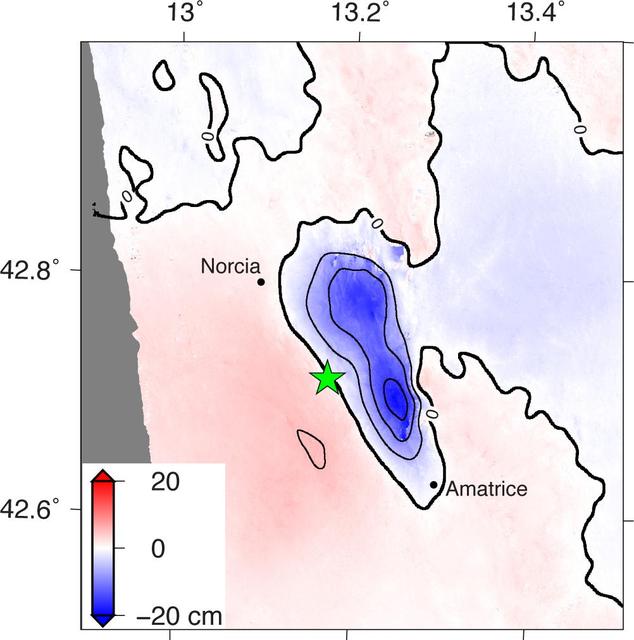
NASA and its partners are contributing observations and expertise to the ongoing response to the Aug. 23, 2016, magnitude 6.2 Amatrice earthquake in central Italy caused widespread building damage to several towns throughout the region. This earthquake was the strongest in that area since the 2009 earthquake that destroyed the city of L'Aquila. Scientists with the Advanced Rapid Imaging and Analysis project (ARIA), a collaboration between NASA's Jet Propulsion Laboratory, Pasadena, California, and the California Institute of Technology in Pasadena, analyzed interferometric synthetic aperture radar images from the PALSAR-2 instrument on the ALOS-2 satellite operated by the Japan Aerospace Exploration Agency (JAXA) to calculate a map of the deformation of Earth's surface caused by the quake. This false-color map shows the amount of permanent surface movement, as viewed by the satellite, during a seven-month interval between two ALOS-2 images acquired on Sept. 9, 2015 and Aug. 24, 2016. The movement was caused almost entirely by the earthquake. In this map, the colors of the surface displacements are proportional to the surface motion. The red and pink tones show the areas where the land moved toward the satellite by up to 2 inches (5 centimeters). The area with various shades of blue moved away from the satellite, mostly downward, by as much as 8 inches (20 centimeters). Contours on the surface motion are 2 inches (5 centimeters) The green star shows the epicenter where the earthquake started as located by the U.S. Geological Survey National Earthquake Information Center. Black dots show town locations. Scientists use these maps to build detailed models of the fault slip at depth and associated land movements to better understand the impact on future earthquake activity. The map shows the fault or faults that moved in the earthquake is about 14 miles (22 kilometers) long between Amatrice and Norcia and slopes to the west beneath the area that moved downward. The PALSAR-2 data were provided by JAXA through a science project. http://photojournal.jpl.nasa.gov/catalog/PIA20893
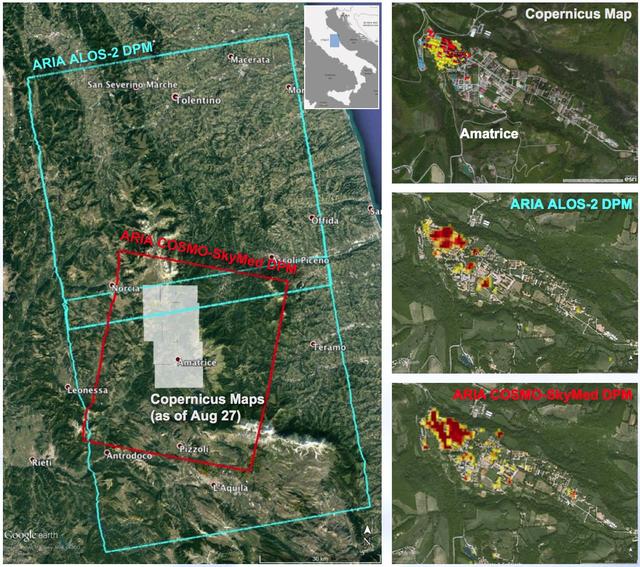
A NASA-funded program provided valuable information for responders and groups supporting the recovery efforts for the Aug. 24, 2016, magnitude 6.2 earthquake that struck central Italy. The earthquake caused significant loss of life and property damage in the town of Amatrice. To assist in the disaster response efforts, scientists at NASA's Jet Propulsion Laboratory and Caltech, both in Pasadena, California, obtained and used radar imagery of the earthquake's hardest-hit region to discriminate areas of damage from that event. The views indicate the extent of damage caused by the earthquake and subsequent aftershocks in and around Amatrice, based on changes to the ground surface detected by radar. The color variations from yellow to red indicate increasingly more significant ground surface change. The damage maps were created from data obtained before and after the earthquake by satellites belonging to the Italian Space Agency (ASI) and the Japan Aerospace Exploration Agency (JAXA). The radar-derived damage maps compare well with a damage map produced by the European Commission Copernicus Emergency Management Service based upon visual inspection of high-resolution pre-earthquake aerial photographs and post-earthquake satellite optical imagery, and provide broader geographic coverage of the earthquake's impact in the region. The X-band COSMO-SkyMed (CSK) data were provided through a research collaboration with ASI and were acquired on July 3, August 20, and August 28, 2016. The L-band ALOS/PALSAR-2 data were provided by JAXA through its science research program and were acquired on September 9, 2015, January 27, 2016, and August 24, 2016. The radar data were processed by the Advanced Rapid Imaging and Analysis (ARIA) team at JPL and Caltech. ARIA is a NASA-funded project that is building an automated system for demonstrating the ability to rapidly and reliably provide GPS and satellite data to support the local, national and international hazard monitoring and response communities. Using space-based imagery of disasters, ARIA data products can provide rapid assessments of the geographic region impacted by a disaster, as well as detailed imaging of the locations where damage occurred. Radar can "see" through clouds day and night and measure centimeter-level ground movements. NASA is partnering with the Indian Space Research Organization (ISRO) to develop the NASA ISRO Synthetic Aperture Radar (NISAR) mission that will routinely provide systematic SAR observations of Earth's land and ice-covered surfaces at least twice every 12 days, enabling greater scientific understanding of the dynamic processes that drive the Earth system and natural hazards, as well as providing actionable support for disaster response and recovery. http://photojournal.jpl.nasa.gov/catalog/PIA21091