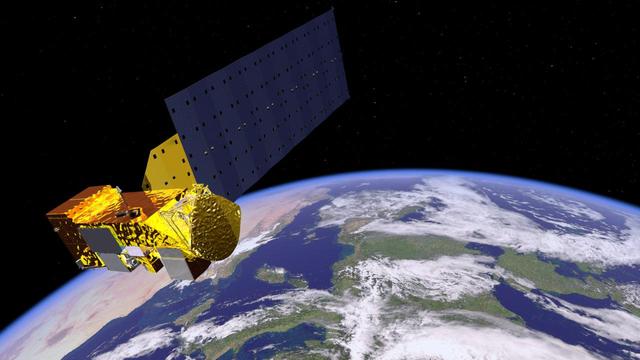
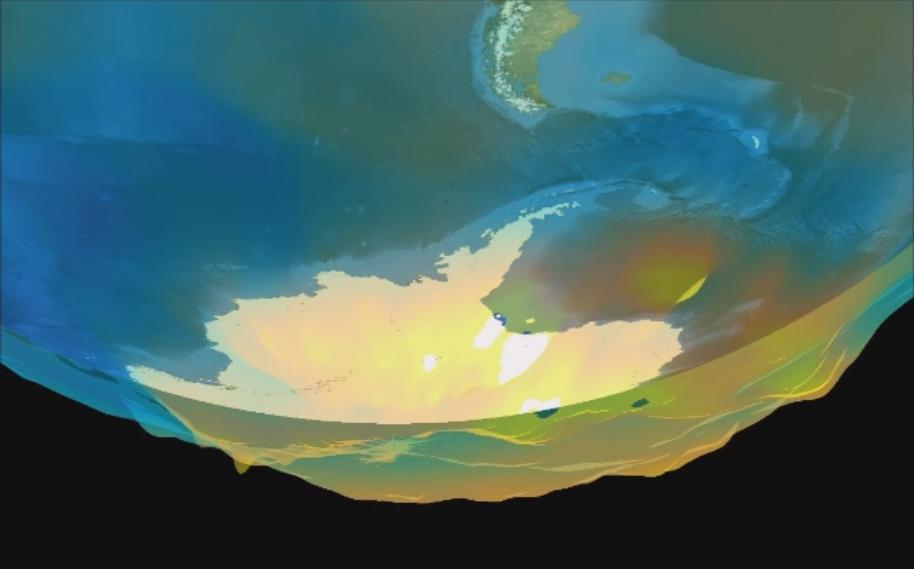
NASA Aqua satellite carries six state-of-the-art instruments in a near-polar low-Earth orbit. Aqua is seen in this artist concept orbiting Earth. The six instruments are the Atmospheric Infrared Sounder (AIRS), the Advanced Microwave Sounding Unit (AMSU-A), the Humidity Sounder for Brazil (HSB), the Advanced Microwave Scanning Radiometer for EOS (AMSR-E), the Moderate Resolution Imaging Spectroradiometer (MODIS), and Clouds and the Earth's Radiant Energy System (CERES). Each has unique characteristics and capabilities, and all six serve together to form a powerful package for Earth observations. http://photojournal.jpl.nasa.gov/catalog/PIA18156
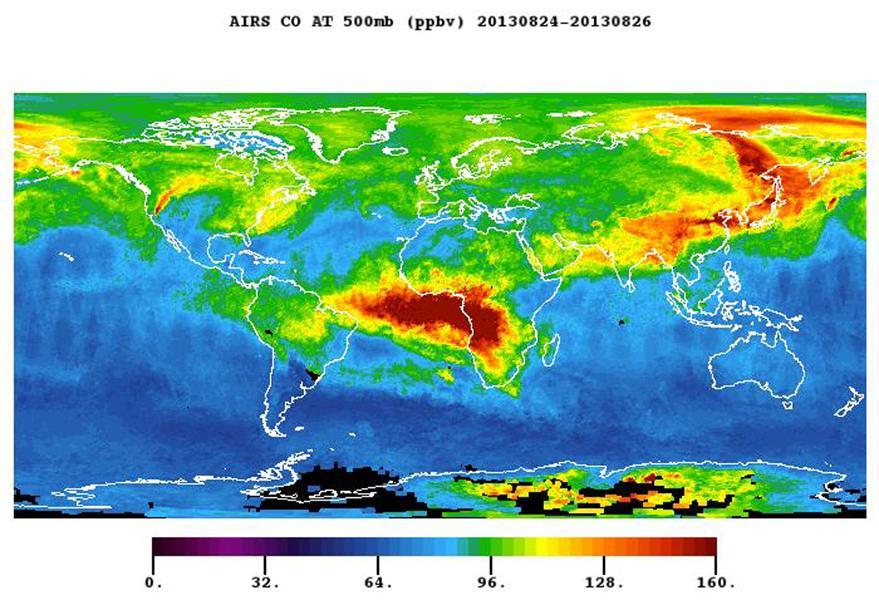
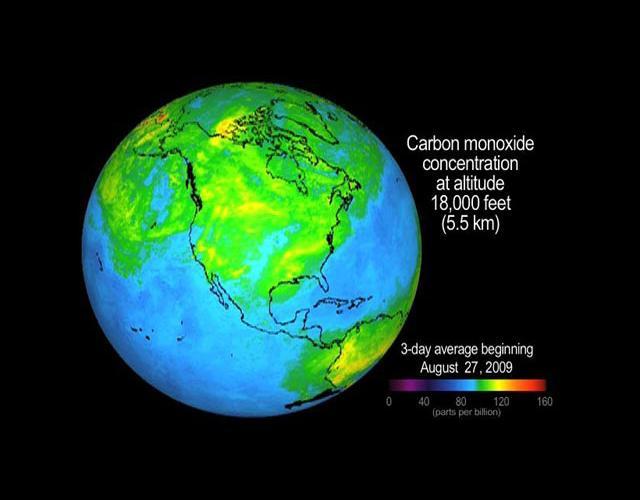
The plume of carbon monoxide pollution from the Rim Fire burning in and near Yosemite National Park, Calif., shows a three-day running average of daily measurements from NASA Aqua spacecraft.
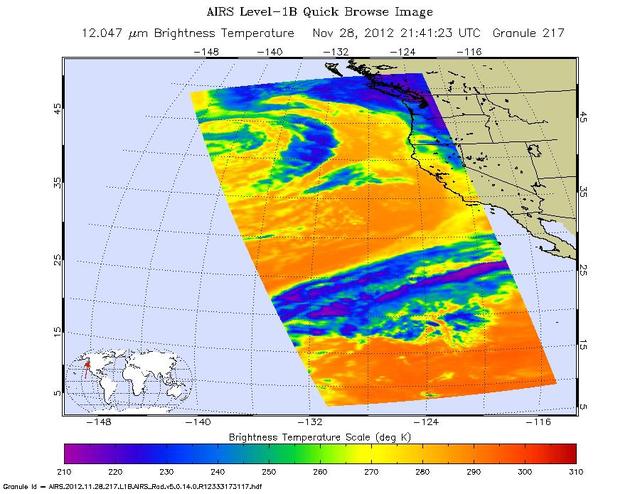
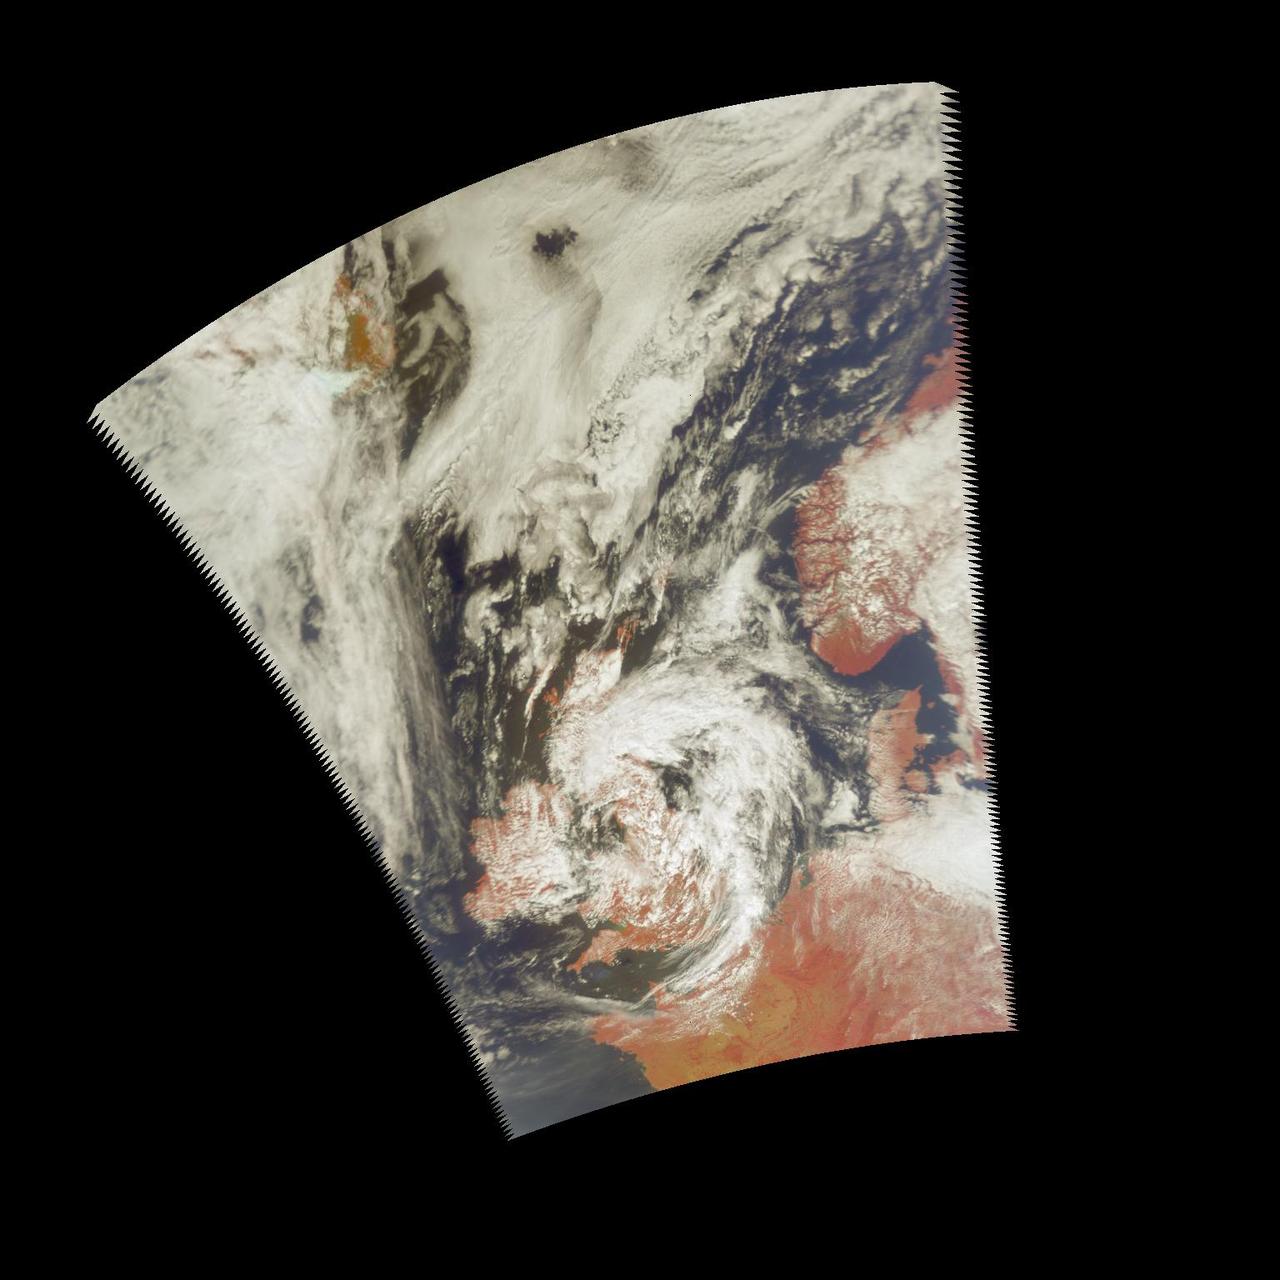
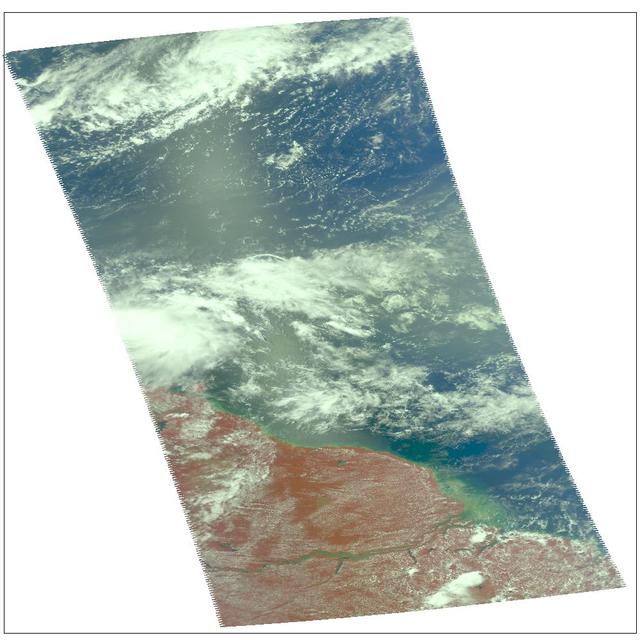
NASA Aqua spacecraft captured this infrared image of the first of a series of storms approaching the Pacific Northwest at 2141 UTC 1:41 p.m. PST on Nov. 28, 2012, marking the beginning of an atmospheric river event.
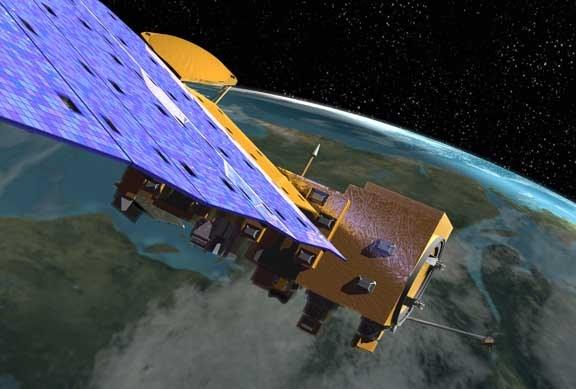
NASA's Aqua Satellite Celebrates 10th Anniversary The Aqua satellite mission has proved to be a major component of the Earth Observing System (EOS) for its ability to gather unprecedented amounts of information on Earth’s water cycle, including measurements on water vapor, clouds, precipitation, ice, and snow. Aqua data has helped improve weather prediction, detection of forest fires, volcanic ash, and sandstorms. In addition, Aqua data have been used to detect and monitor such greenhouse gases as carbon dioxide, water vapor, and methane, and to examine the energy imbalance at the top of the Earth's atmosphere and the various components of it. With these uses of Aqua data, scientists have been able to better understand our Earth over the course of the past ten years. Aqua is a major international Earth Science satellite mission centered at NASA. Launched on May 4, 2002, the satellite has six different Earth-observing instruments on board and is named for the large amount of information being obtained about water in the Earth system from its stream of approximately 89 Gigabytes of data a day. The water variables being measured include almost all elements of the water cycle and involve water in its liquid, solid, and vapor forms. Additional variables being measured include radiative energy fluxes, aerosols, vegetation cover on the land, phytoplankton and dissolved organic matter in the oceans, and air, land, and water temperatures. For more information about NASA's Aqua satellite, visit: aqua.nasa.gov ------------ Caption: Artist rendition of the NASA's Aqua satellite, which carries the MODIS and AIRS instruments. Credit: NASA <b><a href="http://www.nasa.gov/audience/formedia/features/MP_Photo_Guidelines.html" rel="nofollow">NASA image use policy.</a></b> <b><a href="http://www.nasa.gov/centers/goddard/home/index.html" rel="nofollow">NASA Goddard Space Flight Center</a></b> enables NASA’s mission through four scientific endeavors: Earth Science, Heliophysics, Solar System Exploration, and Astrophysics. Goddard plays a leading role in NASA’s accomplishments by contributing compelling scientific knowledge to advance the Agency’s mission. <b>Follow us on <a href="http://twitter.com/NASA_GoddardPix" rel="nofollow">Twitter</a></b> <b>Like us on <a href="http://www.facebook.com/pages/Greenbelt-MD/NASA-Goddard/395013845897?ref=tsd" rel="nofollow">Facebook</a></b> <b>Find us on <a href="http://instagrid.me/nasagoddard/?vm=grid" rel="nofollow">Instagram</a></b>
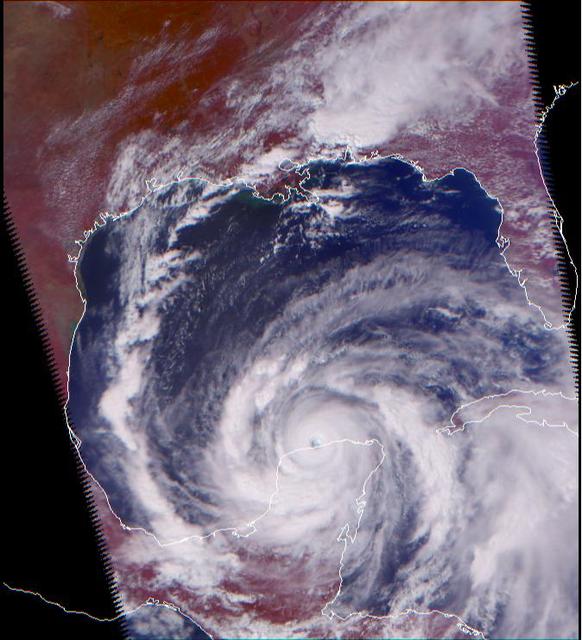
Hurricane Isidore as seen by the Atmospheric Infrared Sounding System AIRS on NASA Aqua in 2002. http://photojournal.jpl.nasa.gov/catalog/PIA00350
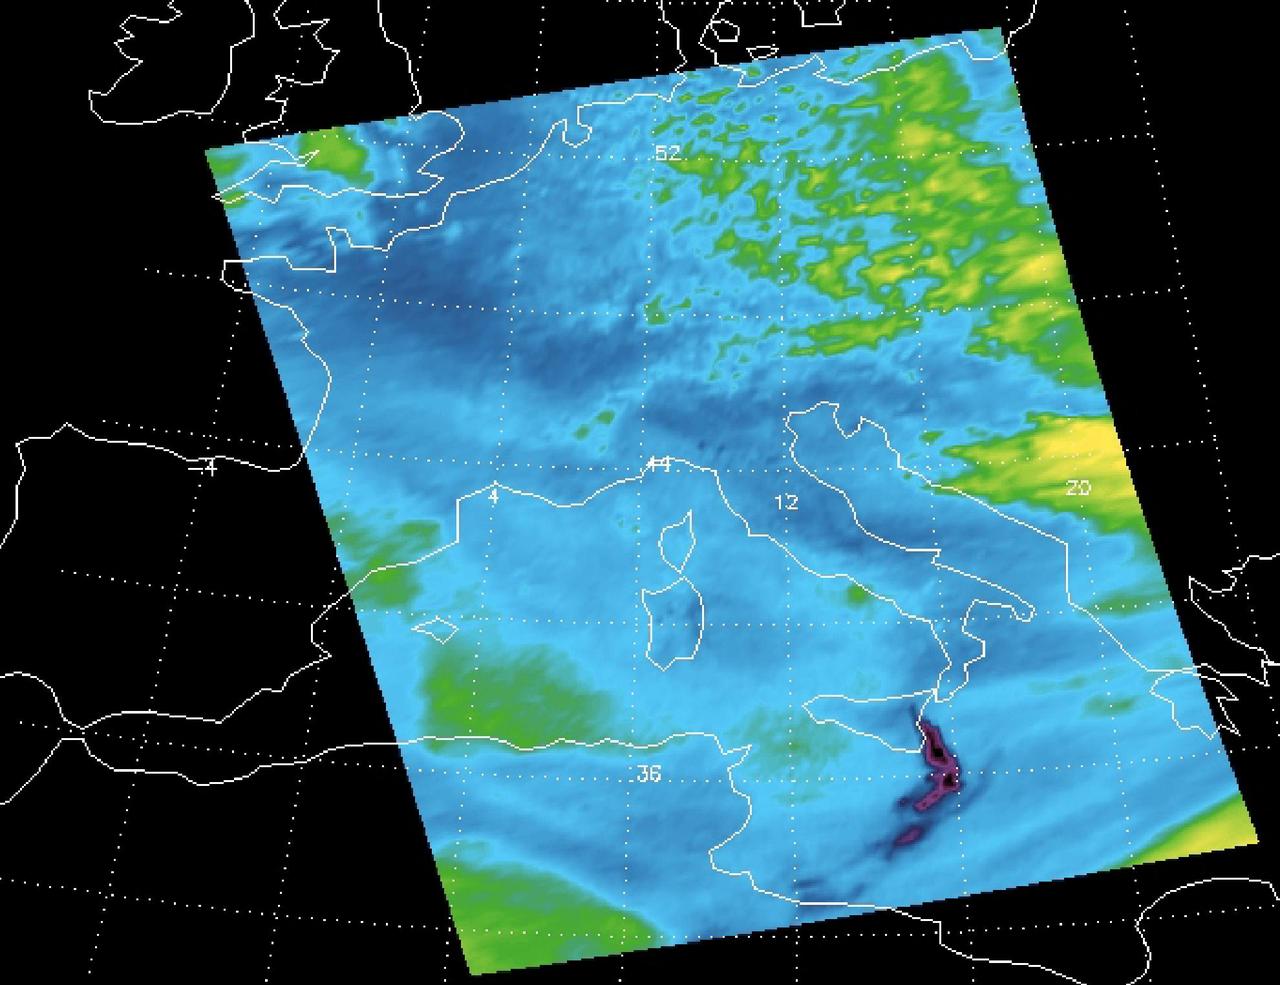
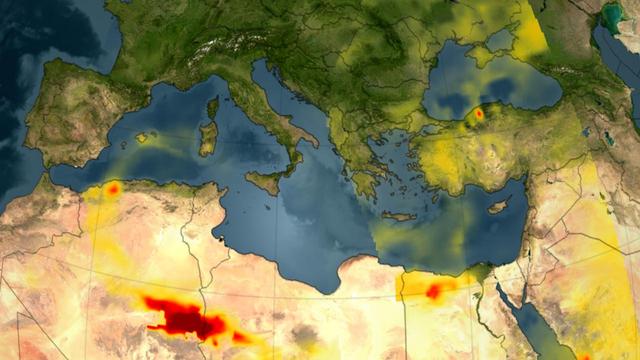
Sulfur dioxide plume from the Mt. Etna Eruption 2002 as seen by the Atmospheric Infrared Sounder AIRS on NASA Aqua satellite.
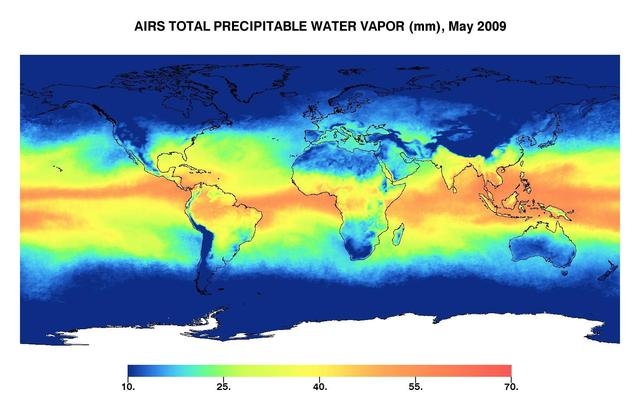
This image represents the total precipitable water vapor for May 2009 as observed by JPL Atmospheric Infrared Sounder on NASA Aqua satellite.
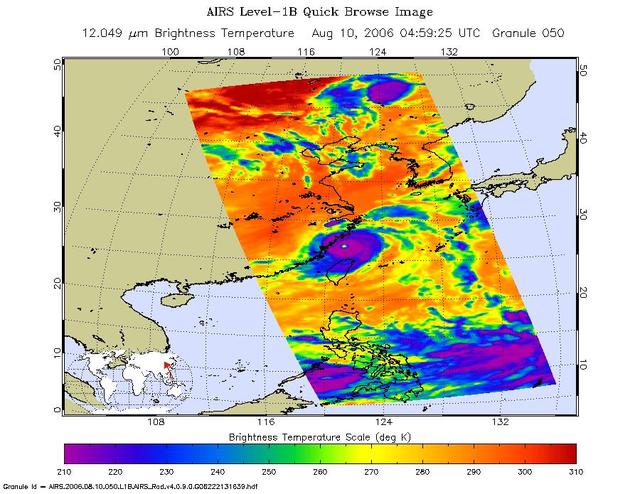
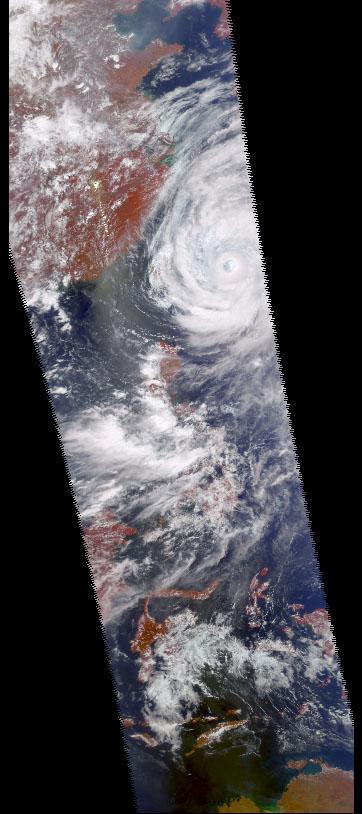
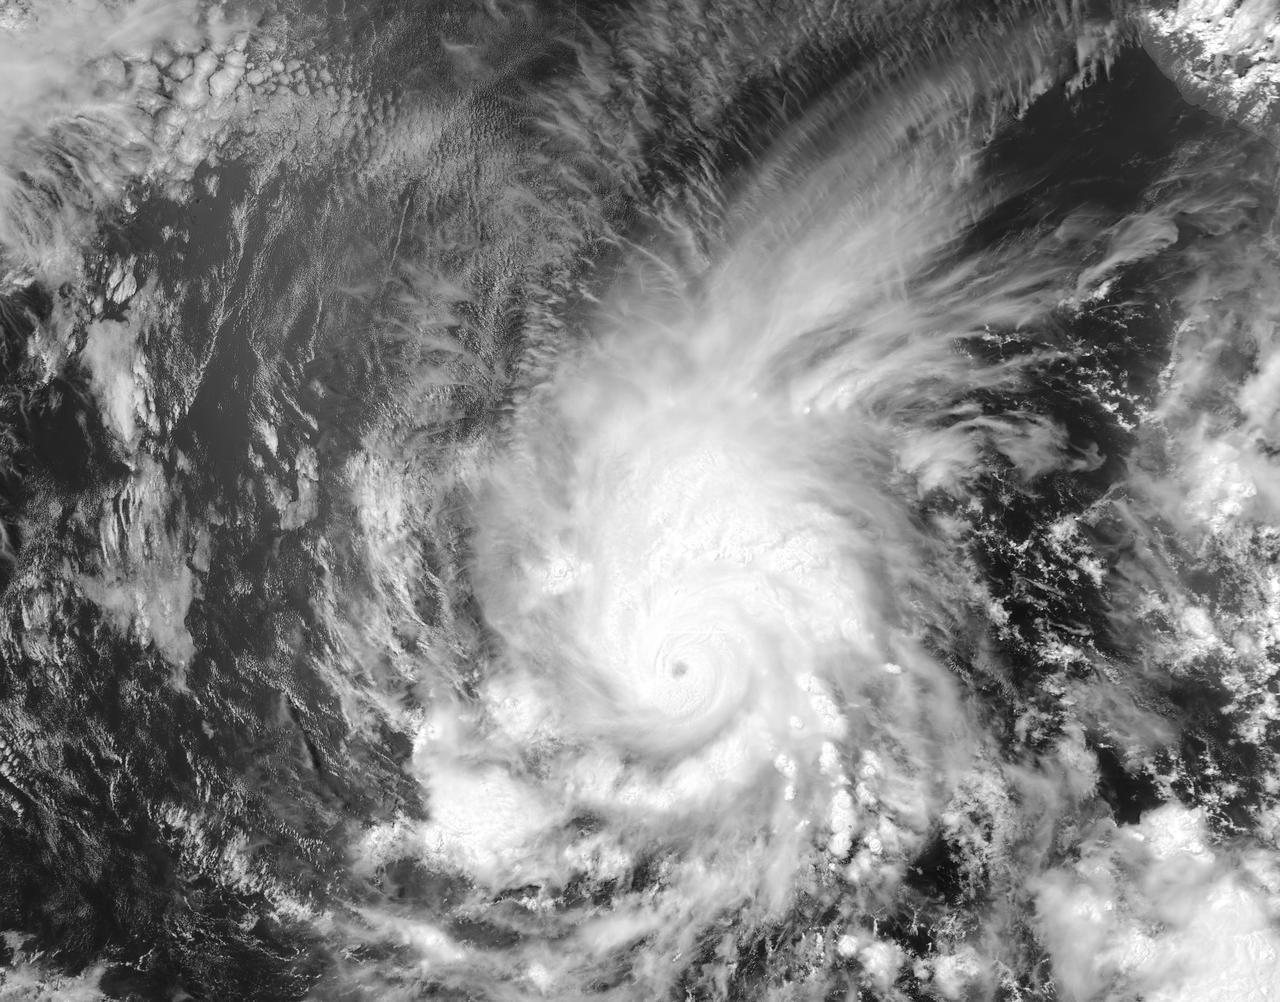
This is an infrared image of Typhoon Saomai from the Atmospheric Infrared Sounder AIRS on NASA Aqua satellite on August 10, 2006.
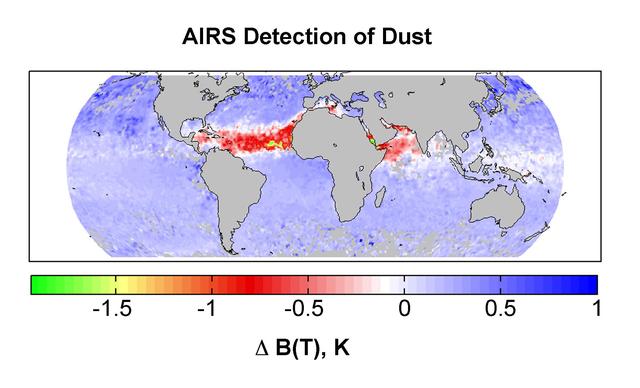
Detection of dust: global map for July 2003 from the Atmospheric Infrared Sounder AIRS on NASA Aqua satellite.
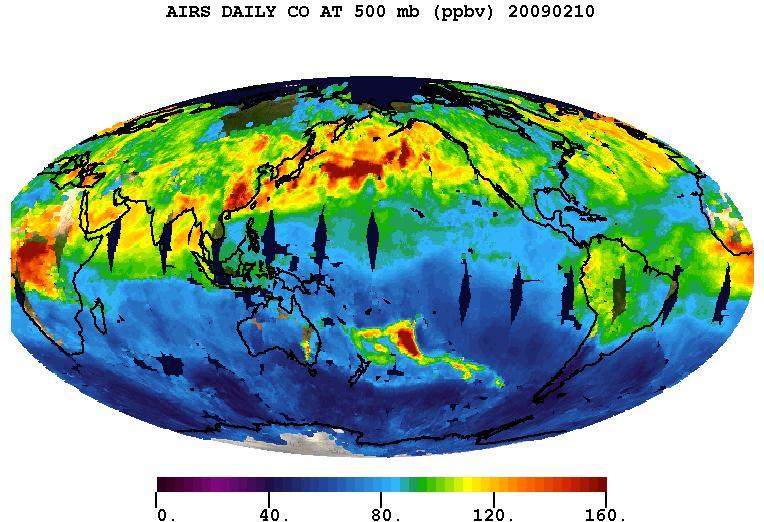
Carbon monoxide from the Australian fires of February, 2009, as seen by the Atmospheric Infrared Sounder AIRS on NASA Aqua satellite.
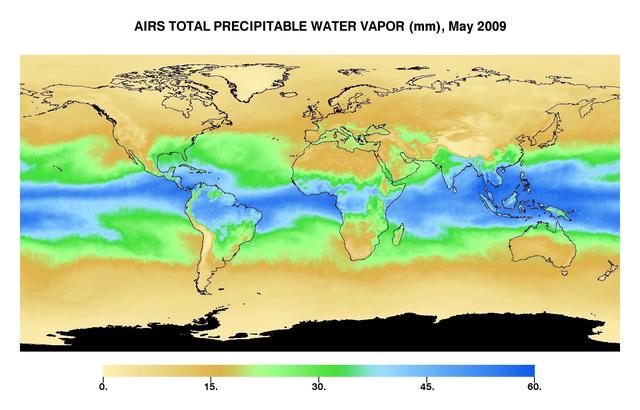
This image represents the total precipitable water vapor for May, 2009 as observed by JPL Atmospheric Infrared Sounder on NASA Aqua satellite.

Global tropospheric methane for August 2005 retrieved from the Atmospheric Infrared Sounder AIRS on NASA Aqua satellite.
The Atmospheric Infrared Sounder AIRS onboard NASA Aqua satellite collects data and creates a temperature profile, September, 2008.
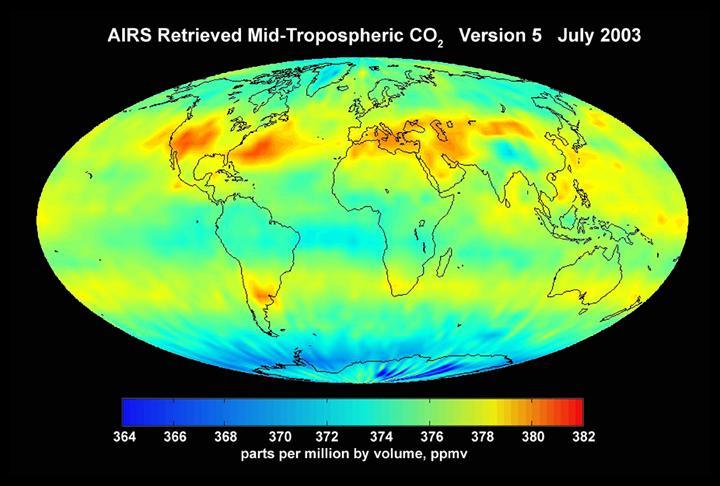
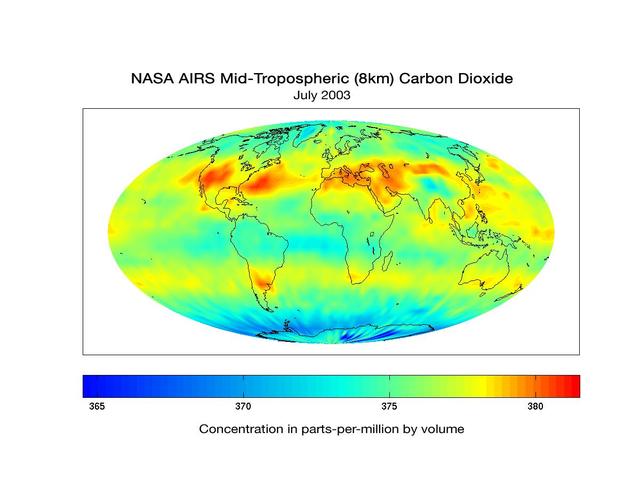
AIRS mid-tropospheric CO2, Version 5, July 2003 from the Atmospheric Infrared Sounder AIRS on NASA Aqua satellite.
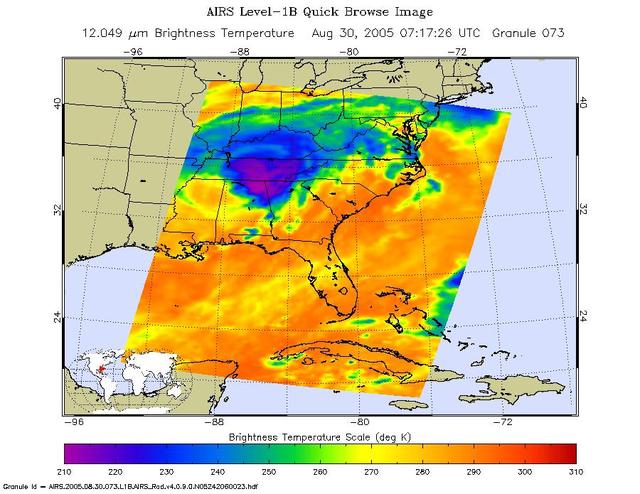
Infrared image of Hurricane Katrina captured by the Atmospheric Infrared Sounder onboard NASA Aqua satellite in August, 2005.
Supertyphoon Pongsona isotherms as it hit the island of Guam, December of 2002, from the Atmospheric Infrared Sounder AIRS on NASA Aqua satellite.
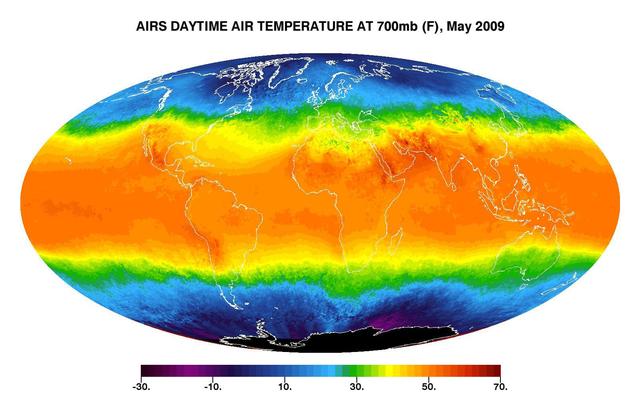
This image shows average daytime temperatures in May, 2009, as observed by JPL Atmospheric Infrared Sounder on NASA Aqua satellite.
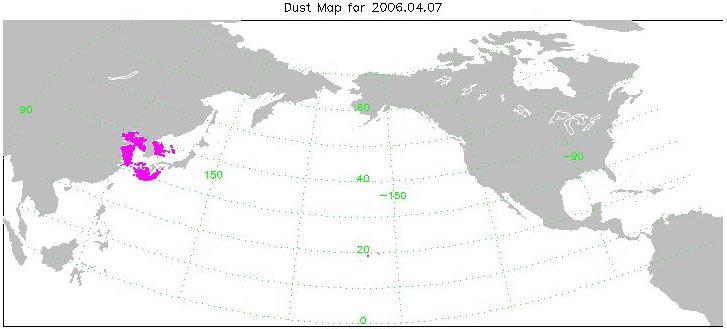
Transport of dust from China Dust Storm of April 2006, from the Atmospheric Infrared Sounder AIRS on NASA Aqua satellite.
The Atmospheric Infrared Sounder AIRS instrument on NASA Aqua spacecraft is also being used by scientists to observe atmospheric carbon dioxide.
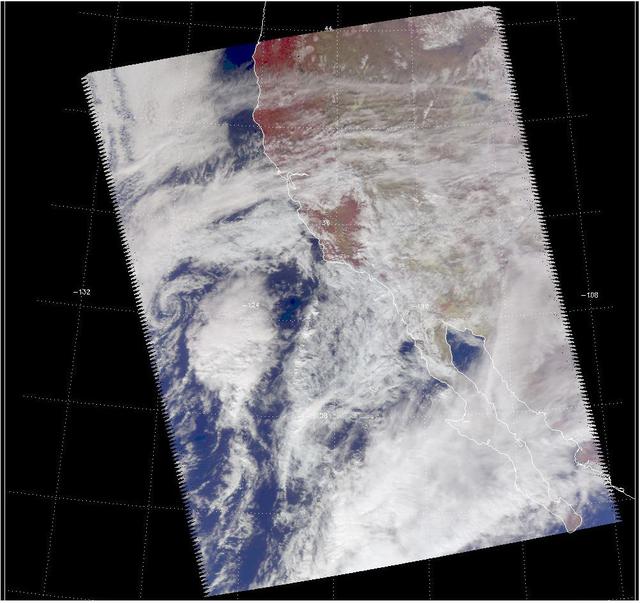
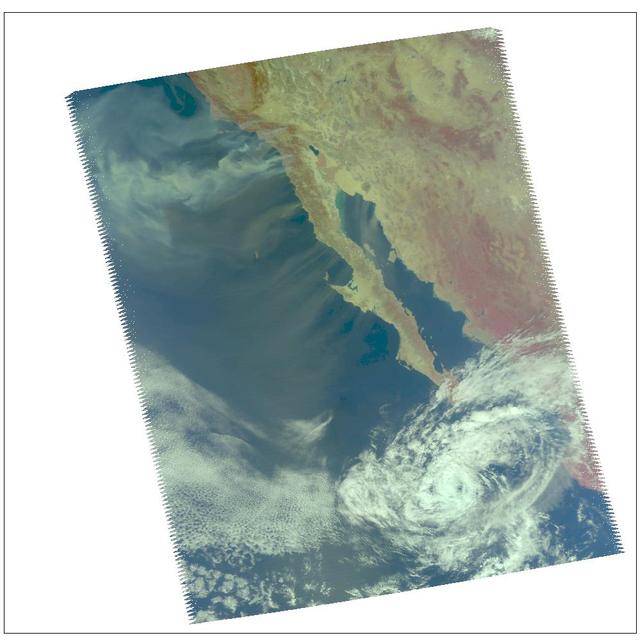
Visible image of a California storm in March, 2003, as seen by the Atmospheric Infrared Sounder AIRS on NASA Aqua satellite. http://photojournal.jpl.nasa.gov/catalog/PIA00402

Carbon monoxide from California wildfire, a visualization created using data from the Atmospheric Infrared Sounder AIRS on NASA Aqua satellite, June-July, 2008.
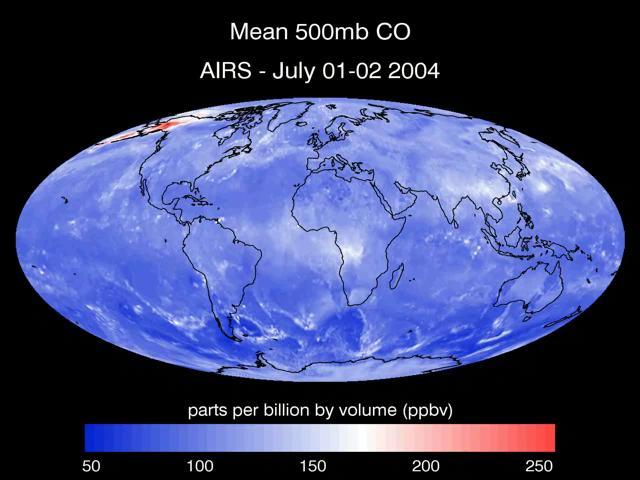
A series of maps of the transport of carbon monoxide generated by Alaska Fires, July 2004, created by data from the Atmospheric Infrared Sounder AIRS on NASA Aqua satellite.
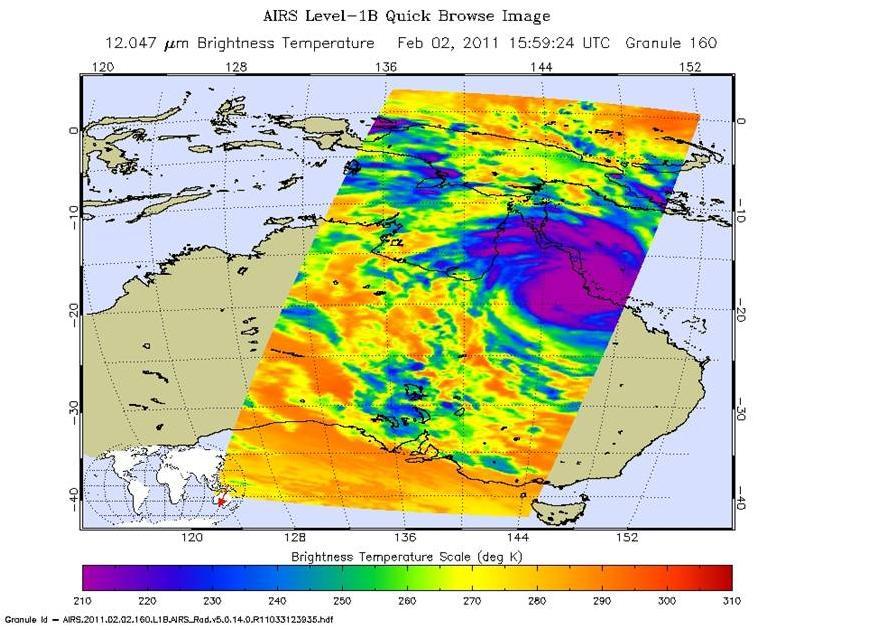
Powerful Tropical Cyclone Yasi fury rakes Northeastern Australia in February, 2011, as seen by the Atmospheric Infrared Sounder AIRS on NASA Aqua satellite.
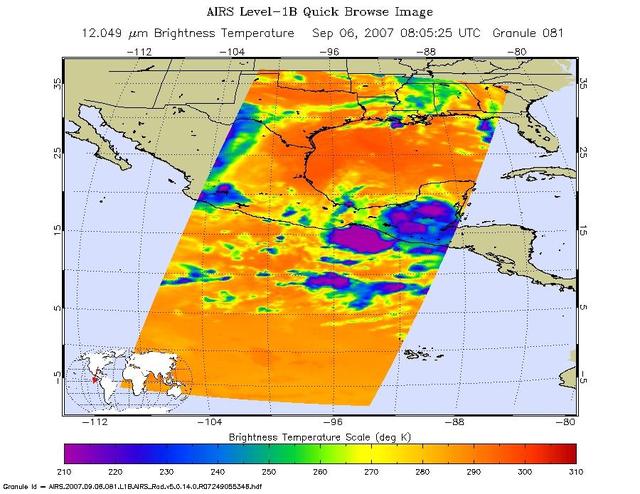
Visible image of Hurricane Dean, at the coast of Mexico from Manzanillo to Mazatlan in August, 2007, from Atmospheric Infrared Sounder AIRS on NASA Aqua satellite.
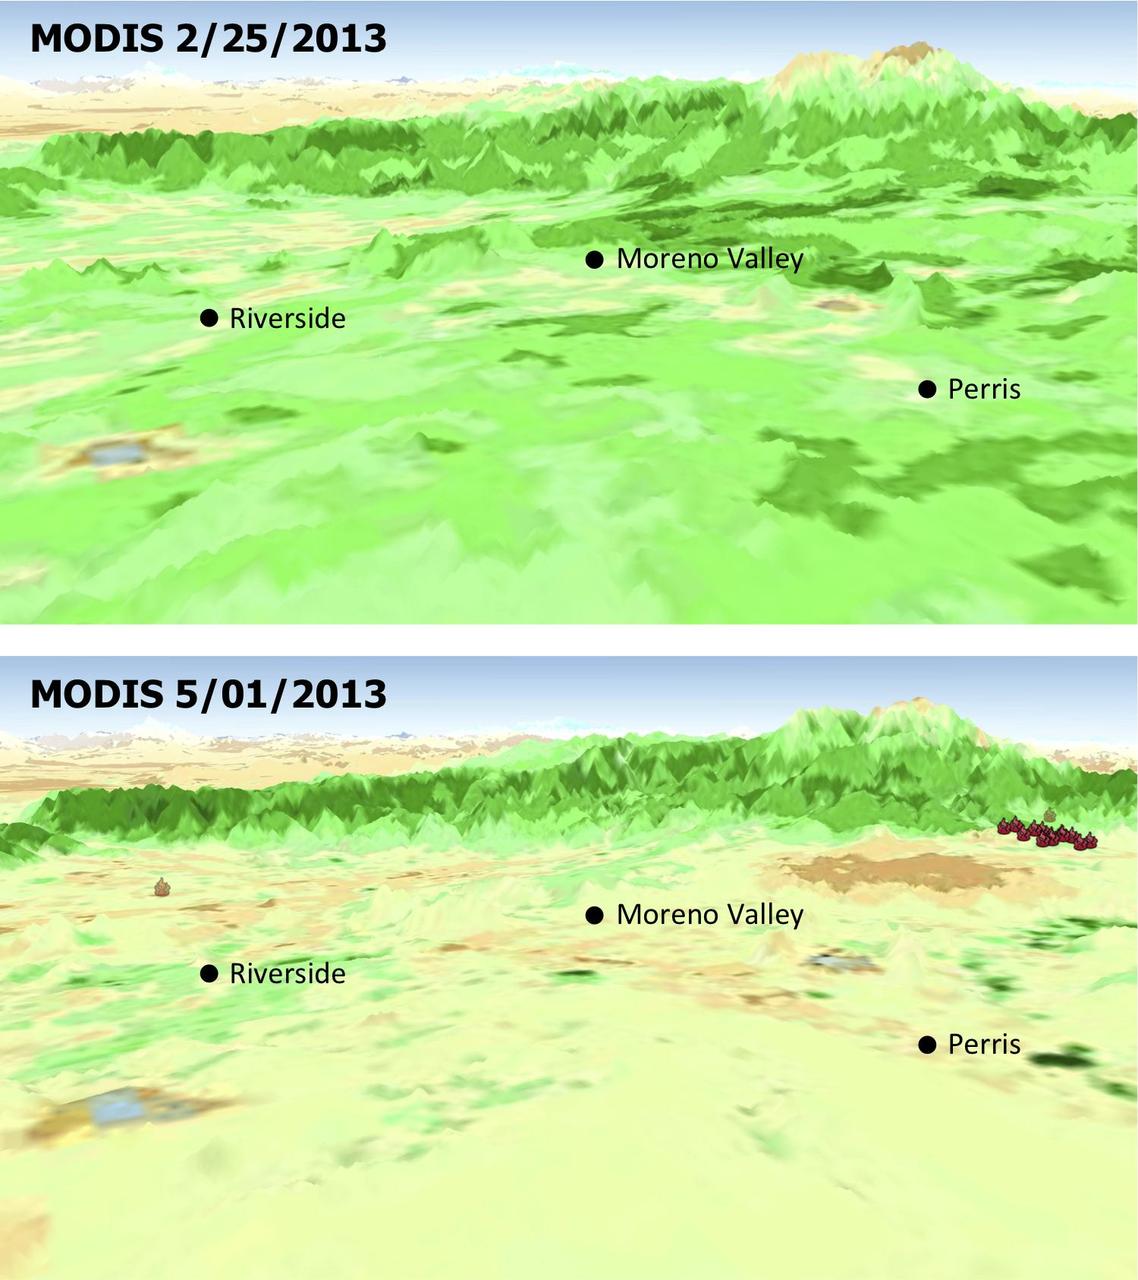
The quick dry-out of vegetation in Southern California this year is depicted in this pair of images from the Moderate Resolution Imaging Spectroradiometer MODIS sensor on NASA Aqua spacecraft.
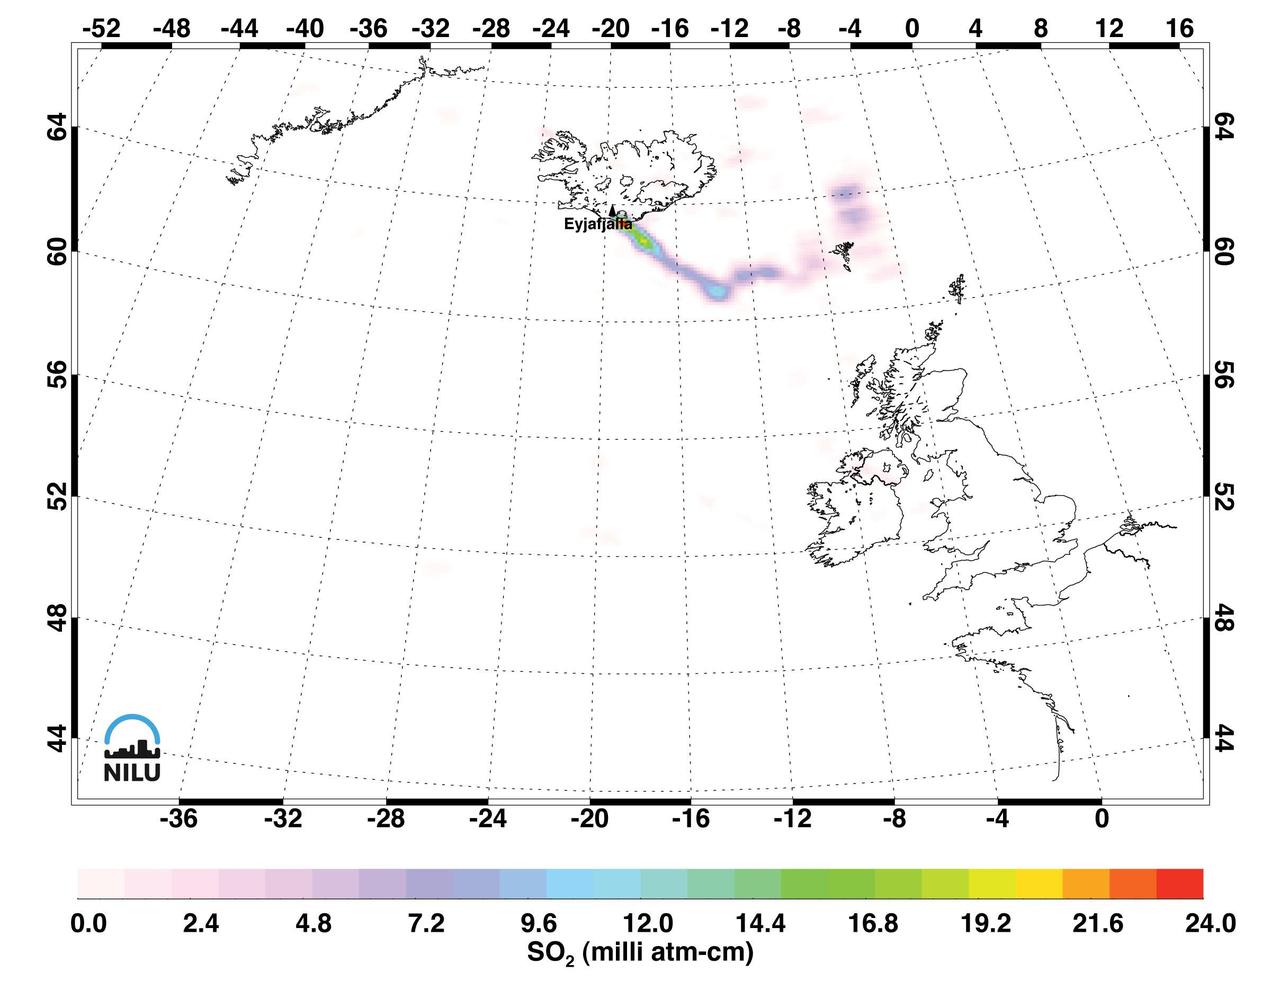
Images made with data from the Atmospheric Infrared Sounder on NASA Aqua satellite, show sulfur dioxide released from the volcanic eruption of Eyjafjallajökull.
Hurricane Isabel isotherms as the storm moved across the Atlantic Ocean in September, 2003, from the Atmospheric Infrared Sounder AIRS on NASA Aqua satellite.
A major dust storm moved across the eastern and northeastern regions of Australia on Sept. 23, 2009, out towards the Pacific as seen by NASA Aqua satellite.
Visible image of Typhoon Sepat, western Pacific Ocean, southeast coast of China, August, 2007, from the Atmospheric Infrared Sounder AIRS on NASA Aqua satellite.
A series of fires across Greece in August of 2007 burned 469,000 acres, visualized here by the Atmospheric Infrared Sounder AIRS on NASA Aqua satellite.
Tropical Storm Isidore was born in mid-September, 2000 north of Venezuela. This images is from Atmospheric Infrared Sounding System AIRS on NASA Aqua. http://photojournal.jpl.nasa.gov/catalog/PIA00365
Mt. Etna, a volcano on the island of Sicily, erupted on October 26, 2002, as seen by the Atmospheric Infrared Sounding System AIRS on NASA Aqua. http://photojournal.jpl.nasa.gov/catalog/PIA00355
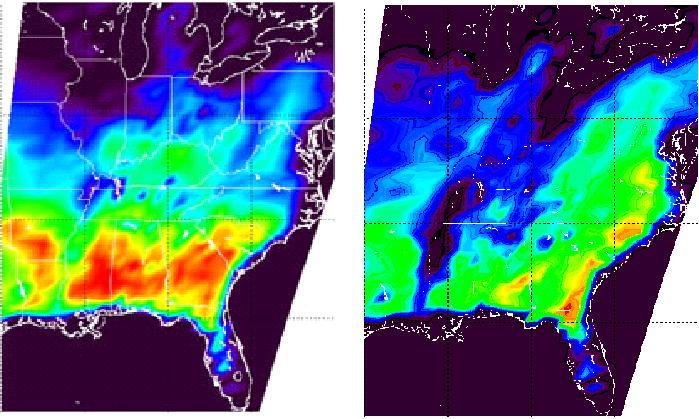
These four images of Tropical Cyclone Ramasun were obtained July 3, 2002 by the Atmospheric Infrared Sounder experiment system onboard NASA Aqua spacecraft. http://photojournal.jpl.nasa.gov/catalog/PIA00341

Typhoon Chan-Hom's eye was visible from space when NASA's Aqua satellite passed overhead early on July 8, 2015. The MODIS instrument, known as the Moderate Resolution Imaging Spectrometer, flies aboard NASA's Aqua satellite. When Aqua passed over Typhoon Chan-Hom on July 8 at 04:25 UTC (12:25 a.m. EDT), MODIS captured a visible-light image of the storm that clearly showed its eye. The MODIS image also a ring of powerful thunderstorms surrounding the eye of the storm, and the bulk of thunderstorms wrapping around the system from west to east, along the southern side. At 0900 UTC (5 a.m. EDT), Typhoon Chan-Hom's maximum sustained winds were near 85 knots (97.8 mph/157.4 kph). Tropical-storm-force winds extended 145 nautical miles (166.9 miles/268.5 km) from the center, making the storm almost 300 nautical miles (345 miles/555 km) in diameter. Typhoon-force winds extended out to 35 nautical miles (40 miles/64.8 km) from the center. Chan-Hom's eye was centered near 20.5 North latitude and 132.7 East longitude, about 450 nautical miles (517.9 miles/833.4 km) southeast of Kadena Air Base, Iwo To, Japan. Chan-Hom was moving to the northwest at 11 knots (12.6 mph/20.3 kph). The typhoon was generating very rough seas with wave heights to 28 feet (8.5 meters). The Joint Typhoon Warning Center expects Chan-Hom to continue tracking northwestward over the next three days under the steering influence of a sub-tropical ridge (elongated area of high pressure). Chan-Hom is expected to intensify steadily peaking at 120 knots (138.1 mph/222.2 kph) on July 10. The JTWC forecast predicts that Chan-Hom will make landfall near Wenzhou, Zhejiang, China and begin decaying due to land interaction. For updated warnings and watches from China's National Meteorological Centre, visit: <a href="http://www.cma.gov.cn/en/WeatherWarnings/" rel="nofollow">www.cma.gov.cn/en/WeatherWarnings/</a>. Credit: NASA/GSFC/Jeff Schmaltz/MODIS Land Rapid Response Team b><a href="http://www.nasa.gov/audience/formedia/features/MP_Photo_Guidelines.html" rel="nofollow">NASA image use policy.</a> <b><a href="http://www.nasa.gov/centers/goddard/home/index.html" rel="nofollow">NASA Goddard Space Flight Center</a></b> enables NASA’s mission through four scientific endeavors: Earth Science, Heliophysics, Solar System Exploration, and Astrophysics. Goddard plays a leading role in NASA’s accomplishments by contributing compelling scientific knowledge to advance the Agency’s mission. <b>Follow us on <a href="http://twitter.com/NASAGoddardPix" rel="nofollow">Twitter</a></b> <b>Like us on <a href="http://www.facebook.com/pages/Greenbelt-MD/NASA-Goddard/395013845897?ref=tsd" rel="nofollow">Facebook</a></b> <b>Find us on <a href="http://instagrid.me/nasagoddard/?vm=grid" rel="nofollow">Instagram</a></b>
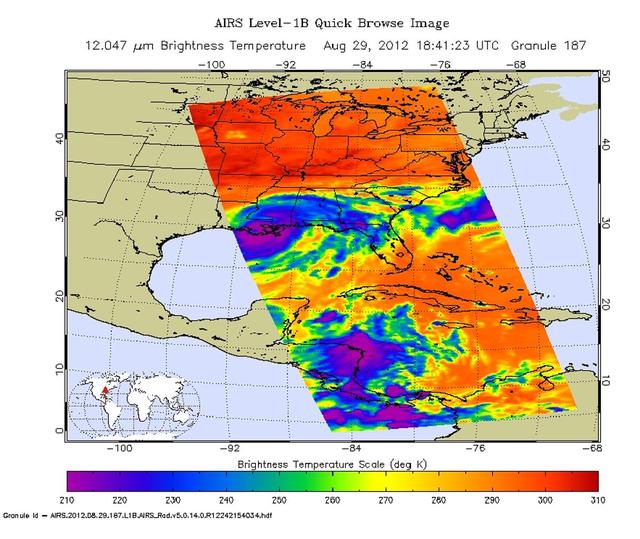
Strong tropical storm Isaac continues to create havoc across the Gulf Coast, from eastern Texas to Florida. This infrared image from NASA Aqua spacecraft, was acquired at 2:41 p.m. CDT on Aug. 29, 2012.
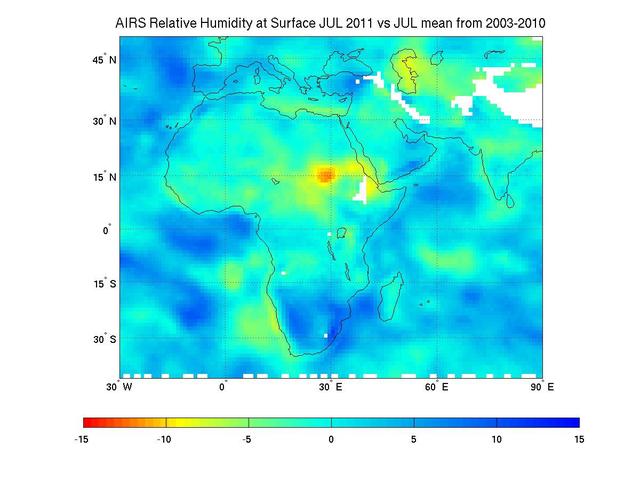
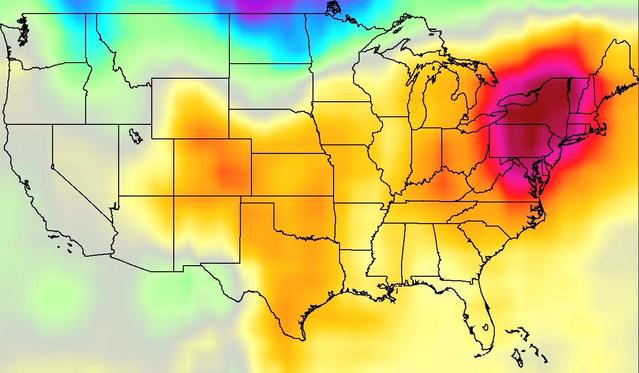
Surface relative humidity anomalies in percent, during July 2011 compared to the average surface relative humidity over the previous eight years, as measured by NASA Aqua instrument AIRS. The driest areas are shown in oranges and reds.
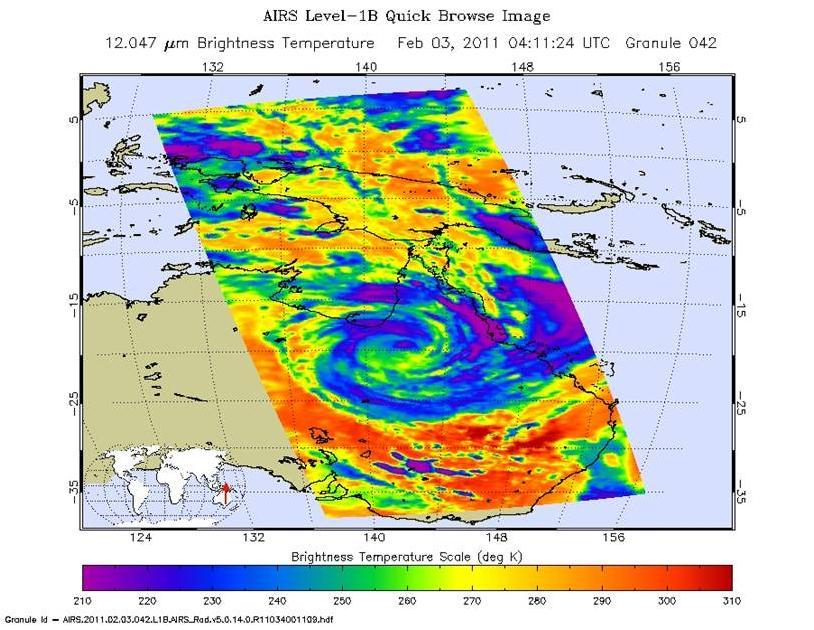
The Atmospheric Infrared Sounder AIRS instrument onboard NASA Aqua spacecraft captured this infrared image of Tropical Cyclone Yasi on Feb. 2, 2011 as the storm passed over Australia Great Dividing Range.
Smoke from multiple wildfires burning in Southern California in October, 2007, can be seen in this false-color image from the Atmospheric Infrared Sounder AIRS on NASA Aqua satellite.
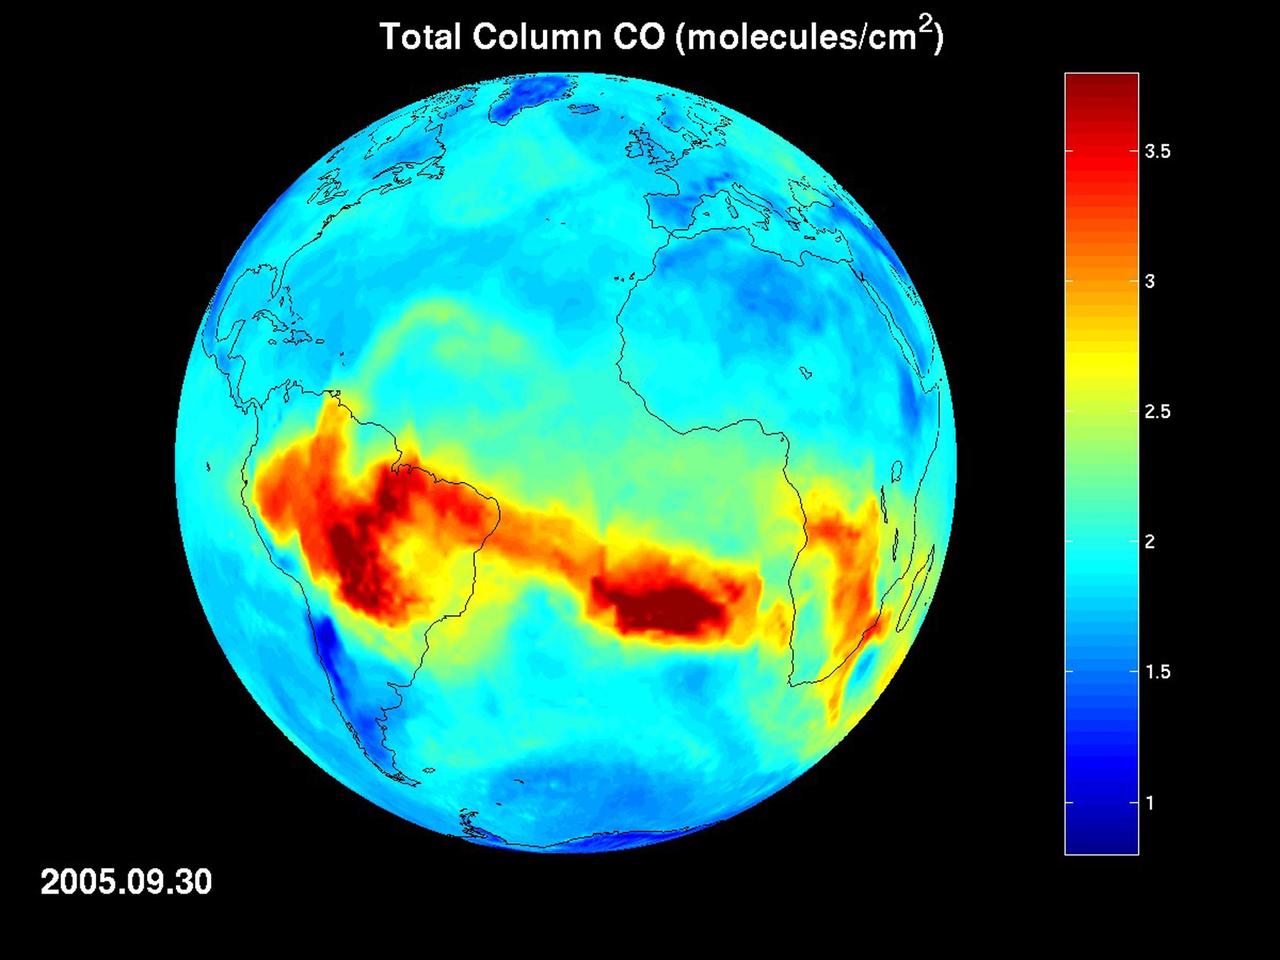
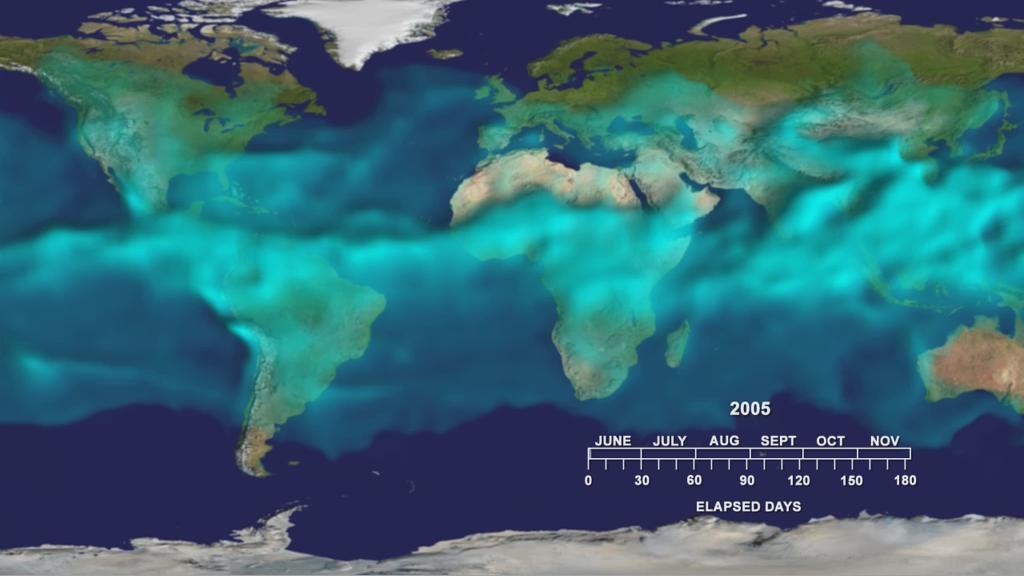
Map of carbon monoxide draped on globe: time Series from 8/1/2005 to 9/30/2005 from the Atmospheric Infrared Sounder AIRS on NASA Aqua satellite.
NASA Aqua spacecraft has illustrated surface air and skin temperature for the period from July 16-24, showing movement of a dome of heat across the eastern two-thirds of the country. See More Details for the movies.

This map created with data from the AIRS on NASA Aqua satellite shows the concentration of carbon dioxide in Earth mid-troposphere, located roughly between 3 to 6 miles 5 to 9 kilometers in altitude.
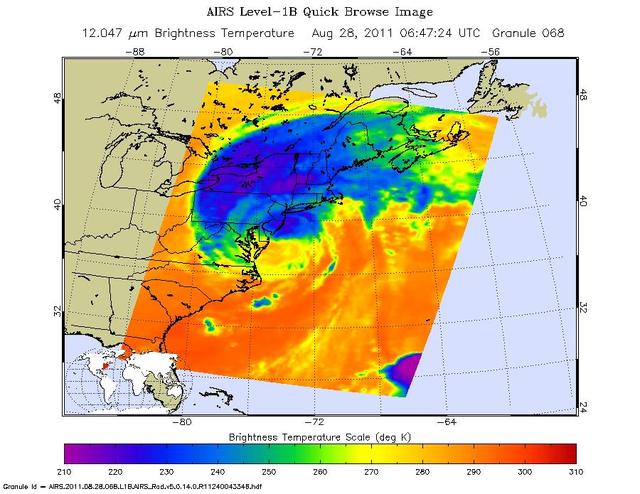
This infrared image of Hurricane Irene from the AIRS instrument on NASA Aqua spacecraft, was taken at 2:47 a.m. EDT on Aug. 28. The storm coldest cloud top temperatures and intense rains are shown in purples and blues.
Visible image of Tropical Storm Erin, the Atlantic Ocean 210 miles south of Galveston, Texas, August, 2007, from the Atmospheric Infrared Sounder AIRS on NASA Aqua satellite.

This plot shows the concentration of carbon dioxide in Earth mid-troposphere at various latitudes as measured by NASA Aqua satellite. The colored lines represent different latitude bands that circle Earth, called zones.
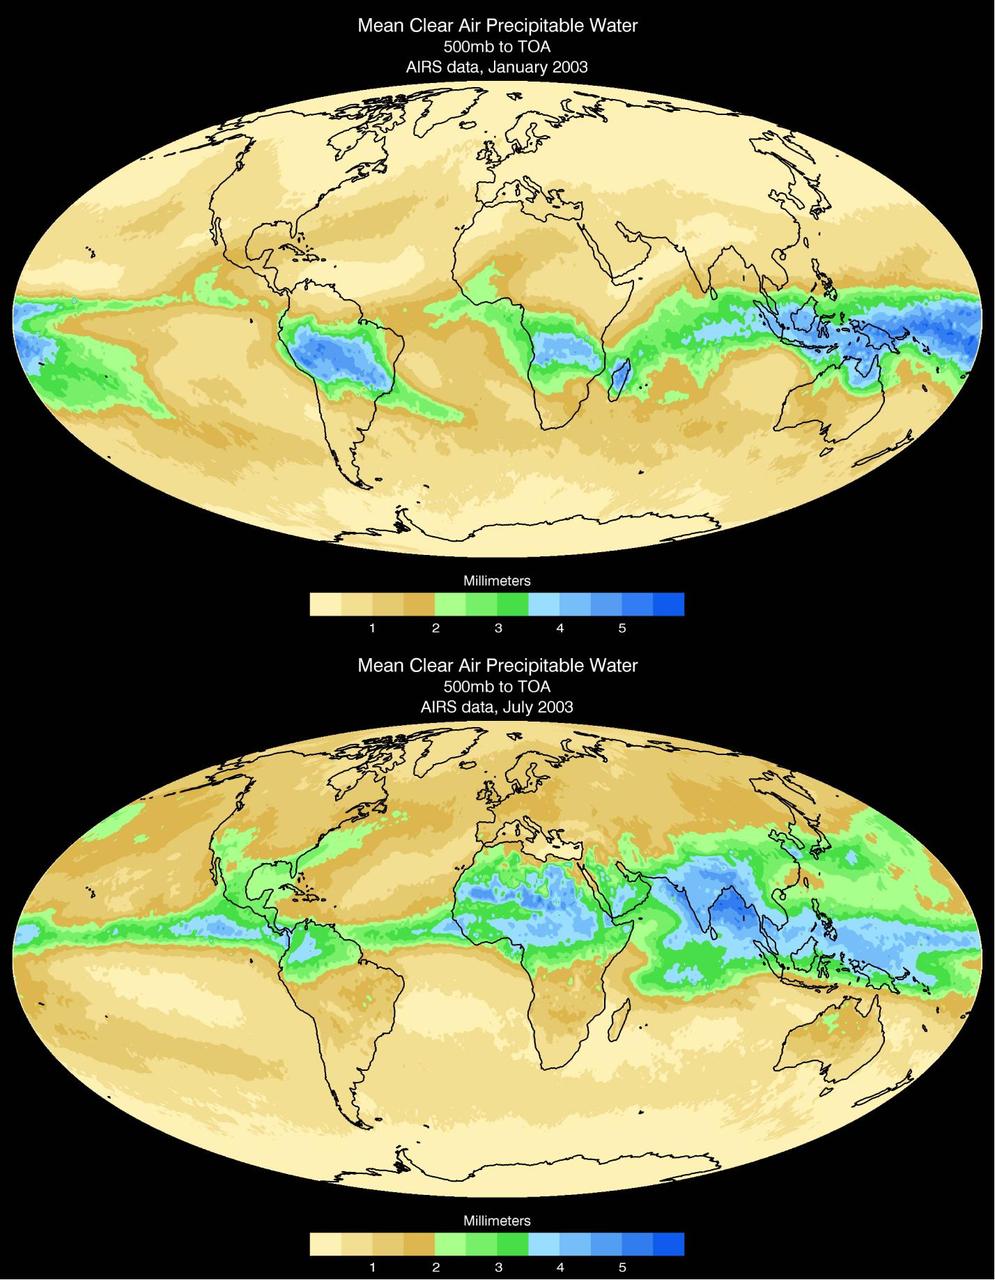
Water vapor is the dominant greenhouse gas in our atmosphere. Mean clear air precipitable water, 500mb to top of atmosphere from the Atmospheric Infrared Sounder AIRS on NASA Aqua satellite.
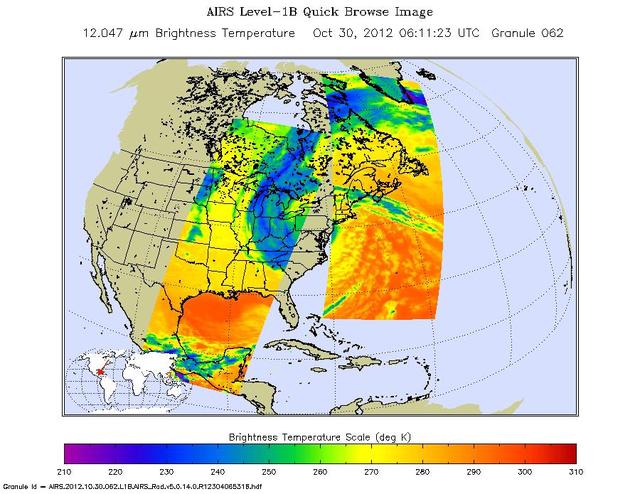
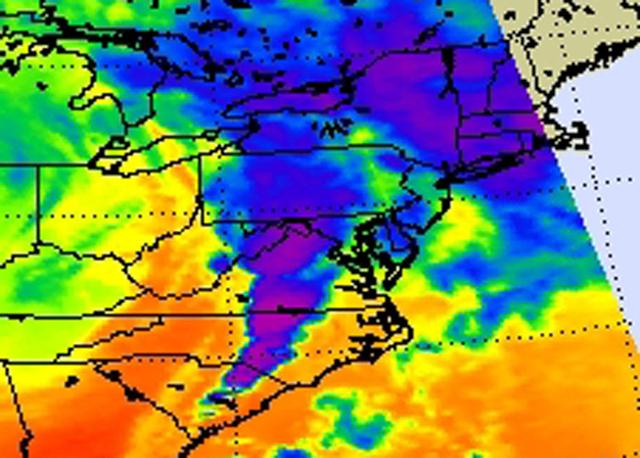
Early Tuesday, Oct. 30, 2012, Hurricane Sandy continued inland, moving to the northwest over Pennsylvania. Swaths of infrared measurements taken over two orbits of NASA Aqua satellite by the Atmospheric Infrared Sounder are displayed here.
NASA Aqua satellite captured an infrared image of the storms on April 16, 2011 showing very cold, high cloud tops of the strong thunderstorms that spawned tornadoes in North Carolina and Virginia.
Carbon monoxide in the smoke from the Station fire was lofted high into the atmosphere, where it was observed by JPL Atmospheric Infrared Sounder instrument onboard NASA Aqua satellite. Animation available at the Photojournal.
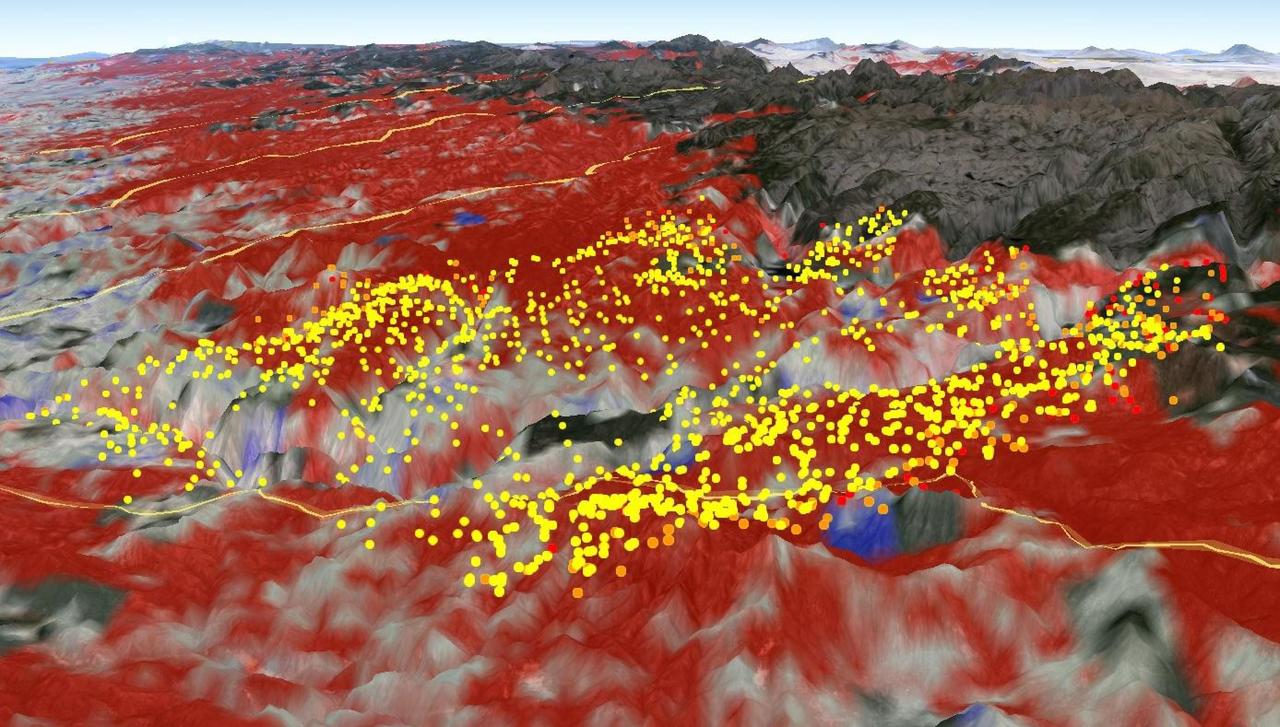
In this image from NASA Aqua satellite, the red areas seen by the MODIS instrument revealed that live fuel moisture had excessively dried up by more than 50 percent prior to the Rim Fire in August 2013.
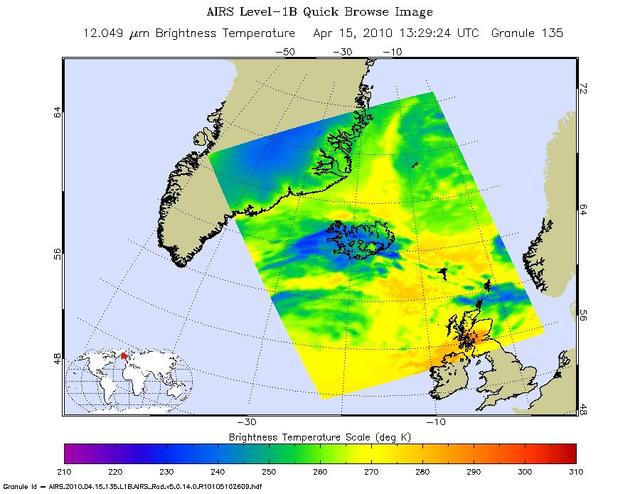
NASA Aqua satellite flew over the volcano on April 15, capturing this image of the ash plume. The image shows the ash cloud being carried over the Shetland Islands and onward to Europe.
This visualization from the Atmospheric Infrared Sounder AIRS on NASA Aqua satellite shows variations in the three dimensional distribution of water vapor in the atmosphere during the summer and fall of 2005.
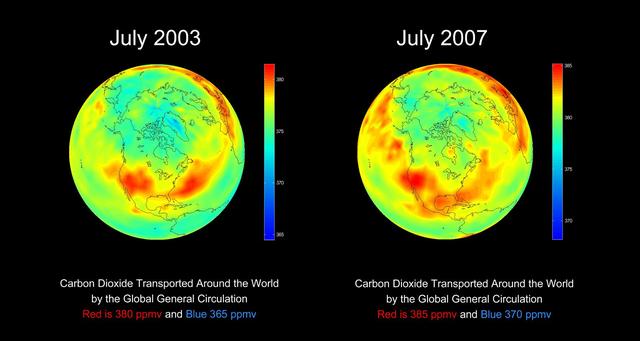
AIRS global distribution of mid-tropospheric carbon dioxide at 8-13 km altitudes between July 2003 and 2007, from the Atmospheric Infrared Sounder AIRS on NASA Aqua satellite.
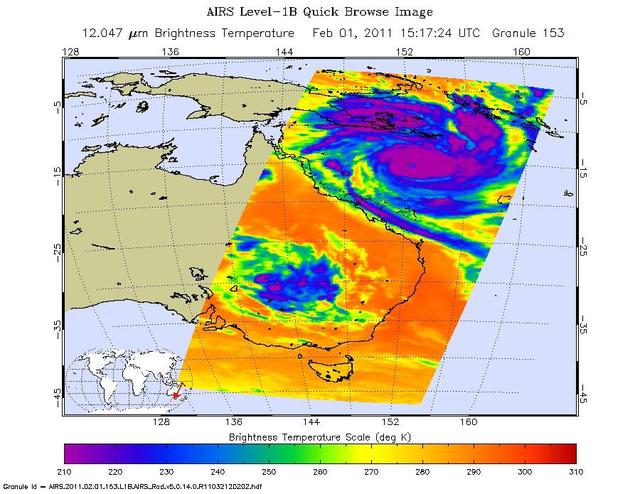
Shown here is the latest infrared image of Yasi from NASA Aqua satellite, taken on Feb. 1, 2011. A distinct eye is visible, and the outer bands of the storm can be seen nearing the Australian coast.

This graph made with data from the AIRS instrument on NASA Aqua satellite shows the concentration of carbon dioxide in Earth mid-troposphere, located roughly between 3 to 6 miles 5 to 9 kilometers in altitude.
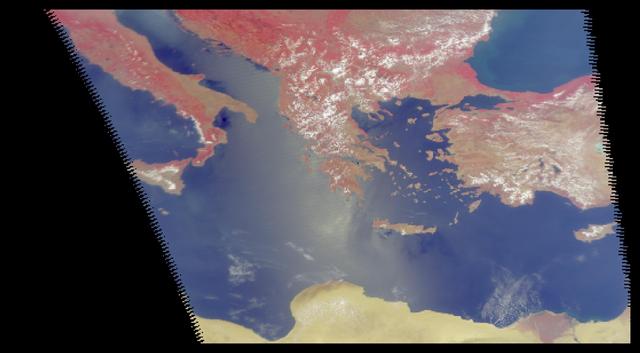
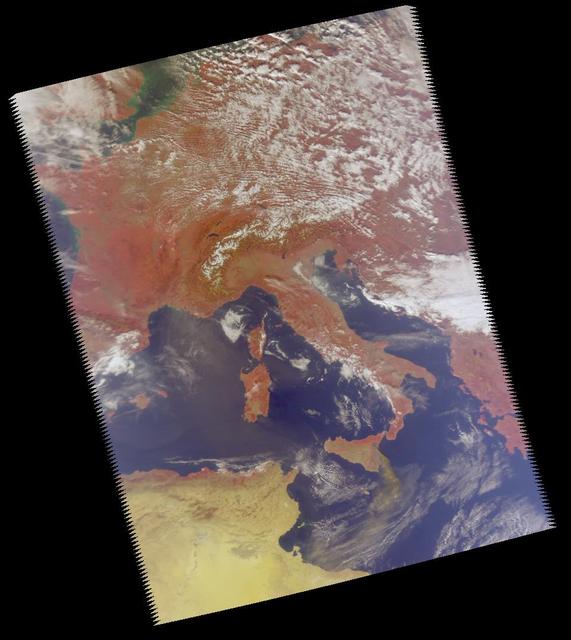
These four images of the Mediterranean were obtained concurrently on June 14, 2002 from the three instruments that make up the Atmospheric Infrared Sounder experiment system aboard NASA Aqua spacecraft. http://photojournal.jpl.nasa.gov/catalog/PIA00326
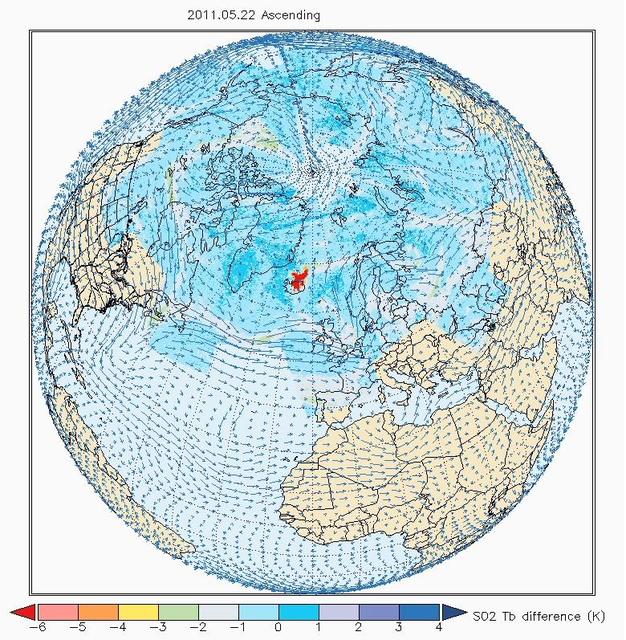
The Atmospheric Infrared Sounder AIRS on NASA Aqua satellite sees sulfur dioxide plume from Iceland Grímsvötn Volcano when it erupted May, 2011.
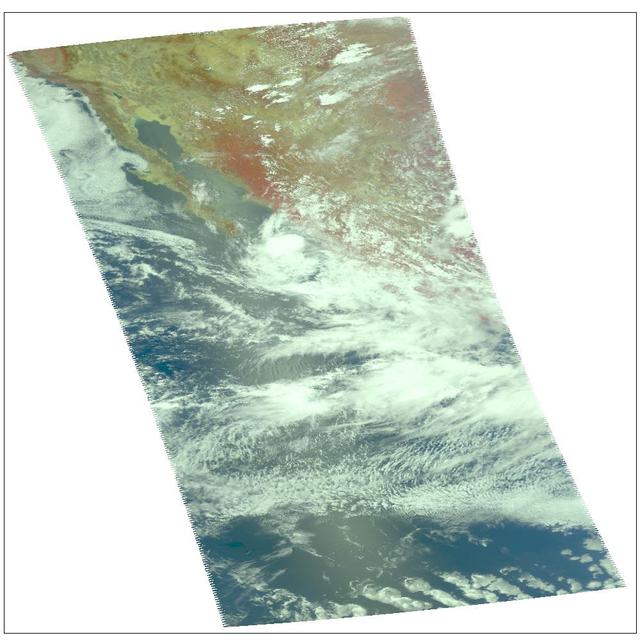
Amanda, the first named storm of the 2014 hurricane season in the Americas, is seen off the west coast of Mexico in an image acquired on May 25 by the Moderate Resolution Imaging Spectrometer MODIS on NASA Aqua satellite.
These infrared and microwave images were created with data retrieved by the Atmospheric Infrared Sounder AIRS on NASA Aqua satellite, and show the remnants of the former Hurricane Felix over Central America, September, 2007.
Visualization of the formation and evolution of the Antarctic Vortex ozone hole over the South Pole from Sept. 1 to Dec. 4, 2014, created using data from NASA Aqua spacecraft.
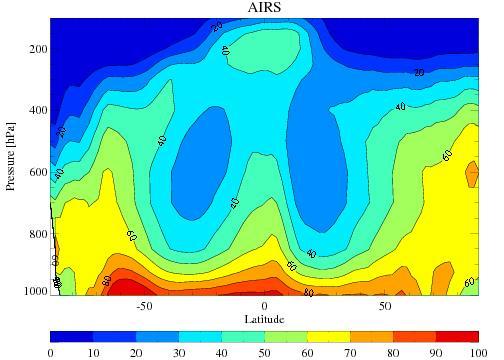
The average tropospheric relative humidity from the Atmospheric Infrared Sounder AIRS onboard NASA Aqua satellite for the four December-February periods during 2002 through 2005.
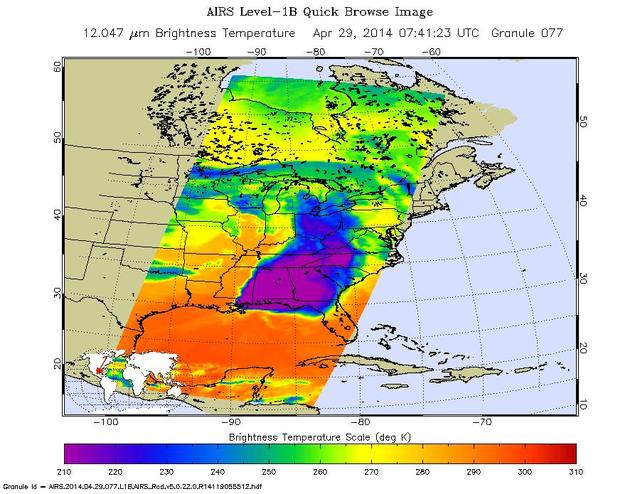
NASA Aqua spacecraft passed over central and southern United States on April 27-29, 2014 capturing this false-color infrared image of the slow-moving low-pressure system that spawned the strong supercell thunderstorms.
This image was made from data acquired by the Atmospheric Infrared Sounding System AIRS instrument suite aboard NASA Aqua spacecraft in December, 2002, just as the eye of Supertyphoon Pongsona was about to pass over Guam. http://photojournal.jpl.nasa.gov/catalog/PIA00367
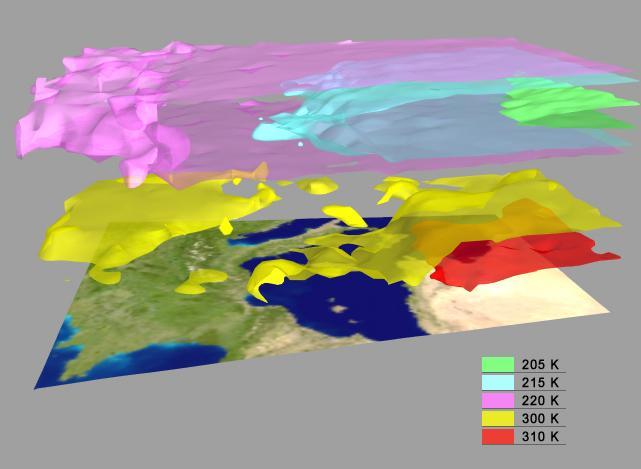
These images, taken over northern Europe on July 20, 2002, depict a few of the different views of Earth and its atmosphere that are produced by the Atmospheric Infrared Sounder experiment system operating on NASA Aqua spacecraft. http://photojournal.jpl.nasa.gov/catalog/PIA00345
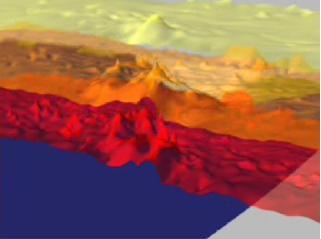
AIRS Retrieved Temperature Isotherms over Southern Europe viewed from the west, September 8, 2002. The isotherms in this map made from AIRS onboard NASA Aqua satellite data show regions of the same temperature in the atmosphere. http://photojournal.jpl.nasa.gov/catalog/PIA00513
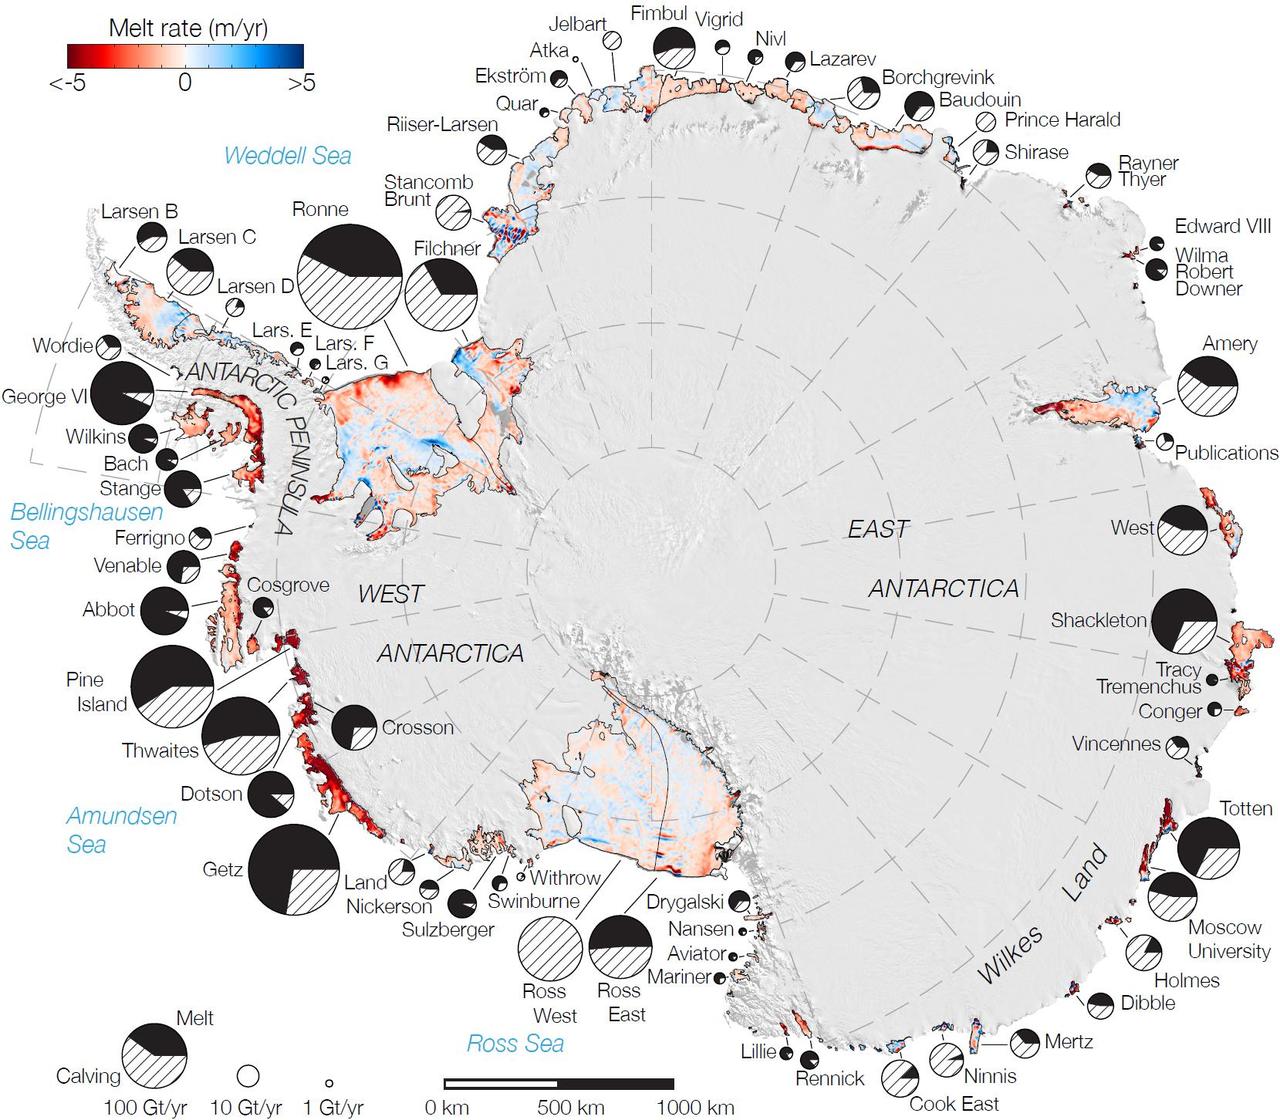
Rates of basal melt of Antarctic ice shelves melting of the shelves from underneath overlaid on a 2009 mosaic of Antarctica created from data from NASA Terra and Aqua spacecraft.

Satellite images obtained from NASA Atmospheric Infrared Sounder AIRS instrument aboard NASA Aqua spacecraft provide a glimpse into one of the most powerful storms ever recorded on Earth, Typhoon Haiyan.
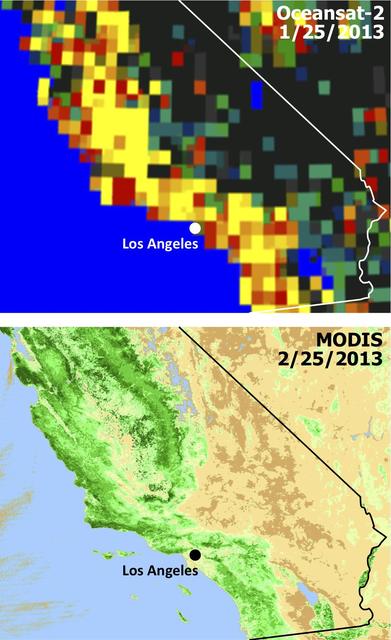
Extensive and persistent rains between Jan. 24 and Jan. 27, 2013, significantly increased soil moisture and enhanced vegetation growth in Southern California based on data from NASA Aqua spacecraft and ISRO Oceansat-2 satellite.
NASA Aqua spacecraft passed over Tropical Storm Don at 8:17 UTC 1:17 a.m. EDT on July 29, 2011. Texas is experiencing exceptional drought conditions; Tropical Storm Don may bring relief.
NASA Aqua spacecraft continues to track the gradual organization of Tropical Storm Emily, as seen in this image taken Aug. 2, 2011 at 1:05 p.m. EDT. At that time, the storm was located about 270 miles southeast of San Juan, Puerto Rico.
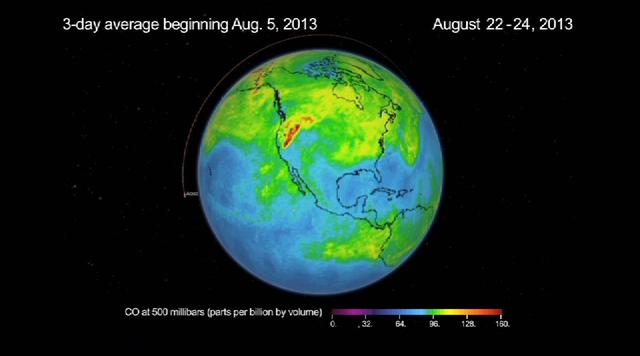
This frame from a movie was produced with data from NASA Aqua spacecraft showing the spread of carbon monoxide pollution across North America from fires in the Western U.S., including the Beaver Creek Fire in Idaho and the Rim Fire in California.

This image from NASA Aqua spacecraft shows how surface emissivity -- how efficiently Earth surface radiates heat -- changed in several regions of Pakistan over a 32-day period between July 11 pre-flood and August 12 post-flood.
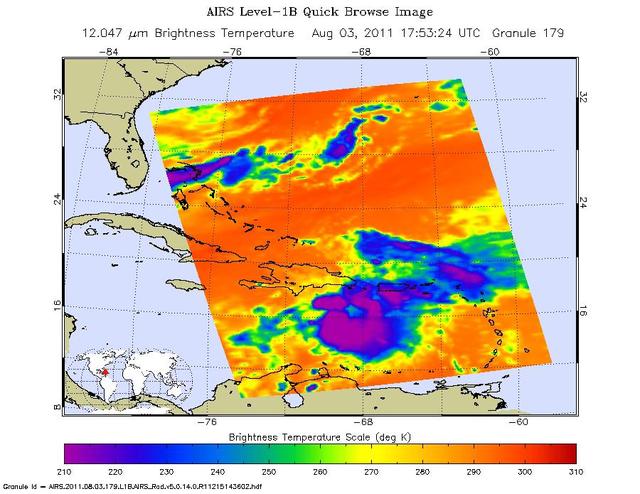
Tropical Storm Emily continues its march toward Hispaniola, which it is expected to reach later on Aug. 3. NASA Aqua spacecraft captured this infrared image 1:53 p.m. EDT on Aug. 3, with the storm located south of Santo Domingo, Dominican Republic.
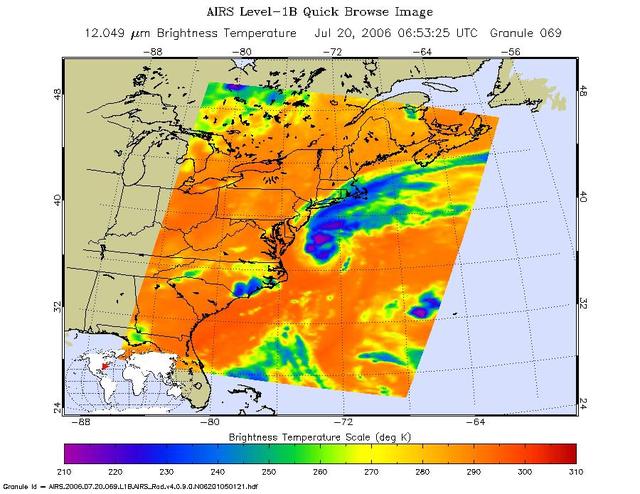
This is an AIRS infrared image of Tropical Storm Beryl in the western Atlantic, from the NASA Aqua satellite on July 20, 2006, 1:30 am local time. The image shows the temperature of the cloud tops or the surface of the Earth in cloud-free regions.
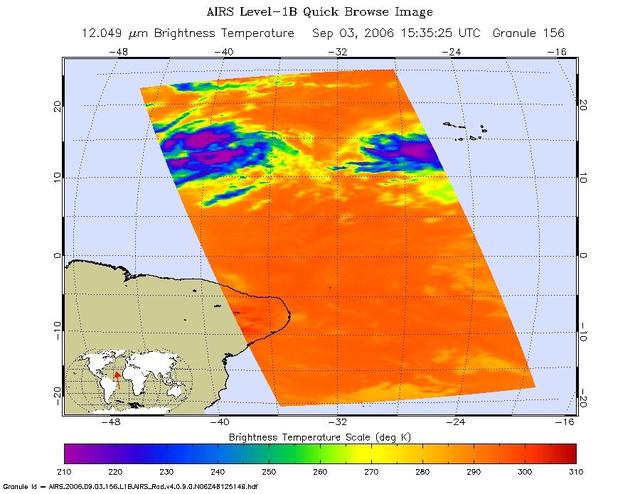
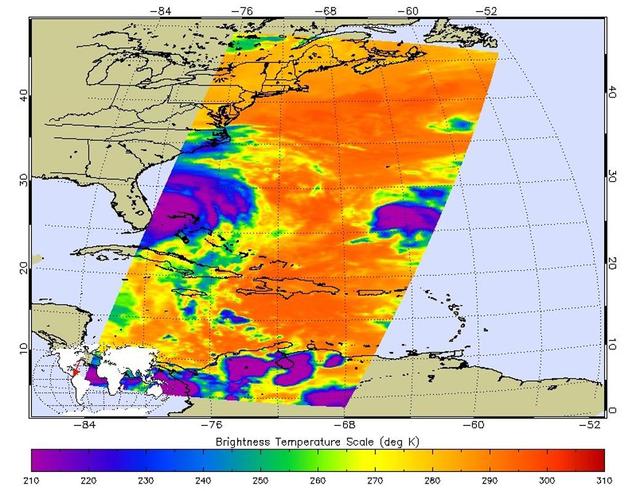
This infrared image shows Tropical Depression 6 Florence in the Atlantic, from the Atmospheric Infrared Sounder AIRS on NASA Aqua satellite in September, 2006. Because infrared radiation does not penetrate through clouds, AIRS infrared images show either the temperature of the cloud tops or the surface of the Earth in cloud-free regions. The lowest temperatures (in purple) are associated with high, cold cloud tops that make up the top of the storm. In cloud-free areas the AIRS instrument will receive the infrared radiation from the surface of the Earth, resulting in the warmest temperatures (orange/red). http://photojournal.jpl.nasa.gov/catalog/PIA00512
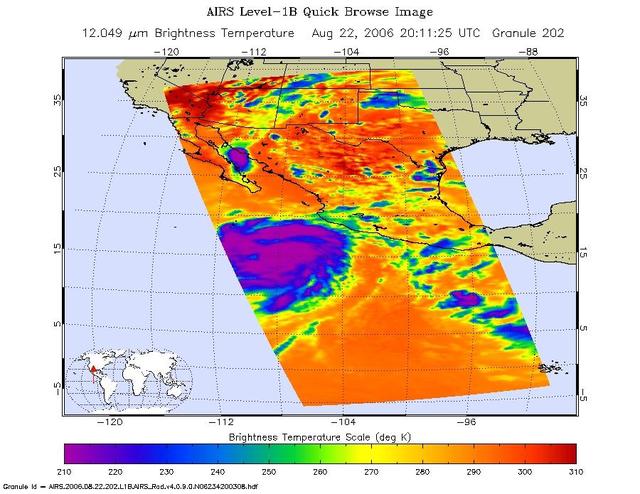
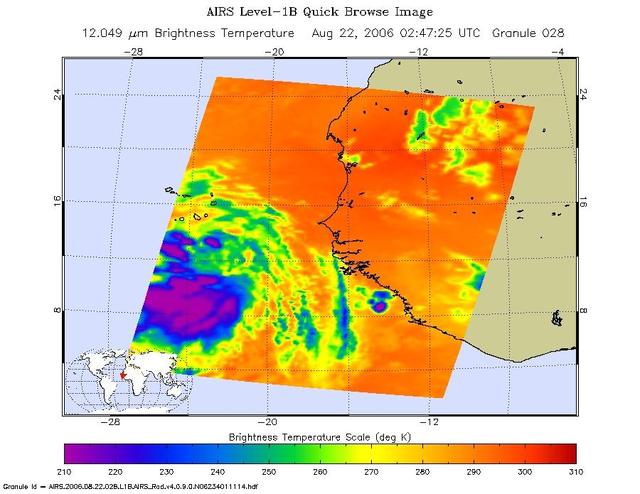
This is an infrared image of Hurricane Ileana in the Eastern Pacific, from the Atmospheric Infrared Sounder (AIRS) on NASA's Aqua satellite on August 22, 2006. This AIRS image shows the temperature of the cloud tops or the surface of the Earth in cloud-free regions. The lowest temperatures (in purple) are associated with high, cold cloud tops that make up the top of the storm. The infrared signal does not penetrate through clouds. Where there are no clouds the AIRS instrument reads the infrared signal from the surface of the Earth, revealing warmer temperatures (red). http://photojournal.jpl.nasa.gov/catalog/PIA00509
In July of 2005, a continent-sized cloud of hot air and dust originating from the Sahara Desert crossed the Atlantic Ocean and headed towards Florida and the Caribbean, captured by the Atmospheric Infrared Sounder onboard NASA Aqua satellite. A Saharan Air Layer, or SAL, forms when dry air and dust rise from Africa's west coast and ride the trade winds above the Atlantic Ocean. These dust clouds are not uncommon, especially during the months of July and August. They start when weather patterns called tropical waves pick up dust from the desert in North Africa, carry it a couple of miles into the atmosphere and drift westward. http://photojournal.jpl.nasa.gov/catalog/PIA00448
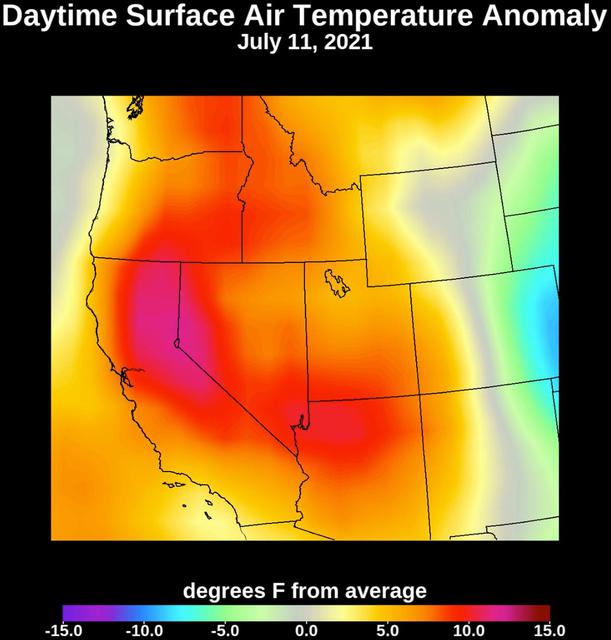
Collecting temperature readings in the atmosphere and at the surface, NASA's Atmospheric Infrared Sounder (AIRS) instrument aboard the agency's Aqua satellite captured the progression of a slow-moving heat dome across the southwestern U.S. from July 1 to July 12, 2021. The animation of the AIRS data shows surface air temperature anomalies – values above or below long-term averages. The hottest areas, shown in pink, experienced surface air temperatures more than 10 degrees Fahrenheit (5.6 degrees Celsius) above average. Surface air temperature is something that people directly feel when they are outside. Animation available at https://photojournal.jpl.nasa.gov/catalog/PIA23693
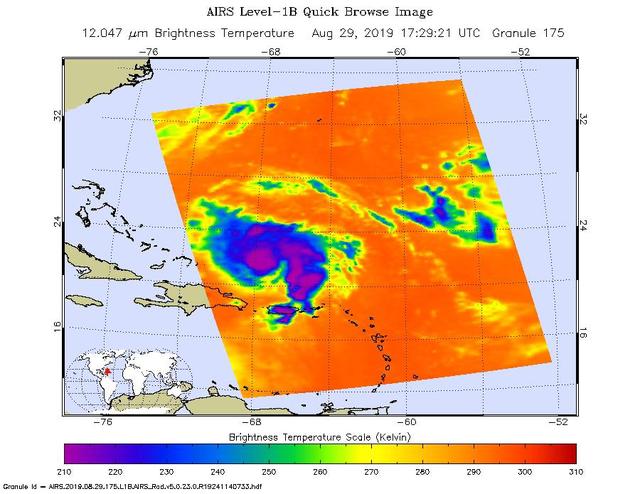
An infrared image of Hurricane Dorian, as seen by the AIRS instrument aboard NASA's Aqua satellite at 1:30 p.m. EDT (10:30 a.m. PDT) on Aug. 29, 2019. The large purple areas are cold clouds, carried high into the atmosphere by deep thunderstorms. Blue and green show warmer areas with less rain clouds, while orange and red represent mostly cloud-free air. https://photojournal.jpl.nasa.gov/catalog/PIA23358
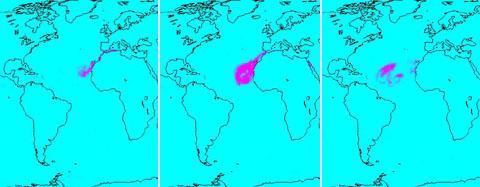
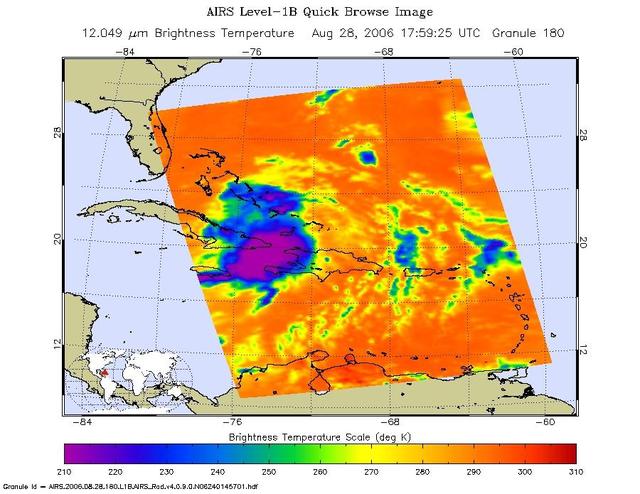
These images show Tropical Depression Debbie in the Atlantic, from the Atmospheric Infrared Sounder (AIRS) on NASA's Aqua satellite on August 22, 2006. This AIRS image shows the temperature of the cloud tops or the surface of the Earth in cloud-free regions. The lowest temperatures (in purple) are associated with high, cold cloud tops that make up the top of the storm. The infrared signal does not penetrate through clouds. Where there are no clouds the AIRS instrument reads the infrared signal from the surface of the Earth, revealing warmer temperatures (red). At the time the data were taken from which these images were made the eye had not yet opened but the storm is now well organized. The location of the future eye appears as a circle at 275 K brightness temperature in the microwave image just to the SE of the Azores. http://photojournal.jpl.nasa.gov/catalog/PIA00508
Since the start of 2023 California has been drenched by a series of storms being transported by an atmospheric river – a relatively narrow, windy region in Earth's atmosphere that can transport moisture or tiny particles for thousands of miles, much like a river on land moves water. NASA's Atmospheric Infrared Sounder (AIRS) captured the series of storms as they dumped record amounts of rain in some parts of California, caused flooding, and damaged infrastructure. Forecasts say this pattern of storms will continue through the week of Jan. 9. The images show cloud temperatures taken at infrared wavelengths not visible to the human eye. Purple and violet areas are colder, between about minus 82 degrees Fahrenheit and minus 46 degrees Fahrenheit (minus 63 degrees Celsius to minus 44 degrees Celsius), than blue and green regions which are roughly minus 28 degrees Fahrenheit to 26 degrees Fahrenheit (minus 33 degrees Celsius to minus 3 degrees Celsius). Warmer red sections are between roughly 62 degrees Fahrenheit and 80 degrees Fahrenheit (17 degrees Celsius to 27 degrees Celsius), representing mostly cloud-free air. The cooler parts of the clouds are associated with very heavy rainfall. White patches represent gaps in satellite coverage. Located aboard the Aqua satellite AIRS, in conjunction with the Advanced Microwave Sounding Unit (AMSU), senses emitted infrared and microwave radiation from Earth to provide a 3D look at the planet's weather and climate. Working in tandem, the two instruments make simultaneous observations down to Earth's surface. With more than 2,000 channels sensing different regions of the atmosphere, the system creates a global, 3D map of atmospheric temperature and humidity, cloud amounts and heights, greenhouse gas concentrations, and many other atmospheric phenomena. Launched into Earth orbit in 2002 aboard NASA's Aqua spacecraft, the AIRS and AMSU instruments are managed by NASA's Jet Propulsion Laboratory in Southern California, under contract to NASA. JPL is a division of Caltech. Animation available at https://photojournal.jpl.nasa.gov/catalog/PIA25597
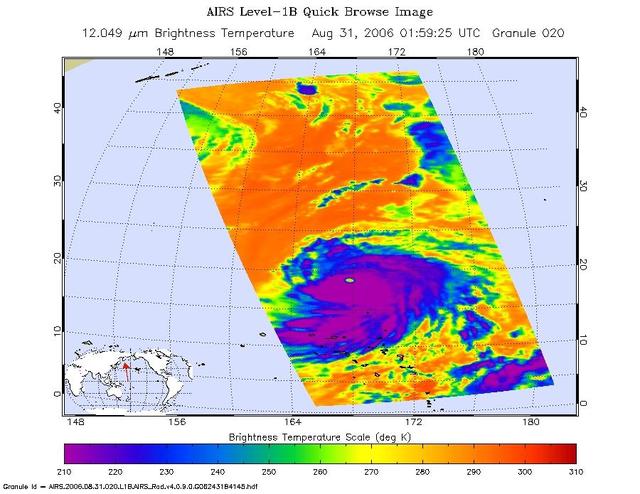
This infrared image shows Typhoon Ioke in the Western Pacific, from the Atmospheric Infrared Sounder AIRS on NASA Aqua satellite in August, 2006. Because infrared radiation does not penetrate through clouds, AIRS infrared images show either the temperature of the cloud tops or the surface of the Earth in cloud-free regions. The lowest temperatures (in purple) are associated with high, cold cloud tops that make up the top of the storm. In cloud-free areas the AIRS instrument will receive the infrared radiation from the surface of the Earth, resulting in the warmest temperatures (orange/red). http://photojournal.jpl.nasa.gov/catalog/PIA00511
This infrared image shows Tropical Storm Ernesto over Cuba, from the Atmospheric Infrared Sounder AIRS on NASA Aqua satellite in August, 2006. Because infrared radiation does not penetrate through clouds, AIRS infrared images show either the temperature of the cloud tops or the surface of the Earth in cloud-free regions. The lowest temperatures (in purple) are associated with high, cold cloud tops that make up the top of the storm. In cloud-free areas the AIRS instrument will receive the infrared radiation from the surface of the Earth, resulting in the warmest temperatures (orange/red). http://photojournal.jpl.nasa.gov/catalog/PIA00510
At 11:29 p.m. PDT on Oct. 6 (2:29 a.m. EDT on Oct. 7), NASA's Atmospheric Infrared Sounder (AIRS) instrument on NASA's Aqua satellite produced this false-color infrared image of Matthew as the storm moved up Florida's central coast. The image shows the temperature of Matthew's cloud tops or the surface of Earth in cloud-free regions, with the most intense thunderstorms shown in purples and blues. http://photojournal.jpl.nasa.gov/catalog/PIA21097
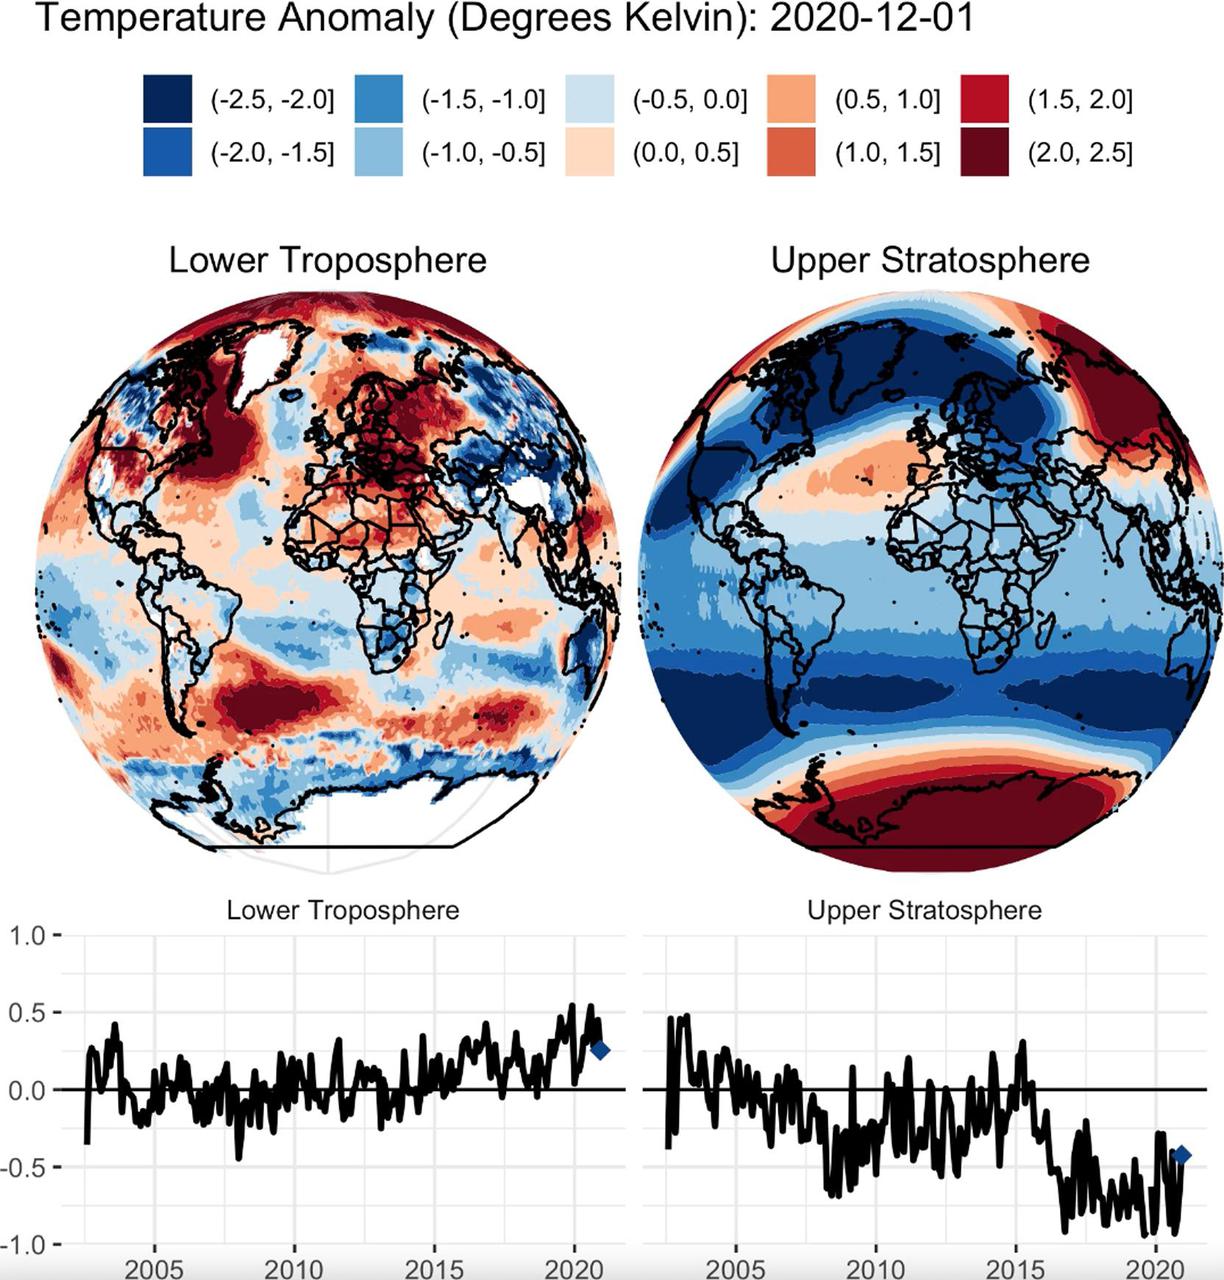
This animation shows a nearly 20-year record of temperature anomalies for two layers in Earth's atmosphere: the lower troposphere, where most of the planet's weather occurs; and the upper stratosphere, which contains the ozone layer. NASA's Atmospheric Infrared Sounder (AIRS), aboard the Aqua satellite, captured these measurements from 2002 to 2020. Preliminary data analysis shows a warming trend for the lower troposphere, and a strong cooling trend in the upper stratosphere. The globes show a map of where warmer than average or cooler than average temperatures for each atmospheric layer occurred during this time period. The line graphs show the deviation of temperatures averaged over the entire planet for the lower troposphere and upper stratosphere. AIRS, in conjunction with the Advanced Microwave Sounding Unit (AMSU), senses emitted infrared and microwave radiation from Earth to provide a three-dimensional look at the planet's weather and climate. Working in tandem, the two instruments make simultaneous observations down to Earth's surface. With more than 2,000 channels sensing different regions of the atmosphere, the system creates a global, three-dimensional map of atmospheric temperature and humidity, cloud amounts and heights, greenhouse gas concentrations and many other atmospheric phenomena. Launched into Earth orbit in 2002 aboard NASA's Aqua spacecraft, the AIRS and AMSU instruments are managed by NASA's Jet Propulsion Laboratory in Southern California, under contract to NASA. JPL is a division of Caltech. Movie available at https://photojournal.jpl.nasa.gov/catalog/PIA24139
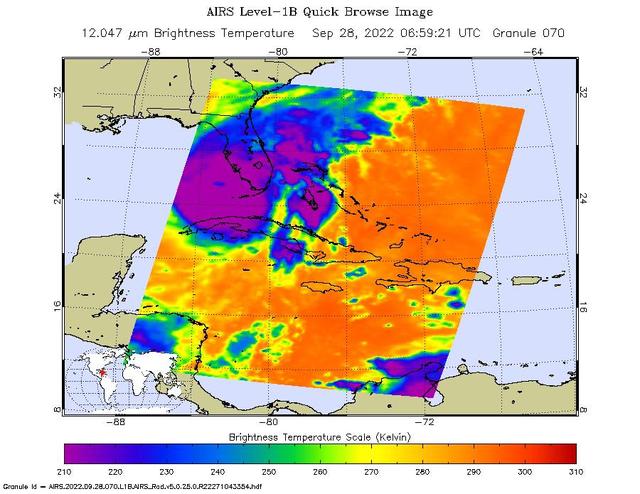
NASA's Atmospheric Infrared Sounder (AIRS) instrument aboard the Aqua satellite captured imagery of Hurricane Ian over the Gulf of Mexico between Cuba and Florida just before 2 a.m. local time Sept. 28, 2022. At that time, the Category 3 storm was in a period of rapid intensification – when a hurricane's wind speeds increase by 35 mph (56 kph) or more within 24 hours – while moving northward toward Florida after having recently made landfall over western Cuba. The image shows cloud or surface temperature measurements taken at infrared wavelengths. The large purple area indicates very cold clouds at about minus 90 degrees Fahrenheit (minus 67 degrees Celsius, or around 210 Kelvin on the map's scale). These clouds are carried high into the atmosphere by tall thunderstorms and are associated with very heavy rainfall. Warmer areas with shallower rain clouds are shown in blue and green. The orange and red areas represent mostly cloud-free air. The eye of the hurricane is seen as a small blue area in the middle of the large purple patch. AIRS, in conjunction with the Advanced Microwave Sounding Unit (AMSU), senses emitted infrared and microwave radiation from Earth to provide a 3D look at the planet's weather and climate. Working in tandem, the two instruments make simultaneous observations down to Earth's surface. With more than 2,000 channels sensing different regions of the atmosphere, the system creates a global, 3D map of atmospheric temperature and humidity, cloud amounts and heights, greenhouse gas concentrations, and many other atmospheric phenomena. Launched into Earth orbit in 2002 aboard NASA's Aqua spacecraft, the AIRS and AMSU instruments are managed by NASA's Jet Propulsion Laboratory in Southern California, under contract to NASA. JPL is a division of Caltech. https://photojournal.jpl.nasa.gov/catalog/PIA24908
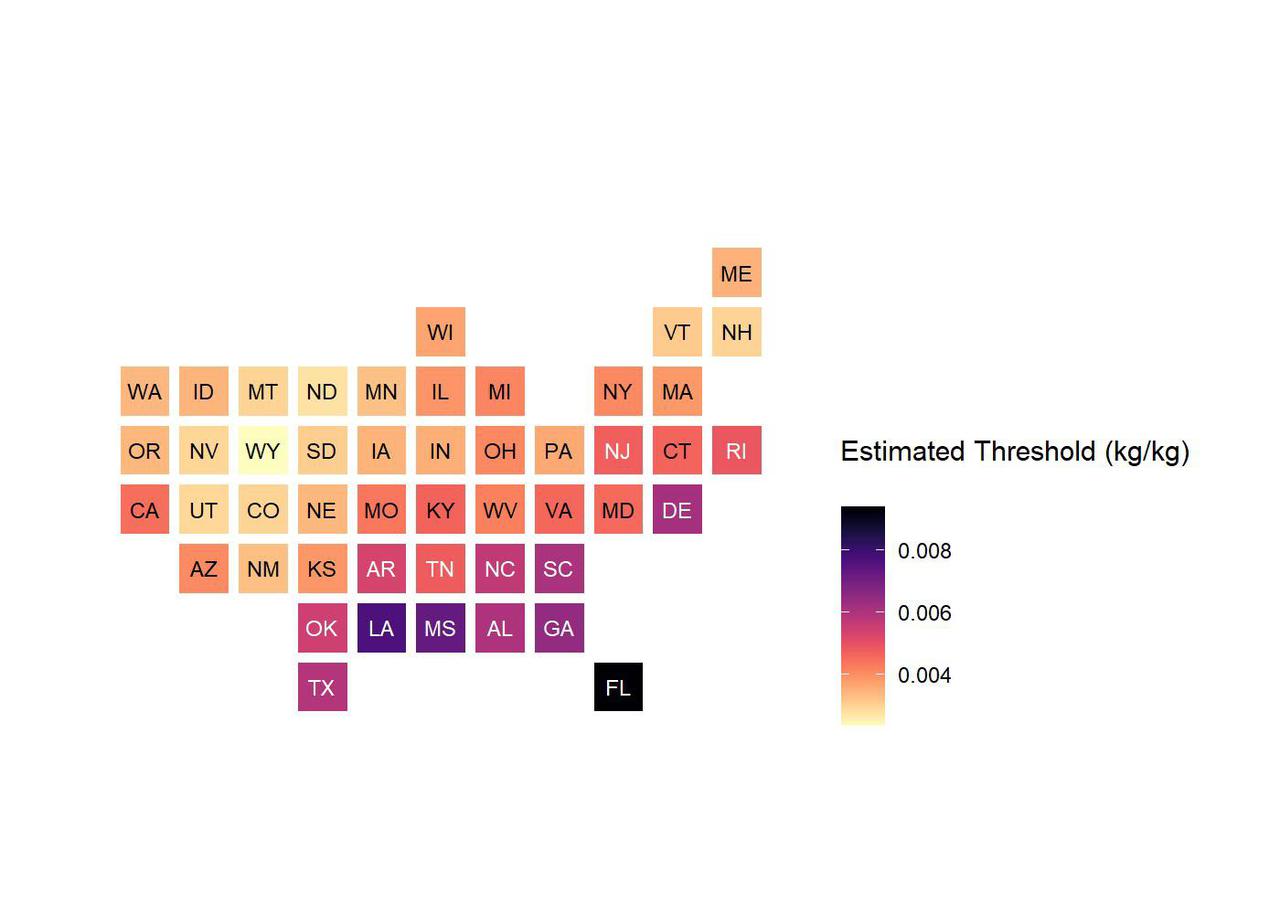
This chart shows low-humidity thresholds that signal flu outbreaks in 48 U.S. states, calculated using water vapor data from NASA's Atmospheric Infrared Sounder (AIRS) instrument on the Aqua satellite with data on U.S. flu cases from 2003 to 2015. The color range from lighter to darker indicates lower to higher humidity thresholds, with the driest state, Wyoming, having the lowest threshold and Florida the highest. Units are kilograms of water per kilogram of air. https://photojournal.jpl.nasa.gov/catalog/PIA24986
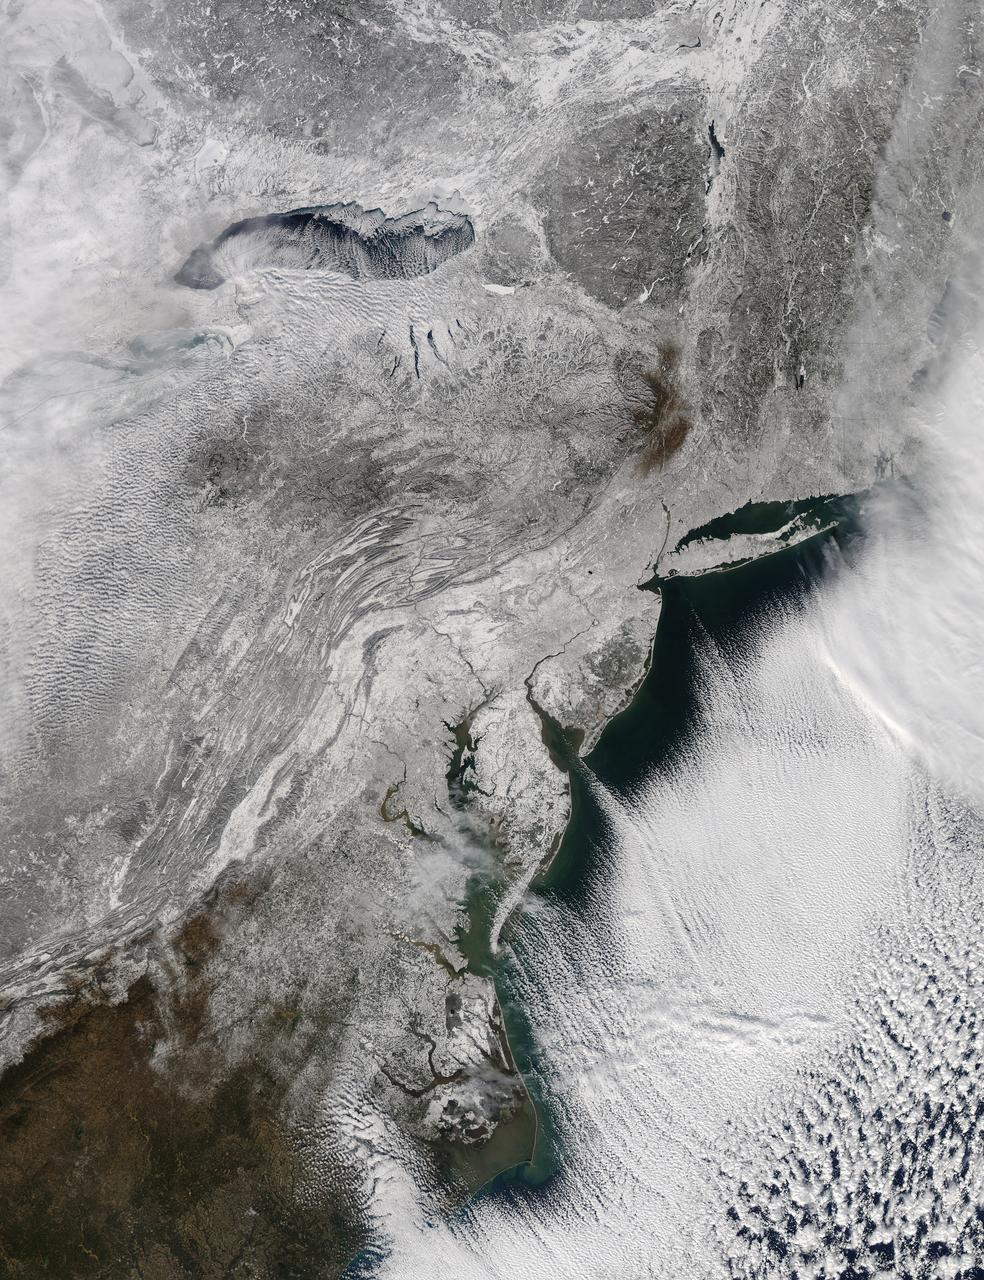
The storm system that moved through the northeastern U.S. dropped large snowfall totals up to a foot in southern New England to a couple of inches in Virginia. On January 22, 2014, the day after the event, the Moderate Resolution Imaging Spectroradiometer instrument that flies aboard NASA's Aqua satellite captured this image of the snowfall at 18:10 UTC/1:10 p.m. EST. In the image, snowfall covers the ground in all six New England states, New York, Pennsylvania, New Jersey, Delaware, Maryland, West Virginia, Ohio, Virginia, Washington, D.C. and North Carolina. Image Credit: NASA Goddard MODIS Rapid Response Team Text: Rob Gutro, NASA Goddard Space Flight Center <b><a href="http://www.nasa.gov/audience/formedia/features/MP_Photo_Guidelines.html" rel="nofollow">NASA image use policy.</a></b> <b><a href="http://www.nasa.gov/centers/goddard/home/index.html" rel="nofollow">NASA Goddard Space Flight Center</a></b> enables NASA’s mission through four scientific endeavors: Earth Science, Heliophysics, Solar System Exploration, and Astrophysics. Goddard plays a leading role in NASA’s accomplishments by contributing compelling scientific knowledge to advance the Agency’s mission. <b>Follow us on <a href="http://twitter.com/NASAGoddardPix" rel="nofollow">Twitter</a></b> <b>Like us on <a href="http://www.facebook.com/pages/Greenbelt-MD/NASA-Goddard/395013845897?ref=tsd" rel="nofollow">Facebook</a></b> <b>Find us on <a href="http://instagram.com/nasagoddard?vm=grid" rel="nofollow">Instagram</a></b>
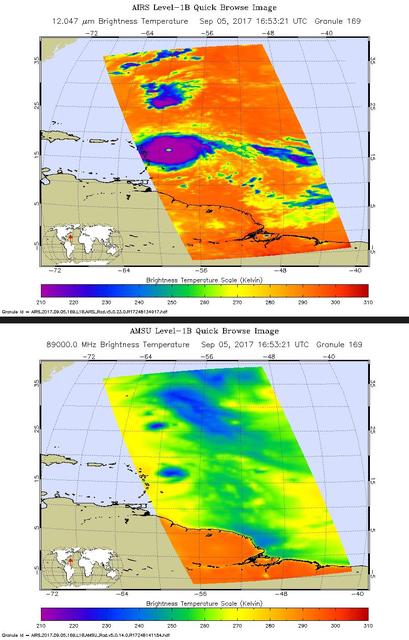
Hurricane Irma is the strongest hurricane ever recorded outside the Caribbean Sea and Gulf of Mexico. These two images from the Atmospheric Infrared Sounder (AIRS) instrument aboard NASA's Aqua satellite show what Hurricane Irma looked like when Aqua passed overhead just before 1 p.m. local time (10 a.m. PDT) on Sept. 5, 2017. Forecasts at the National Hurricane Center have Irma passing near the major islands to its west before turning northward near Florida this weekend. The first image (top) is an infrared snapshot from AIRS (see Figure 1 for larger image). In orange and red areas, the ocean surface shines through, while blue and purple areas represent cold, high clouds that obscure what lies below. Typical of well-developed hurricanes, Irma is nearly circular with a well-defined eye at its center. The eye is about 25 miles (40 kilometers) in diameter. Careful scrutiny shows a red pixel in the center of the eye, which means that AIRS achieved a bulls-eye with one of its "looks" and was able to see to the ocean between the dense clouds in the eye wall. The second image (bottom) shows the view through AIRS' microwave-colored "lenses" (see Figure 2 for larger image). Here the ocean surface looks yellow, while green represents various degrees of cloudiness. Blue shows areas where it is raining heavily. The eye is not apparent in this image because the "pixel size" of the microwave sounder, about 30 miles (50 kilometers), is larger than the eye and therefore cannot "thread the needle." The infrared sounder, on the other hand, has a pixel size of only 10 miles (16.5 kilometers) and can distinguish the small eye. https://photojournal.jpl.nasa.gov/catalog/PIA21941
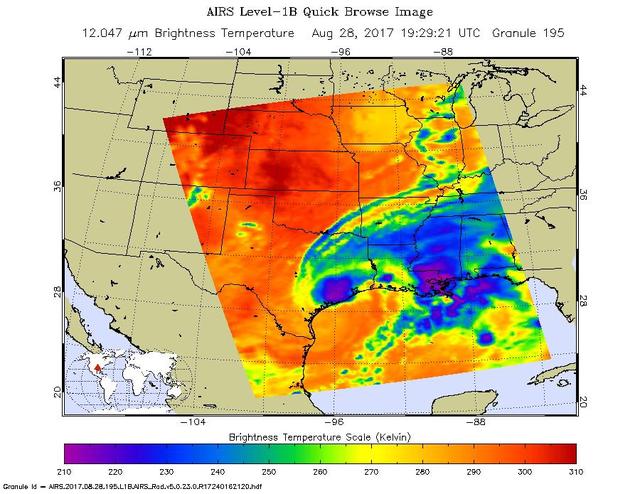
The latest infrared image from NASA's Atmospheric Infrared Sounder (AIRS) instrument aboard NASA's Aqua satellite illustrates the growing flood threat from now Tropical Storm Harvey. In the false-color image, acquired at 2:29 p.m. CDT (19:29 UTC) on Aug. 28, 2017, a large area of dark blue and purple centered along the southeastern Texas coast denotes the coldest cloud top temperatures and strongest thunderstorms. A second area of intense precipitation is visible over southeastern Louisiana. Harvey has reemerged over the Gulf of Mexico, but the National Hurricane Center forecasts only a small amount of strengthening before the storm moves slowly north and inland again. https://photojournal.jpl.nasa.gov/catalog/PIA21885
This image shows how a partial solar eclipse darkened clouds over the Yukon and British Columbia in western Canada. It was taken on Oct. 23 at 21:20 UTC (5:20 p.m. EDT) by the Moderate Resolution Imaging Spectroradiometer instrument that flies aboard NASA's Aqua satellite. Credit: NASA Goddard MODIS Rapid Response Team Unlabeled image <b><a href="http://www.nasa.gov/audience/formedia/features/MP_Photo_Guidelines.html" rel="nofollow">NASA image use policy.</a></b> <b><a href="http://www.nasa.gov/centers/goddard/home/index.html" rel="nofollow">NASA Goddard Space Flight Center</a></b> enables NASA’s mission through four scientific endeavors: Earth Science, Heliophysics, Solar System Exploration, and Astrophysics. Goddard plays a leading role in NASA’s accomplishments by contributing compelling scientific knowledge to advance the Agency’s mission. <b>Follow us on <a href="http://twitter.com/NASAGoddardPix" rel="nofollow">Twitter</a></b> <b>Like us on <a href="http://www.facebook.com/pages/Greenbelt-MD/NASA-Goddard/395013845897?ref=tsd" rel="nofollow">Facebook</a></b> <b>Find us on <a href="http://instagram.com/nasagoddard?vm=grid" rel="nofollow">Instagram</a></b>
This image shows how the partial solar eclipse darkened clouds over Alaska. It was taken on Oct. 23 at 21:10 UTC (5:10 p.m. EDT) by the Moderate Resolution Imaging Spectroradiometer instrument that flies aboard NASA's Aqua satellite. Credit: NASA Goddard MODIS Rapid Response Team <b><a href="http://www.nasa.gov/audience/formedia/features/MP_Photo_Guidelines.html" rel="nofollow">NASA image use policy.</a></b> <b><a href="http://www.nasa.gov/centers/goddard/home/index.html" rel="nofollow">NASA Goddard Space Flight Center</a></b> enables NASA’s mission through four scientific endeavors: Earth Science, Heliophysics, Solar System Exploration, and Astrophysics. Goddard plays a leading role in NASA’s accomplishments by contributing compelling scientific knowledge to advance the Agency’s mission. <b>Follow us on <a href="http://twitter.com/NASAGoddardPix" rel="nofollow">Twitter</a></b> <b>Like us on <a href="http://www.facebook.com/pages/Greenbelt-MD/NASA-Goddard/395013845897?ref=tsd" rel="nofollow">Facebook</a></b> <b>Find us on <a href="http://instagram.com/nasagoddard?vm=grid" rel="nofollow">Instagram</a></b>
The MODIS instrument aboard NASA's Aqua satellite captured this visible image of Super Typhoon Vongfong on Oct. 9 at 04:25 UTC (12:25 a.m. EDT as it moved north through the Philippine Sea. Credit: NASA Goddard MODIS Rapid Response Team --- Vongfong weakened to a Category 4 typhoon on the Saffir-Simpson scale on Thursday, October 9, with maximum sustained winds near 130 knots (149.6 mph/240.8 kph), down from a Category 5 typhoon on Oct. 8. Forecasters at the Joint Typhoon Warning Center predict slow weakening over the next several days. Vongfong was centered near 20.6 north and 129.5 east, about 384 nautical miles south-southeast of Kadena Air Base, Okinawa, Japan. It is moving to the north-northwest at 7 knots (8 mph/12.9 kph) and generating 44 foot (13.4 meter) high seas. For warnings and watches, visit the Japan Meteorological Agency website at: <a href="http://www.jma.go.jp/en/typh/" rel="nofollow">www.jma.go.jp/en/typh/</a>. Vongfong is forecast to continue moving north through the Philippine Sea and is expected to pass just to the east of Kadena Air Base, then track over Amami Oshima before making landfall in Kyushu and moving over the other three big islands of Japan. Residents of all of these islands should prepare for typhoon conditions beginning on October 10. Read more: <a href="http://1.usa.gov/1s0CCQy" rel="nofollow">1.usa.gov/1s0CCQy</a> <b><a href="http://www.nasa.gov/audience/formedia/features/MP_Photo_Guidelines.html" rel="nofollow">NASA image use policy.</a></b> <b><a href="http://www.nasa.gov/centers/goddard/home/index.html" rel="nofollow">NASA Goddard Space Flight Center</a></b> enables NASA’s mission through four scientific endeavors: Earth Science, Heliophysics, Solar System Exploration, and Astrophysics. Goddard plays a leading role in NASA’s accomplishments by contributing compelling scientific knowledge to advance the Agency’s mission. <b>Follow us on <a href="http://twitter.com/NASAGoddardPix" rel="nofollow">Twitter</a></b> <b>Like us on <a href="http://www.facebook.com/pages/Greenbelt-MD/NASA-Goddard/395013845897?ref=tsd" rel="nofollow">Facebook</a></b> <b>Find us on <a href="http://instagram.com/nasagoddard?vm=grid" rel="nofollow">Instagram</a></b>
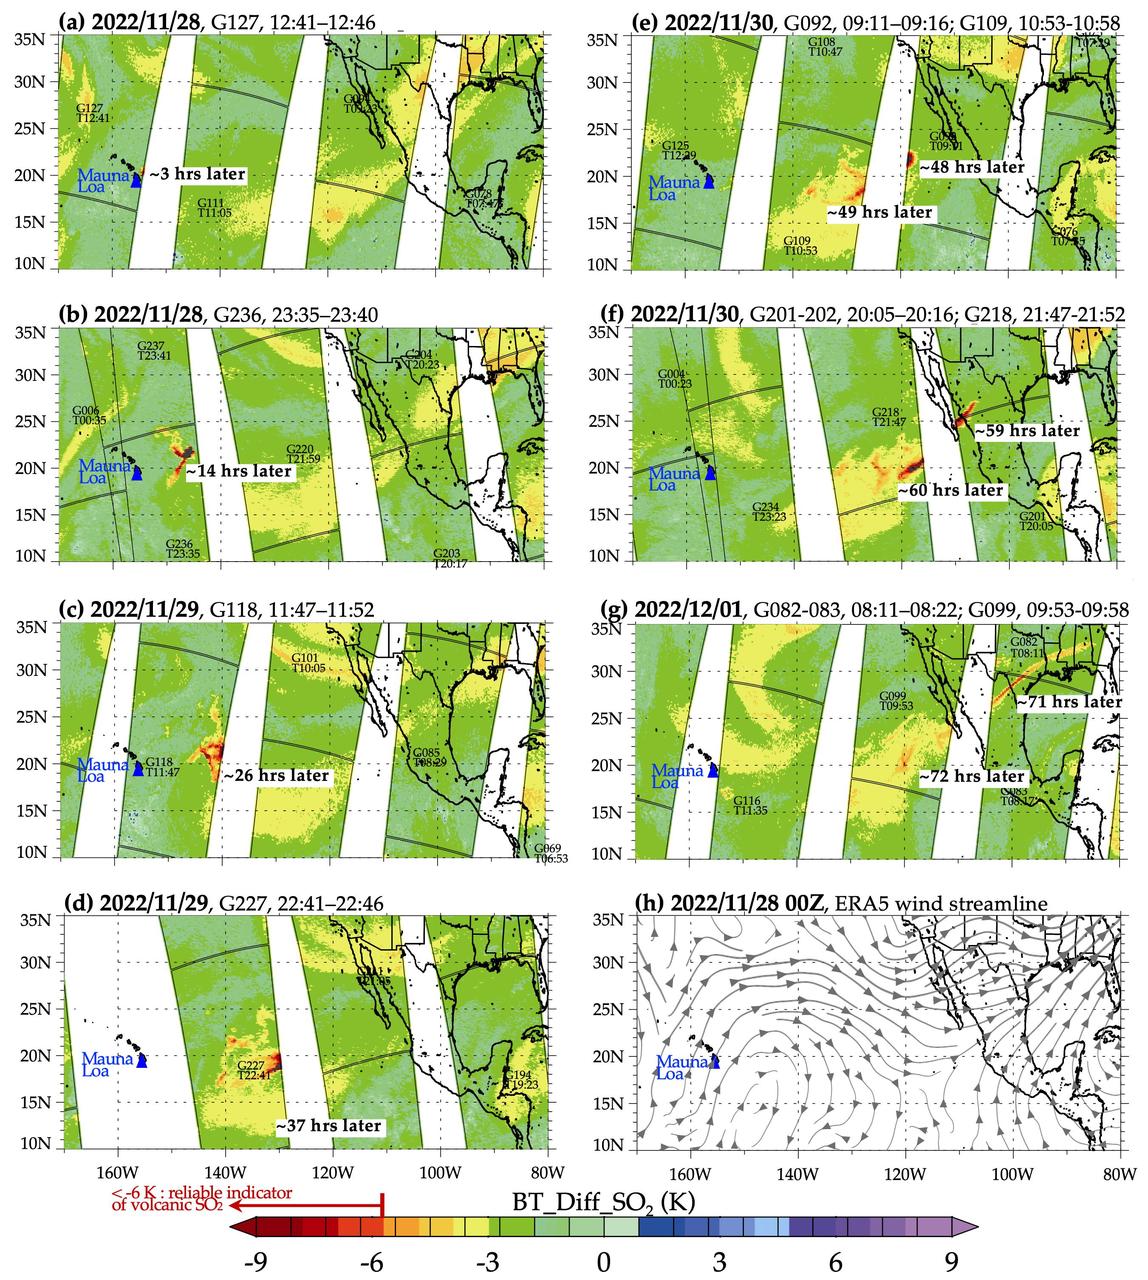
The Atmospheric Infrared Sounder (AIRS) instrument aboard NASA's Aqua satellite detected volcanic sulfur dioxide (SO₂) plumes emanating from Hawaii's Mauna Loa volcano, which started erupting late Sunday, Nov. 27, 2022, at 11:30 p.m. Hawaiian Standard Time (9:30 a.m. UTC, Nov. 28). The AIRS images shown here were taken from seven overpasses, capturing the SO₂ volcanic plumes and its pathways since the eruption. Starting from the upper left frame — captured at 2:41 a.m. HST (12:41 UTC) on Nov. 28, around three hours after the eruption began — a red patch that represents an SO₂ plume can be seen east of the volcano, which is shown as a blue triangle, then moving east and diffusing through subsequent frames. By 71 hours after the eruption, the eastern part of the plume is over the southeastern United States. SO₂ can be harmful to the human respiratory system when inhaled. In the atmosphere, it can also lead to the formation of other gaseous sulfur oxides (SOₓ). These substances can react with other chemicals to form particulate-matter pollution, which can cause breathing problems, contribute to acid rain, and reduce sky visibility. AIRS measures the amount of radiation reaching the instrument from the top of the atmosphere at more than 2,000 different wavelengths. Brightness temperature (BT) is a measure of the amount of radiation, and the images show the difference between BT observed at two different wavelengths. One of the wavelengths is sensitive to atmospheric SO₂, and the other is not, so the difference between the two measurements can give a reliable signal of volcanic SO₂ plumes. A fully automated volcanic plume detection rapid response system that uses AIRS data has been developed at the Jet Propulsion Laboratory in Southern California. This tool is available at the AIRS Rapid Response website, where detections of the most recent volcanic SO₂, dust, and clouds, in visible and infrared images, are updated in near real-time when a volcanic event anywhere on Earth triggers the system. AIRS historical detections of volcanic SO₂ and dust are archived on the site at https://airs.jpl.nasa.gov/volcanic_plumes/. AIRS, in conjunction with the Advanced Microwave Sounding Unit (AMSU), senses emitted infrared and microwave radiation from Earth to provide a three-dimensional look at the planet's weather and climate. Working in tandem, the two instruments make simultaneous observations down to Earth's surface. With more than 2,000 channels sensing different regions of the atmosphere, the system creates a global map of atmospheric temperature and humidity, cloud amounts and heights, greenhouse gas concentrations, and many other atmospheric phenomena. Launched into Earth orbit in 2002 aboard NASA's Aqua spacecraft, the AIRS and AMSU instruments are managed by JPL, under contract to NASA. JPL is a division of Caltech. https://photojournal.jpl.nasa.gov/catalog/PIA25562
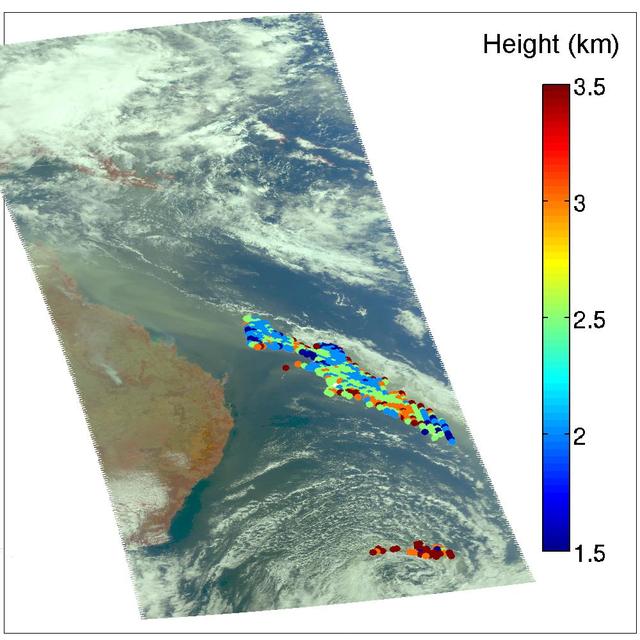
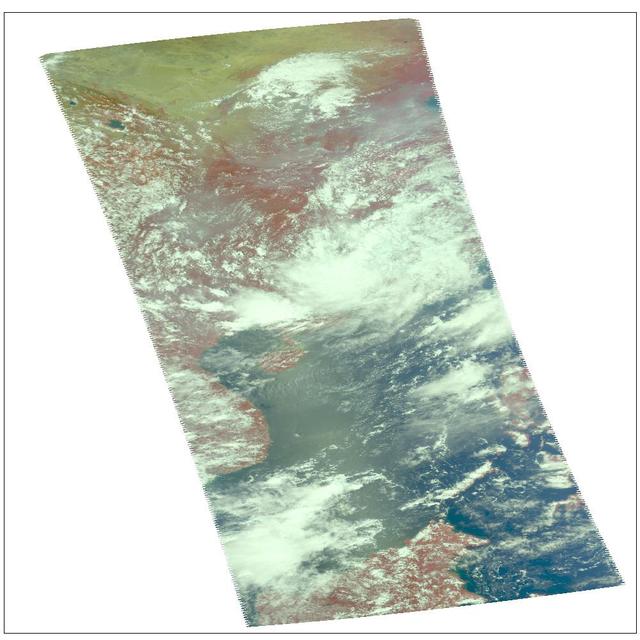
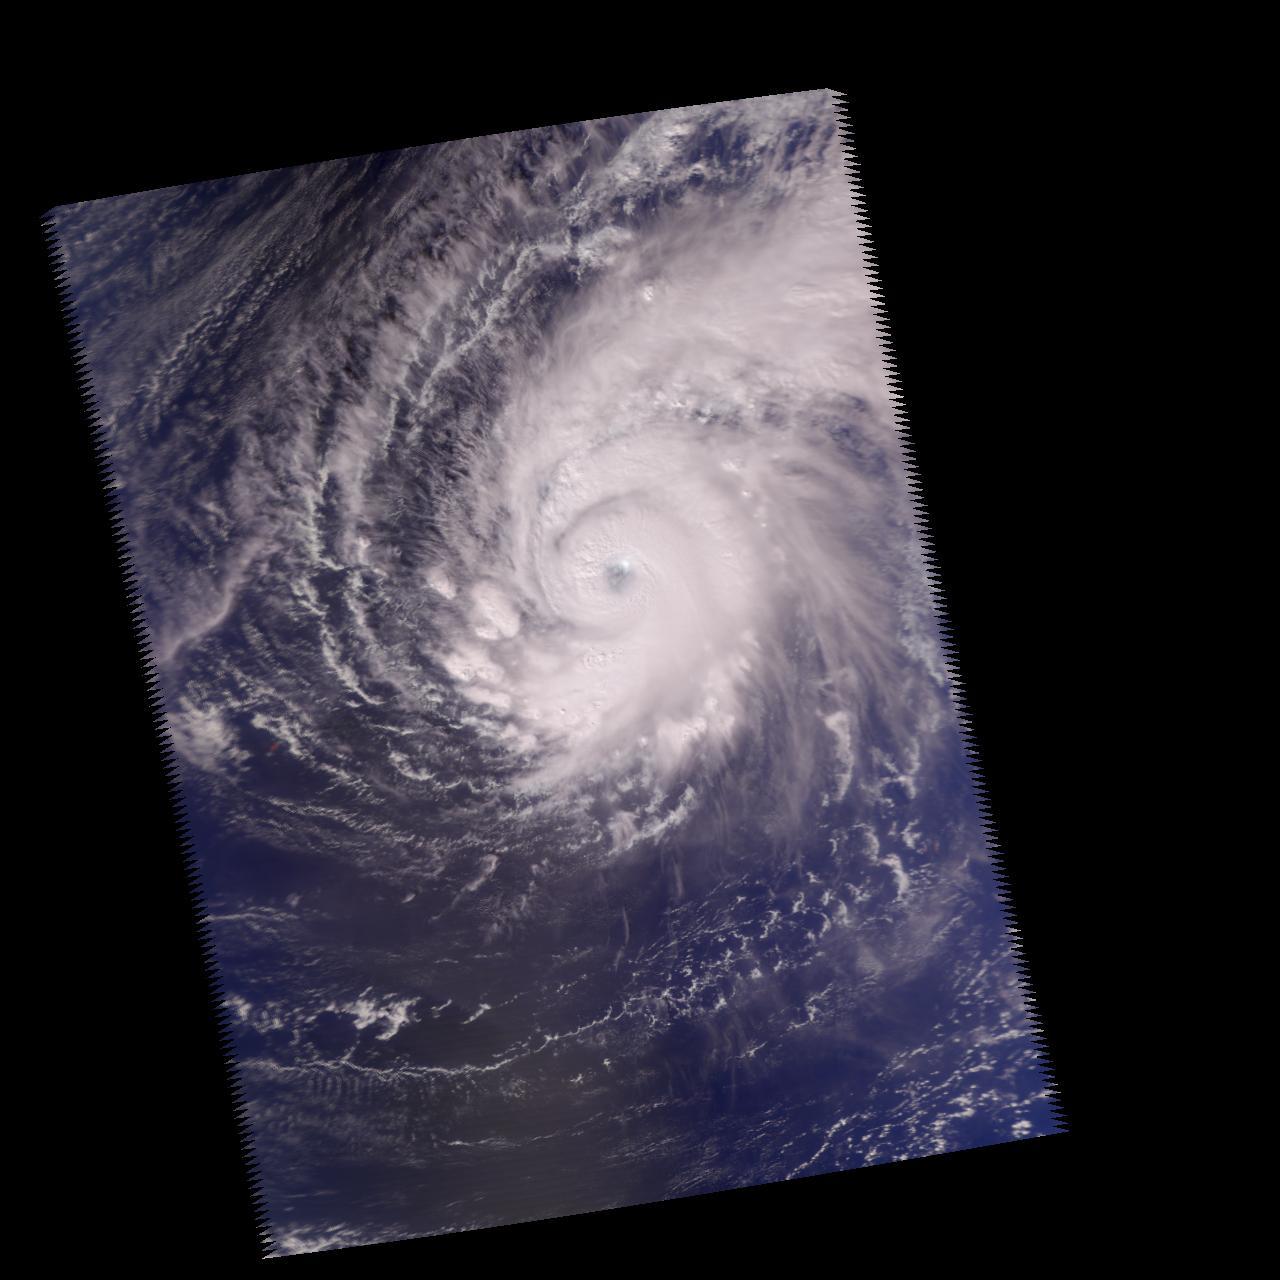
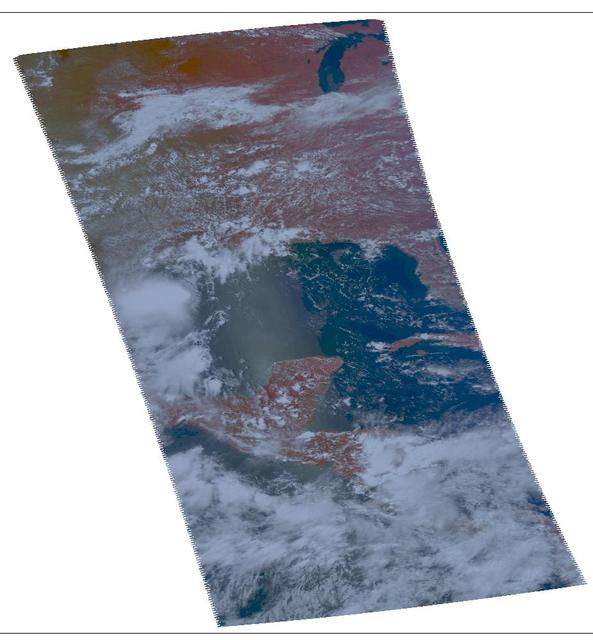
Hurricane Darby as observed by the Atmospheric Infrared Sounder AIRS onboard NASA Aqua in July, 2004. This daylight image of Hurricane Darby on July 28 was made with the visible sensor in the AIRS instrument suite. After reaching sustained winds on July 27 of 100 knots (115 mph) with gusts to 120 knots (138 mph), the intensity of the storm is now lowered to 75 knots (86 mph). Located in the eastern north Pacific Ocean located about 1,165 miles west-southwest of the southern tip of Baja California, the storm continues its west/northwest path at 14 knots (16mph). Figure 1 is a daylight snapshot from AIRS visible/near-infrared sensor before Darby became a tropical storm. Darby is in the upper right-hand corner. Circulation is not apparent because the storm was not organized sufficiently to allow the nascent eye to appear. At this time, winds were approximately 35 mph. Figure 2 is an AIRS infrared image. Darby falls on the edge of two AIRS data granules, which have been "stitched" together in this image. Storm intensity is lowered to 75 knots (86 mph), down from 100 knots (115 mph). http://photojournal.jpl.nasa.gov/catalog/PIA00439
Tropical Storm Blas as observed by the Atmospheric Infrared Sounder AIRS onboard NASA Aqua in the year 2004. The major contribution to radiation (infrared light) that AIRS channels sense comes from different levels in the atmosphere, depending upon the channel wavelength. To create the movie, a set of AIRS channels were selected which probe the atmosphere at progressively deeper levels. If there were no clouds, the color in each frame would be nearly uniform until the Earth's surface is encountered. The tropospheric air temperature warms at a rate of 6 K (about 11 F) for each kilometer of descent toward the surface. Thus the colors would gradually change from cold to warm as the movie progresses. Clouds block the infrared radiation. Thus wherever there are clouds we can penetrate no deeper in infrared. The color remains fixed as the movie progresses, for that area of the image is "stuck" to the cloud top temperature. The coldest temperatures around 220 K (about -65 F) come from altitudes of about 10 miles. http://photojournal.jpl.nasa.gov/catalog/PIA00436
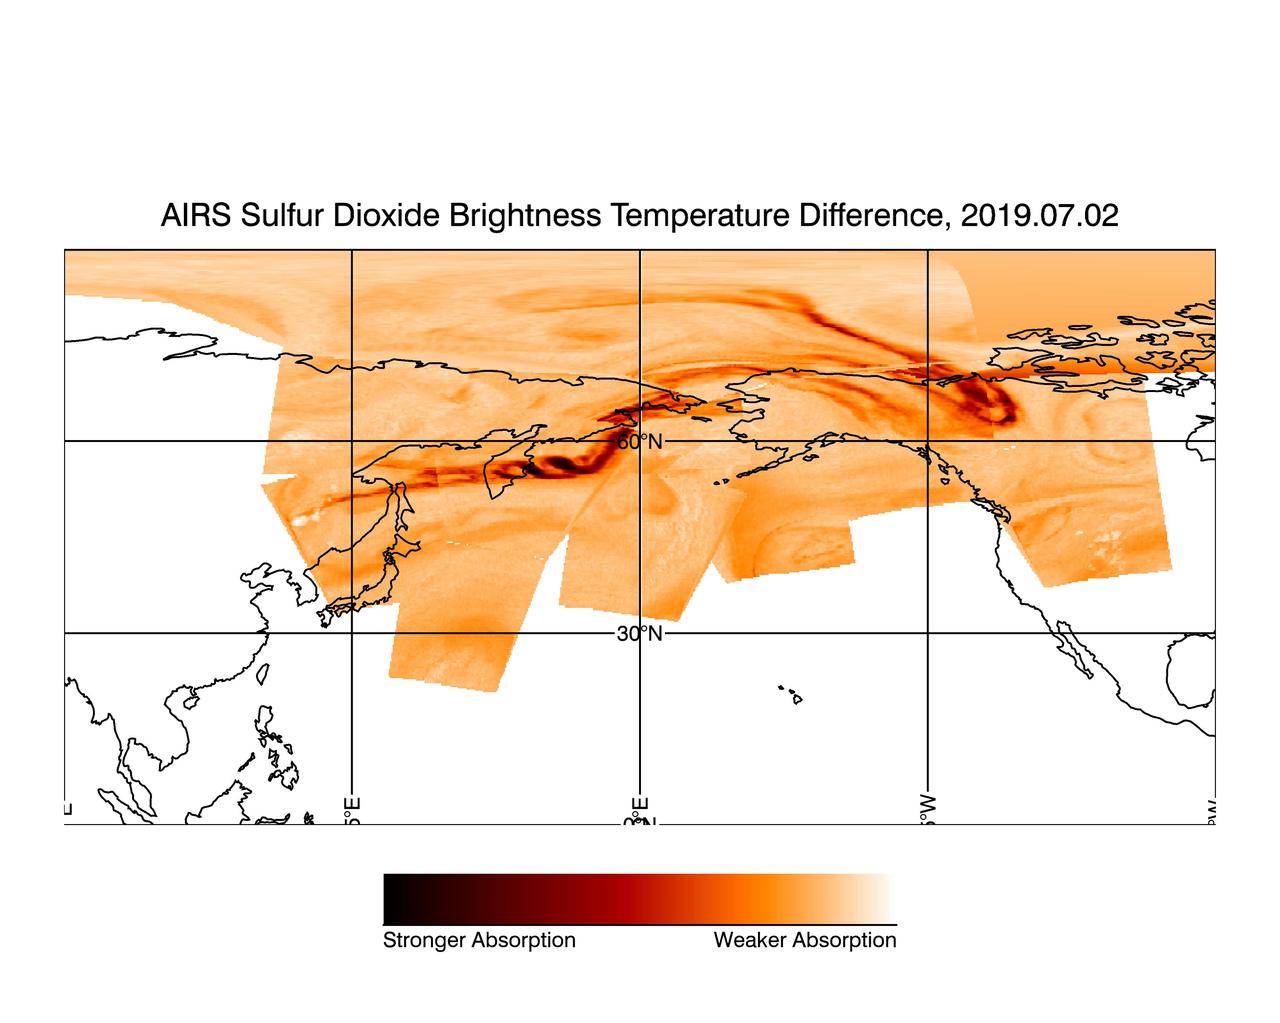
Dormant since 1924, the Raikoke Volcano on Russia's Kuril Islands began erupting on June 22, 2019. In this image made with data from the Atmospheric Infrared Sounder on NASA's Aqua satellite, sulfur dioxide (SO2) in the volcanic plume is observed over several overpasses on July 2, 2019, days after the Raikoke volcanic eruption. SO2 absorbs infrared radiance emitted from Earth's surface and the lower atmosphere in proportion with the quantity of SO2 present in the plume. Areas with higher quantities of sulfur dioxide are shown in dark red while areas with lower quantities of sulfur dioxide are shown in light orange. Areas where data was not included in the image, due to the lack of plume in those regions, are shown in white. The image combines multiple granules of AIRS data taken throughout the day. Each data granule collected by the instrument is outlined in green, with its corresponding time stamp (in UTC) printed in white. https://photojournal.jpl.nasa.gov/catalog/PIA23421
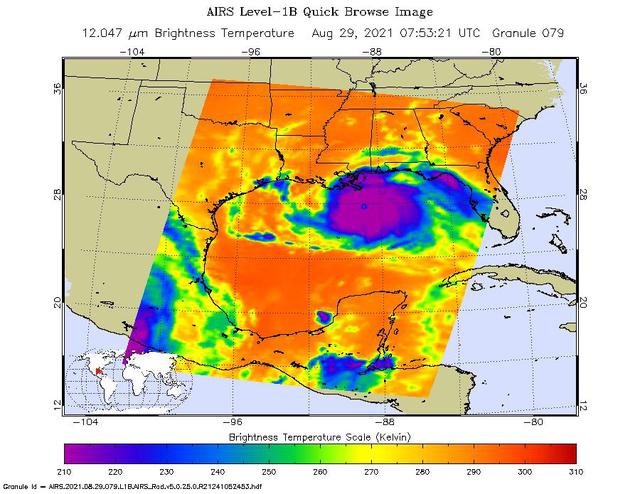
NASA's Atmospheric Infrared Sounder (AIRS), aboard the Aqua satellite, caught views of Hurricane Ida as the high-end Category 4 storm swept ashore around noon local time on Aug. 29, 2021, near Port Fourchon, Louisiana. One snapshot showed the hurricane around 3 a.m. that day while it was still over the Gulf of Mexico. The second view (Figure 1) caught the storm around 1:45 p.m. local time. In the infrared AIRS imagery, purple areas indicate very cold clouds carried high into the atmosphere by towering thunderstorms. These regions are also associated with heavy rainfall. Blue and green indicate warmer areas with shallower rain clouds. The orange and red areas represent mostly cloud-free air. The eye of the hurricane is seen just over the Louisiana coast as a small blue-green area in the middle of the large patch of purple in the after-landfall image. AIRS, in conjunction with the Advanced Microwave Sounding Unit (AMSU), senses emitted infrared and microwave radiation from Earth to provide a three-dimensional look at the planet's weather and climate. Working in tandem, the two instruments make simultaneous observations down to Earth's surface. With more than 2,000 channels sensing different regions of the atmosphere, the system creates a global, three-dimensional map of atmospheric temperature and humidity, cloud amounts and heights, greenhouse gas concentrations, and many other atmospheric phenomena. Launched into Earth orbit in 2002 aboard NASA's Aqua spacecraft, the AIRS and AMSU instruments are managed by NASA's Jet Propulsion Laboratory in Southern California, under contract to NASA. JPL is a division of Caltech. https://photojournal.jpl.nasa.gov/catalog/PIA24538
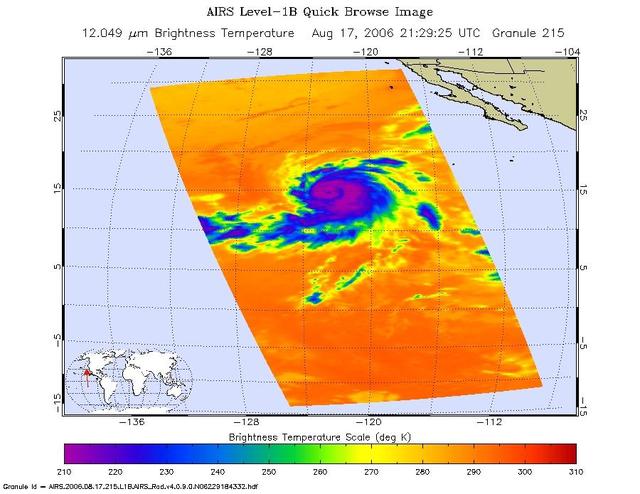
Infrared, microwave, and visible/near-infrared images of Hurricane Hector in the eastern Pacific were created with data from the Atmospheric Infrared Sounder (AIRS) on NASA's Aqua satellite on August 17, 2006. The infrared AIRS image shows the temperature of the cloud tops or the surface of the Earth in cloud-free regions. The lowest temperatures (in purple) are associated with high, cold cloud tops that make up the top of the hurricane. The infrared signal does not penetrate through clouds. Where there are no clouds the AIRS instrument reads the infrared signal from the surface of the Earth, revealing warmer temperatures (red). At the time the data were taken from which these images were made, Hector is a well organized storm, with the strongest convection in the SE quadrant. The increasing vertical wind shear in the NW quadrant is appearing to have an effect. Maximum sustained winds are at 85 kt, gusts to 105 kt. Estimated minimum central pressure is 975 mbar. The microwave image is created from microwave radiation emitted by Earth's atmosphere and received by the instrument. It shows where the heaviest rainfall is taking place (in blue) in the storm. Blue areas outside of the storm where there are either some clouds or no clouds, indicate where the sea surface shines through. The "visible" image is created from data acquired by the visible light/near-infrared sensor on the AIRS instrument. http://photojournal.jpl.nasa.gov/catalog/PIA00507
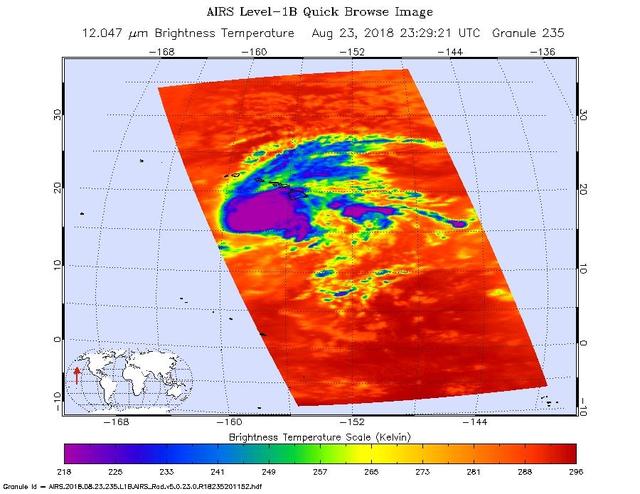
This image shows Hurricane Lane as observed by the Atmospheric Infrared Sounder (AIRS) instrument on NASA's Aqua satellite on Thursday, Aug. 23, 2018. Purple shows very cold clouds high in the atmosphere above the center of the hurricane, blue and green show the warmer temperatures of lower clouds surrounding the storm center; and orange and red areas have almost no clouds. No eye is seen in this image, which means it was either too small for AIRS to detect or it was covered by high, cold clouds. Figure 1 was observed on Aug. 22, 2018. Purple shows very cold clouds high in the atmosphere above the center of the hurricane, blue and green show the warmer temperatures of lower clouds surrounding the storm center; and orange and red areas have almost no clouds. The eye of the storm is clearly visible. https://photojournal.jpl.nasa.gov/catalog/PIA22493
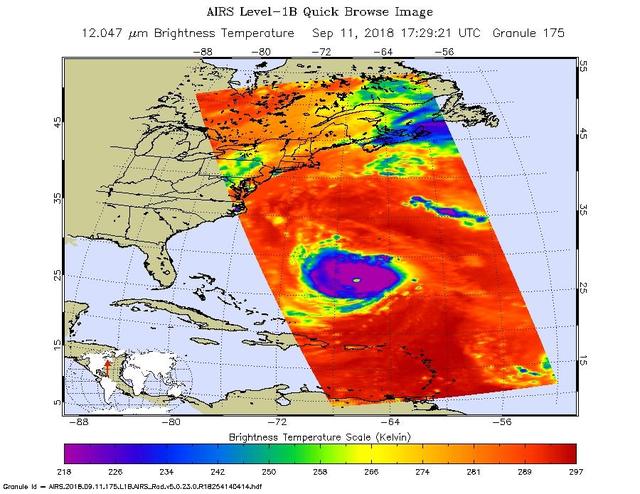
This image, taken at 1:35 pm local time on Tuesday, September 11, 2018 by the Atmospheric Infrared Sounder (AIRS) onboard NASA's Aqua satellite shows Hurricane Florence whose strong winds are expected to reach the Carolina coast late Thursday. Florence intensified from a Category 2 to a Category 4 storm in a matter of hours. As of Tuesday evening, Florence had maximum sustained winds of 140 mph (225 kph). AIRS has more than 2,000 "channels" that capture various hues of infrared, and this image represents the temperature of the cloud tops and the ocean surface (called "brightness temperature" in the image). Purple shows very cold clouds high in the atmosphere, blue and green show the warmer temperatures of lower clouds, and red shows the surface. Florence has the characteristics of a mature, powerful hurricane: an extensive, nearly symmetric ring of deep, cold rain clouds in purple; slightly shallower rain clouds in the outer perimeter seen in green; a large area of cloud-free air flowing away from the storm in red; and a well-defined eye (seen as the greenish spot near the center) where warm low clouds can be seen below. https://photojournal.jpl.nasa.gov/catalog/PIA22697