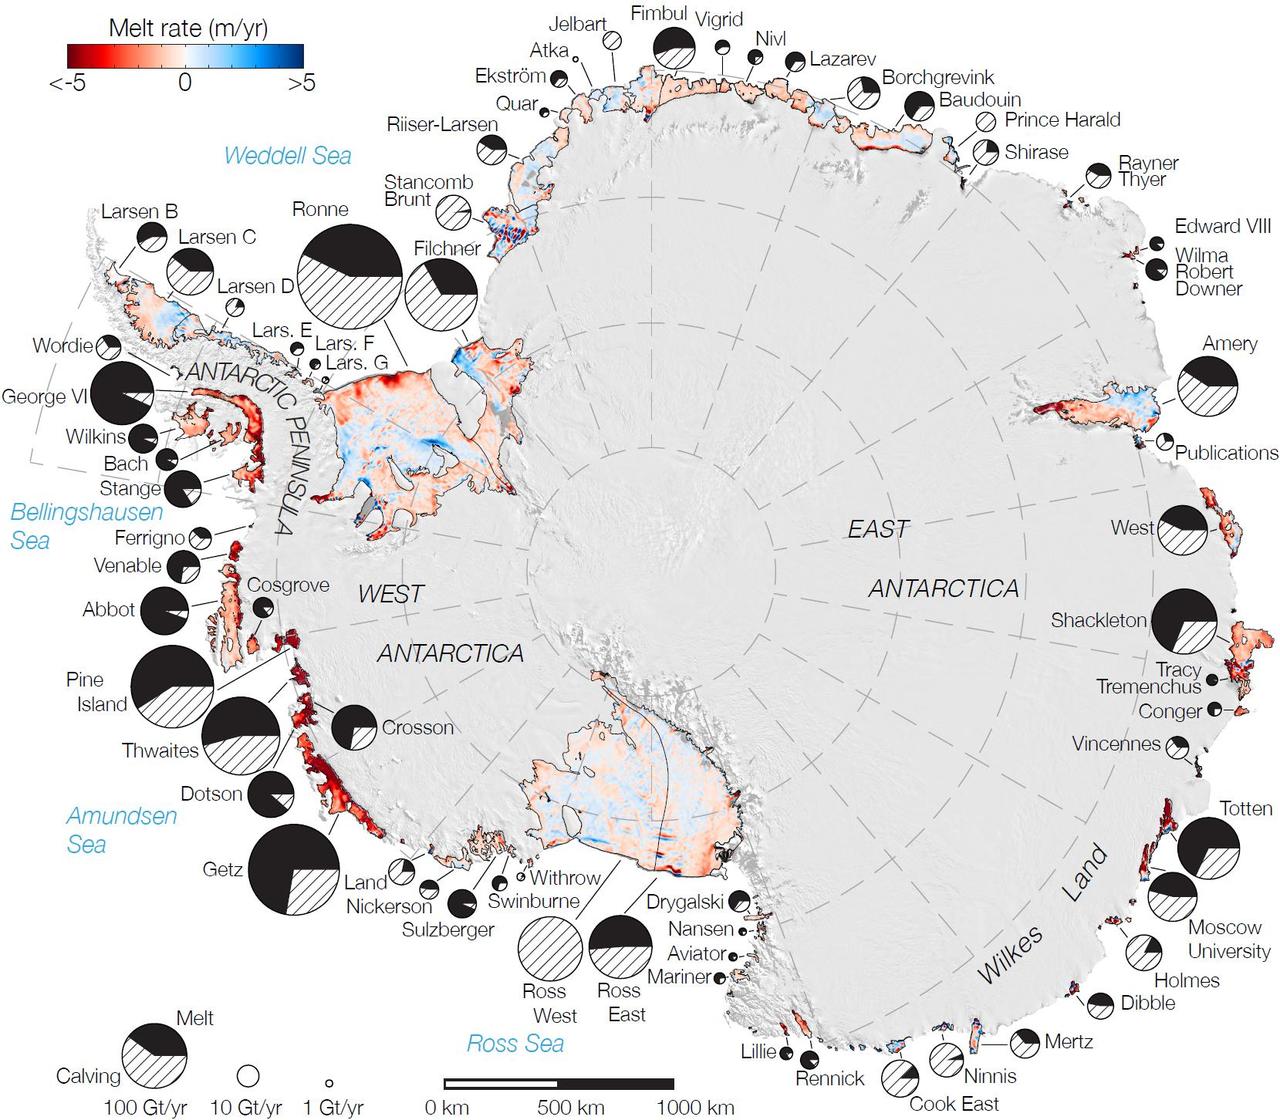
Rates of basal melt of Antarctic ice shelves melting of the shelves from underneath overlaid on a 2009 mosaic of Antarctica created from data from NASA Terra and Aqua spacecraft.
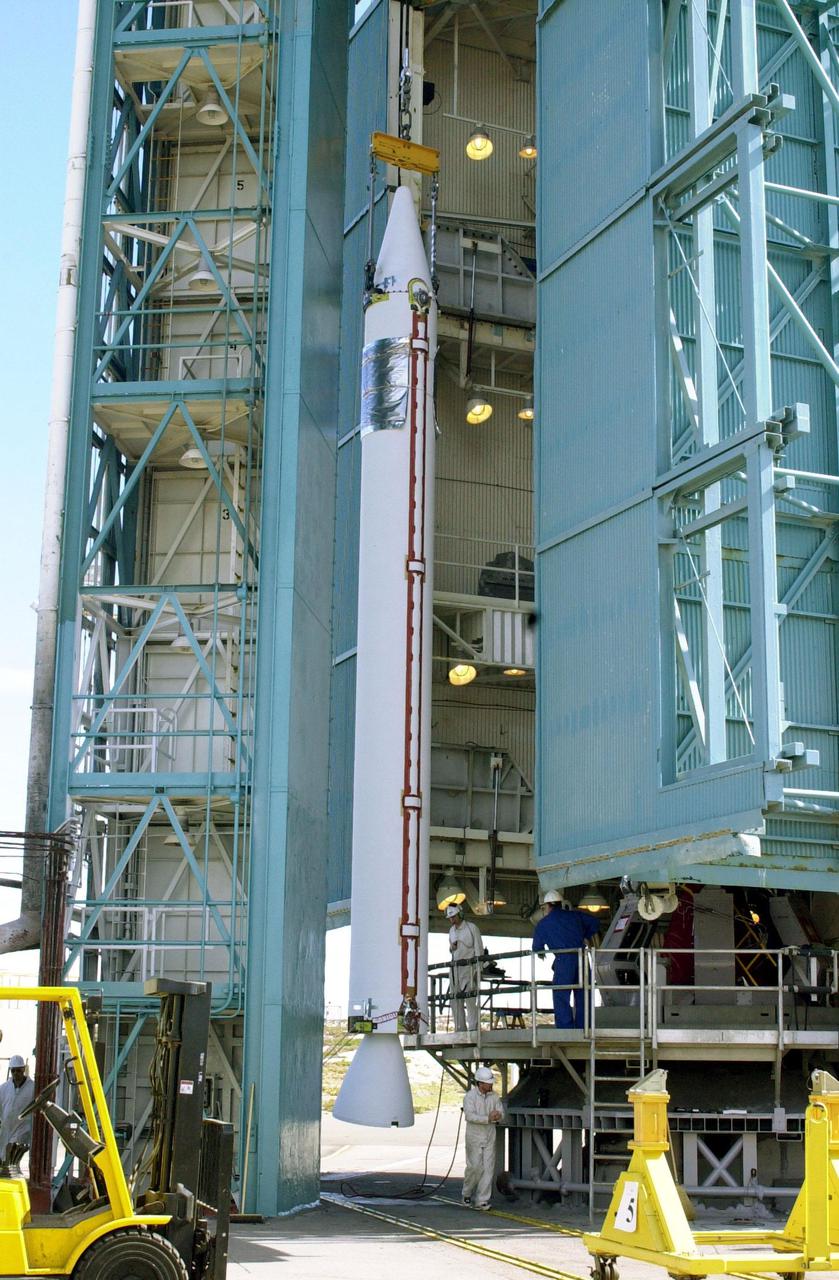
VANDENBERG AFB, CALIF. -- On the launch pad, a solid rocket booster is lifted up the gantry for mating with the Delta II rocket that will launch the Aqua-EOS satellite. Aqua is one of a series of spacebased platforms that are central to NASA's Earth Science Enterprise (ESE), a long-term study of the scope, dynamics and implications of global change. The Aqua program is composed of Aqua and other spacecraft (including Terra and Aura) and a data distribution system (ESDIS, and Mission Operations Center Implementation Team). Flying in an orbit that covers the globe every 16 days, Aqua will provide a six-year chronology of the planet and its processes. Comprehensive measurements taken by its onboard instruments will allow multidisciplinary teams of scientists and researchers from North and South America, Asia, Australia and Europe to assess long-term change, identify its human and natural causes and advance the development of models for long-term forecasting. Launch is scheduled for April 26 from Vandenberg
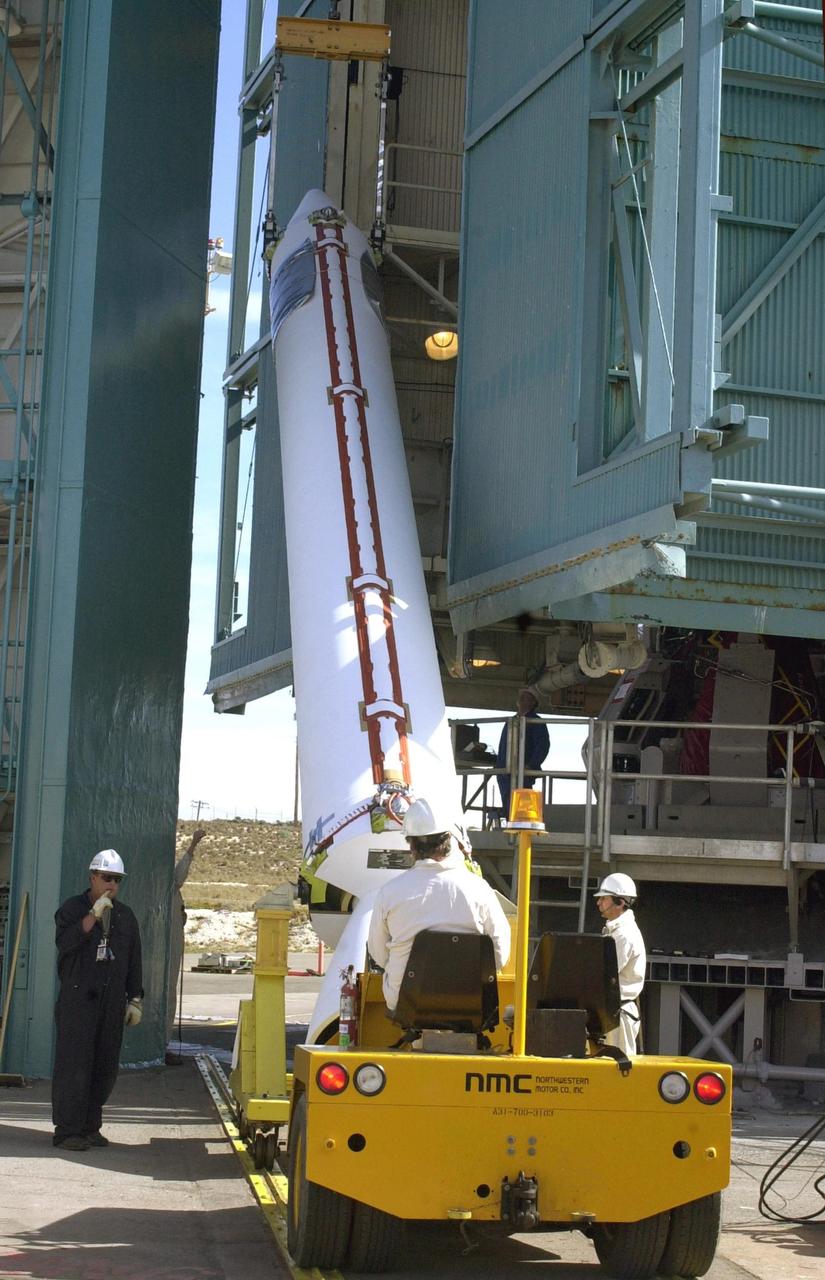
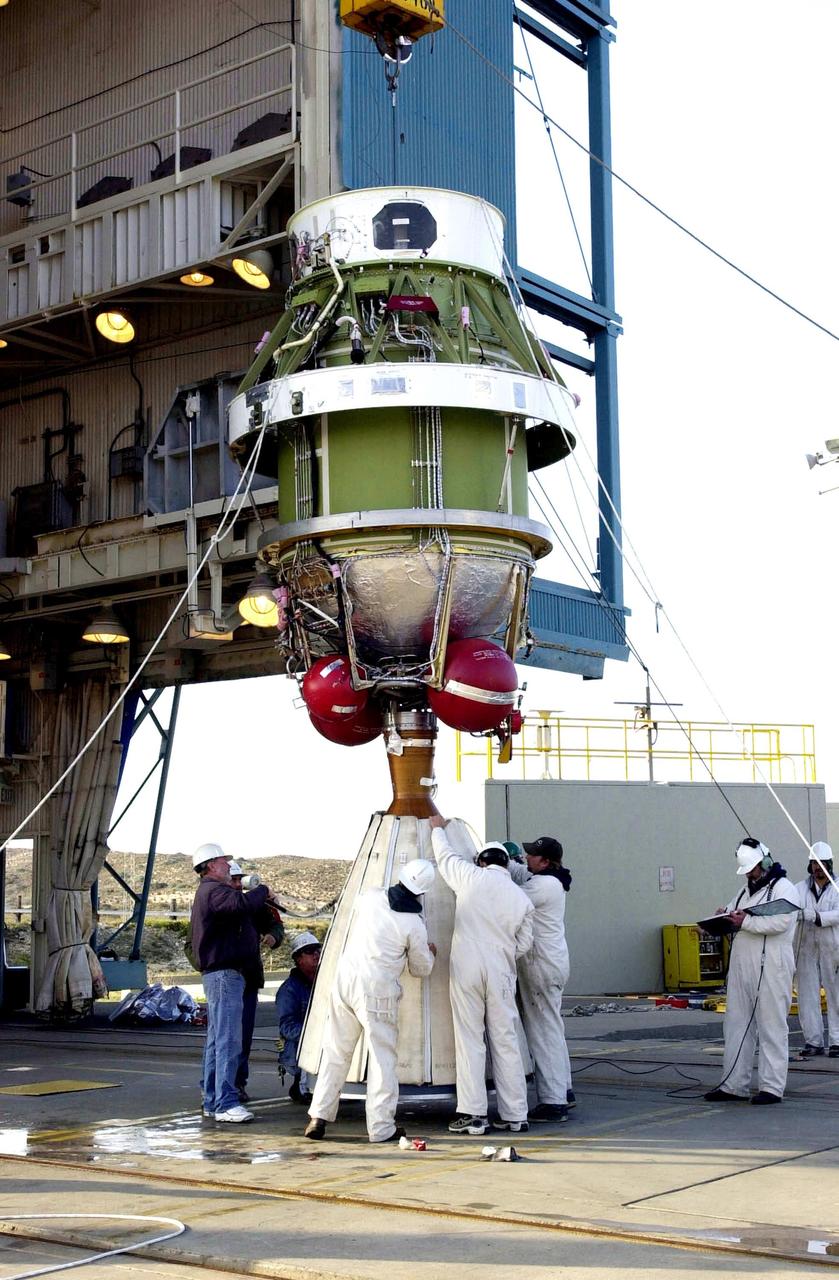
VANDENBERG AFB, CALIF. -- On the launch pad, an overhead crane lifts a solid rocket booster to vertical for mating with the Delta II rocket that will launch the Aqua-EOS satellite. Aqua is one of a series of spacebased platforms that are central to NASA's Earth Science Enterprise (ESE), a long-term study of the scope, dynamics and implications of global change. The Aqua program is composed of Aqua and other spacecraft (including Terra and Aura) and a data distribution system (ESDIS, and Mission Operations Center Implementation Team). Flying in an orbit that covers the globe every 16 days, Aqua will provide a six-year chronology of the planet and its processes. Comprehensive measurements taken by its onboard instruments will allow multidisciplinary teams of scientists and researchers from North and South America, Asia, Australia and Europe to assess long-term change, identify its human and natural causes and advance the development of models for long-term forecasting. Launch is scheduled for April 26 from Vandenberg

VANDENBERG AFB,CALIF. - On the SLC-2 launch pad, the gantry closes in on the Delta II rocket to enable mating of the second stage. The Delta II will launch the Aqua-EOS satellite. Aqua is one of a series of spacebased platforms that are central to NASA's Earth Science Enterprise (ESE), a long-term study of the scope, dynamics and implications of global change. The Aqua program is composed of Aqua and other spacecraft (including Terra and Aura) and a data distribution system (ESDIS, and Mission Operations Center Implementation Team). Flying in an orbit that covers the globe every 16 days, Aqua will provide a six-year chronology of the planet and its processes. Comprehensive measurements taken by its onboard instruments will allow multidisciplinary teams of scientists and researchers from North and South America, Asia, Australia and Europe to assess long-term change, identify its human and natural causes and advance the development of models for long-term forecasting. Launch is scheduled for April 26 from Vandenberg
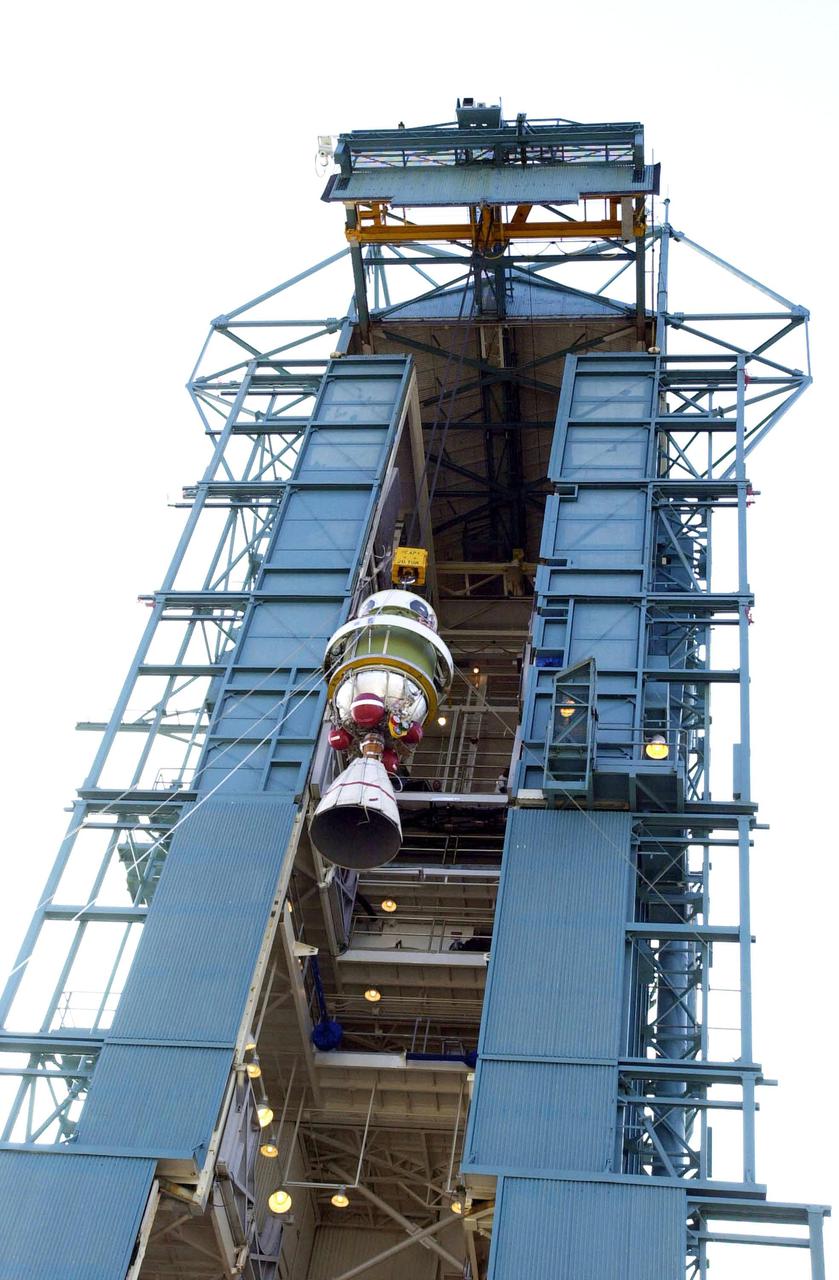
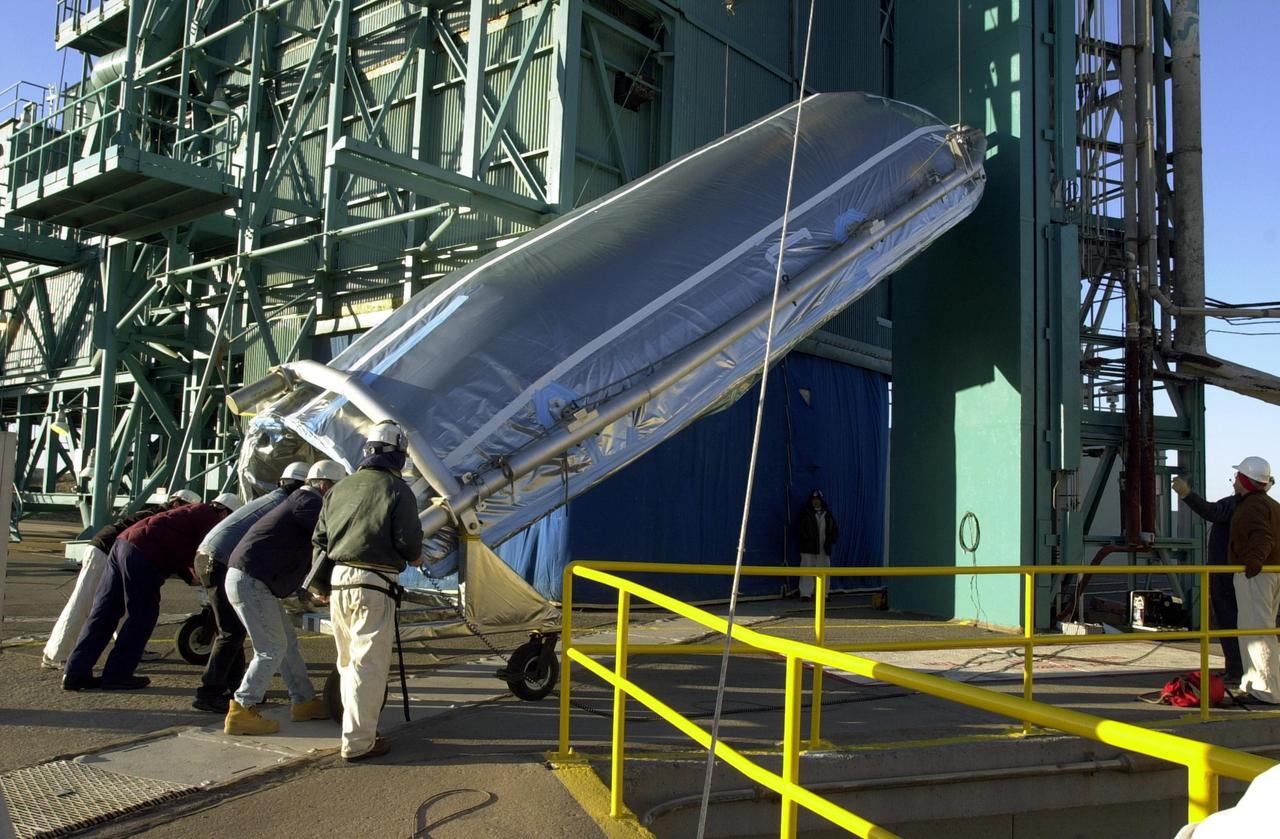
VANDENBERG AFB, CALIF. - The second stage of the Delta II rocket is lifted up the gantry on the launch pad. The Delta II rocket will launch the Aqua-EOS satellite. Aqua is one of a series of spacebased platforms that are central to NASA's Earth Science Enterprise (ESE), a long-term study of the scope, dynamics and implications of global change. The Aqua program is composed of Aqua and other spacecraft (including Terra and Aura) and a data distribution system (ESDIS, and Mission Operations Center Implementation Team). Flying in an orbit that covers the globe every 16 days, Aqua will provide a six-year chronology of the planet and its processes. Comprehensive measurements taken by its onboard instruments will allow multidisciplinary teams of scientists and researchers from North and South America, Asia, Australia and Europe to assess long-term change, identify its human and natural causes and advance the development of models for long-term forecasting. Launch is scheduled for April 26 from Vandenberg
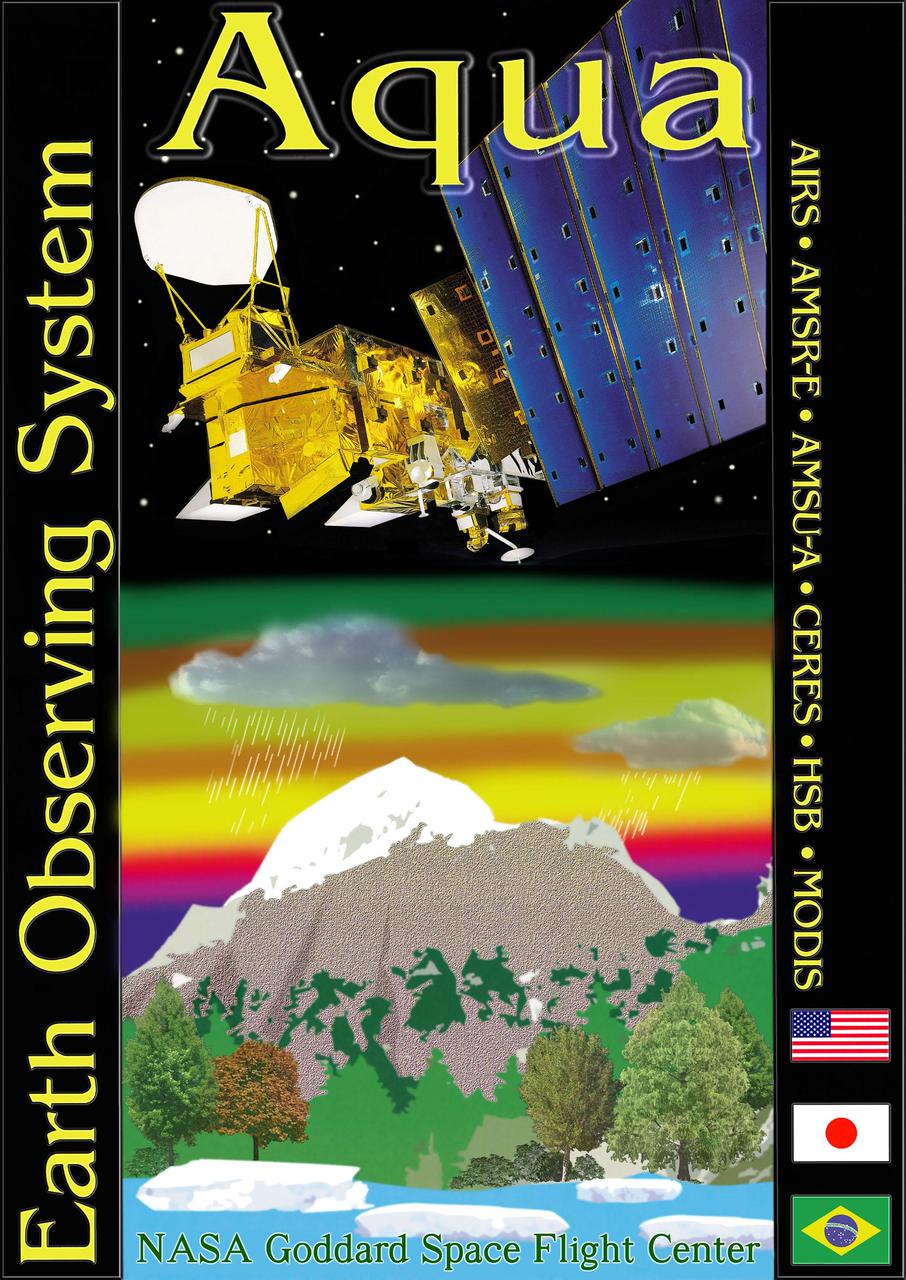
KENNEDY SPACE CENTER, FLA. -- The Aqua-EOS logo. Aqua is one of a series of spacebased platforms that are central to NASA's Earth Science Enterprise (ESE), a long-term study of the scope, dynamics and implications of global change. The Aqua program is composed of Aqua and other spacecraft (including Terra and Aura) and a data distribution system (ESDIS, and Mission Operations Center Implementation Team). Flying in an orbit that covers the globe every 16 days, Aqua will provide a six-year chronology of the planet and its processes. Comprehensive measurements taken by its onboard instruments will allow multidisciplinary teams of scientists and researchers from North and South America, Asia, Australia and Europe to assess long-term change, identify its human and natural causes and advance the development of models for long-term forecasting. Launch is scheduled from Vandenberg Air Force Base, Calif
VANDENBERG AFB, CALIF. - On the SLC-2 launch pad, the first half of the Delta II fairing for the Aqua-EOS satellite arrives at the gantry. The Delta II will launch the Aqua-EOS satellite. Aqua is one of a series of spacebased platforms that are central to NASA's Earth Science Enterprise (ESE), a long-term study of the scope, dynamics and implications of global change. The Aqua program is composed of Aqua and other spacecraft (including Terra and Aura) and a data distribution system (ESDIS, and Mission Operations Center Implementation Team). Flying in an orbit that covers the globe every 16 days, Aqua will provide a six-year chronology of the planet and its processes. Comprehensive measurements taken by its onboard instruments will allow multidisciplinary teams of scientists and researchers from North and South America, Asia, Australia and Europe to assess long-term change, identify its human and natural causes and advance the development of models for long-term forecasting. Launch is scheduled for April 26 from Vandenberg
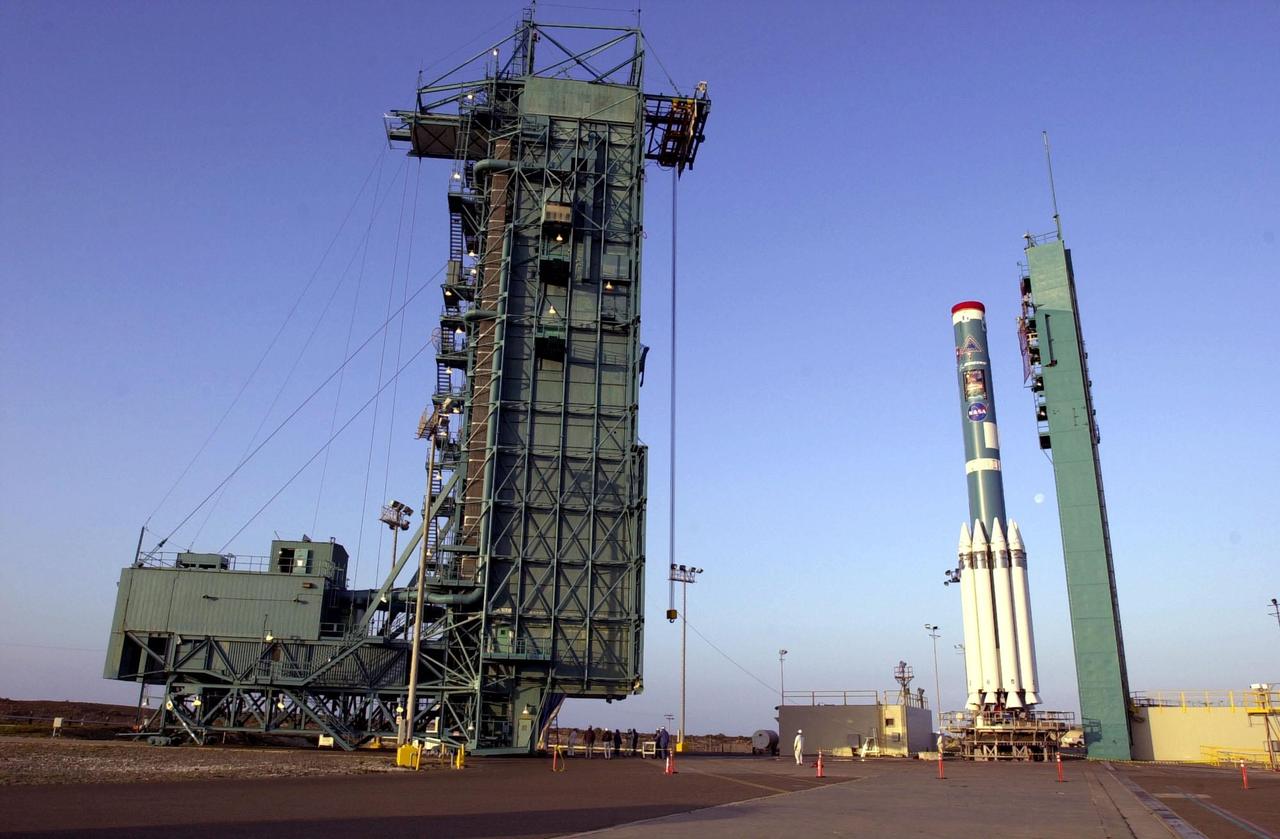
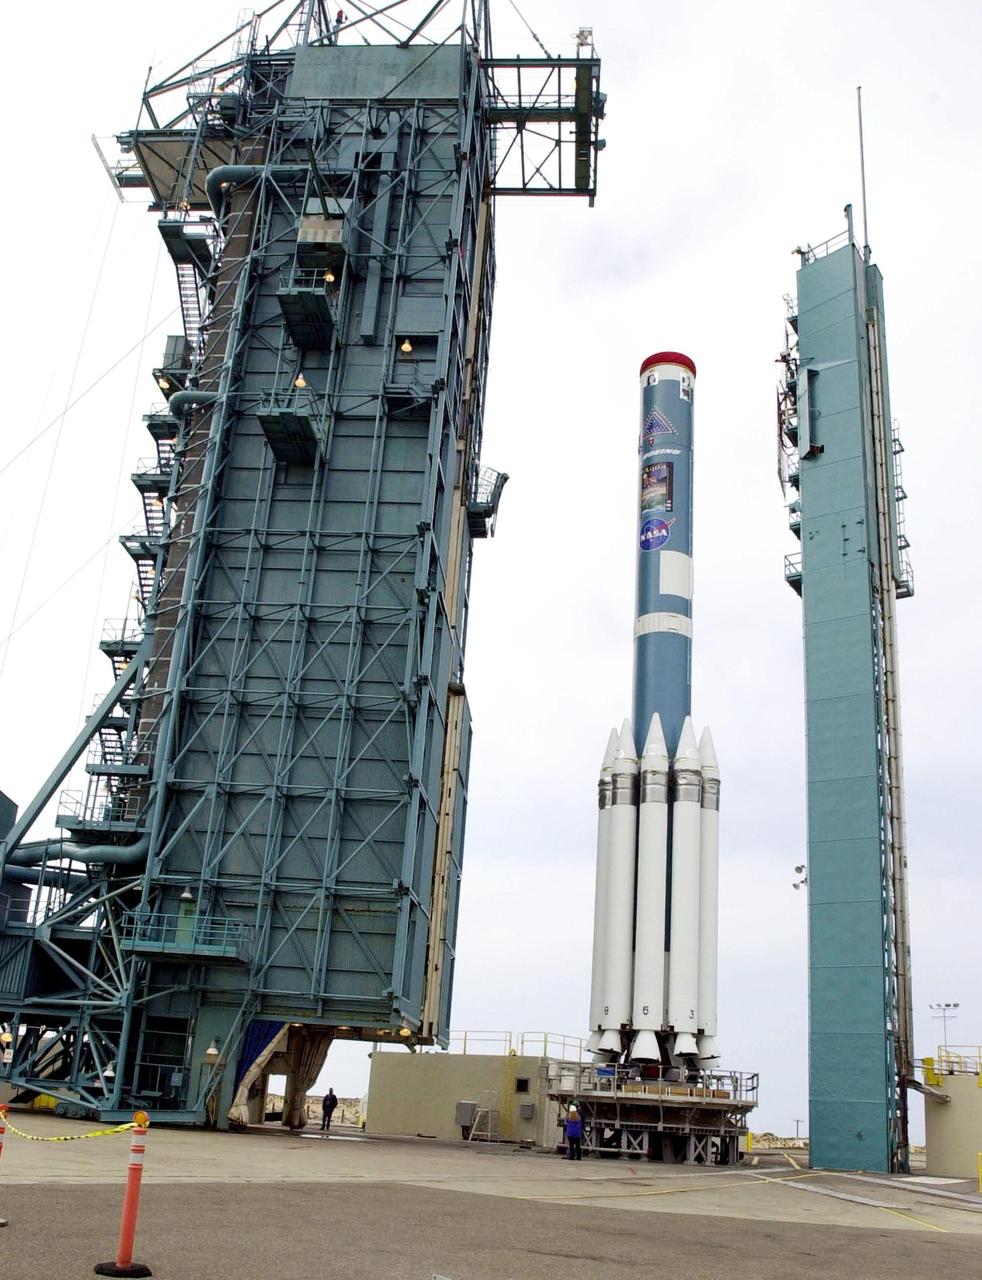
VANDENBERG AFB, CALIF. -- The partially assembled Delta II rocket (right) and the gantry (left) wait for the rocket's second stage to be transported to the launch pad. The Delta II rocket will launch the Aqua-EOS satellite. Aqua is one of a series of spacebased platforms that are central to NASA's Earth Science Enterprise (ESE), a long-term study of the scope, dynamics and implications of global change. The Aqua program is composed of Aqua and other spacecraft (including Terra and Aura) and a data distribution system (ESDIS, and Mission Operations Center Implementation Team). Flying in an orbit that covers the globe every 16 days, Aqua will provide a six-year chronology of the planet and its processes. Comprehensive measurements taken by its onboard instruments will allow multidisciplinary teams of scientists and researchers from North and South America, Asia, Australia and Europe to assess long-term change, identify its human and natural causes and advance the development of models for long-term forecasting. Launch is scheduled for April 26 from Vandenberg

VANDENBERG AFB, CALIF. - - Inside the gantry on the SLC-2 launch pad, workers check the fitting on the second stage of a Delta II rocket mated with the first stage, below. The Delta II will launch the Aqua-EOS satellite. Aqua is one of a series of spacebased platforms that are central to NASA's Earth Science Enterprise (ESE), a long-term study of the scope, dynamics and implications of global change. The Aqua program is composed of Aqua and other spacecraft (including Terra and Aura) and a data distribution system (ESDIS, and Mission Operations Center Implementation Team). Flying in an orbit that covers the globe every 16 days, Aqua will provide a six-year chronology of the planet and its processes. Comprehensive measurements taken by its onboard instruments will allow multidisciplinary teams of scientists and researchers from North and South America, Asia, Australia and Europe to assess long-term change, identify its human and natural causes and advance the development of models for long-term forecasting. Launch is scheduled for April 26 from Vandenberg
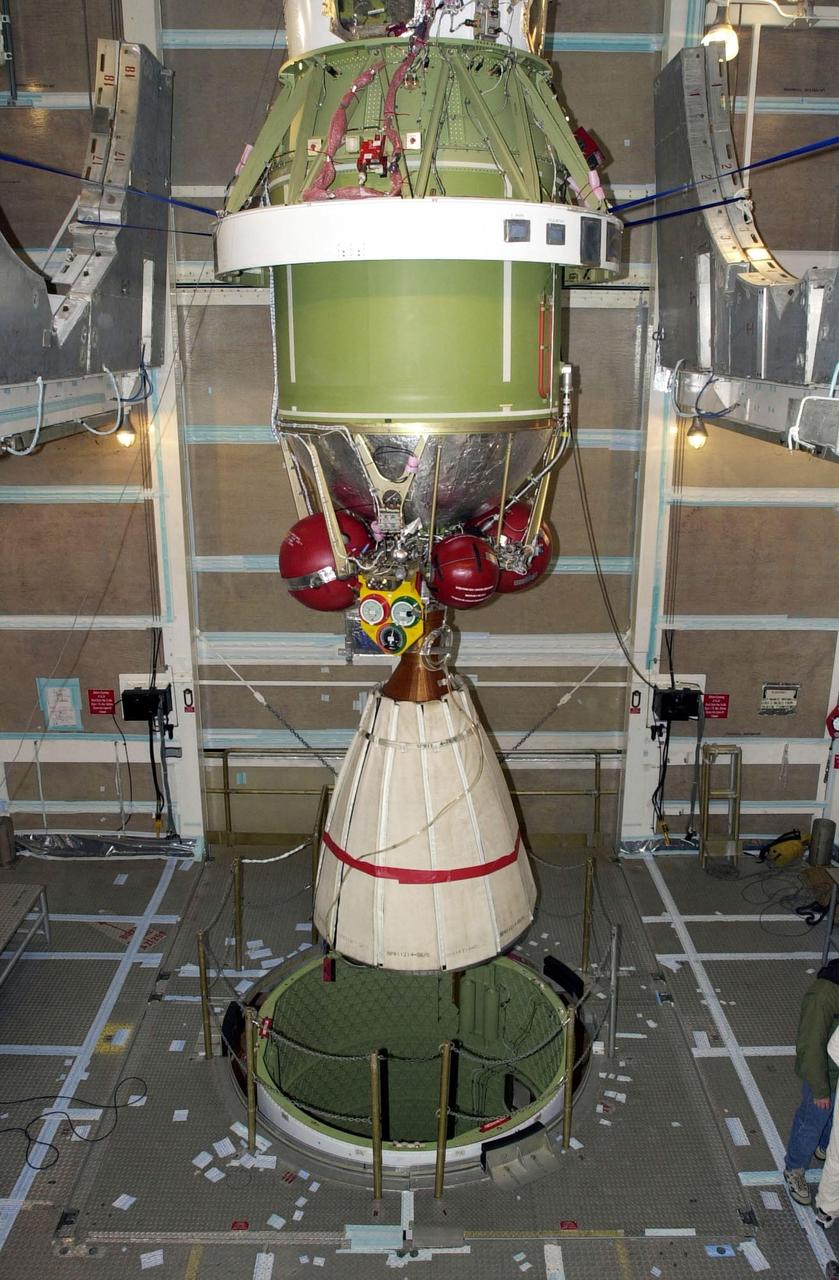
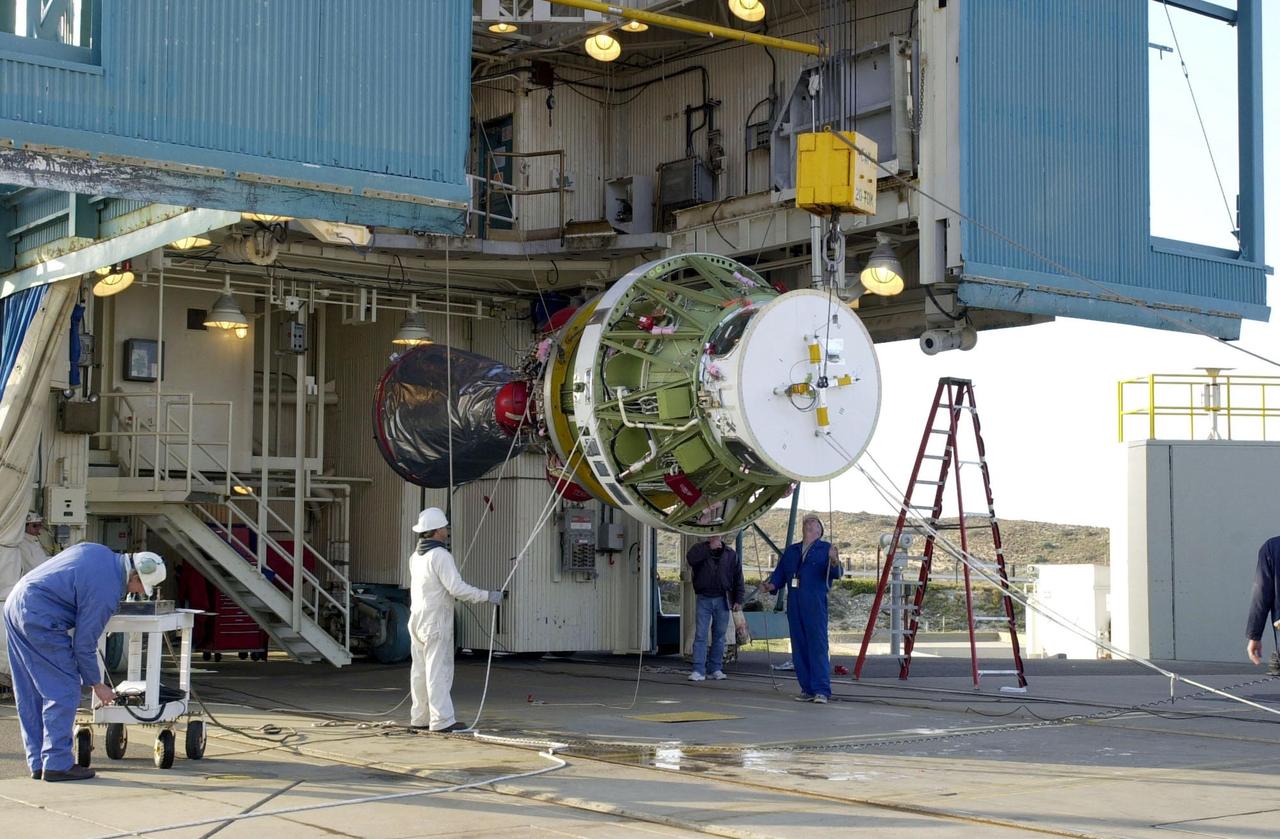
VANDENBERG AFB, CALIF. - Inside the gantry on the SLC-2 launch pad, the second stage of a Delta II rocket is lowered for mating with the first stage, below. The Delta II will launch the Aqua-EOS satellite. Aqua is one of a series of spacebased platforms that are central to NASA's Earth Science Enterprise (ESE), a long-term study of the scope, dynamics and implications of global change. The Aqua program is composed of Aqua and other spacecraft (including Terra and Aura) and a data distribution system (ESDIS, and Mission Operations Center Implementation Team). Flying in an orbit that covers the globe every 16 days, Aqua will provide a six-year chronology of the planet and its processes. Comprehensive measurements taken by its onboard instruments will allow multidisciplinary teams of scientists and researchers from North and South America, Asia, Australia and Europe to assess long-term change, identify its human and natural causes and advance the development of models for long-term forecasting. Launch is scheduled for April 26 from Vandenberg
VANDENBERG AFB, CALIF. -- The second stage of the Delta II rocket is ready to be raised to vertical for its lift up the gantry on the launch pad. The Delta II rocket will launch the Aqua-EOS satellite. Aqua is one of a series of spacebased platforms that are central to NASA's Earth Science Enterprise (ESE), a long-term study of the scope, dynamics and implications of global change. The Aqua program is composed of Aqua and other spacecraft (including Terra and Aura) and a data distribution system (ESDIS, and Mission Operations Center Implementation Team). Flying in an orbit that covers the globe every 16 days, Aqua will provide a six-year chronology of the planet and its processes. Comprehensive measurements taken by its onboard instruments will allow multidisciplinary teams of scientists and researchers from North and South America, Asia, Australia and Europe to assess long-term change, identify its human and natural causes and advance the development of models for long-term forecasting. Launch is scheduled for April 26 from Vandenberg
VANDENBERG AFB, CALIF. - Workers on the launch pad ready the second stage of the Delta II rocket for its lift up the gantry on the launch pad. The Delta II rocket will launch the Aqua-EOS satellite. Aqua is one of a series of spacebased platforms that are central to NASA's Earth Science Enterprise (ESE), a long-term study of the scope, dynamics and implications of global change. The Aqua program is composed of Aqua and other spacecraft (including Terra and Aura) and a data distribution system (ESDIS, and Mission Operations Center Implementation Team). Flying in an orbit that covers the globe every 16 days, Aqua will provide a six-year chronology of the planet and its processes. Comprehensive measurements taken by its onboard instruments will allow multidisciplinary teams of scientists and researchers from North and South America, Asia, Australia and Europe to assess long-term change, identify its human and natural causes and advance the development of models for long-term forecasting. Launch is scheduled for April 26 from Vandenberg
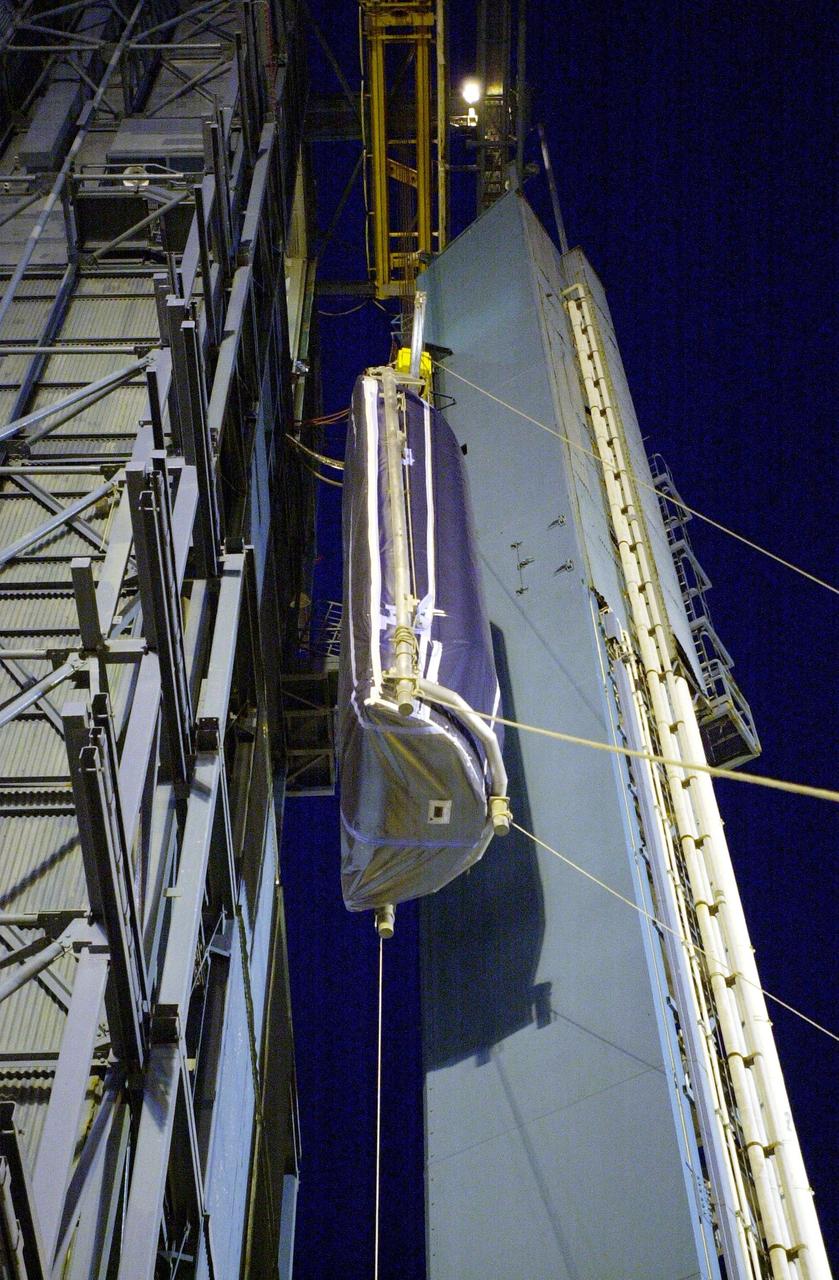
VANDENBERG AFB, CALIF. - On the SLC-2 launch pad, the first half of the Delta II fairing for the Aqua-EOS satellite is lifted up the gantry. The Delta II will launch the Aqua-EOS satellite, one of a series of spacebased platforms that are central to NASA's Earth Science Enterprise (ESE), a long-term study of the scope, dynamics and implications of global change. The Aqua program is composed of Aqua and other spacecraft (including Terra and Aura) and a data distribution system (ESDIS, and Mission Operations Center Implementation Team). Flying in an orbit that covers the globe every 16 days, Aqua will provide a six-year chronology of the planet and its processes. Comprehensive measurements taken by its onboard instruments will allow multidisciplinary teams of scientists and researchers from North and South America, Asia, Australia and Europe to assess long-term change, identify its human and natural causes and advance the development of models for long-term forecasting. Launch is scheduled for April 26 from Vandenberg
VANDENBERG AFB,CALIF. - The gantry (left) on SLC-2 moves toward the first stage of the Delta II rocket, for mating with the second stage. The Delta II will launch the Aqua-EOS satellite. Aqua is one of a series of spacebased platforms that are central to NASA's Earth Science Enterprise (ESE), a long-term study of the scope, dynamics and implications of global change. The Aqua program is composed of Aqua and other spacecraft (including Terra and Aura) and a data distribution system (ESDIS, and Mission Operations Center Implementation Team). Flying in an orbit that covers the globe every 16 days, Aqua will provide a six-year chronology of the planet and its processes. Comprehensive measurements taken by its onboard instruments will allow multidisciplinary teams of scientists and researchers from North and South America, Asia, Australia and Europe to assess long-term change, identify its human and natural causes and advance the development of models for long-term forecasting. Launch is scheduled for April 26 from Vandenberg
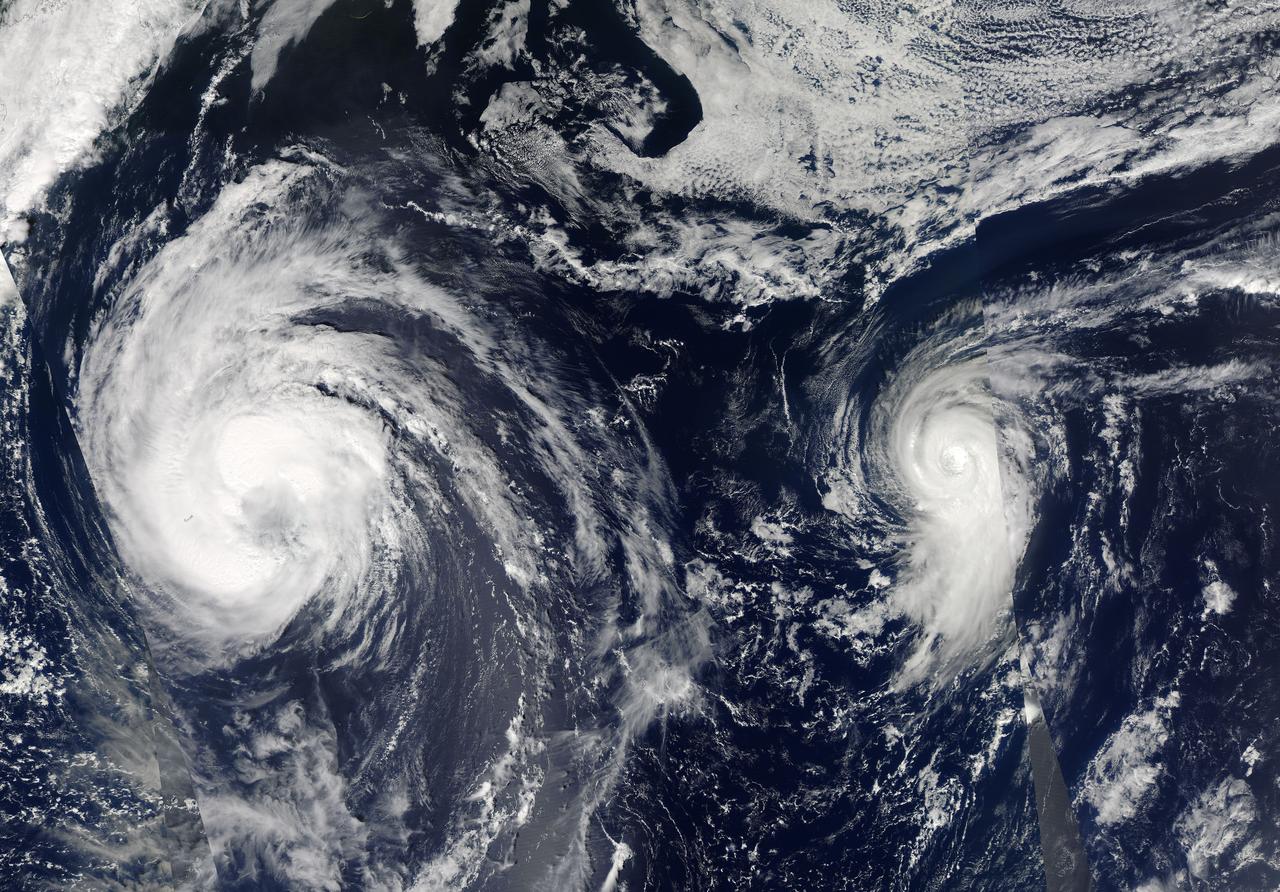
This visible image of Tropical Storm Leslie and Hurricane Michael was taken by the MODIS instrument aboard both NASA's Aqua and Terra satellites on Sept. 9 at 12:50 p.m. EDT. Credit: NASA Goddard/MODIS Rapid Response Team -- Satellite images from two NASA satellites were combined to create a full picture of Tropical Storm Leslie and Hurricane Michael spinning in the Atlantic Ocean. Imagery from NASA's Aqua and Terra satellites showed Leslie now past Bermuda and Michael in the north central Atlantic, and Leslie is much larger than the smaller, more powerful Michael. Images of each storm were taken by the Moderate Resolution Imaging Spectroradiometer, or MODIS instrument that flies onboard both the Aqua and Terra satellites. Both satellites captured images of both storms on Sept. 7 and Sept. 10. The image from Sept. 7 showed a much more compact Michael with a visible eye. By Sept. 10, the eye was no longer visible in Michael and the storm appeared more elongated from south to north. To continue reading go to: <a href="http://1.usa.gov/NkUPqn" rel="nofollow">1.usa.gov/NkUPqn</a> <b><a href="http://www.nasa.gov/audience/formedia/features/MP_Photo_Guidelines.html" rel="nofollow">NASA image use policy.</a></b> <b><a href="http://www.nasa.gov/centers/goddard/home/index.html" rel="nofollow">NASA Goddard Space Flight Center</a></b> enables NASA’s mission through four scientific endeavors: Earth Science, Heliophysics, Solar System Exploration, and Astrophysics. Goddard plays a leading role in NASA’s accomplishments by contributing compelling scientific knowledge to advance the Agency’s mission. <b>Follow us on <a href="http://twitter.com/NASA_GoddardPix" rel="nofollow">Twitter</a></b> <b>Like us on <a href="http://www.facebook.com/pages/Greenbelt-MD/NASA-Goddard/395013845897?ref=tsd" rel="nofollow">Facebook</a></b> <b>Find us on <a href="http://instagrid.me/nasagoddard/?vm=grid" rel="nofollow">Instagram</a></b>
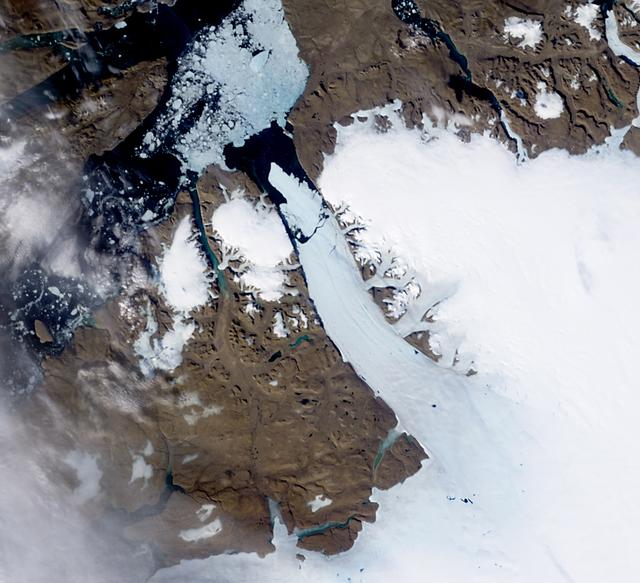
NASA image acquired August 5, 2010 On August 5, 2010, an enormous chunk of ice, roughly 97 square miles (251 square kilometers) in size, broke off the Petermann Glacier, along the northwestern coast of Greenland. The Canadian Ice Service detected the remote event within hours in near real-time data from the Moderate Resolution Imaging Spectroradiometer (MODIS) on NASA’s Aqua satellite. The Peterman Glacier lost about one-quarter of its 70-kilometer (40-mile) long floating ice shelf, said researchers who analyzed the satellite data at the University of Delaware. The Moderate Resolution Imaging Spectroradiometer (MODIS) on NASA’s Terra satellite captured these natural-color images of Petermann Glacier 18:05 UTC on August 5, 2010 (top), and 17:15 UTC on July 28, 2010 (bottom). The Terra image of the Petermann Glacier on August 5 was acquired almost 10 hours after the Aqua observation that first recorded the event. By the time Terra took this image, skies were less cloudy than they had been earlier in the day, and the oblong iceberg had broken free of the glacier and moved a short distance down the fjord. Icebergs calving off the Petermann Glacier are not unusual. Petermann Glacier’s floating ice tongue is the Northern Hemisphere’s largest, and it has occasionally calved large icebergs. The recently calved iceberg is the largest to form in the Arctic since 1962, said the University of Delaware. To read more and or to download the high res go here: <a href="http://www.nasa.gov/topics/earth/features/petermann-calve.html" rel="nofollow">www.nasa.gov/topics/earth/features/petermann-calve.html</a> or Click here to see more images from <b><a href="#//earthobservatory.nasa.gov/" rel="nofollow"> NASA Goddard’s Earth Observatory</a></b> NASA Earth Observatory image created by Jesse Allen and Robert Simmon, using data obtained from the Goddard Level 1 and Atmospheric Archive and Distribution System (LAADS). Caption by Holli Riebeek and Michon Scott. Instrument: Terra - MODIS <b><a href="http://www.nasa.gov/centers/goddard/home/index.html" rel="nofollow">NASA Goddard Space Flight Center</a></b> is home to the nation's largest organization of combined scientists, engineers and technologists that build spacecraft, instruments and new technology to study the Earth, the sun, our solar system, and the universe. <b>Follow us on <a href="http://twitter.com/NASA_GoddardPix" rel="nofollow">Twitter</a></b> <b>Join us on <a href="http://www.facebook.com/pages/Greenbelt-MD/NASA-Goddard/395013845897?ref=tsd" rel="nofollow">Facebook</a><b></b></b>
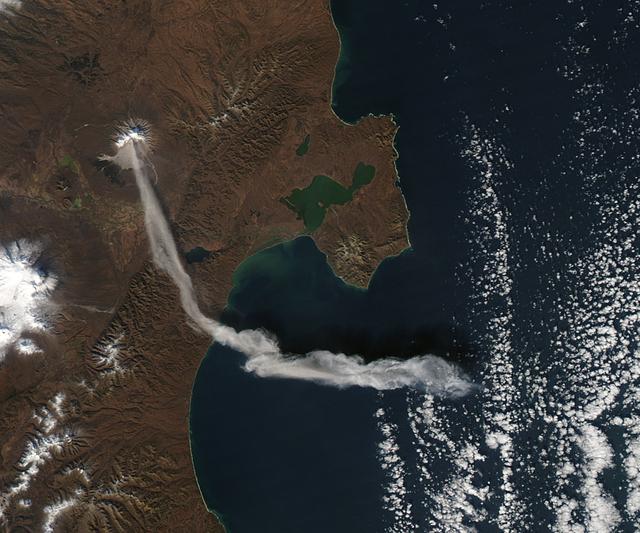
When NASA’s Terra satellite passed over Russia’s Kamchatka Peninsula at noon local time (00:00 Universal Time) on October 6, 2012, Shilveluch Volcano was quiet. By the time NASA’s Aqua satellite passed over the area two hours later (bottom image), the volcano had erupted and sent a plume of ash over the Kamchatskiy Zaliv. The plume traveled about 90 kilometers (55 miles) toward the south-southeast, where a change in wind direction began pushing the plume toward the east. On October 6, 2012, the Kamchatka Volcanic Emergency Response Team (KVERT) reported that the ash plume from Shiveluch reached an altitude of 3 kilometers (9,800 feet) above sea level, and had traveled some 220 kilometers (140 miles) from the volcano summit. Shiveluch (also spelled Sheveluch) ranks among the biggest and most active volcanoes on the Kamchatka Peninsula. Rising to 3,283 meters (10,771 feet) above sea level, Shiveluch is a stratovolcano composed of alternating layers of hardened lava, compacted ash, and rocks ejected by previous eruptions. The beige-colored expanse of rock on the volcano’s southern slopes (visible in both images) is due to an explosive eruption that occurred in 1964. Part of Shiveluch’s southern flank collapsed, and the light-colored rock is avalanche debris left by that event. High-resolution imagery of Shiveluch shows very little vegetation within that avalanche zone. On October 6, 2012, KVERT cited observations from the Moderate Resolution Imaging Spectroradiometer (MODIS) instruments on Terra and Aqua in detecting the Shiveluch eruption. This was not the first time that MODIS observed a Shiveluch eruption shortly after it started. In 2007, MODIS captured an image within minutes of the eruption’s start, before winds could blow the ash away from the summit. When NASA’s Terra satellite passed over Russia’s Kamchatka Peninsula at noon local time (00:00 Universal Time) on October 6, 2012, Shilveluch Volcano was quiet (top image). By the time NASA’s Aqua satellite passed over the area two hours later (bottom image), the volcano had erupted and sent a plume of ash over the Kamchatskiy Zaliv. The plume traveled about 90 kilometers (55 miles) toward the south-southeast, where a change in wind direction began pushing the plume toward the east. On October 6, 2012, the Kamchatka Volcanic Emergency Response Team (KVERT) reported that the ash plume from Shiveluch reached an altitude of 3 kilometers (9,800 feet) above sea level, and had traveled some 220 kilometers (140 miles) from the volcano summit. Shiveluch (also spelled Sheveluch) ranks among the biggest and most active volcanoes on the Kamchatka Peninsula. Rising to 3,283 meters (10,771 feet) above sea level, Shiveluch is a stratovolcano composed of alternating layers of hardened lava, compacted ash, and rocks ejected by previous eruptions. The beige-colored expanse of rock on the volcano’s southern slopes (visible in both images) is due to an explosive eruption that occurred in 1964. Part of Shiveluch’s southern flank collapsed, and the light-colored rock is avalanche debris left by that event. High-resolution imagery of Shiveluch shows very little vegetation within that avalanche zone. On October 6, 2012, KVERT cited observations from the Moderate Resolution Imaging Spectroradiometer (MODIS) instruments on Terra and Aqua in detecting the Shiveluch eruption. This was not the first time that MODIS observed a Shiveluch eruption shortly after it started. In 2007, MODIS captured an image within minutes of the eruption’s start, before winds could blow the ash away from the summit. Credit: <b><a href="http://www.earthobservatory.nasa.gov/" rel="nofollow"> NASA Earth Observatory</a></b> <b><a href="http://www.nasa.gov/audience/formedia/features/MP_Photo_Guidelines.html" rel="nofollow">NASA image use policy.</a></b> <b><a href="http://www.nasa.gov/centers/goddard/home/index.html" rel="nofollow">NASA Goddard Space Flight Center</a></b> enables NASA’s mission through four scientific endeavors: Earth Science, Heliophysics, Solar System Exploration, and Astrophysics. Goddard plays a leading role in NASA’s accomplishments by contributing compelling scientific knowledge to advance the Agency’s mission. <b>Follow us on <a href="http://twitter.com/NASA_GoddardPix" rel="nofollow">Twitter</a></b> <b>Like us on <a href="http://www.facebook.com/pages/Greenbelt-MD/NASA-Goddard/395013845897?ref=tsd" rel="nofollow">Facebook</a></b> <b>Find us on <a href="http://instagrid.me/nasagoddard/?vm=grid" rel="nofollow">Instagram</a></b>
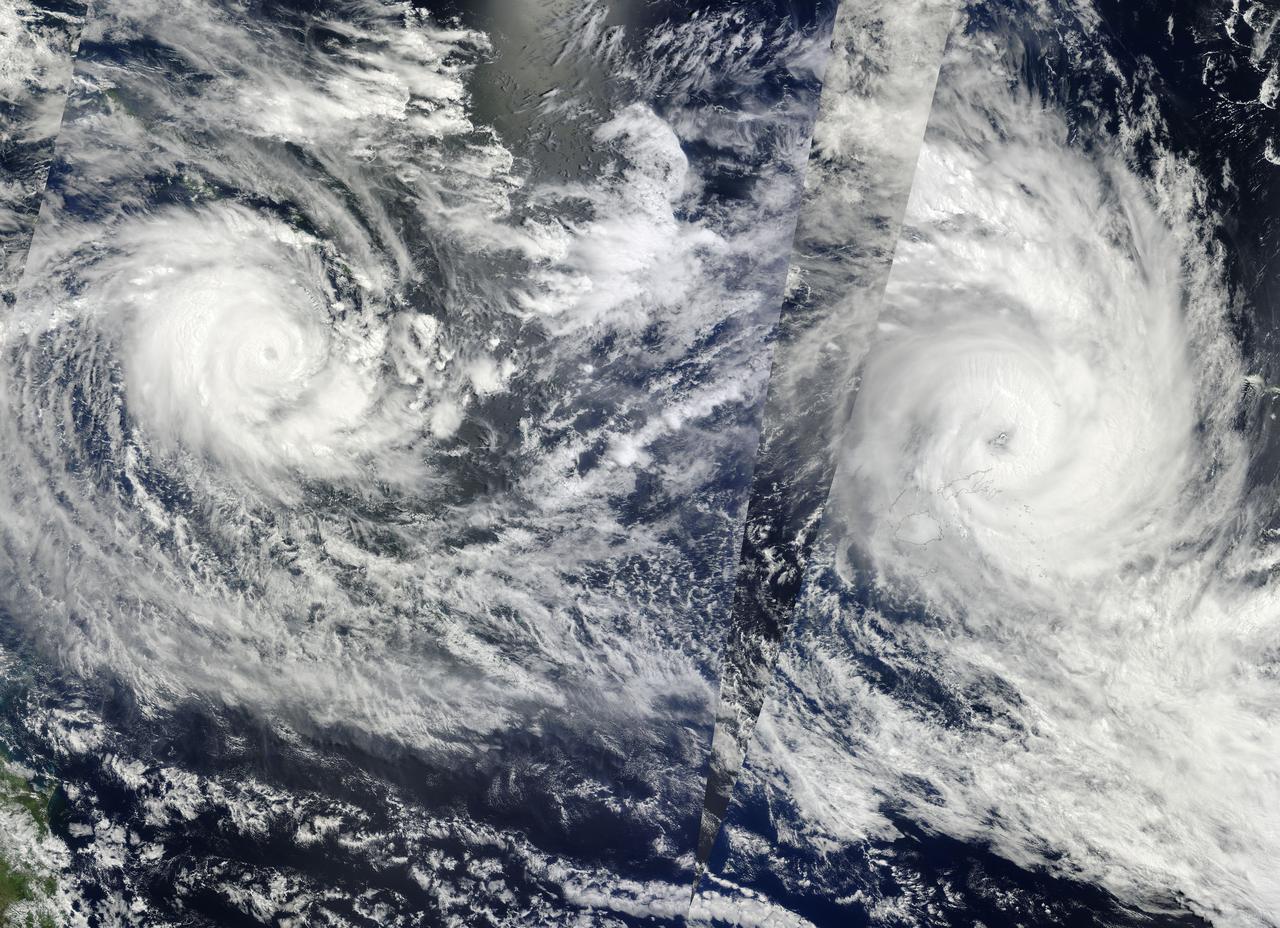
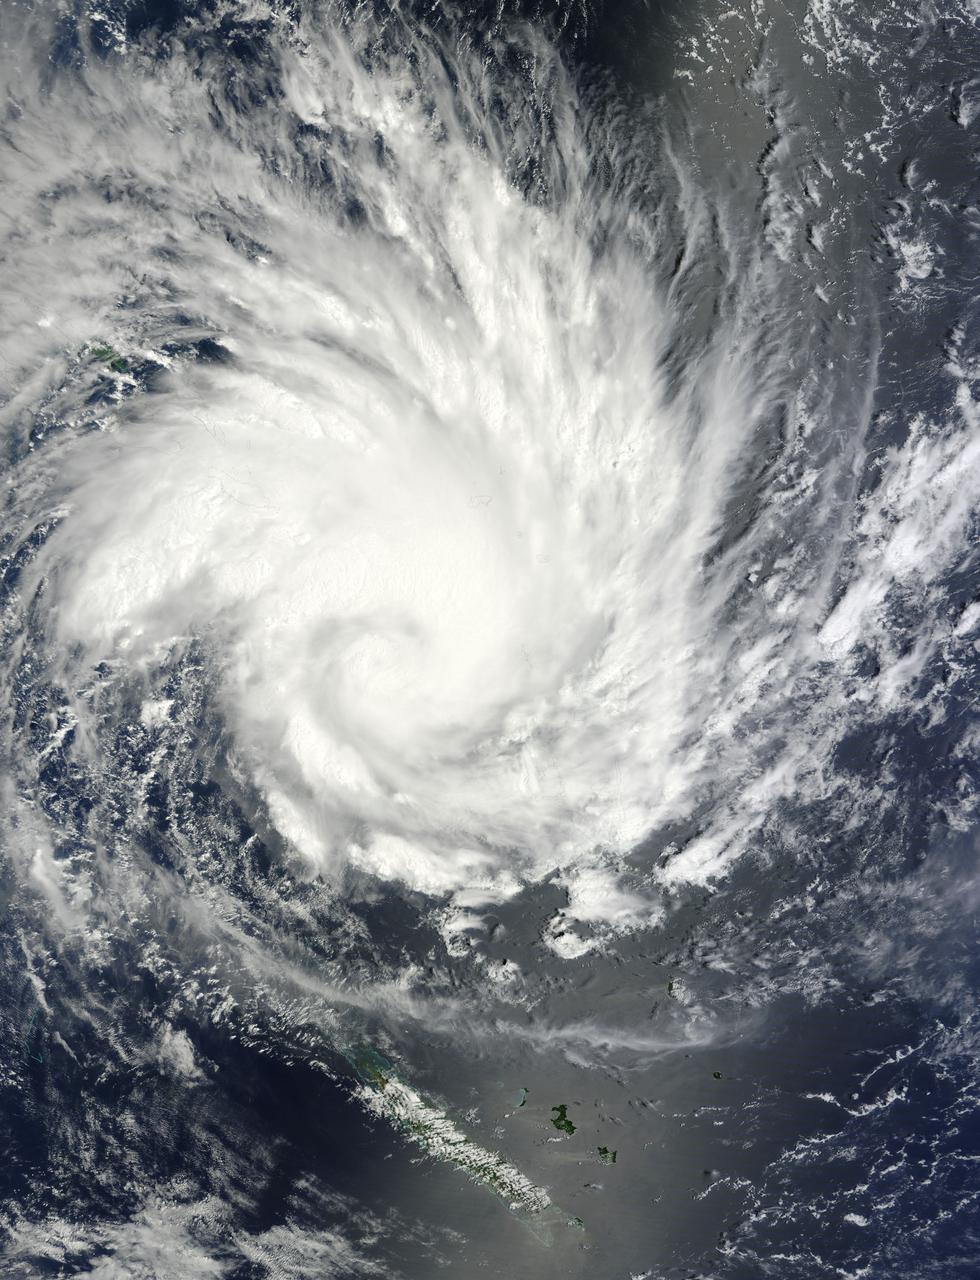
NASA Image acquired March 14 - 15, 2010 Two fierce tropical cyclones raged over the South Pacific Ocean in mid-March 2010, the U.S. Navy’s Joint Typhoon Warning Center (JTWC) reported. Over the Solomon Islands, Tropical Cyclone Ului had maximum sustained winds of 130 knots (240 kilometers per hour, 150 miles per hour) and gusts up to 160 knots (300 km/hr, 180 mph). Over Fiji, Tropical Cyclone Tomas had maximum sustained winds of 115 knots (215 km/hr, 132 mph) and gusts up to 140 knots (260 km/hr, 160 mph). The Moderate Resolution Imaging Spectroradiometer (MODIS) on NASA’s Terra and Aqua satellites captured both storms in multiple passes over the South Pacific on March 15, 2010, local time. The majority of the image is from the morning of March 15 (late March 14, UTC time) as seen by MODIS on the Terra satellite, with the right portion of the image having been acquired earliest. The wedge-shaped area right of center is from Aqua MODIS, and it was taken in the early afternoon of March 15 (local time). Although it packs less powerful winds, according to the JTWC, Tomas stretches across a larger area. It was moving over the northern Fiji islands when Terra MODIS captured the right portion of the image. According to early reports, Tomas forced more than 5,000 people from their homes while the islands sustained damage to crops and buildings. The JTWC reported that Tomas had traveled slowly toward the south and was passing over an area of high sea surface temperatures. (Warm seas provide energy for cyclones.) This storm was expected to intensify before transitioning to an extratropical storm. Ului is more compact and more powerful. A few hours before this image was taken, the storm had been an extremely dangerous Category 5 cyclone with sustained winds of 140 knots (260 km/hr, 160 mph). Ului degraded slightly before dealing the southern Solomon Islands a glancing blow. Initial news reports say that homes were damaged on the islands, but no one was injured. Like Tomas, Ului had been moving westward over an area of high sea surface temperatures. This storm was expected to continue moving westward before turning south and eventually weakening. The high-resolution image provided above is at 500 meters per pixel. The MODIS Rapid Response System provides this image at additional resolutions. NASA image by Jeff Schmaltz, MODIS Rapid Response Team, Goddard Space Flight Center. Caption by Michon Scott and Holli Riebeek. Instrument: Terra - MODIS To learn more about this image go here: <a href="http://earthobservatory.nasa.gov/IOTD/view.php?id=43154." rel="nofollow">earthobservatory.nasa.gov/IOTD/view.php?id=43154.</a>.
![KENNEDY SPACE CENTER, FLA. - - With rockets and main engine firing, the Boeing Delta II launch vehicle leaps off the pad at NASA’s Space Complex 2 on Vandenberg Air Force Base, Calif., carrying the Aura spacecraft. Aura, a mission dedicated to the health of Earth's atmosphere, successfully launched today at 3:01:59 a.m. Pacific Time. Spacecraft separation occurred at 4:06 a.m. Pacific Time, inserting Aura into a 438-mile orbit. NASA’s latest Earth-observing satellite, Aura will help us understand and protect the air we breathe. Aura will also help scientists understand how the composition of the atmosphere affects and responds to Earth's changing climate. The results from this mission will help scientists better understand the processes that connect local and global air quality. With the launch of Aura, the first series of NASA’s Earth Observing System satellites is complete. The other satellites are Terra, which monitors land, and Aqua, which observes Earth’s water cycle. [Photo: Boeing/Thom Baur]](https://images-assets.nasa.gov/image/KSC-04pd1475/KSC-04pd1475~medium.jpg)
KENNEDY SPACE CENTER, FLA. - - With rockets and main engine firing, the Boeing Delta II launch vehicle leaps off the pad at NASA’s Space Complex 2 on Vandenberg Air Force Base, Calif., carrying the Aura spacecraft. Aura, a mission dedicated to the health of Earth's atmosphere, successfully launched today at 3:01:59 a.m. Pacific Time. Spacecraft separation occurred at 4:06 a.m. Pacific Time, inserting Aura into a 438-mile orbit. NASA’s latest Earth-observing satellite, Aura will help us understand and protect the air we breathe. Aura will also help scientists understand how the composition of the atmosphere affects and responds to Earth's changing climate. The results from this mission will help scientists better understand the processes that connect local and global air quality. With the launch of Aura, the first series of NASA’s Earth Observing System satellites is complete. The other satellites are Terra, which monitors land, and Aqua, which observes Earth’s water cycle. [Photo: Boeing/Thom Baur]
![KENNEDY SPACE CENTER, FLA. - With rockets and main engine firing, the Boeing Delta II launch vehicle leaps off the pad at NASA’s Space Complex 2 on Vandenberg Air Force Base, Calif., carrying the Aura spacecraft. Aura, a mission dedicated to the health of Earth's atmosphere, successfully launched today at 3:01:59 a.m. Pacific Time. Spacecraft separation occurred at 4:06 a.m. Pacific Time, inserting Aura into a 438-mile orbit. NASA’s latest Earth-observing satellite, Aura will help us understand and protect the air we breathe. Aura will also help scientists understand how the composition of the atmosphere affects and responds to Earth's changing climate. The results from this mission will help scientists better understand the processes that connect local and global air quality. With the launch of Aura, the first series of NASA’s Earth Observing System satellites is complete. The other satellites are Terra, which monitors land, and Aqua, which observes Earth’s water cycle. [Photo: Boeing/Thom Baur]](https://images-assets.nasa.gov/image/KSC-04pd1474/KSC-04pd1474~medium.jpg)
KENNEDY SPACE CENTER, FLA. - With rockets and main engine firing, the Boeing Delta II launch vehicle leaps off the pad at NASA’s Space Complex 2 on Vandenberg Air Force Base, Calif., carrying the Aura spacecraft. Aura, a mission dedicated to the health of Earth's atmosphere, successfully launched today at 3:01:59 a.m. Pacific Time. Spacecraft separation occurred at 4:06 a.m. Pacific Time, inserting Aura into a 438-mile orbit. NASA’s latest Earth-observing satellite, Aura will help us understand and protect the air we breathe. Aura will also help scientists understand how the composition of the atmosphere affects and responds to Earth's changing climate. The results from this mission will help scientists better understand the processes that connect local and global air quality. With the launch of Aura, the first series of NASA’s Earth Observing System satellites is complete. The other satellites are Terra, which monitors land, and Aqua, which observes Earth’s water cycle. [Photo: Boeing/Thom Baur]
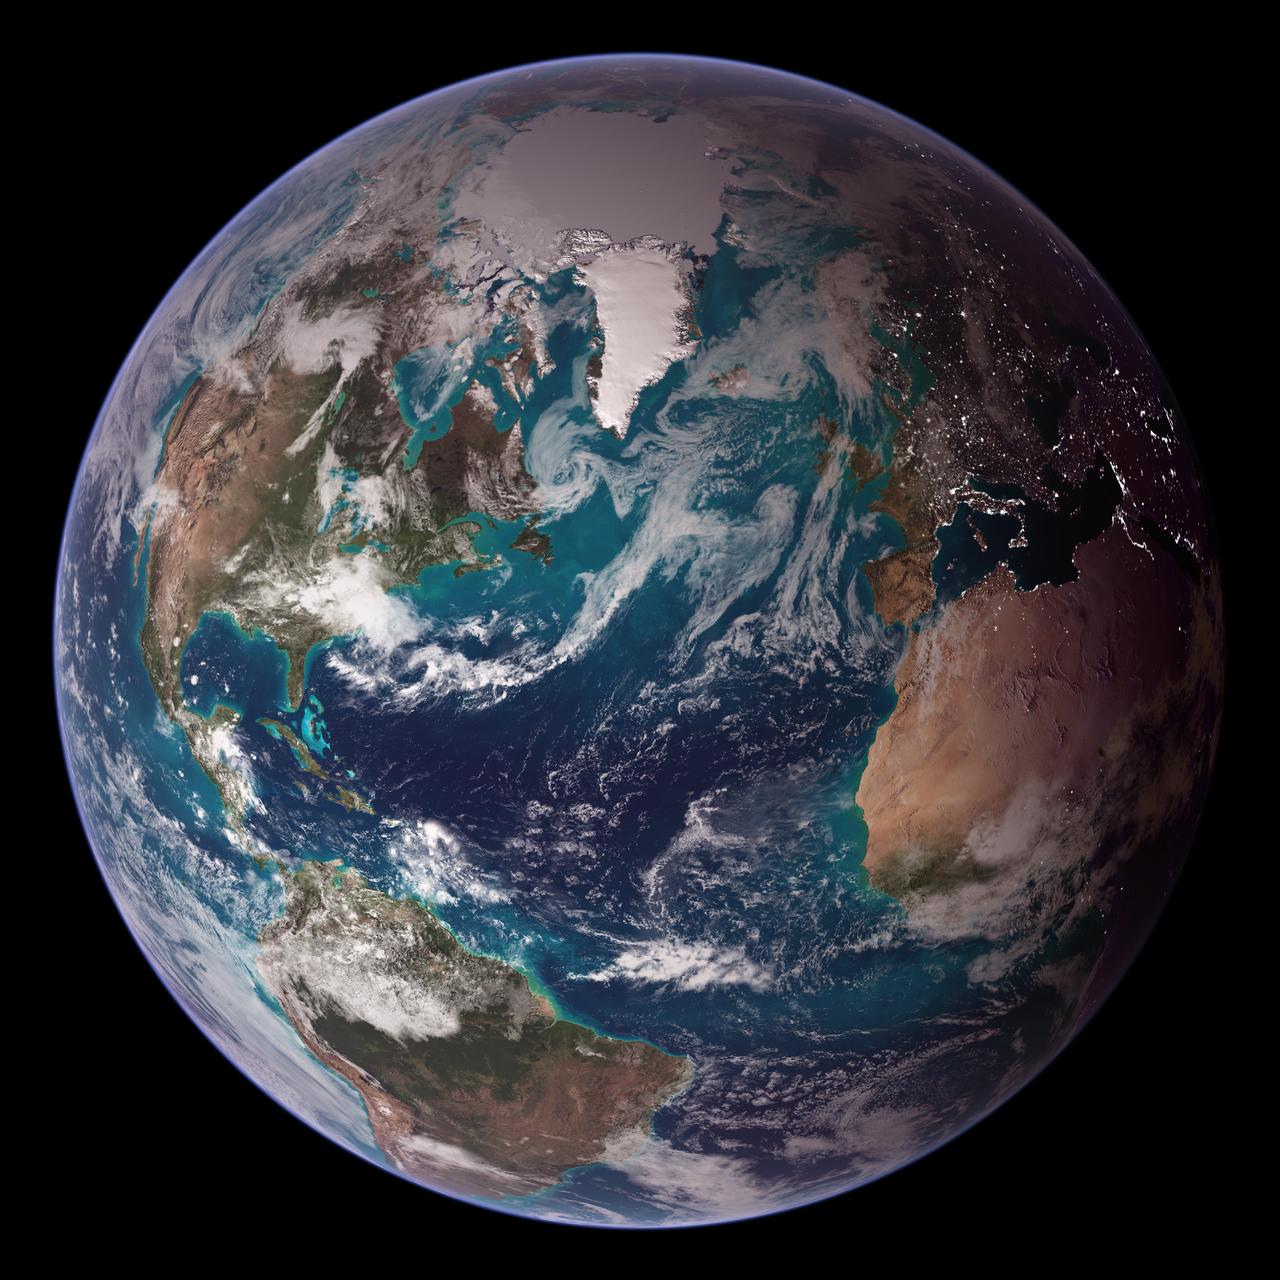
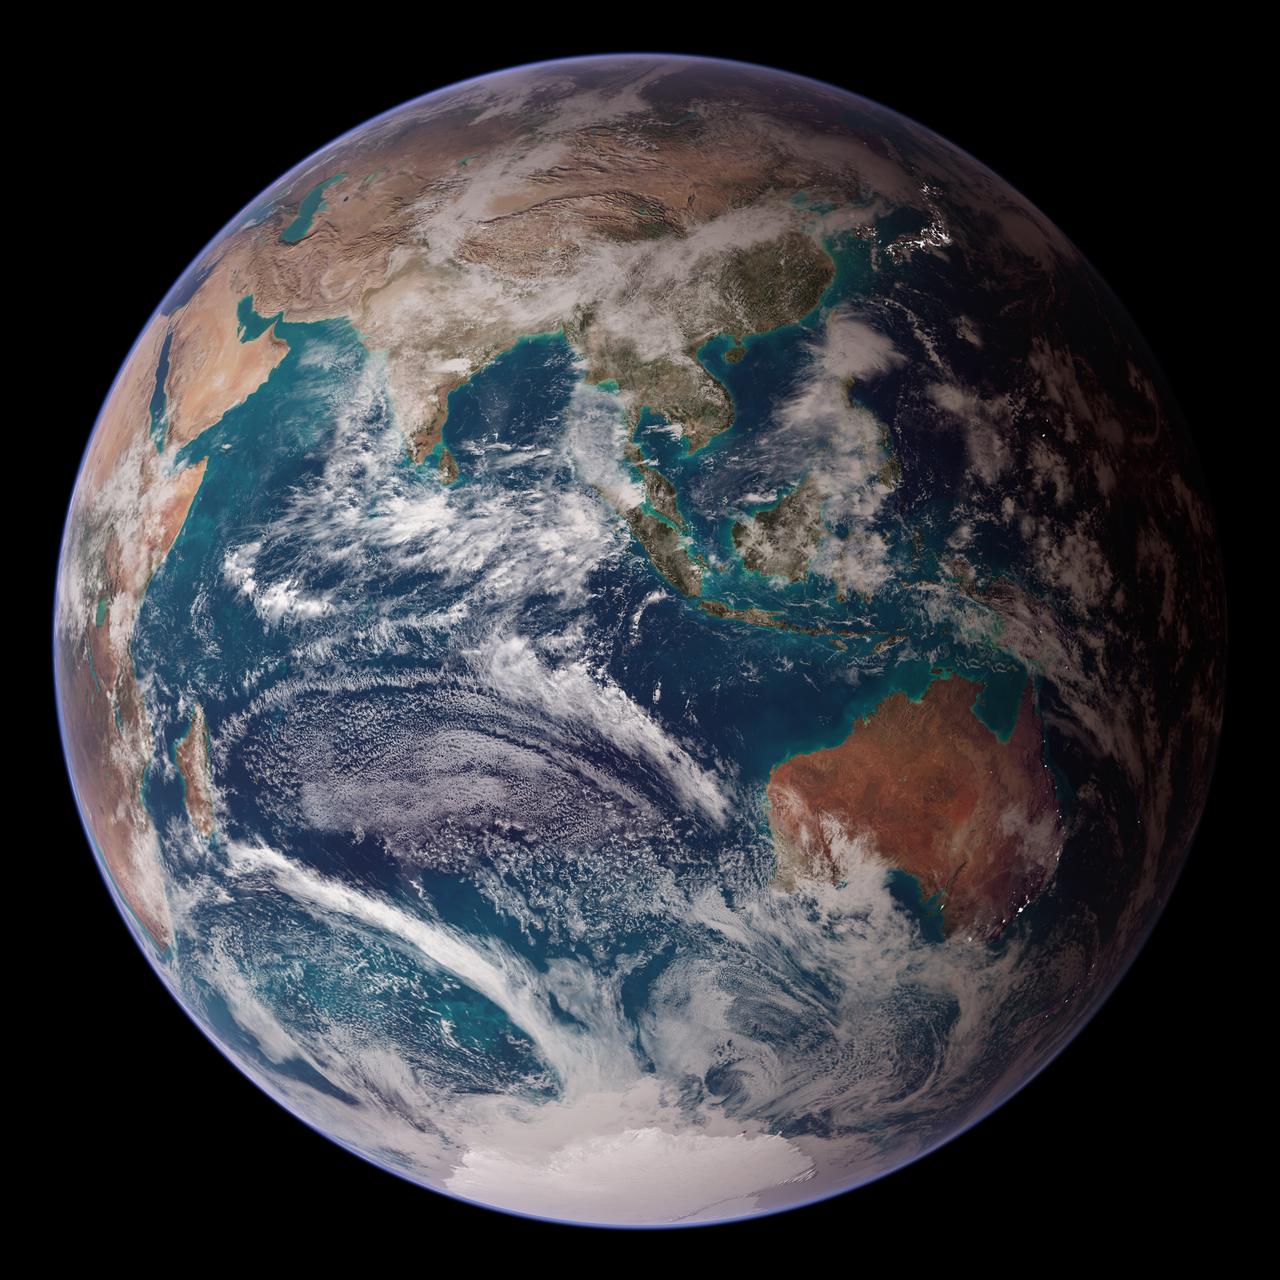
<b>RELEASE DATE: OCTOBER 9, 2007</b> <b>Credit: NASA/Goddard Space Flight Center/Reto Stöckli</b> A day’s clouds. The shape and texture of the land. The living ocean. City lights as a beacon of human presence across the globe. This amazingly beautiful view of Earth from space is a fusion of science and art, a showcase for the remote-sensing technology that makes such views possible, and a testament to the passion and creativity of the scientists who devote their careers to understanding how land, ocean, and atmosphere—even life itself—interact to generate Earth’s unique (as far as we know!) life-sustaining environment. Drawing on data from multiple satellite missions (not all collected at the same time), a team of NASA scientists and graphic artists created layers of global data for everything from the land surface, to polar sea ice, to the light reflected by the chlorophyll in the billions of microscopic plants that grow in the ocean. They wrapped these layers around a globe, set it against a black background, and simulated the hazy edge of the Earth’s atmosphere (the limb) that appears in astronaut photography of the Earth. The land surface layer is based on photo-like surface reflectance observations (reflected sunlight) measured by the Moderate Resolution Imaging Spectroradiometer (MODIS) on NASA’s Terra satellite in July 2004. The sea ice layer near the poles comes from Terra MODIS observations of daytime sea ice observed between August 28 and September 6, 2001. The ocean layer is a composite. In shallow water areas, the layer shows surface reflectances observed by Terra MODIS in July 2004. In the open ocean, the photo-like layer is overlaid with observations of the average ocean chlorophyll content for 2004. NASA’s Aqua MODIS collected the chlorophyll data. The cloud layer shows a single-day snapshot of clouds observed by Terra MODIS across the planet on July 29, 2001. City lights on Earth’s night side are visualized from data collected by the Defense Meteorological Satellite Program mission between 1994–1995. The topography layer is based on radar data collected by the Space Shuttle Endeavour during an 11-day mission in February of 2000. Topography over Antarctica comes from the Radarsat Antarctic Mapping Project, version 2. Most of the data layers in this visualization are available as monthly composites as part of NASA’s Blue Marble Next Generation image collection. The images in the collection appear in cylindrical projection (rectangular maps), and they are available at 500-meter resolution. The large images provided above are the full-size versions of these globes. In their hope that these images will inspire people to appreciate the beauty of our home planet and to learn about the Earth system, the developers of these images encourage readers to re-use and re-publish the images freely. NASA images by Reto Stöckli, based on data from NASA and NOAA. To learn the history of the Blue Marble go here: <a href="http://earthobservatory.nasa.gov/Features/BlueMarble/BlueMarble_history.php" rel="nofollow">earthobservatory.nasa.gov/Features/BlueMarble/BlueMarble_...</a> To learn more about the Blue Marble go here: <a href="http://earthobservatory.nasa.gov/IOTD/view.php?id=8108" rel="nofollow">earthobservatory.nasa.gov/IOTD/view.php?id=8108</a> <b><a href="http://www.nasa.gov/centers/goddard/home/index.html" rel="nofollow">NASA Goddard Space Flight Center</a></b> is home to the nation's largest organization of combined scientists, engineers and technologists that build spacecraft, instruments and new technology to study the Earth, the sun, our solar system, and the universe. <b>Follow us on <a href="http://twitter.com/NASA_GoddardPix" rel="nofollow">Twitter</a></b> <b>Join us on <a href="http://www.facebook.com/pages/Greenbelt-MD/NASA-Goddard/395013845897?ref=tsd" rel="nofollow">Facebook</a><b> </b></b>
NASA's Terra satellite passed over Tropical Storm Isaac on Aug. 24 at 15:20 UTC (11:20 a.m. EDT) as it continued moving through the eastern Caribbean Sea. The MODIS instrument onboard Aqua captured this visible image. At 2 p.m. EDT on Aug. 24, Isaac's maximum sustained winds were near 60 mph (95 kmh). The National Hurricane Center noted that Isaac could strengthen later before reaching the coast of Hispaniola tonight, Aug. 24. Hispaniola is an island that contains the Dominican Republic and Haiti. Isaac is located about 135 miles (215 km) south-southeast of Port au Prince, Haiti, near latitude 16.8 north and longitude 71.4 west. Isaac is now moving toward the northwest near 14 mph (22 kmh). Isaac is expected to reach hurricane status over the weekend of Aug. 25-26 and NASA satellites will continue providing valuable temperature, rainfall, visible and infrared data. Text Credit: Rob Gutro NASA's Goddard Space Flight Center, Greenbelt, Md. <b>To read more go to: <a href="http://www.nasa.gov/mission_pages/hurricanes/archives/2012/h2012_Isaac.html" rel="nofollow">www.nasa.gov/mission_pages/hurricanes/archives/2012/h2012...</a></b> Credit: NASA Goddard MODIS Rapid Response Team <b><a href="http://www.nasa.gov/audience/formedia/features/MP_Photo_Guidelines.html" rel="nofollow">NASA image use policy.</a></b> <b><a href="http://www.nasa.gov/centers/goddard/home/index.html" rel="nofollow">NASA Goddard Space Flight Center</a></b> enables NASA’s mission through four scientific endeavors: Earth Science, Heliophysics, Solar System Exploration, and Astrophysics. Goddard plays a leading role in NASA’s accomplishments by contributing compelling scientific knowledge to advance the Agency’s mission. <b>Follow us on <a href="http://twitter.com/NASA_GoddardPix" rel="nofollow">Twitter</a></b> <b>Like us on <a href="http://www.facebook.com/pages/Greenbelt-MD/NASA-Goddard/395013845897?ref=tsd" rel="nofollow">Facebook</a></b> <b>Find us on <a href="http://instagrid.me/nasagoddard/?vm=grid" rel="nofollow">Instagram</a></b>

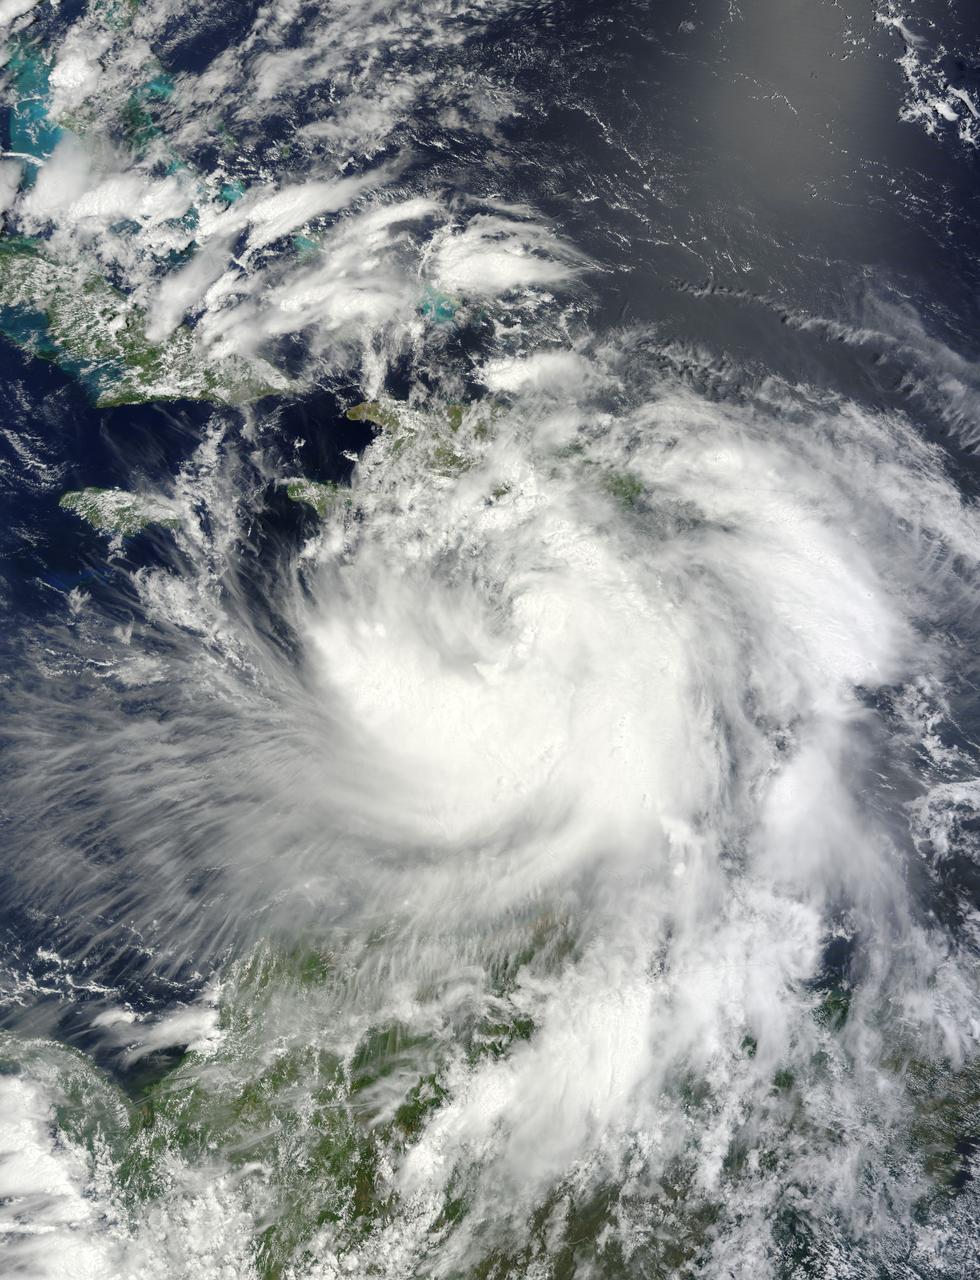
Read more from: <a href="http://go.nasa.gov/2duxEeZ" rel="nofollow">go.nasa.gov/2duxEeZ</a> On October 4, 2016, Hurricane Matthew made landfall on southwestern Haiti as a category-4 storm—the strongest storm to hit the Caribbean nation in more than 50 years. Just hours after landfall, the Moderate Resolution Imaging Spectroradiometer (MODIS) on NASA’s Terra satellite acquired this natural-color image. At the time, Matthew had top sustained winds of about 230 kilometers (145 miles) per hour. Earlier on October 4, temperature data collected by MODIS on NASA’s Aqua satellite revealed that the cloud tops around Matthew were very cold (at least -57° Celsius, or -70° Fahrenheit). Cold cloud tops are known to produce heavy rainfall. The National Hurricane Center called for 380 to 500 millimeters (15 to 20 inches) of rain in Southern Haiti and in the southwestern Dominican Republic. The northward movement of the storm should bring the center of Matthew over eastern Cuba late on October 4. Dangerous conditions can extend far beyond a storm’s center. According to National Hurricane Center forecasters, Matthew is “likely to produce devastating impacts from storm surge, extreme winds, heavy rains, flash floods, and/or mudslides in portions of the watch and warning areas in Haiti, Cuba, and the Bahamas.” NASA Earth Observatory image by Joshua Stevens, using MODIS data from the Land Atmosphere Near real-time Capability for EOS (LANCE). Caption by Kathryn Hansen.
<b>RELEASE DATE: OCTOBER 9, 2007</b> <b>Credit: NASA/Goddard Space Flight Center/Reto Stöckli</b> A day’s clouds. The shape and texture of the land. The living ocean. City lights as a beacon of human presence across the globe. This amazingly beautiful view of Earth from space is a fusion of science and art, a showcase for the remote-sensing technology that makes such views possible, and a testament to the passion and creativity of the scientists who devote their careers to understanding how land, ocean, and atmosphere—even life itself—interact to generate Earth’s unique (as far as we know!) life-sustaining environment. Drawing on data from multiple satellite missions (not all collected at the same time), a team of NASA scientists and graphic artists created layers of global data for everything from the land surface, to polar sea ice, to the light reflected by the chlorophyll in the billions of microscopic plants that grow in the ocean. They wrapped these layers around a globe, set it against a black background, and simulated the hazy edge of the Earth’s atmosphere (the limb) that appears in astronaut photography of the Earth. The land surface layer is based on photo-like surface reflectance observations (reflected sunlight) measured by the Moderate Resolution Imaging Spectroradiometer (MODIS) on NASA’s Terra satellite in July 2004. The sea ice layer near the poles comes from Terra MODIS observations of daytime sea ice observed between August 28 and September 6, 2001. The ocean layer is a composite. In shallow water areas, the layer shows surface reflectances observed by Terra MODIS in July 2004. In the open ocean, the photo-like layer is overlaid with observations of the average ocean chlorophyll content for 2004. NASA’s Aqua MODIS collected the chlorophyll data. The cloud layer shows a single-day snapshot of clouds observed by Terra MODIS across the planet on July 29, 2001. City lights on Earth’s night side are visualized from data collected by the Defense Meteorological Satellite Program mission between 1994–1995. The topography layer is based on radar data collected by the Space Shuttle Endeavour during an 11-day mission in February of 2000. Topography over Antarctica comes from the Radarsat Antarctic Mapping Project, version 2. Most of the data layers in this visualization are available as monthly composites as part of NASA’s Blue Marble Next Generation image collection. The images in the collection appear in cylindrical projection (rectangular maps), and they are available at 500-meter resolution. The large images provided above are the full-size versions of these globes. In their hope that these images will inspire people to appreciate the beauty of our home planet and to learn about the Earth system, the developers of these images encourage readers to re-use and re-publish the images freely. NASA images by Reto Stöckli, based on data from NASA and NOAA. To learn the history of the Blue Marble go here: <a href="http://earthobservatory.nasa.gov/Features/BlueMarble/BlueMarble_history.php" rel="nofollow">earthobservatory.nasa.gov/Features/BlueMarble/BlueMarble_...</a> To learn more about the Blue Marble go here: <a href="http://earthobservatory.nasa.gov/IOTD/view.php?id=8108" rel="nofollow">earthobservatory.nasa.gov/IOTD/view.php?id=8108</a> To learn more about NASA's Goddard Space Flight Center go here: <a href="http://www.nasa.gov/centers/goddard/home/index.html" rel="nofollow">www.nasa.gov/centers/goddard/home/index.html</a> <b><a href="http://www.nasa.gov/centers/goddard/home/index.html" rel="nofollow">NASA Goddard Space Flight Center</a></b> is home to the nation's largest organization of combined scientists, engineers and technologists that build spacecraft, instruments and new technology to study the Earth, the sun, our solar system, and the universe. <b><a href="http://www.nasa.gov/centers/goddard/home/index.html" rel="nofollow">NASA Goddard Space Flight Center</a></b> is home to the nation's largest organization of combined scientists, engineers and technologists that build spacecraft, instruments and new technology to study the Earth, the sun, our solar system, and the universe. <b>Follow us on <a href="http://twitter.com/NASA_GoddardPix" rel="nofollow">Twitter</a></b> <b>Join us on <a href="http://www.facebook.com/pages/Greenbelt-MD/NASA-Goddard/395013845897?ref=tsd" rel="nofollow">Facebook</a><b> </b></b>
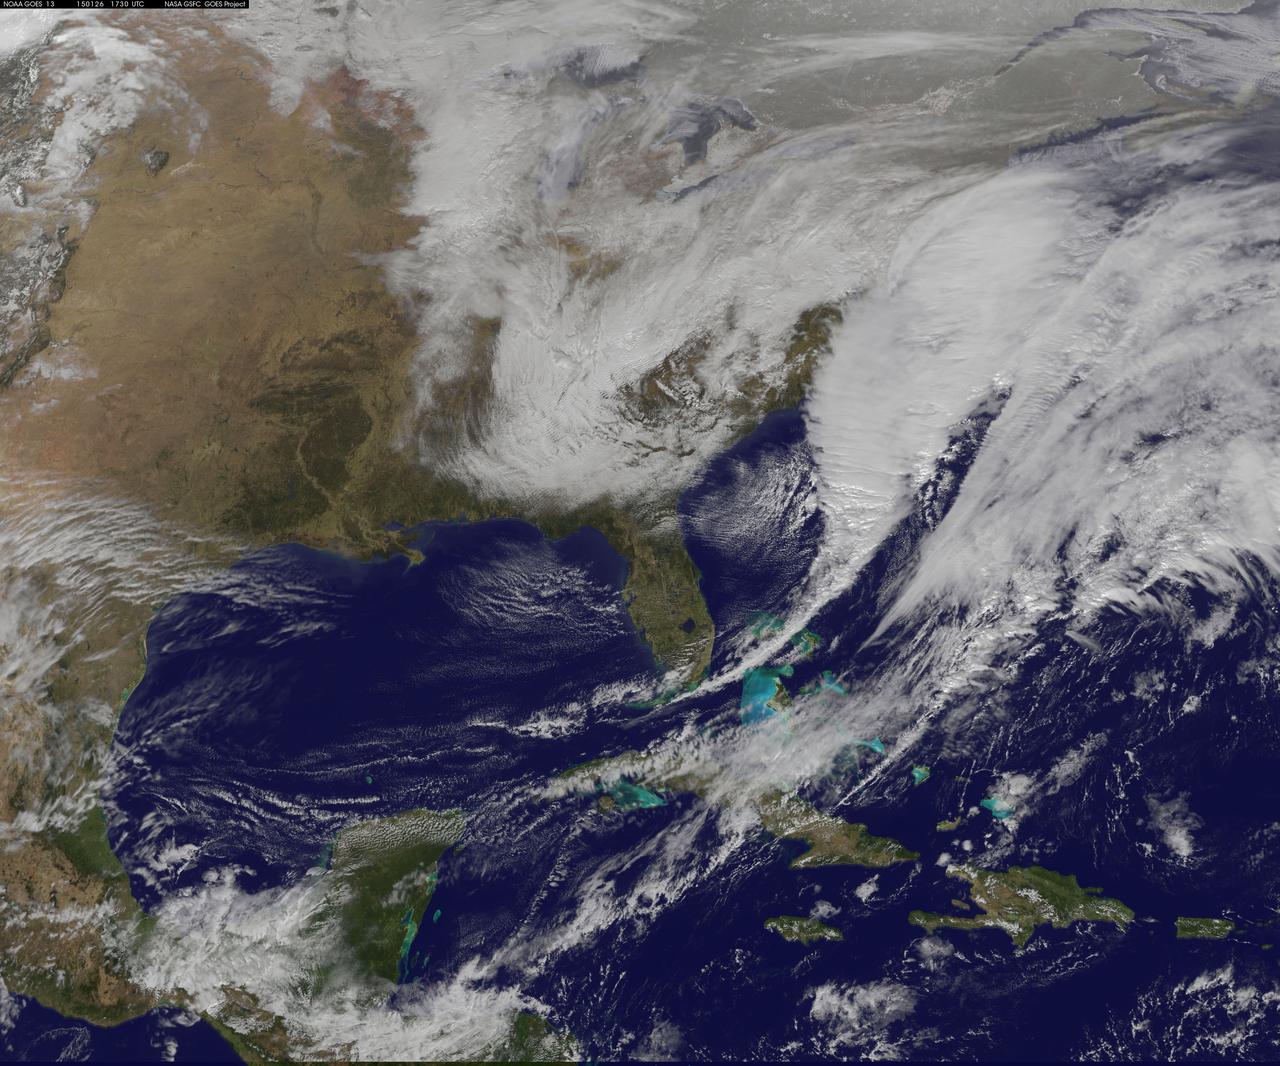
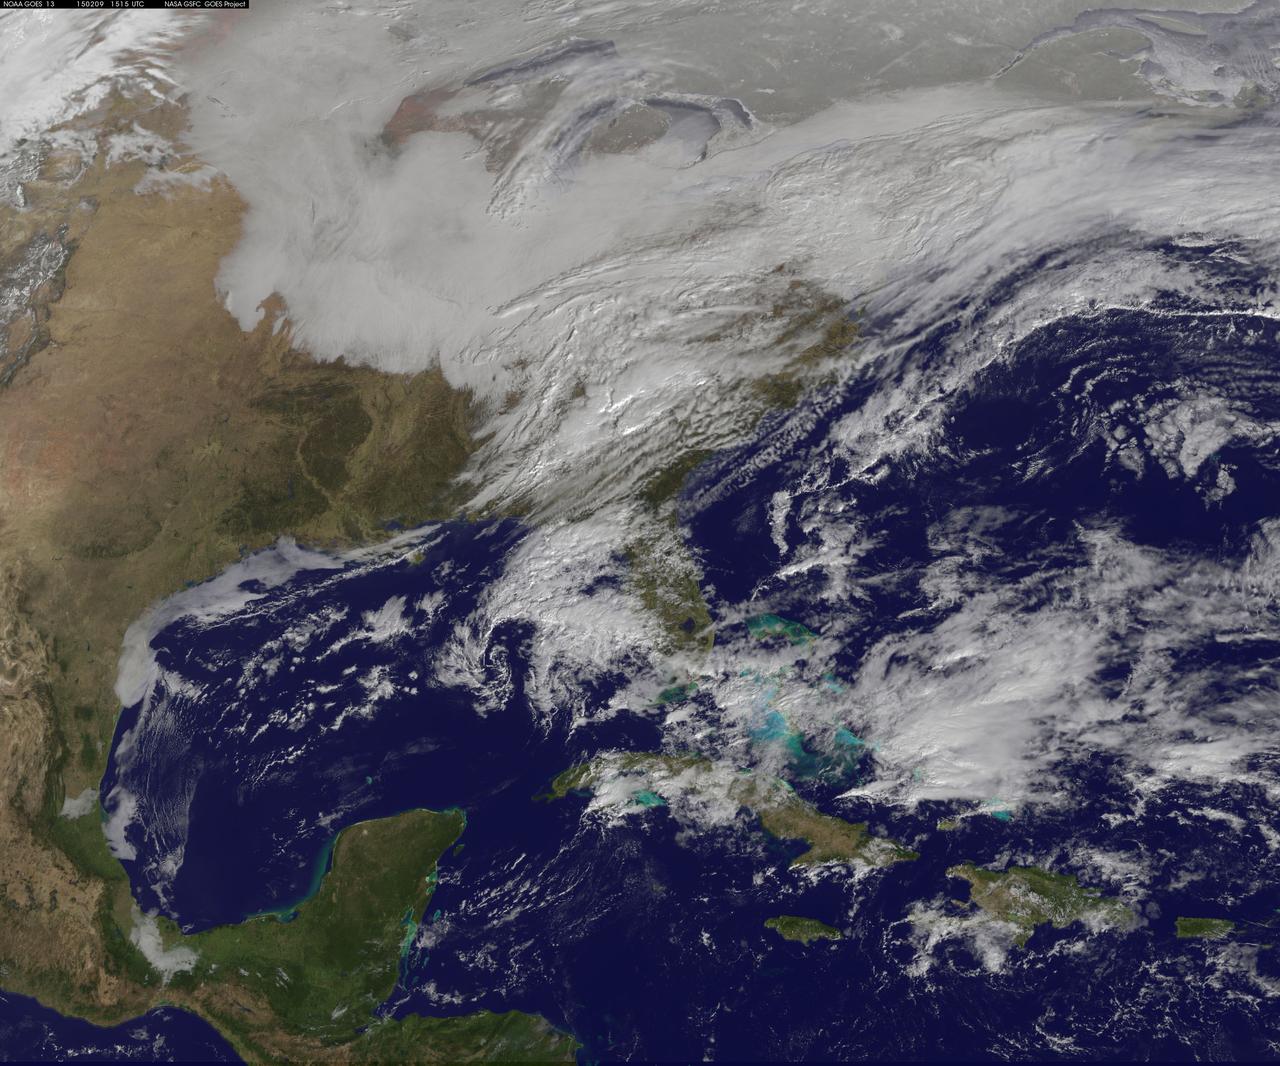
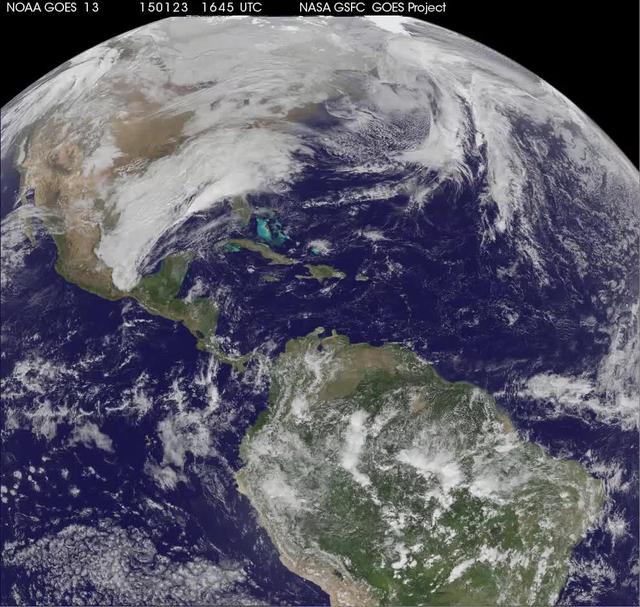
National Weather Service forecasters have been tracking a low pressure area that moved from the Midwest into the Atlantic Ocean today, and is expected to become a strong nor'easter that will bring blizzard conditions to the northeastern U.S. The path of the system was captured in a NASA movie of NOAA's GOES-East satellite imagery. On Monday, January 26, 2015, the National Weather Service noted: A storm system off the East Coast will continue to strengthen as it develops into a major nor'easter on Monday. As the storm moves up the coast, it is expected to bring snowfall of 1-3 feet or more to many parts of the Northeast through Tuesday evening, including New York City and Boston. Strong, gusty winds will combine with the snow to create blizzard conditions along and near the coast. Winter storm warnings are in effect for the panhandles of West Virginia and Maryland, much of interior New England down to the northern Mid-Atlantic as well as for Nantucket Island, Massachusetts. Winter weather advisories are in effect for portions of the Ohio Valley, Mid-Atlantic and the southern Appalachians as well as a narrow area across interior New England. To create the video and imagery, NASA/NOAA's GOES Project located at NASA's Goddard Space Flight Center in Greenbelt, Maryland overlays the cloud data from NOAA's GOES-East satellite on a true-color image of land and ocean created by data from the Moderate Resolution Imaging Spectroradiometer, or MODIS, instrument that flies aboard NASA's Aqua and Terra satellites. Together, these data create the entire animation of the storm and show its movement. GOES satellites provide the kind of continuous monitoring necessary for intensive data analysis. Geostationary describes an orbit in which a satellite is always in the same position with respect to the rotating Earth. This allows GOES to hover continuously over one position on Earth's surface, appearing stationary. As a result, GOES provide a constant vigil for the atmospheric "triggers" for severe weather conditions such as tornadoes, flash floods, hail storms and hurricanes. For updated information about the storm system, visit NOAA's NWS website: <a href="http://www.weather.gov" rel="nofollow">www.weather.gov</a> For more information about GOES satellites, visit: <a href="http://www.goes.noaa.gov/" rel="nofollow">www.goes.noaa.gov/</a> or goes.gsfc.nasa.gov/ Rob Gutro NASA's Goddard Space Flight Center
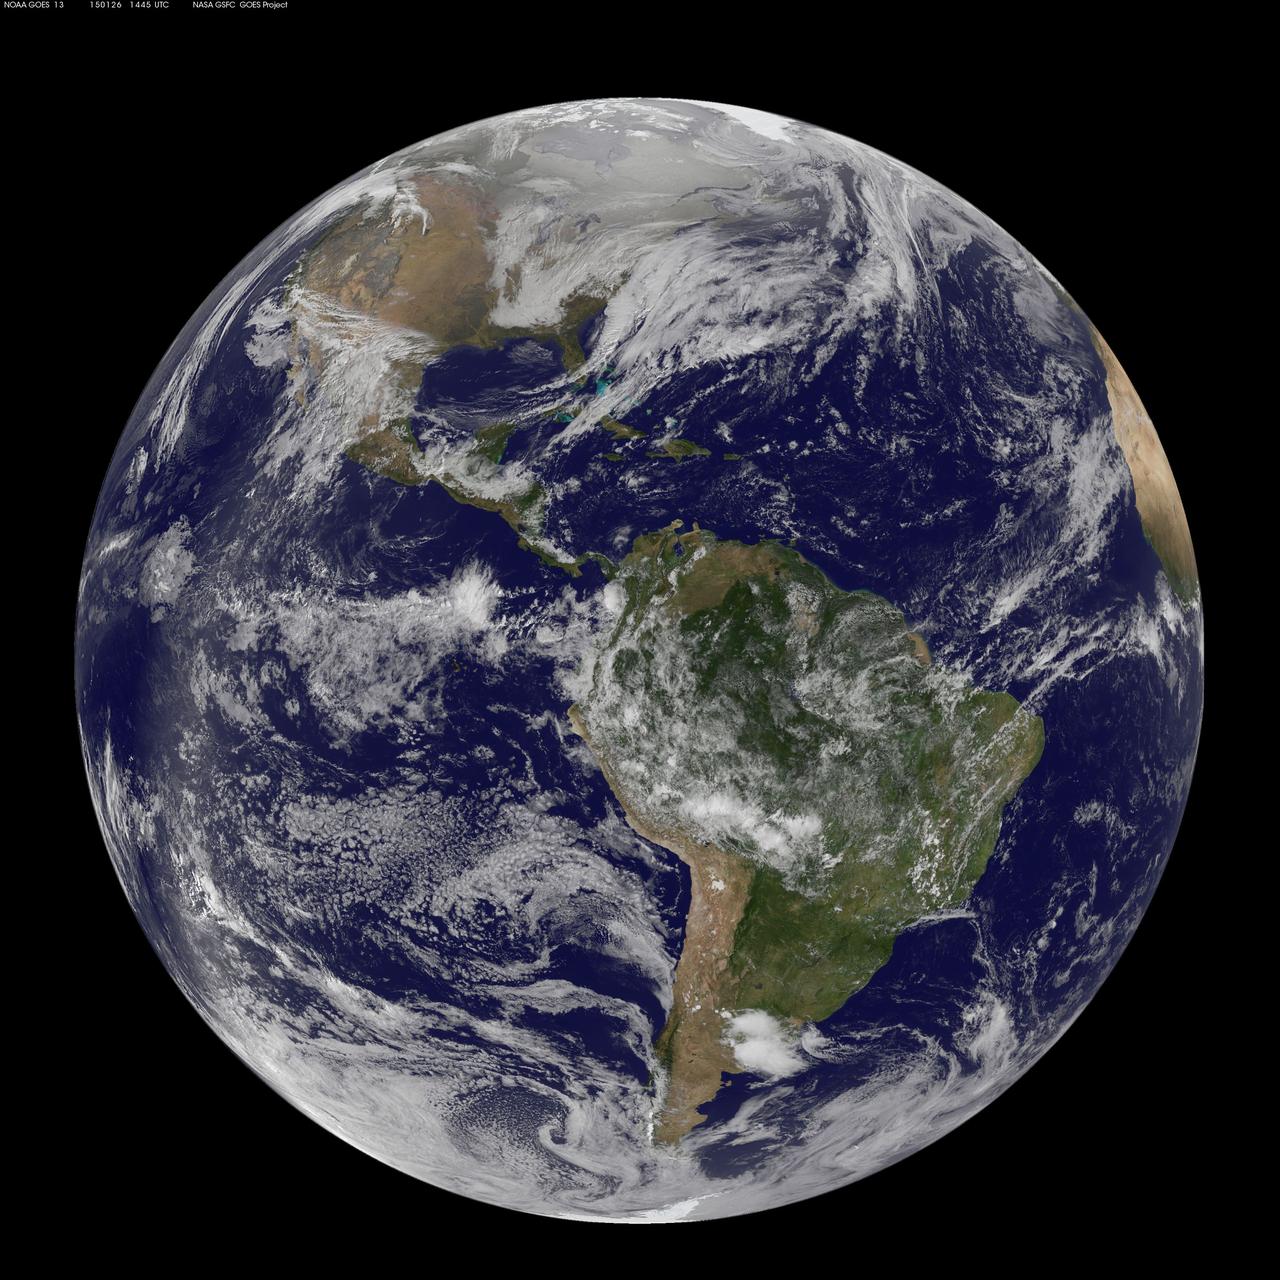
National Weather Service forecasters have been tracking a low pressure area that moved from the Midwest into the Atlantic Ocean today, and is expected to become a strong nor'easter that will bring blizzard conditions to the northeastern U.S. The path of the system was captured in a NASA movie of NOAA's GOES-East satellite imagery. (This GOES 13 image was captured on January 26, 2015 at 1445 UTC.) On Monday, January 26, 2015, the National Weather Service noted: A storm system off the East Coast will continue to strengthen as it develops into a major nor'easter on Monday. As the storm moves up the coast, it is expected to bring snowfall of 1-3 feet or more to many parts of the Northeast through Tuesday evening, including New York City and Boston. Strong, gusty winds will combine with the snow to create blizzard conditions along and near the coast. Winter storm warnings are in effect for the panhandles of West Virginia and Maryland, much of interior New England down to the northern Mid-Atlantic as well as for Nantucket Island, Massachusetts. Winter weather advisories are in effect for portions of the Ohio Valley, Mid-Atlantic and the southern Appalachians as well as a narrow area across interior New England. To create the video and imagery, NASA/NOAA's GOES Project located at NASA's Goddard Space Flight Center in Greenbelt, Maryland overlays the cloud data from NOAA's GOES-East satellite on a true-color image of land and ocean created by data from the Moderate Resolution Imaging Spectroradiometer, or MODIS, instrument that flies aboard NASA's Aqua and Terra satellites. Together, these data create the entire animation of the storm and show its movement. GOES satellites provide the kind of continuous monitoring necessary for intensive data analysis. Geostationary describes an orbit in which a satellite is always in the same position with respect to the rotating Earth. This allows GOES to hover continuously over one position on Earth's surface, appearing stationary. As a result, GOES provide a constant vigil for the atmospheric "triggers" for severe weather conditions such as tornadoes, flash floods, hail storms and hurricanes. For updated information about the storm system, visit NOAA's NWS website: <a href="http://www.weather.gov" rel="nofollow">www.weather.gov</a> For more information about GOES satellites, visit: <a href="http://www.goes.noaa.gov/" rel="nofollow">www.goes.noaa.gov/</a> or goes.gsfc.nasa.gov/ Rob Gutro NASA's Goddard Space Flight Center
NASA image acquired January 30, 2011 at 23:20 UTC. Satellite: Terra <b> Click here to see the most recent image captured Feb. 1: <a href="http://www.flickr.com/photos/gsfc/5407540724/">www.flickr.com/photos/gsfc/5407540724/</a></b> Tropical Storm Anthony made landfall in Queensland, Australia this past weekend, and now the residents are watching a larger, more powerful cyclone headed their way. NASA's Terra satellite captured a visible image of the large Tropical Cyclone Yasi late yesterday as it makes its way west through the Coral Sea toward Queensland. The Moderate Resolution Imaging Spectroradiometer (MODIS) instrument that flies aboard NASA's Terra satellite captured an image of Cyclone Yasi on Jan. 30 at 23:20 UTC (6:20 p.m. EST/09:20 a.m., Monday, January 31 in Australia/Brisbane local time). Although the image did not reveal a visible eye, the storm appears to be well-formed and also appears to be strengthening. Warnings and watches are already in effect throughout the Coral Sea. The Solomon Islands currently have a Tropical Cyclone warning for the provinces of Temotu, Rennell & Bellona, Makira and Guadalcanal. The Australian Bureau of Meteorology has already posted a Tropical Cyclone Watch from Cooktown to Yeppoon and inland to between Georgetown and Moranbah in Queensland, Australia. The Australian Bureau of Meteorology expects damaging winds to develop in coastal and island communities between Cooktown and Yeppoon Wednesday morning, and inland areas on Wednesday afternoon. Updates from the Australian Bureau of Meteorology can be monitored at the Bureau's website at <a href="http://www.bom.gov.au" rel="nofollow">www.bom.gov.au</a>. On January 31 at 1500 UTC (10 a.m. EST/ 1:00 a.m. Tuesday February 1, 2011 in Australia/Brisbane local time), Tropical Cyclone Yasi had maximum sustained winds near 90 knots (103 mph/166 kmh). Yasi is a Category Two Cyclone on the Saffir-Simpson Scale. It was centered about 875 miles E of Cairns, Australia, near 13.4 South latitude and 160.4 East longitude. It was moving west near 19 knots (22 mph/35 kmh). Cyclone-force winds extend out to 30 miles (48 km) from the center. Animated infrared satellite imagery, such as that from the Atmospheric Infrared Sounder (AIRS) that flies on NASA's Aqua satellite, showed deep convective (thunderstorm) bands wrapping tighter into the low level circulation center. Wrapping bands of thunderstorms indicate strengthening. Yasi is forecast to move west then southwestward into an area of low vertical wind shear (strong wind shear can weaken a storm). Forecasters at the Joint Typhoon Warning Center (JTWC) expect Yasi to continue strengthening over the next 36 hours. JTWC forecasts a landfall just south of Cairns as a large 100-plus knot (115 mph/185 kmh)n system by Wednesday. Residents along the Queensland coast should now be making preparations now for the storm's arrival. Rob Gutro NASA's Goddard Space Flight Center Credit: NASA/GSFC/Jeff Schmaltz/MODIS Land Rapid Response Team Click here to see more images from <b><a href="http://rapidfire.sci.gsfc.nasa.gov/gallery/?latest" rel="nofollow">MODIS</a></b> <b><a href="http://www.nasa.gov/centers/goddard/home/index.html" rel="nofollow">NASA Goddard Space Flight Center</a></b> enables NASA’s mission through four scientific endeavors: Earth Science, Heliophysics, Solar System Exploration, and Astrophysics. Goddard plays a leading role in NASA’s accomplishments by contributing compelling scientific knowledge to advance the Agency’s mission. <b>Follow us on <a href="http://twitter.com/NASA_GoddardPix" rel="nofollow">Twitter</a></b> <b>Join us on <a href="http://www.facebook.com/pages/Greenbelt-MD/NASA-Goddard/395013845897?ref=tsd" rel="nofollow">Facebook</a></b>
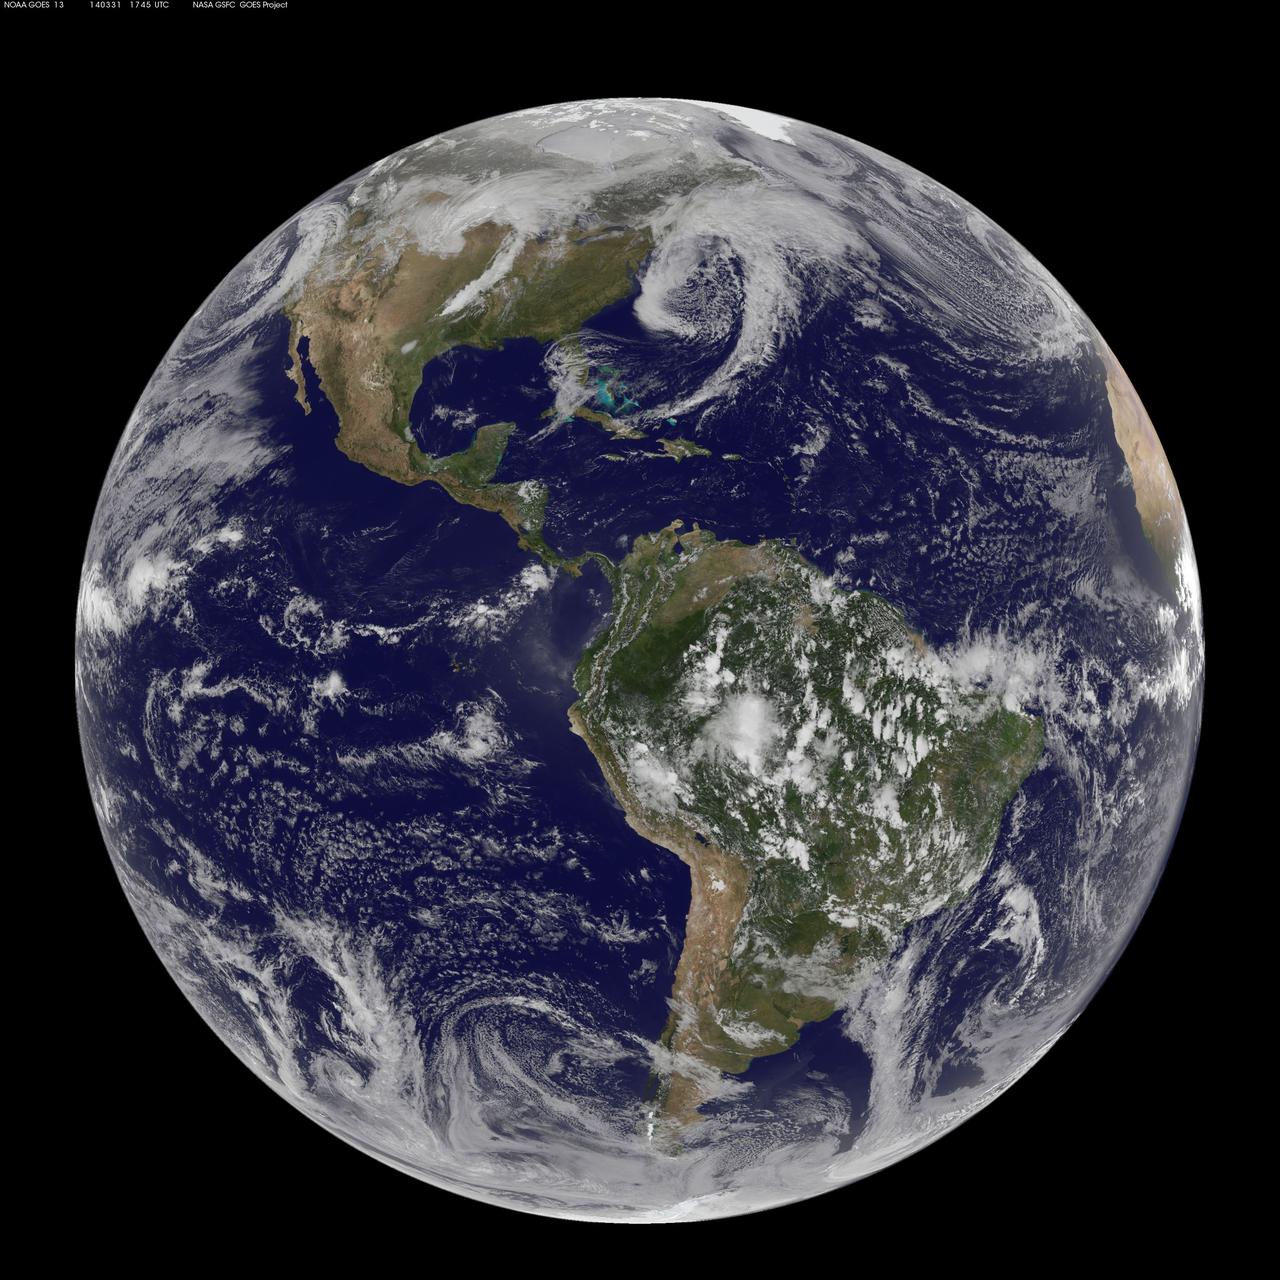
There are three low pressure systems around the U.S. and they resemble dragons on satellite imagery. NOAA's GOES-13 and GOES-15 satellite image from March 31 shows the low pressure systems in the eastern Pacific Ocean, over the nation's Heartland, and in the eastern Atlantic Ocean. All three lows have the signature comma shape that make them appear to be curled up dragons. According to the National Weather Service, the low pressure area approaching the northwestern U.S. is expected to bring rainfall to the coast and areas of snow that stretch from western Washington state south toward the four corners region. The low in the middle of the country is located over Nebraska and dropping snow to the north and west of it. That same low is bringing rain from southern Minnesota south to eastern Texas. Meanwhile, the third low pressure system is bringing rain and snow to parts of New England. NOAA's GOES-East satellite sits in a fixed orbit in space capturing visible and infrared imagery of all weather over the eastern U.S. and Atlantic Ocean. The data to create this image was taken on March 31 at 17:45 UTC/1:45 p.m. EDT by NOAA's GOES-East or GOES-13 satellite and made into an image by NASA/NOAA's GOES Project at NASA's Goddard Space Flight Center in Greenbelt, Md. To create the image NASA/NOAA's GOES Project takes the cloud data from NOAA's GOES-East satellite and overlays it on a true-color image of land and ocean created by data from the Moderate Resolution Imaging Spectroradiometer, or MODIS, instrument that flies aboard NASA's Aqua and Terra satellites. Together, those data created the entire picture of the storm and show its movement. After the storm system passes, the snow on the ground becomes visible. GOES satellites provide the kind of continuous monitoring necessary for intensive data analysis. Geostationary describes an orbit in which a satellite is always in the same position with respect to the rotating Earth. This allows GOES to hover continuously over one position on Earth's surface, appearing stationary. As a result, GOES provide a constant vigil for the atmospheric "triggers" for severe weather conditions such as tornadoes, flash floods, hail storms and hurricanes. For updated information about the storm system, visit NOAA's NWS website: <a href="http://www.weather.gov" rel="nofollow">www.weather.gov</a> For more information about GOES satellites, visit: <a href="http://www.goes.noaa.gov/" rel="nofollow">www.goes.noaa.gov/</a> or goes.gsfc.nasa.gov/ Rob Gutro NASA's Goddard Space Flight Center, Greenbelt, Md. <b><a href="http://www.nasa.gov/audience/formedia/features/MP_Photo_Guidelines.html" rel="nofollow">NASA image use policy.</a></b> <b><a href="http://www.nasa.gov/centers/goddard/home/index.html" rel="nofollow">NASA Goddard Space Flight Center</a></b> enables NASA’s mission through four scientific endeavors: Earth Science, Heliophysics, Solar System Exploration, and Astrophysics. Goddard plays a leading role in NASA’s accomplishments by contributing compelling scientific knowledge to advance the Agency’s mission. <b>Follow us on <a href="http://twitter.com/NASAGoddardPix" rel="nofollow">Twitter</a></b> <b>Like us on <a href="http://www.facebook.com/pages/Greenbelt-MD/NASA-Goddard/395013845897?ref=tsd" rel="nofollow">Facebook</a></b> <b>Find us on <a href="http://instagram.com/nasagoddard?vm=grid" rel="nofollow">Instagram</a></b>
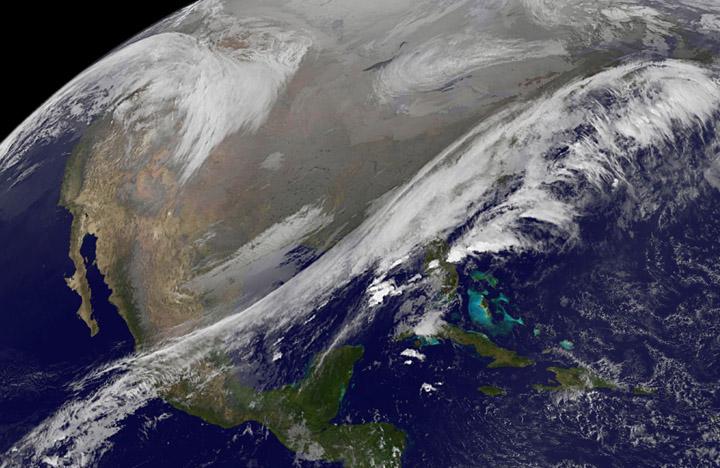
This NOAA's GOES satellite infrared image taken on Nov. 25 at 11:45 UTC (6:45 a.m. EST) shows two main weather systems over the U.S. Credit: NASA/NOAA GOES Project As the U.S. Thanksgiving holiday approaches this Thursday, November 27, NOAA's GOES-East and GOES-West satellites are keeping a weather eye out for storms that may affect early travelers. In an image from Nov. 25, the satellites show an active weather pattern is in place for travelers across the central and eastern U.S. NOAA's GOES-East satellite provides visible and infrared images over the eastern U.S. and the Atlantic Ocean, while NOAA's GOES-West satellite covers the western U.S. and Pacific Ocean from its fixed orbit in space. Data from both satellites were combined at NASA's GOES Project to create a full view of the U.S. on Nov. 25 at 11:45 UTC (6:45 a.m. EST). The image shows clouds associated with cold front stretching from the Gulf of Mexico over northern Florida and along the U.S. East coast to eastern Canada. Clouds associated with another area of low pressure are in the northern Rockies and northwestern U.S. To create the image, NASA/NOAA's GOES Project takes the cloud data from NOAA's GOES-East satellite and overlays it on a true-color image of land and ocean created by data from the Moderate Resolution Imaging Spectroradiometer, or MODIS, instrument that flies aboard NASA's Aqua and Terra satellites. Together, those data created the entire picture of the storm and show its movement. After the storm system passes, the snow on the ground becomes visible. NOAA's National Weather Service Weather Prediction Center said "a storm system will develop off the coast of the Carolinas early Wednesday (Nov. 25) and strengthen as it moves rapidly up the East Coast Wednesday into early Thursday (Nov. 26). Heavy snow is likely to begin in the central Appalachians early Wednesday morning, spreading northeast through the interior Mid-Atlantic into New England by Wednesday night. Winter Storm Watches are in effect for these areas." For travelers in the western U.S., the Northern Rocky Mountains are expected to receive more snow from the north side of a stationary frontal boundary. South of the boundary rain showers will affect the lower valley. The National Weather Service calls for cold weather to continue in the northern Plains and Upper Midwest as a Canadian surface high pressure rules the weather. The U.S. Southwest will experience nice weather for mid-week. In the Pacific Northwest, the National Weather Service noted that a warm front will bring rain, heavy at times, to the Cascades today and tonight. There will be a break in the heavier rains on Wednesday, then another period of heavy rain for the Cascades Wednesday night through Friday morning as a cold front slowly drags through the area. NOAA's GOES satellites provide the kind of continuous monitoring necessary for intensive data analysis. Geostationary describes an orbit in which a satellite is always in the same position with respect to the rotating Earth. This allows GOES to hover continuously over one position on Earth's surface, appearing stationary. As a result, GOES provide a constant vigil for the atmospheric triggers for severe weather conditions such as tornadoes, flash floods, hail storms and hurricanes.
Another large snowstorm affecting New England was dropping more snow on the region and breaking records on February 9, as NOAA's GOES-East satellite captured an image of the clouds associated with the storm system. On Feb. 9, NOAA's National Weather Service in Boston, Massachusetts noted that "The 30-day snowfall total at Boston ending 7 a.m. this morning is 61.6 inches. This exceeds the previous maximum 30 day snowfall total on record at Boston, which was 58.8 inches ending Feb 7 1978." The GOES-East image was created by NASA/NOAA's GOES Project at NASA's Goddard Space Flight Center in Greenbelt, Maryland. It showed a blanket of clouds over the U.S. northeast that stretched down to the Mid-Atlantic where there was no snow on the ground in Washington, D.C. NOAA's National Weather Service Weather Prediction Center provided a look at the extent of the storm system and noted "Heavy snow will impact portions of New York State and New England as the new week begins. Freezing rain will spread from western Pennsylvania to Long Island, with rain for the mid-Atlantic states." The low pressure area bringing the snow to the northeast was located in central Pennsylvania. A cold front extended southward from the low across the Tennessee Valley while a stationary boundary extended eastward from the low across the central mid-Atlantic. To create the image, NASA/NOAA's GOES Project takes the cloud data from NOAA's GOES-East satellite and overlays it on a true-color image of land and ocean created by data from the Moderate Resolution Imaging Spectroradiometer, or MODIS, instrument that flies aboard NASA's Aqua and Terra satellites. Together, those data created the entire picture of the storm. NOAA's GOES satellites provide the kind of continuous monitoring necessary for intensive data analysis. Geostationary describes an orbit in which a satellite is always in the same position with respect to the rotating Earth. This allows GOES to hover continuously over one position on Earth's surface, appearing stationary. As a result, GOES provide a constant vigil for the atmospheric triggers for severe weather conditions such as tornadoes, flash floods, hail storms and hurricanes. For updated information about the storm system, visit NOAA's NWS website: <a href="http://www.weather.gov" rel="nofollow">www.weather.gov</a> For more information about GOES satellites, visit: <a href="http://www.goes.noaa.gov/" rel="nofollow">www.goes.noaa.gov/</a> or goes.gsfc.nasa.gov/ Rob Gutro NASA's Goddard Space Flight Center <b><a href="http://goes.gsfc.nasa.gov/" rel="nofollow">Credit: NOAA/NASA GOES Project</a></b> <b><a href="http://www.nasa.gov/audience/formedia/features/MP_Photo_Guidelines.html" rel="nofollow">NASA image use policy.</a></b> <b><a href="http://www.nasa.gov/centers/goddard/home/index.html" rel="nofollow">NASA Goddard Space Flight Center</a></b> enables NASA’s mission through four scientific endeavors: Earth Science, Heliophysics, Solar System Exploration, and Astrophysics. Goddard plays a leading role in NASA’s accomplishments by contributing compelling scientific knowledge to advance the Agency’s mission. <b>Follow us on <a href="http://twitter.com/NASAGoddardPix" rel="nofollow">Twitter</a></b> <b>Like us on <a href="http://www.facebook.com/pages/Greenbelt-MD/NASA-Goddard/395013845897?ref=tsd" rel="nofollow">Facebook</a></b> <b>Find us on <a href="http://instagram.com/nasagoddard?vm=grid" rel="nofollow">Instagram</a></b>
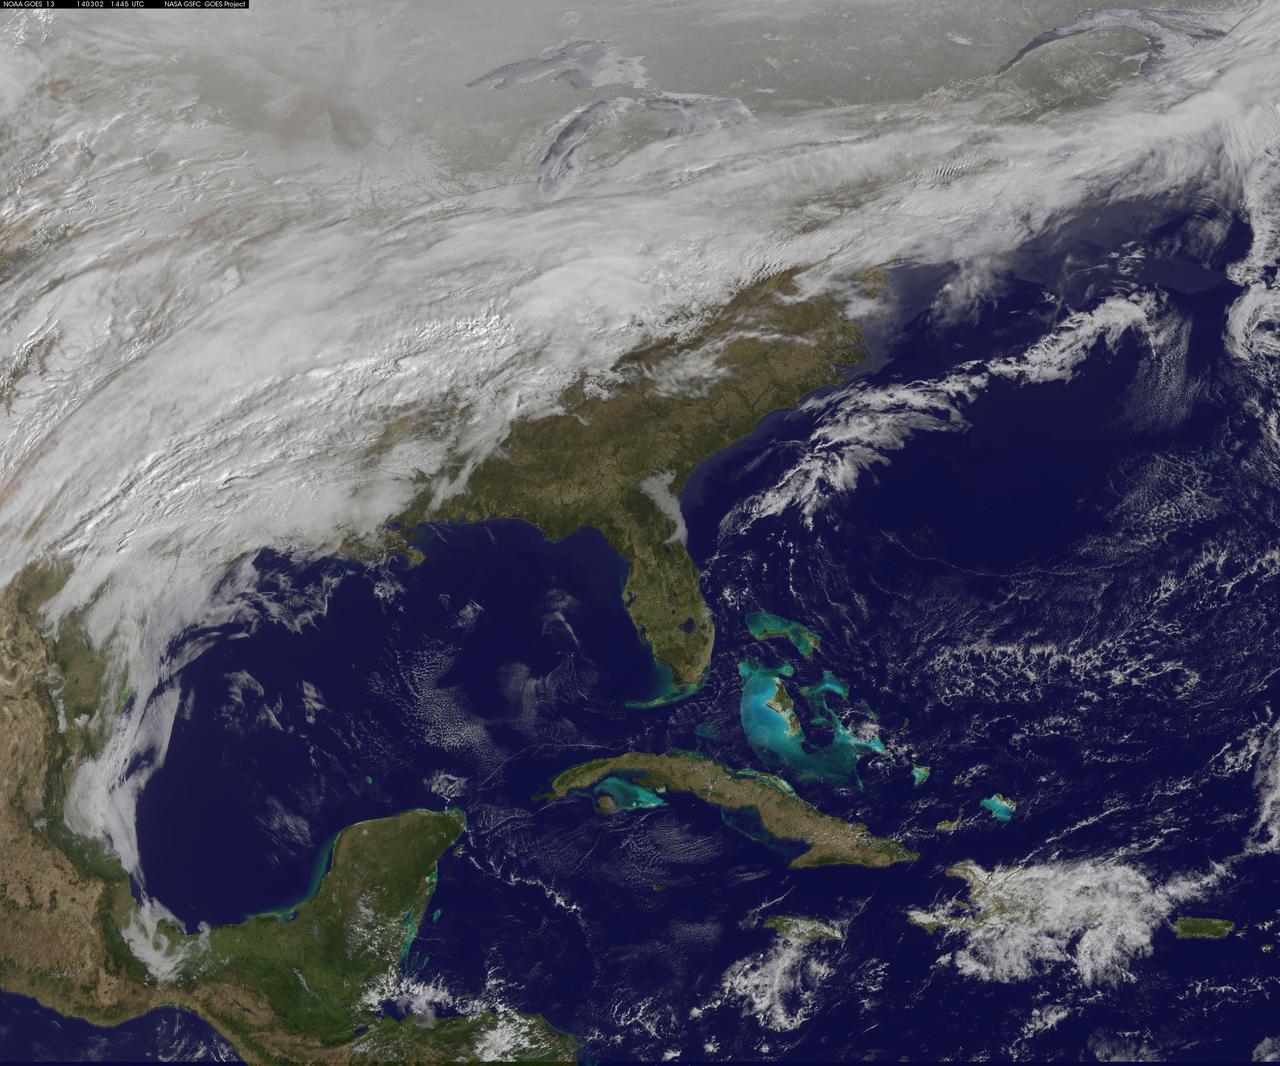
A major winter storm is poised to wallop the Mid-Atlantic and bring large amounts of snow to cities including Baltimore, Md., Washington, D.C. area on March 2 and 3, according to NOAA's National Weather Service. NOAA's GOES-East satellite captured this image of the clouds associated with the winter storm as it continued moving east toward those cities. On March 2, the National Weather Prediction Center in College Park, Md. noted that there is a slight risk for severe thunderstorms over parts of the western Gulf Coast and the Lower Mississippi Valley as a result of the southern portion of the system. The update at 7 a.m. EST noted that freezing rain/sleet is possible over parts of the lower Mississippi Valley and parts of the central Appalachians, while eastern Texas and the lower Mississippi Valley into the Ohio Valley are expected to experience heavy rain. The NWS Short Range Forecast Discussion stated "A strong storm over the Southern Plains/Lower Mississippi Valley will advance northeastward along a quasi-stationary front to off the Southern Mid-Atlantic Coast by Monday evening. Moisture from the Gulf of Mexico will overrun and pool along the associated front producing an area of snow extending from the Central Plains into the Northeast." The clouds are associated with a cold from that stretches from eastern Maine through Maryland and west into the Tennessee Valley. The low pressure center associated with the front was located over Arkansas. At NASA/NOAA's GOES Project at NASA's Goddard Space Flight Center in Greenbelt, Md. the cloud data from NOAA's GOES-East satellite were overlaid on a true-color image of land and ocean created by data from the Moderate Resolution Imaging Spectroradiometer or MODIS instrument that flies aboard NASA's Aqua and Terra satellites. Together, those data created the entire picture of the position of this major winter storm. GOES satellites provide the kind of continuous monitoring necessary for intensive data analysis. Geostationary describes an orbit in which a satellite is always in the same position with respect to the rotating Earth. This allows GOES to hover continuously over one position on Earth's surface, appearing stationary. As a result, GOES provide a constant vigil for the atmospheric "triggers" for severe weather conditions such as tornadoes, flash floods, hail storms and hurricanes. For updated information about the storm system, visit NOAA's NWS website: <a href="http://www.weather.gov" rel="nofollow">www.weather.gov</a> For more information about GOES satellites, visit: <a href="http://www.goes.noaa.gov/" rel="nofollow">www.goes.noaa.gov/</a> or <a href="http://goes.gsfc.nasa.gov/" rel="nofollow">goes.gsfc.nasa.gov/</a> Rob Gutro NASA Goddard Space Flight Center, Greenbelt, Md. <b><a href="http://www.nasa.gov/audience/formedia/features/MP_Photo_Guidelines.html" rel="nofollow">NASA image use policy.</a></b> <b><a href="http://www.nasa.gov/centers/goddard/home/index.html" rel="nofollow">NASA Goddard Space Flight Center</a></b> enables NASA’s mission through four scientific endeavors: Earth Science, Heliophysics, Solar System Exploration, and Astrophysics. Goddard plays a leading role in NASA’s accomplishments by contributing compelling scientific knowledge to advance the Agency’s mission. <b>Follow us on <a href="http://twitter.com/NASAGoddardPix" rel="nofollow">Twitter</a></b> <b>Like us on <a href="http://www.facebook.com/pages/Greenbelt-MD/NASA-Goddard/395013845897?ref=tsd" rel="nofollow">Facebook</a></b> <b>Find us on <a href="http://instagram.com/nasagoddard?vm=grid" rel="nofollow">Instagram</a></b>
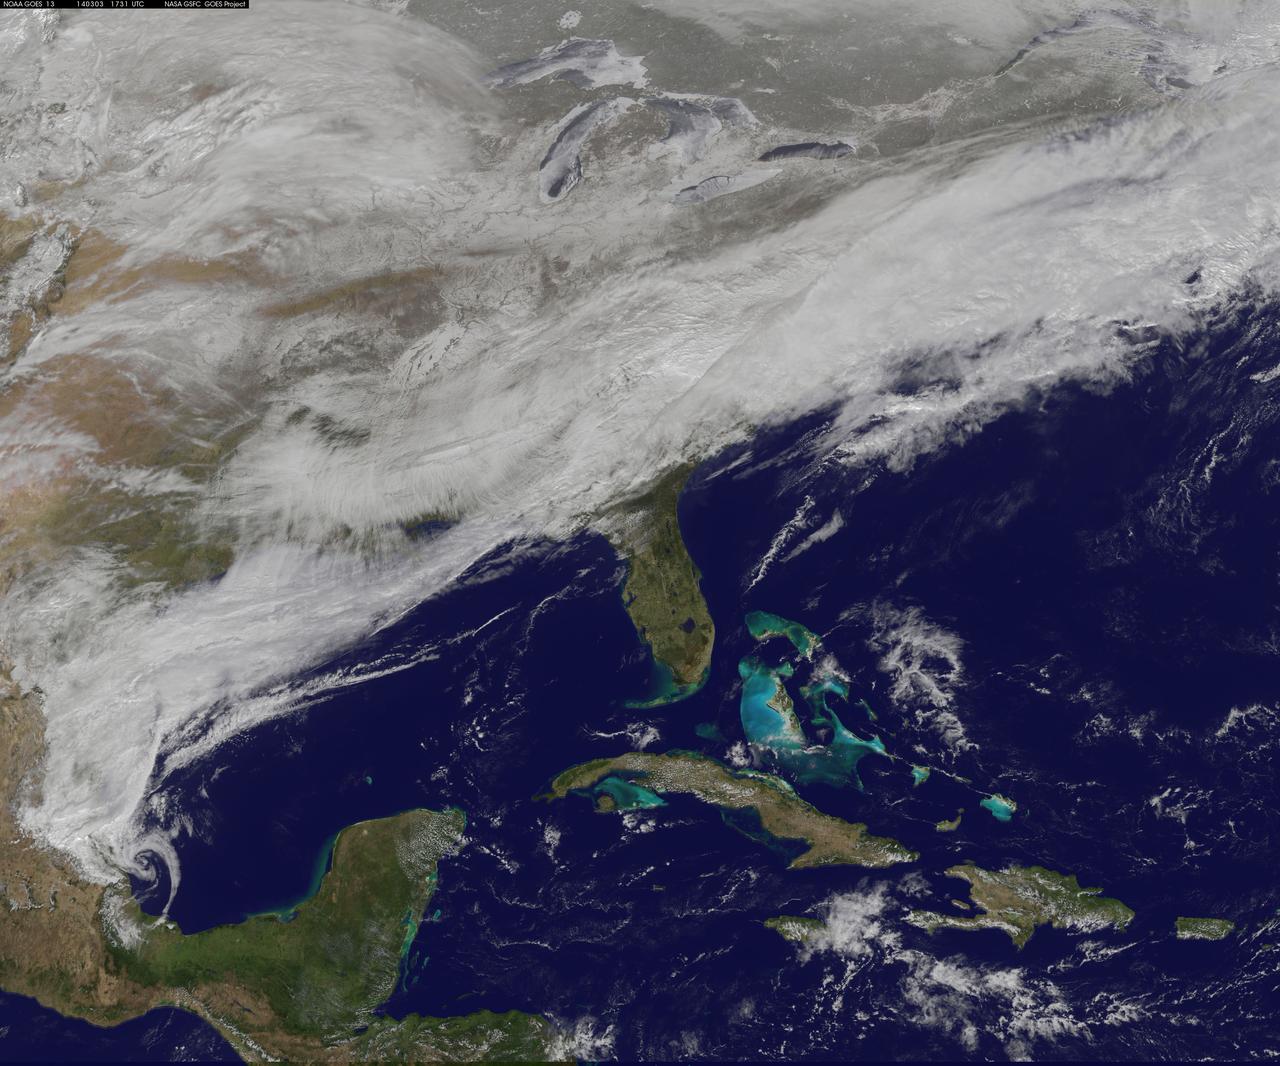
On March 3, a major winter storm brought snow to the mid-Atlantic, freezing rain to the Carolinas and rain and some freezing rain to the Gulf Coast states. NOAA's GOES-East satellite captured an image of the clouds associated with the winter storm on March 3 at 12:45 p.m. EST (1745 UTC)/ as it continued on its march over the mid-Atlantic. Bands of snow and sometimes heavy snow affected the Washington, D.C., region, Delaware and central Virginia, stretching west into West Virginia and eastern Kentucky. Snow also stretched back into the Ohio and Tennessee valleys while rain and freezing rain affected the Carolinas, and while the Gulf Coast states received rain. National Weather Service Winter Storm Warnings remained in effect until 6 p.m. EST on March 3 for Washington, D.C., and Baltimore, Md. In Richmond and Norfolk, Va., the Winter Storm warnings were in effect for six additional hours ending at midnight. On March 3, NOAA's National Weather Prediction Center in College Park, Md., noted the late-season winter storm will continue to shift eastward through the Tennessee Valley and the mid-Atlantic today, making for hazardous travel conditions. NOAA noted that unseasonably cold temperatures more typical of January will prevail east of the Rocky Mountains for the next few days keeping winter around for a while longer. The clouds are associated with a cold front that stretched from eastern Maine through Maryland and west into the Tennessee Valley. At NASA/NOAA's GOES Project at NASA's Goddard Space Flight Center in Greenbelt, Md., the cloud data from NOAA's GOES-East satellite were overlaid on a true-color image of land and ocean created by data from the Moderate Resolution Imaging Spectroradiometer, or MODIS, instrument that flies aboard NASA's Aqua and Terra satellites. Together, those data created the entire picture of the position of this major winter storm. GOES satellites provide the kind of continuous monitoring necessary for intensive data analysis. Geostationary describes an orbit in which a satellite is always in the same position with respect to the rotating Earth. This allows GOES to hover continuously over one position on Earth's surface, appearing stationary. As a result, GOES provide a constant vigil for the atmospheric "triggers" for severe weather conditions such as tornadoes, flash floods, hail storms and hurricanes. For updated information about the storm system, visit NOAA's NWS website: <a href="http://www.weather.gov" rel="nofollow">www.weather.gov</a> For more information about GOES satellites, visit: <a href="http://www.goes.noaa.gov/" rel="nofollow">www.goes.noaa.gov/</a> or goes.gsfc.nasa.gov/ Rob Gutro NASA's Goddard Space Flight Center, Greenbelt, Md. <b><a href="http://www.nasa.gov/audience/formedia/features/MP_Photo_Guidelines.html" rel="nofollow">NASA image use policy.</a></b> <b><a href="http://www.nasa.gov/centers/goddard/home/index.html" rel="nofollow">NASA Goddard Space Flight Center</a></b> enables NASA’s mission through four scientific endeavors: Earth Science, Heliophysics, Solar System Exploration, and Astrophysics. Goddard plays a leading role in NASA’s accomplishments by contributing compelling scientific knowledge to advance the Agency’s mission. <b>Follow us on <a href="http://twitter.com/NASAGoddardPix" rel="nofollow">Twitter</a></b> <b>Like us on <a href="http://www.facebook.com/pages/Greenbelt-MD/NASA-Goddard/395013845897?ref=tsd" rel="nofollow">Facebook</a></b> <b>Find us on <a href="http://instagram.com/nasagoddard?vm=grid" rel="nofollow">Instagram</a></b>
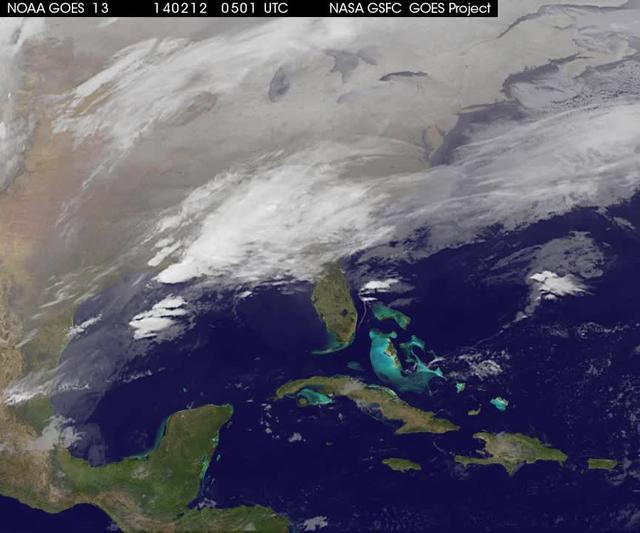
A new NASA video of NOAA's GOES satellite imagery shows three days of movement of the massive winter storm that stretches from the southern U.S. to the northeast. Visible and infrared imagery from NOAA's GOES-East or GOES-13 satellite from Feb. 10 at 1815 UTC/1:15 p.m. EST to Feb. 12 to 1845 UTC/1:45 p.m. EST were compiled into a video made by NASA/NOAA's GOES Project at NASA's Goddard Space Flight Center in Greenbelt, Md. In the video, viewers can see the development and movement of the clouds associated with the progression of the frontal system and related low pressure areas that make up the massive storm. The video also shows the snow covered ground over the Great Lakes region and Ohio Valley that stretches to northern New England. The clouds and fallen snow data from NOAA's GOES-East satellite were overlaid on a true-color image of land and ocean created by data from the Moderate Resolution Imaging Spectroradiometer or MODIS instrument that flies aboard NASA's Aqua and Terra satellites. On February 12 at 10 a.m. EST, NOAA's National Weather Service or NWS continued to issue watches and warnings from Texas to New England. Specifically, NWS cited Winter Storm Warnings and Winter Weather Advisories were in effect from eastern Texas eastward across the interior section of southeastern U.S. states and across much of the eastern seaboard including the Appalachians. Winter storm watches are in effect for portions of northern New England as well as along the western slopes of northern and central Appalachians. For updates on local forecasts, watches and warnings, visit NOAA's <a href="http://www.weather.gov" rel="nofollow">www.weather.gov</a> webpage. NOAA's Weather Prediction Center or WPC noted the storm is expected to bring "freezing rain spreading into the Carolinas, significant snow accumulations are expected in the interior Mid-Atlantic states tonight into Thursday and ice storm warnings and freezing rain advisories are in effect across much of central Georgia. GOES satellites provide the kind of continuous monitoring necessary for intensive data analysis. Geostationary describes an orbit in which a satellite is always in the same position with respect to the rotating Earth. This allows GOES to hover continuously over one position on Earth's surface, appearing stationary. As a result, GOES provide a constant vigil for the atmospheric "triggers" for severe weather conditions such as tornadoes, flash floods, hail storms and hurricanes. For updated information about the storm system, visit NOAA's WPC website; <a href="http://www.hpc.ncep.noaa.gov/" rel="nofollow">www.hpc.ncep.noaa.gov/</a> For more information about GOES satellites, visit: <a href="http://www.goes.noaa.gov/" rel="nofollow">www.goes.noaa.gov/</a> or <a href="http://goes.gsfc.nasa.gov/" rel="nofollow">goes.gsfc.nasa.gov/</a> Rob Gutro NASA's Goddard Space Flight Center <b><a href="http://goes.gsfc.nasa.gov/" rel="nofollow">Credit: NOAA/NASA GOES Project</a></b> <b><a href="http://www.nasa.gov/audience/formedia/features/MP_Photo_Guidelines.html" rel="nofollow">NASA image use policy.</a></b> <b><a href="http://www.nasa.gov/centers/goddard/home/index.html" rel="nofollow">NASA Goddard Space Flight Center</a></b> enables NASA’s mission through four scientific endeavors: Earth Science, Heliophysics, Solar System Exploration, and Astrophysics. Goddard plays a leading role in NASA’s accomplishments by contributing compelling scientific knowledge to advance the Agency’s mission. <b>Follow us on <a href="http://twitter.com/NASAGoddardPix" rel="nofollow">Twitter</a></b> <b>Like us on <a href="http://www.facebook.com/pages/Greenbelt-MD/NASA-Goddard/395013845897?ref=tsd" rel="nofollow">Facebook</a></b> <b>Find us on <a href="http://instagrid.me/nasagoddard/?vm=grid" rel="nofollow">Instagram</a></b>
National Weather Service forecasters have been tracking a low pressure area that moved from the Midwest into the Atlantic Ocean today, and is expected to become a strong nor'easter that will bring blizzard conditions to the northeastern U.S. The path of the system was captured in a NASA movie of NOAA's GOES-East satellite imagery. An animation of visible and infrared imagery from NOAA's Geostationary Operational Environmental or GOES satellite captured over the period of January 24 through 26 showed the progression of the developing nor'easter. The satellite animation began on Jan. 24 when clouds associated with a cold front preceding the low, pushed off the U.S. East coast. The front was followed by a low pressure area that moved from the Midwest to the southeast. That low moved over the Carolinas and exited into the Atlantic Ocean on Jan. 26. NOAA's National Weather Service forecast calls for the low to intensify along the Eastern Seaboard and bring blizzard conditions to the northeastern U.S. on Monday night, January 26 and Tuesday, January 27. On Monday, January 26, 2015, the National Weather Service noted: A storm system off the East Coast will continue to strengthen as it develops into a major nor'easter on Monday. As the storm moves up the coast, it is expected to bring snowfall of 1-3 feet or more to many parts of the Northeast through Tuesday evening, including New York City and Boston. Strong, gusty winds will combine with the snow to create blizzard conditions along and near the coast. Winter storm warnings are in effect for the panhandles of West Virginia and Maryland, much of interior New England down to the northern Mid-Atlantic as well as for Nantucket Island, Massachusetts. Winter weather advisories are in effect for portions of the Ohio Valley, Mid-Atlantic and the southern Appalachians as well as a narrow area across interior New England. To create the video and imagery, NASA/NOAA's GOES Project located at NASA's Goddard Space Flight Center in Greenbelt, Maryland overlays the cloud data from NOAA's GOES-East satellite on a true-color image of land and ocean created by data from the Moderate Resolution Imaging Spectroradiometer, or MODIS, instrument that flies aboard NASA's Aqua and Terra satellites. Together, these data create the entire animation of the storm and show its movement. GOES satellites provide the kind of continuous monitoring necessary for intensive data analysis. Geostationary describes an orbit in which a satellite is always in the same position with respect to the rotating Earth. This allows GOES to hover continuously over one position on Earth's surface, appearing stationary. As a result, GOES provide a constant vigil for the atmospheric "triggers" for severe weather conditions such as tornadoes, flash floods, hail storms and hurricanes. For updated information about the storm system, visit NOAA's NWS website: <a href="http://www.weather.gov" rel="nofollow">www.weather.gov</a> For more information about GOES satellites, visit: <a href="http://www.goes.noaa.gov/" rel="nofollow">www.goes.noaa.gov/</a> or goes.gsfc.nasa.gov/ Rob Gutro NASA's Goddard Space Flight Center
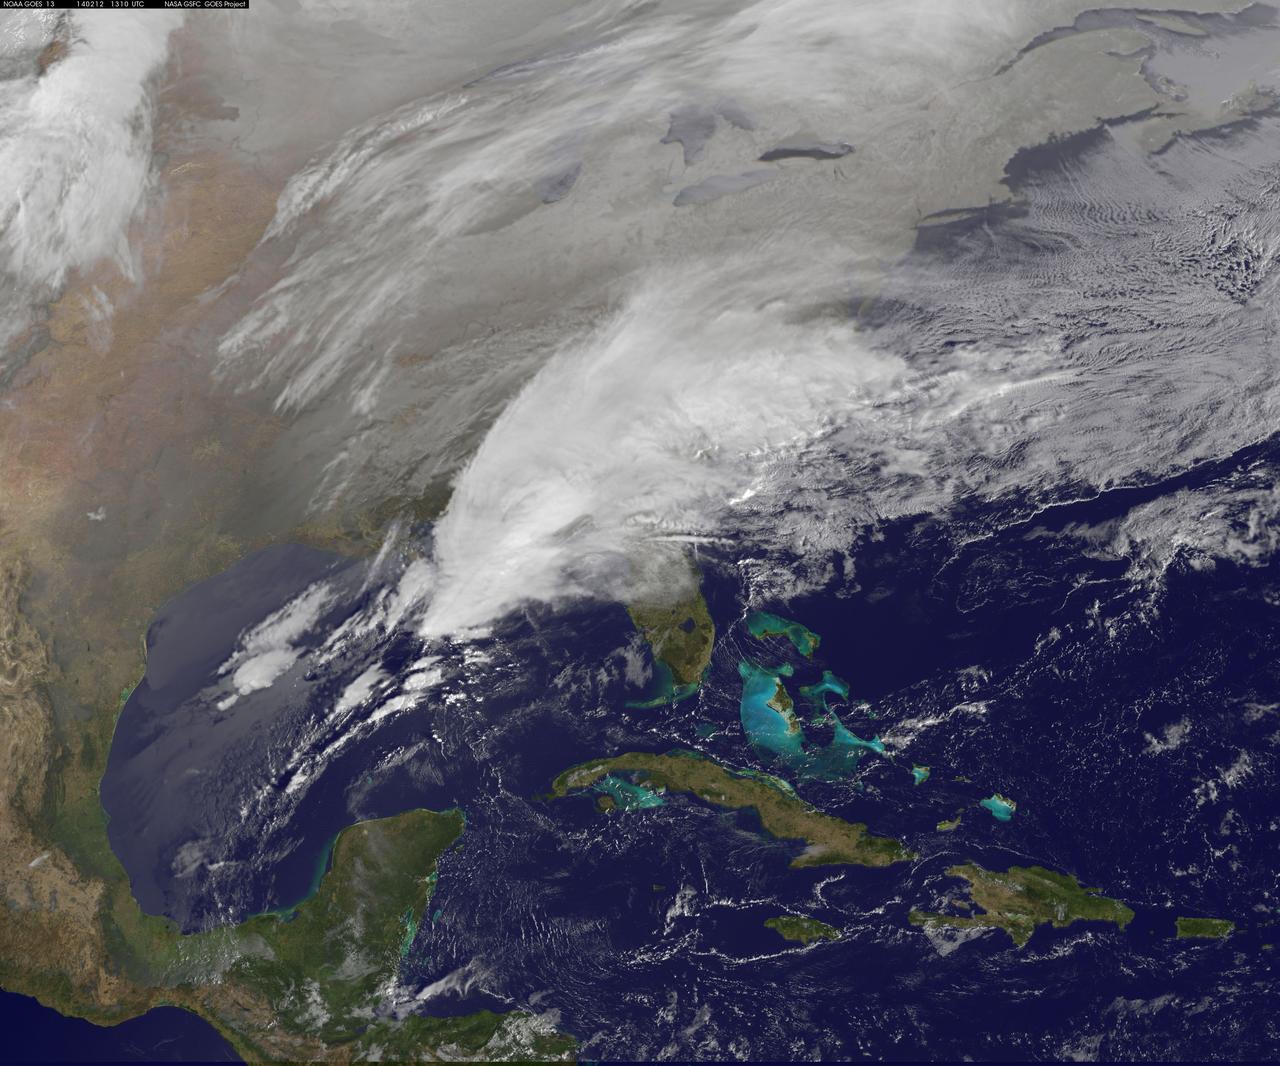
Clouds associated with the major winter storm that is bringing wintry precipitation and chilly temperatures to the U.S. south is the focus in an image from NOAA's GOES-East satellite today, February 12 at 1310 UTC/ 8:10 EST. Rain, freezing rain, sleet and snow are part of the large front that stretches from eastern Texas to the Carolinas in the Geostationary Operational Environmental satellite or GOES image. NOAA's weather maps show several areas of low pressure along the frontal boundary. One low pressure is in the northern Gulf of Mexico, while the other is in the Atlantic Ocean, just south of South Carolina. (Insert link: <a href="http://www.hpc.ncep.noaa.gov/noaa/noaad1.gif" rel="nofollow">www.hpc.ncep.noaa.gov/noaa/noaad1.gif</a>). NOAA's National Weather Service has been issuing watches and warnings throughout the south that extend along Mid-Atlantic east coast. The visible cloud and ground snow data in this image was taken from NOAA's GOES-East satellite. The image was created by the NASA GOES Project at NASA's Goddard Space Flight Center in Greenbelt, Md. The clouds and fallen snow were overlaid on a true-color image of land and ocean created by data from the Moderate Resolution Imaging Spectroradiometer or MODIS instrument that flies aboard NASA's Aqua and Terra satellites. NOAA's Weather Prediction Center, or WPC noted on Feb. 11 at 3:59 a.m. EST, "Once the intensifying surface low moves off the Southeast coast and begins its track up the Eastern Seaboard Wednesday night...winter weather will start lifting northward into the northern Mid-Atlantic states." GOES satellites provide the kind of continuous monitoring necessary for intensive data analysis. Geostationary describes an orbit in which a satellite is always in the same position with respect to the rotating Earth. This allows GOES to hover continuously over one position on Earth's surface, appearing stationary. As a result, GOES provide a constant vigil for the atmospheric "triggers" for severe weather conditions such as tornadoes, flash floods, hail storms and hurricanes. For updated information about the storm system, visit NOAA's WPC website; <a href="http://www.hpc.ncep.noaa.gov/" rel="nofollow">www.hpc.ncep.noaa.gov/</a> For more information about GOES satellites, visit: <a href="http://www.goes.noaa.gov/" rel="nofollow">www.goes.noaa.gov/</a> or <a href="http://goes.gsfc.nasa.gov/" rel="nofollow">goes.gsfc.nasa.gov/</a> Rob Gutro NASA's Goddard Space Flight Center <b><a href="http://www.nasa.gov/audience/formedia/features/MP_Photo_Guidelines.html" rel="nofollow">NASA image use policy.</a></b> <b><a href="http://www.nasa.gov/centers/goddard/home/index.html" rel="nofollow">NASA Goddard Space Flight Center</a></b> enables NASA’s mission through four scientific endeavors: Earth Science, Heliophysics, Solar System Exploration, and Astrophysics. Goddard plays a leading role in NASA’s accomplishments by contributing compelling scientific knowledge to advance the Agency’s mission. <b>Follow us on <a href="http://twitter.com/NASAGoddardPix" rel="nofollow">Twitter</a></b> <b>Like us on <a href="http://www.facebook.com/pages/Greenbelt-MD/NASA-Goddard/395013845897?ref=tsd" rel="nofollow">Facebook</a></b> <b>Find us on <a href="http://instagram.com/nasagoddard?vm=grid" rel="nofollow">Instagram</a></b>

NOAA's GOES-East satellite provided a look at the frigid eastern two-thirds of the U.S. on Jan. 7, 2015, that shows a blanket of northern snow, lake-effect snow from the Great Lakes and clouds behind the Arctic cold front. A visible picture captured at 1600 UTC (11 a.m. EST) showed the effects of the latest Arctic outbreak. The cold front that brought the Arctic air has moved as far south as Florida, and stretches back over the Gulf of Mexico and just west of Texas today. The image shows clouds behind the frontal boundary stretching from the Carolinas west over the Heartland. Farther north, a wide band of fallen snow covers the ground from New England west to Montana, with rivers appearing like veins. The GOES-East satellite image also shows wind-whipped lake-effect snows off the Great Lakes, blowing to the southeast. Meanwhile, Florida, the nation's warm spot appeared almost cloud-free. To create the image, NASA/NOAA's GOES Project used cloud data from NOAA's GOES-East satellite and overlaid it on a true-color image of land and ocean created by data from the Moderate Resolution Imaging Spectroradiometer, or MODIS, instrument that flies aboard NASA's Aqua and Terra satellites. Together, those data created the entire picture of the Arctic outbreak. The forecast from NOAA's National Weather Service Weather Prediction Center (WPC) calls for more snow along the Appalachian Mountains from Tennessee north to upstate New York. Snow is also expected to fall from New England west to Montana, and in eastern New Mexico and the Colorado Rockies. The WPC summary for Jan. 7 noted: Bitter cold will be felt from the western High Plains to the Mid-Atlantic and Northeast U.S. for the next few days. Widespread subzero overnight lows are forecast for the Dakotas, Upper Midwest, Great Lakes, and interior New England. Wind Chill Advisories and Warnings are in effect for many of these areas. GOES-East provides visible and infrared images over the eastern U.S. and the Atlantic Ocean from its fixed orbit in space. NOAA's GOES satellites provide the kind of continuous monitoring necessary for intensive data analysis. Geostationary describes an orbit in which a satellite is always in the same position with respect to the rotating Earth. This allows GOES to hover continuously over one position on Earth's surface, appearing stationary. As a result, GOES provide a constant vigil for the atmospheric triggers for severe weather conditions such as tornadoes, flash floods, hail storms and hurricanes. For updated information about the storm system, visit NOAA's NWS website: <a href="http://www.weather.gov" rel="nofollow">www.weather.gov</a> For more information about GOES satellites, visit: <a href="http://www.goes.noaa.gov/" rel="nofollow">www.goes.noaa.gov/</a> or goes.gsfc.nasa.gov/ Rob Gutro NASA's Goddard Space Flight Center, Greenbelt, Md. <b><a href="http://www.nasa.gov/audience/formedia/features/MP_Photo_Guidelines.html" rel="nofollow">NASA image use policy.</a></b> <b><a href="http://www.nasa.gov/centers/goddard/home/index.html" rel="nofollow">NASA Goddard Space Flight Center</a></b> enables NASA’s mission through four scientific endeavors: Earth Science, Heliophysics, Solar System Exploration, and Astrophysics. Goddard plays a leading role in NASA’s accomplishments by contributing compelling scientific knowledge to advance the Agency’s mission. <b>Follow us on <a href="http://twitter.com/NASAGoddardPix" rel="nofollow">Twitter</a></b> <b>Like us on <a href="http://www.facebook.com/pages/Greenbelt-MD/NASA-Goddard/395013845897?ref=tsd" rel="nofollow">Facebook</a></b> <b>Find us on <a href="http://instagram.com/nasagoddard?vm=grid" rel="nofollow">Instagram</a></b>
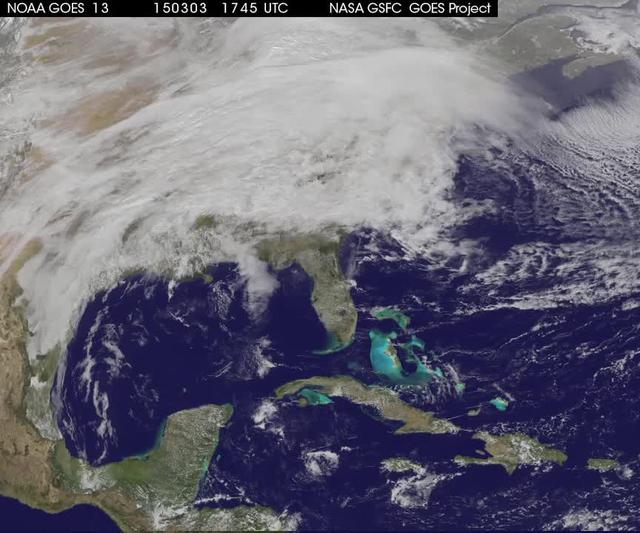
A winter storm was bringing snow, sleet and freezing rain from lower Mississippi Valley to Northeastern U.S. on Thursday, March 5, 2015. A new NASA animation of NOAA's GOES-East satellite imagery showed the progression of the clouds associated with the storm system that triggered winter storm warnings and winter weather advisories from the southern Plains eastward through the Mid-Atlantic and southern New England coast. The system also triggered flood warnings along and to the west of the central Appalachians. An animation of GOES satellite visible and infrared imagery from March 3 through March 5 showed clouds associated with a cold front push over U.S. East coast. Behind the front, Arctic air is expected to drop low temperatures into the single numbers from Washington, D.C. to Minnesota overnight. Temperatures in the Carolinas and Tennessee are expected to drop to the low 20s. NOAA's National Weather Service Weather Prediction Center (NWS NPC) in College Park, Maryland noted "a strong cold front moving across the eastern U.S. will bring heavy snow from parts of the Ohio Valley to the Northeast today (March 5) with rain, freezing rain and sleet possible from parts of the lower Mississippi Valley across the Southeast to the southern Mid-Atlantic. Snowfall totals of 5 to 10 inches are possible for some areas. Winter Storm Warnings remain in effect from Texas to Nantucket." The animation ends at 17:45 UTC (12:45 p.m. EST). Before the end of the animation, the low pressure center along an arctic frontal boundary was nearly stationary over western North Carolina at 9 a.m. EST on March 5, according to the NWS NPC. NWS radar and surface observations indicated an extended swath of precipitation from near the Texas Gulf Coast through the interior eastern U.S. into southern New England. NPC's storm summary noted at that time "rain was changing to sleet/freezing rain and to all snow along a band within this swath as colder air continues to filter in from the north. Some areas in Tennessee, the northern mid-Atlantic and southern New England were reporting moderate to heavy snow." To create the video and imagery, NASA/NOAA's GOES Project takes the cloud data from NOAA's GOES-East satellite and overlays it on a true-color image of land and ocean created by data from the Moderate Resolution Imaging Spectroradiometer, or MODIS, instrument that flies aboard NASA's Aqua and Terra satellites. Together, those data created the entire picture of the storm and show its movement. After the storm system passes, the snow on the ground becomes visible. GOES satellites provide the kind of continuous monitoring necessary for intensive data analysis. Geostationary describes an orbit in which a satellite is always in the same position with respect to the rotating Earth. This allows GOES to hover continuously over one position on Earth's surface, appearing stationary. For updated information about the storm system, visit NOAA's NWS website: <a href="http://www.weather.gov" rel="nofollow">www.weather.gov</a> For more information about GOES satellites, visit: <a href="http://www.goes.noaa.gov/" rel="nofollow">www.goes.noaa.gov/</a> or goes.gsfc.nasa.gov/ Rob Gutro NASA's Goddard Space Flight Center <b><a href="http://www.nasa.gov/audience/formedia/features/MP_Photo_Guidelines.html" rel="nofollow">NASA image use policy.</a></b> <b><a href="http://www.nasa.gov/centers/goddard/home/index.html" rel="nofollow">NASA Goddard Space Flight Center</a></b> enables NASA’s mission through four scientific endeavors: Earth Science, Heliophysics, Solar System Exploration, and Astrophysics. Goddard plays a leading role in NASA’s accomplishments by contributing compelling scientific knowledge to advance the Agency’s mission. <b>Follow us on <a href="http://twitter.com/NASAGoddardPix" rel="nofollow">Twitter</a></b> <b>Like us on <a href="http://www.facebook.com/pages/Greenbelt-MD/NASA-Goddard/395013845897?ref=tsd" rel="nofollow">Facebook</a></b> <b>Find us on <a href="http://instagrid.me/nasagoddard/?vm=grid" rel="nofollow">Instagram</a></b>
![The monster winter storm that brought icing to the U.S. southeast moved northward along the Eastern Seaboard and brought snow, sleet and rain from the Mid-Atlantic to New England on February 13. A new image from NOAA's GOES satellite showed clouds associated with the massive winter storm stretch from the U.S. southeast to the northeast. Data from NOAA's GOES-East satellite taken on Feb. 13 at 1455 UTC/9:45 a.m. EST were made into an image by NASA/NOAA's GOES Project at NASA's Goddard Space Flight Center in Greenbelt, Md. The clouds and fallen snow data from NOAA's GOES-East satellite were overlaid on a true-color image of land and ocean created by data from the Moderate Resolution Imaging Spectroradiometer or MODIS instrument that flies aboard NASA's Aqua and Terra satellites.The image showed that the clouds associated with the storm were blanketing much of the U.S. East Coast. At 3:11 a.m. EST, a surface map issued by the National Weather Service or NWS showed the storm's low pressure area was centered over eastern North Carolina. Since then, the low has continued to track north along the eastern seaboard. By 11 a.m. EST, precipitation from the storm was falling from South Carolina to Maine, according to National Weather Service radar. By 11 a.m. EST, the Washington, D.C. region snow and sleet totals ranged from 3" in far eastern Maryland to over 18" in the northern and western suburbs in Maryland and Virginia. NWS reported that snow, sleet and rain were still falling and more snow is expected as the back side of the low moves into the region. The New York City region remained under an NWS Winter Storm Warning until 6 a.m. on Friday, February 14 and the National Weather Service expects minor coastal impacts Thursday into Friday afternoon. New England was also being battered by the storm. At 10:56 a.m. EST, Barnstable, Mass. on Cape Cod was experiencing rain and winds gusting to 28 mph. An NWS wind advisory is in effect for Cape Cod until 7 p.m. EST. Further north, Portland, Maine was experiencing heavy snow with winds from the northeast at 6 mph. The National Weather Service in Gray, Maine noted "Significant snowfall is likely for much of western Maine and New Hampshire as this storm passes by. There will be a mix or changeover to sleet and freezing rain over southern and coastal sections tonight...before all areas end as a period of snow Friday (Feb. 14) morning." On February 13 at 10 a.m. EST, NOAA's National Weather Service noted "An abundance of Atlantic moisture getting wrapped into the storm will continue to fuel widespread precipitation...which should lift through the Mid-Atlantic States and Northeast Thursday into Friday. A wide swath of heavy snow accumulations are expected with this storm...but air [moving] off the warmer ocean water should change snow over to rain along the coastal areas. Also...a narrow axis of sleet and freezing rain will be possible within the transition zone...which is expected to set up near the I-95 corridor." For updates on local forecasts, watches and warnings, visit NOAA's <a href="http://www.weather.gov" rel="nofollow">www.weather.gov</a> webpage. GOES satellites provide the kind of continuous monitoring necessary for intensive data analysis. Geostationary describes an orbit in which a satellite is always in the same position with respect to the rotating Earth. This allows GOES to hover continuously over one position on Earth's surface, appearing stationary. As a result, GOES provide a constant vigil for the atmospheric "triggers" for severe weather conditions such as tornadoes, flash floods, hail storms and hurricanes. For updated information about the storm system, visit NOAA's WPC website: <a href="http://www.hpc.ncep.noaa.gov/" rel="nofollow">www.hpc.ncep.noaa.gov/</a> For more information about GOES satellites, visit: <a href="http://www.goes.noaa.gov/" rel="nofollow">www.goes.noaa.gov/</a> or <a href="http://goes.gsfc.nasa.gov/" rel="nofollow">goes.gsfc.nasa.gov/</a> Credit: NASA/GSFC/Jeff Schmaltz/MODIS Land Rapid Response Team <b><a href="http://www.nasa.gov/audience/formedia/features/MP_Photo_Guidelines.html" rel="nofollow">NASA image use policy.</a></b> <b><a href="http://www.nasa.gov/centers/goddard/home/index.html" rel="nofollow">NASA Goddard Space Flight Center</a></b> enables NASA’s mission through four scientific endeavors: Earth Science, Heliophysics, Solar System Exploration, and Astrophysics. Goddard plays a leading role in NASA’s accomplishments by contributing compelling scientific knowledge to advance the Agency’s mission. <b>Follow us on <a href="http://twitter.com/NASAGoddardPix" rel="nofollow">Twitter</a></b> <b>Like us on <a href="http://www.facebook.com/pages/Greenbelt-MD/NASA-Goddard/395013845897?ref=tsd" rel="nofollow">Facebook</a></b> <b>Find us on <a href="http://instagram.com/nasagoddard?vm=grid" rel="nofollow">Instagram</a></b>](https://images-assets.nasa.gov/image/GSFC_20171208_Archive_e001228/GSFC_20171208_Archive_e001228~medium.jpg)
The monster winter storm that brought icing to the U.S. southeast moved northward along the Eastern Seaboard and brought snow, sleet and rain from the Mid-Atlantic to New England on February 13. A new image from NOAA's GOES satellite showed clouds associated with the massive winter storm stretch from the U.S. southeast to the northeast. Data from NOAA's GOES-East satellite taken on Feb. 13 at 1455 UTC/9:45 a.m. EST were made into an image by NASA/NOAA's GOES Project at NASA's Goddard Space Flight Center in Greenbelt, Md. The clouds and fallen snow data from NOAA's GOES-East satellite were overlaid on a true-color image of land and ocean created by data from the Moderate Resolution Imaging Spectroradiometer or MODIS instrument that flies aboard NASA's Aqua and Terra satellites.The image showed that the clouds associated with the storm were blanketing much of the U.S. East Coast. At 3:11 a.m. EST, a surface map issued by the National Weather Service or NWS showed the storm's low pressure area was centered over eastern North Carolina. Since then, the low has continued to track north along the eastern seaboard. By 11 a.m. EST, precipitation from the storm was falling from South Carolina to Maine, according to National Weather Service radar. By 11 a.m. EST, the Washington, D.C. region snow and sleet totals ranged from 3" in far eastern Maryland to over 18" in the northern and western suburbs in Maryland and Virginia. NWS reported that snow, sleet and rain were still falling and more snow is expected as the back side of the low moves into the region. The New York City region remained under an NWS Winter Storm Warning until 6 a.m. on Friday, February 14 and the National Weather Service expects minor coastal impacts Thursday into Friday afternoon. New England was also being battered by the storm. At 10:56 a.m. EST, Barnstable, Mass. on Cape Cod was experiencing rain and winds gusting to 28 mph. An NWS wind advisory is in effect for Cape Cod until 7 p.m. EST. Further north, Portland, Maine was experiencing heavy snow with winds from the northeast at 6 mph. The National Weather Service in Gray, Maine noted "Significant snowfall is likely for much of western Maine and New Hampshire as this storm passes by. There will be a mix or changeover to sleet and freezing rain over southern and coastal sections tonight...before all areas end as a period of snow Friday (Feb. 14) morning." On February 13 at 10 a.m. EST, NOAA's National Weather Service noted "An abundance of Atlantic moisture getting wrapped into the storm will continue to fuel widespread precipitation...which should lift through the Mid-Atlantic States and Northeast Thursday into Friday. A wide swath of heavy snow accumulations are expected with this storm...but air [moving] off the warmer ocean water should change snow over to rain along the coastal areas. Also...a narrow axis of sleet and freezing rain will be possible within the transition zone...which is expected to set up near the I-95 corridor." For updates on local forecasts, watches and warnings, visit NOAA's <a href="http://www.weather.gov" rel="nofollow">www.weather.gov</a> webpage. GOES satellites provide the kind of continuous monitoring necessary for intensive data analysis. Geostationary describes an orbit in which a satellite is always in the same position with respect to the rotating Earth. This allows GOES to hover continuously over one position on Earth's surface, appearing stationary. As a result, GOES provide a constant vigil for the atmospheric "triggers" for severe weather conditions such as tornadoes, flash floods, hail storms and hurricanes. For updated information about the storm system, visit NOAA's WPC website: <a href="http://www.hpc.ncep.noaa.gov/" rel="nofollow">www.hpc.ncep.noaa.gov/</a> For more information about GOES satellites, visit: <a href="http://www.goes.noaa.gov/" rel="nofollow">www.goes.noaa.gov/</a> or <a href="http://goes.gsfc.nasa.gov/" rel="nofollow">goes.gsfc.nasa.gov/</a> Credit: NASA/GSFC/Jeff Schmaltz/MODIS Land Rapid Response Team <b><a href="http://www.nasa.gov/audience/formedia/features/MP_Photo_Guidelines.html" rel="nofollow">NASA image use policy.</a></b> <b><a href="http://www.nasa.gov/centers/goddard/home/index.html" rel="nofollow">NASA Goddard Space Flight Center</a></b> enables NASA’s mission through four scientific endeavors: Earth Science, Heliophysics, Solar System Exploration, and Astrophysics. Goddard plays a leading role in NASA’s accomplishments by contributing compelling scientific knowledge to advance the Agency’s mission. <b>Follow us on <a href="http://twitter.com/NASAGoddardPix" rel="nofollow">Twitter</a></b> <b>Like us on <a href="http://www.facebook.com/pages/Greenbelt-MD/NASA-Goddard/395013845897?ref=tsd" rel="nofollow">Facebook</a></b> <b>Find us on <a href="http://instagram.com/nasagoddard?vm=grid" rel="nofollow">Instagram</a></b>
![The monster winter storm that brought icing to the U.S. southeast moved northward along the Eastern Seaboard and brought snow, sleet and rain from the Mid-Atlantic to New England on February 13. A new image from NOAA's GOES satellite showed clouds associated with the massive winter storm stretch from the U.S. southeast to the northeast. Data from NOAA's GOES-East satellite taken on Feb. 13 at 1455 UTC/9:45 a.m. EST were made into an image by NASA/NOAA's GOES Project at NASA's Goddard Space Flight Center in Greenbelt, Md. The clouds and fallen snow data from NOAA's GOES-East satellite were overlaid on a true-color image of land and ocean created by data from the Moderate Resolution Imaging Spectroradiometer or MODIS instrument that flies aboard NASA's Aqua and Terra satellites.The image showed that the clouds associated with the storm were blanketing much of the U.S. East Coast. At 3:11 a.m. EST, a surface map issued by the National Weather Service or NWS showed the storm's low pressure area was centered over eastern North Carolina. Since then, the low has continued to track north along the eastern seaboard. By 11 a.m. EST, precipitation from the storm was falling from South Carolina to Maine, according to National Weather Service radar. By 11 a.m. EST, the Washington, D.C. region snow and sleet totals ranged from 3" in far eastern Maryland to over 18" in the northern and western suburbs in Maryland and Virginia. NWS reported that snow, sleet and rain were still falling and more snow is expected as the back side of the low moves into the region. The New York City region remained under an NWS Winter Storm Warning until 6 a.m. on Friday, February 14 and the National Weather Service expects minor coastal impacts Thursday into Friday afternoon. New England was also being battered by the storm. At 10:56 a.m. EST, Barnstable, Mass. on Cape Cod was experiencing rain and winds gusting to 28 mph. An NWS wind advisory is in effect for Cape Cod until 7 p.m. EST. Further north, Portland, Maine was experiencing heavy snow with winds from the northeast at 6 mph. The National Weather Service in Gray, Maine noted "Significant snowfall is likely for much of western Maine and New Hampshire as this storm passes by. There will be a mix or changeover to sleet and freezing rain over southern and coastal sections tonight...before all areas end as a period of snow Friday (Feb. 14) morning." On February 13 at 10 a.m. EST, NOAA's National Weather Service noted "An abundance of Atlantic moisture getting wrapped into the storm will continue to fuel widespread precipitation...which should lift through the Mid-Atlantic States and Northeast Thursday into Friday. A wide swath of heavy snow accumulations are expected with this storm...but air [moving] off the warmer ocean water should change snow over to rain along the coastal areas. Also...a narrow axis of sleet and freezing rain will be possible within the transition zone...which is expected to set up near the I-95 corridor." For updates on local forecasts, watches and warnings, visit NOAA's <a href="http://www.weather.gov" rel="nofollow">www.weather.gov</a> webpage. GOES satellites provide the kind of continuous monitoring necessary for intensive data analysis. Geostationary describes an orbit in which a satellite is always in the same position with respect to the rotating Earth. This allows GOES to hover continuously over one position on Earth's surface, appearing stationary. As a result, GOES provide a constant vigil for the atmospheric "triggers" for severe weather conditions such as tornadoes, flash floods, hail storms and hurricanes. For updated information about the storm system, visit NOAA's WPC website: <a href="http://www.hpc.ncep.noaa.gov/" rel="nofollow">www.hpc.ncep.noaa.gov/</a> For more information about GOES satellites, visit: <a href="http://www.goes.noaa.gov/" rel="nofollow">www.goes.noaa.gov/</a> or <a href="http://goes.gsfc.nasa.gov/" rel="nofollow">goes.gsfc.nasa.gov/</a> Credit: NASA/GSFC/Jeff Schmaltz/MODIS Land Rapid Response Team <b><a href="http://www.nasa.gov/audience/formedia/features/MP_Photo_Guidelines.html" rel="nofollow">NASA image use policy.</a></b> <b><a href="http://www.nasa.gov/centers/goddard/home/index.html" rel="nofollow">NASA Goddard Space Flight Center</a></b> enables NASA’s mission through four scientific endeavors: Earth Science, Heliophysics, Solar System Exploration, and Astrophysics. Goddard plays a leading role in NASA’s accomplishments by contributing compelling scientific knowledge to advance the Agency’s mission. <b>Follow us on <a href="http://twitter.com/NASAGoddardPix" rel="nofollow">Twitter</a></b> <b>Like us on <a href="http://www.facebook.com/pages/Greenbelt-MD/NASA-Goddard/395013845897?ref=tsd" rel="nofollow">Facebook</a></b> <b>Find us on <a href="http://instagram.com/nasagoddard?vm=grid" rel="nofollow">Instagram</a></b>](https://images-assets.nasa.gov/image/GSFC_20171208_Archive_e001229/GSFC_20171208_Archive_e001229~medium.jpg)
The monster winter storm that brought icing to the U.S. southeast moved northward along the Eastern Seaboard and brought snow, sleet and rain from the Mid-Atlantic to New England on February 13. A new image from NOAA's GOES satellite showed clouds associated with the massive winter storm stretch from the U.S. southeast to the northeast. Data from NOAA's GOES-East satellite taken on Feb. 13 at 1455 UTC/9:45 a.m. EST were made into an image by NASA/NOAA's GOES Project at NASA's Goddard Space Flight Center in Greenbelt, Md. The clouds and fallen snow data from NOAA's GOES-East satellite were overlaid on a true-color image of land and ocean created by data from the Moderate Resolution Imaging Spectroradiometer or MODIS instrument that flies aboard NASA's Aqua and Terra satellites.The image showed that the clouds associated with the storm were blanketing much of the U.S. East Coast. At 3:11 a.m. EST, a surface map issued by the National Weather Service or NWS showed the storm's low pressure area was centered over eastern North Carolina. Since then, the low has continued to track north along the eastern seaboard. By 11 a.m. EST, precipitation from the storm was falling from South Carolina to Maine, according to National Weather Service radar. By 11 a.m. EST, the Washington, D.C. region snow and sleet totals ranged from 3" in far eastern Maryland to over 18" in the northern and western suburbs in Maryland and Virginia. NWS reported that snow, sleet and rain were still falling and more snow is expected as the back side of the low moves into the region. The New York City region remained under an NWS Winter Storm Warning until 6 a.m. on Friday, February 14 and the National Weather Service expects minor coastal impacts Thursday into Friday afternoon. New England was also being battered by the storm. At 10:56 a.m. EST, Barnstable, Mass. on Cape Cod was experiencing rain and winds gusting to 28 mph. An NWS wind advisory is in effect for Cape Cod until 7 p.m. EST. Further north, Portland, Maine was experiencing heavy snow with winds from the northeast at 6 mph. The National Weather Service in Gray, Maine noted "Significant snowfall is likely for much of western Maine and New Hampshire as this storm passes by. There will be a mix or changeover to sleet and freezing rain over southern and coastal sections tonight...before all areas end as a period of snow Friday (Feb. 14) morning." On February 13 at 10 a.m. EST, NOAA's National Weather Service noted "An abundance of Atlantic moisture getting wrapped into the storm will continue to fuel widespread precipitation...which should lift through the Mid-Atlantic States and Northeast Thursday into Friday. A wide swath of heavy snow accumulations are expected with this storm...but air [moving] off the warmer ocean water should change snow over to rain along the coastal areas. Also...a narrow axis of sleet and freezing rain will be possible within the transition zone...which is expected to set up near the I-95 corridor." For updates on local forecasts, watches and warnings, visit NOAA's <a href="http://www.weather.gov" rel="nofollow">www.weather.gov</a> webpage. GOES satellites provide the kind of continuous monitoring necessary for intensive data analysis. Geostationary describes an orbit in which a satellite is always in the same position with respect to the rotating Earth. This allows GOES to hover continuously over one position on Earth's surface, appearing stationary. As a result, GOES provide a constant vigil for the atmospheric "triggers" for severe weather conditions such as tornadoes, flash floods, hail storms and hurricanes. For updated information about the storm system, visit NOAA's WPC website: <a href="http://www.hpc.ncep.noaa.gov/" rel="nofollow">www.hpc.ncep.noaa.gov/</a> For more information about GOES satellites, visit: <a href="http://www.goes.noaa.gov/" rel="nofollow">www.goes.noaa.gov/</a> or <a href="http://goes.gsfc.nasa.gov/" rel="nofollow">goes.gsfc.nasa.gov/</a> Credit: NASA/GSFC/Jeff Schmaltz/MODIS Land Rapid Response Team <b><a href="http://www.nasa.gov/audience/formedia/features/MP_Photo_Guidelines.html" rel="nofollow">NASA image use policy.</a></b> <b><a href="http://www.nasa.gov/centers/goddard/home/index.html" rel="nofollow">NASA Goddard Space Flight Center</a></b> enables NASA’s mission through four scientific endeavors: Earth Science, Heliophysics, Solar System Exploration, and Astrophysics. Goddard plays a leading role in NASA’s accomplishments by contributing compelling scientific knowledge to advance the Agency’s mission. <b>Follow us on <a href="http://twitter.com/NASAGoddardPix" rel="nofollow">Twitter</a></b> <b>Like us on <a href="http://www.facebook.com/pages/Greenbelt-MD/NASA-Goddard/395013845897?ref=tsd" rel="nofollow">Facebook</a></b> <b>Find us on <a href="http://instagram.com/nasagoddard?vm=grid" rel="nofollow">Instagram</a></b>