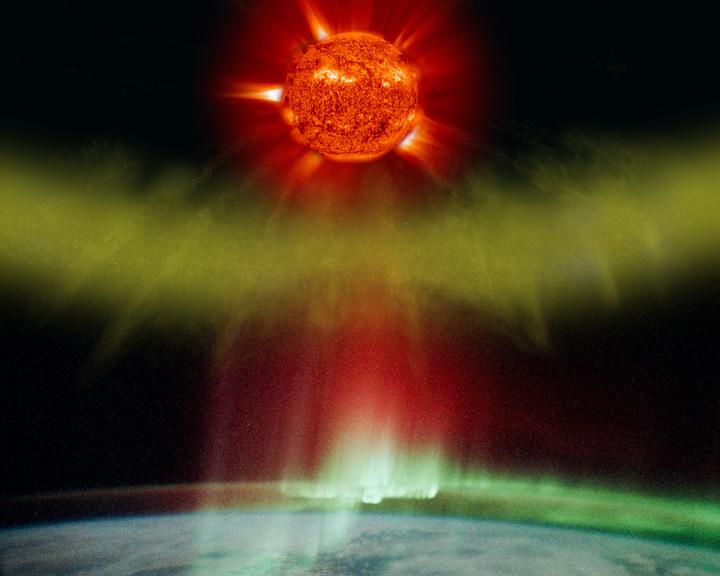
Illustration of a CME particle cloud blasted from the sun impacting Earth and creating aurora (in actual photo of aurora as taken by an astronaut on the space station). Credit: NASA/GSFC/SOHO/ESA To learn more go to the SOHO website: <a href="http://sohowww.nascom.nasa.gov/home.html" rel="nofollow">sohowww.nascom.nasa.gov/home.html</a> To learn more about NASA's Sun Earth Day go here: <a href="http://sunearthday.nasa.gov/2010/index.php" rel="nofollow">sunearthday.nasa.gov/2010/index.php</a>
ISS006-E-18372 (January 2003) --- The Aurora Borealis or “northern lights” and the Manicouagan Impact Crater reservoir (foreground) in Quebec, Canada, were featured in this photograph taken by astronaut Donald R. Pettit, Expedition 6 NASA ISS science officer, on board the International Space Station (ISS).
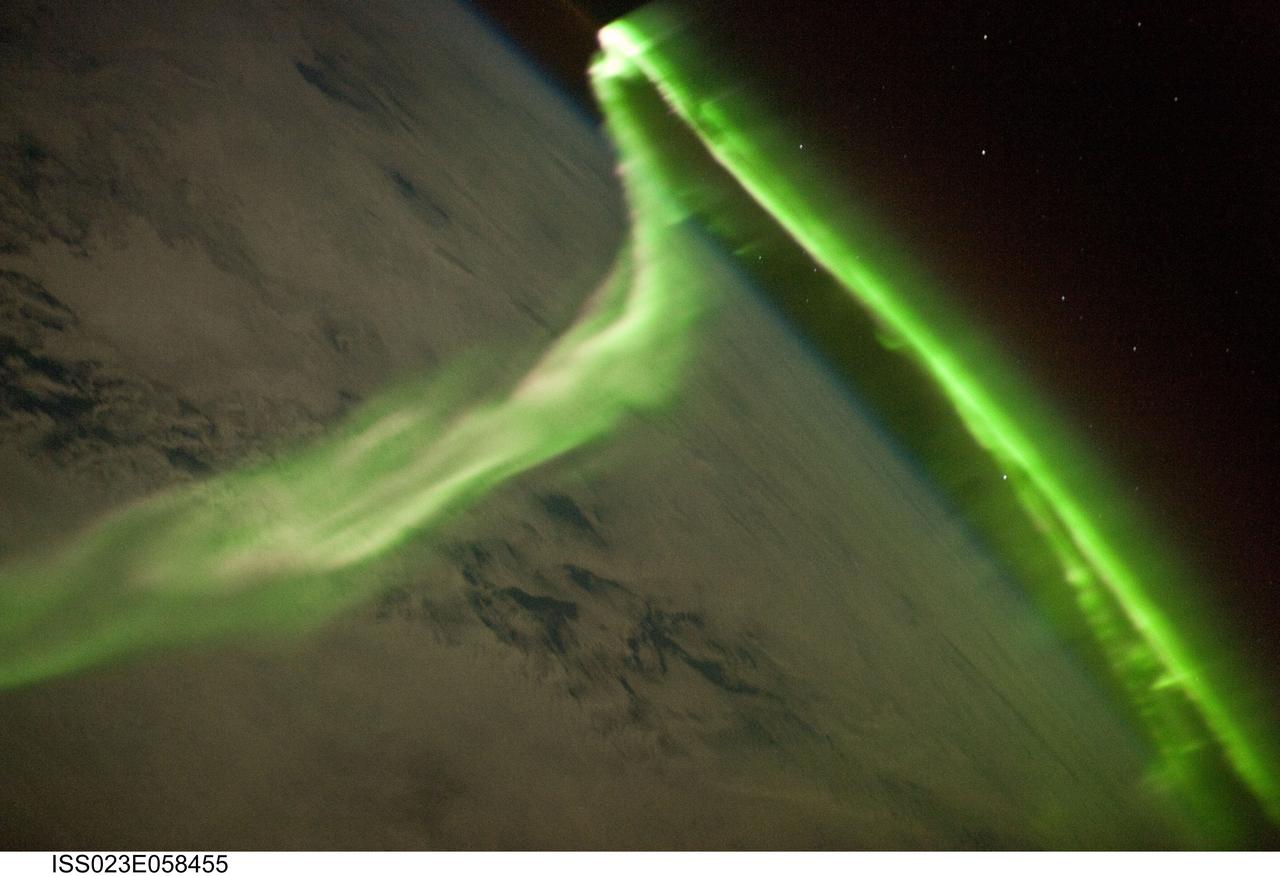
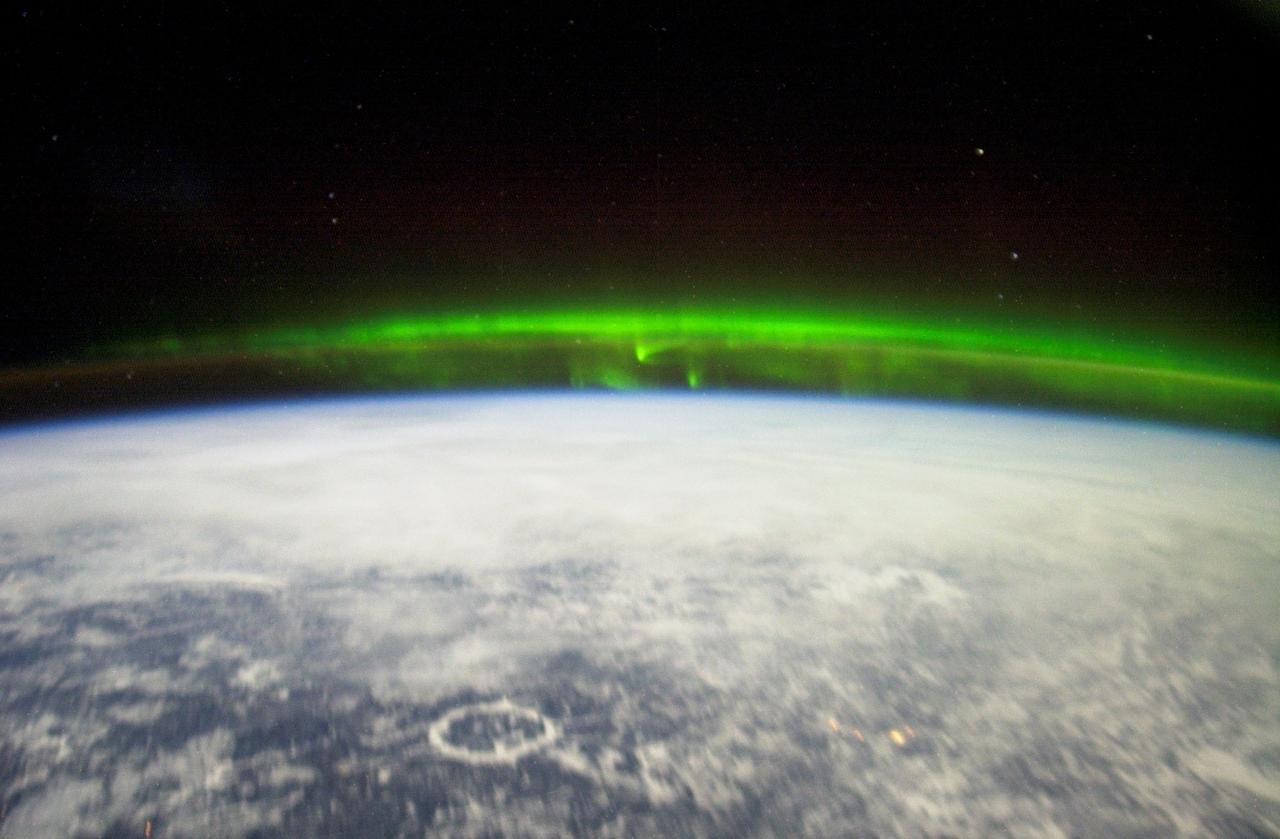
ISS023-E-058455 (29 May 2010) --- Aurora Australis is featured in this image photographed by an Expedition 23 crew member on the International Space Station. Among the views of Earth afforded crew members aboard the ISS, surely one of the most spectacular is of the aurora. These ever-shifting displays of colored ribbons, curtains, rays, and spots are most visible near the North (Aurora Borealis) and South (Aurora Australis) Poles as charged particles streaming from the sun (the solar wind) interact with Earth’s magnetic field, resulting in collisions with atoms of oxygen and nitrogen in the upper atmosphere. The atoms are excited by these collisions, and typically emit photons as a means of returning to their original energy state. The photons form the aurora that we see. The most commonly observed color of aurora is green, caused by photons (light) emitted by excited oxygen atoms at wavelengths centered at 0.558 micrometers, or millionths of a meter. Visible light is reflected from healthy (green) plant leaves at approximately the same wavelength. Red auroras are generated by light emitted at a longer wavelength (0.630 micrometers), and other colors such as blue and purple are also sometimes observed. While auroras are generally only visible close to the poles, severe magnetic storms impacting Earth’s magnetic field can shift them towards the equator. This striking aurora image was taken during a geomagnetic storm that was most likely caused by a coronal mass ejection from the sun on May 24, 2010. The ISS was located over the Southern Indian Ocean at an altitude of 350 kilometers, with the observer most likely looking towards Antarctica (not visible) and the South Pole. The aurora has a sinuous ribbon shape that separates into discrete spots near the lower right corner of the image. While the dominant coloration of the aurora is green, there are faint suggestions of red photon emission as well (light fuscia tones at center left). Dense cloud cover is dimly visible below the aurora. The curvature of Earth’s horizon, or limb, is clearly visible as is the faint blue line of the upper atmosphere directly above at top center. Several stars appear as bright pinpoints against the blackness of space at top right.
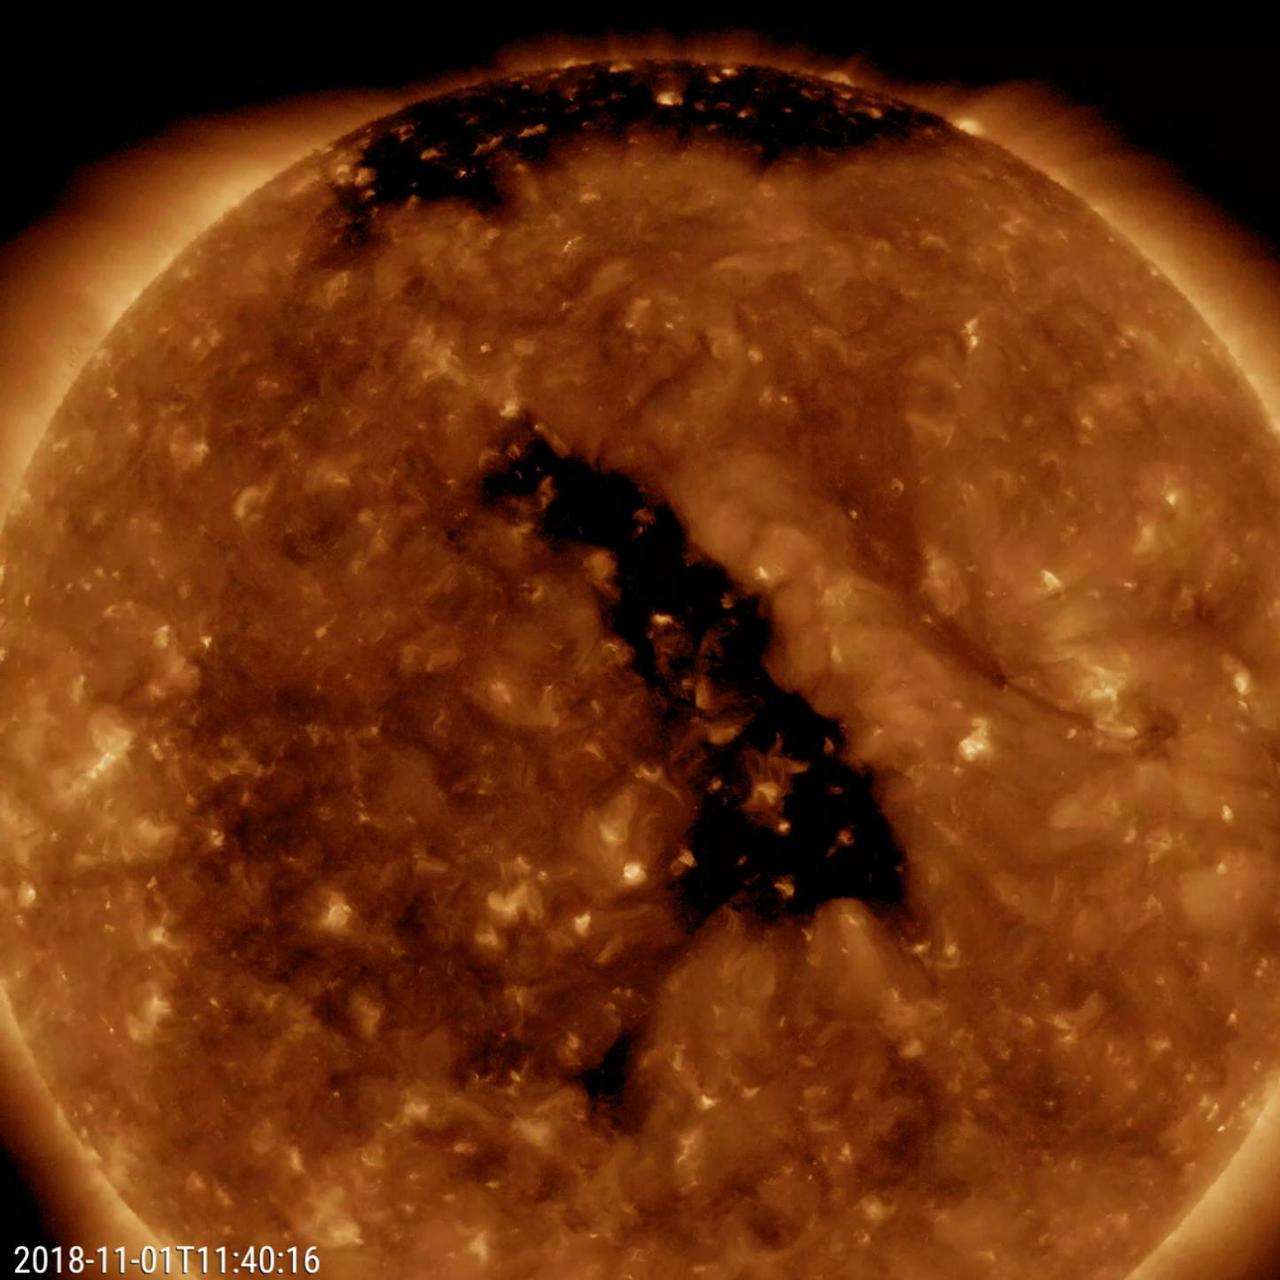
The most distinctive feature on the Sun this week was a good-sized coronal hole at a slanted angle nearly centered on the face of the sun (Oct. 31 - Nov. 2, 2018). Coronal holes are magnetically open areas from which solar wind particles speed into space. They appear darker in this wavelength of extreme ultraviolet light. If these particles impact Earth's magnetosphere, they will likely generate aurora near the Earth's poles regions. The video clip covers about two days of activity. Movies available at https://photojournal.jpl.nasa.gov/catalog/PIA18141
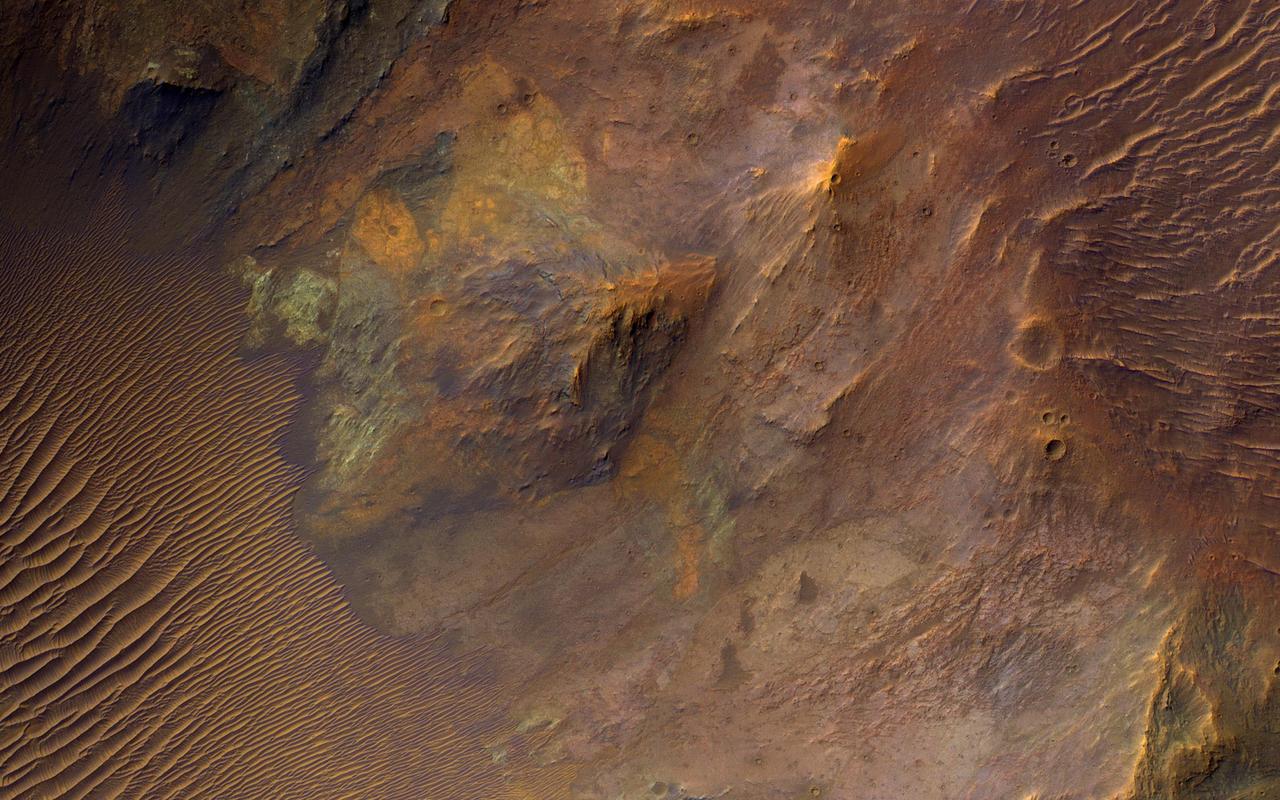
Large impacts produce uplifted central structures, either peaks, or pits, or an uplifted peak with a central pit. This crater south of Aurorae Chaos has a central pit exposing bedrock units with diverse colors, indicating diverse rock compositions. This crater includes clay-rich minerals identified by the CRISM instrument on MRO. See this enhanced-color cutout over the eastern half of the central pit. https://photojournal.jpl.nasa.gov/catalog/PIA23737
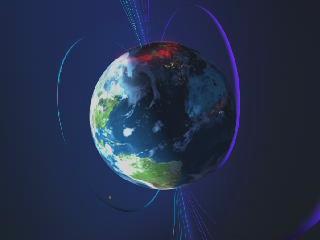
Animation of solar wind impacting the magnetosphere and creating aurora. Credit: NASA/GSFC/SOHO/ESA Sound: Juan Carlos Garcia To learn more go to the SOHO website: <a href="http://sohowww.nascom.nasa.gov/home.html" rel="nofollow">sohowww.nascom.nasa.gov/home.html</a> To learn more about NASA's Sun Earth Day go here: <a href="http://sunearthday.nasa.gov/2010/index.php" rel="nofollow">sunearthday.nasa.gov/2010/index.php</a>

These mosaics of Jupiter's night side show the Jovian aurora at approximately 45 minute intervals as the auroral ring rotated with the planet below the spacecraft. The images were obtained by the Solid State Imaging (SSI) system on NASA's Galileo spacecraft. during its eleventh orbit of Jupiter. The auroral ring is offset from Jupiter's pole of rotation and reaches the lowest latitude near 165 degrees west longitude. The aurora is hundreds of kilometers wide, and when it crosses the edge of Jupiter, it is about 250 kilometers above the planet. As on Earth, the auroral emission is caused by electrically charged particles striking atoms in the upper atmosphere from above. The particles travel along Jupiter's magnetic field lines, but their origin is not fully understood. The field lines where the aurora is most intense cross the Jovian equator at large distances (many Jovian radii) from the planet. The faint background throughout the image is scattered light in the camera. This stray light comes from the sunlit portion of Jupiter, which is out of the image. In multispectral observations the aurora appears red, consistent with how atomic hydrogen in Jupiter's atmosphere would glow. Galileo's unique perspective allows it to view the night side of the planet at short range, revealing details that cannot be seen from Earth. These detailed features are time dependent, and can be followed in this sequence of Galileo images. In the first mosaic, the auroral ring is directly over Jupiter's limb and is seen "edge on." In the fifth mosaic, the auroral emission is coming from several distinct bands. This mosaic also shows the footprint of the Io flux tube. Volcanic eruptions on Jupiter's moon, Io, spew forth particles that become ionized and are pulled into Jupiter's magnetic field to form an invisible tube, the Io flux tube, between Jupiter and Io. The bright circular feature towards the lower right may mark the location where these energetic particles impact Jupiter. Stars which are visible in some of the images enable precise determination of where the camera is pointed. This has allowed the first three dimensional establishment of the position of the aurora. Surprisingly, the measured height is about half the altitude (above the one bar pressure level) predicted by magnetospheric models. The Universal Time, in Spacecraft Event Time (SCET), that the images were taken is listed beneath each mosaic. The first four frames were taken on November 5, 1997 (SCET 97.309) before the Galileo spacecraft reached perijove, the closest point to Jupiter. The latter four were taken three days later on November 8, 1997 (SCET 97.312), after perijove. Each image was taken at visible wavelengths and is displayed in shades of blue. North is at the top of the picture. A grid of planetocentric latitude and west longitude is overlain on the images. The resolution in the plane of the pictures is 15 kilometers per picture element. The images were taken at a range of 1.3 million kilometers. http://photojournal.jpl.nasa.gov/catalog/PIA01600
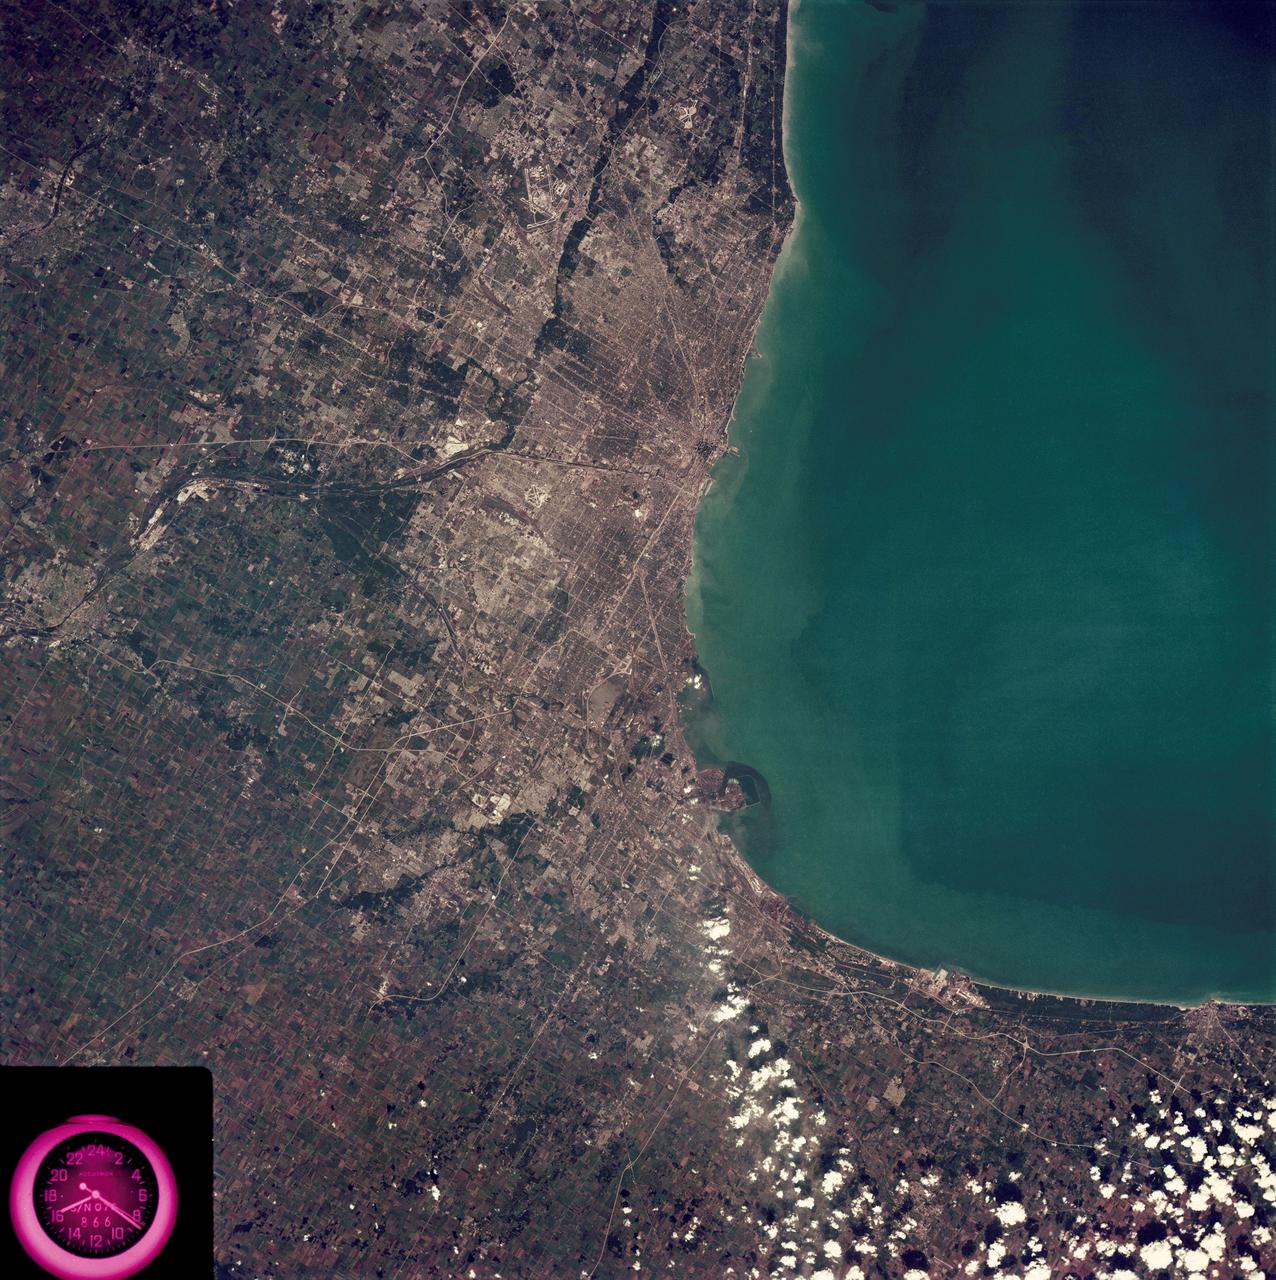
SL3-88-222 (18 Sept. 1973) --- The metropolitan area of Chicago is encompassed in this Skylab 3 Earth Resources Experiments Package (EREP) S190-B photograph taken on Sept. 18, 1973 from the Skylab space station cluster in Earth orbit. The surrounding major cities of Aurora and Joliet, Illinois; Hammond, Gary and East Chicago, Indiana, are easily delineated. The photograph reveals the following: (1) Cultural differentiation of commercial, industrial and residential areas for use in population and social studies in micro-macro community planning and in cultural pattern studies in the improvement of urban areas. (Aurora is one of 27 census cities of interest to Robert Alexander, a principal investigator. Alexander is with the U.S. Geological Survey). (2) The transportation network with major corridors and their interchanges, primary and feeder streets for use in network analysis and in the development of models for population movement and land use projection. (3) The agricultural lands for land use identification on crop inventory analysis; airports for use in delineation of service and infringement of major man-made features that affect ecosystem balance (support to environmental impact studies). (4) Air and water plumes for use in case studies, natural and man-made differentiation of pollution sources, in support of model development and in ecosystem research studies on the effects of pollution. (5) Recreational centers for use in relating recreational centers to population centers, establishing possible demands and in development of possible future recreational centers to support the demand. All EREP photography is available to the public through the Department of Interior?s Earth Resources Observations Systems Data Center, Sioux Falls, South Dakota, 57198. Photo credit: NASA
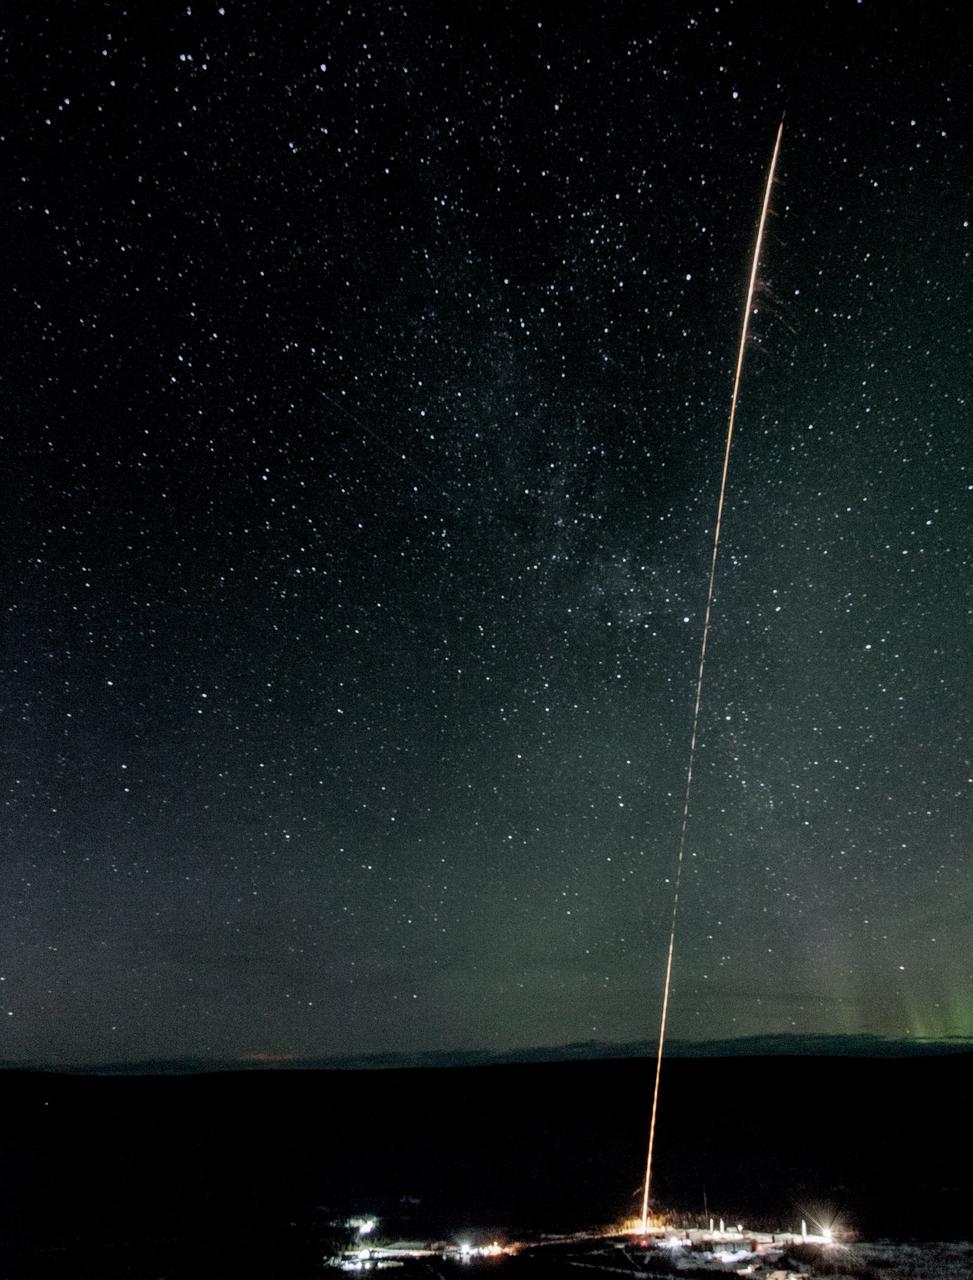
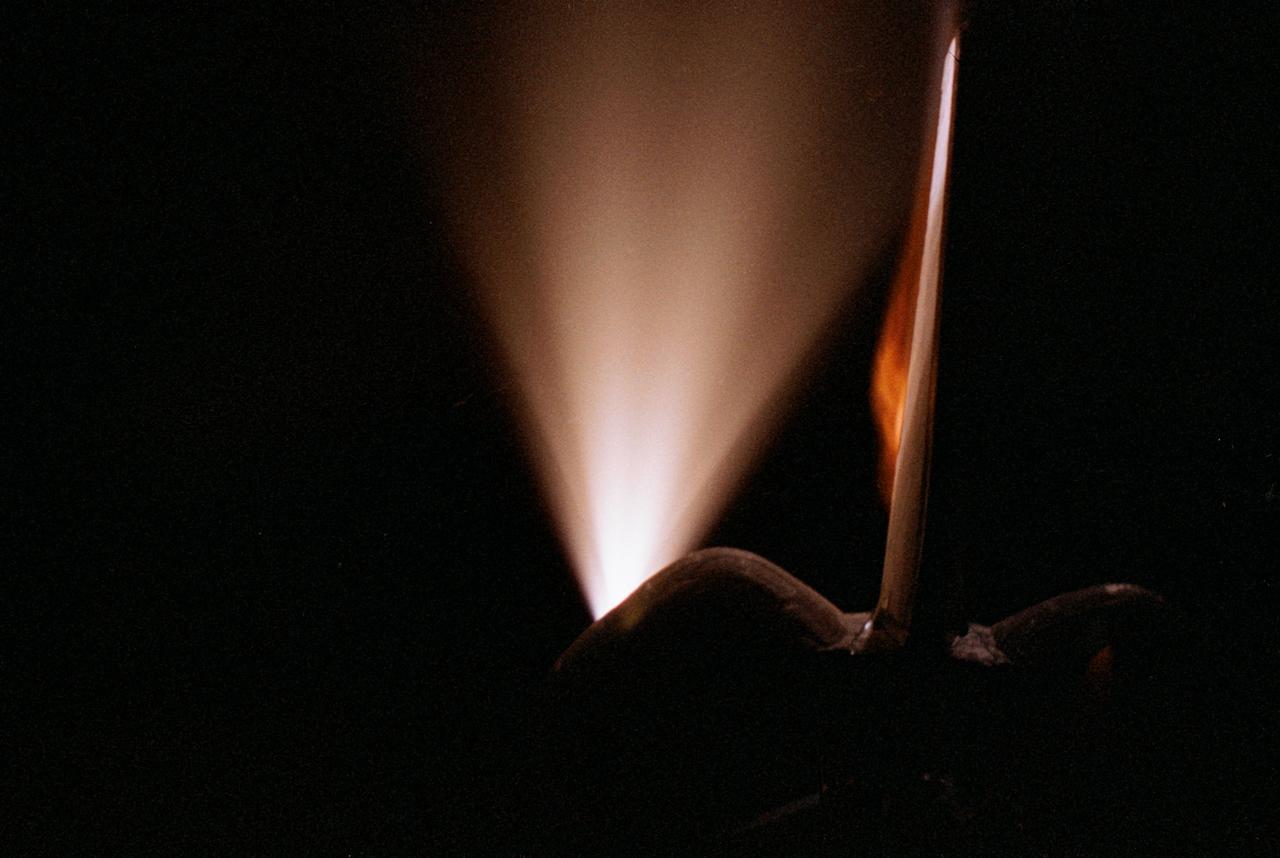
A test rocket is launched the night of Feb. 17 from the Poker Flat Research Range in Alaska. Test rockets are launched as part of the countdown to test out the radar tracking systems. NASA is launching five sounding rockets from the Poker Range into active auroras to explore the Earth's magnetic environment and its impact on Earth’s upper atmosphere and ionosphere. The launch window for the four remaining rockets runs through March 3. Credit: NASA/Terry Zaperach <b><a href="http://www.nasa.gov/audience/formedia/features/MP_Photo_Guidelines.html" rel="nofollow">NASA image use policy.</a></b> <b><a href="http://www.nasa.gov/centers/goddard/home/index.html" rel="nofollow">NASA Goddard Space Flight Center</a></b> enables NASA’s mission through four scientific endeavors: Earth Science, Heliophysics, Solar System Exploration, and Astrophysics. Goddard plays a leading role in NASA’s accomplishments by contributing compelling scientific knowledge to advance the Agency’s mission. <b>Follow us on <a href="http://twitter.com/NASAGoddardPix" rel="nofollow">Twitter</a></b> <b>Like us on <a href="http://www.facebook.com/pages/Greenbelt-MD/NASA-Goddard/395013845897?ref=tsd" rel="nofollow">Facebook</a></b> <b>Find us on <a href="http://instagrid.me/nasagoddard/?vm=grid" rel="nofollow">Instagram</a></b>
STS070-386-027 (13-22 JULY 1995) --- High-speed film provided this close-up view of the Space Shuttle Discovery’s aft, featuring the ignition of one of the primary thrusters. Note the impact of the firing on the starboard side of the vertical stabilizer. Crew members told a August 11, 1995, gathering of Johnson Space Center (JSC) employees that the Window Experiment (WINDEX) paid close attention to surface glow, jet plumes, water dumps, aurora and airglow. The data collection is part of an effort to avoid misinterpretation of measurements of Earth, the solar system and starts taken from satellites in low Earth-orbits and prevent damage to sensitive systems and solar arrays during rendezvous and docking. Such firings of the thrusters increase local densities of gases in the atmosphere dramatically and introduce non-natural elements that react with the atmosphere dramatically and spacecraft systems enveloped by the thruster plume. WINDEX recorded phenomena associated with thruster start-up and shut-down transients and observed the effect of the transients on Shuttle glow phenomenon.
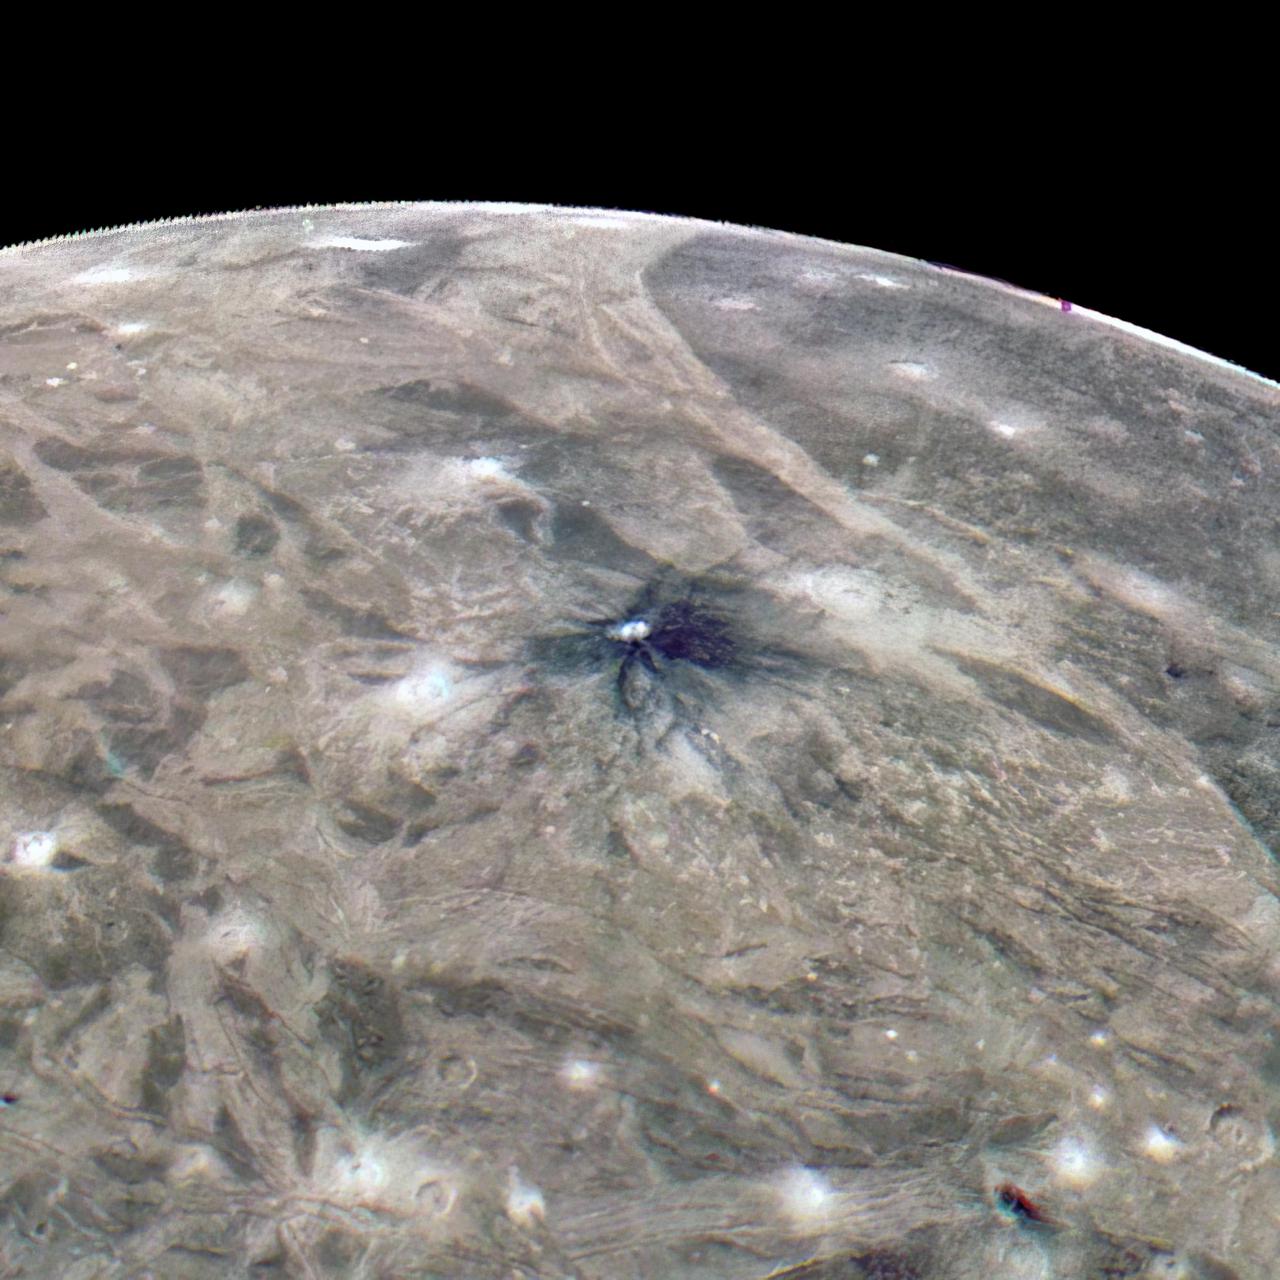
This look at the complex surface of Jupiter's moon Ganymede came from NASA's Juno mission during a close pass by the giant moon in June 2021. At closest approach, the spacecraft came within just 650 miles (1,046 kilometers) of Ganymede's surface. Most of Ganymede's craters have bright rays extending from the impact scar, but about 1 percent of the craters have dark rays. This image taken by JunoCam during the close Ganymede pass shows one of the dark-rayed craters. The crater, named Kittu, is about 9 miles (15 kilometers) across, surrounded by darker material ejected during the impact that formed the crater. Scientists believe that contamination from the impactor produced the dark rays. As time passes, the rays stay dark because they are a bit warmer than the surroundings, so ice is driven off to condense on nearby colder, brighter terrain. Ganymede is the largest moon in our solar system, larger even than the planet Mercury. It's the only moon known to have its own magnetic field, which causes auroras that circle the moon's poles. Evidence also indicates Ganymede may hide a liquid water ocean beneath its icy surface. Citizen scientist Thomas Thomopoulos created this enhanced-color image using data from the JunoCam camera. The original image was taken on June 7, 2021. https://photojournal.jpl.nasa.gov/catalog/PIA25012

The Polar Night Nitric Oxide or PolarNOx experiment from Virginia Tech is launched aboard a NASA Black Brant IX sounding rocket at 8:45 a.m. EST, Jan. 27, from the Poker Flat Research Range in Alaska. PolarNOx is measuring nitric oxide in the polar night sky. Nitric oxide in the polar night sky is created by auroras. Under appropriate conditions it can be transported to the stratosphere where it may destroy ozone resulting in possible changes in stratospheric temperature and wind and may even impact the circulation at Earth’s surface. Credit: NASA/Wallops/Jamie Adkins <b><a href="http://www.nasa.gov/audience/formedia/features/MP_Photo_Guidelines.html" rel="nofollow">NASA image use policy.</a></b> <b><a href="http://www.nasa.gov/centers/goddard/home/index.html" rel="nofollow">NASA Goddard Space Flight Center</a></b> enables NASA’s mission through four scientific endeavors: Earth Science, Heliophysics, Solar System Exploration, and Astrophysics. Goddard plays a leading role in NASA’s accomplishments by contributing compelling scientific knowledge to advance the Agency’s mission. <b>Follow us on <a href="http://twitter.com/NASAGoddardPix" rel="nofollow">Twitter</a></b> <b>Like us on <a href="http://www.facebook.com/pages/Greenbelt-MD/NASA-Goddard/395013845897?ref=tsd" rel="nofollow">Facebook</a></b> <b>Find us on <a href="http://instagrid.me/nasagoddard/?vm=grid" rel="nofollow">Instagram</a></b>
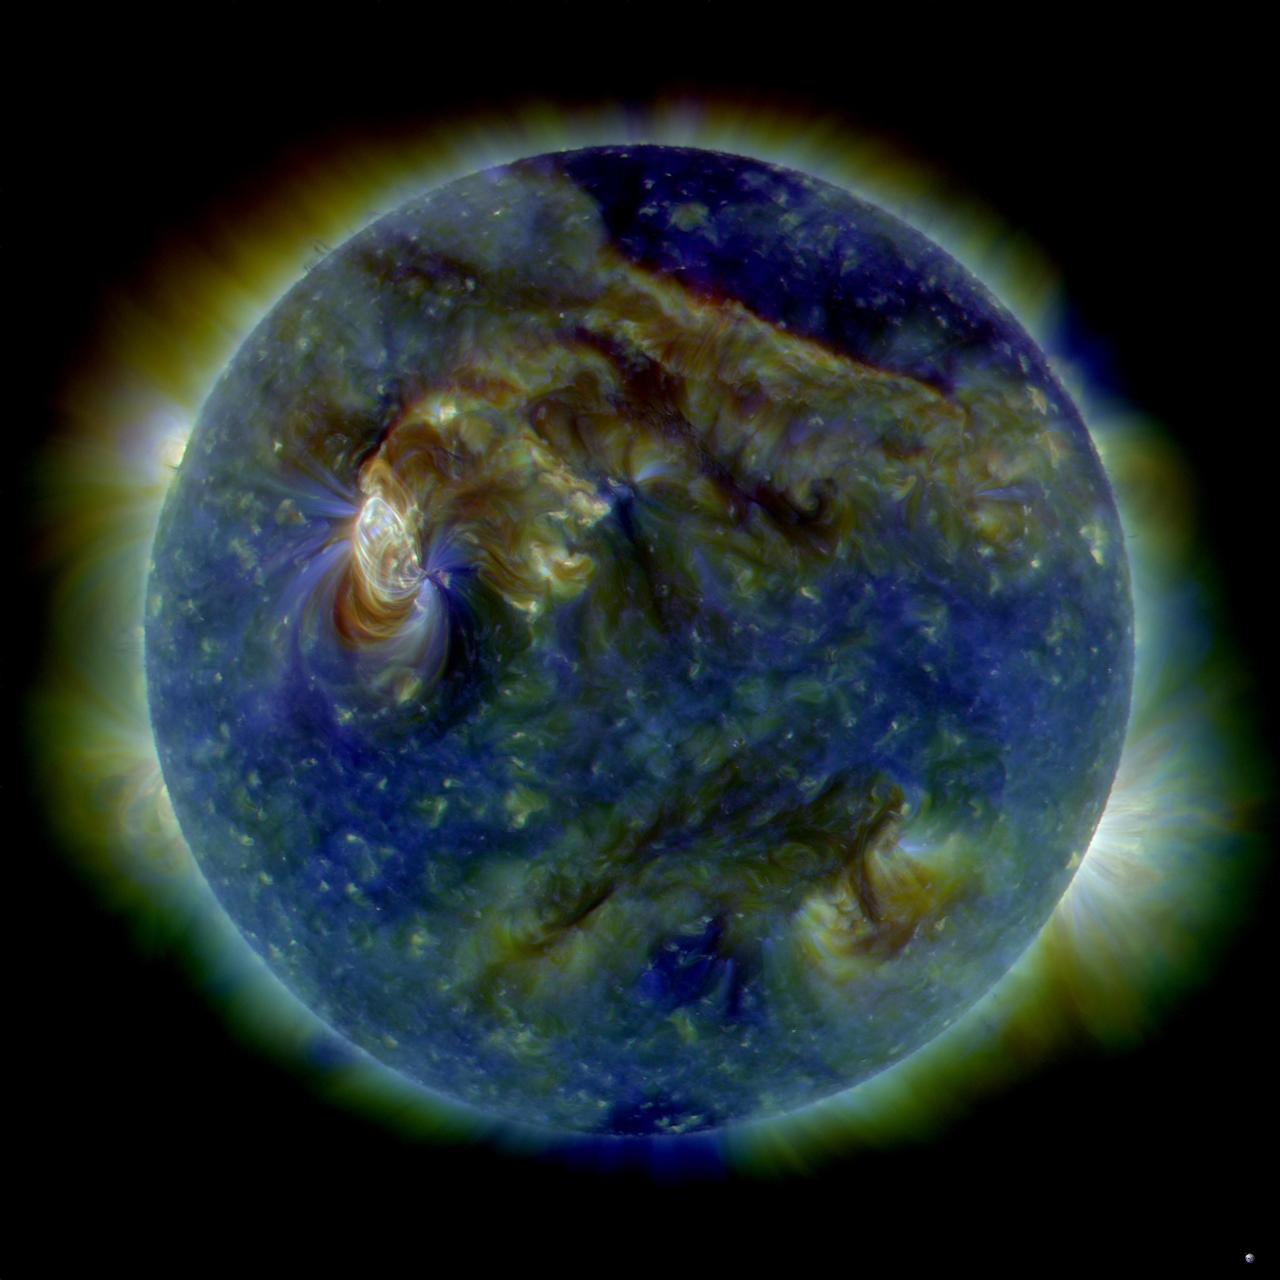
NASA image release August 6, 2010 On August 1, 2010, almost the entire Earth-facing side of the sun erupted in a tumult of activity. This image from the Solar Dynamics Observatory of the news-making solar event on August 1 shows the C3-class solar flare (white area on upper left), a solar tsunami (wave-like structure, upper right), multiple filaments of magnetism lifting off the stellar surface, large-scale shaking of the solar corona, radio bursts, a coronal mass ejection and more. This multi-wavelength extreme ultraviolet snapshot from the Solar Dynamics Observatory shows the sun's northern hemisphere in mid-eruption. Different colors in the image represent different gas temperatures. Earth's magnetic field is still reverberating from the solar flare impact on August 3, 2010, which sparked aurorae as far south as Wisconsin and Iowa in the United States. Analysts believe a second solar flare is following behind the first flare and could re-energize the fading geomagnetic storm and spark a new round of Northern Lights. Credit: NASA/SDO/AIA <b><a href="http://www.nasa.gov/centers/goddard/home/index.html" rel="nofollow">NASA Goddard Space Flight Center</a></b> is home to the nation's largest organization of combined scientists, engineers and technologists that build spacecraft, instruments and new technology to study the Earth, the sun, our solar system, and the universe. <b>Follow us on <a href="http://twitter.com/NASA_GoddardPix" rel="nofollow">Twitter</a></b> <b>Join us on <a href="http://www.facebook.com/pages/Greenbelt-MD/NASA-Goddard/395013845897?ref=tsd" rel="nofollow">Facebook</a><b> </b></b>