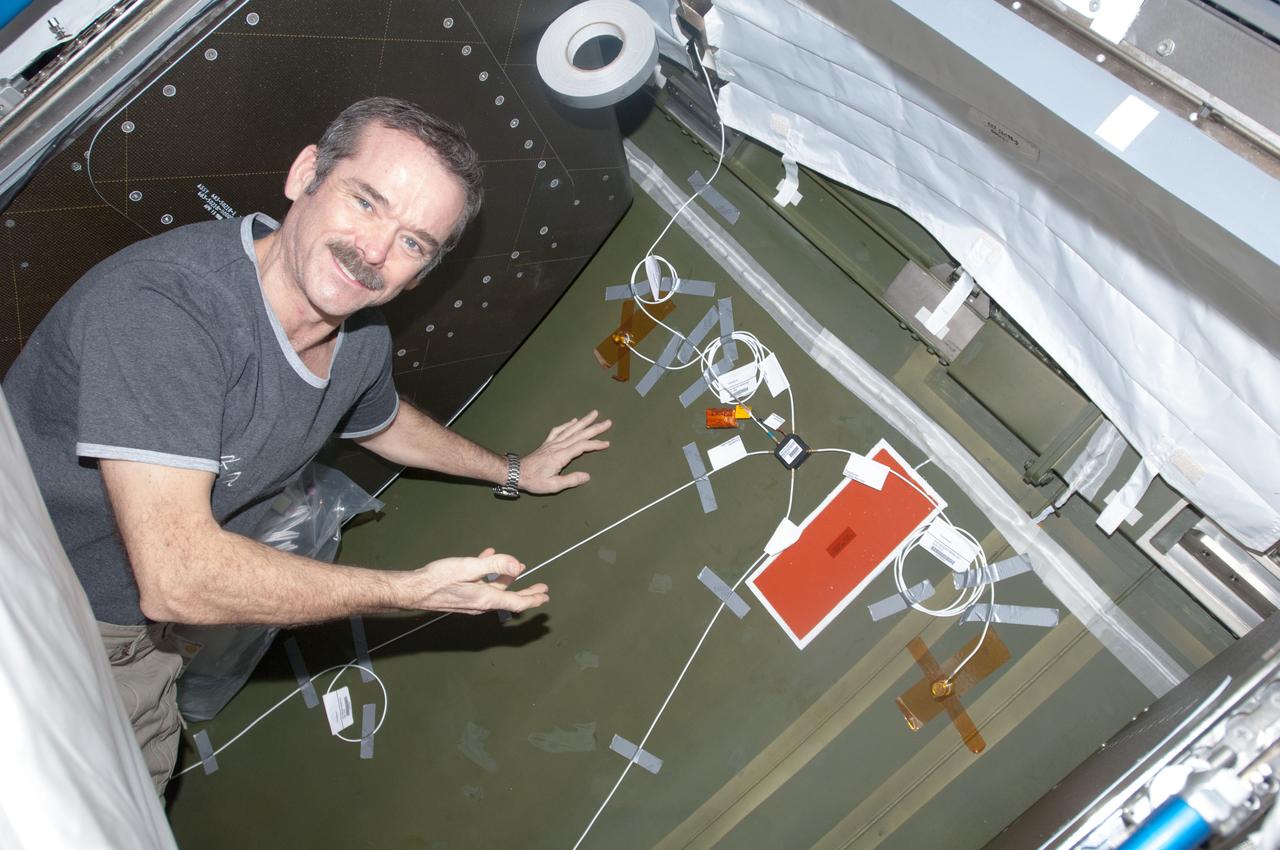
View of Canadian Space Agency (CSA) Chris Hadfield,Expedition 34 Flight Engineer (FE),installing Ultra-Sonic Background Noise Tests (UBNT) sensors behind rack in the U.S. Laboratory using the International Space Station (ISS) as Testbed for Analog Research (ISTAR) procedures. These sensors detect high frequency noise levels generated by ISS hardware and equipment operating within the U.S. Laboratory. Photo was taken during Expedition 34.
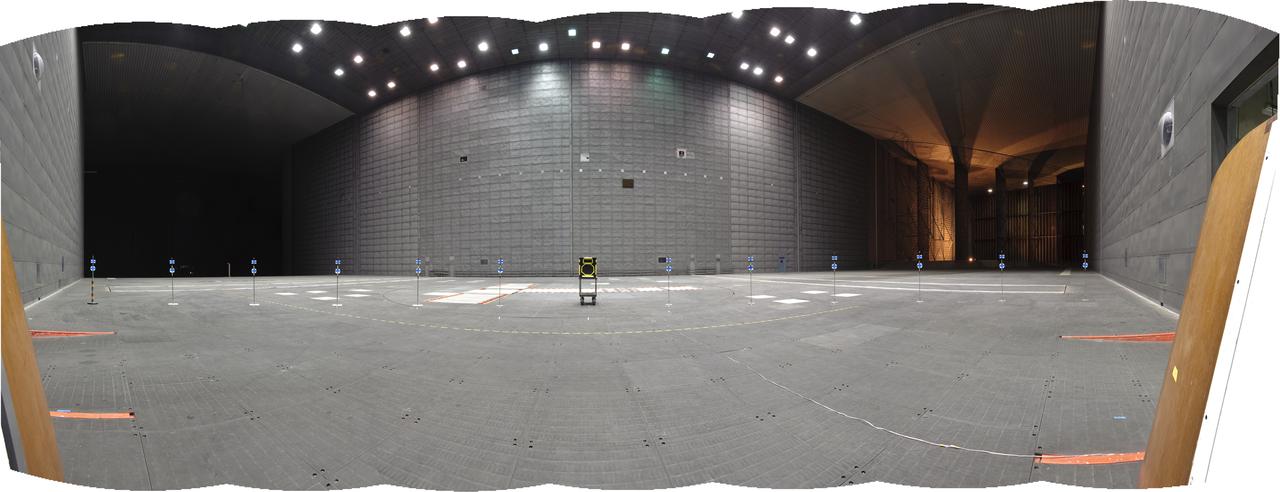
National Full Scale Aerodynamic Complex (NFAC) located at the NASA Ames Research Center 80x20ft. wind tunnel microphone array background noise test
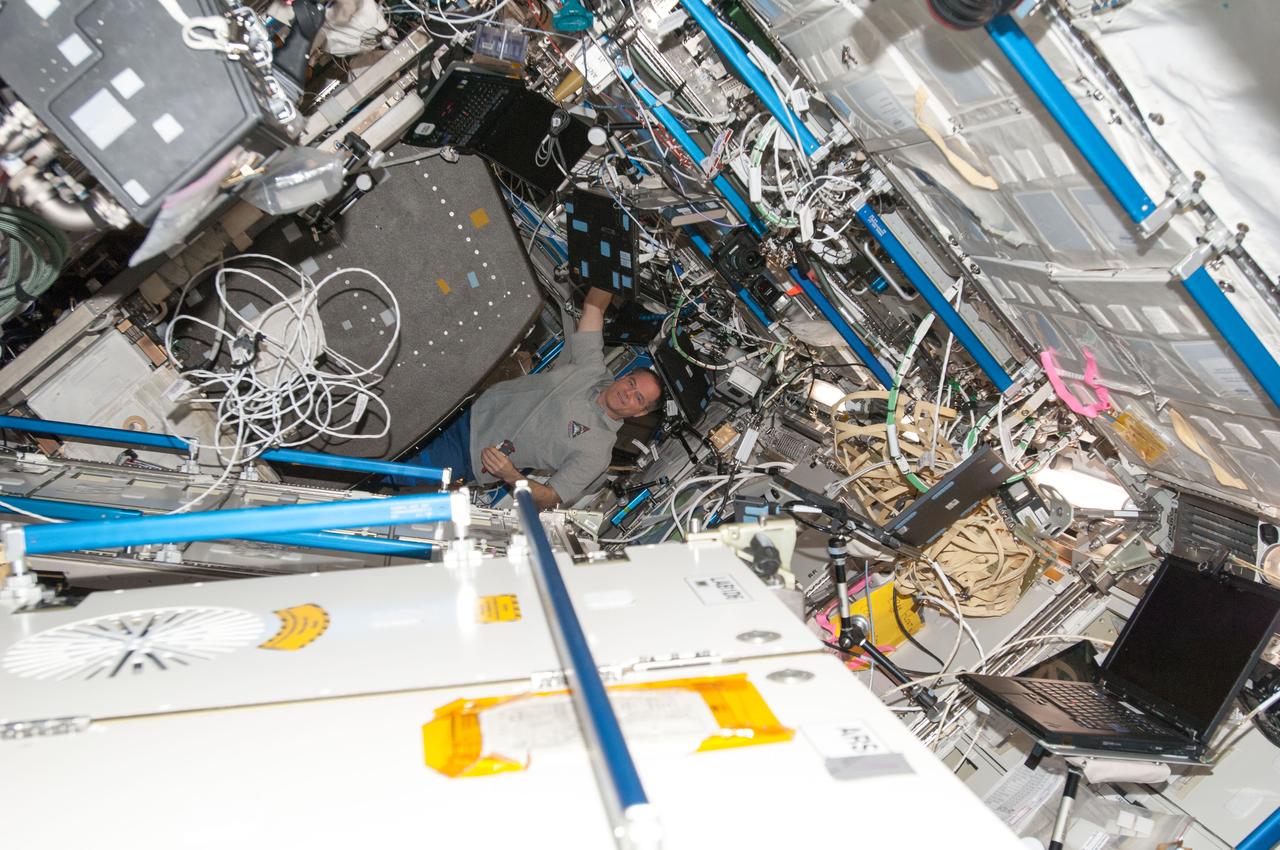
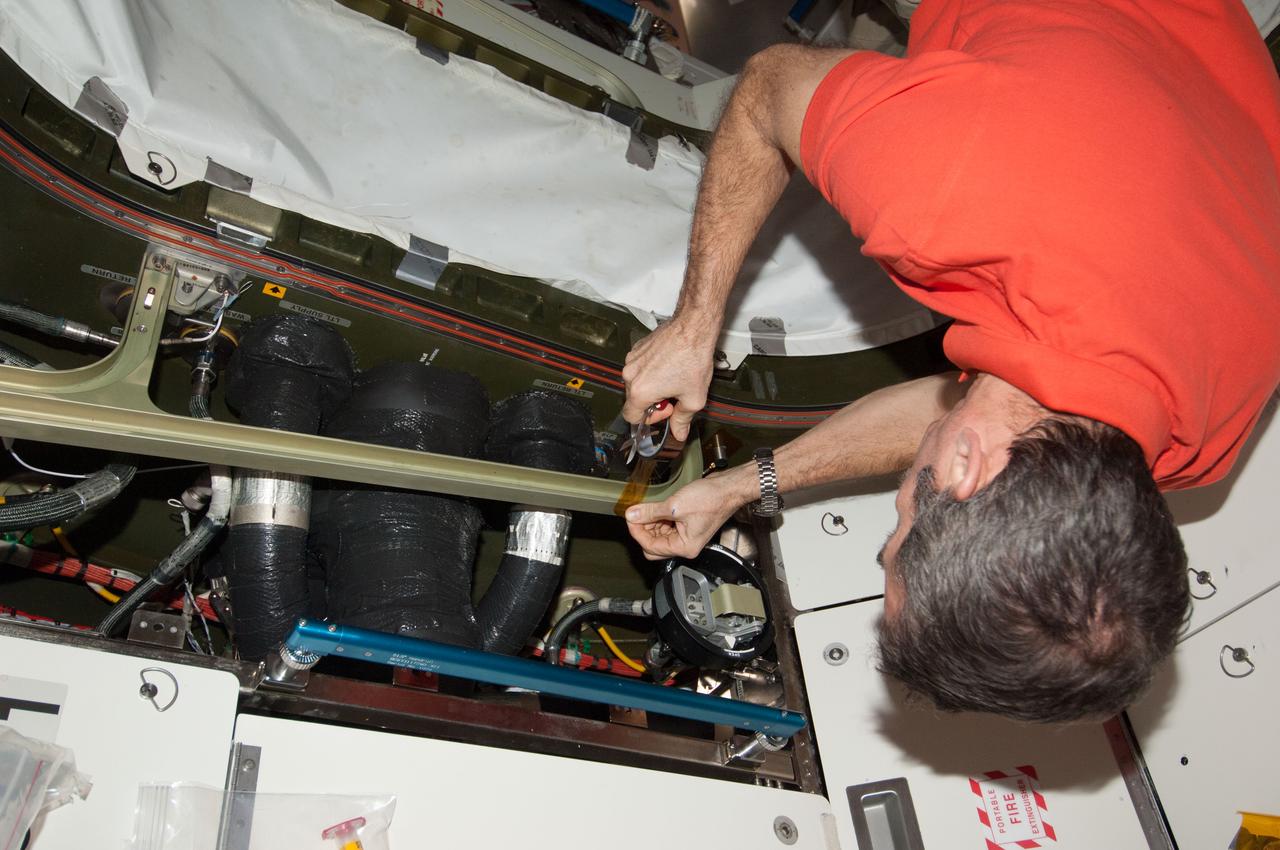
ISS034-E-030216 (16 Jan. 2013) --- NASA astronaut Kevin Ford, Expedition 34 commander, installs a Ultra-Sonic Background Noise Tests (UBNT) sensor kit behind a rack in the Destiny of the International Space Station.
ISS034-E-030218 (16 Jan. 2013) --- NASA astronaut Kevin Ford, Expedition 34 commander, installs a Ultra-Sonic Background Noise Tests (UBNT) sensor kit behind a rack in the Destiny of the International Space Station.
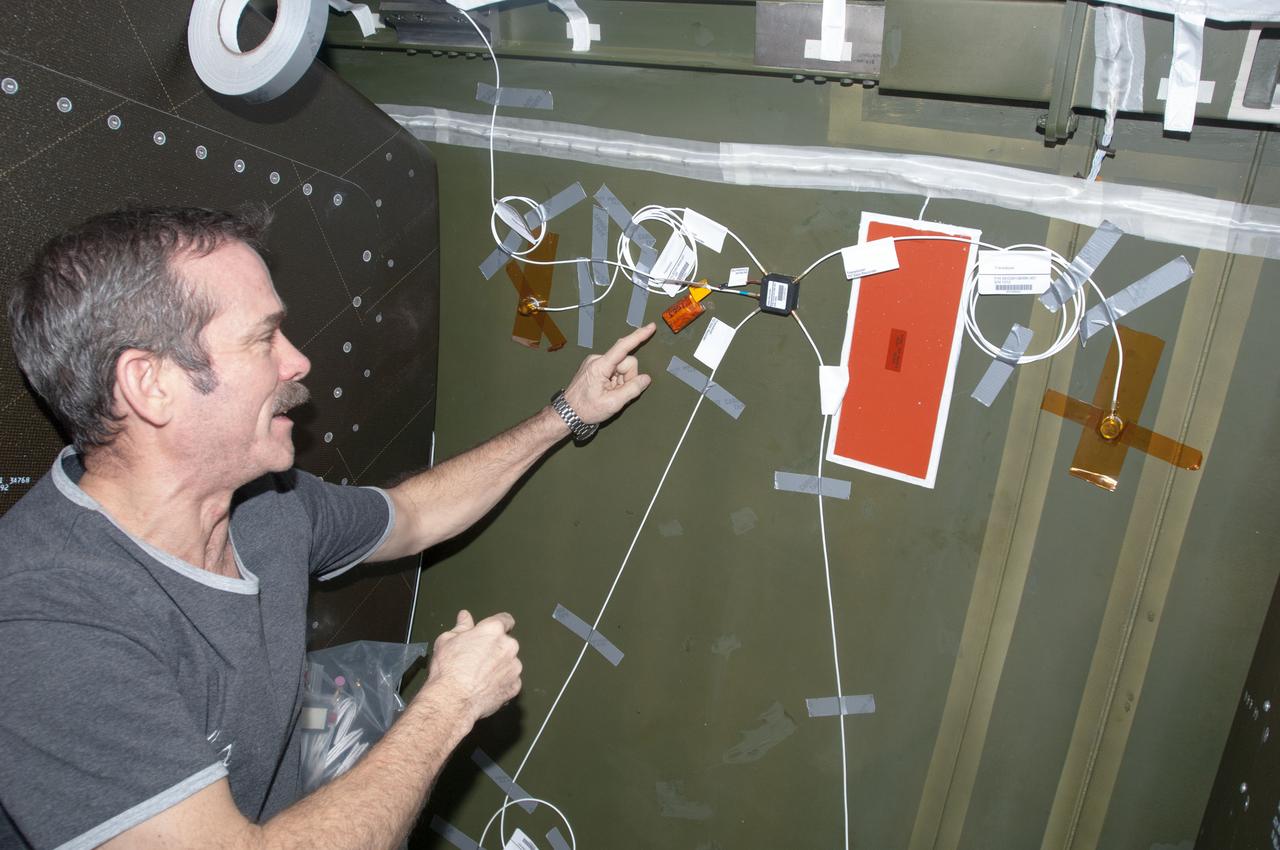
ISS034-E-038211 (1 Feb. 2013) --- Canadian Space Agency astronaut Chris Hadfield, Expedition 34 flight engineer, installs Ultra-Sonic Background Noise Tests (UBNT) sensors behind a rack in the Destiny laboratory, using the International Space Station (ISS) as Testbed for Analog Research (ISTAR) procedures. These sensors detect high frequency noise levels generated by ISS hardware and equipment operating within Destiny.
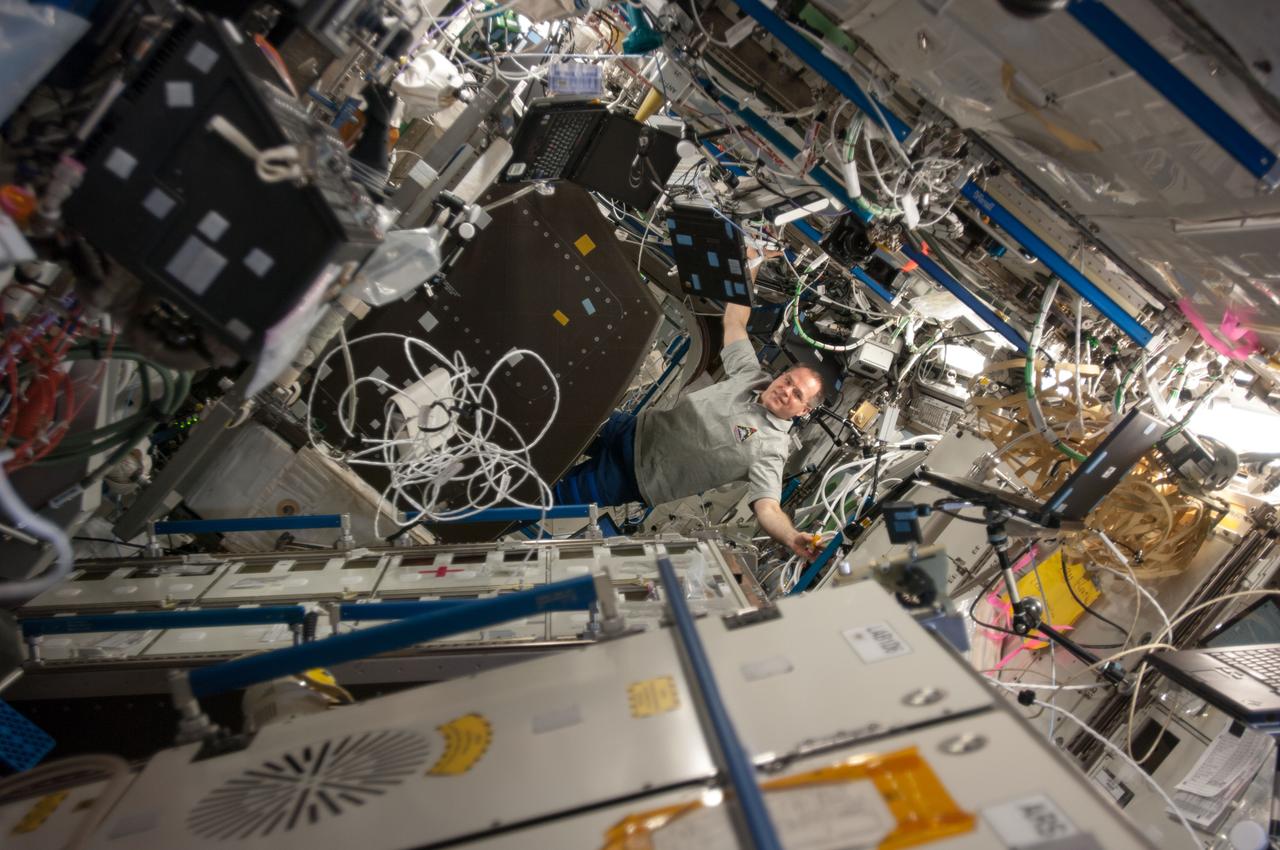
ISS034-E-037330 (31 Jan. 2013) --- Canadian Space Agency astronaut Chris Hadfield, Expedition 34 flight engineer, installs a Ultra-Sonic Background Noise Tests (UBNT) sensor kit behind a rack in the Destiny of the International Space Station.
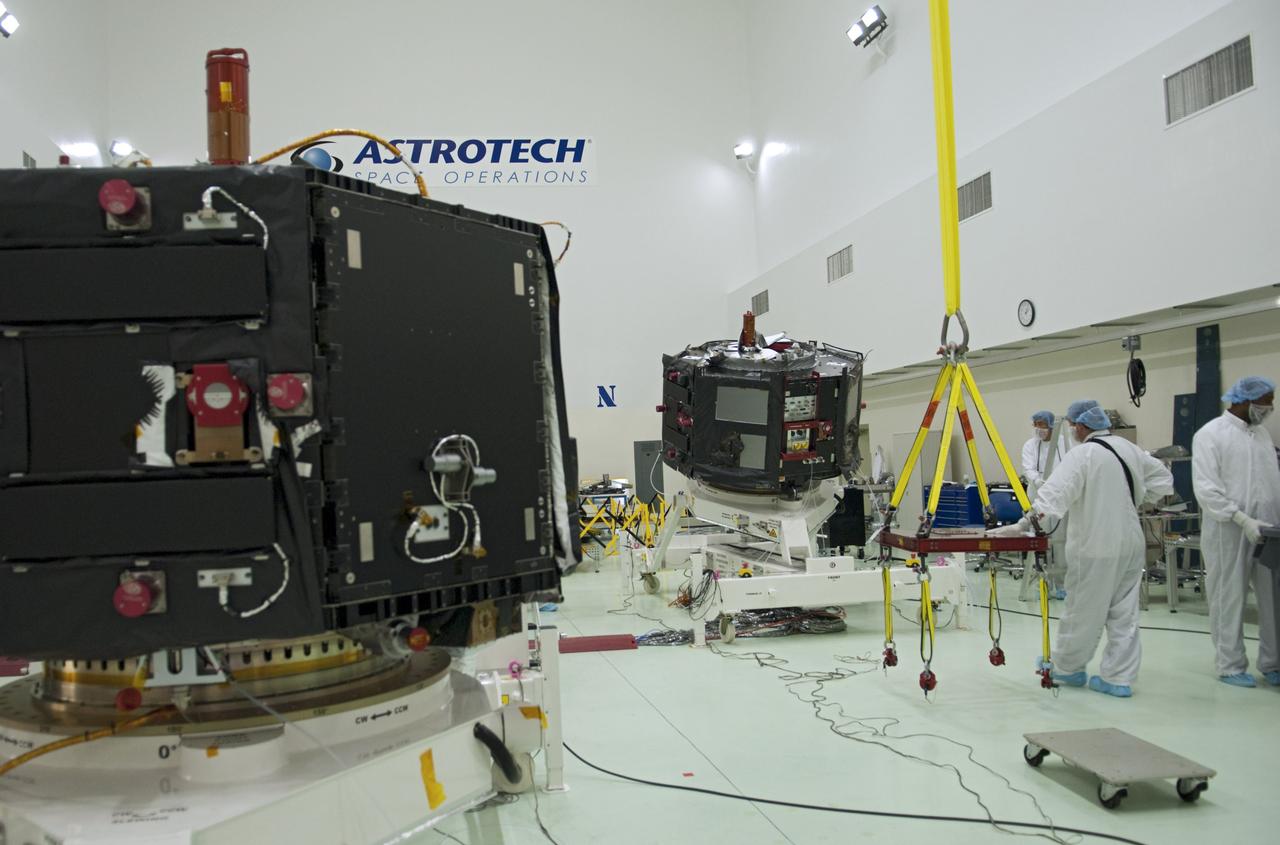
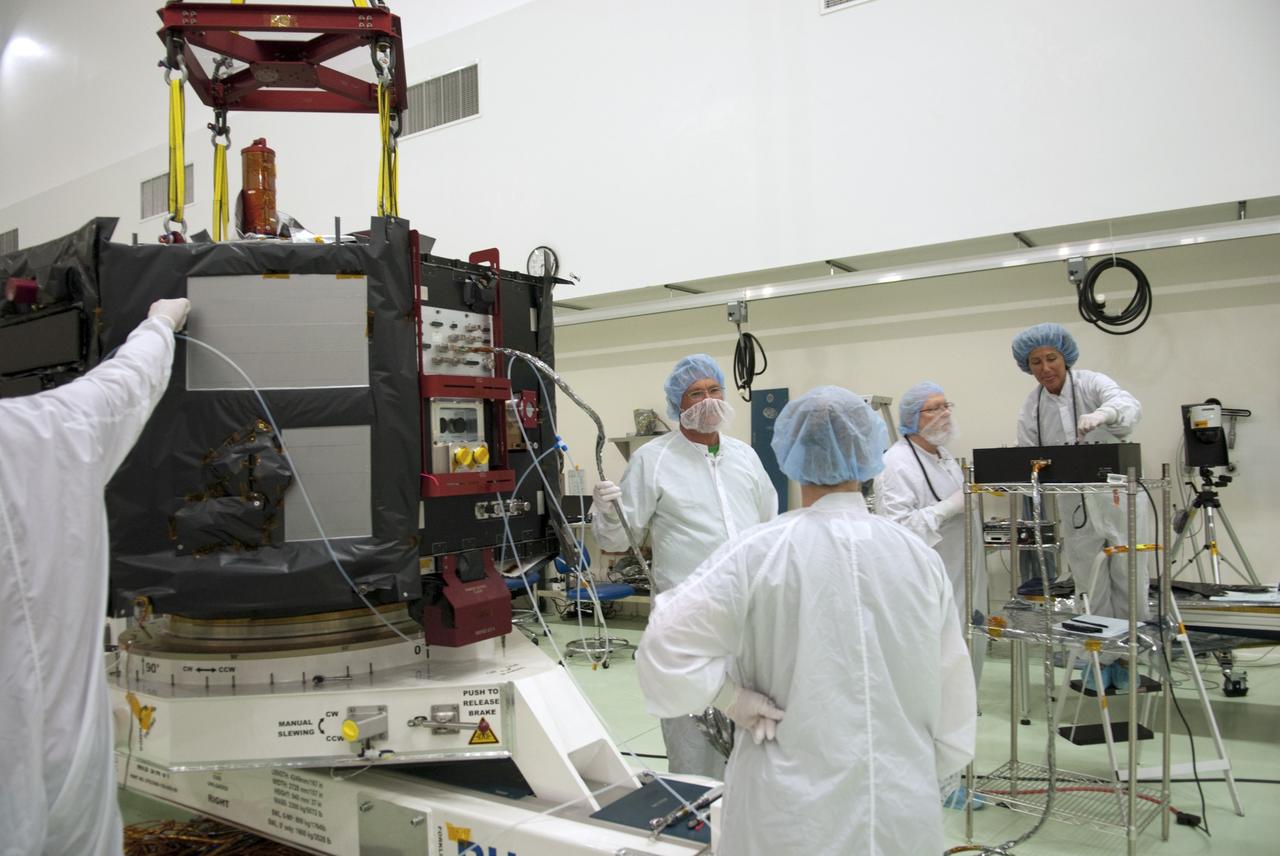
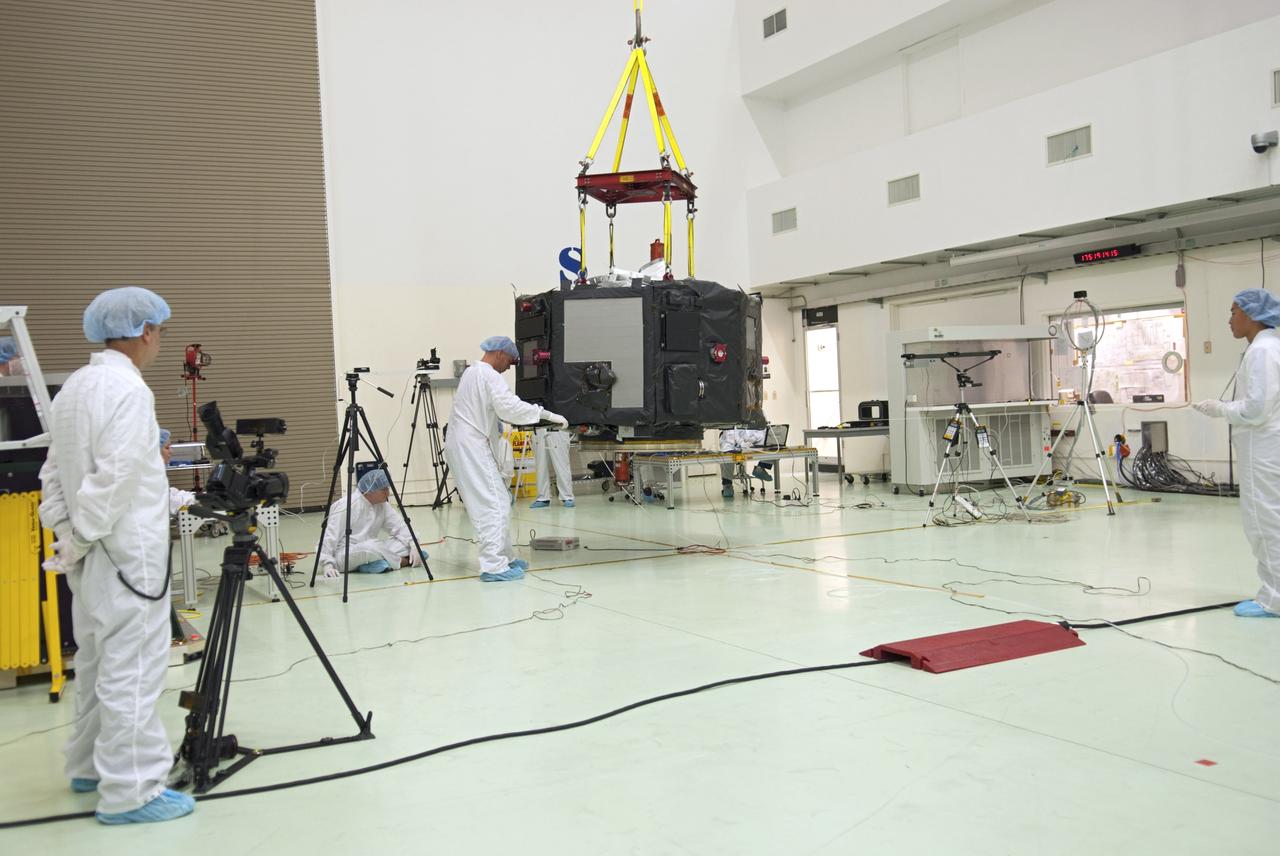
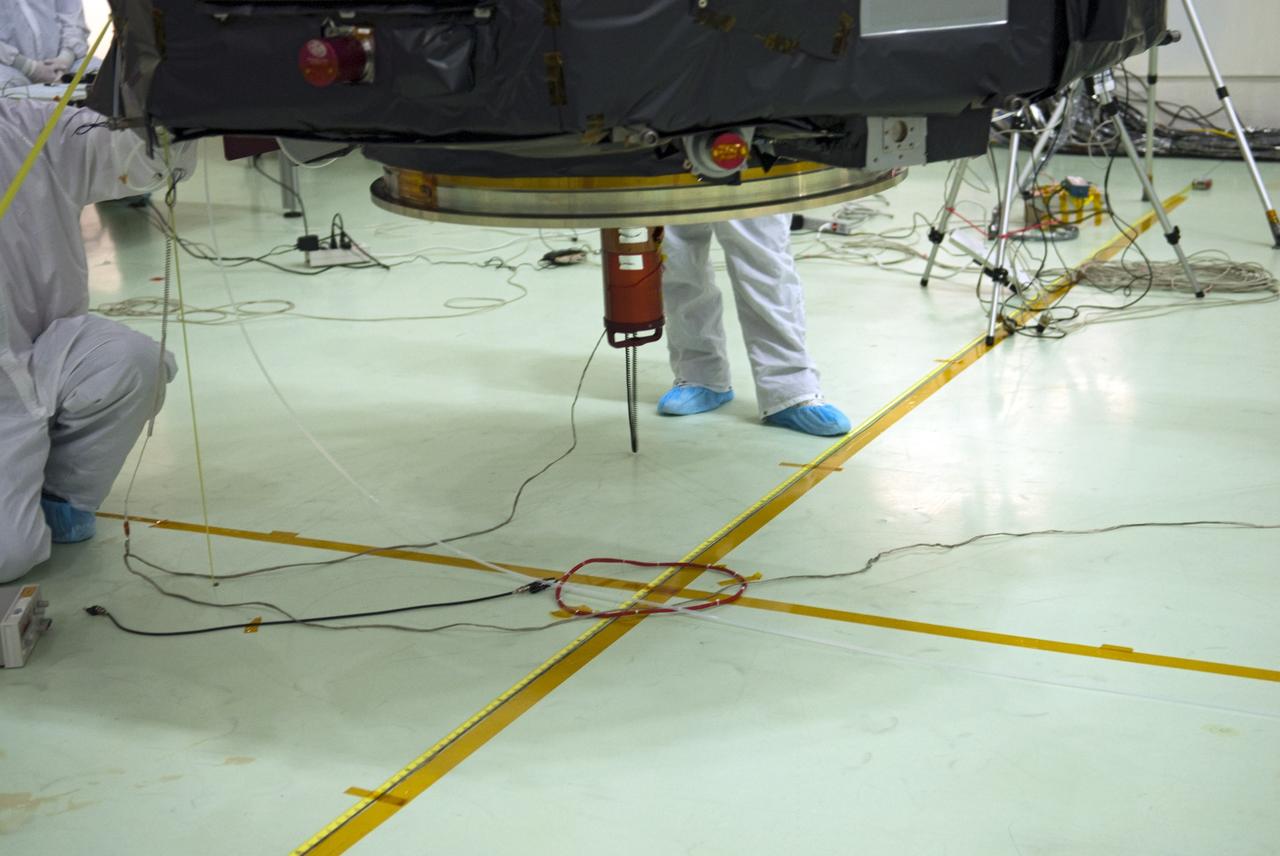
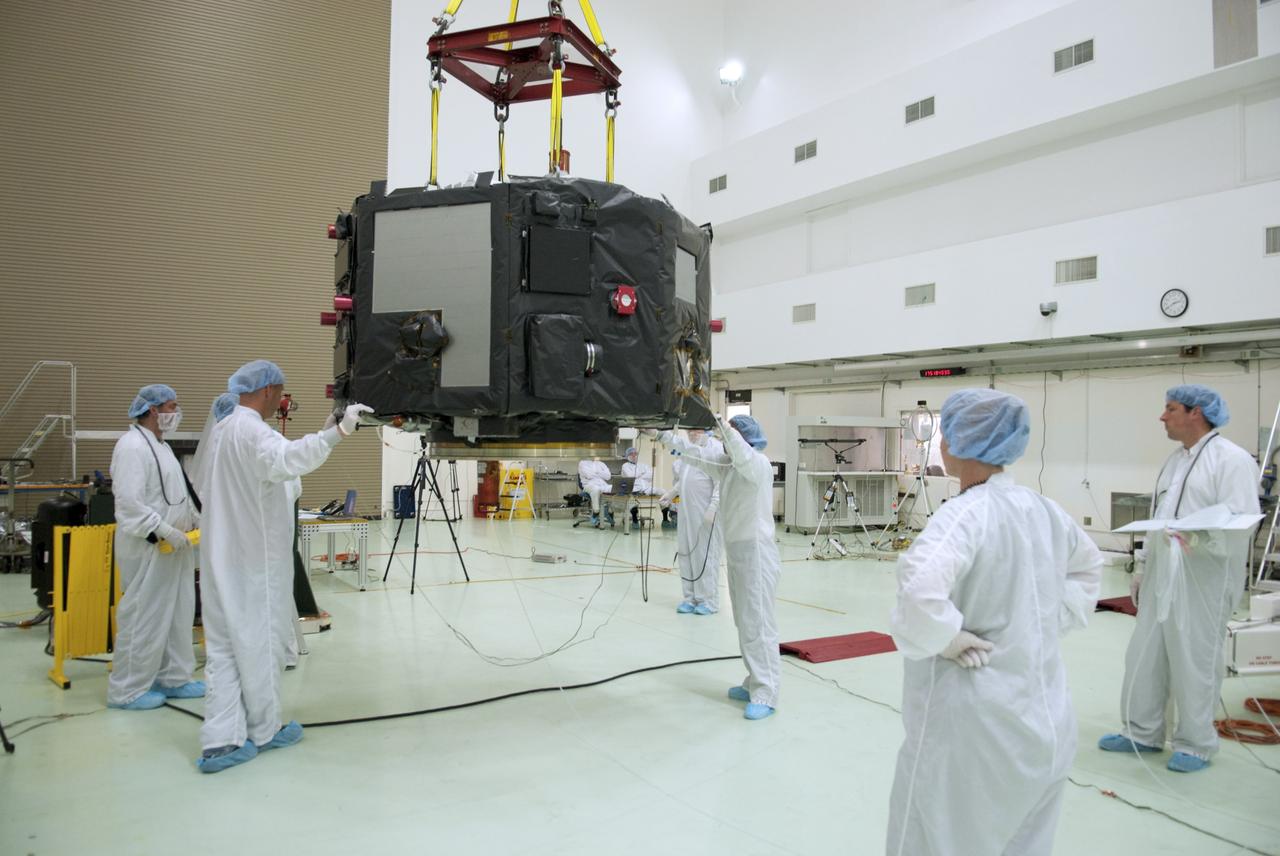
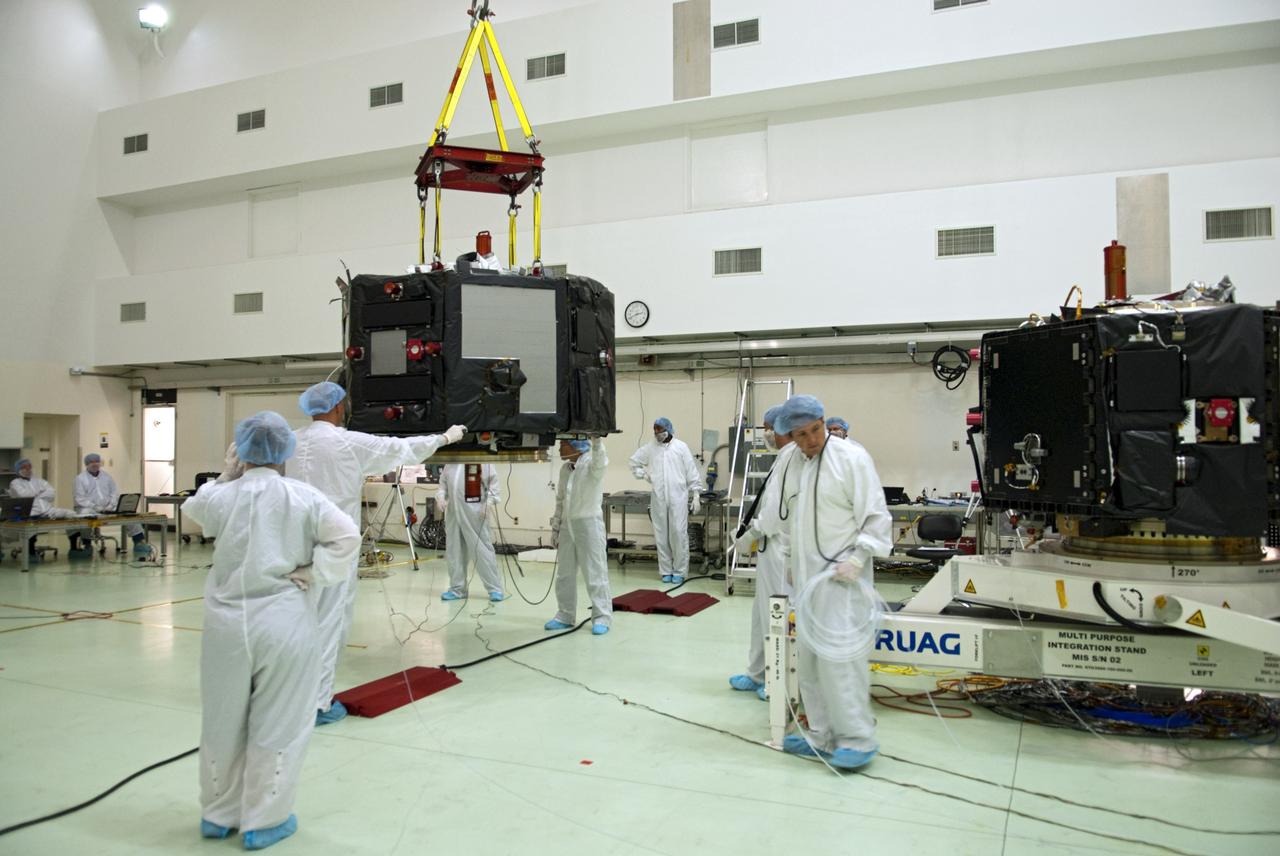
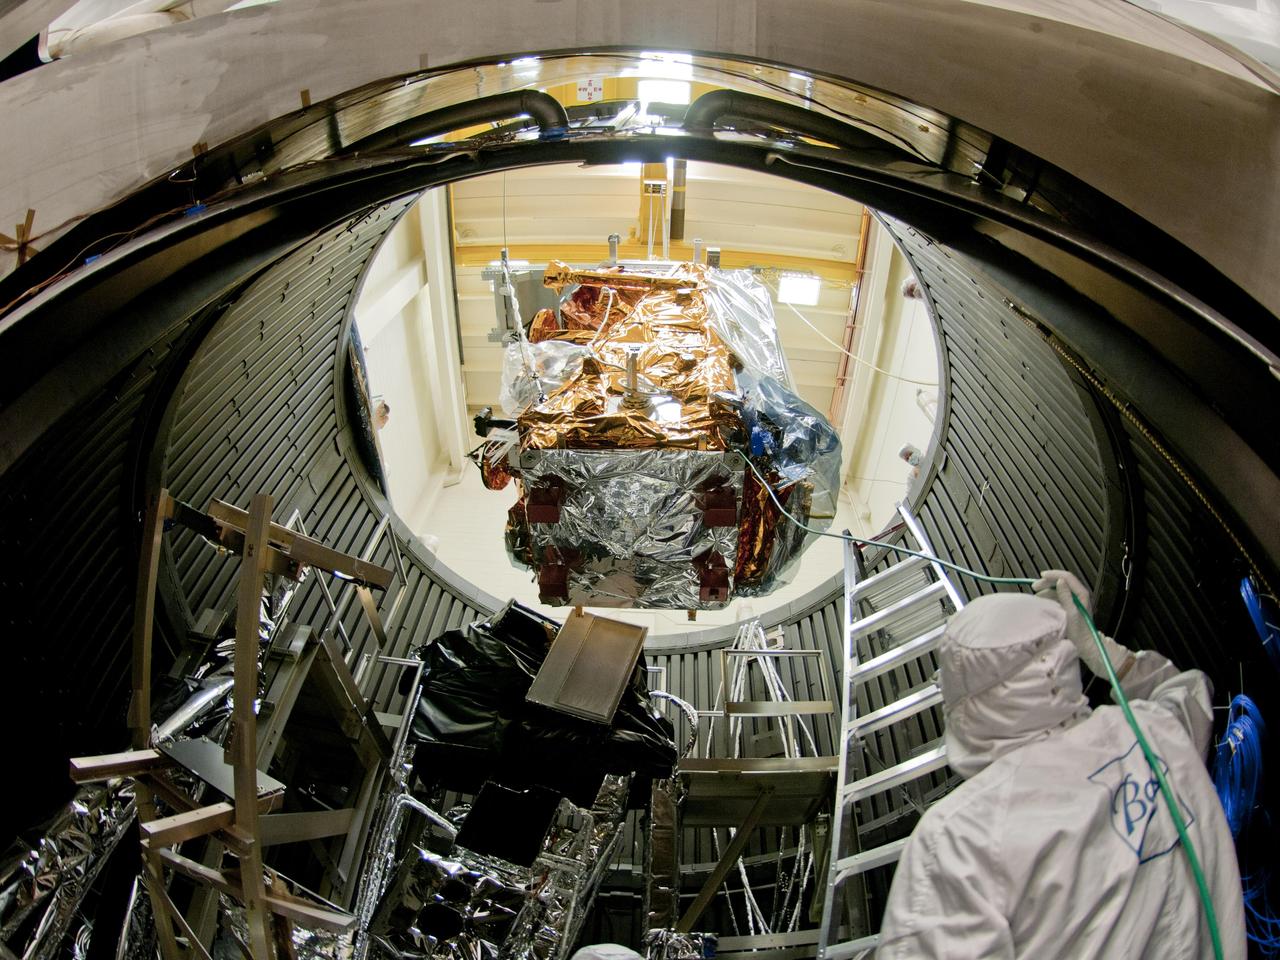
CAPE CANAVERAL, Fla. – Inside the Astrotech payload processing facility near NASA’s Kennedy Space Center in Florida, technicians line up the Radiation Belt Storm Probes, or RBSP, spacecraft A over an electromagnetic source in order to perform a magnetic swing test. The magnetic swing test is performed to characterize the magnetic signature of the spacecraft so that when it is taking measurements with its sensors in space scientists can subtract out background noise from the spacecraft itself. NASA’s RBSP mission will help us understand the sun’s influence on Earth and near-Earth space by studying the Earth’s radiation belts on various scales of space and time. RBSP will begin its mission of exploration of Earth’s Van Allen radiation belts and the extremes of space weather after its launch aboard a United Launch Alliance Atlas V rocket. Launch is targeted for Aug. 23. For more information, visit http://www.nasa.gov/rbsp. Photo credit: NASA/Charisse Nahser
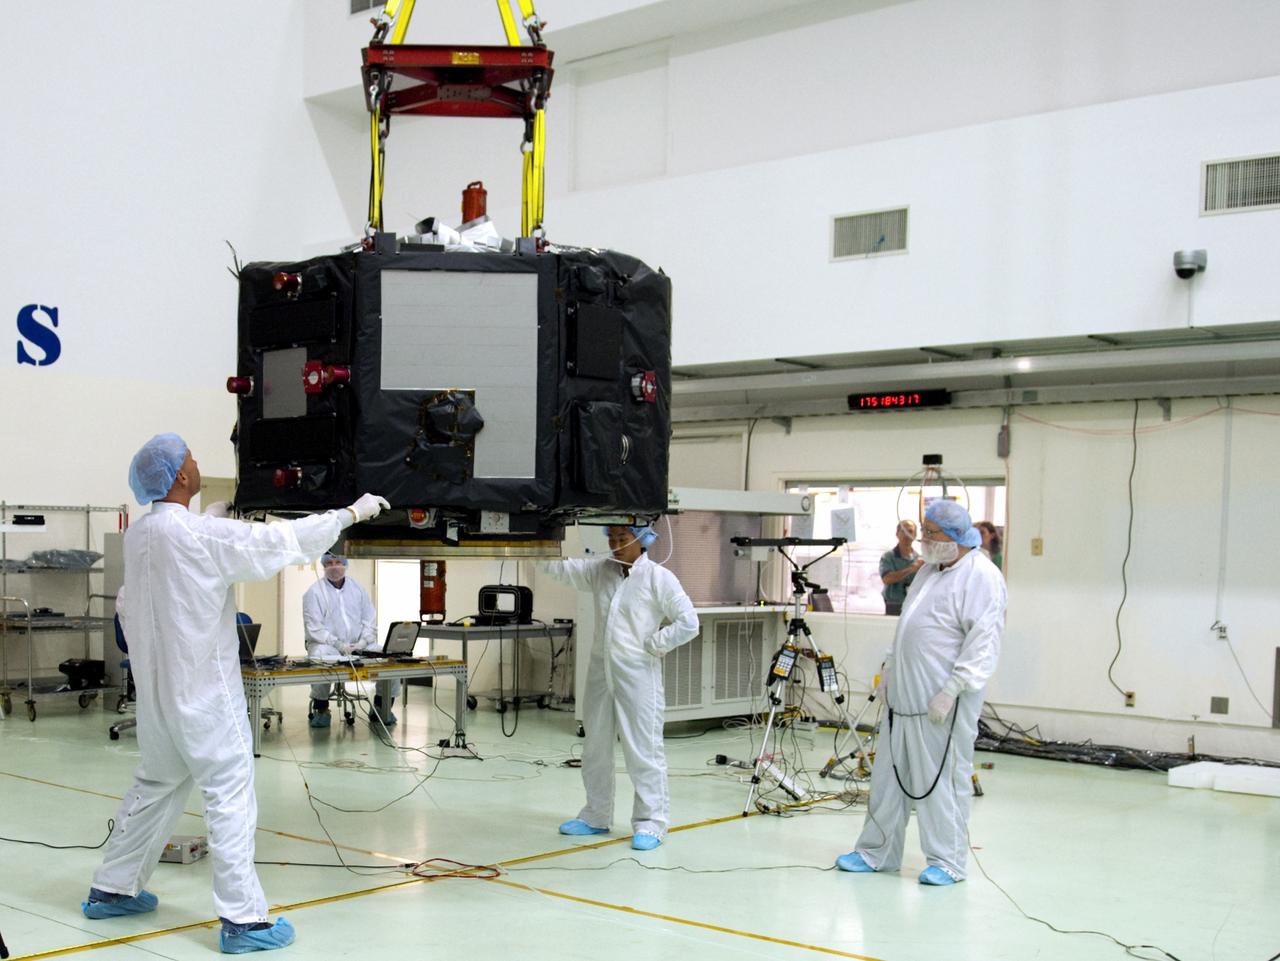
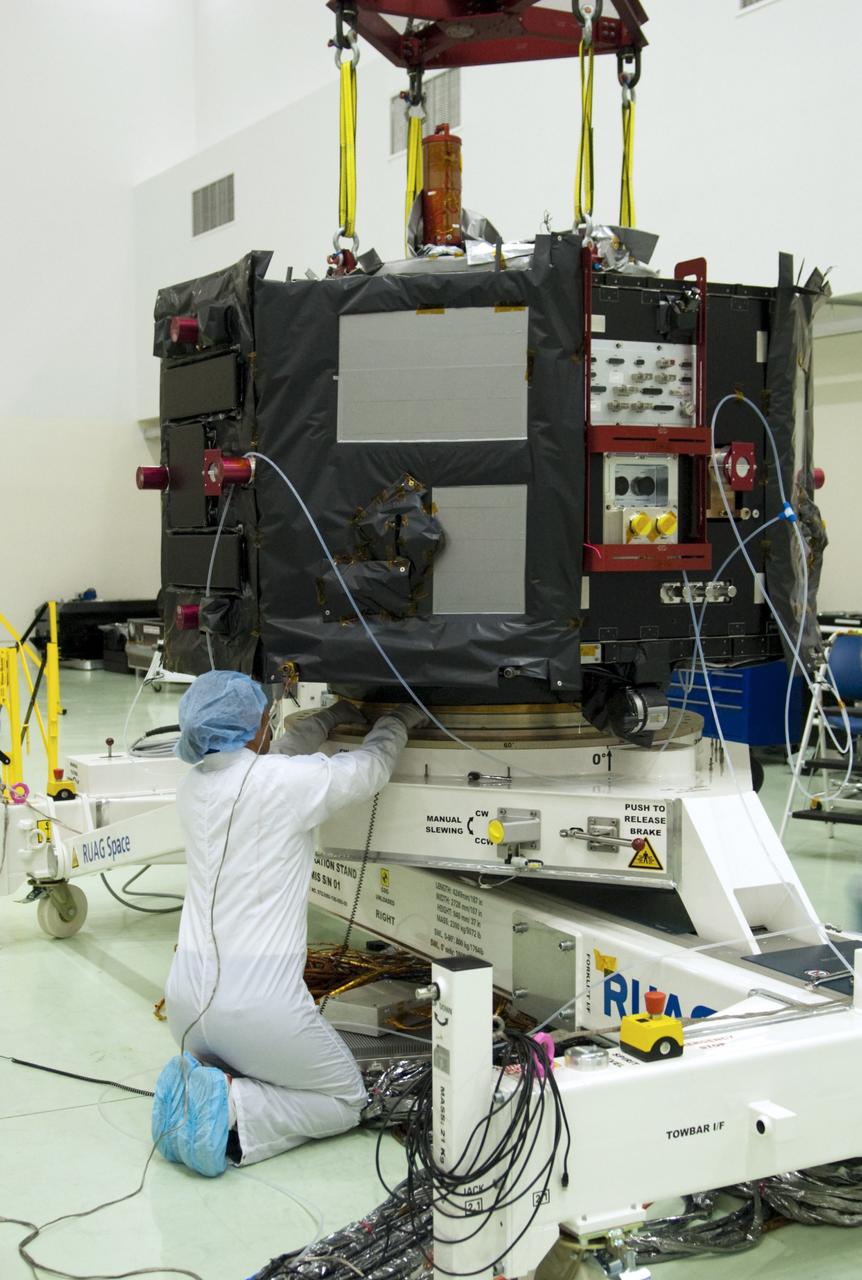
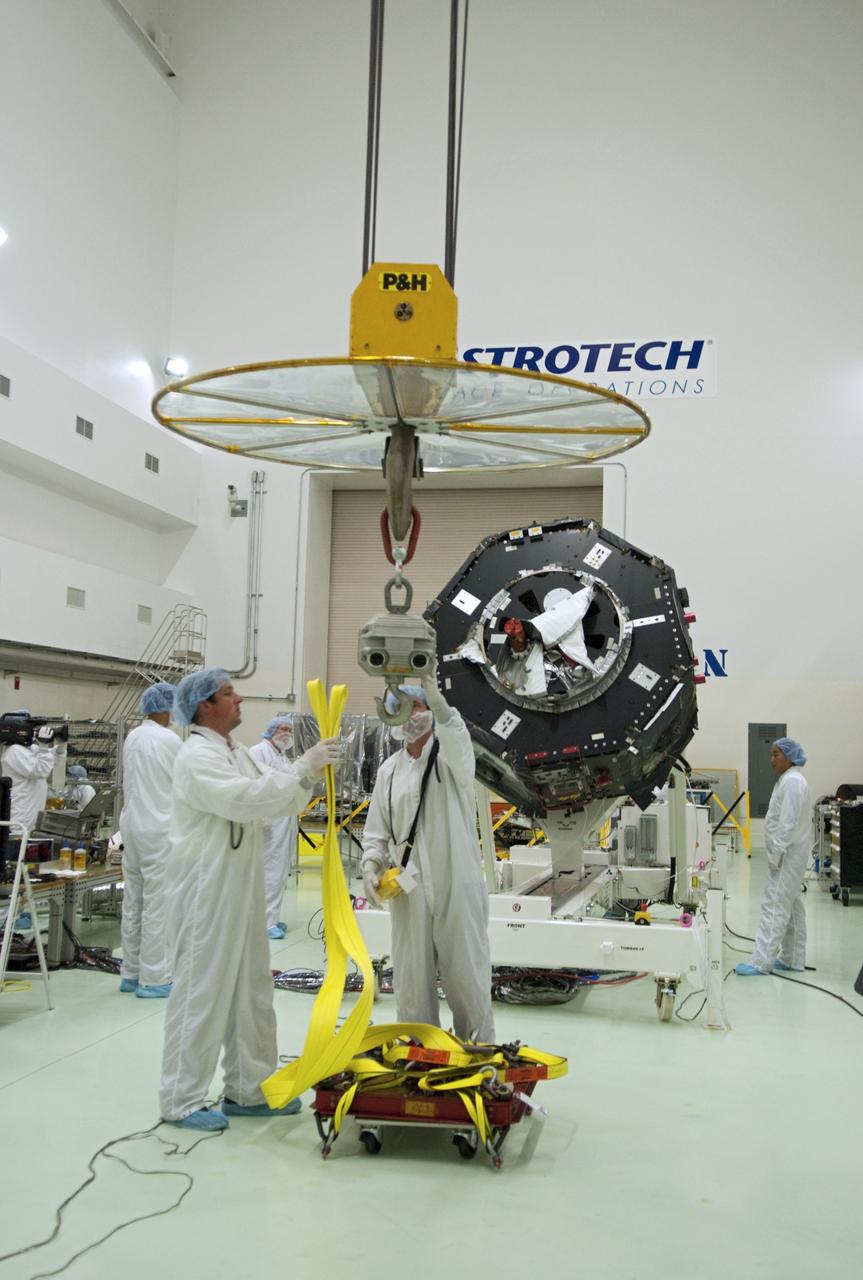
CAPE CANAVERAL, Fla. – Inside the Astrotech payload processing facility near NASA’s Kennedy Space Center in Florida, technicians prepare to perform a magnetic swing test on Radiation Belt Storm Probes, or RBSP, spacecraft A. The magnetic swing test is performed to characterize the magnetic signature of the spacecraft so that when it is taking measurements with its sensors in space scientists can subtract out background noise from the spacecraft itself. NASA’s RBSP mission will help us understand the sun’s influence on Earth and near-Earth space by studying the Earth’s radiation belts on various scales of space and time. RBSP will begin its mission of exploration of Earth’s Van Allen radiation belts and the extremes of space weather after its launch aboard a United Launch Alliance Atlas V rocket. Launch is targeted for Aug. 23. For more information, visit http://www.nasa.gov/rbsp. Photo credit: NASA/Charisse Nahser
CAPE CANAVERAL, Fla. – Inside the Astrotech payload processing facility near NASA’s Kennedy Space Center in Florida, technicians prepare to perform a magnetic swing test on Radiation Belt Storm Probes, or RBSP, spacecraft A. The magnetic swing test is performed to characterize the magnetic signature of the spacecraft so that when it is taking measurements with its sensors in space scientists can subtract out background noise from the spacecraft itself. NASA’s RBSP mission will help us understand the sun’s influence on Earth and near-Earth space by studying the Earth’s radiation belts on various scales of space and time. RBSP will begin its mission of exploration of Earth’s Van Allen radiation belts and the extremes of space weather after its launch aboard a United Launch Alliance Atlas V rocket. Launch is targeted for Aug. 23. For more information, visit http://www.nasa.gov/rbsp. Photo credit: NASA/Charisse Nahser
CAPE CANAVERAL, Fla. – Inside the Astrotech payload processing facility near NASA’s Kennedy Space Center in Florida, technicians prepare to perform a magnetic swing test on Radiation Belt Storm Probes, or RBSP, spacecraft A. The magnetic swing test is performed to characterize the magnetic signature of the spacecraft so that when it is taking measurements with its sensors in space scientists can subtract out background noise from the spacecraft itself. NASA’s RBSP mission will help us understand the sun’s influence on Earth and near-Earth space by studying the Earth’s radiation belts on various scales of space and time. RBSP will begin its mission of exploration of Earth’s Van Allen radiation belts and the extremes of space weather after its launch aboard a United Launch Alliance Atlas V rocket. Launch is targeted for Aug. 23. For more information, visit http://www.nasa.gov/rbsp. Photo credit: NASA/Charisse Nahser

CAPE CANAVERAL, Fla. – Inside the Astrotech payload processing facility near NASA’s Kennedy Space Center in Florida, technicians line up the Radiation Belt Storm Probes, or RBSP, spacecraft A over an electromagnetic source in order to perform a magnetic swing test. The magnetic swing test is performed to characterize the magnetic signature of the spacecraft so that when it is taking measurements with its sensors in space scientists can subtract out background noise from the spacecraft itself. NASA’s RBSP mission will help us understand the sun’s influence on Earth and near-Earth space by studying the Earth’s radiation belts on various scales of space and time. RBSP will begin its mission of exploration of Earth’s Van Allen radiation belts and the extremes of space weather after its launch aboard a United Launch Alliance Atlas V rocket. Launch is targeted for Aug. 23. For more information, visit http://www.nasa.gov/rbsp. Photo credit: NASA/Charisse Nahser
CAPE CANAVERAL, Fla. – Inside the Astrotech payload processing facility near NASA’s Kennedy Space Center in Florida, technicians line up the Radiation Belt Storm Probes, or RBSP, spacecraft A over an electromagnetic source in order to perform a magnetic swing test. The magnetic swing test is performed to characterize the magnetic signature of the spacecraft so that when it is taking measurements with its sensors in space scientists can subtract out background noise from the spacecraft itself. NASA’s RBSP mission will help us understand the sun’s influence on Earth and near-Earth space by studying the Earth’s radiation belts on various scales of space and time. RBSP will begin its mission of exploration of Earth’s Van Allen radiation belts and the extremes of space weather after its launch aboard a United Launch Alliance Atlas V rocket. Launch is targeted for Aug. 23. For more information, visit http://www.nasa.gov/rbsp. Photo credit: NASA/Charisse Nahser
CAPE CANAVERAL, Fla. – Inside the Astrotech payload processing facility near NASA’s Kennedy Space Center in Florida, technicians line up the Radiation Belt Storm Probes, or RBSP, spacecraft A over an electromagnetic source in order to perform a magnetic swing test. The magnetic swing test is performed to characterize the magnetic signature of the spacecraft so that when it is taking measurements with its sensors in space scientists can subtract out background noise from the spacecraft itself. NASA’s RBSP mission will help us understand the sun’s influence on Earth and near-Earth space by studying the Earth’s radiation belts on various scales of space and time. RBSP will begin its mission of exploration of Earth’s Van Allen radiation belts and the extremes of space weather after its launch aboard a United Launch Alliance Atlas V rocket. Launch is targeted for Aug. 23. For more information, visit http://www.nasa.gov/rbsp. Photo credit: NASA/Charisse Nahser
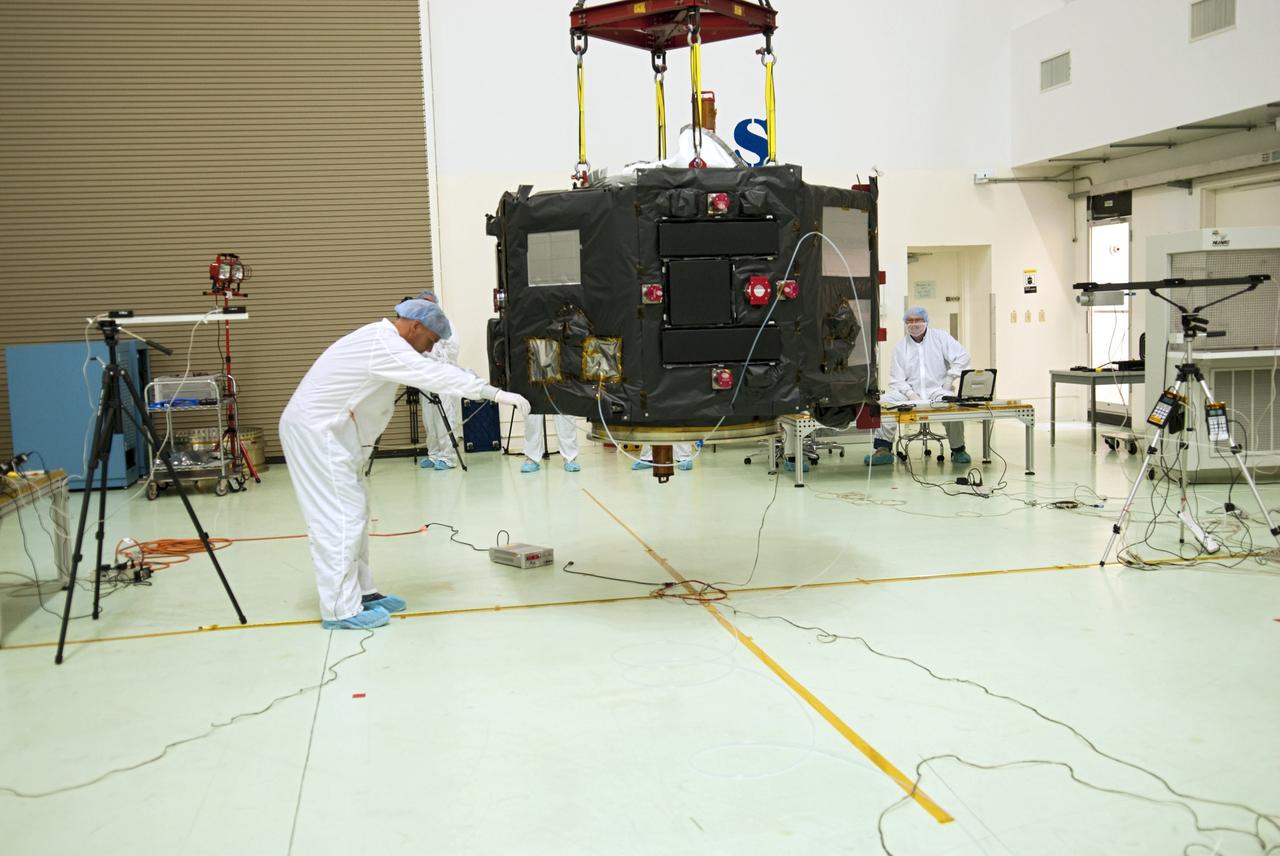
CAPE CANAVERAL, Fla. – Inside the Astrotech payload processing facility near NASA’s Kennedy Space Center in Florida, technicians prepare to perform a magnetic swing test on Radiation Belt Storm Probes, or RBSP, spacecraft A. The magnetic swing test is performed to characterize the magnetic signature of the spacecraft so that when it is taking measurements with its sensors in space scientists can subtract out background noise from the spacecraft itself. NASA’s RBSP mission will help us understand the sun’s influence on Earth and near-Earth space by studying the Earth’s radiation belts on various scales of space and time. RBSP will begin its mission of exploration of Earth’s Van Allen radiation belts and the extremes of space weather after its launch aboard a United Launch Alliance Atlas V rocket. Launch is targeted for Aug. 23. For more information, visit http://www.nasa.gov/rbsp. Photo credit: NASA/Charisse Nahser
CAPE CANAVERAL, Fla. – Inside the Astrotech payload processing facility near NASA’s Kennedy Space Center in Florida, technicians prepare to perform a magnetic swing test on Radiation Belt Storm Probes, or RBSP, spacecraft A. The magnetic swing test is performed to characterize the magnetic signature of the spacecraft so that when it is taking measurements with its sensors in space scientists can subtract out background noise from the spacecraft itself. NASA’s RBSP mission will help us understand the sun’s influence on Earth and near-Earth space by studying the Earth’s radiation belts on various scales of space and time. RBSP will begin its mission of exploration of Earth’s Van Allen radiation belts and the extremes of space weather after its launch aboard a United Launch Alliance Atlas V rocket. Launch is targeted for Aug. 23. For more information, visit http://www.nasa.gov/rbsp. Photo credit: NASA/Charisse Nahser
CAPE CANAVERAL, Fla. – Inside the Astrotech payload processing facility near NASA’s Kennedy Space Center in Florida, technicians line up the Radiation Belt Storm Probes, or RBSP, spacecraft A over an electromagnetic source in order to perform a magnetic swing test. The magnetic swing test is performed to characterize the magnetic signature of the spacecraft so that when it is taking measurements with its sensors in space scientists can subtract out background noise from the spacecraft itself. NASA’s RBSP mission will help us understand the sun’s influence on Earth and near-Earth space by studying the Earth’s radiation belts on various scales of space and time. RBSP will begin its mission of exploration of Earth’s Van Allen radiation belts and the extremes of space weather after its launch aboard a United Launch Alliance Atlas V rocket. Launch is targeted for Aug. 23. For more information, visit http://www.nasa.gov/rbsp. Photo credit: NASA/Charisse Nahser
CAPE CANAVERAL, Fla. – Inside the Astrotech payload processing facility near NASA’s Kennedy Space Center in Florida, technicians prepare to perform a magnetic swing test on Radiation Belt Storm Probes, or RBSP, spacecraft A. The magnetic swing test is performed to characterize the magnetic signature of the spacecraft so that when it is taking measurements with its sensors in space scientists can subtract out background noise from the spacecraft itself. NASA’s RBSP mission will help us understand the sun’s influence on Earth and near-Earth space by studying the Earth’s radiation belts on various scales of space and time. RBSP will begin its mission of exploration of Earth’s Van Allen radiation belts and the extremes of space weather after its launch aboard a United Launch Alliance Atlas V rocket. Launch is targeted for Aug. 23. For more information, visit http://www.nasa.gov/rbsp. Photo credit: NASA/Charisse Nahser
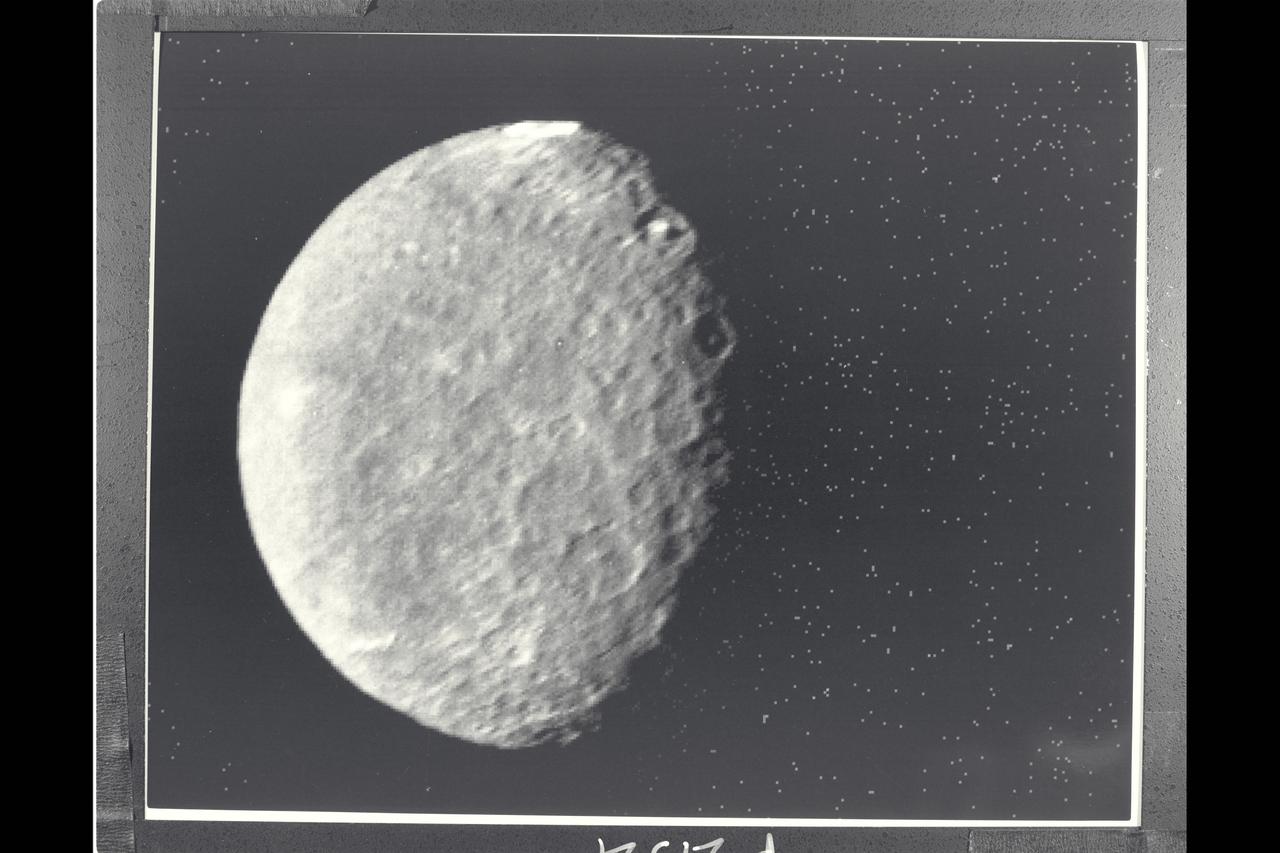
P-29521 BW Range: 557,000 kilometers ( 346, 000 miles) The southern hemisphere of Umbriel displays heavy cratering in this Voyager 2 image. This frame, taken through the clear-filter of Voyager's narrow-angle camera, is the most detailed image of Umbriel, with a resolution of about 10 km (6 mi). Umbriel is the darkest of Uranus' larger moons and the one that appears to have experienced the lowest level of geological activity. It has a diameter of about 1,200 km (750 mi) and reflects only 16 percent of the light striking its surface; in the latter respect, Umbriel is similiar to lunar highland areas. Umbriel is heavily cratered but lacks the numerous bright-ray craters seen on the other large Uranian satellites; this results in a relatively uniform surface albedo (reflectivity). The prominent crater on the terminator (upper right) is about 110 km (70 mi) across and has a bright central peak. The strangest feature in this image (at top) is a curious bright ring, the most reflective area seen on Umbriel. The ring is about 140 km (90 mi) in diameter and lies near the satellite's equator. The nature of the ring is not known, although it might be a frost deposit, perhaps associated with an impact crater. Spots against the black background are due to 'noise' in the data.
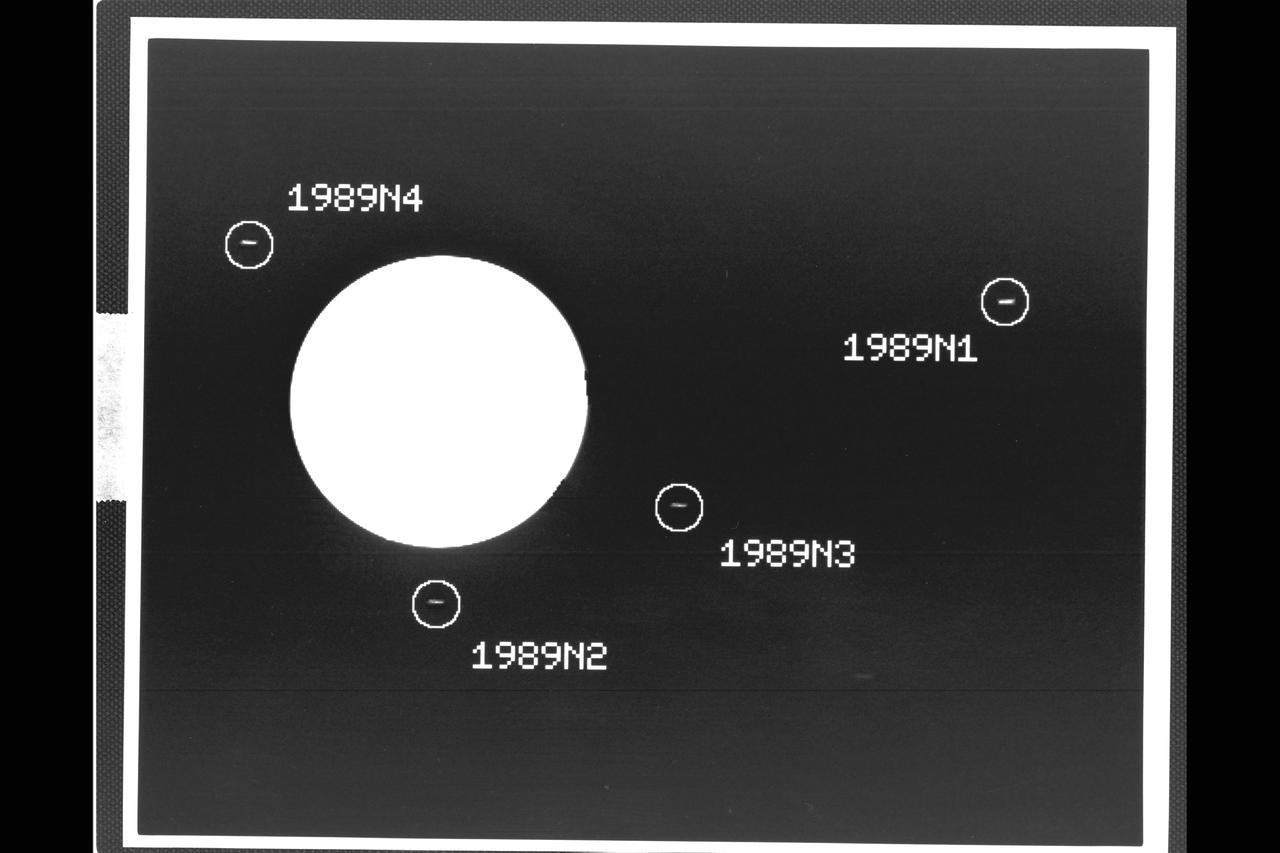
P-34540 Range: 37.3 million kilometers (23.6 million miles) This image captured by the Voyager 2 spacecraft was used to confirm the discovery of three new satellites orbiting Neptune. The 46-second exposure was taken with the narrow angle camera and shows the large globe of the planet to be severely overexposed and almost pure white in appearance. The image has been computer-processed to accentuate the new moons, which otherwise would be hard to distinguish from background noise. The satellite 1989N1, at right in this frame, was discovered by Voyager 2 in early July 1989. The new satellites confirmed later are 1989N2, 1989N3 and 1989N4. Each of the moons appears as a small streak, an effect caused by movement of the spacecraft during the long exposure. The new moons occupy nearly circular and equatorial orbits ranging from about 27,300 to 48,300 kilometers (17,000 to 30,000 miles) from Neptunes's cloud tops, and are estimated to range in diameter from about 100 to 200 kilometers (about 60 to 125 miles).
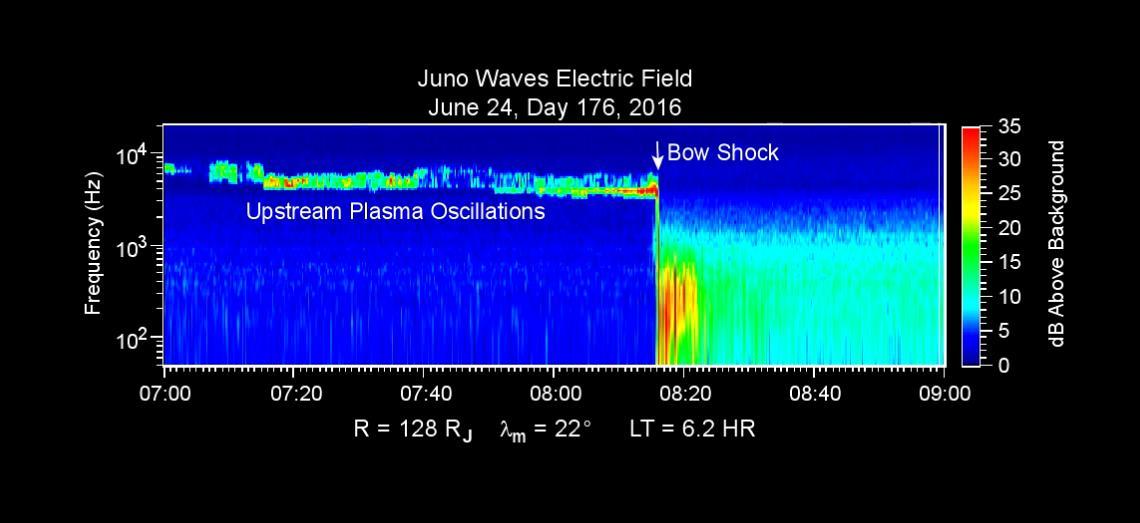
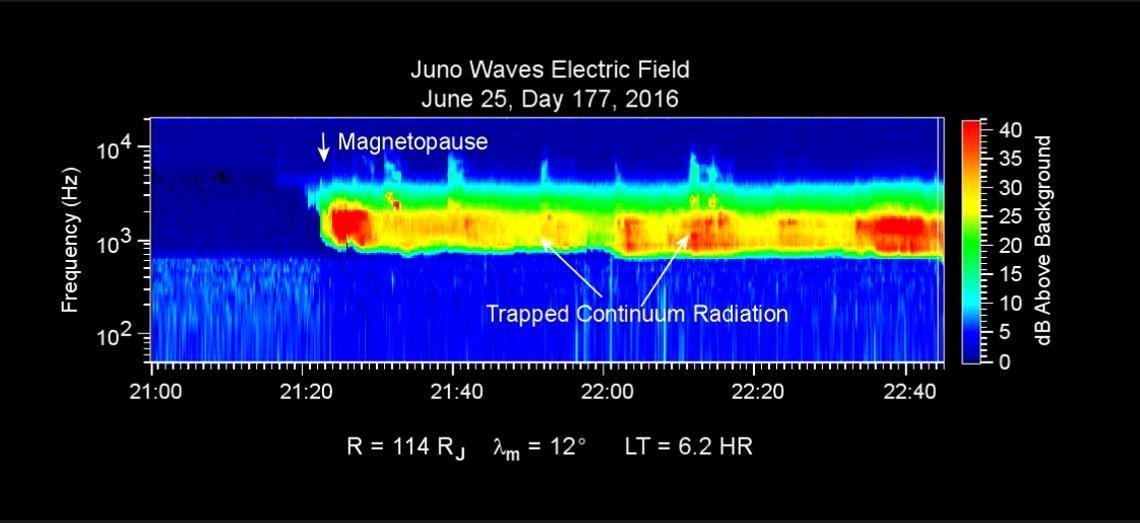
This chart presents data that the Waves investigation on NASA's Juno spacecraft recorded as the spacecraft crossed the bow shock just outside of Jupiter's magnetosphere on June 24, 2016, while approaching Jupiter. Audio accompanies the animation, with volume and pitch correlated to the amplitude and frequency of the recorded waves. The graph is a frequency-time spectrogram with color coding to indicate wave amplitudes as a function of wave frequency (vertical axis, in hertz) and time (horizontal axis, with a total elapsed time of two hours). During the hour before Juno reached the bow shock, the Waves instrument was detecting mainly plasma oscillations just below 10,000 hertz (10 kilohertz). The frequency of these oscillations is related to the local density of electrons; the data yield an estimate of approximately one electron per cubic centimeter (about 16 per cubic inch) in this region just outside Jupiter's bow shock. The broadband burst of noise marked "Bow Shock" is the region of turbulence where the supersonic solar wind is heated and slowed by encountering the Jovian magnetosphere. The shock is analogous to a sonic boom generated in Earth's atmosphere by a supersonic aircraft. The region after the shock is called the magnetosheath. The vertical bar to the right of the chart indicates the color coding of wave amplitude, in decibels (dB) above the background level detected by the Waves instrument. Each step of 10 decibels marks a tenfold increase in wave power. When Juno collected these data, the distance from the spacecraft to Jupiter was about 5.56 million miles (8.95 million kilometers), indicated on the chart as 128 times the radius of Jupiter. Jupiter's magnetic field is tilted about 10 degrees from the planet's axis of rotation. The note of 22 degrees on the chart indicates that at the time these data were recorded, the spacecraft was 22 degrees north of the magnetic-field equator. The "LT" notation is local time on Jupiter at the longitude of the planet directly below the spacecraft, with a value of 6.2 indicating approximately dawn. http://photojournal.jpl.nasa.gov/catalog/PIA20753
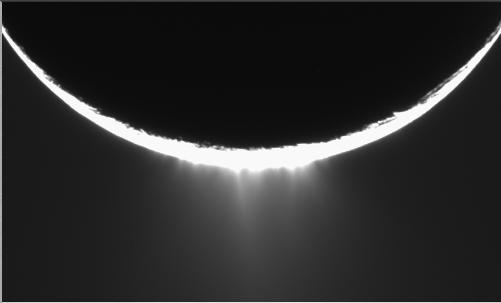
Jets of icy particles burst from Saturn’s moon Enceladus in this brief movie sequence of four images taken on Nov. 27, 2005. The sensational discovery of active eruptions on a third outer solar system body (Io and Triton are the others) is surely one of the great highlights of the Cassini mission. Imaging scientists, as reported in the journal Science on March 10, 2006, believe that the jets are geysers erupting from pressurized subsurface reservoirs of liquid water above 273 degrees Kelvin (0 degrees Celsius). Images taken in January 2005 appeared to show the plume emanating from the fractured south polar region of Enceladus, but the visible plume was only slightly brighter than the background noise in the image, because the lighting geometry was not suitable to reveal the true details of the feature. This potential sighting, in addition to the detection of the icy particles in the plume by other Cassini instruments, prompted imaging scientists to target Enceladus again with exposures designed to confirm the validity of the earlier plume sighting. The new views show individual jets, or plume sources, that contribute to the plume with much greater visibility than the earlier images. The full plume towers over the 505-kilometer-wide (314-mile) moon and is at least as tall as the moon's diameter. The four 10-second exposures were taken over the course of about 36 minutes at approximately 12 minute intervals. Enceladus rotates about 7.5 degrees in longitude over the course of the frames, and most of the observed changes in the appearances of the jets is likely attributable to changes in the viewing geometry. However, some of the changes may be due to actual variation in the flow from the jets on a time scale of tens of minutes. Additionally, the shift of the sources seen here should provide information about their location in front of and behind the visible limb (edge) of Enceladus. These images were obtained using the Cassini spacecraft narrow-angle camera at distances between 144,350 and 149,520 kilometers (89,695 and 92,907 miles) from Enceladus and at a phase angle of about 161 degrees. Image scale is about 900 meters (2,950 feet) per pixel on Enceladus. A movie is available at http://photojournal.jpl.nasa.gov/catalog/PIA07762
NPP is lowered into the thermal vacuum chamber. Once inside the Iron Maiden (visible in the lower left) is fitted in place. Then air is pumped out of the chamber and temperature extremes are applied to replicate orbit conditions. Credit: Ball Aerospace The NPP satellite sits surrounded by 144 rock concert speakers. They're stacked in a circle 16 feet high in a testing room at Ball Aerospace in Boulder, Colorado. As engineers set up for the environmental test, Pink Floyd's song "Money" plays gently in the background. The music stops. The room clears. Then the sound engineer wearing earplugs and headphones in the control room next door flips a switch. Slowly, the noise of thousands of pounds of exploding rocket fuel builds louder and louder until it blasts the satellite at a deafening 143.6 decibels -- loud enough to cause serious damage and pain to unprotected ears. "I was outside the building when they did the full level acoustics," says Glenn Iona, NPP Chief Engineer at NASA Goddard Space Flight Center, Greenbelt, Md. "and I could feel the ground shaking." To read more go to: <a href="http://www.nasa.gov/mission_pages/NPP/news/npp-testing.html" rel="nofollow">www.nasa.gov/mission_pages/NPP/news/npp-testing.html</a> <b><a href="http://www.nasa.gov/centers/goddard/home/index.html" rel="nofollow">NASA Goddard Space Flight Center</a></b> enables NASA’s mission through four scientific endeavors: Earth Science, Heliophysics, Solar System Exploration, and Astrophysics. Goddard plays a leading role in NASA’s accomplishments by contributing compelling scientific knowledge to advance the Agency’s mission. <b>Follow us on <a href="http://twitter.com/NASA_GoddardPix" rel="nofollow">Twitter</a></b> <b>Like us on <a href="http://www.facebook.com/pages/Greenbelt-MD/NASA-Goddard/395013845897?ref=tsd" rel="nofollow">Facebook</a></b> <b>Find us on <a href="http://web.stagram.com/n/nasagoddard/?vm=grid" rel="nofollow">Instagram</a></b>
This chart presents data that the Waves investigation on NASA's Juno spacecraft recorded as the spacecraft crossed the bow shock just outside of Jupiter's magnetosphere on June 24, 2016, while approaching Jupiter. Audio accompanies the animation, with volume and pitch correlated to the amplitude and frequency of the recorded waves. The graph is a frequency-time spectrogram with color coding to indicate wave amplitudes as a function of wave frequency (vertical axis, in hertz) and time (horizontal axis, with a total elapsed time of two hours). During the hour before Juno reached the bow shock, the Waves instrument was detecting mainly plasma oscillations just below 10,000 hertz (10 kilohertz). The frequency of these oscillations is related to the local density of electrons; the data yield an estimate of approximately one electron per cubic centimeter (about 16 per cubic inch) in this region just outside Jupiter's bow shock. The broadband burst of noise marked "Bow Shock" is the region of turbulence where the supersonic solar wind is heated and slowed by encountering the Jovian magnetosphere. The shock is analogous to a sonic boom generated in Earth's atmosphere by a supersonic aircraft. The region after the shock is called the magnetosheath. The vertical bar to the right of the chart indicates the color coding of wave amplitude, in decibels (dB) above the background level detected by the Waves instrument. Each step of 10 decibels marks a tenfold increase in wave power. When Juno collected these data, the distance from the spacecraft to Jupiter was about 5.56 million miles (8.95 million kilometers), indicated on the chart as 128 times the radius of Jupiter. Jupiter's magnetic field is tilted about 10 degrees from the planet's axis of rotation. The note of 22 degrees on the chart indicates that at the time these data were recorded, the spacecraft was 22 degrees north of the magnetic-field equator. The "LT" notation is local time on Jupiter at the longitude of the planet directly below the spacecraft, with a value of 6.2 indicating approximately dawn. http://photojournal.jpl.nasa.gov/catalog/PIA20753

<b>To view a video of the Gradient Sun go to: <a href="http://www.flickr.com/photos/gsfc/8103212817">www.flickr.com/photos/gsfc/8103212817</a></b> Looking at a particularly beautiful image of the sun helps show how the lines between science and art can sometimes blur. But there is more to the connection between the two disciplines: science and art techniques are often quite similar, indeed one may inform the other or be improved based on lessons from the other arena. One such case is a technique known as a "gradient filter" – recognizable to many people as an option available on a photo-editing program. Gradients are, in fact, a mathematical description that highlights the places of greatest physical change in space. A gradient filter, in turn, enhances places of contrast, making them all the more obviously different, a useful tool when adjusting photos. Scientists, too, use gradient filters to enhance contrast, using them to accentuate fine structures that might otherwise be lost in the background noise. On the sun, for example, scientists wish to study a phenomenon known as coronal loops, which are giant arcs of solar material constrained to travel along that particular path by the magnetic fields in the sun's atmosphere. Observations of the loops, which can be more or less tangled and complex during different phases of the sun's 11-year activity cycle, can help researchers understand what's happening with the sun's complex magnetic fields, fields that can also power great eruptions on the sun such as solar flares or coronal mass ejections. The still here shows an unfiltered image from the sun next to one that has been processed using a gradient filter. Note how the coronal loops are sharp and defined, making them all the more easy to study. On the other hand, gradients also make great art. NASA/Goddard Space Flight Center To download this video go to: <a href="http://svs.gsfc.nasa.gov/goto?11112" rel="nofollow">svs.gsfc.nasa.gov/goto?11112</a> <b><a href="http://www.nasa.gov/audience/formedia/features/MP_Photo_Guidelines.html" rel="nofollow">NASA image use policy.</a></b> <b><a href="http://www.nasa.gov/centers/goddard/home/index.html" rel="nofollow">NASA Goddard Space Flight Center</a></b> enables NASA’s mission through four scientific endeavors: Earth Science, Heliophysics, Solar System Exploration, and Astrophysics. Goddard plays a leading role in NASA’s accomplishments by contributing compelling scientific knowledge to advance the Agency’s mission. <b>Follow us on <a href="http://twitter.com/NASA_GoddardPix" rel="nofollow">Twitter</a></b> <b>Like us on <a href="http://www.facebook.com/pages/Greenbelt-MD/NASA-Goddard/395013845897?ref=tsd" rel="nofollow">Facebook</a></b> <b>Find us on <a href="http://instagrid.me/nasagoddard/?vm=grid" rel="nofollow">Instagram</a></b>
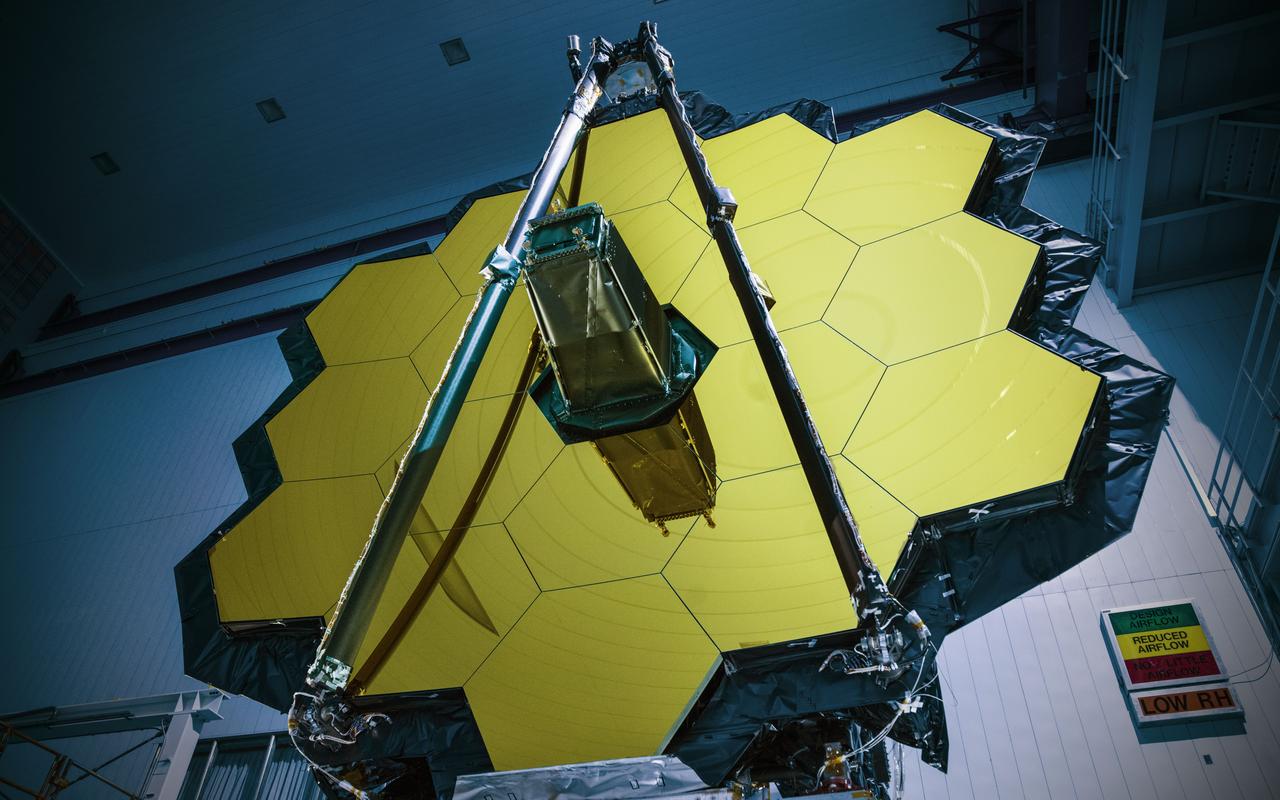
NASA’s James Webb Space Telescope has successfully passed the center of curvature test, an important optical measurement of Webb’s fully assembled primary mirror prior to cryogenic testing, and the last test held at NASA's Goddard Space Flight Center in Greenbelt, Maryland, before the spacecraft is shipped to NASA’s Johnson Space Center in Houston for more testing. After undergoing rigorous environmental tests simulating the stresses of its rocket launch, the Webb telescope team at Goddard analyzed the results from this critical optical test and compared it to the pre-test measurements. The team concluded that the mirrors passed the test with the optical system unscathed. “The Webb telescope is about to embark on its next step in reaching the stars as it has successfully completed its integration and testing at Goddard. It has taken a tremendous team of talented individuals to get to this point from all across NASA, our industry and international partners, and academia,” said Bill Ochs, NASA’s Webb telescope project manager. “It is also a sad time as we say goodbye to the Webb Telescope at Goddard, but are excited to begin cryogenic testing at Johnson.” Rocket launches create high levels of vibration and noise that rattle spacecraft and telescopes. At Goddard, engineers tested the Webb telescope in vibration and acoustics test facilities that simulate the launch environment to ensure that functionality is not impaired by the rigorous ride on a rocket into space. Before and after these environmental tests took place, optical engineers set up an interferometer, the main device used to measure the shape of the Webb telescope’s mirror. An interferometer gets its name from the process of recording and measuring the ripple patterns that result when different beams of light mix and their waves combine or “interfere.” Waves of visible light are less than a thousandth of a millimeter long and optics on the Webb telescope need to be shaped and aligned even more accurately than that to work correctly. Making measurements of the mirror shape and position by lasers prevents physical contact and damage (scratches to the mirror). So, scientists use wavelengths of light to make tiny measurements. By measuring light reflected off the optics using an interferometer, they are able to measure extremely small changes in shape or position that may occur after exposing the mirror to a simulated launch or temperatures that simulate the subfreezing environment of space. During a test conducted by a team from Goddard, Ball Aerospace of Boulder, Colorado, and the Space Telescope Science Institute in Baltimore, temperature and humidity conditions in the clean room were kept incredibly stable to minimize fluctuations in the sensitive optical measurements over time. Even so, tiny vibrations are ever-present in the clean room that cause jitter during measurements, so the interferometer is a “high-speed” one, taking 5,000 “frames” every second, which is a faster rate than the background vibrations themselves. This allows engineers to subtract out jitter and get good, clean results on any changes to the mirror's shape. Credit: NASA/Goddard/Chris Gunn Read more: <a href="https://go.nasa.gov/2oPqHwR" rel="nofollow">go.nasa.gov/2oPqHwR</a> NASA’s Webb Telescope Completes Goddard Testing