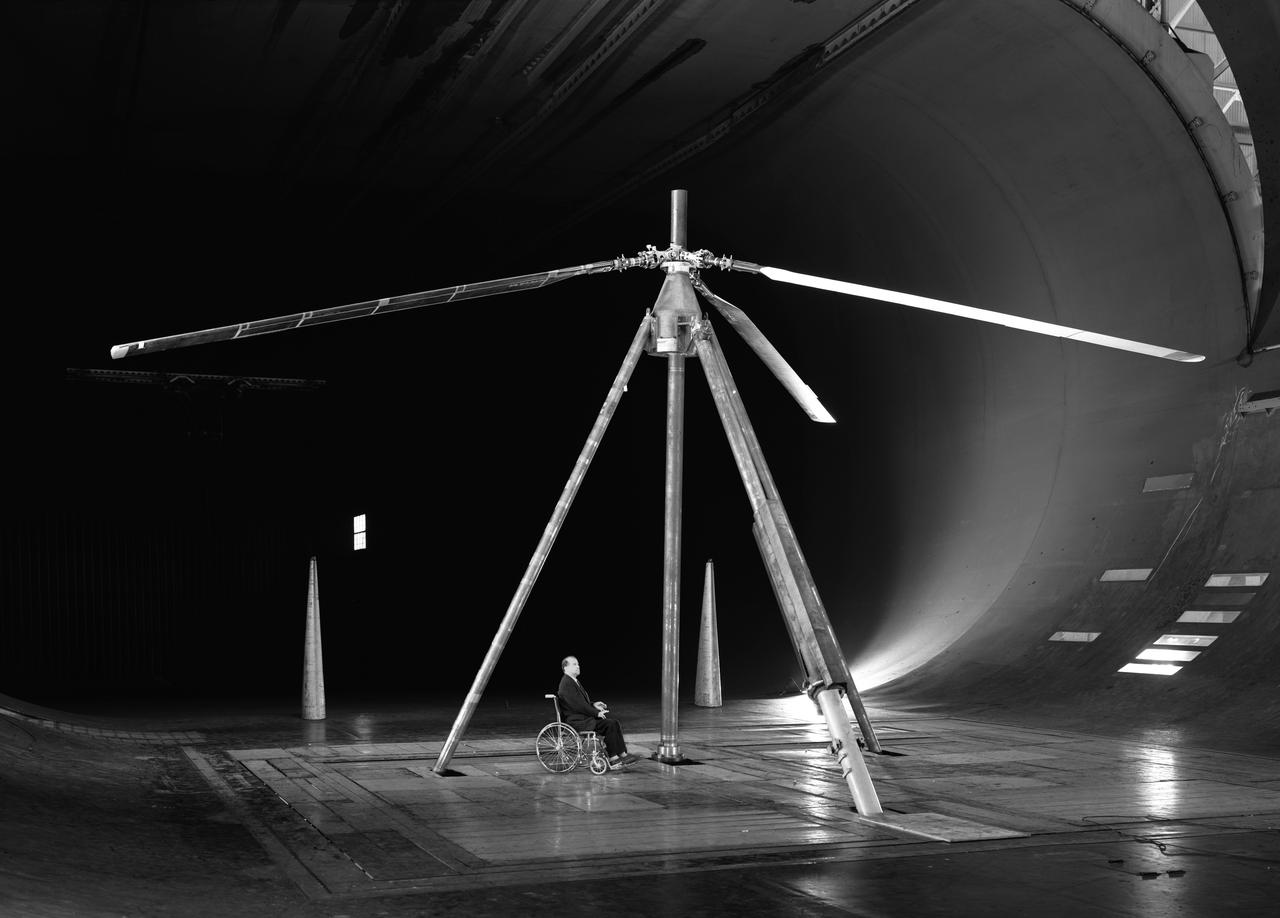
Experimental investigation of boundary-layer control to helicopter rotor blades to increase forward speed capabilities. 3/4 front view. Shaft angle - 35deg. John Mc.Cloud in picture. He was a good guy.
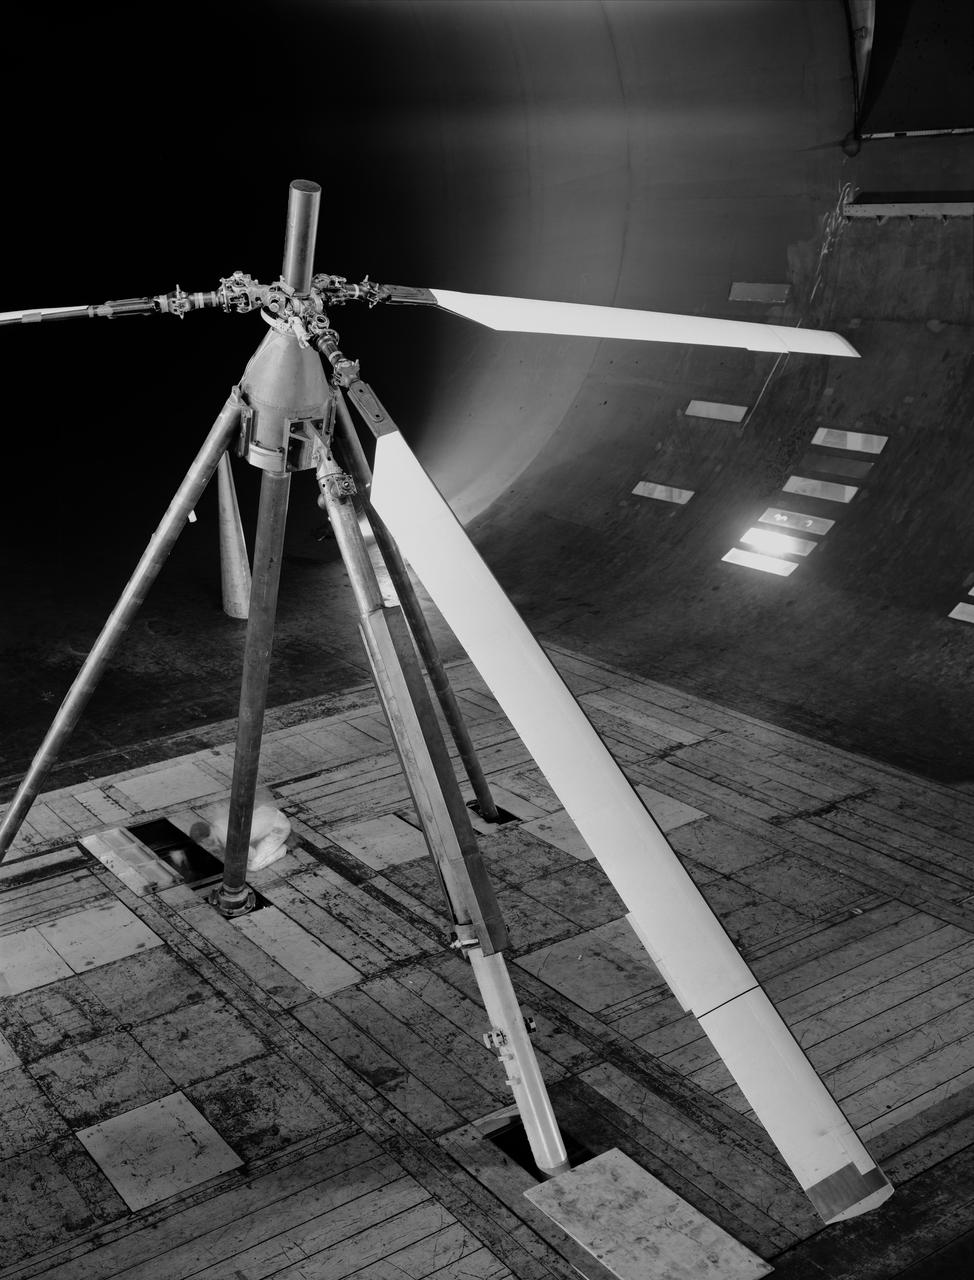
Experimental investigation of boundary layer control to helicopter rotor blades to increase forward speed capabilities. 3/4 overhead view. Shaft angle - 35deg.
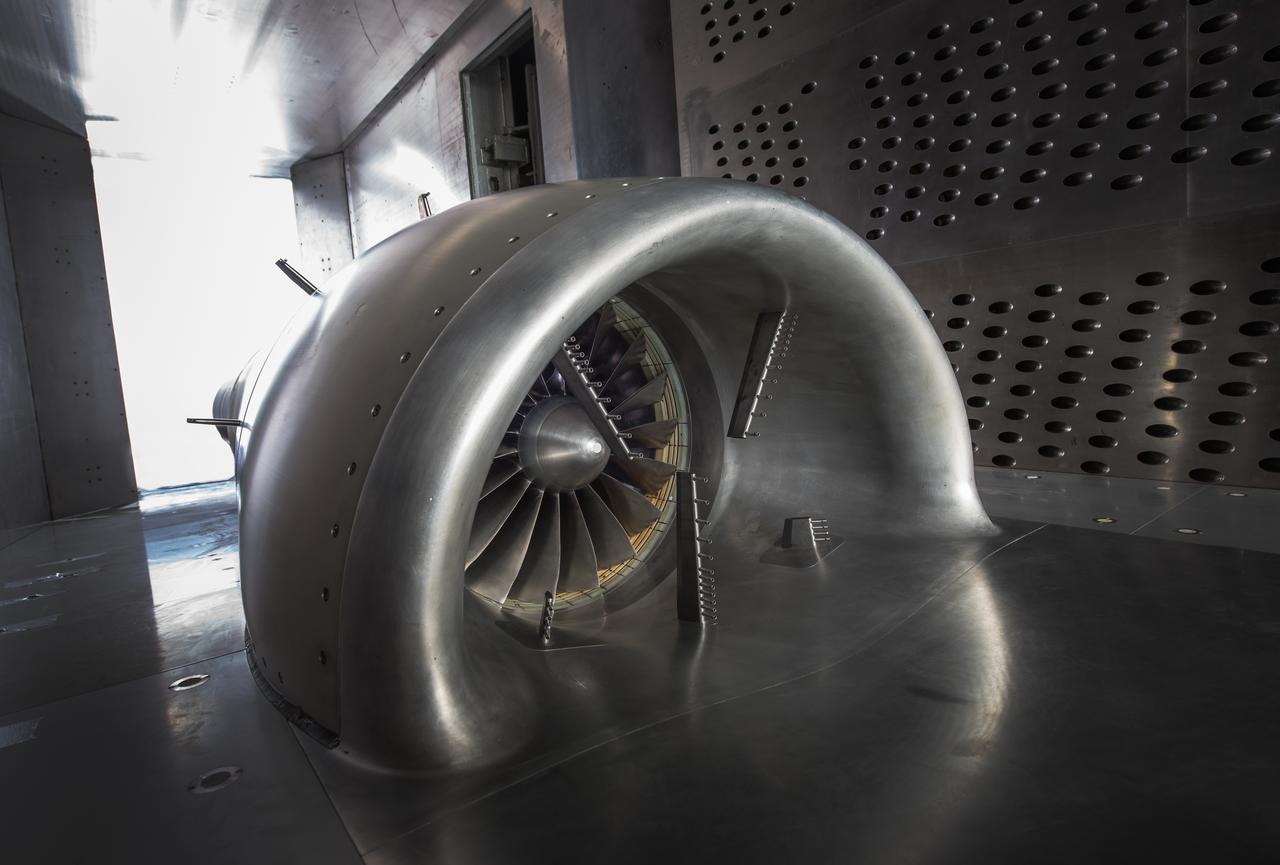
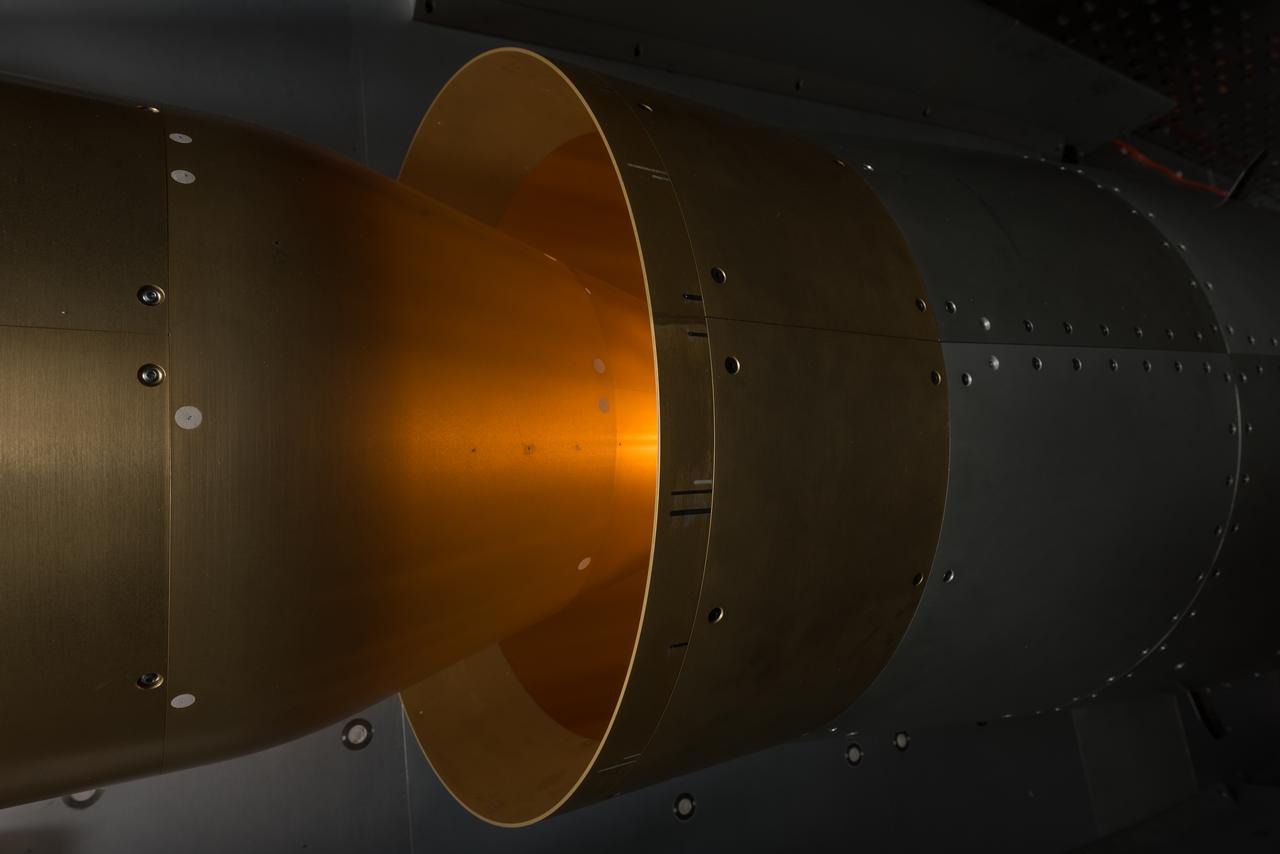
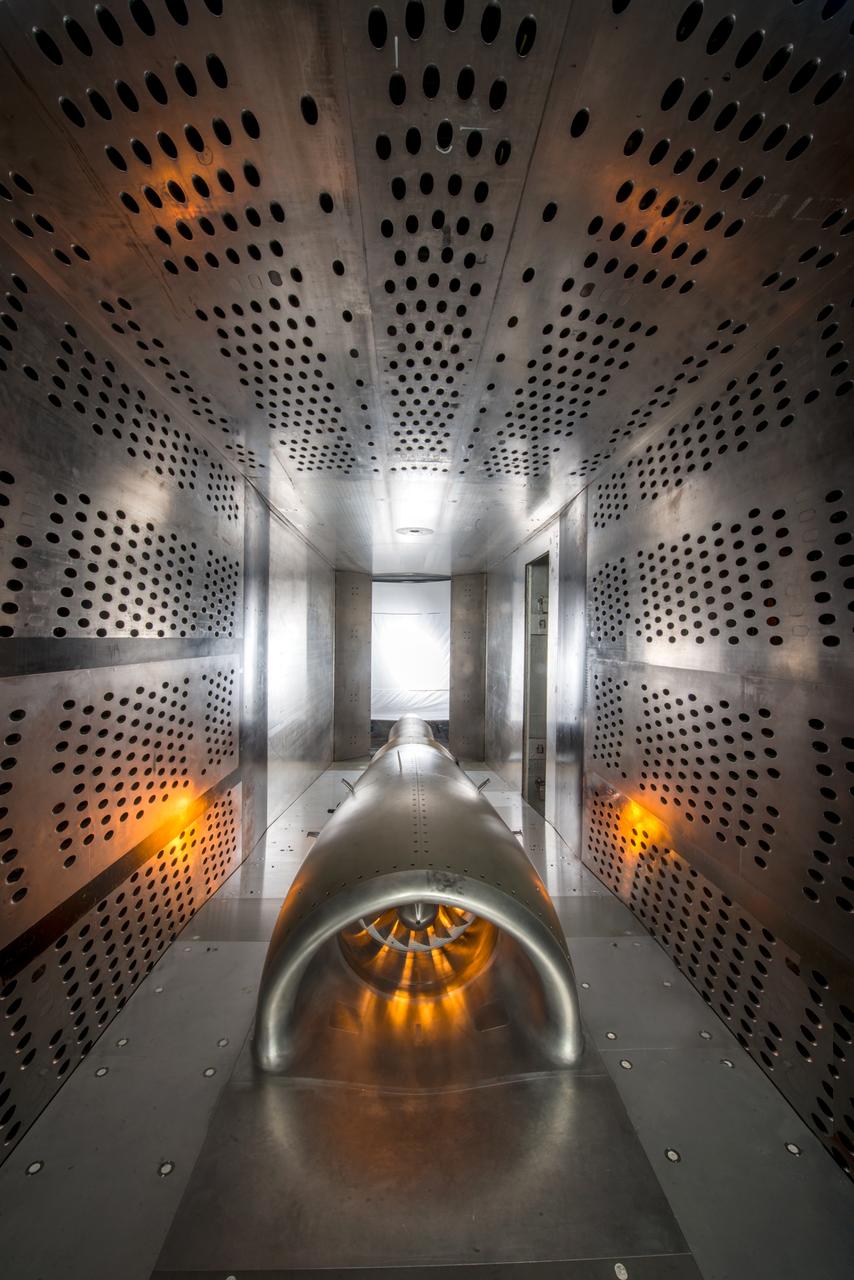
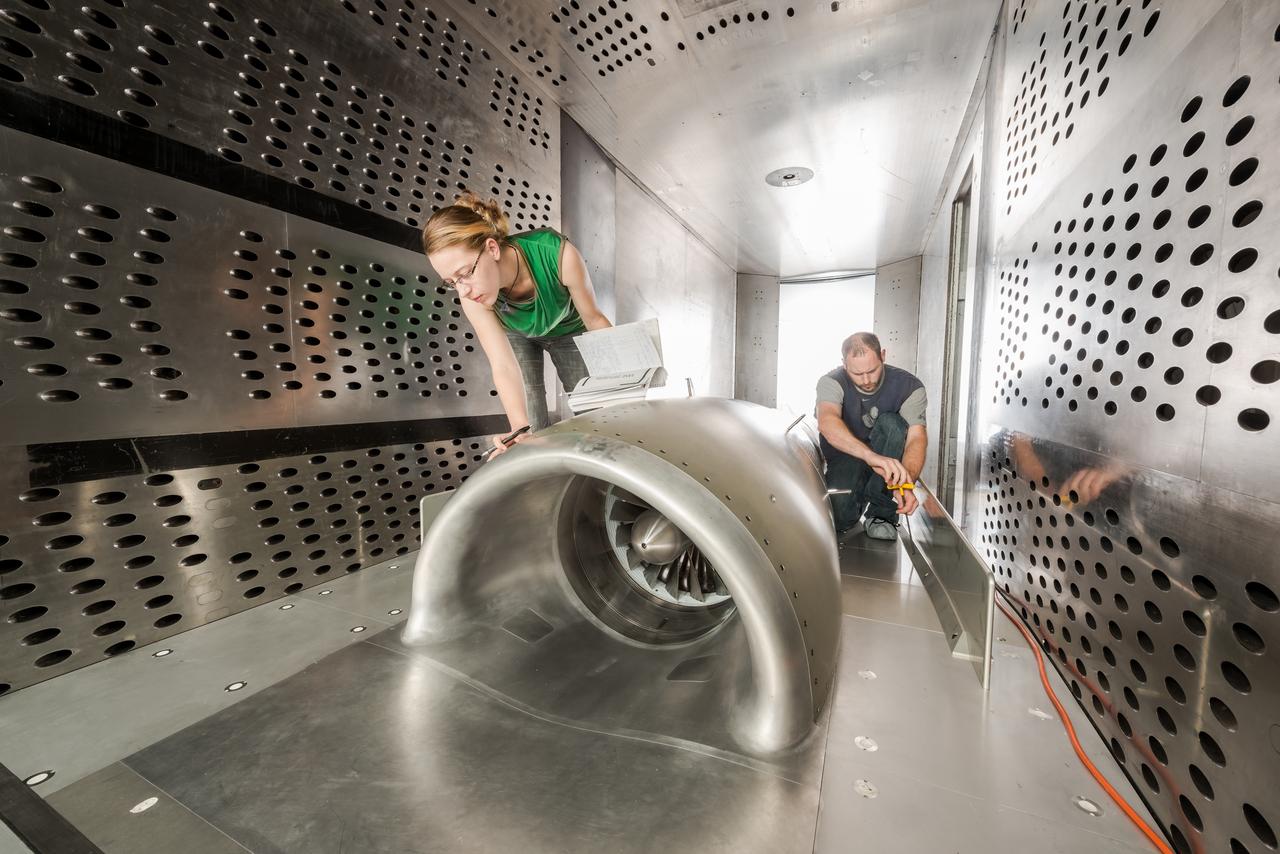
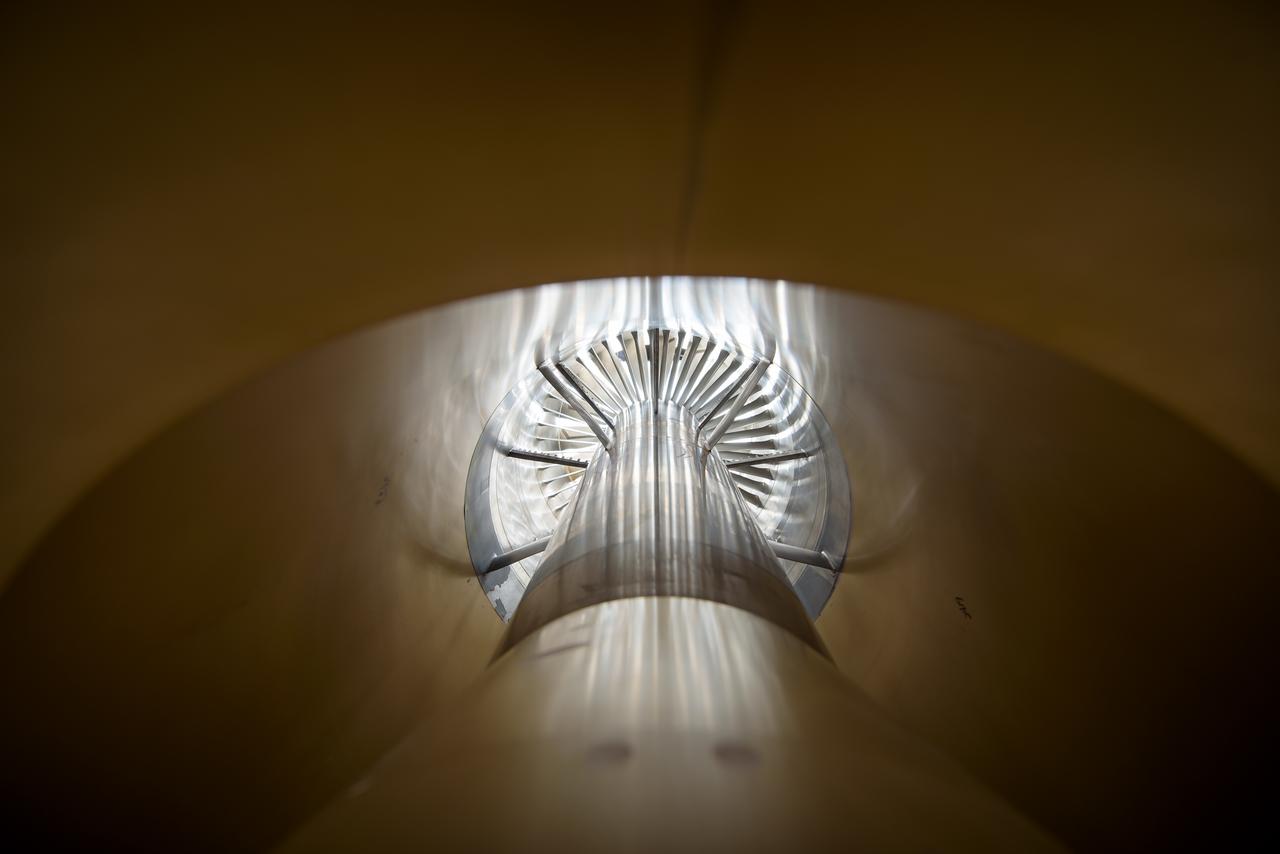
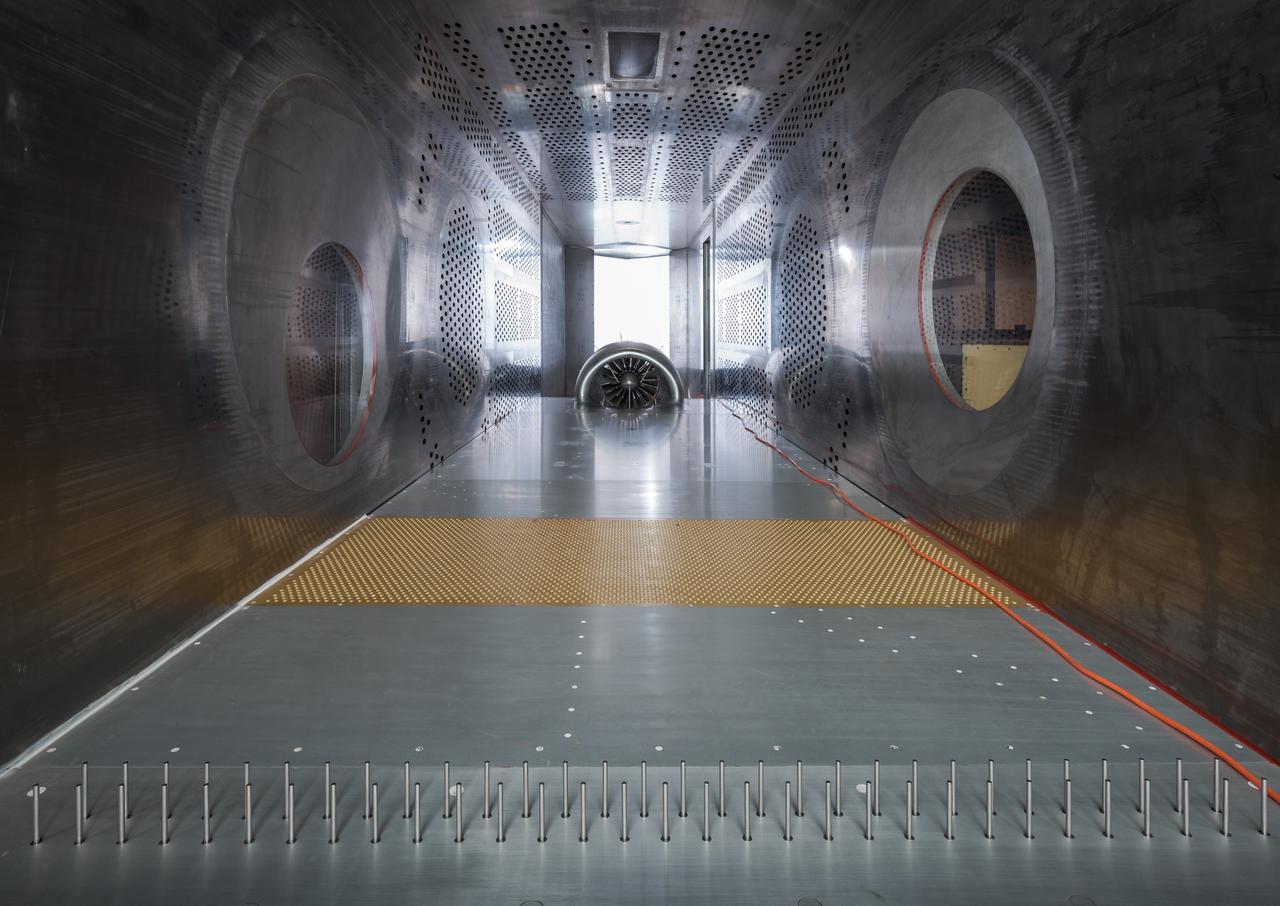
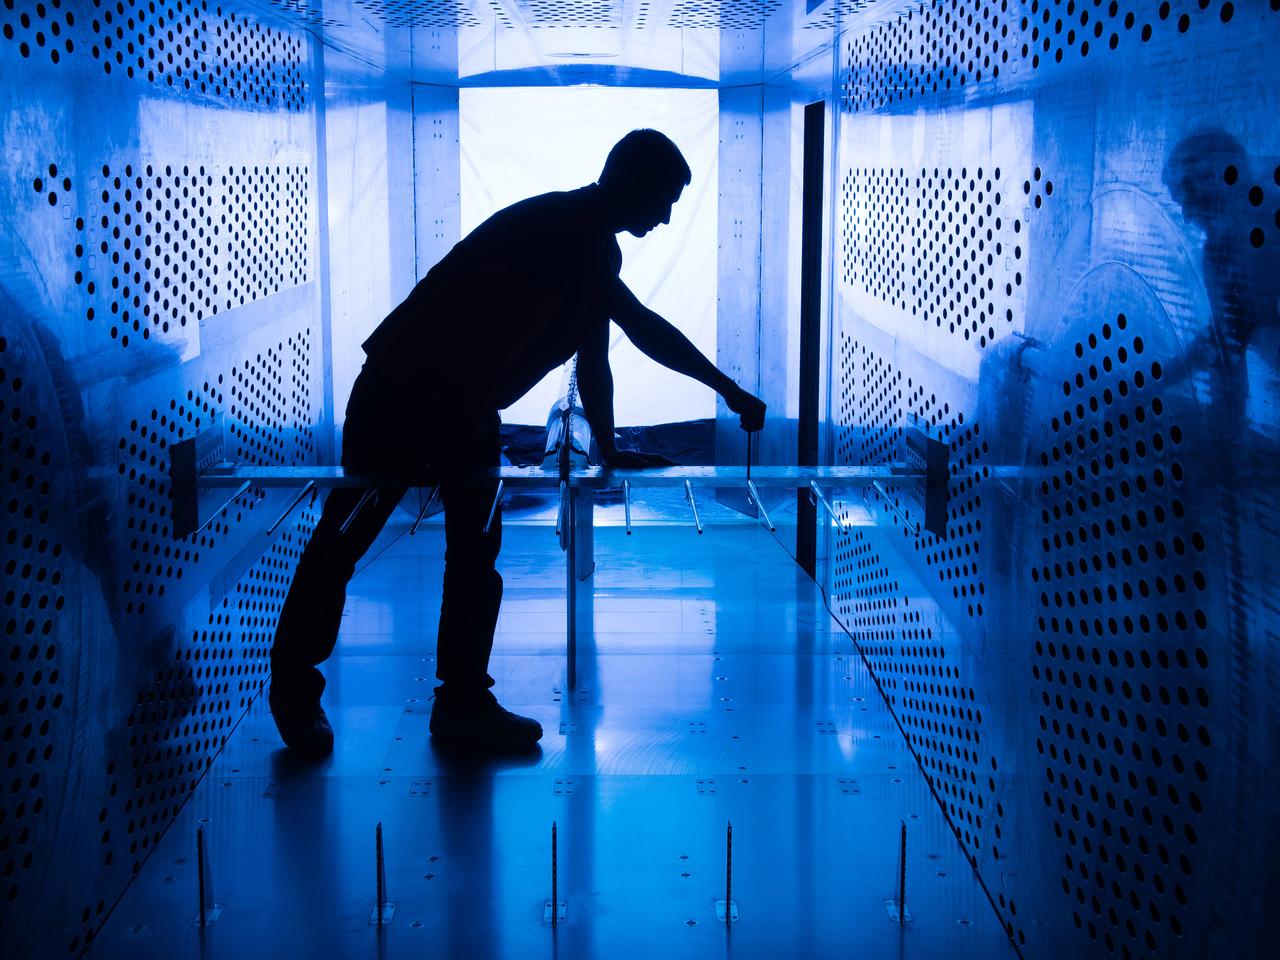
In an effort to improve fuel efficiency, NASA and the aircraft industry are rethinking aircraft design. Inside the 8' x 6' wind tunnel at NASA Glenn, engineers recently tested a fan and inlet design, commonly called a propulsor, which could use four to eight percent less fuel than today's advanced aircraft.
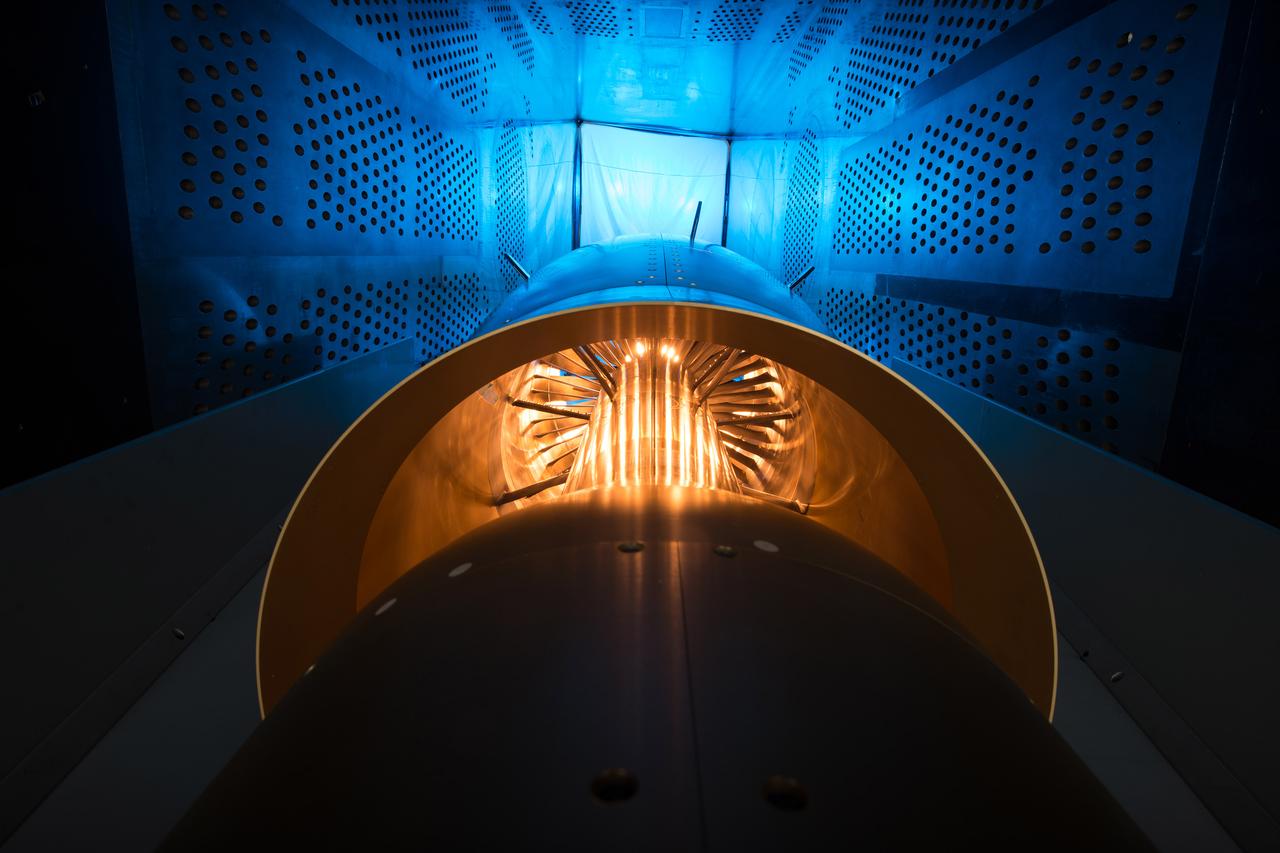
In an effort to improve fuel efficiency, NASA and the aircraft industry are rethinking aircraft design. Inside the 8' x 6' wind tunnel at NASA Glenn, engineers recently tested a fan and inlet design, commonly called a propulsor, which could use four to eight percent less fuel than today's advanced aircraft.
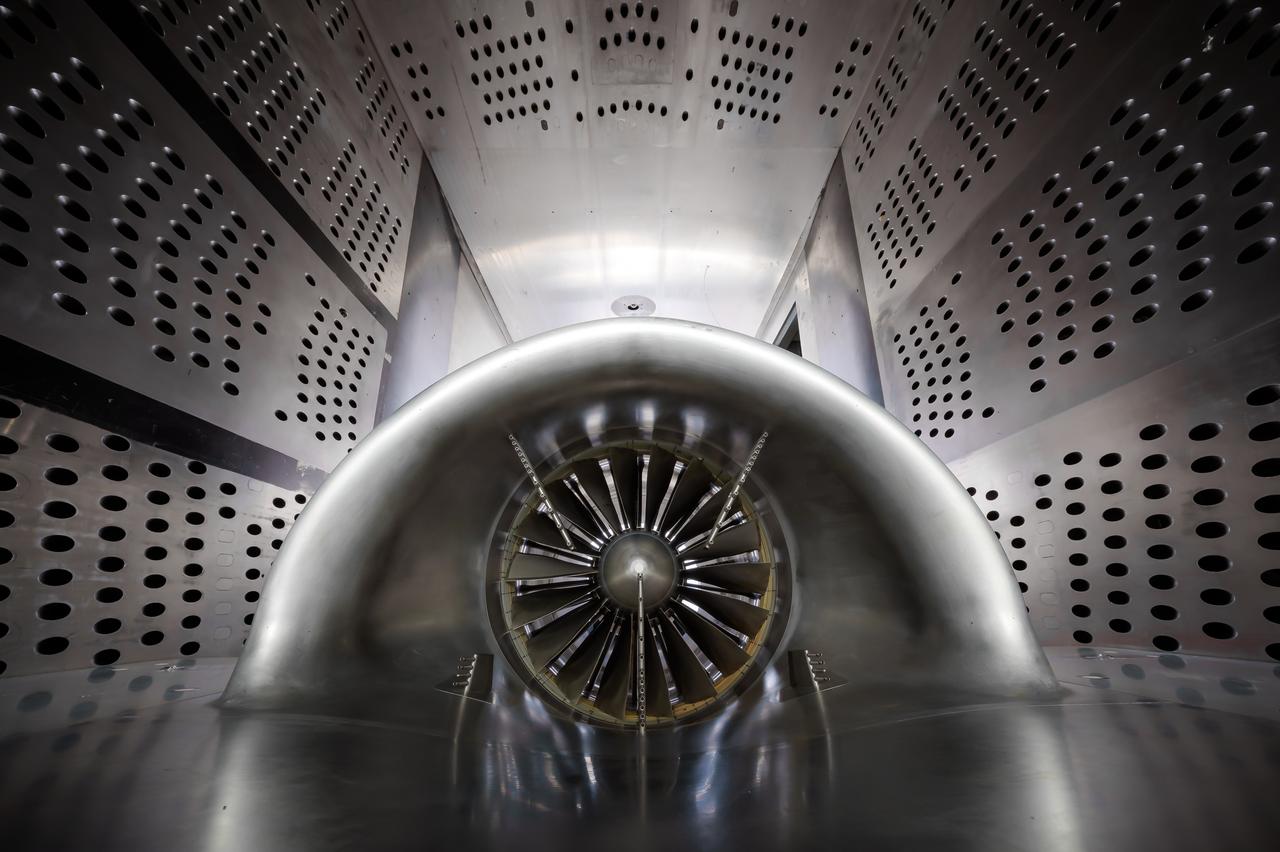
In an effort to improve fuel efficiency, NASA and the aircraft industry are rethinking aircraft design. Inside the 8' x 6' wind tunnel at NASA Glenn, engineers recently tested a fan and inlet design, commonly called a propulsor, which could use four to eight percent less fuel than today's advanced aircraft.
In an effort to improve fuel efficiency, NASA and the aircraft industry are rethinking aircraft design. Inside the 8' x 6' wind tunnel at NASA Glenn, engineers recently tested a fan and inlet design, commonly called a propulsor, which could use four to eight percent less fuel than today's advanced aircraft.
In an effort to improve fuel efficiency, NASA and the aircraft industry are rethinking aircraft design. Inside the 8' x 6' wind tunnel at NASA Glenn, engineers recently tested a fan and inlet design, commonly called a propulsor, which could use four to eight percent less fuel than today's advanced aircraft.
In an effort to improve fuel efficiency, NASA and the aircraft industry are rethinking aircraft design. Inside the 8' x 6' wind tunnel at NASA Glenn, engineers recently tested a fan and inlet design, commonly called a propulsor, which could use four to eight percent less fuel than today's advanced aircraft.
In an effort to improve fuel efficiency, NASA and the aircraft industry are rethinking aircraft design. Inside the 8' x 6' wind tunnel at NASA Glenn, engineers recently tested a fan and inlet design, commonly called a propulsor, which could use four to eight percent less fuel than today's advanced aircraft.
In an effort to improve fuel efficiency, NASA and the aircraft industry are rethinking aircraft design. Inside the 8' x 6' wind tunnel at NASA Glenn, engineers recently tested a fan and inlet design, commonly called a propulsor, which could use four to eight percent less fuel than today's advanced aircraft.
In an effort to improve fuel efficiency, NASA and the aircraft industry are rethinking aircraft design. Inside the 8' x 6' wind tunnel at NASA Glenn, engineers recently tested a fan and inlet design, commonly called a propulsor, which could use four to eight percent less fuel than today's advanced aircraft.
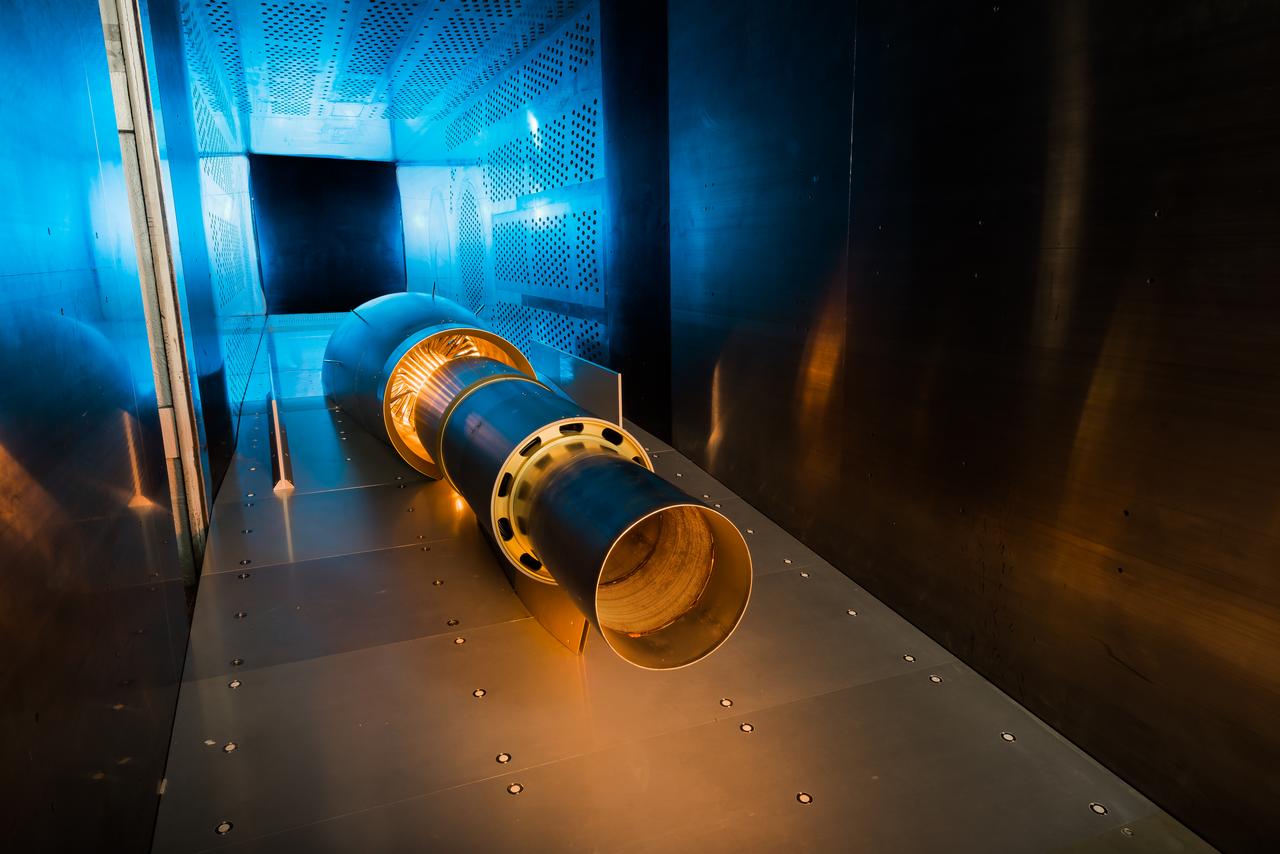
Fundamental Study of a boundary layer ingesting (BLI) propulsion model
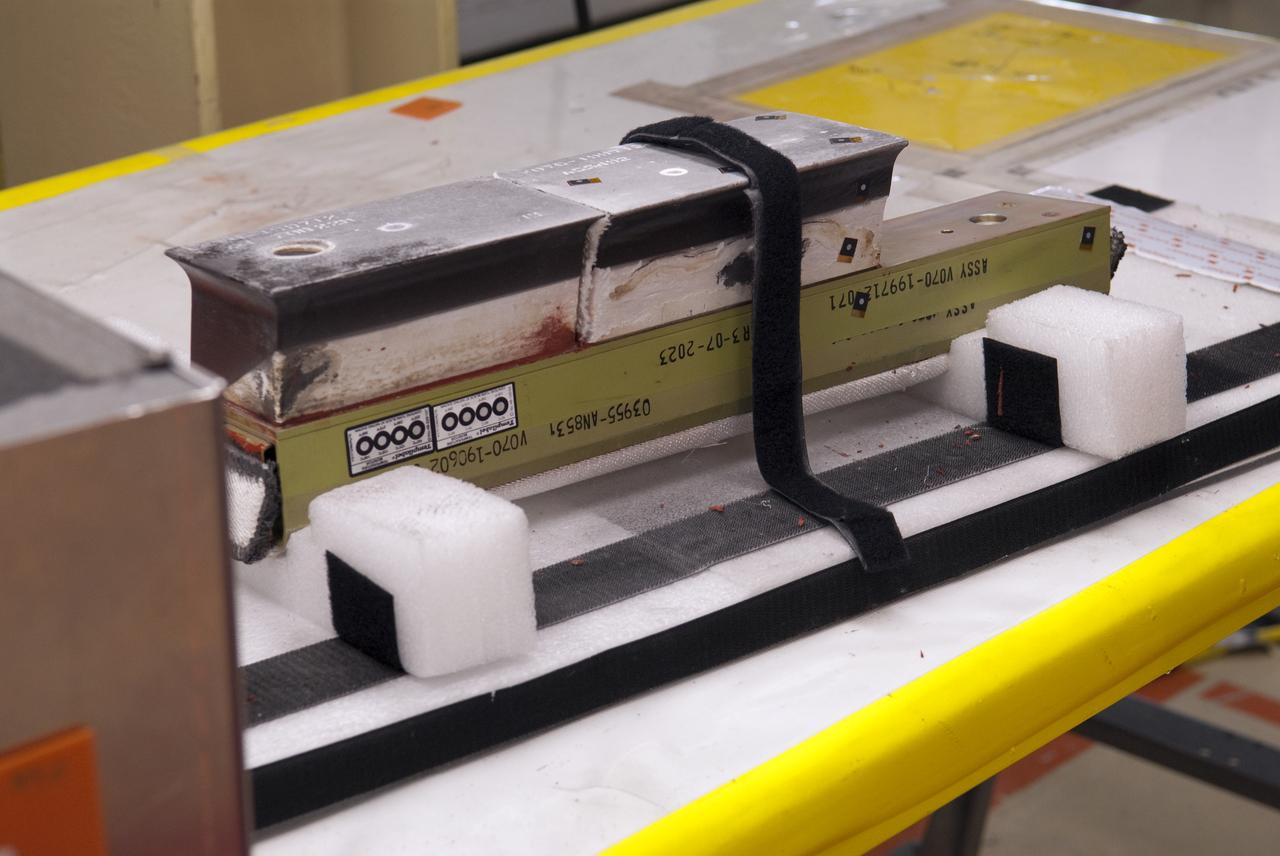
Raised Floor Calibration Hardware for the Boundary Layer Ingesting Inlet Distortion Tolerant Fan tests to be performed in the 8' x 6' Supersonic Wind Tunnel at NASA Glenn Research Center.
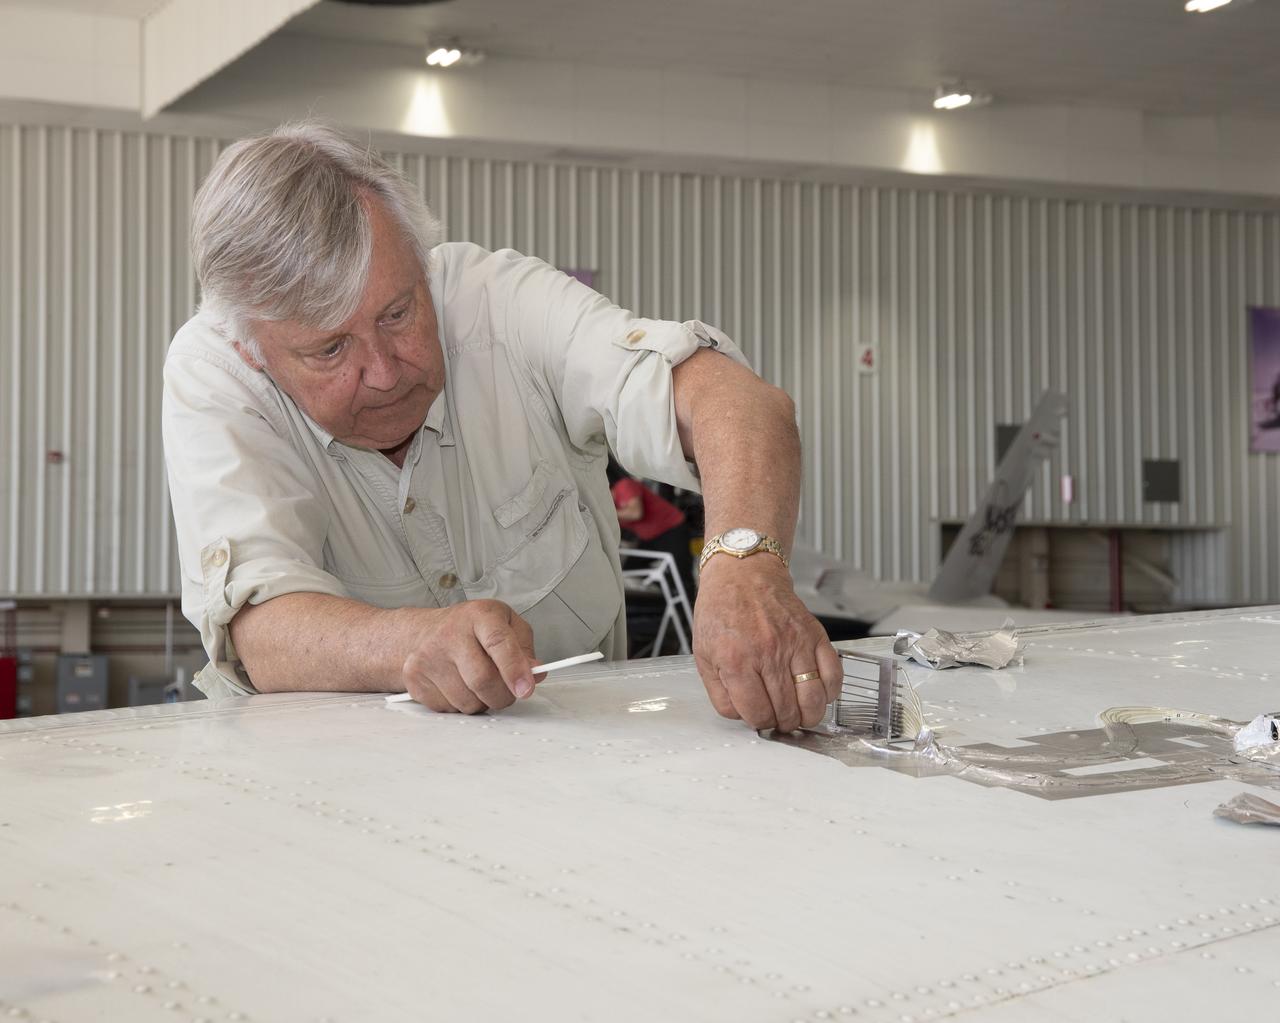
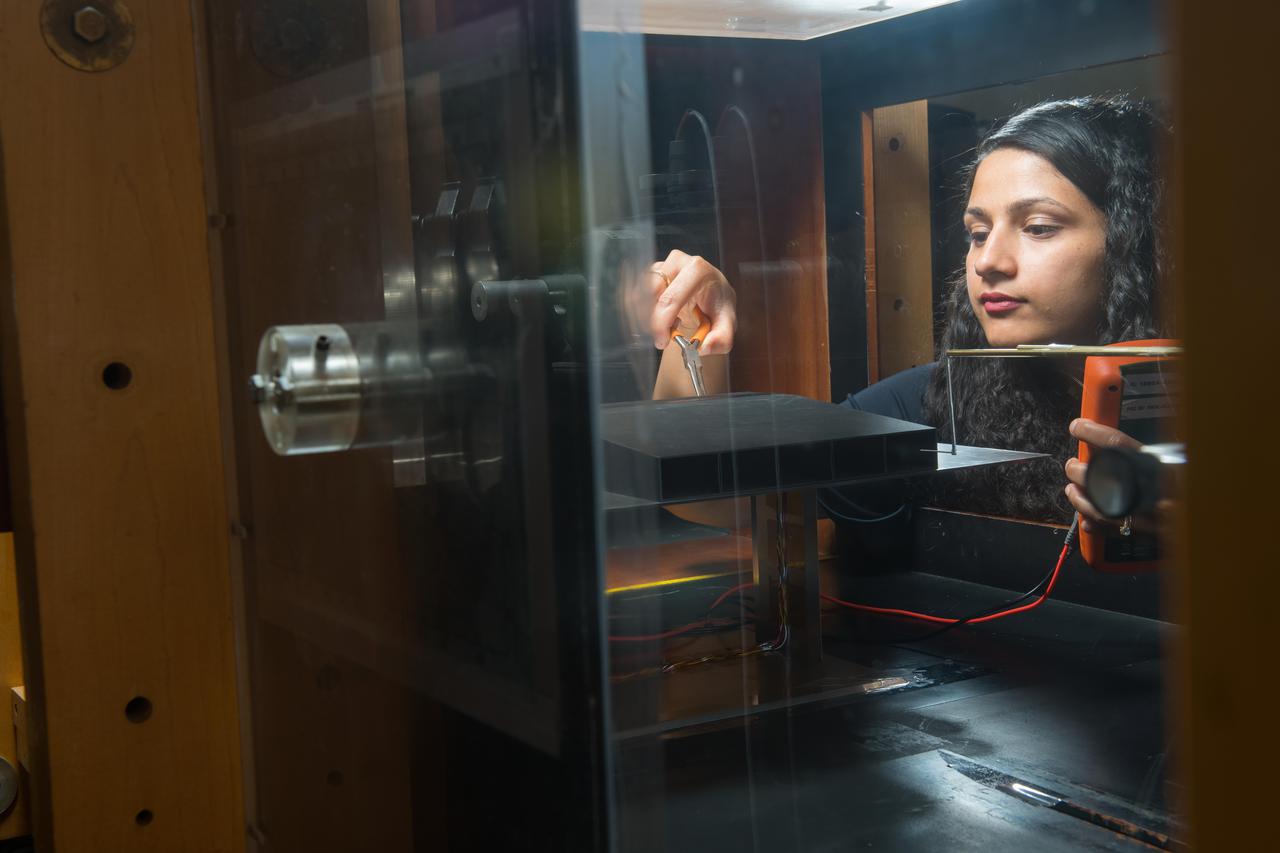
Cal Poly San Luis Obispo Professor Russ Westphal works on the Boundary Layer Data System (BLDS) attached to the wing of a Beechcraft Beech 200 Super King Air aircraft. The BLDS was attached to the aircraft with removable adhesives for a flight test at NASA’s Armstrong Flight Research Center.
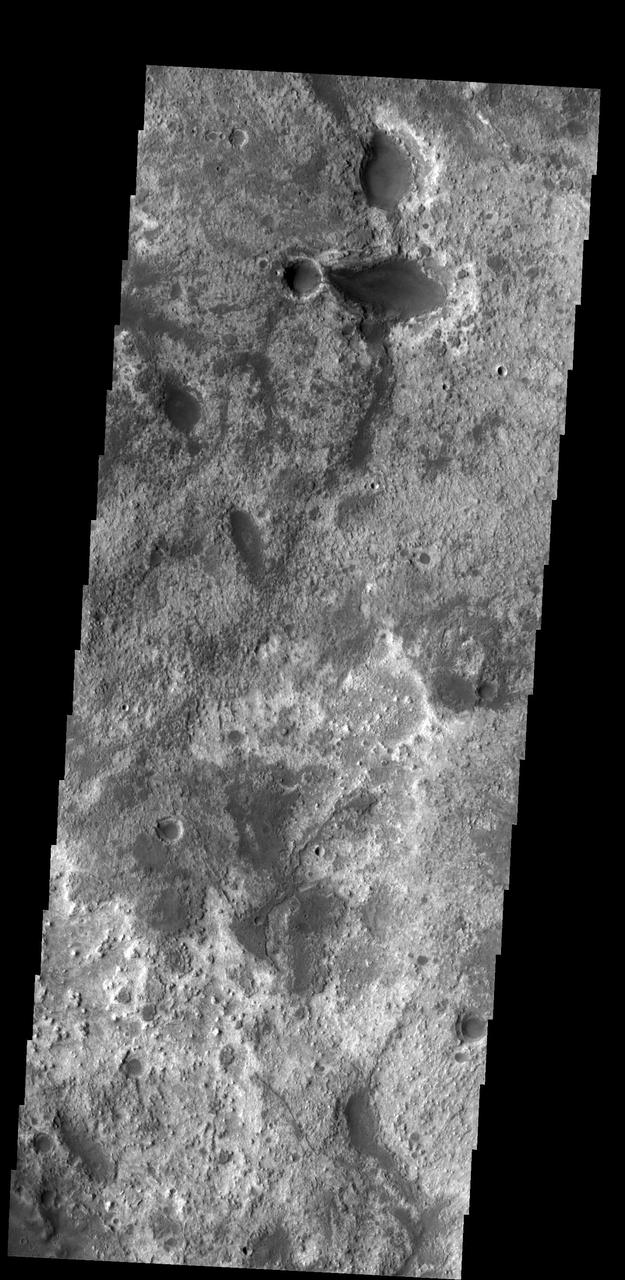
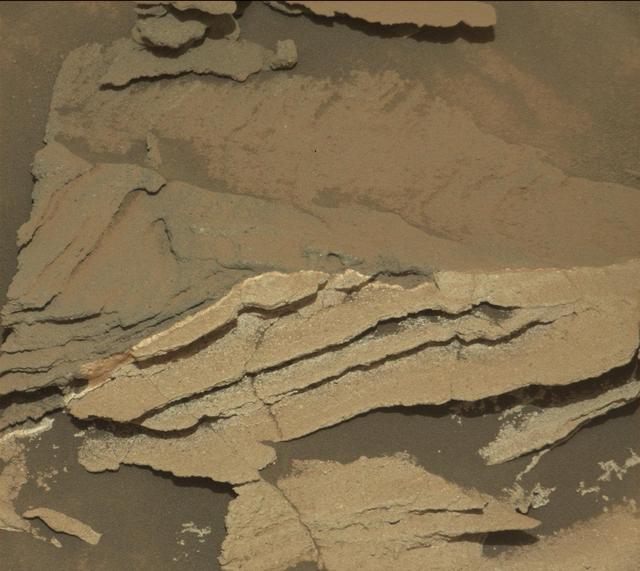
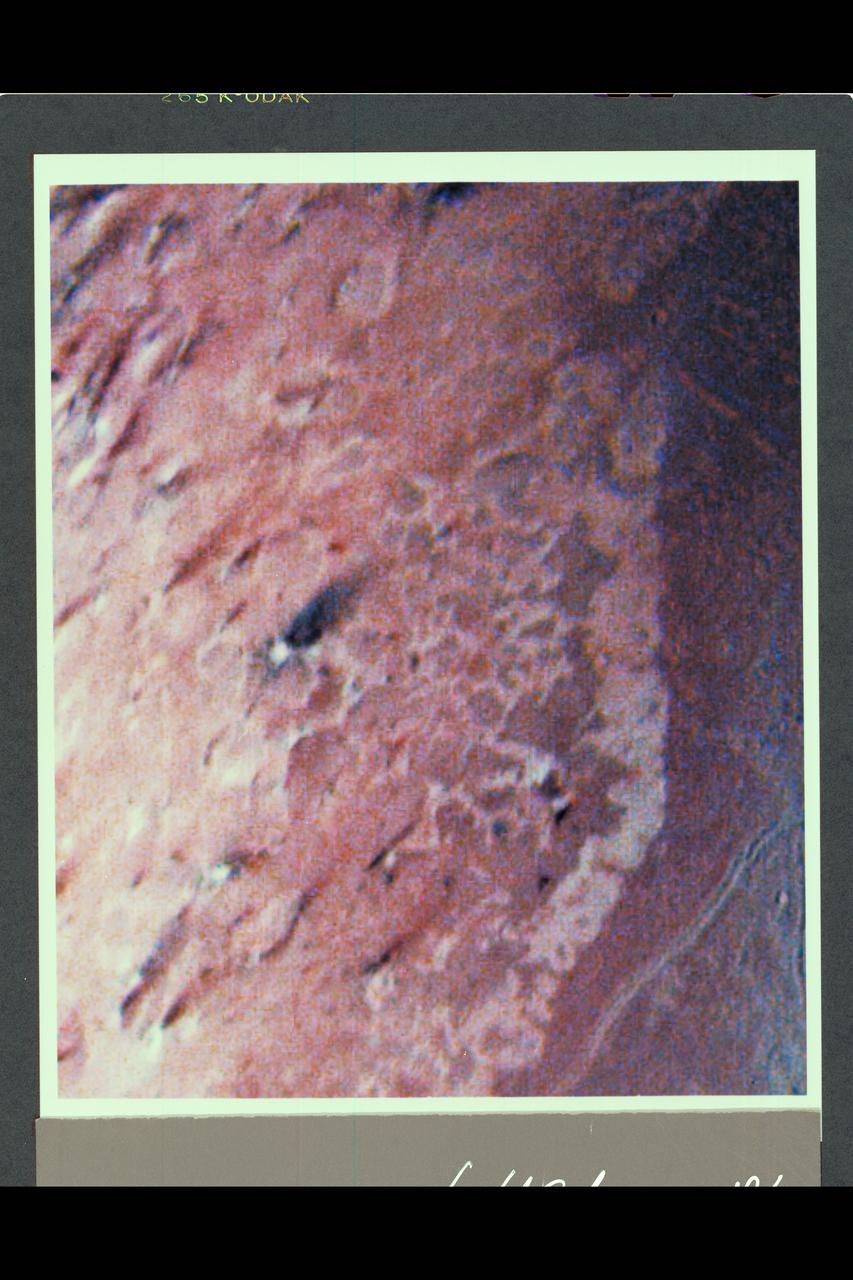
This region of Arabia Terra has several different layers of material exposed. These layers occur at the highland/lowland boundary
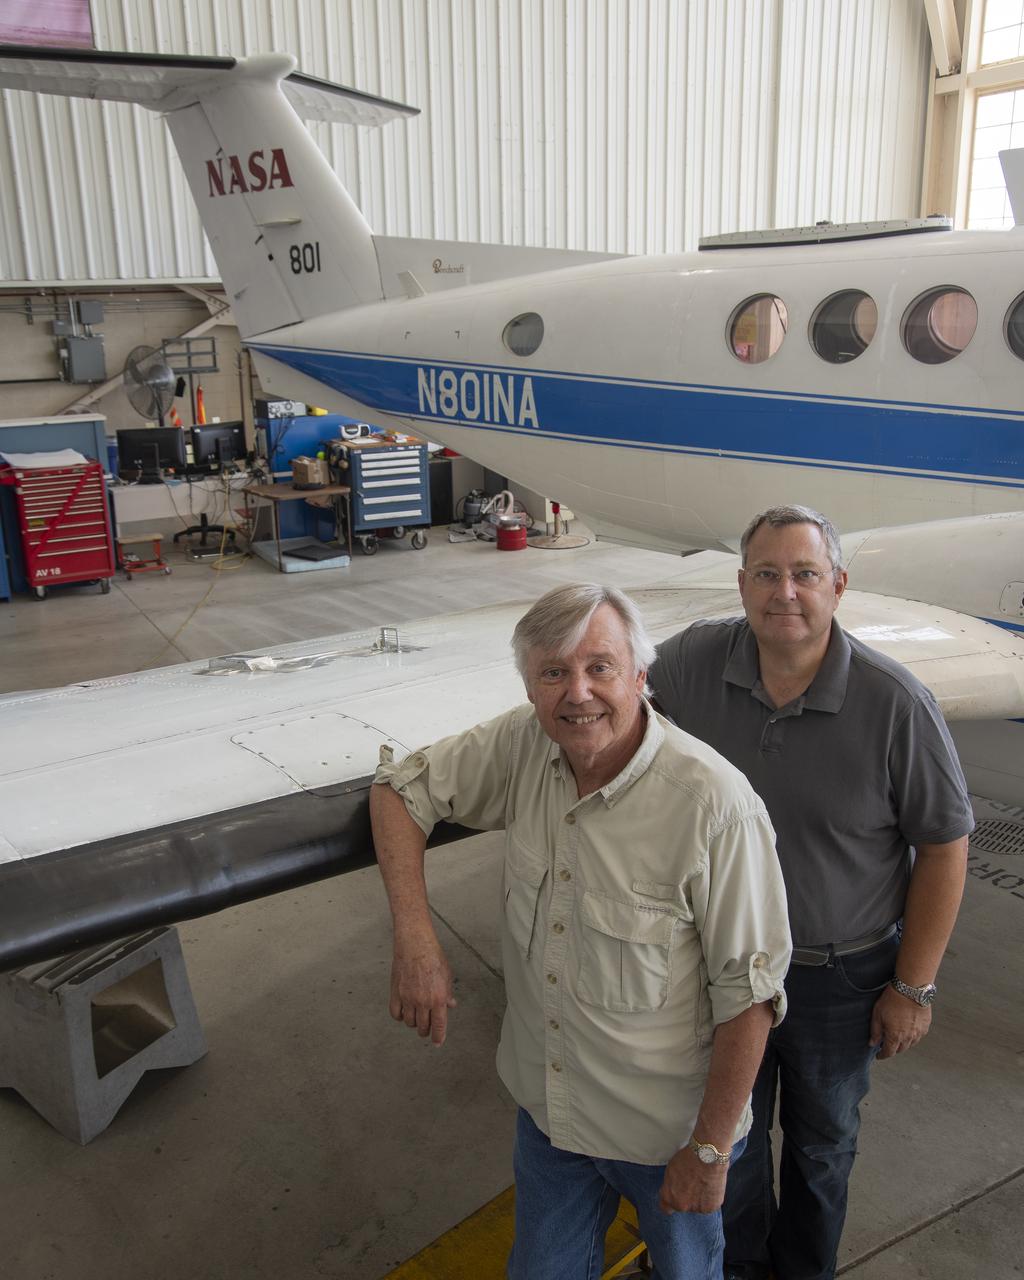
Cal Poly San Luis Obispo professors Russ Westphal, left, and Aaron Drake posed next to NASA Armstrong Flight Research Center’s Beechcraft Beech 200 Super King Air aircraft. On the King Air’s wing is the Boundary Layer Data System (BLDS), a sensor developed by Cal Poly and Northrop Grumman. BLDS was flown at NASA Armstrong as a step towards creating a process allowing universities, small businesses and other interested parties to quickly test flight technologies.
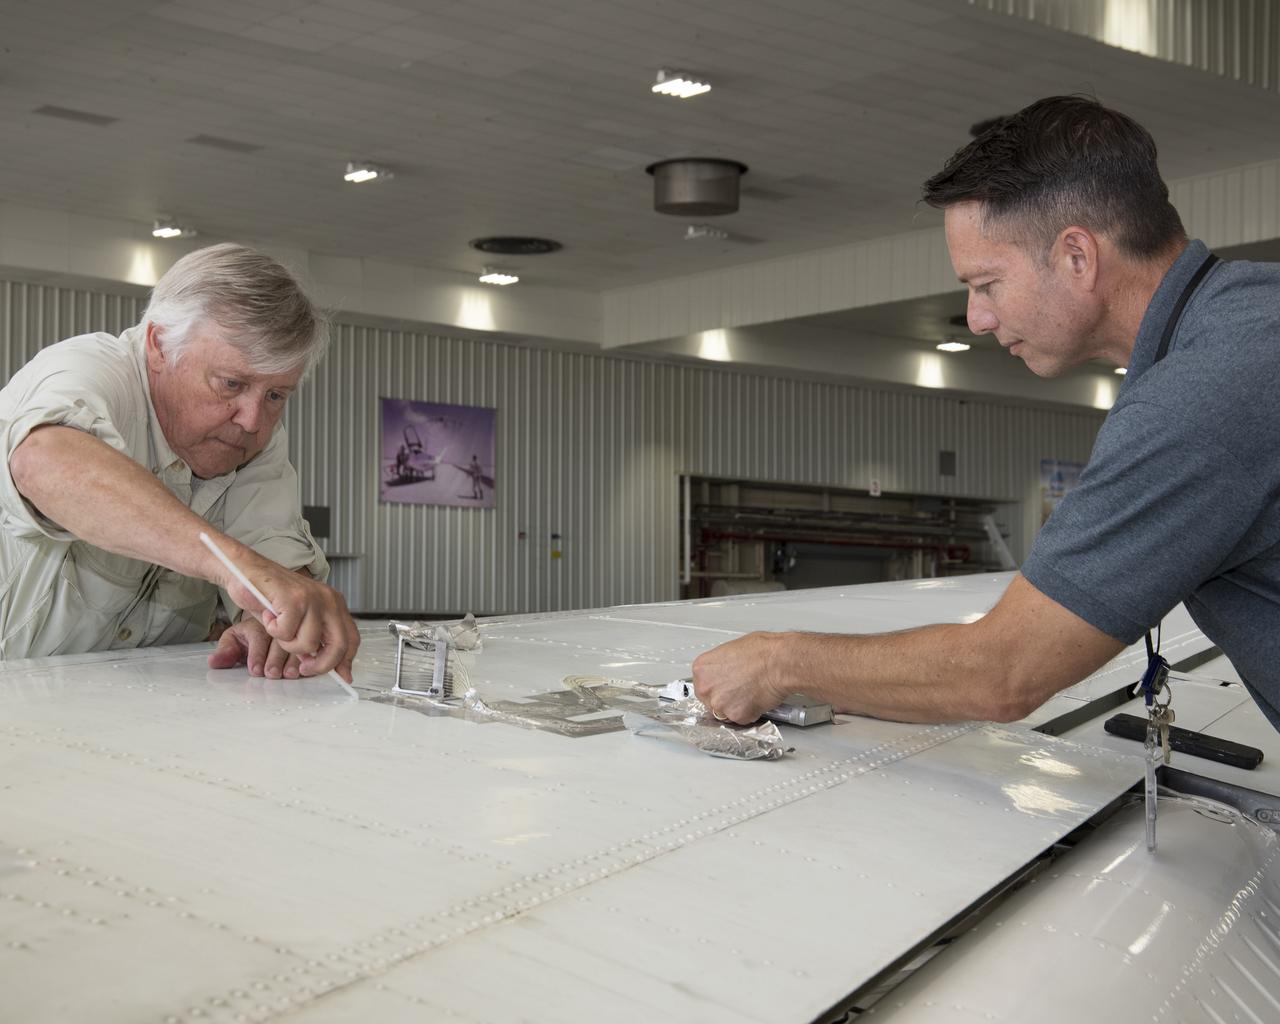
Cal Poly San Luis Obispo Professor Russ Westphal, left, and NASA Armstrong’s Technology Transfer Officer Benjamin Tomlinson remove the Boundary Layer Data System (BLDS) sensor attached to the wing of a Beechcraft Beech 200 Super King Air. The BLDS was flight tested at NASA’s Armstrong Flight Research Center to showcase rapid and flexible flight-testing capabilities.
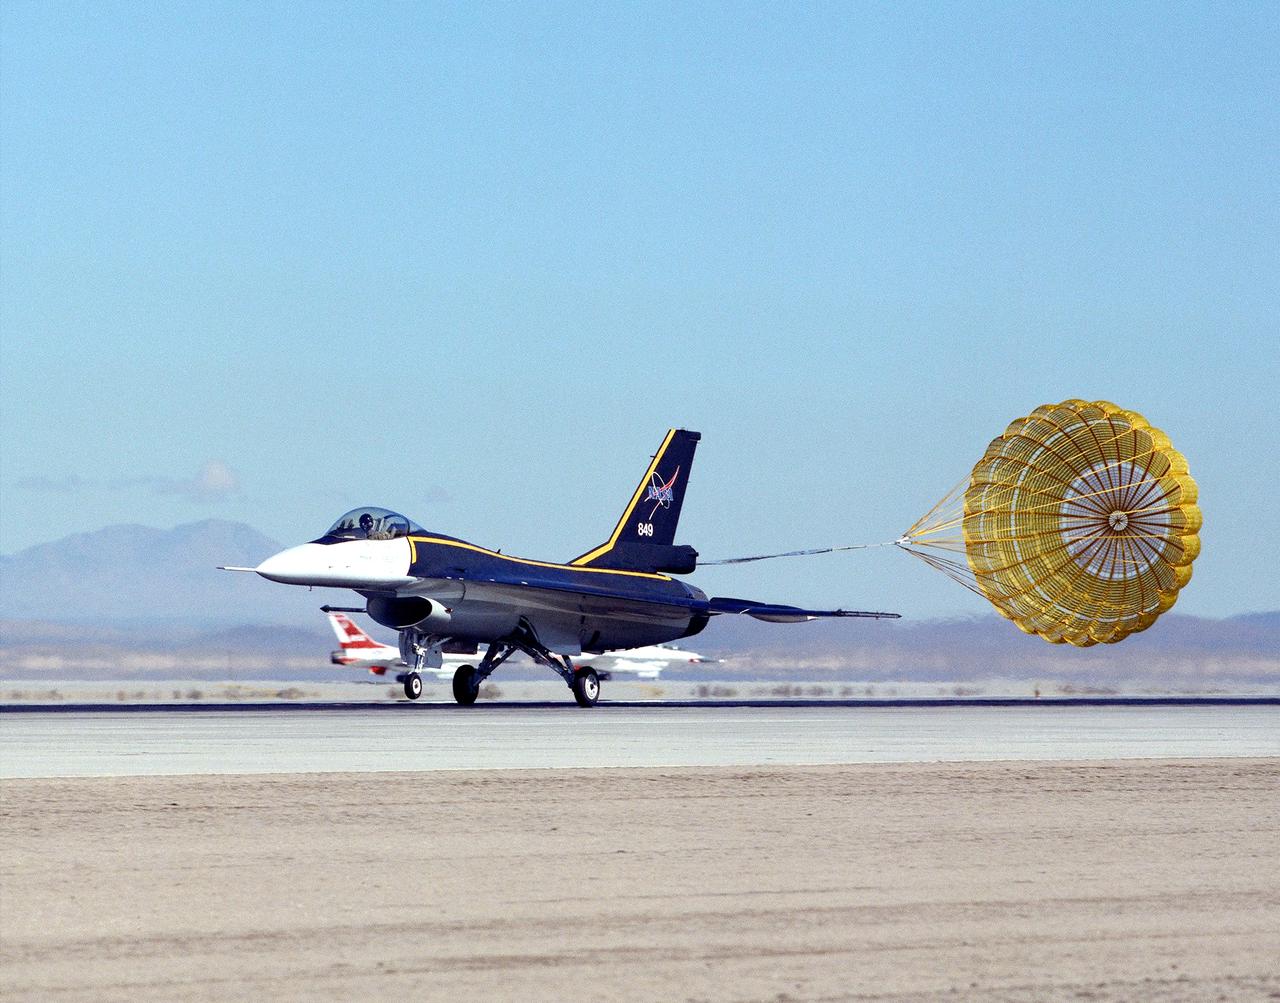
NASA's single-seat F-16XL makes a drag chute landing at the Dryden Flight Research Center, Edwards, California. The aircraft was most recently used in the Cranked-Arrow Wing Aerodynamics Project (CAWAP) to test boundary layer pressures and distribution. Previously it had been used in a program to investigate the characteristics of sonic booms for NASA's High Speed Research Program. Data from the program will be used in the development of a high speed civilian transport. During the series of sonic boom research flights, the F-16XL was used to probe the shock waves being generated by a NASA SR-71 and record their shape and intensity.
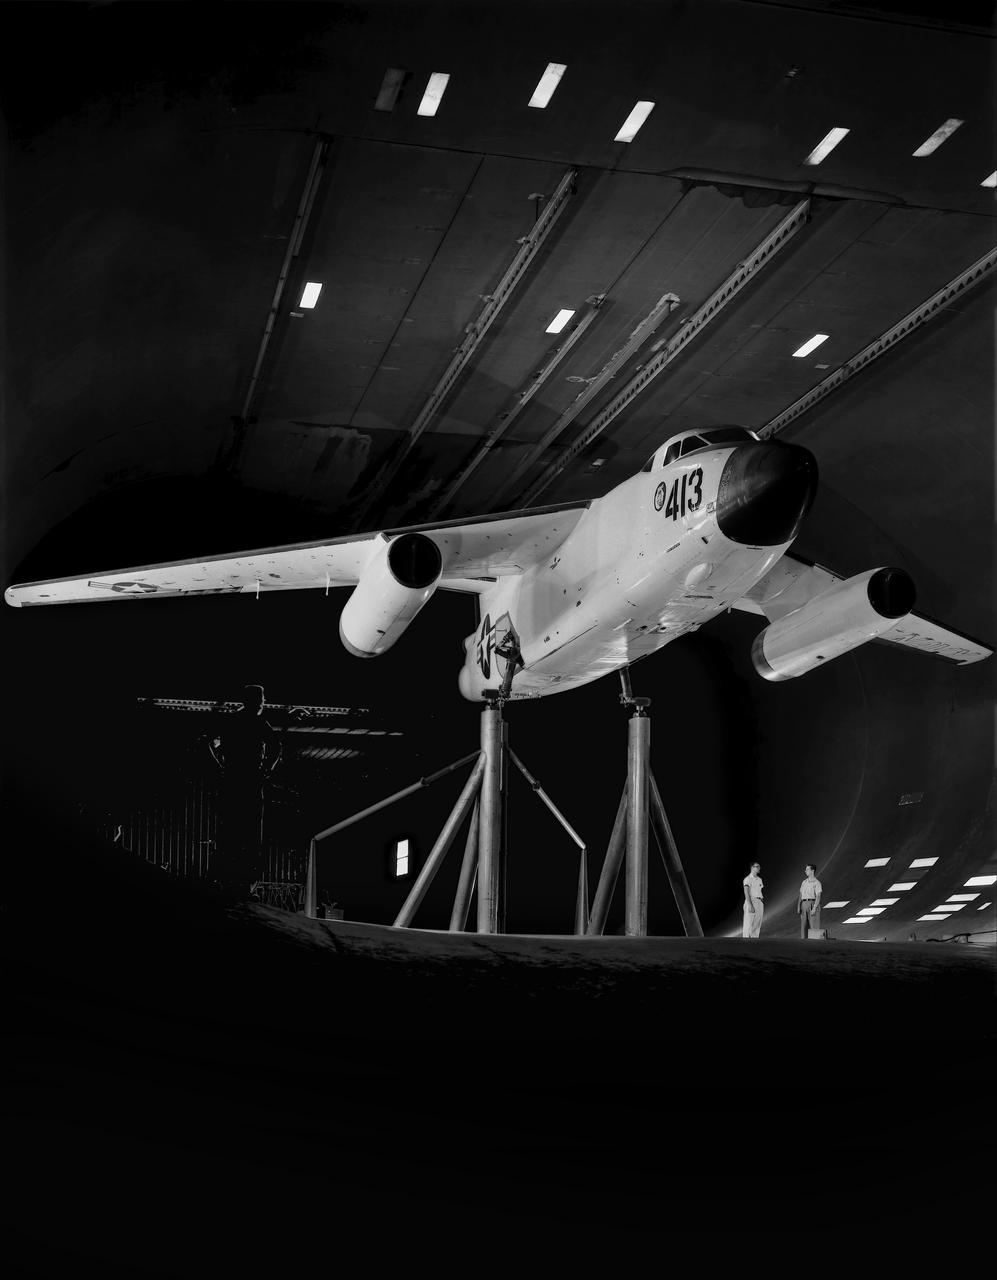
Testing the wing boundary layer control of the A3D in the 40 x 80 wind tunnel. Boundary layer control was added to increase the lift of the wing for aircraft carrier take off and landing.
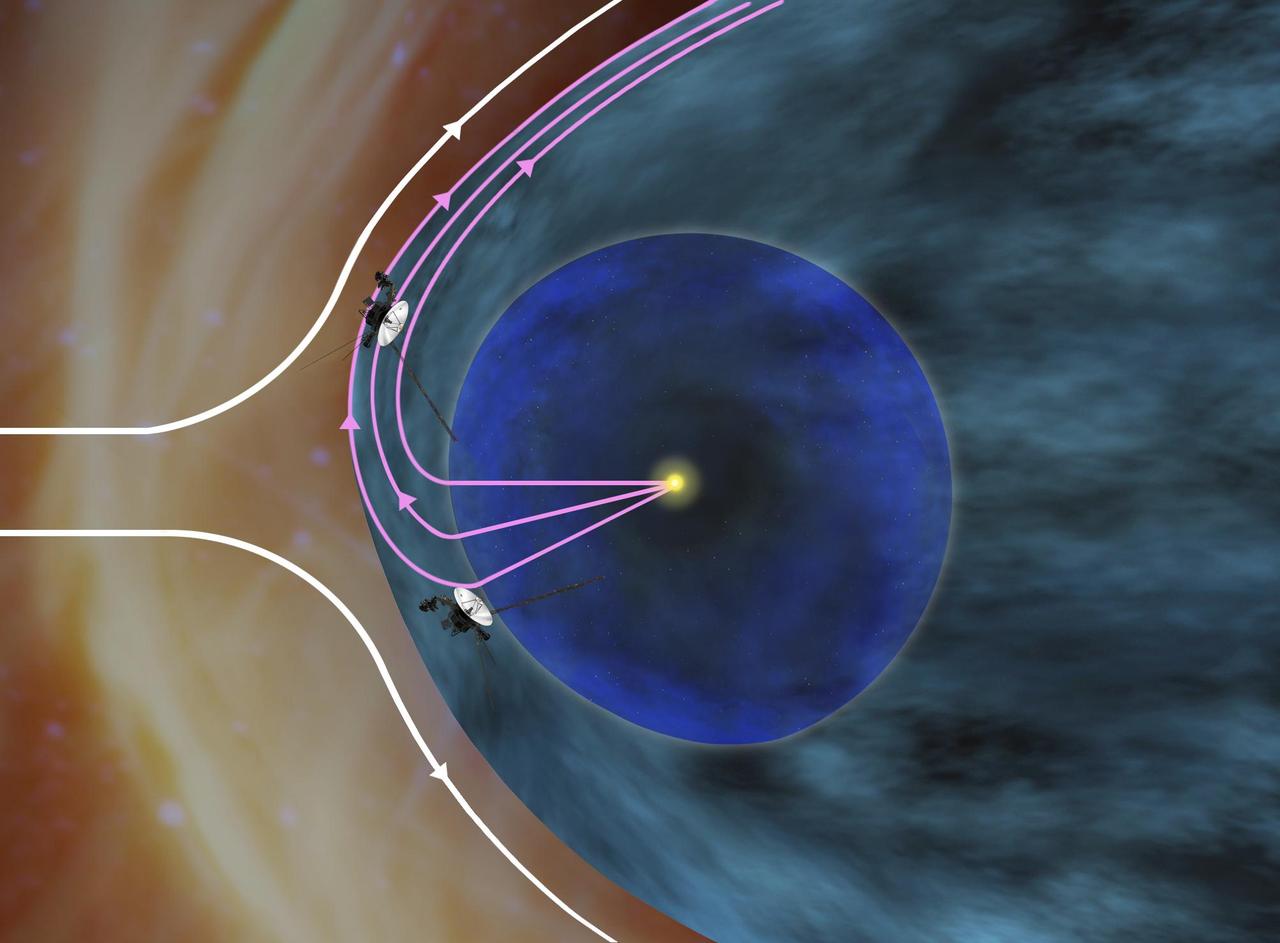
This artist concept shows how NASA Voyager 1 spacecraft is bathed in solar wind from the southern hemisphere flowing northward. This phenomenon creates a layer of giant bubble of solar ions just inside the outer boundary of the heliosphere.
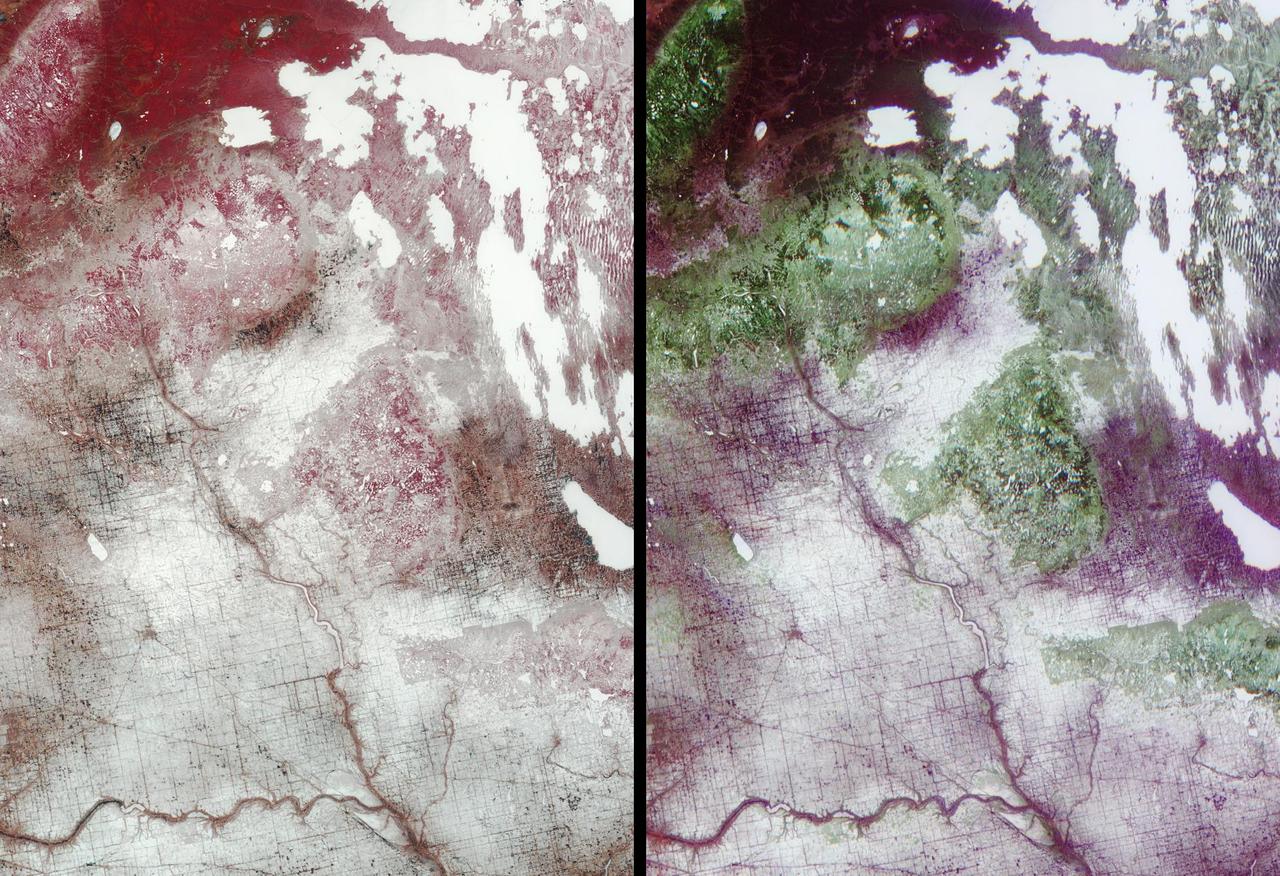
Surface brightness contrasts accentuated by a thin layer of snow enable a network of rivers, roads, and farmland boundaries to stand out clearly in these images from NASA Terra satellite of southeastern Saskatchewan and southwestern Manitoba.
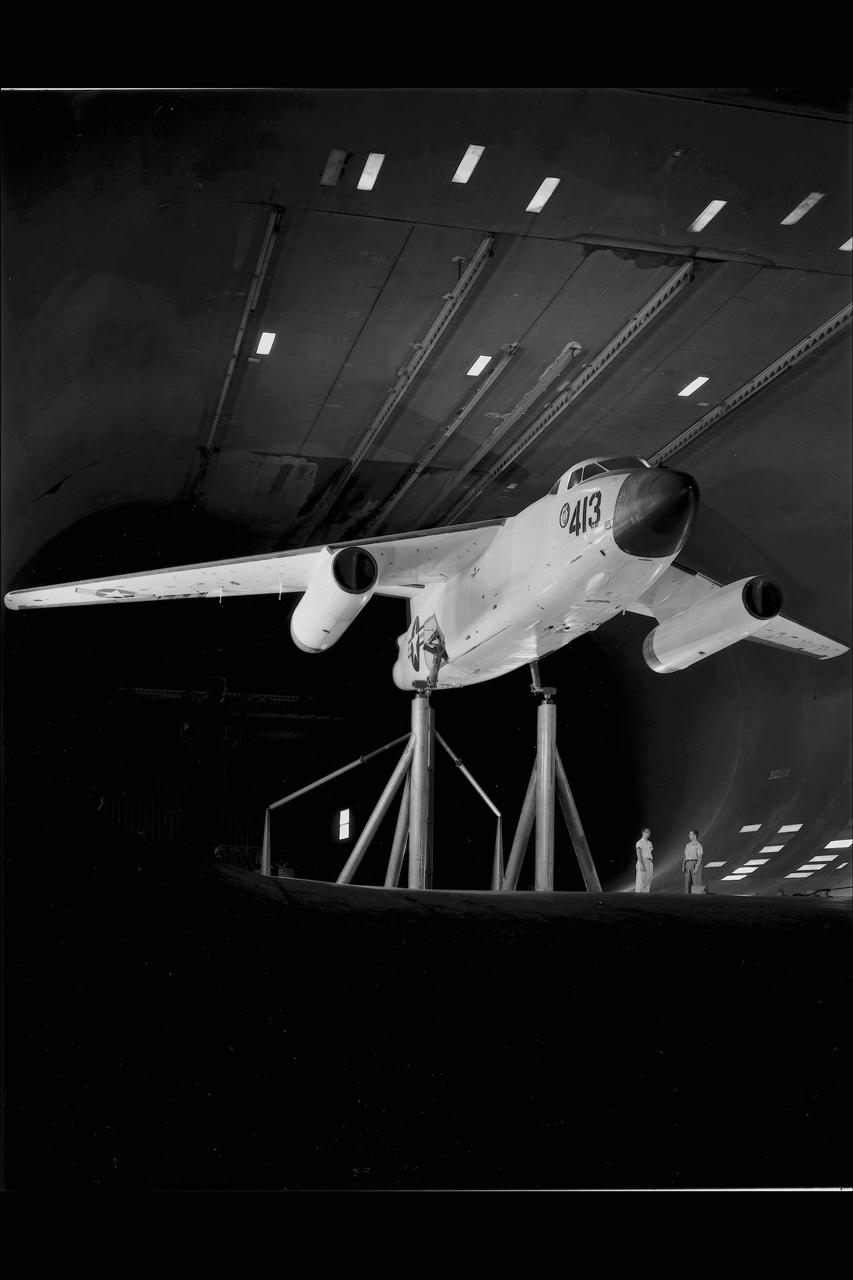
DOUGLAS XA3D-1 #413 AIRPLANE MOUNTED IN THE NACA AMES RESEARCH CENTER'S 40X80_FOOT SUBSONIC WIND TUNNEL sweptback wing Testing the wing boundary layer control of the A3D in the 40 x 80 wind tunnel. Boundary layer control was added to increase the lift of the wing for aircraft carrier take off and landing.
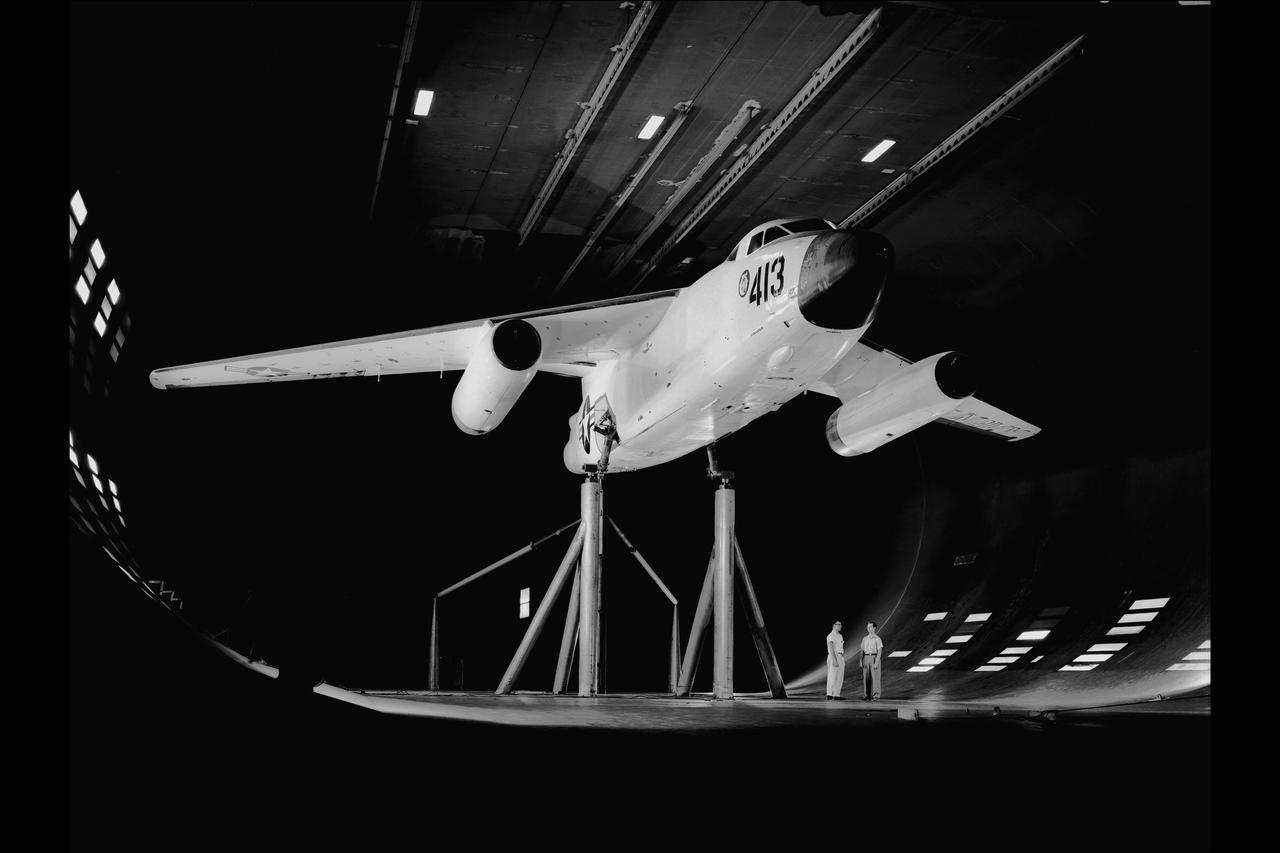
DOUGLAS XA3D-1 #413 AIRPLANE MOUNTED IN THE NACA AMES RESEARCH CENTER'S 40X80_FOOT SUBSONIC WIND TUNNEL Testing the boundary layer control of the A3D in the 40 x 80 wind tunnel. Boundary layer control was added to increase the lift of the wing for take off from an aircraft carrier.
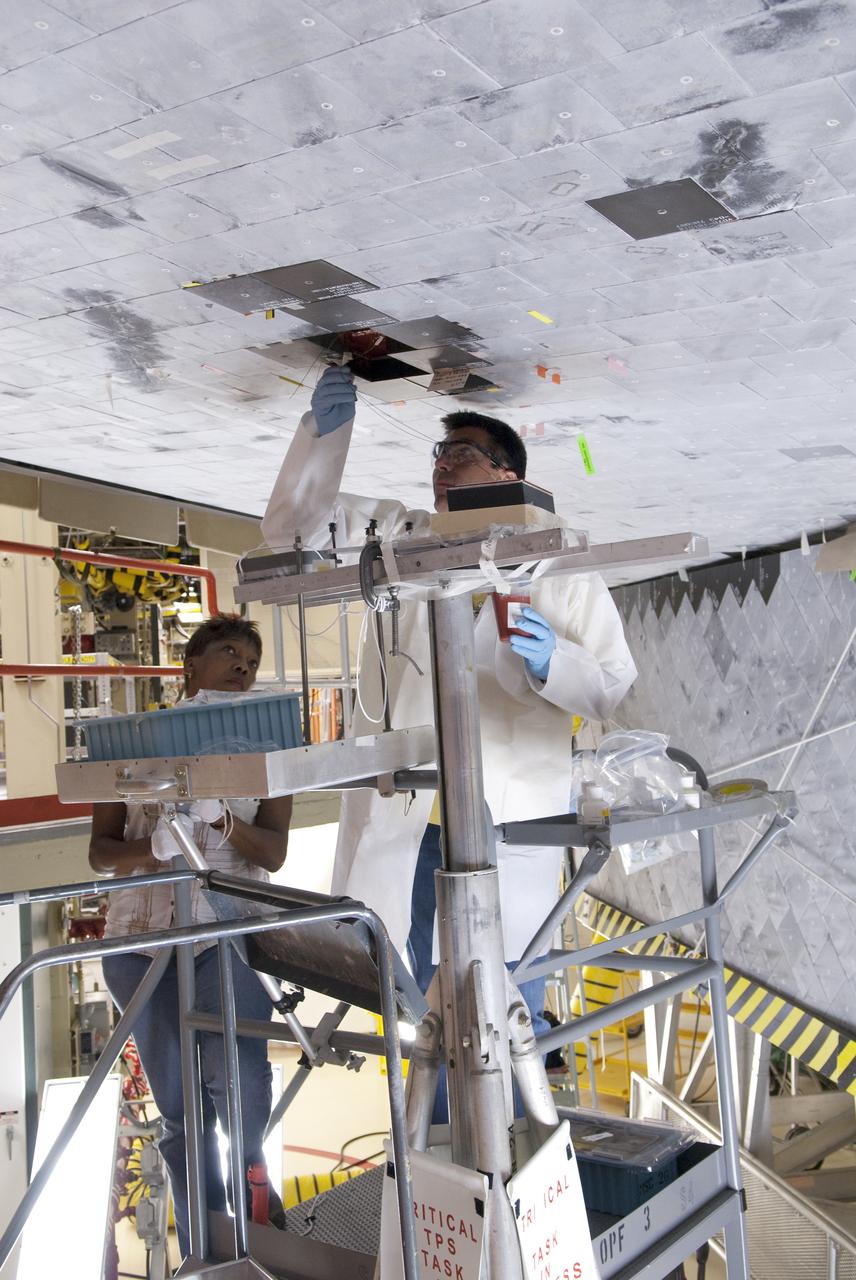
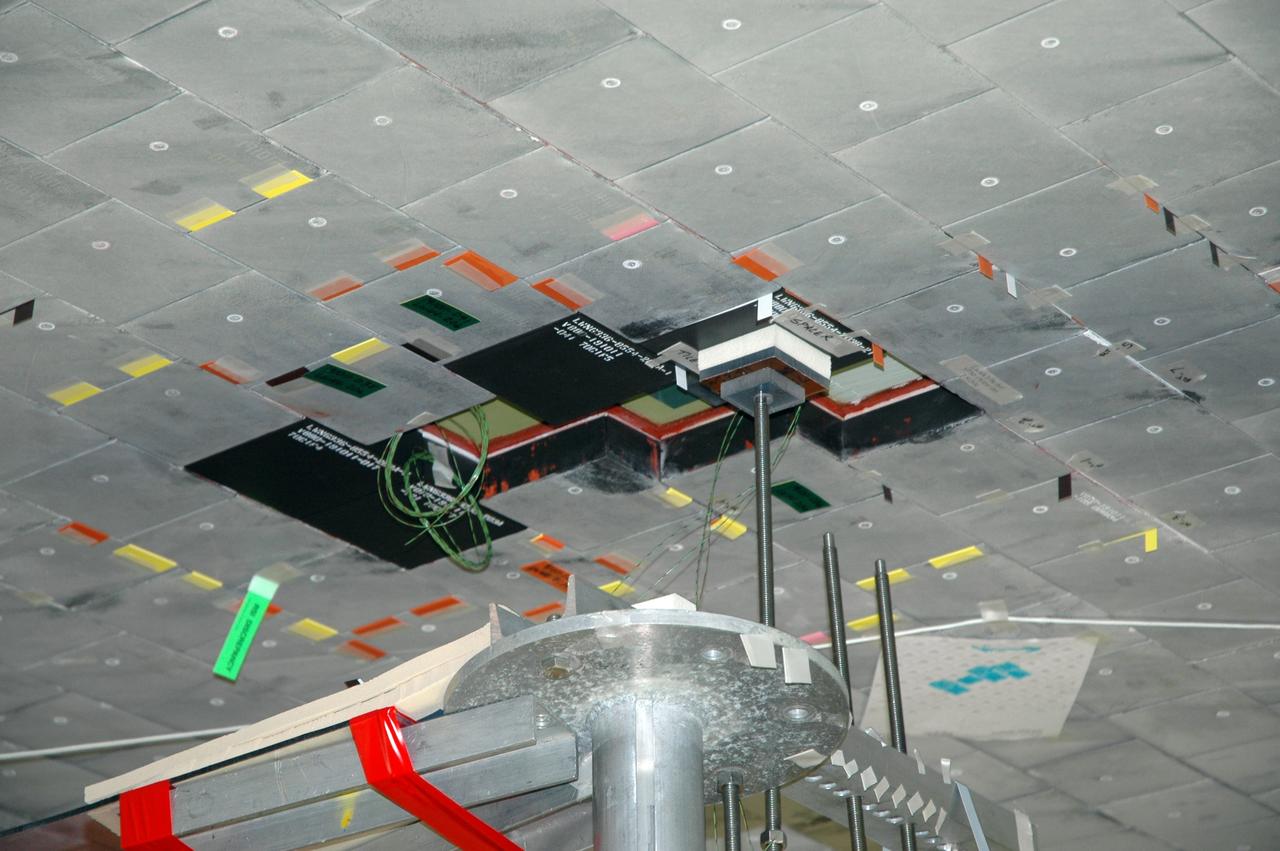
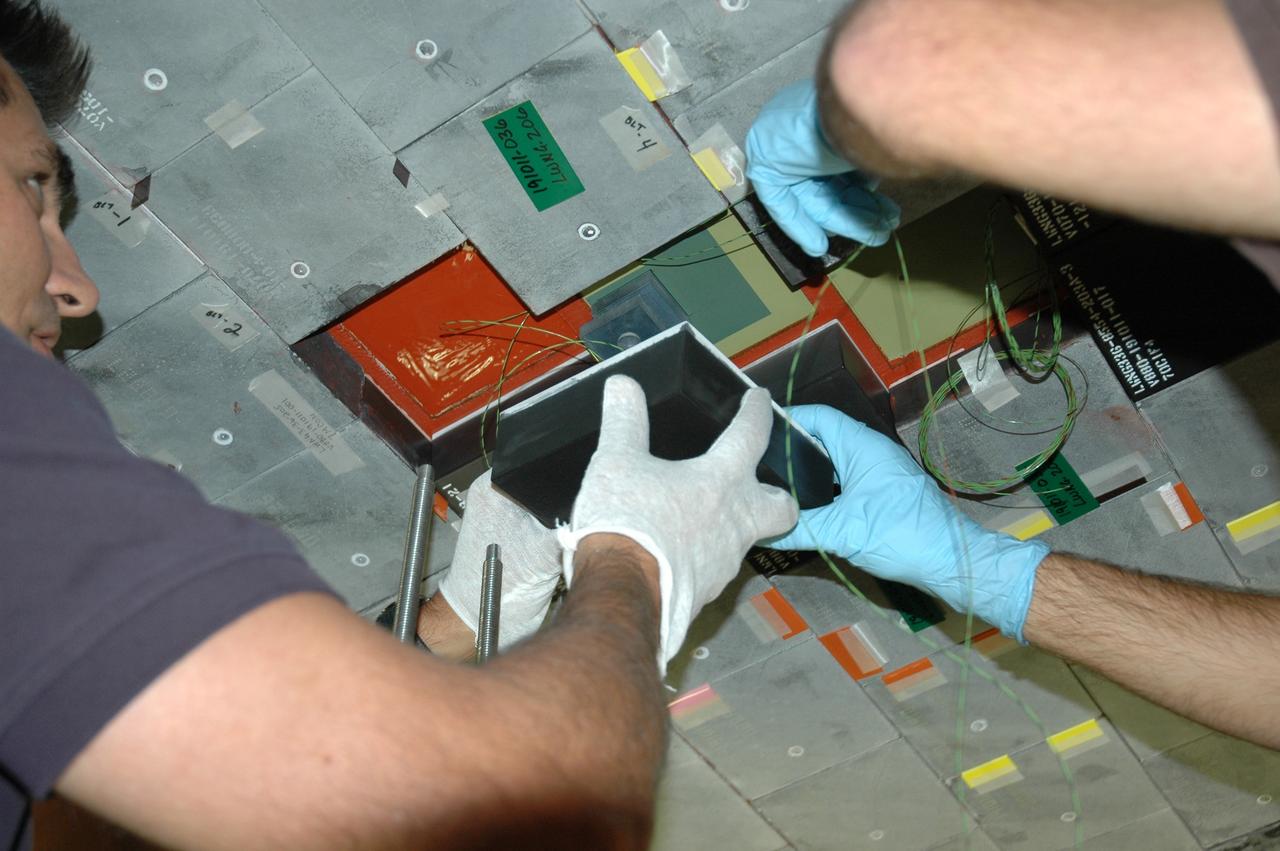
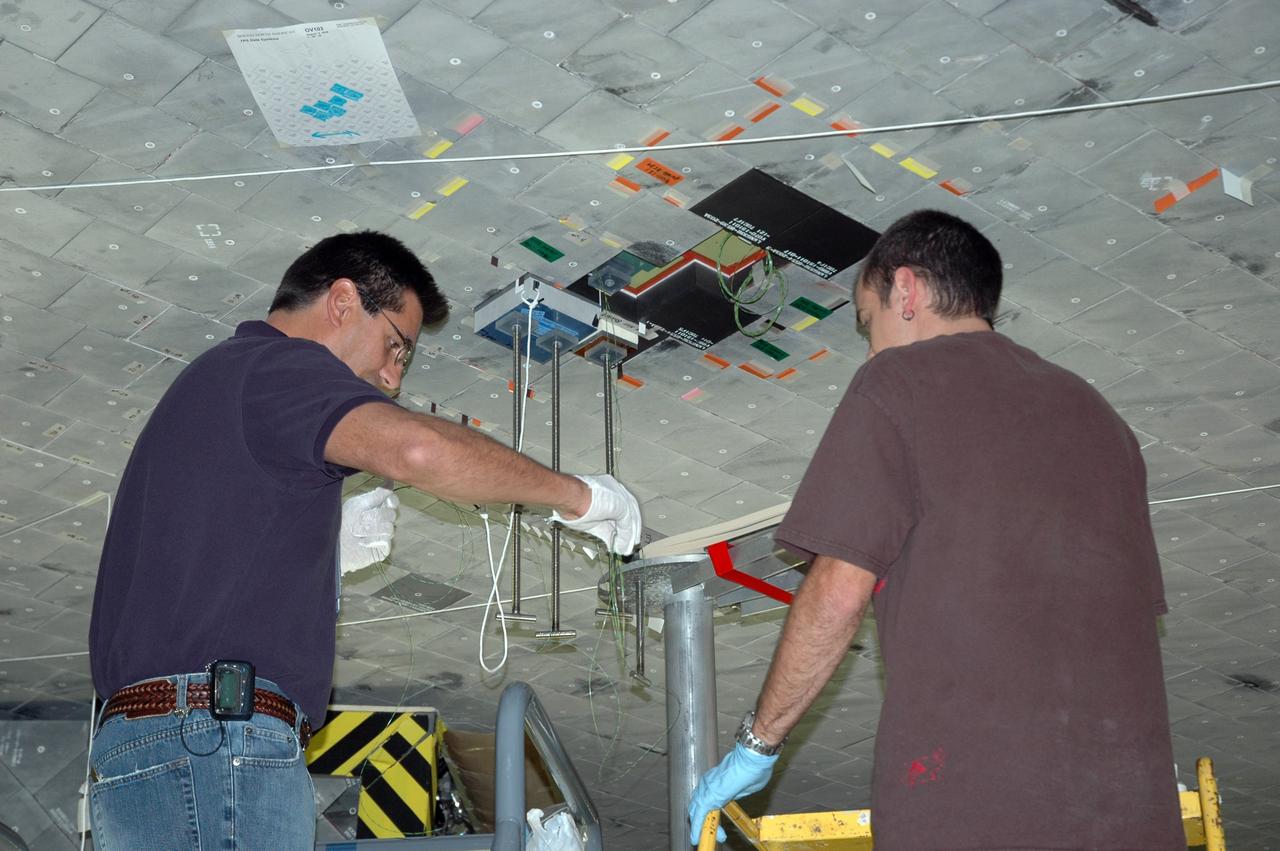
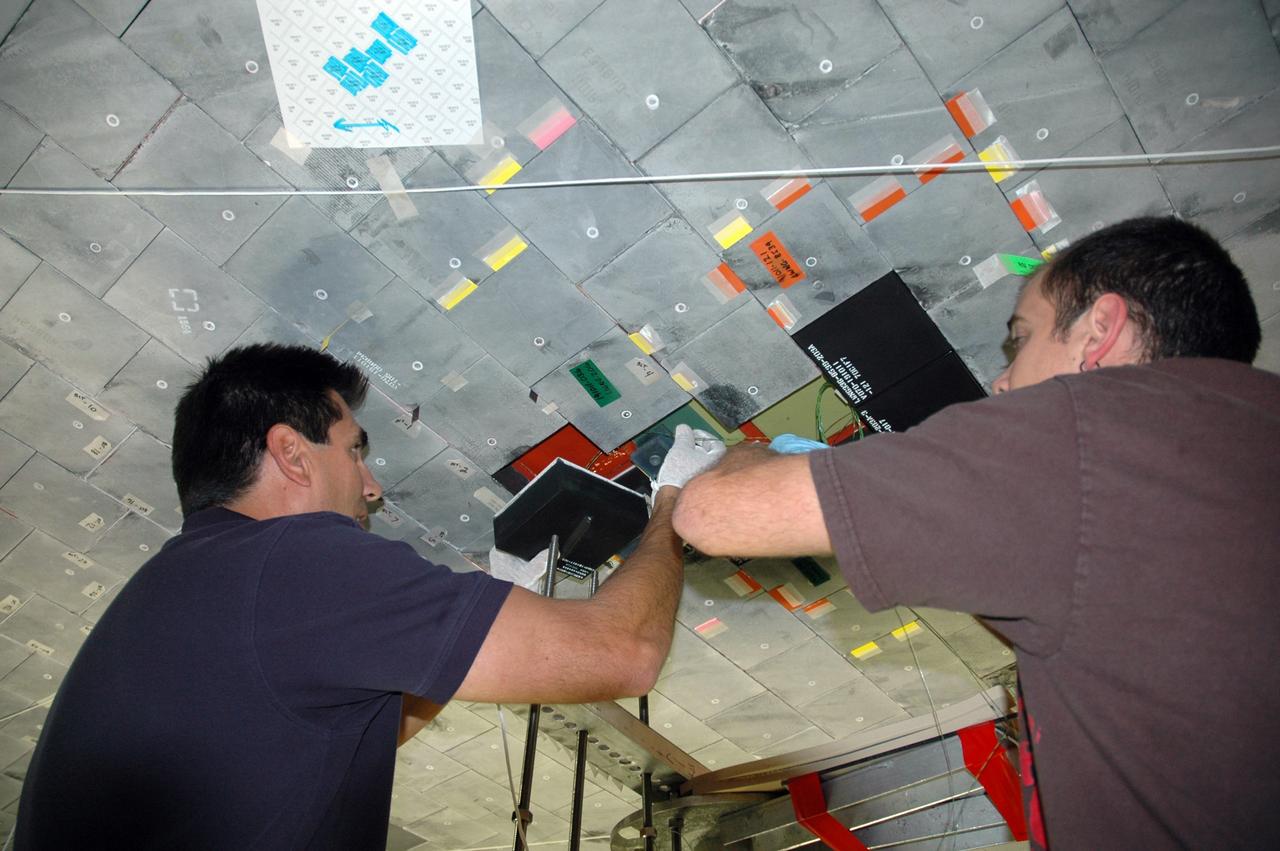
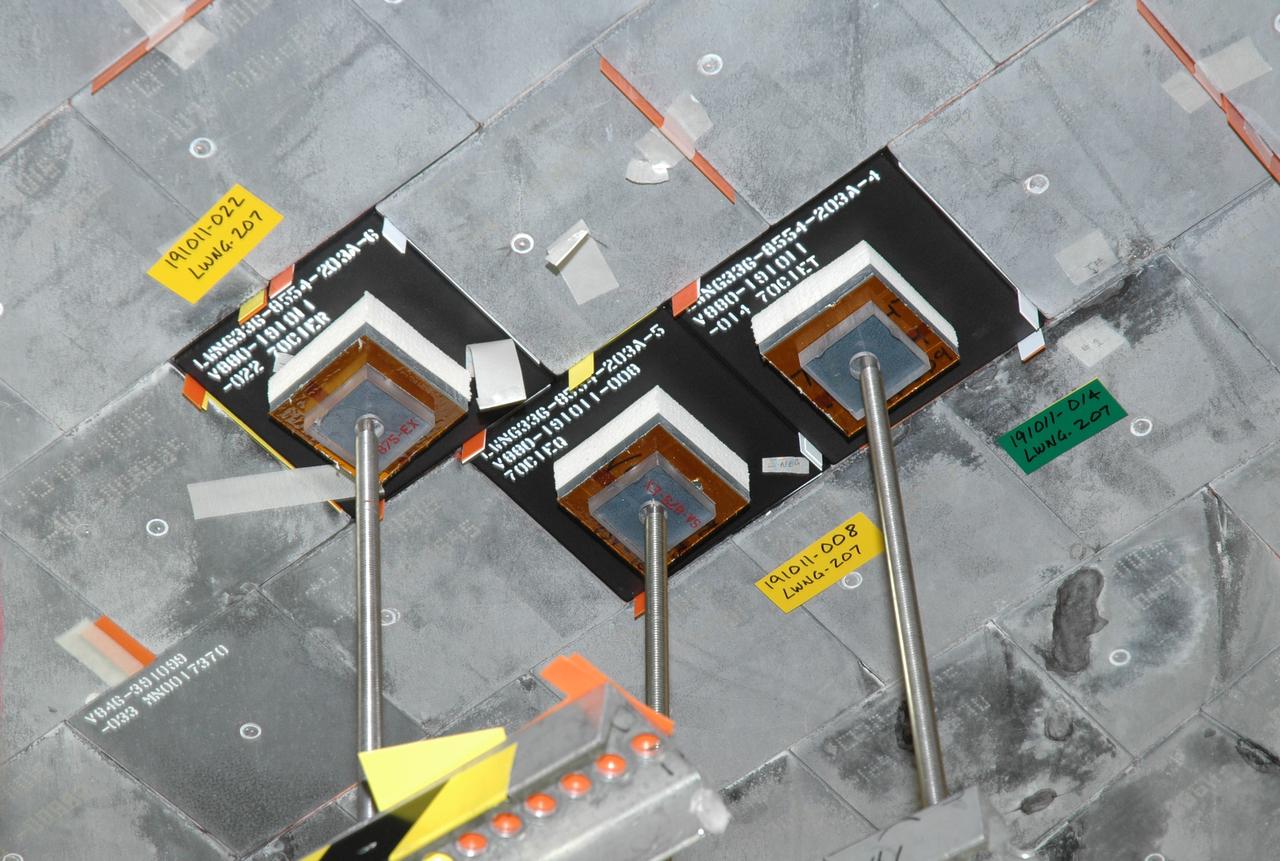
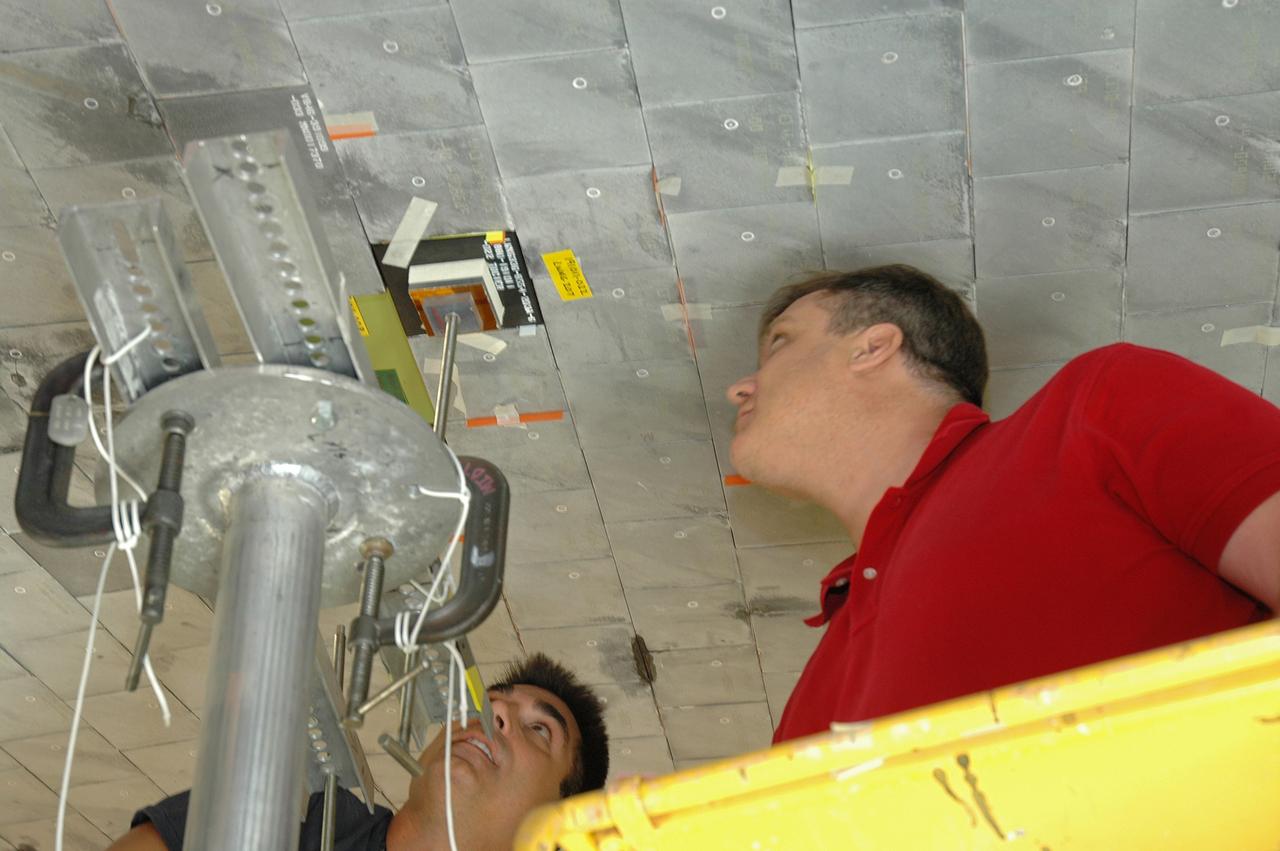
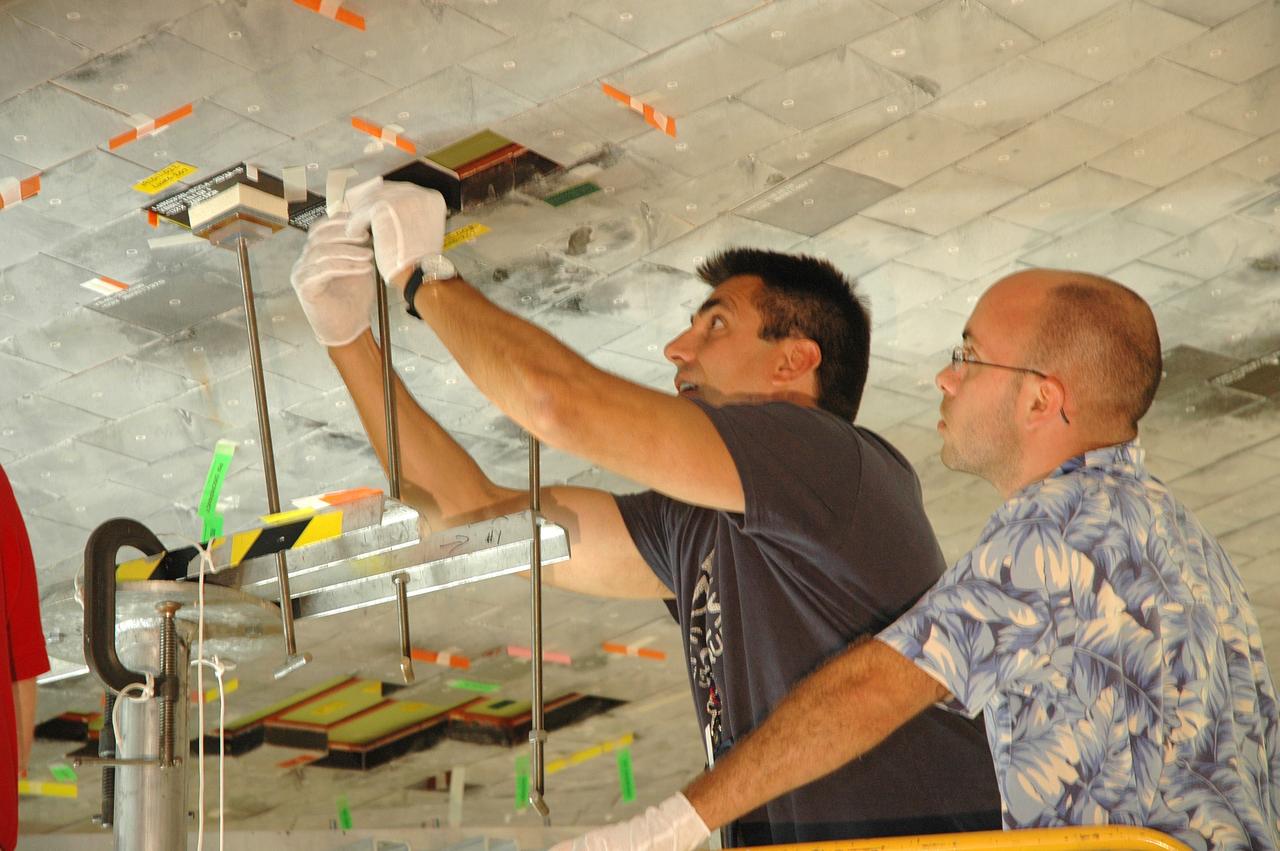
STS-133 DISCOVERY BOUNDARY LAYER TRANSITION TILE BONDING
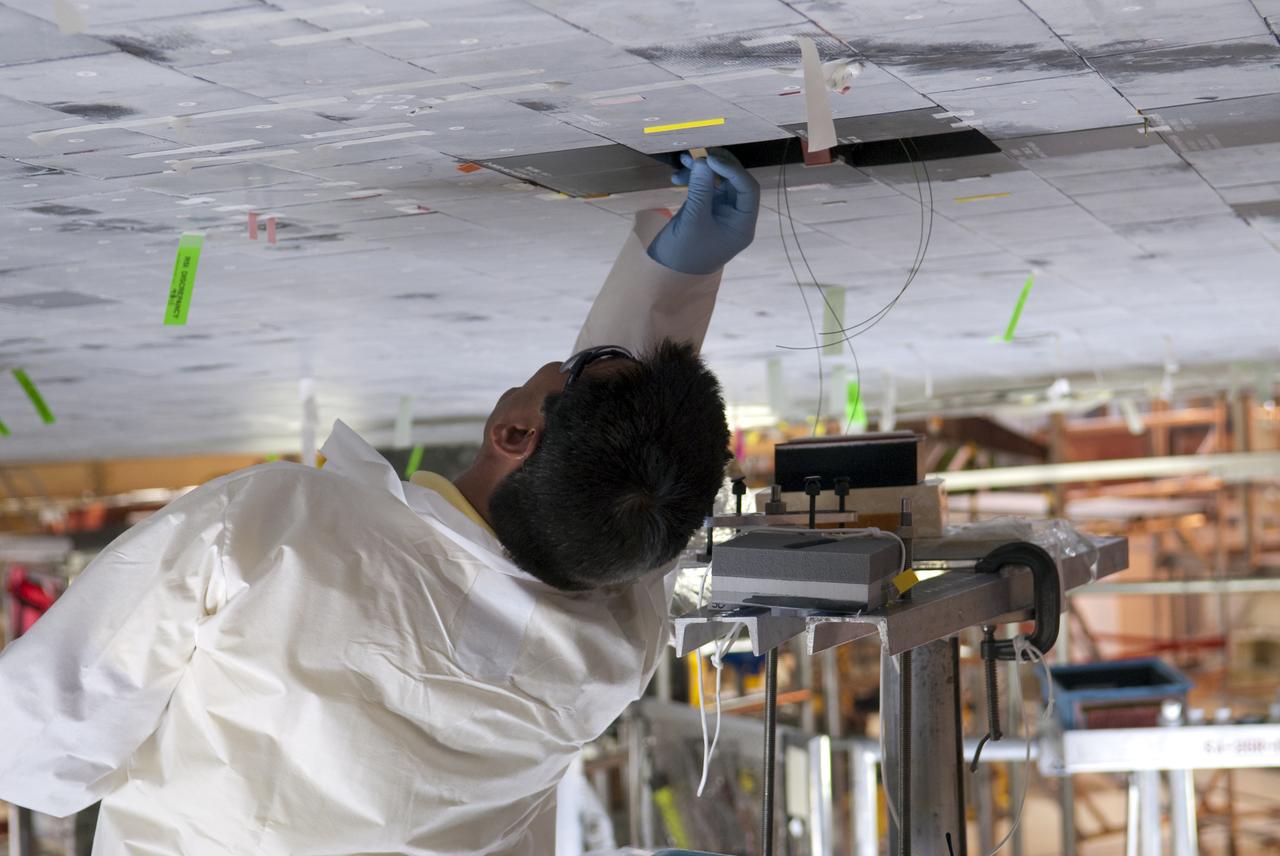
STS-133 DISCOVERY BOUNDARY LAYER TRANSITION TILE BONDING
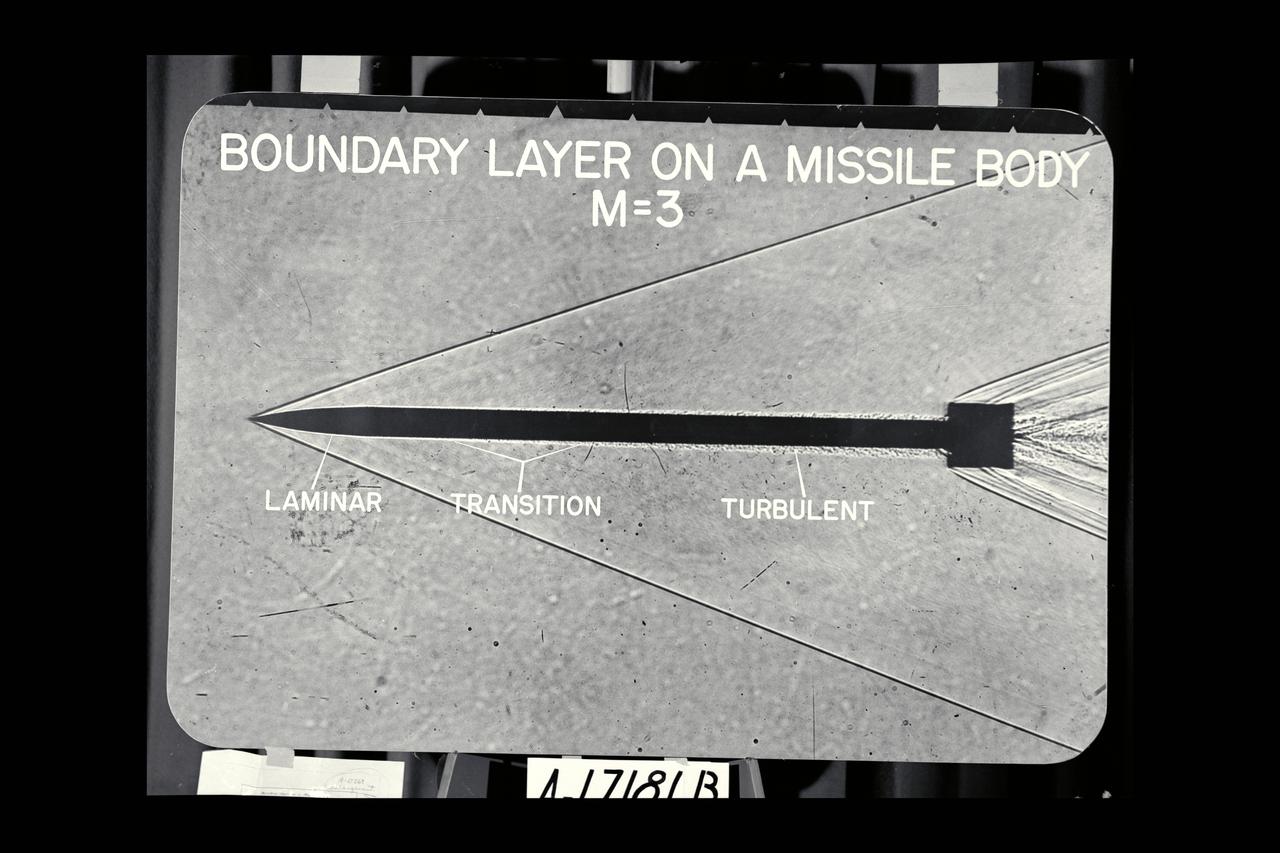
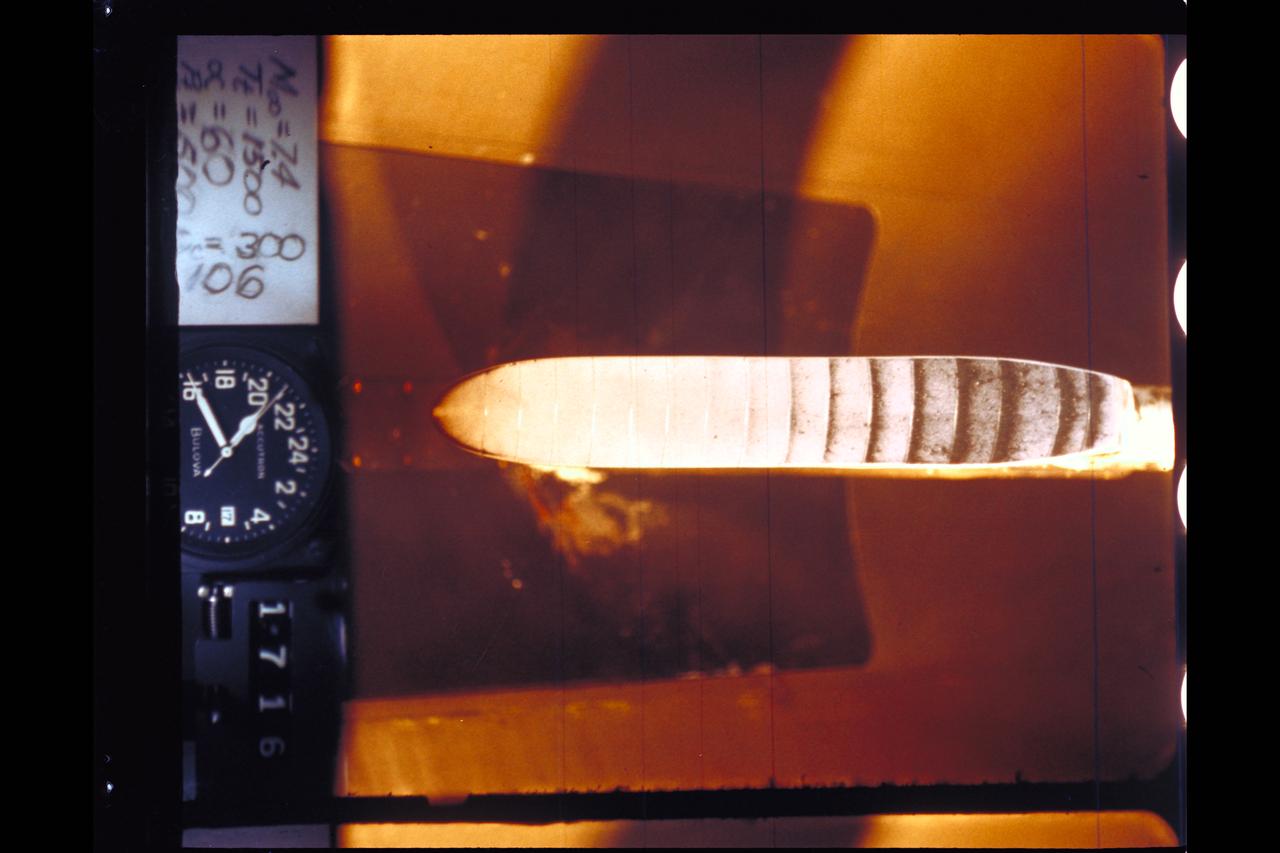
NACA Photographer Shadowgraph: Boundary Layer on Missile body @ M-3
STS-133 DISCOVERY BOUNDARY LAYER TRANSITION TILE BONDING
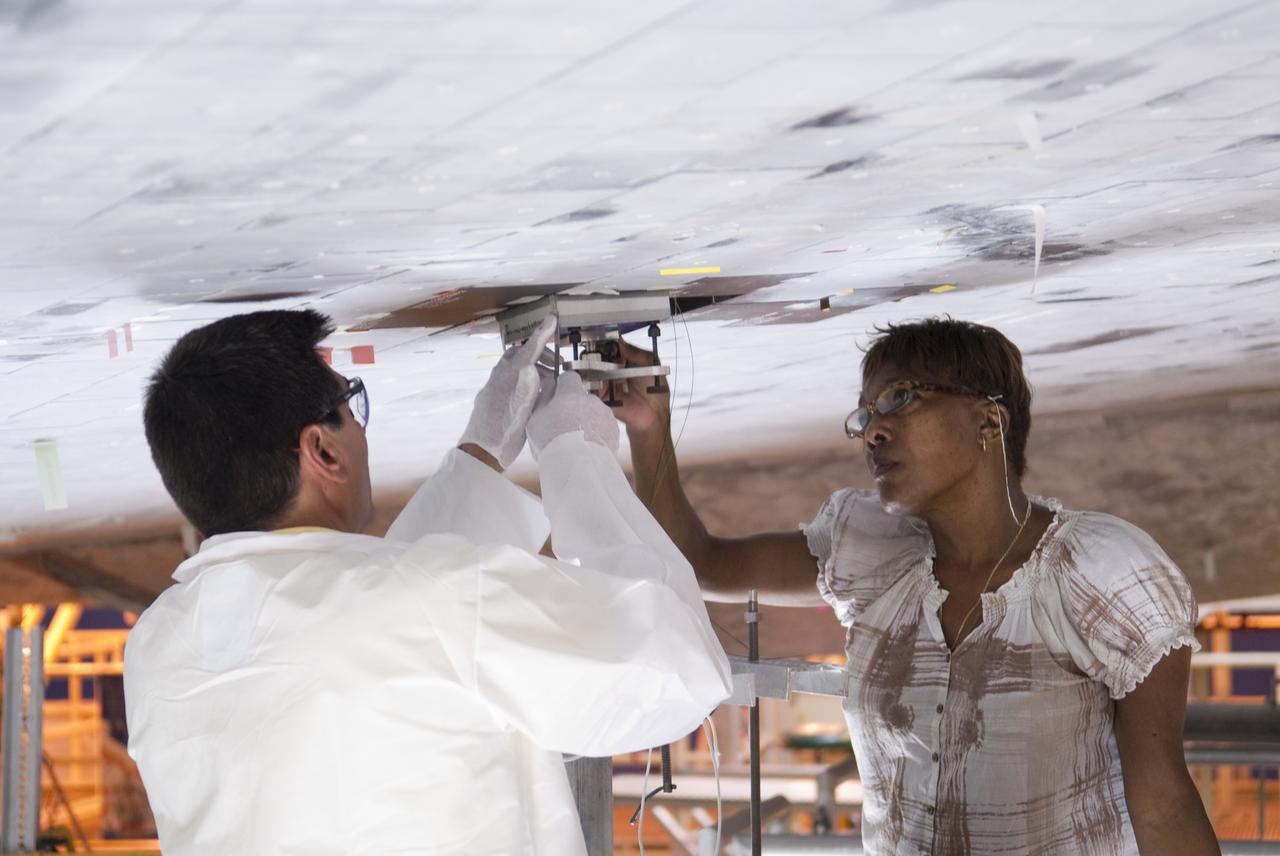
STS-133 DISCOVERY BOUNDARY LAYER TRANSITION TILE BONDING
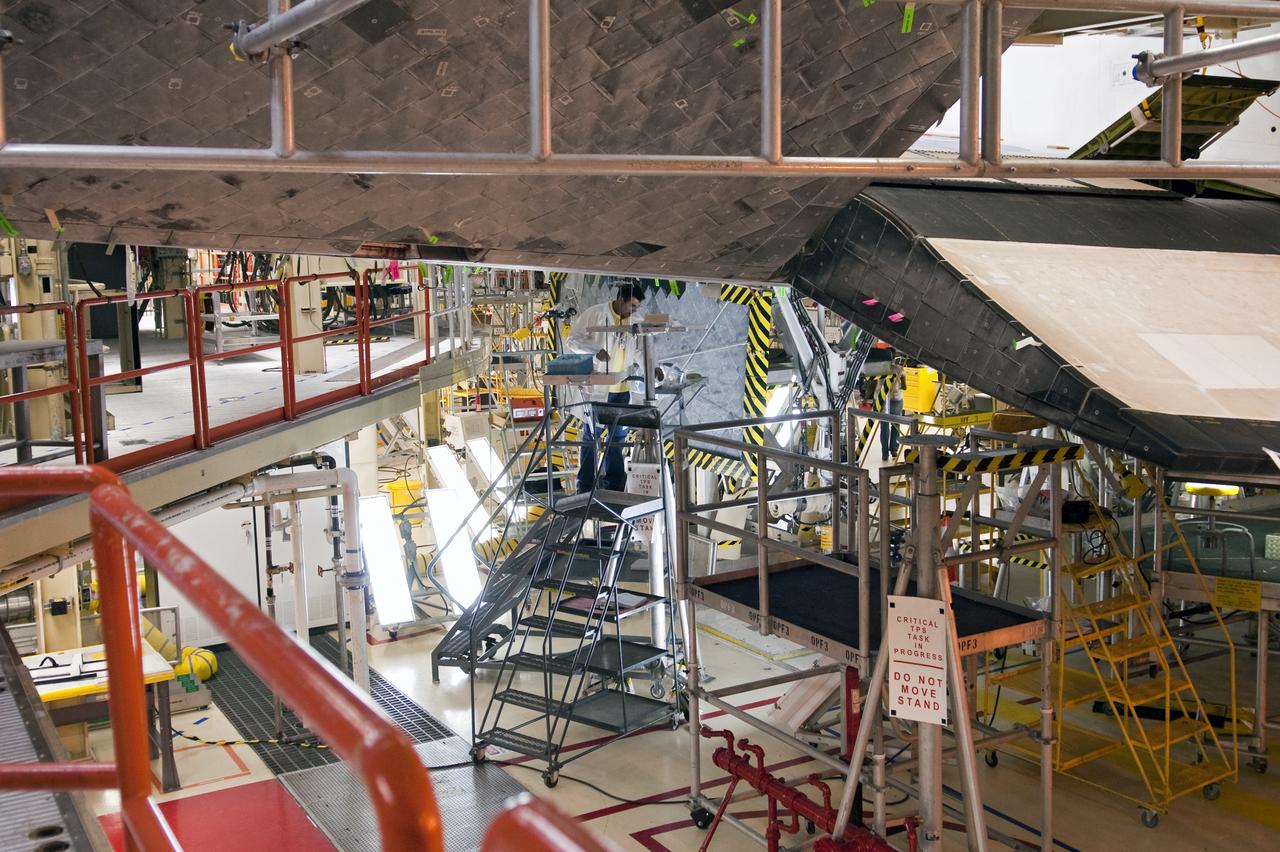
STS-133 DISCOVERY BOUNDARY LAYER TRANSITION TILE BONDING
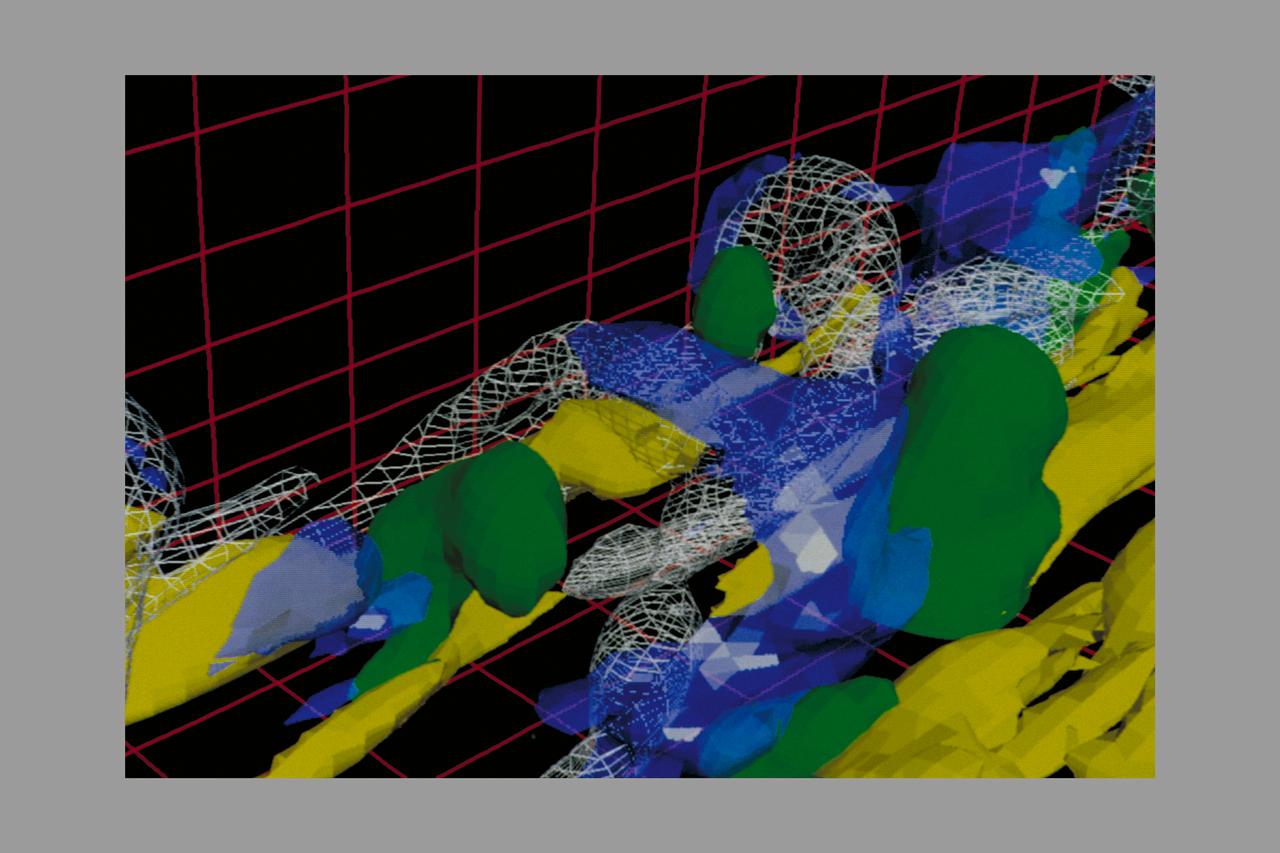
Photo by Dunn camera system Turbulence Physics in Numerical Simulated Boundary Layer - ER-2 simulated flight graphics
North American Space Shuttle Orbiter Model NA129 surface heating and boundary layer transition test in 3.5ft w.t.
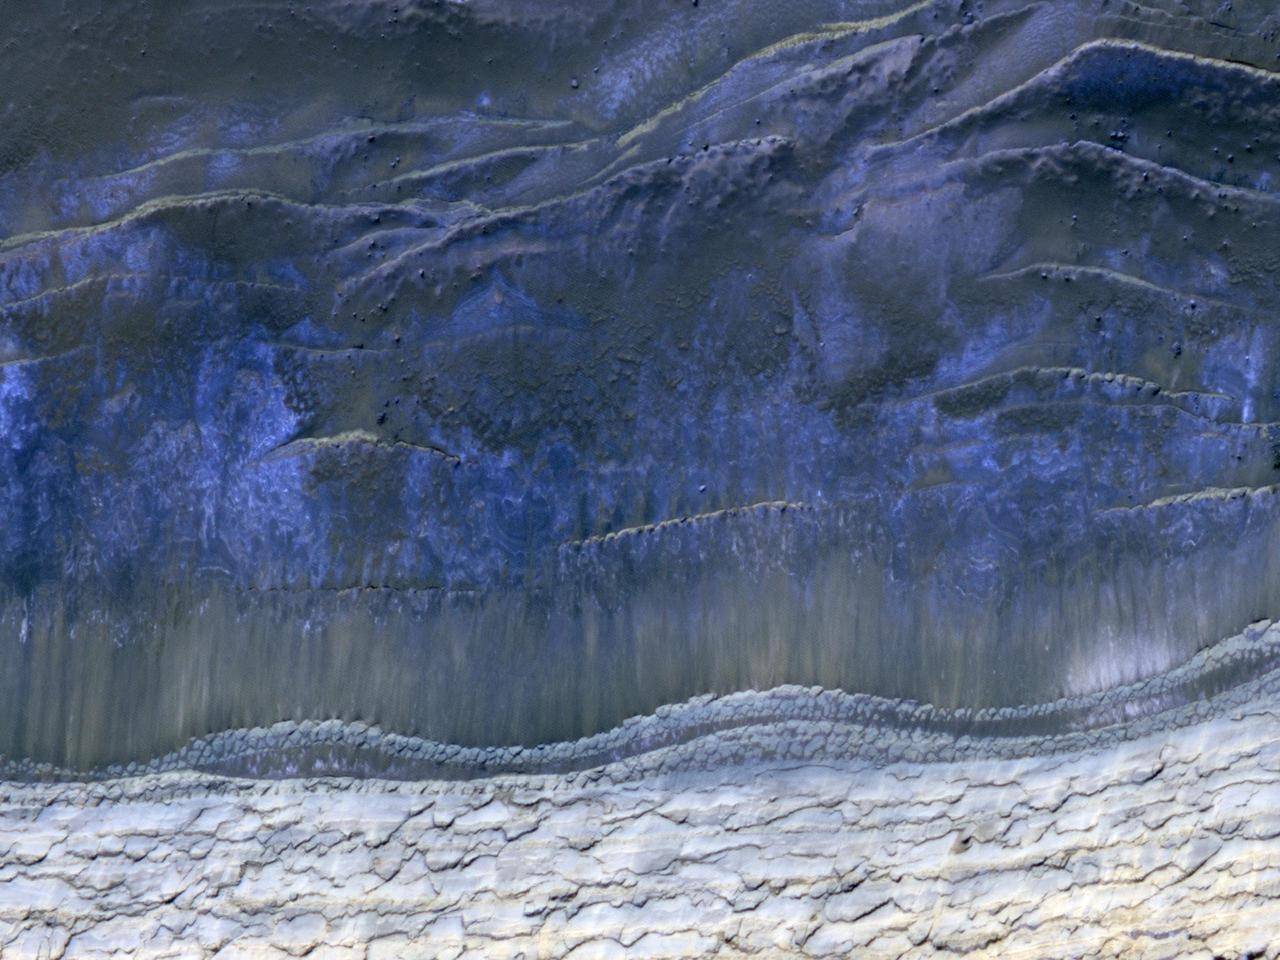
This image from NASA Mars Reconnaissance Orbiter shows the scarp that demarcates the boundary between layered deposits covering the north polar region and the lower surrounding terrain, which includes sand dunes. Original release date March 3, 2010.
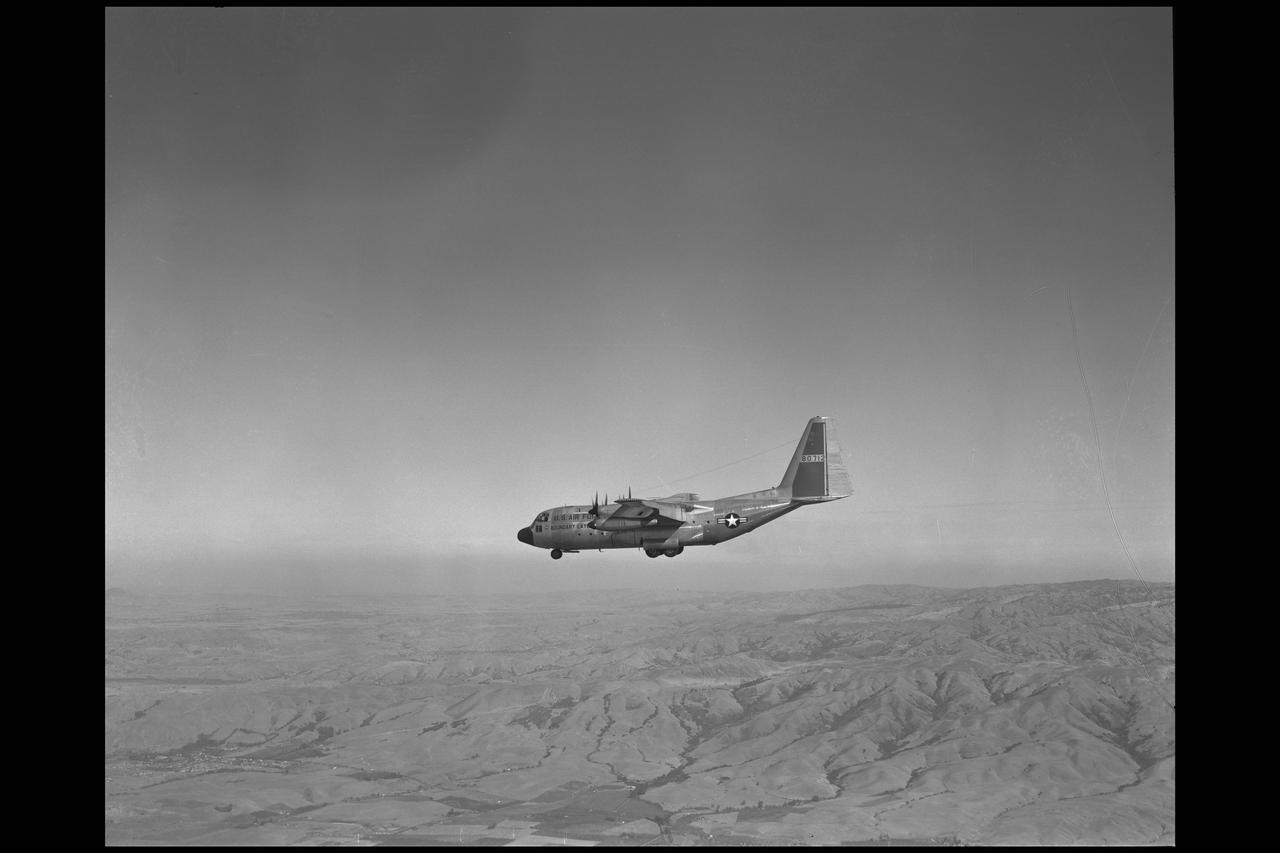
Lockheed NC-130B STOL turboprop-powered aircraft with ailerons drooped 30 degrees. Note trailing-edge flaps deflected 90 degrees for increased lift. Two T-56 turboshaft engines, which drove wing-mounted load compressors for boundary-layer control, are mounted on outboard wing pods. Landing approach speed was reduced 30 knots with boundary-layer control
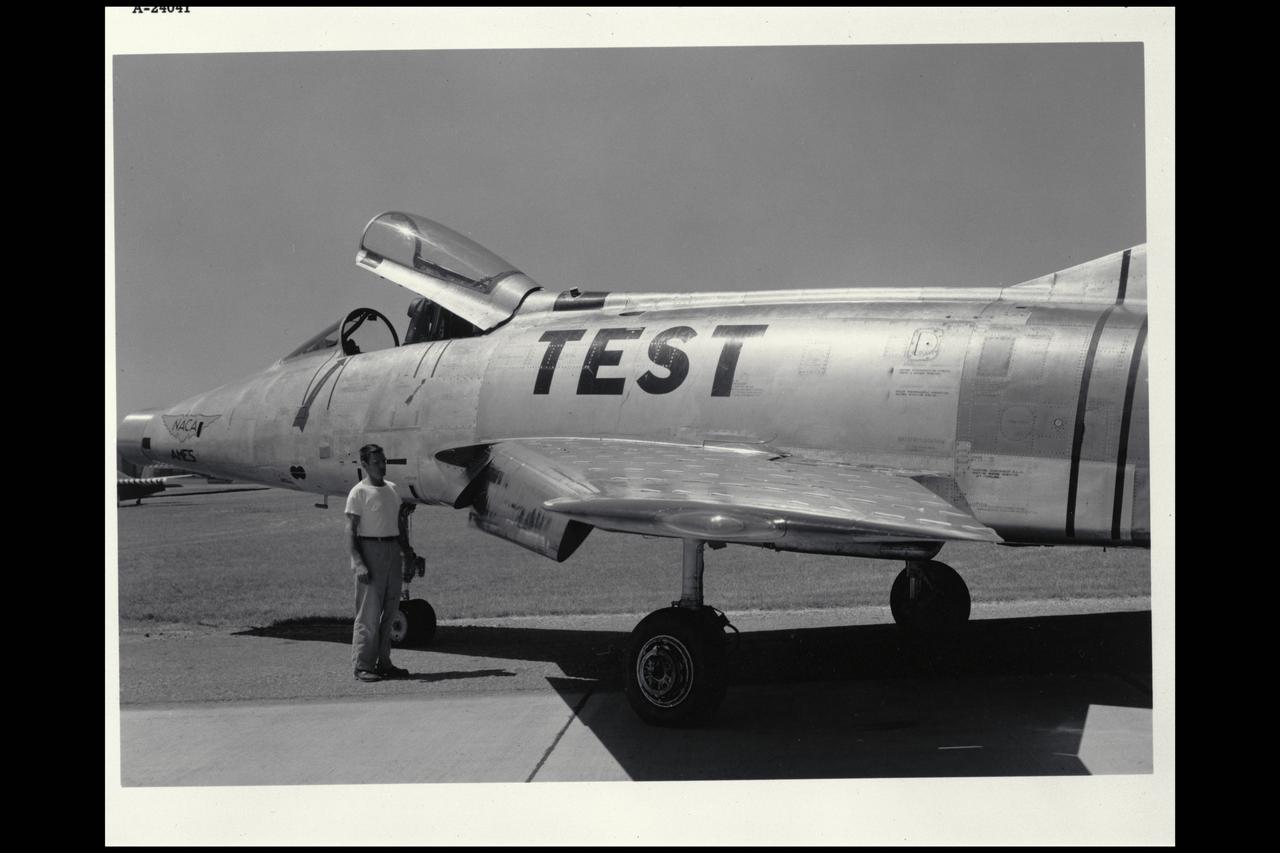
North American F-100A NASA-200 Super Sabre airplane - wing leading edge deflected 60 degrees for increased lift with boundary=layer control; takeoff preformance was improved 10% (mar 1960)
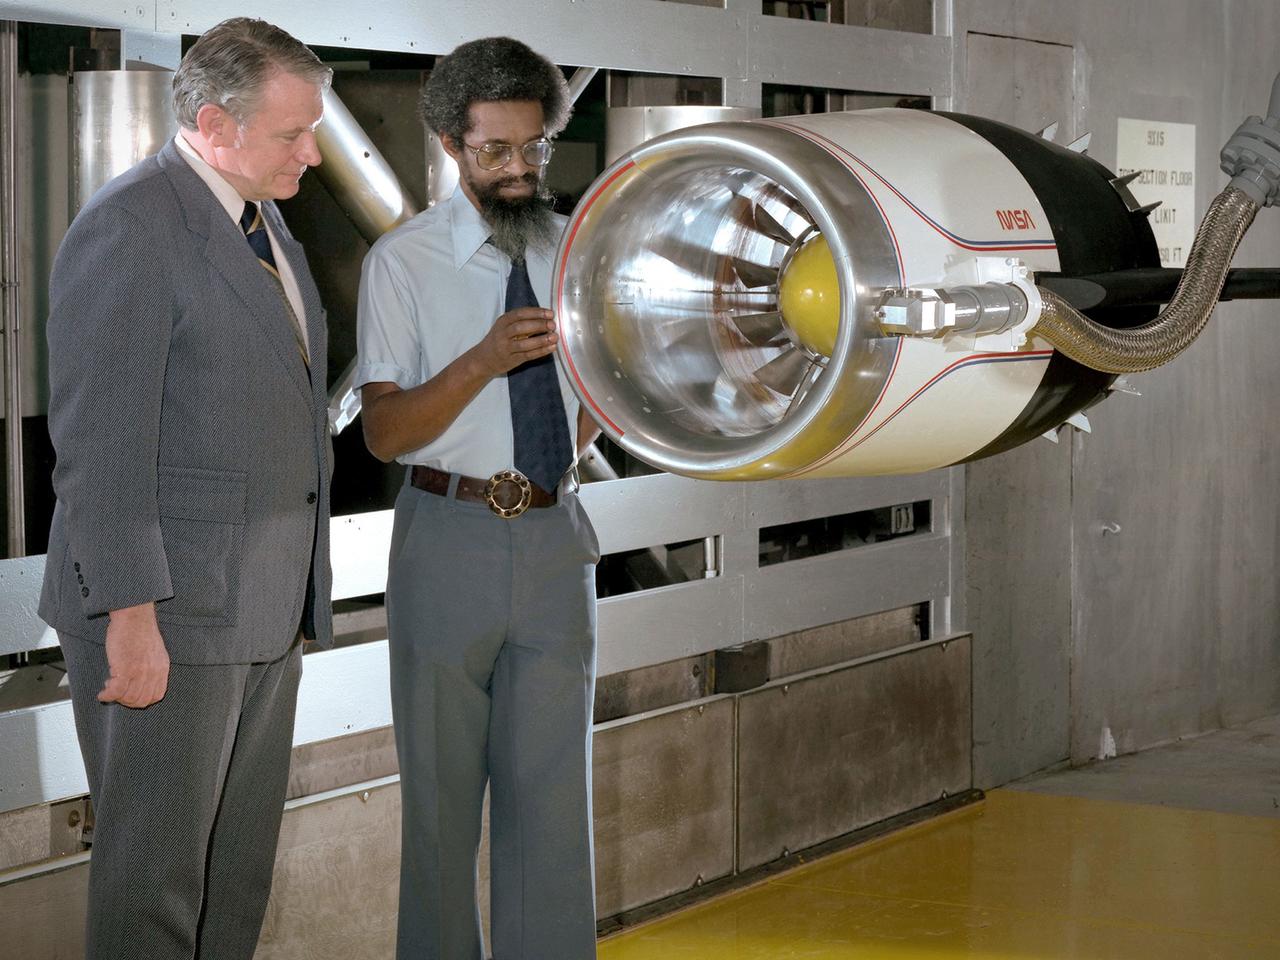
Center Director John McCarthy, left, and researcher Al Johns pose with a one-third scale model of a Grumman Aerospace tilt engine nacelle for Vertical and Short Takeoff and Landing (V/STOL) in the 9- by 15-Foot Low Speed Wind Tunnel at the National Aeronautics and Space Administration (NASA) Lewis Research Center. Lewis researchers had been studying tilt nacelle and inlet issues for several years. One area of concern was the inlet flow separation during the transition from horizontal to vertical flight. The separation of air flow from the inlet’s internal components could significantly stress the fan blades or cause a loss of thrust. In 1978 NASA researchers Robert Williams and Al Johns teamed with Grumman’s H.C. Potonides to develop a series of tests in the Lewis 9- by 15-foot tunnel to study a device designed to delay the flow separation by blowing additional air into the inlet. A jet of air, supplied through the hose on the right, was blown over the inlet surfaces. The researchers verified that the air jet slowed the flow separation. They found that the blowing on boundary layer control resulted in a doubling of the angle-of-attack and decreases in compressor blade stresses and fan distortion. The tests were the first time the concept of blowing air for boundary layer control was demonstrated. Boundary layer control devices like this could result in smaller and lighter V/STOL inlets.
This image from NASA's Curiosity Mars rover reveals details of a bedrock discoloration pattern at a site between "Marias Pass" and "Bridger Basin." The discoloration is not associated with individual layers. It crosses layers and shows clear horizontal boundaries to the darker toned bedrock. This suggests it is related to alteration by fluids that flowed through fractures and permeated into the bedrock. The image was taken by the right-eye (telephoto) camera of the rover's Mast Camera instrument on Sept. 2, 2015, during the mission's 1,092nd Martian day, or sol. http://photojournal.jpl.nasa.gov/catalog/PIA20269
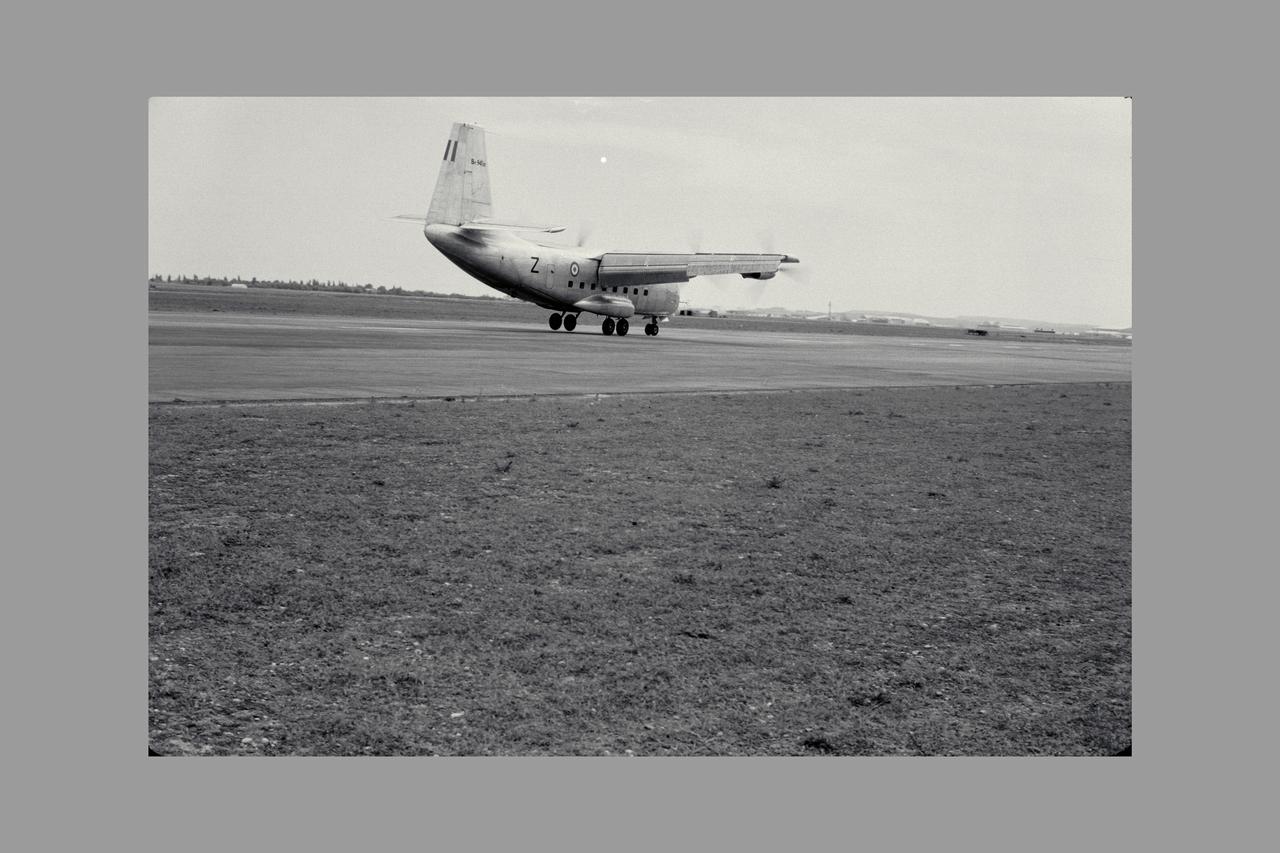
3/4 REAR VIEW OF Breguet 941 AIRPLANE; FLIGHT EVALUATION, MAY 1963. Boundary Layer Control, STOL, and V/STOL Research. Fig. 105 NASA SP Flight Research at Ames: 57 Years of Development and Validation of Aeronautical Technology
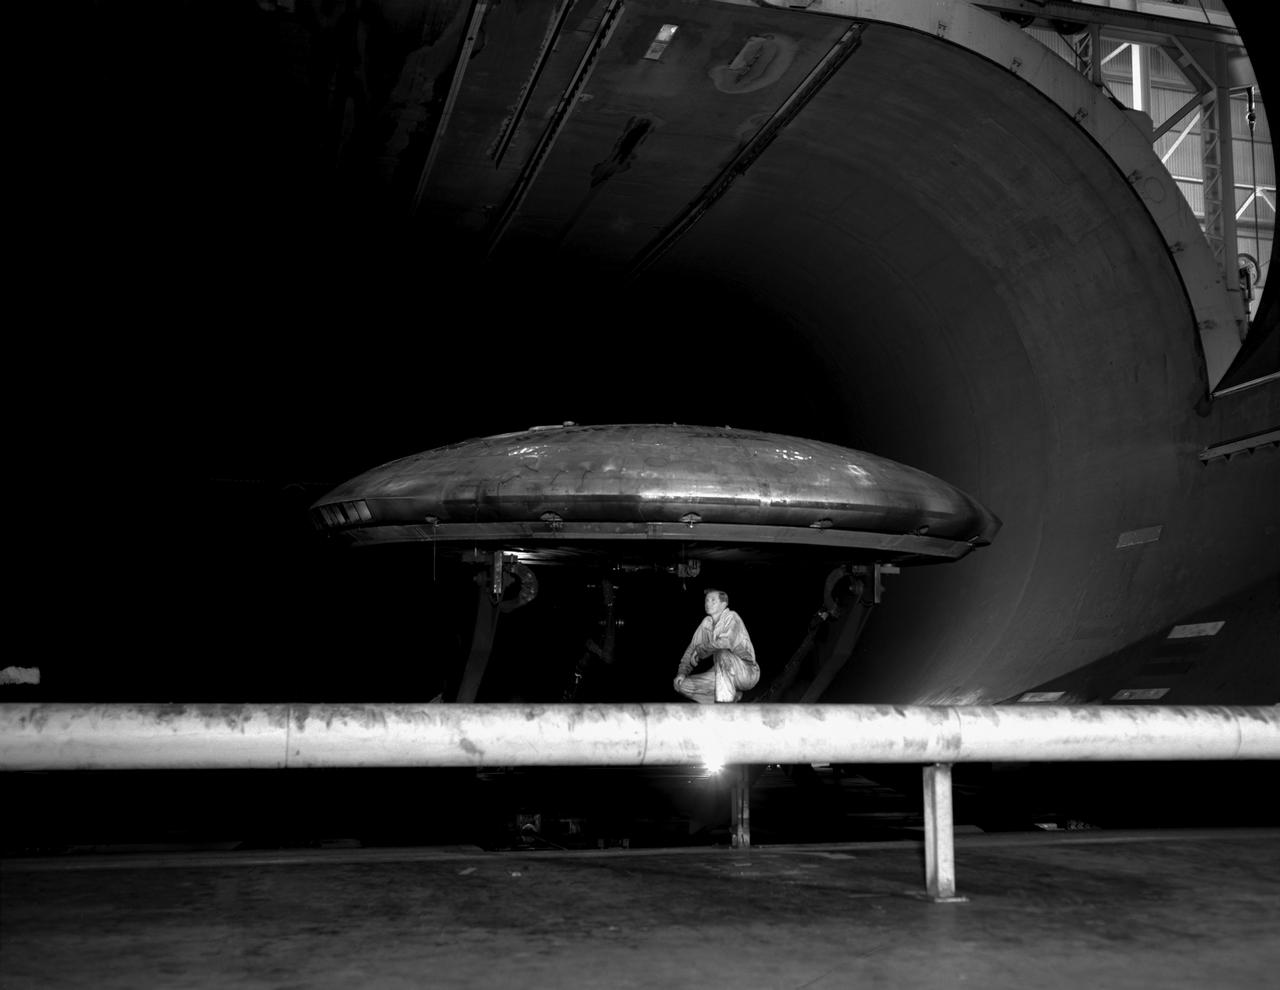
3/4 front view of Avrocar without tail, showing ground board and variable height struts. The ground board minimizes the boundary layer on the floor under the model. black and white negative: KODAK T-MAX 100 Professional. SBA settings neutral SBA on, color SBA on
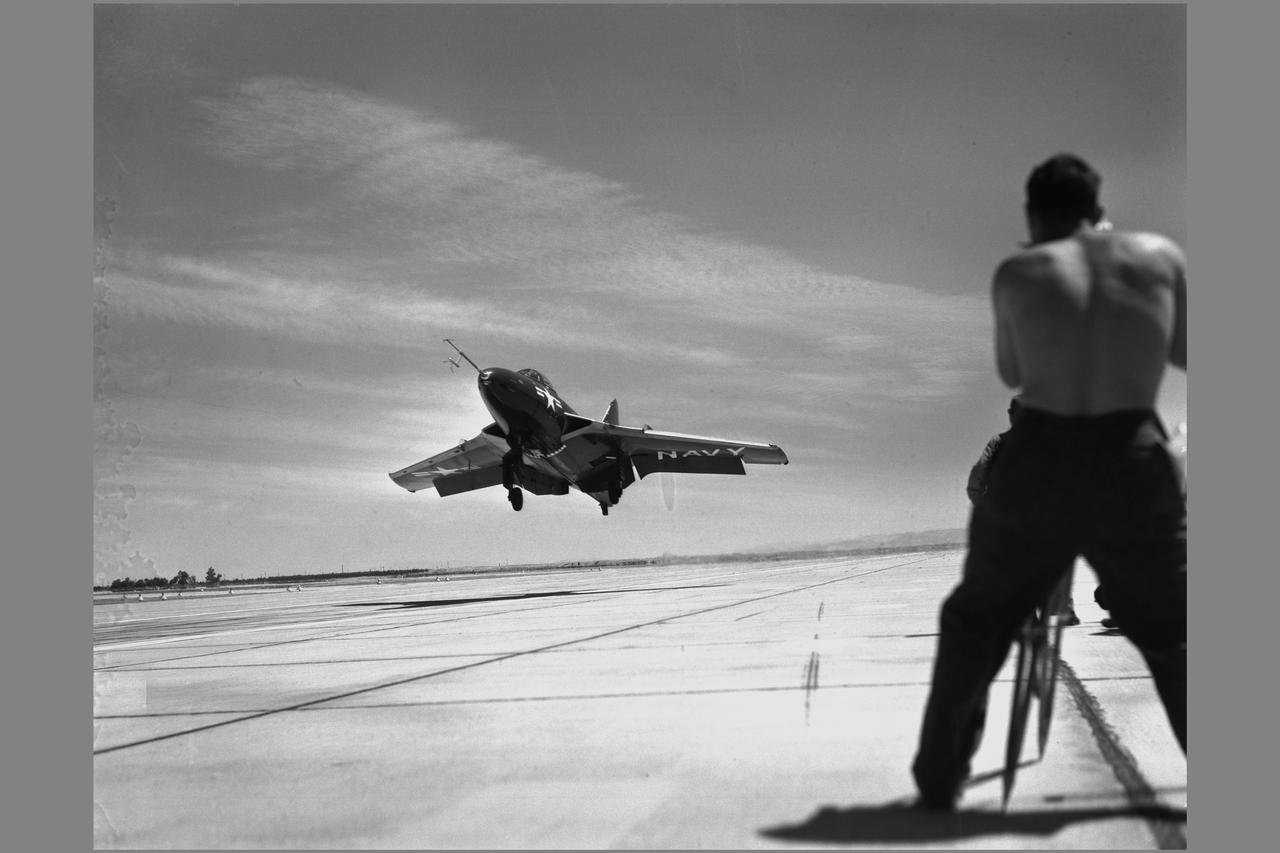
Grumman F9F-6 (Bu. No. 128138) Cougar airplane. EVALUATION OF CARRIER APPROACH TECHNIQUES Boundary Layer Control, STOL, and V/STOL Note: Used in publication in Flight Research at Ames; 57 Years of Development and Validation of Aeronautical Technology NASA SP-1998-3300 fig. 101
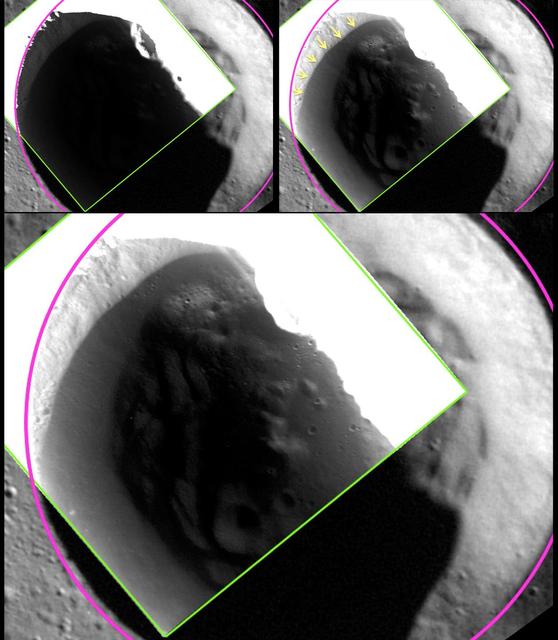
The image shown here was acquired at 24 m/pixel, the highest resolution that has been obtained for any of Mercury's shadowed polar craters. The top left panel shows a view of an unnamed crater in Mercury's north polar region, with the crater rim outlined in pink and the edge of the 24-meter/pixel, low-altitude broadband MDIS image in green. In the large bottom panel, a different stretch has been applied to the same MDIS broadband image, revealing details of the shadowed surface inside the crater. In particular, as highlighted with yellow arrows in the top right panel, the image reveals a region inside the crater that has a lower reflectance. The edge of the low-reflectance region has a sharp and well-defined boundary, even as imaged at this highest resolution of 24 m/pixel. The sharp boundary suggests that the low-reflectance material is sufficiently young to have preserved a sharp boundary against lateral mixing by impact craters. The sharp boundary matches the location predicted by temperature models for the stability of a surficial layer of volatile, organic-rich material tens of centimeters thick that overlies a thicker layer of water ice. http://photojournal.jpl.nasa.gov/catalog/PIA19253
CAPE CANAVERAL, Fla. - In Orbiter Processing Facility bay 3 at NASA's Kennedy Space Center in Florida, boundary layer transition, or BLT, tile is being affixed to space shuttle Discovery before its launch on the STS-119 mission in February 2009. The specially modified tiles and instrumentation package will monitor the heating effects of early re-entry boundary layer transition at high mach numbers. These data support analytical modeling and design efforts for both the space shuttles and NASA next-generation spacecraft, the Orion crew exploration vehicle. On the STS-119 mission, Discovery also will carry the S6 truss segment to complete the 361-foot-long backbone of the International Space Station. The truss includes the fourth pair of solar array wings and electronics that convert sunlight to power for the orbiting laboratory. Photo credit: NASA/Tim Jacobs
CAPE CANAVERAL, Fla. - In Orbiter Processing Facility bay 3 at NASA's Kennedy Space Center in Florida, workers attach boundary layer transition, or BLT, tile to space shuttle Discovery before its launch on the STS-119 mission in February 2009. The specially modified tiles and instrumentation package will monitor the heating effects of early re-entry boundary layer transition at high mach numbers. These data support analytical modeling and design efforts for both the space shuttles and NASA next-generation spacecraft, the Orion crew exploration vehicle. On the STS-119 mission, Discovery also will carry the S6 truss segment to complete the 361-foot-long backbone of the International Space Station. The truss includes the fourth pair of solar array wings and electronics that convert sunlight to power for the orbiting laboratory. Photo credit: NASA/Tim Jacobs
CAPE CANAVERAL, Fla. - In Orbiter Processing Facility bay 3 at NASA's Kennedy Space Center in Florida, workers attach boundary layer transition, or BLT, tile to space shuttle Discovery before its launch on the STS-119 mission in February 2009. The specially modified tiles and instrumentation package will monitor the heating effects of early re-entry boundary layer transition at high mach numbers. These data support analytical modeling and design efforts for both the space shuttles and NASA next-generation spacecraft, the Orion crew exploration vehicle. On the STS-119 mission, Discovery also will carry the S6 truss segment to complete the 361-foot-long backbone of the International Space Station. The truss includes the fourth pair of solar array wings and electronics that convert sunlight to power for the orbiting laboratory. Photo credit: NASA/Tim Jacobs
CAPE CANAVERAL, Fla. - In Orbiter Processing Facility bay 3 at NASA's Kennedy Space Center in Florida, workers attach boundary layer transition, or BLT, tile to space shuttle Discovery before its launch on the STS-119 mission in February 2009. The specially modified tiles and instrumentation package will monitor the heating effects of early re-entry boundary layer transition at high mach numbers. These data support analytical modeling and design efforts for both the space shuttles and NASA next-generation spacecraft, the Orion crew exploration vehicle. On the STS-119 mission, Discovery also will carry the S6 truss segment to complete the 361-foot-long backbone of the International Space Station. The truss includes the fourth pair of solar array wings and electronics that convert sunlight to power for the orbiting laboratory. Photo credit: NASA/Tim Jacobs
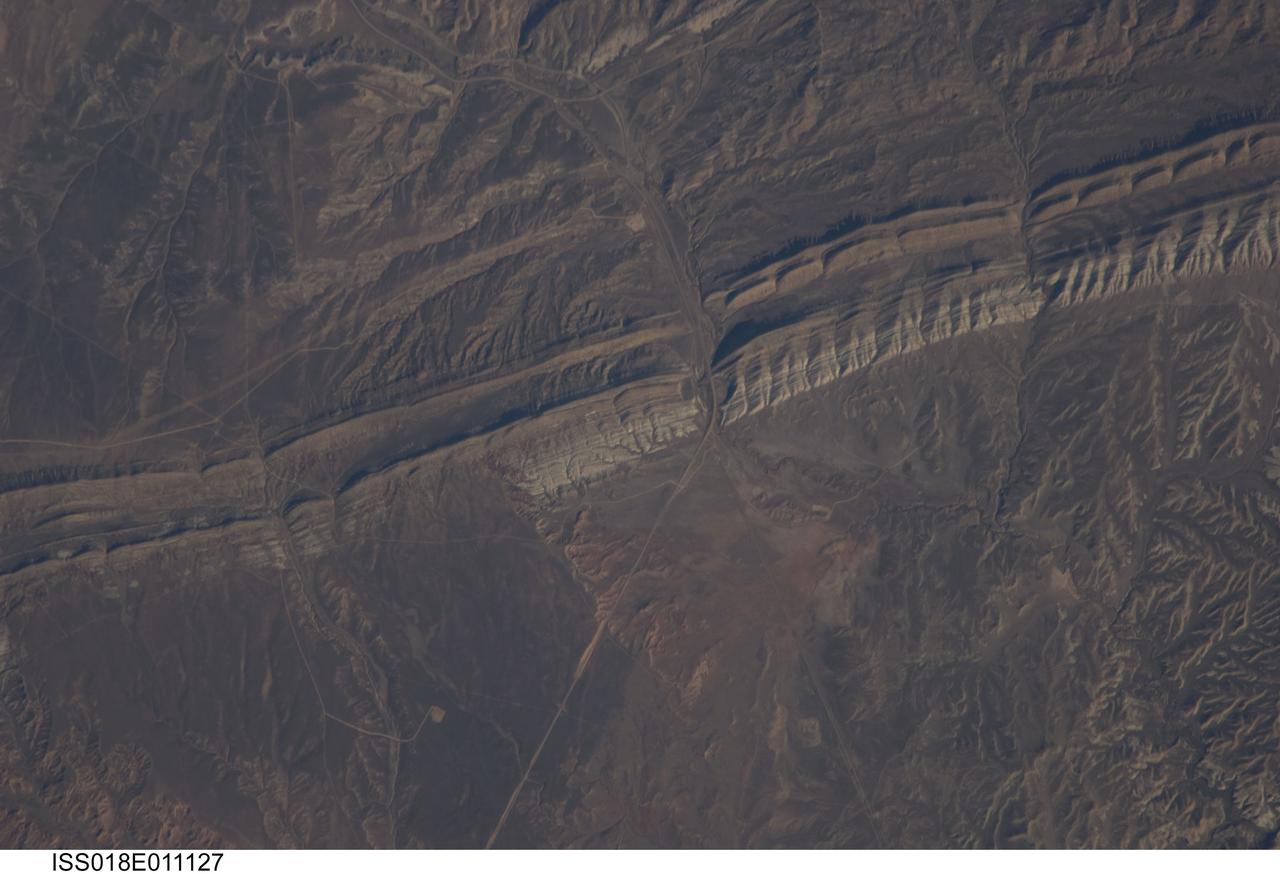
ISS018-E-011127 (6 Dec. 2008) --- Raven Ridge, Colorado is featured in this image photographed by an Expedition 18 crewmember on the International Space Station. An important way to unravel Earth?s history is to find and study old rocks that have been turned up and exposed on the surface through Earth?s tectonic activity. This image of Raven Ridge, Colorado provides a beautiful example of such a place that allows geologists to walk across rocks formed about 65 million years ago, now known as the ?K-T (or Cretaceous-Tertiary) Boundary?, according to scientists. The ridge is a dramatic topographic feature in northwestern Colorado formed by layered sedimentary rocks that span this boundary in geologic time. These sedimentary layers, originally deposited in a near-shore or marine environment as flat-lying beds, were later tilted on end to an almost vertical position by tectonic forces. The tilted beds are visible in this view as hard, resistant ridges of tan, buff, and white rocks, with a less resistant gray layer in the center of Raven Ridge (extending from left to right). The K-T Boundary is most famously known as the geological threshold where dinosaurs ? and a large number of other animal and plant species, both terrestrial and marine ? disappeared from the fossil record in a mass extinction event 66 ? 65 million years ago, according to scientists. Various hypotheses have been advanced to explain the mass extinction event - perhaps the best known being a large meteor impact that sparked widespread climate change or widespread volcanism that likewise produced significant climate change unfavorable for the existing plants and animals. The approximate location of the K-T Boundary is depicted in this image as a dotted white line ? rock layers to the south of the line belong to the Tertiary Period (lower half of image), while rocks to the north of the line are part of the Cretaceous and older Periods (upper half of image). A prominent topographic break in the ridgeline, Mormon Gap, provides road access across the Ridge. To the northwest of the Gap, several landslides formed in relatively soft Tertiary claystone, shale, and sandstone extend southwards from the crest of the Ridge.
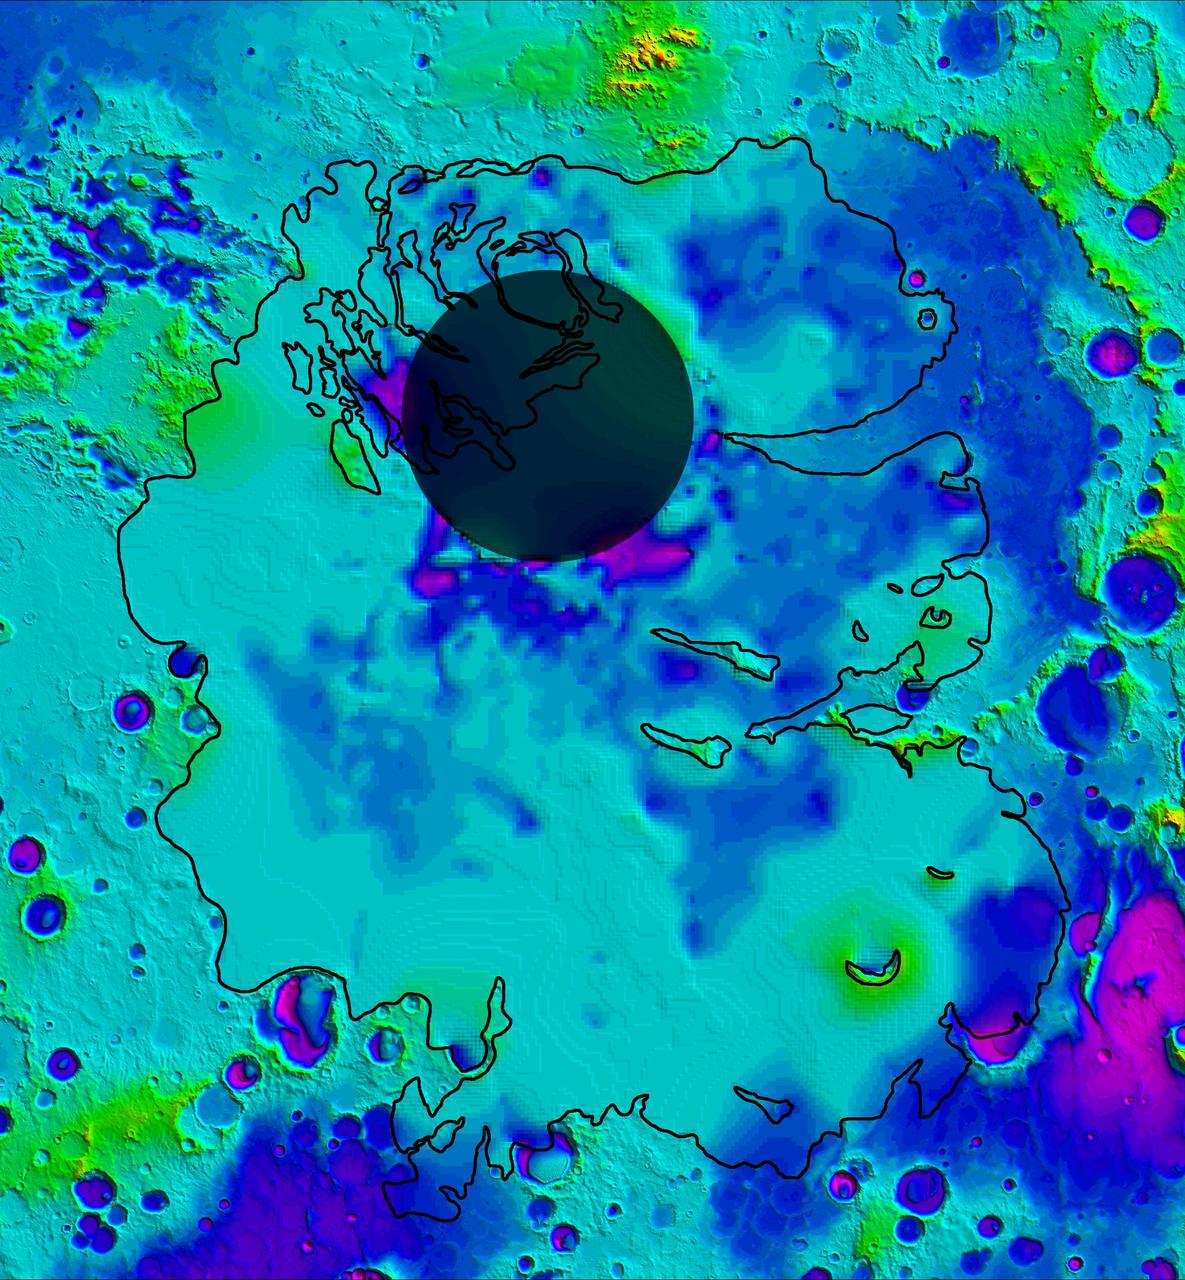
This map shows the topography of the south polar region of Mars, including topography buried by thick deposits of icy material
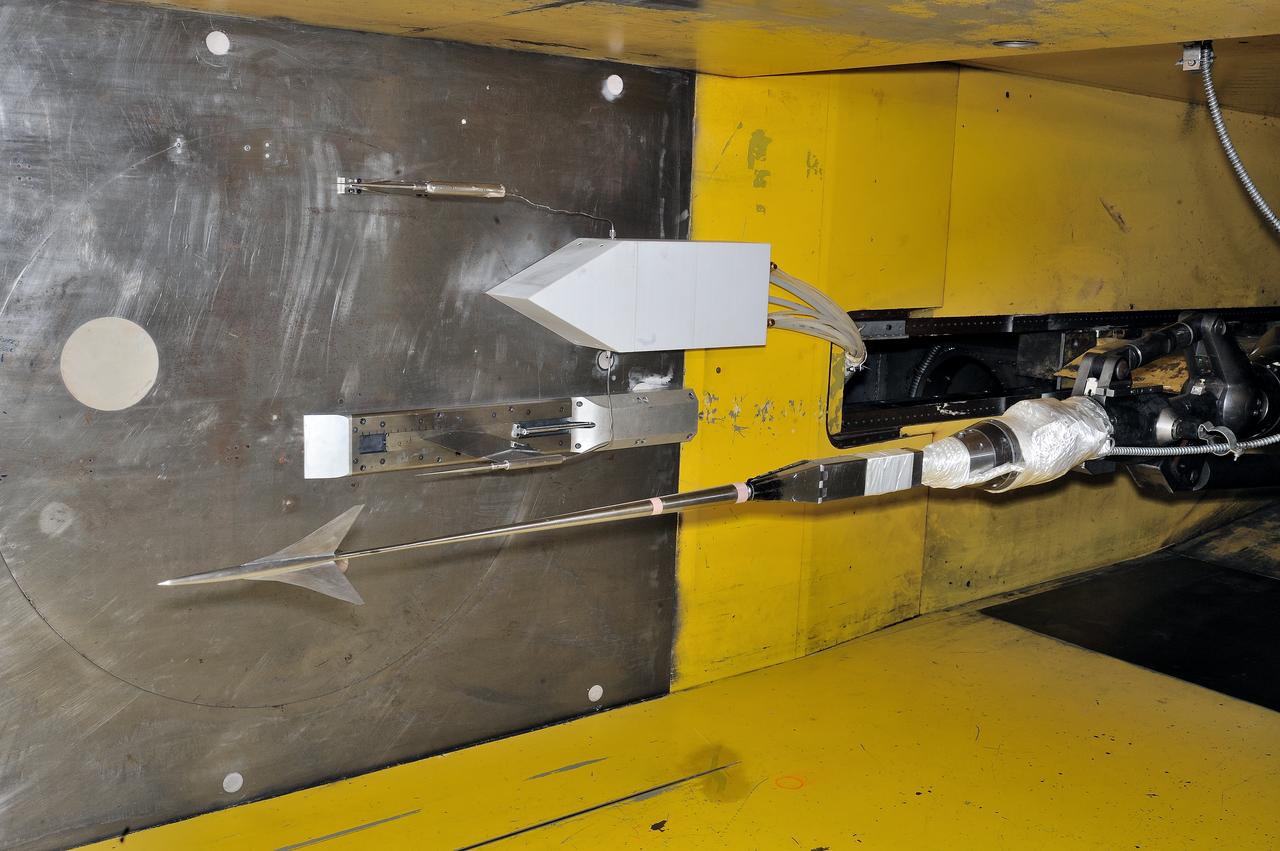
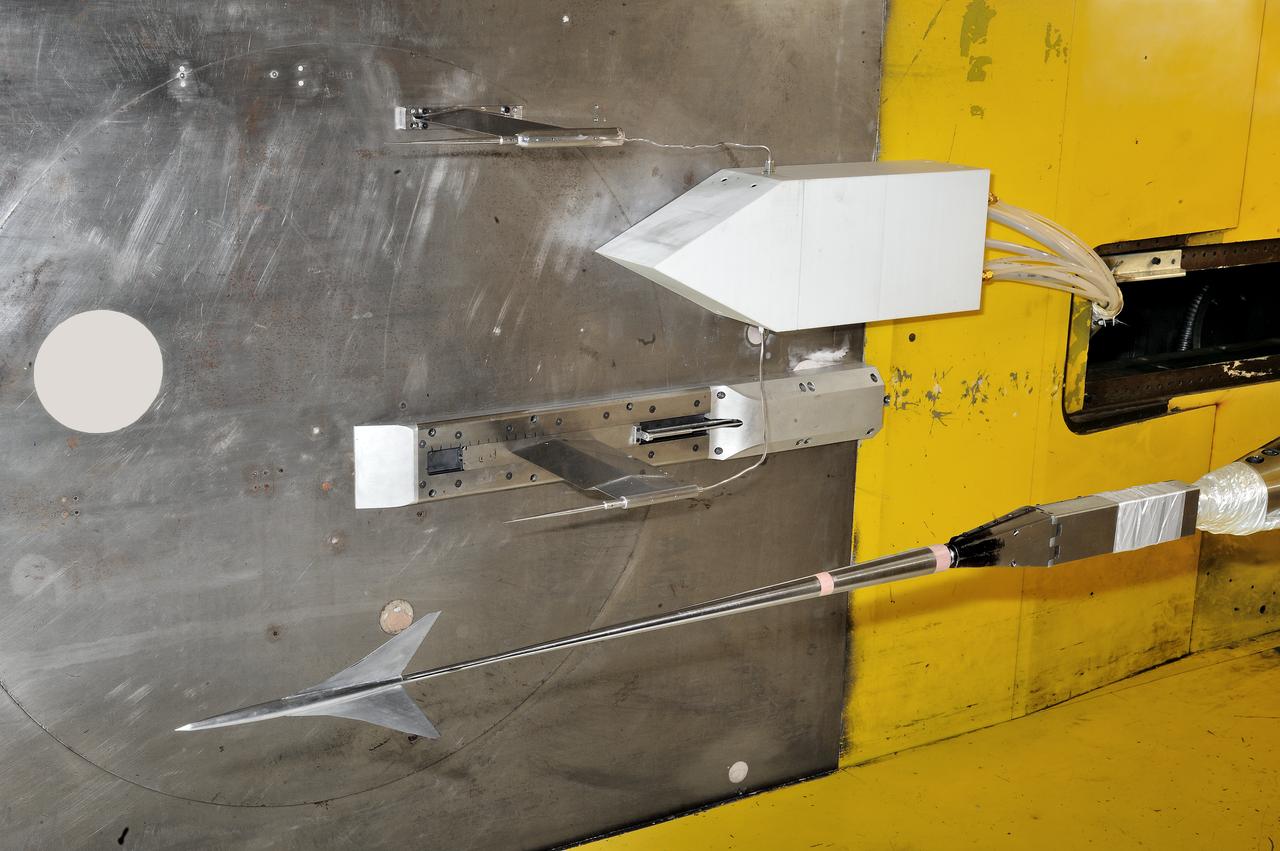
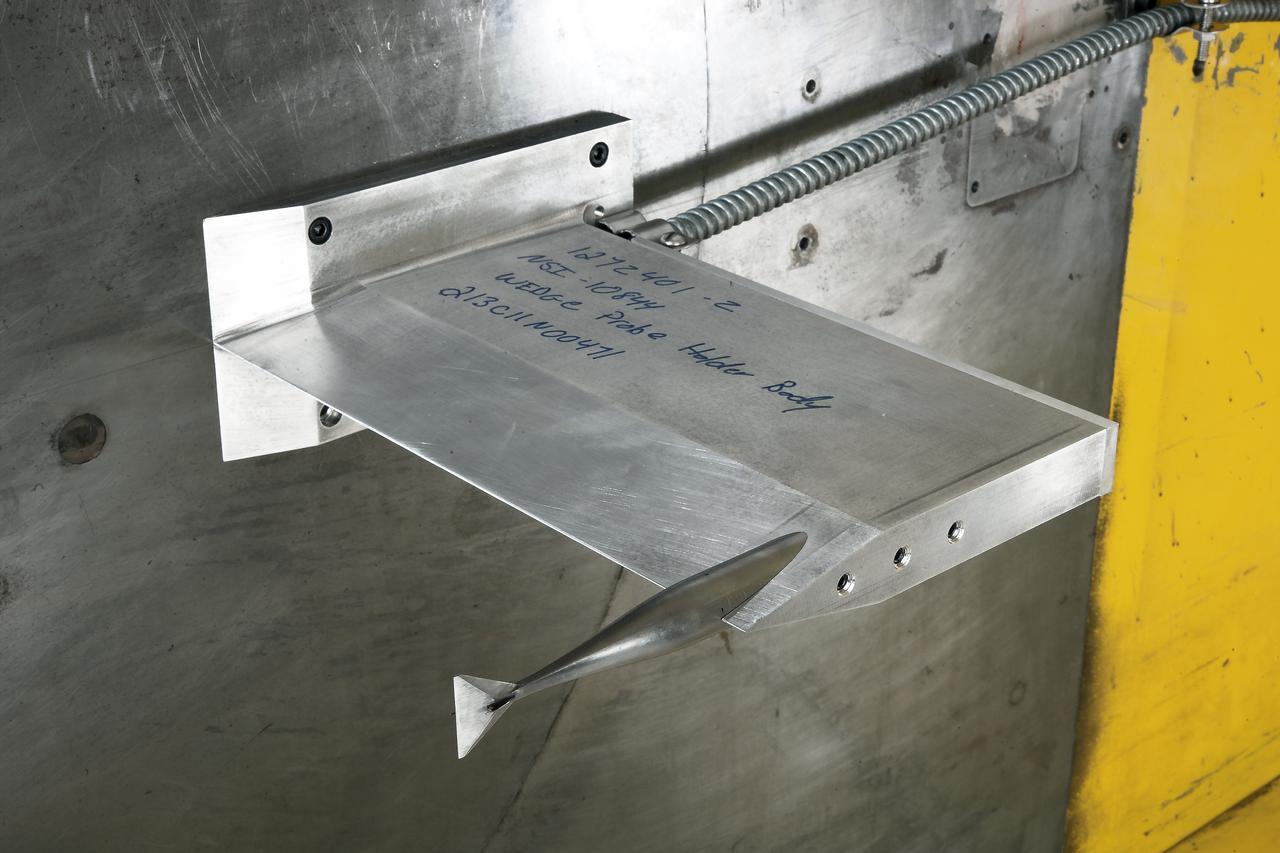
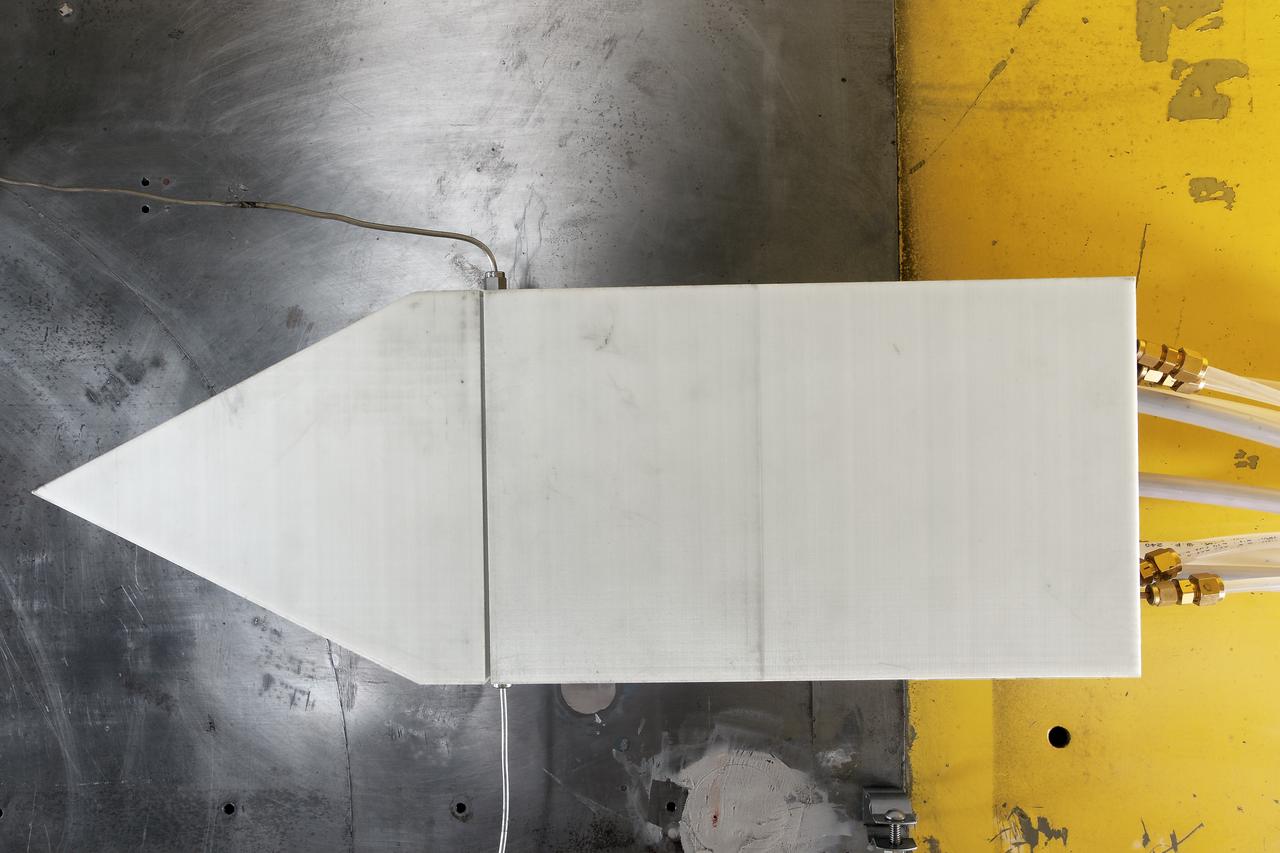
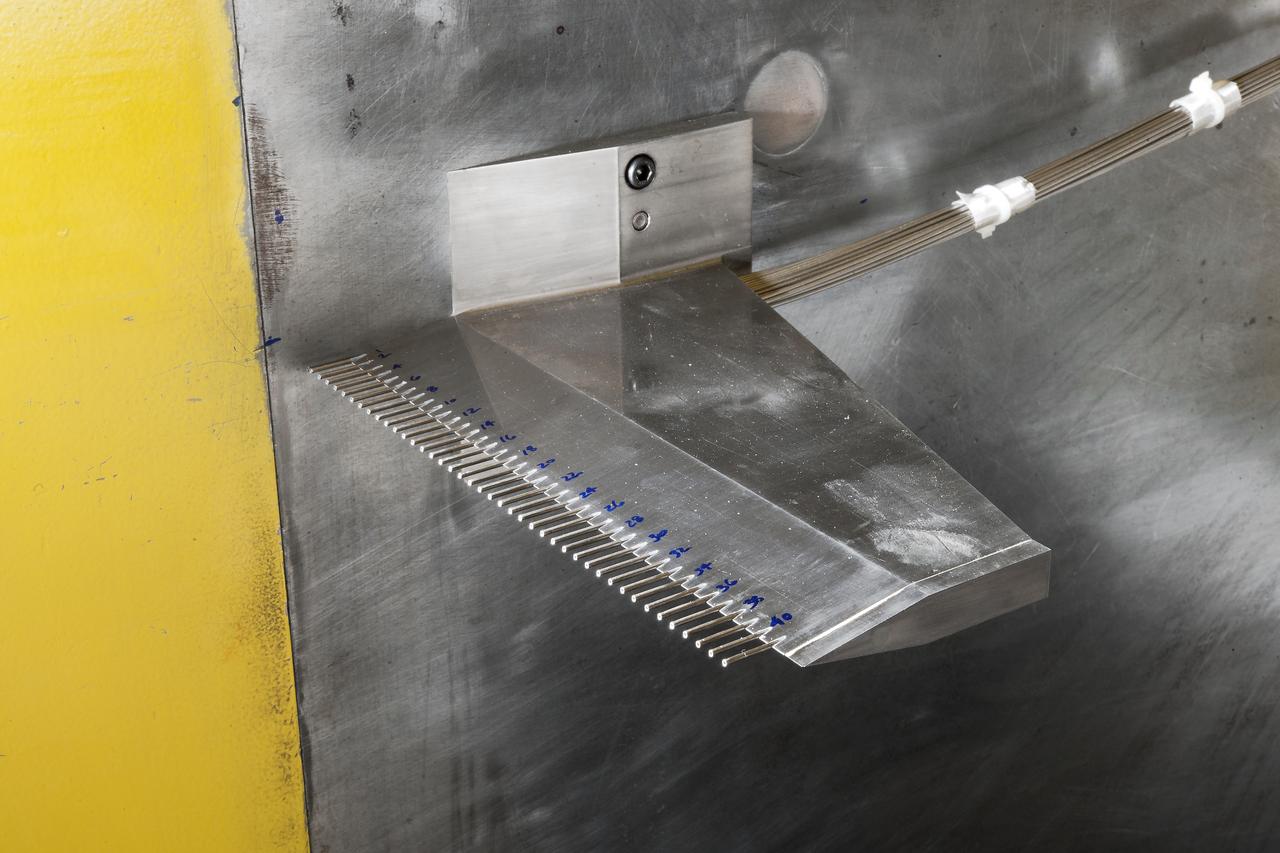
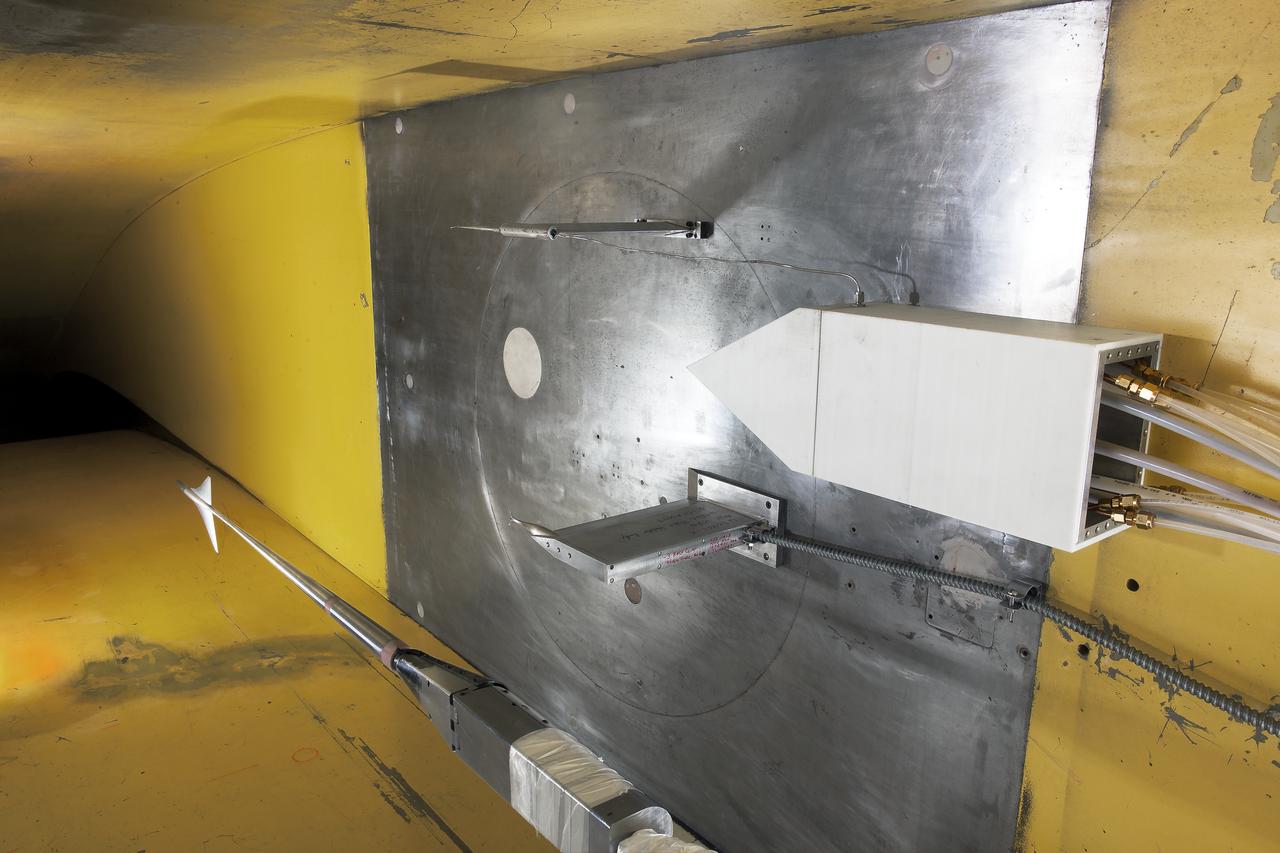
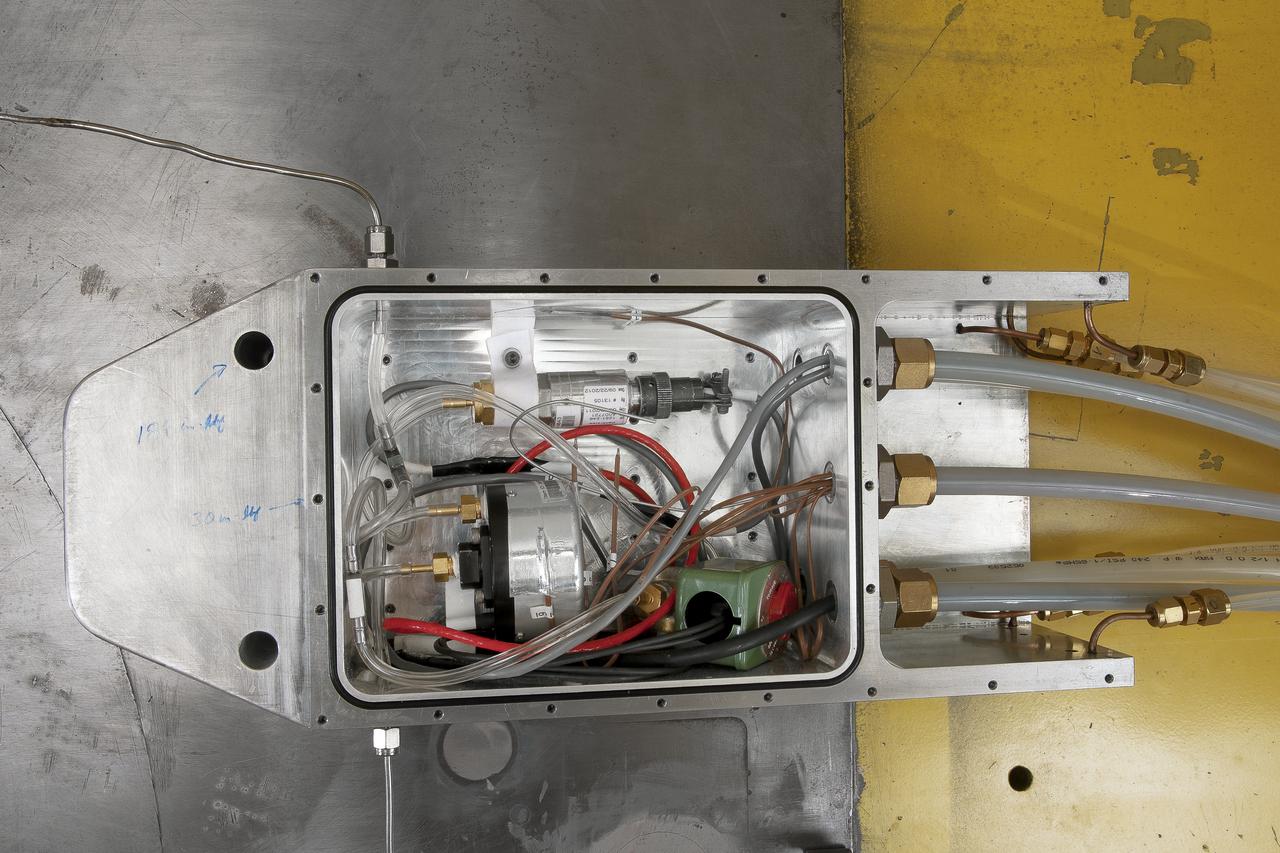
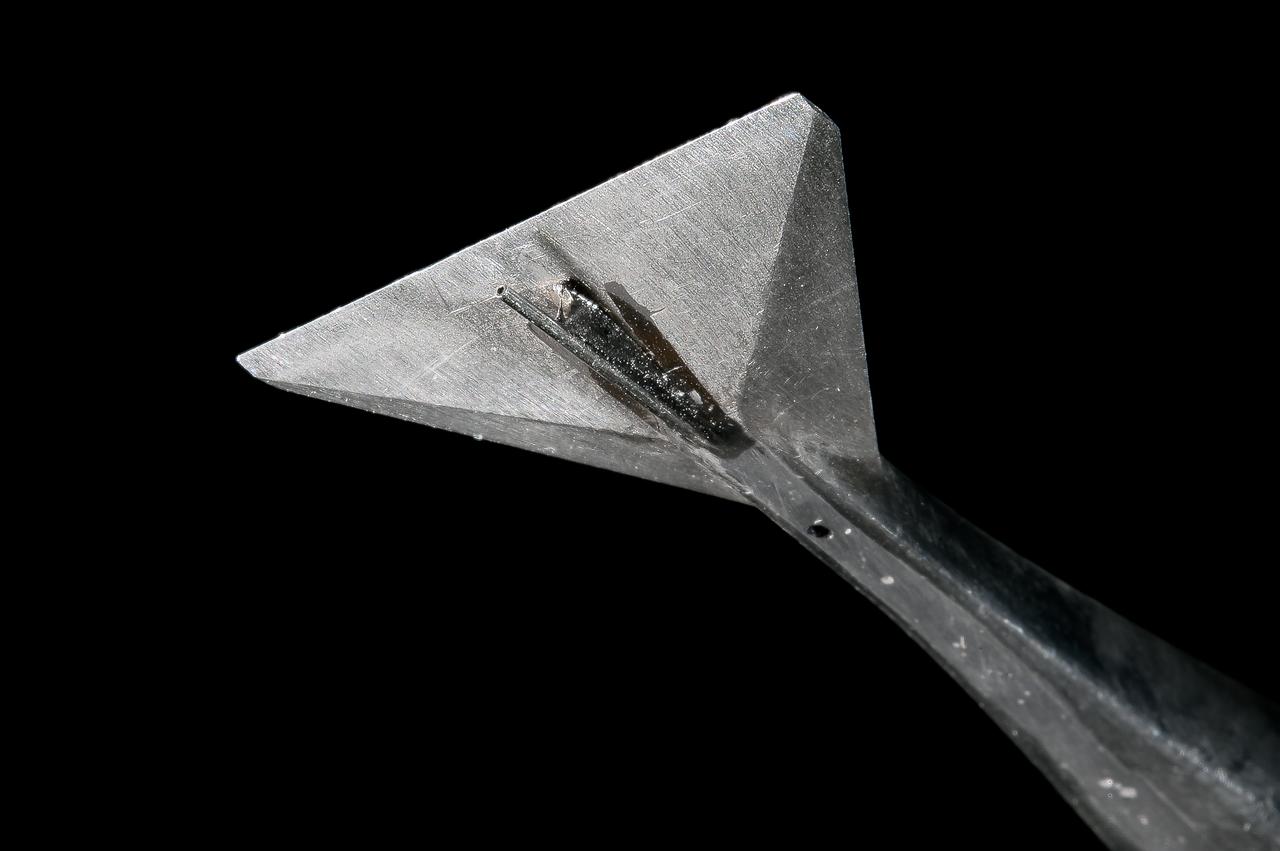
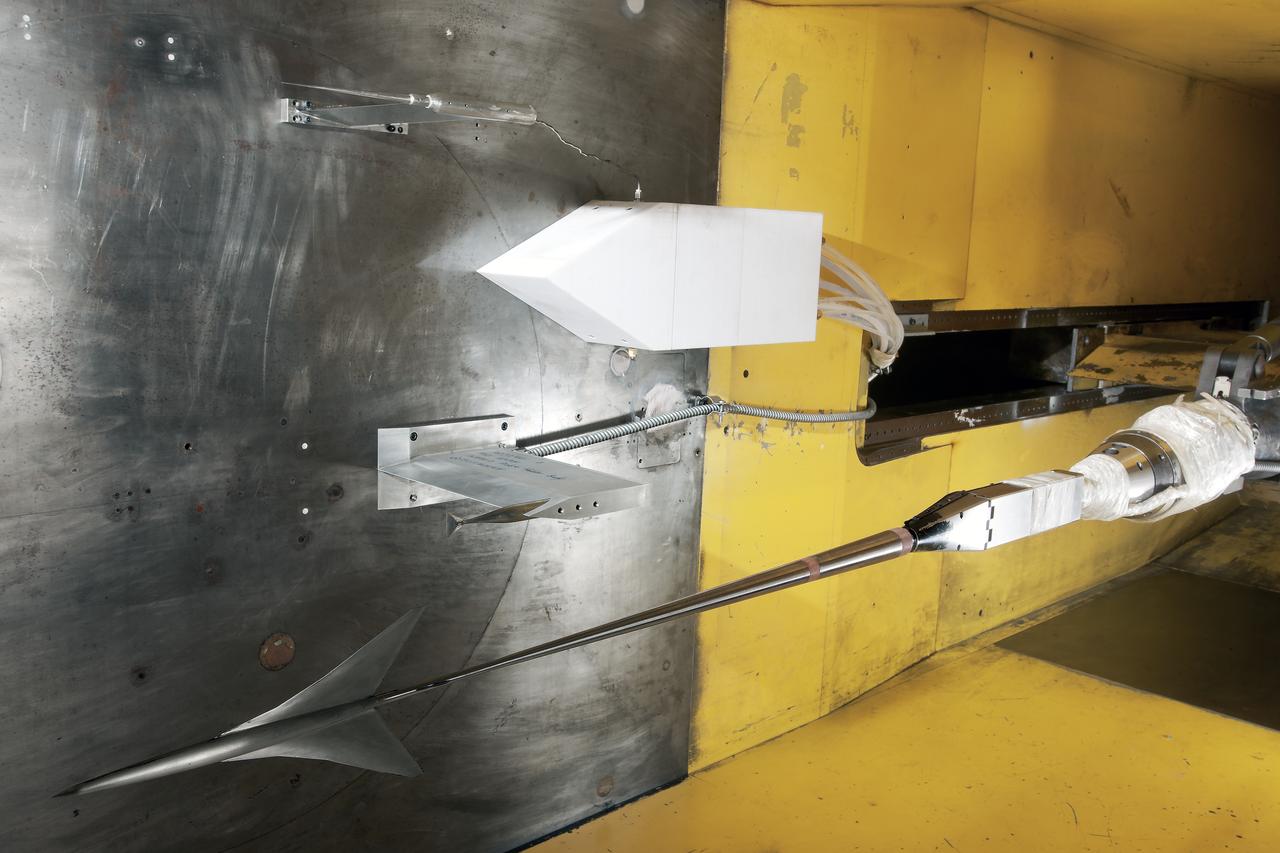
UPWT Test 1998 Continuous Data Sonic Boom Test. Sonic Boom Hardward Mounted in the Langley Unitary Plan wind Tunnel(UPWT). Conical survey probes, wedge probe, and wind tunnel wall boundary layer rake. Rectangular box with wedge front end is a transducer box to that held pressure transducer for the conical probes.
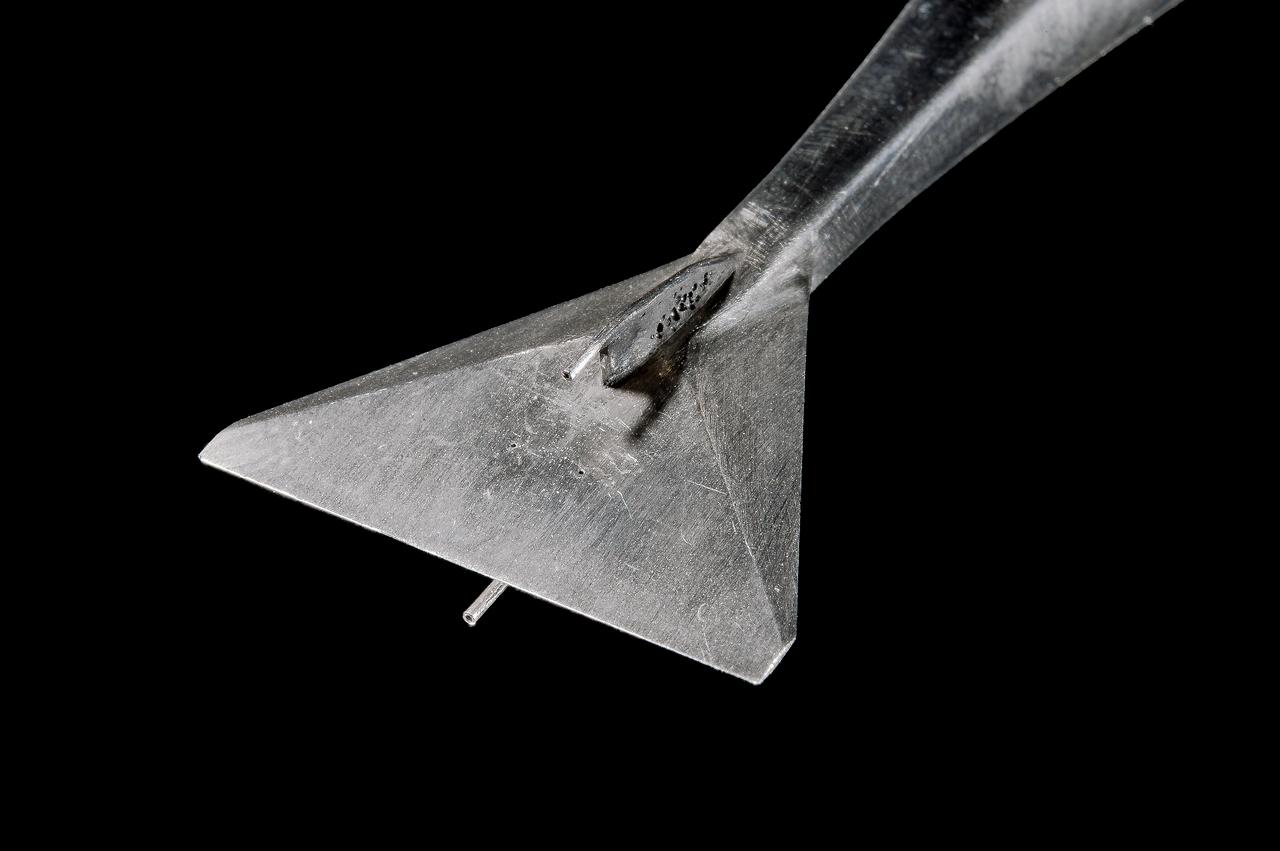
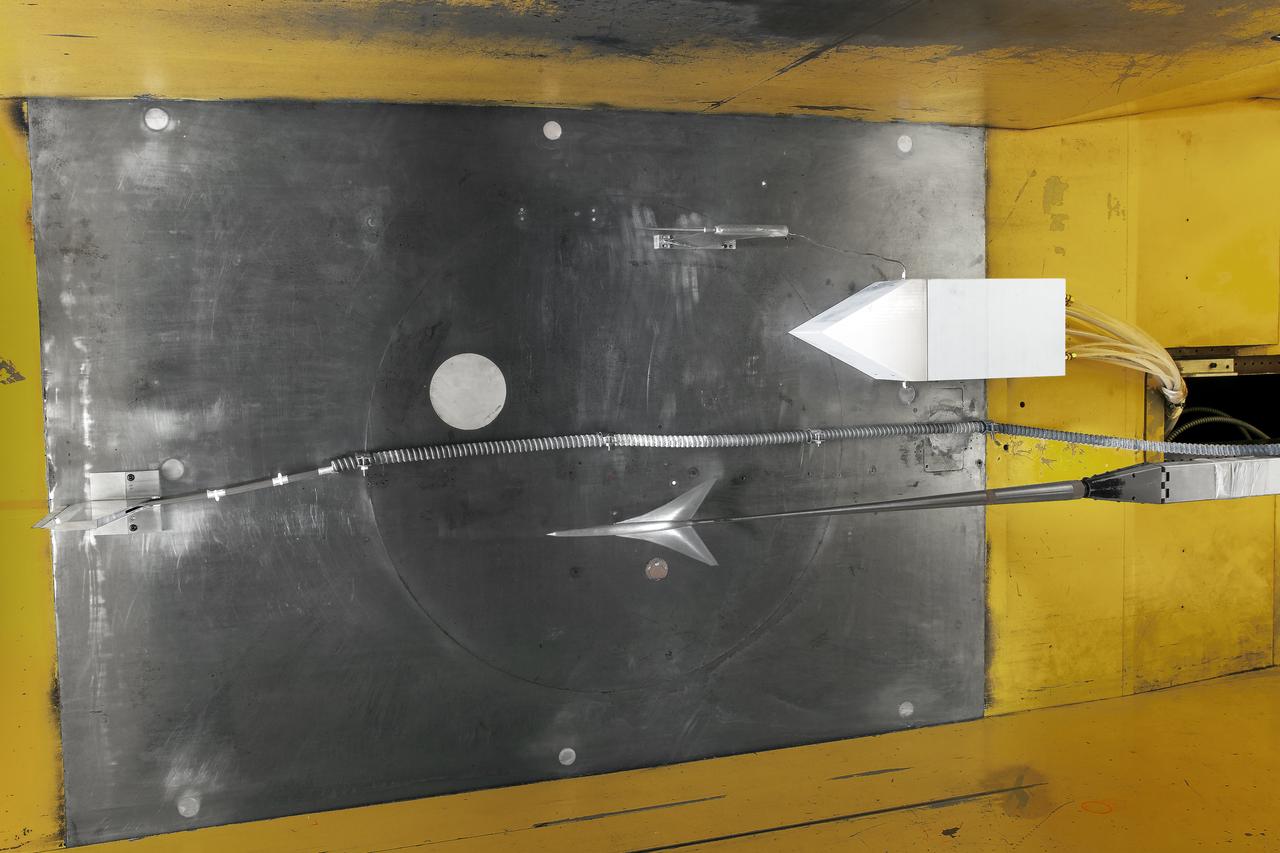
Two images left out of the original order in 2011 L numbers 3800-3810 2011. UPWT Test 1998 Continuous Data Sonic Boom Test. Sonic Boom Hardware Mounted in the Langley Unitary Plan wind Tunnel(UPWT). Conical survey probes, wedge probe, and wind tunnel wall boundary layer rake. Rectangular box with wedge front end is a transducer box to that held pressure transducer for the conical probes.
UPWT Test 1998 Continuous Data Sonic Boom Test. Sonic Boom Hardward Mounted in the Langley Unitary Plan wind Tunnel(UPWT). Conical survey probes, wedge probe, and wind tunnel wall boundary layer rake. Rectangular box with wedge front end is a transducer box to that held pressure transducer for the conical probes.
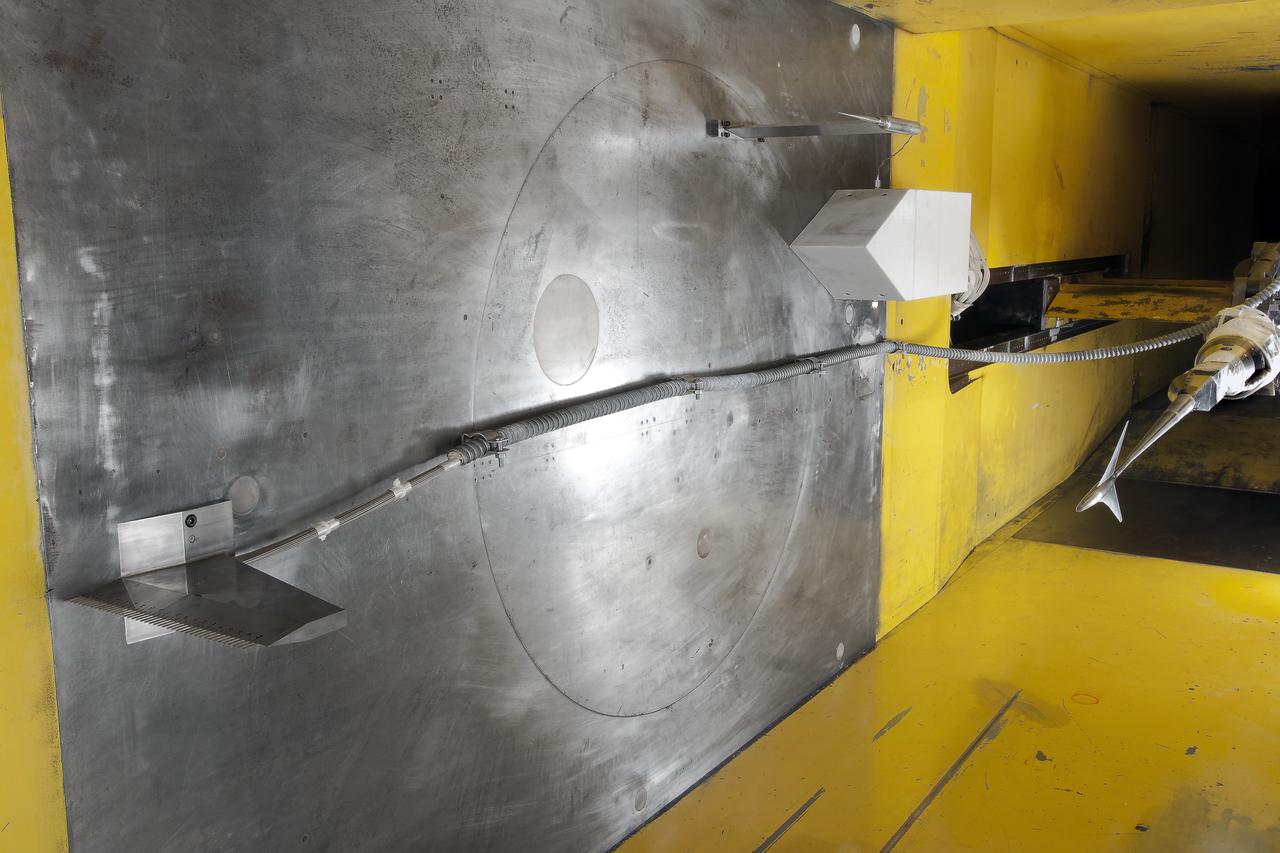
UPWT Test 1998 Continuous Data Sonic Boom Test. Sonic Boom Hardward Mounted in the Langley Unitary Plan wind Tunnel(UPWT). Conical survey probes, wedge probe, and wind tunnel wall boundary layer rake. Rectangular box with wedge front end is a transducer box to that held pressure transducer for the conical probes.
UPWT Test 1998 Continuous Data Sonic Boom Test. Sonic Boom Hardward Mounted in the Langley Unitary Plan wind Tunnel(UPWT). Conical survey probes, wedge probe, and wind tunnel wall boundary layer rake. Rectangular box with wedge front end is a transducer box to that held pressure transducer for the conical probes.
UPWT Test 1998 Continuous Data Sonic Boom Test. Sonic Boom Hardward Mounted in the Langley Unitary Plan wind Tunnel(UPWT). Conical survey probes, wedge probe, and wind tunnel wall boundary layer rake. Rectangular box with wedge front end is a transducer box to that held pressure transducer for the conical probes.
UPWT Test 1998 Continuous Data Sonic Boom Test. Sonic Boom Hardward Mounted in the Langley Unitary Plan wind Tunnel(UPWT). Conical survey probes, wedge probe, and wind tunnel wall boundary layer rake. Rectangular box with wedge front end is a transducer box to that held pressure transducer for the conical probes.

UPWT Test 1998 Continuous Data Sonic Boom Test. Sonic Boom Hardward Mounted in the Langley Unitary Plan wind Tunnel(UPWT). Conical survey probes, wedge probe, and wind tunnel wall boundary layer rake. Rectangular box with wedge front end is a transducer box to that held pressure transducer for the conical probes.
UPWT Test 1998 Continuous Data Sonic Boom Test. Sonic Boom Hardward Mounted in the Langley Unitary Plan wind Tunnel(UPWT). Conical survey probes, wedge probe, and wind tunnel wall boundary layer rake. Rectangular box with wedge front end is a transducer box to that held pressure transducer for the conical probes.
UPWT Test 1998 Continuous Data Sonic Boom Test. Sonic Boom Hardward Mounted in the Langley Unitary Plan wind Tunnel(UPWT). Conical survey probes, wedge probe, and wind tunnel wall boundary layer rake. Rectangular box with wedge front end is a transducer box to that held pressure transducer for the conical probes.
N-231 High Reynolds Number Channel II Facility In this timeframe the test section was designed specifically to test two-dimensional airfoil models. It is equipped with 'through-the-wall' turntables that remotely position the airfoil, with flexible upper and lower walls that can be adjusted to minimize wall interference. Porous side-wall panels provide boundary-layer removal.
UPWT Test 1998 Continuous Data Sonic Boom Test. Sonic Boom Hardward Mounted in the Langley Unitary Plan wind Tunnel(UPWT). Conical survey probes, wedge probe, and wind tunnel wall boundary layer rake. Rectangular box with wedge front end is a transducer box to that held pressure transducer for the conical probes.
Two images left out of the original order in 2011 L numbers 3800-3810 2011. UPWT Test 1998 Continuous Data Sonic Boom Test. Sonic Boom Hardware Mounted in the Langley Unitary Plan wind Tunnel(UPWT). Conical survey probes, wedge probe, and wind tunnel wall boundary layer rake. Rectangular box with wedge front end is a transducer box to that held pressure transducer for the conical probes.
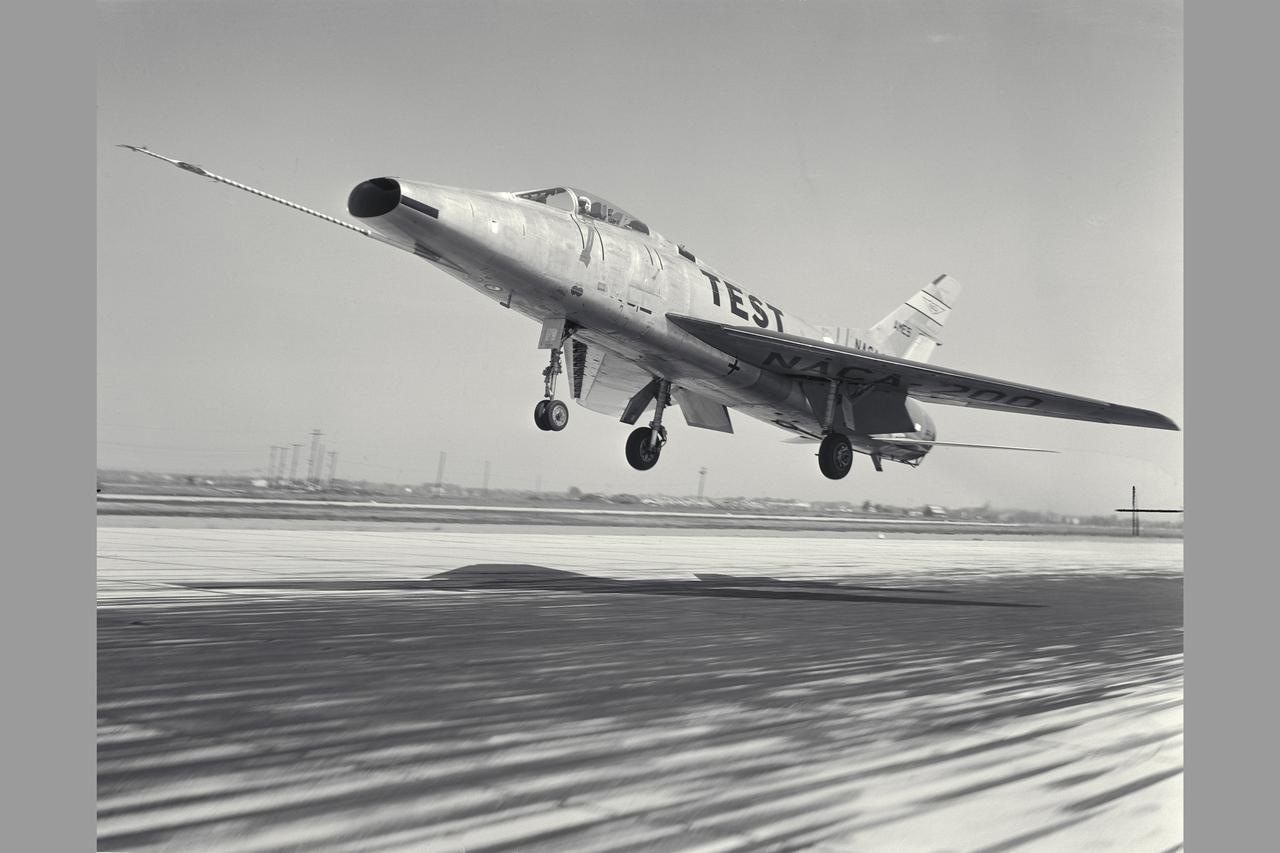
NACA Photographer North American F-100A (NACA-200) Super Sabre Airplane take-off. The blowing-tupe boundary-layer control on the leading- and trailing-edge provided large reductions in takeoff and landing approach speeds. Approach speeds were reduced by about 10 knots (Mar 1960). Note: Used in publication in Flight Research at Ames; 57 Years of Development and Validation of Aeronautical Technology NASA SP-1998-3300 fig. 102 and and Memoirs of a Flight Test Engneer NASA SP-2002-4525
UPWT Test 1998 Continuous Data Sonic Boom Test. Sonic Boom Hardward Mounted in the Langley Unitary Plan wind Tunnel(UPWT). Conical survey probes, wedge probe, and wind tunnel wall boundary layer rake. Rectangular box with wedge front end is a transducer box to that held pressure transducer for the conical probes.
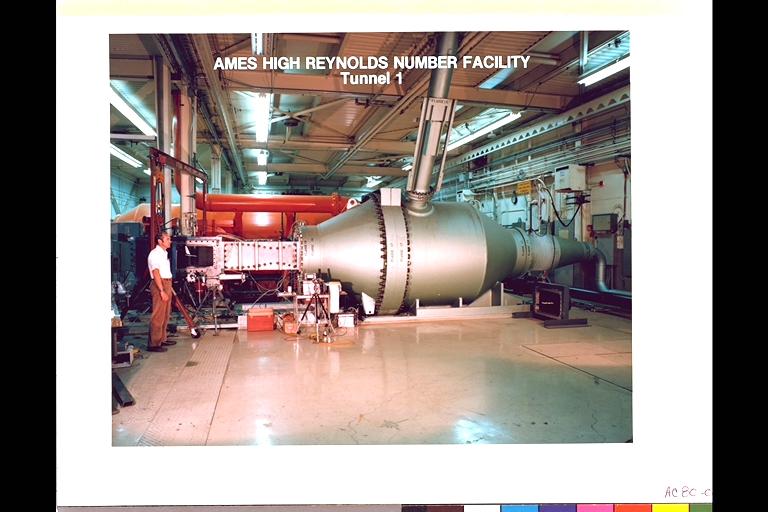
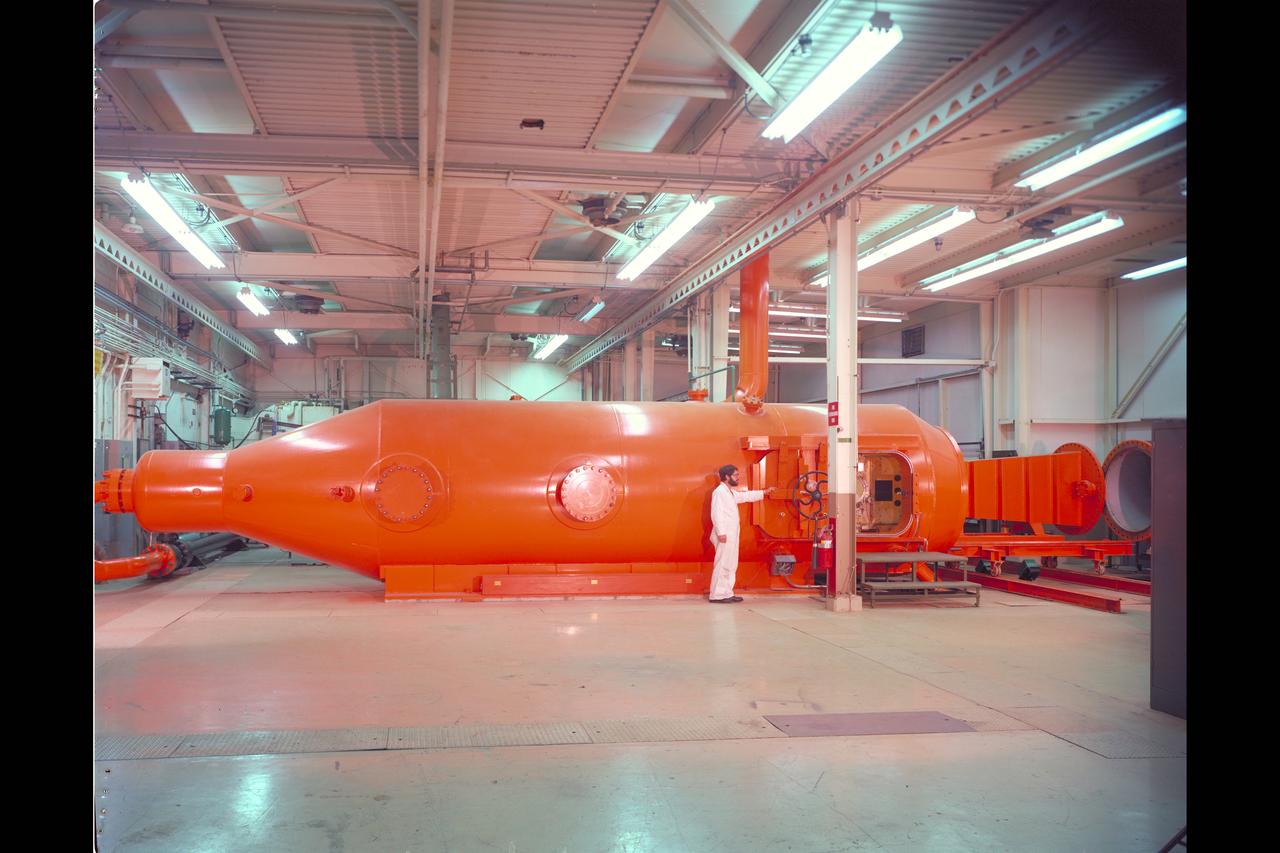
N-231 High Reynolds Number Channel Facility (An example of a Versatile Wind Tunnel) Tunnel 1 I is a blowdown Facility that utilizes interchangeable test sections and nozzles. The facility provides experimental support for the fluid mechanics research, including experimental verification of aerodynamic computer codes and boundary-layer and airfoil studies that require high Reynolds number simulation. (Tunnel 1)
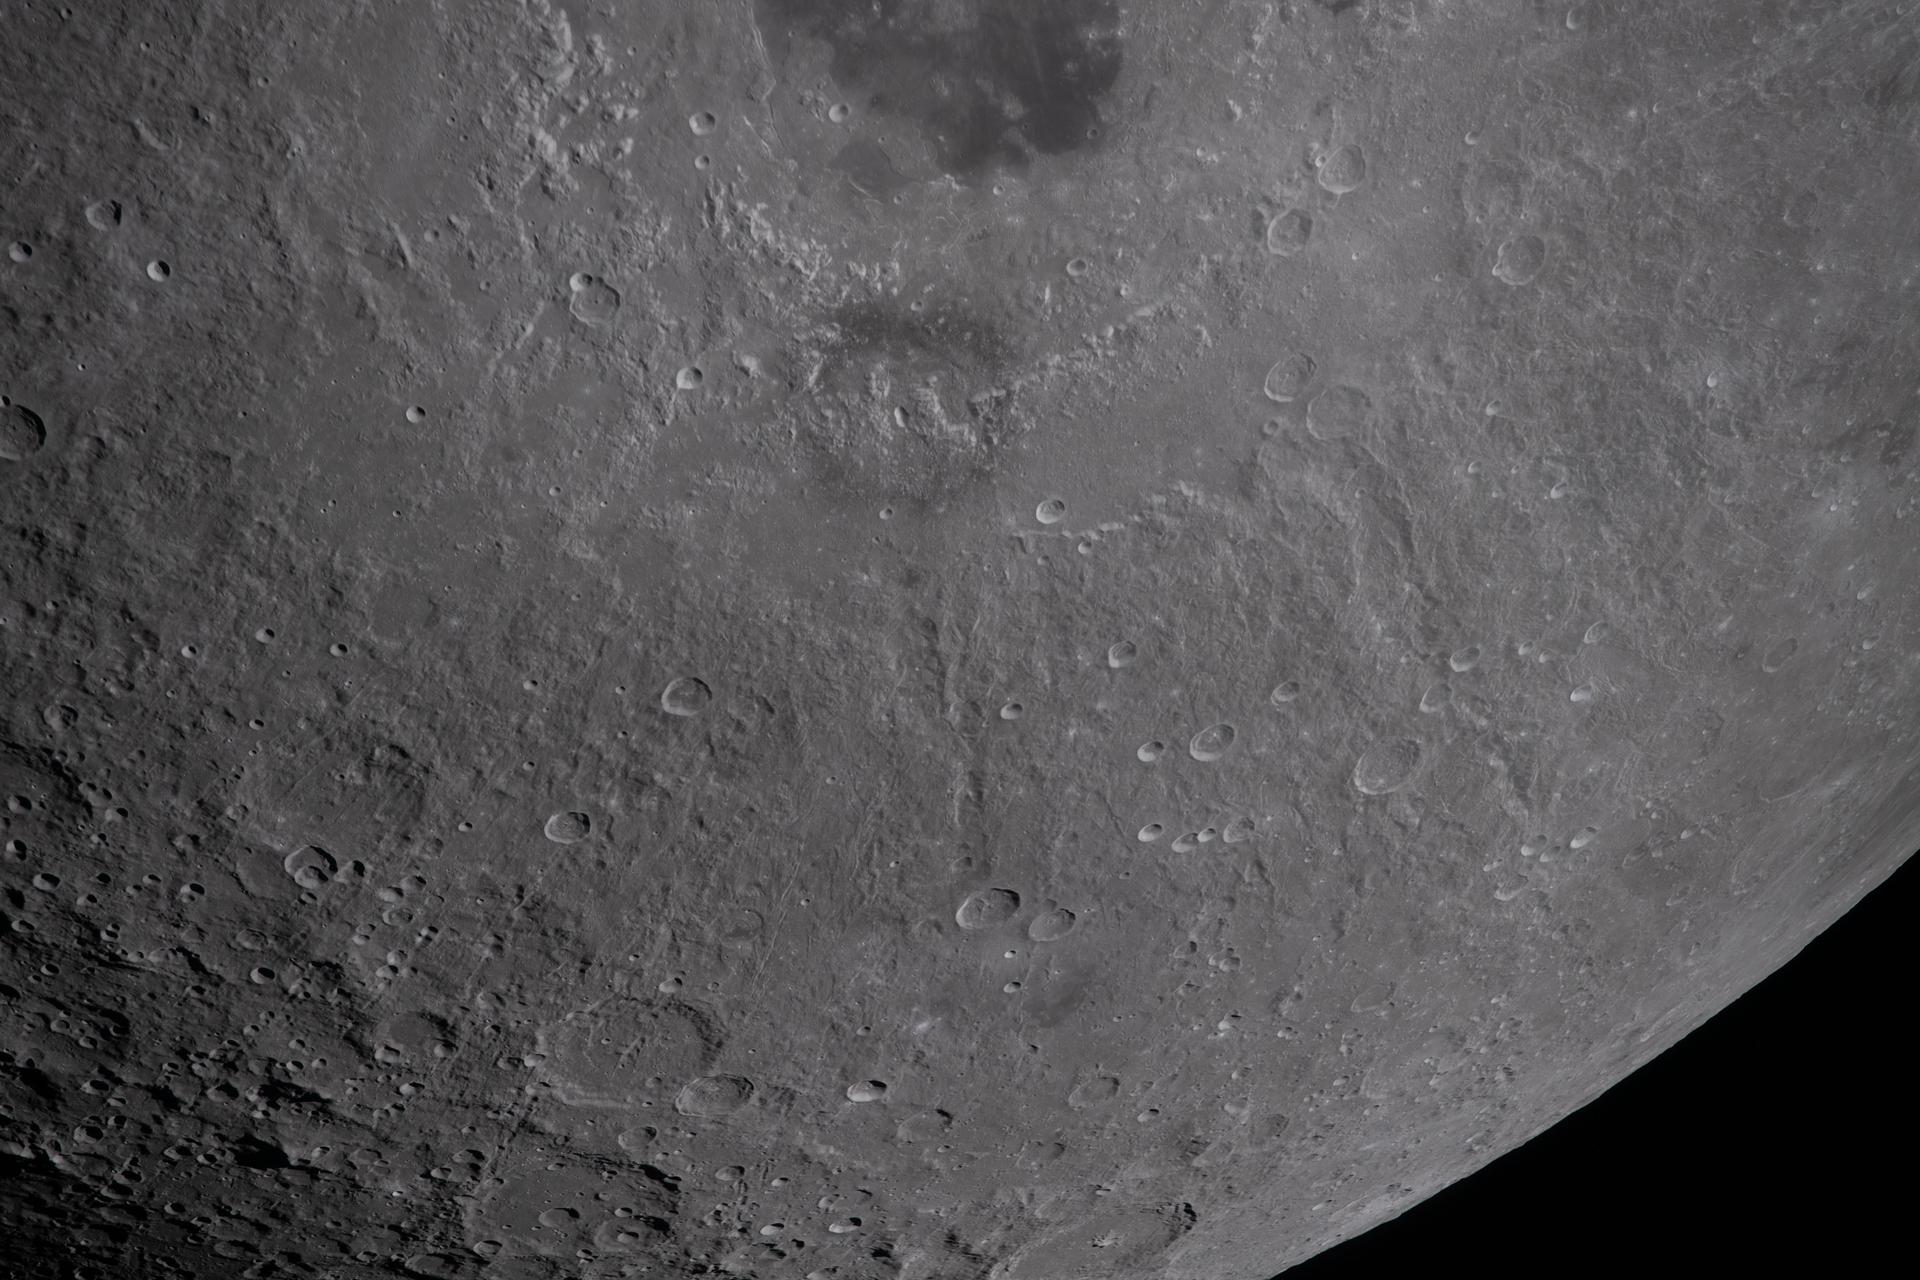
art002e012273 (April 6, 2026) - This view of the southwest portion of Orientale Basin highlights its prominent annular ring—a sweeping arc of mountainous terrain formed by the immense energy of an ancient impact. The ring structure rises above the surrounding surface, tracing the basin’s outer boundary and revealing the layered, multi-ring nature of one of the Moon’s most well-preserved impact features. Apollo-era observers nicknamed this formation “the kiss,” reflecting its distinctive, curved shape.
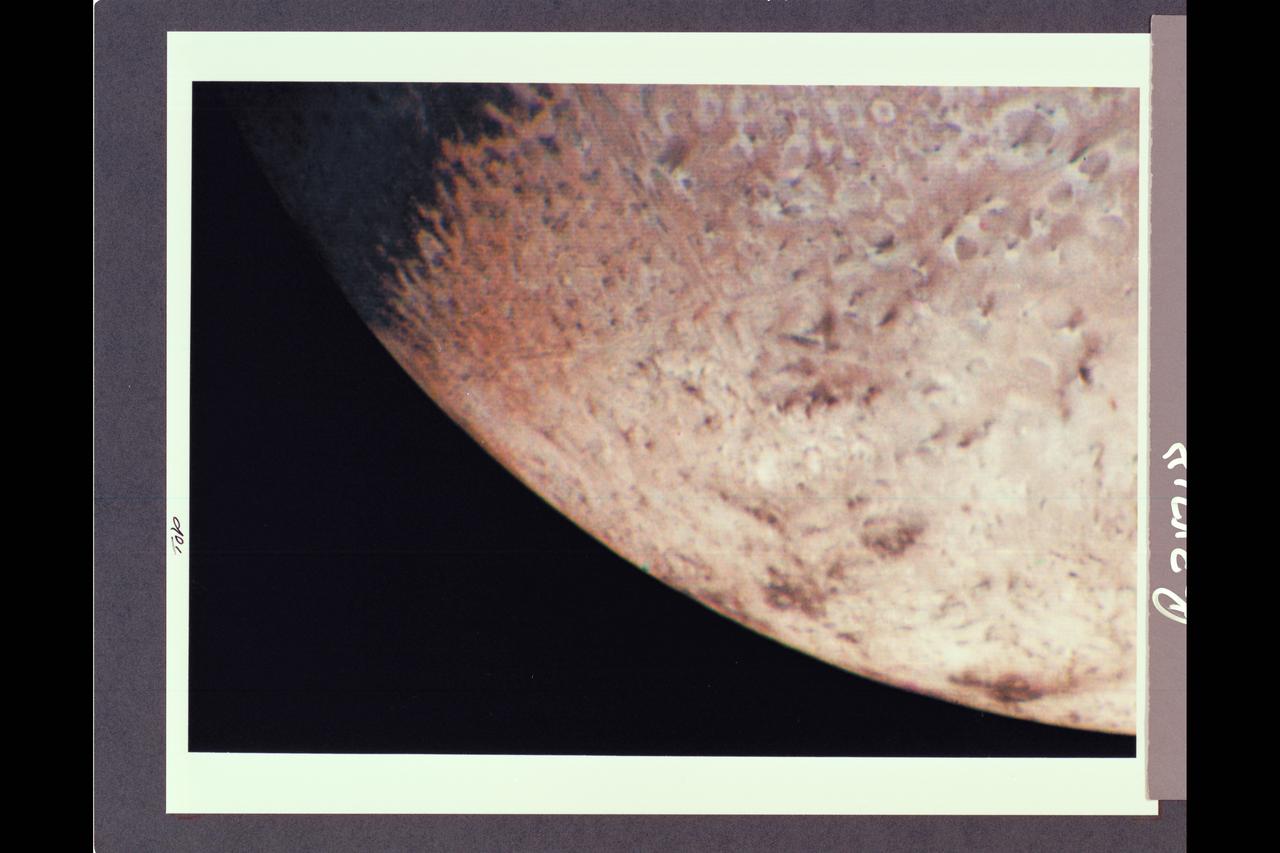
P-34718 Range: 210,000 kilometers (128,000 miles) This natural color image of the limb of Triton shows the largest surface features at about 3 miles across. The picture is a composite of images taken through the violet, green and clear filters and shows a geologic boundary between a rough, pitted surface to the right and a smoother surface to the left. The change between surface types is gradual. The image also shows a color boundary between pinkish material in the upper part of the image and whiter material in the lower part. The geologic and color boundaries are not the same. That implies that whatever supplies the color is a very thin coating over a different underlying material in which the geologic boundary occurs. The colored coating may be a seasonal frost composed of compounds volatile enough to be sublimated at the very low temperatures (40 K to 50 K or -387.4 F to -369.4 F) prevailing near Triton's surface. Possible compositions of the frost layer include methane (which turns red when irradiated), carbon monoxide or nitrogen. The color in this image is somewhat exaggerated: Triton is primarily a white object with a pinkish cast in some areas.

This VIS image shows part of the rim of an unnamed crater in Terra Sirenum. A group of channels dissect the rim in the center of the image. These channels are called gullies due to being on a steep slope rather than a flat river plain. In some images it is possible to see a boundary layer between the upper incised gully and a lower deposition region. The boundary marks a change in slope, the steep upper portion supports fast moving fluid that carves into the rim eroding materials. The change to a flatter slope causes the fluid to slow down and as it slows the materials carried by the fluid are deposited. Orbit Number: 92703 Latitude: -39.1381 Longitude: 182.069 Instrument: VIS Captured: 2022-11-07 10:33 https://photojournal.jpl.nasa.gov/catalog/PIA25804

This VIS image shows part of the rim of an unnamed crater in Terra Sirenum. A group of channels dissect the rim in the center of the image. These channels are called gullies due to being on a steep slope rather than a flat river plain. In some images it is possible to see a boundary layer between the upper incised gully and a lower deposition region. The boundary marks a change in slope, the steep upper portion supports fast moving fluid that carves into the rim eroding materials. The change to a flatter slope causes the fluid to slow down and as it slows the materials carried by the fluid are deposited. Orbit Number: 92428 Latitude: -44.183 Longitude: 194.798 Instrument: VIS Captured: 2022-10-15 19:08 https://photojournal.jpl.nasa.gov/catalog/PIA25761
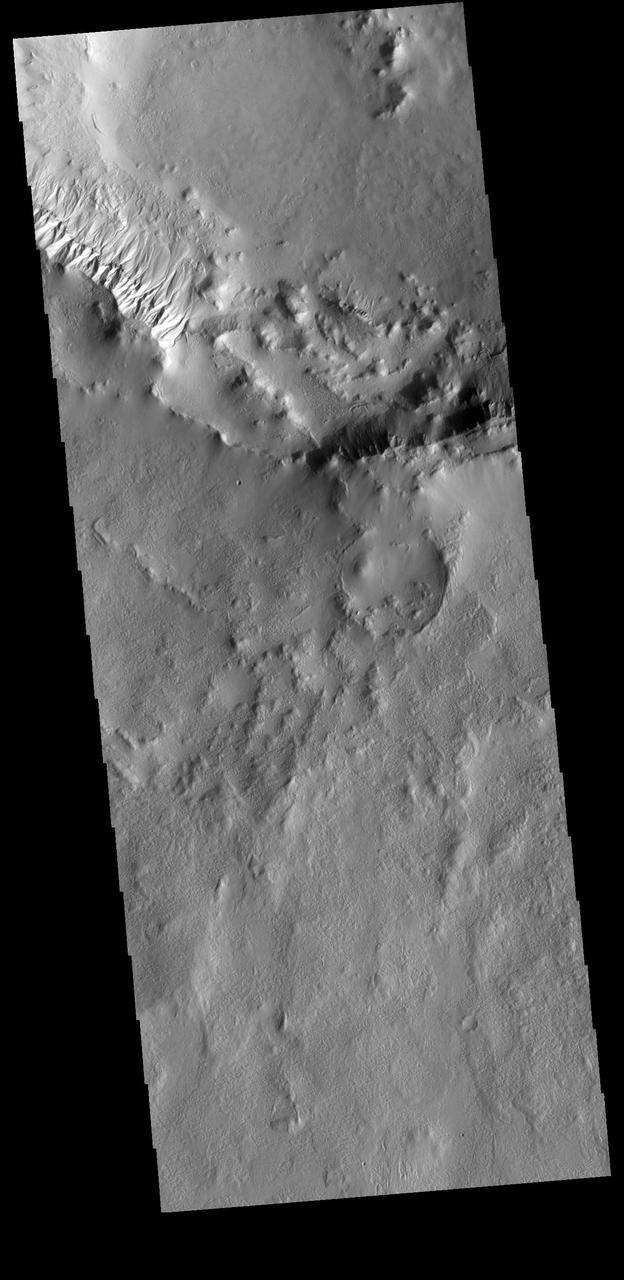
This VIS image shows part of the rim of an unnamed crater in Terra Cimmeria. A group of channels dissect the rim near to upper left of the image. These channels are called gullies due to being on a steep slope rather than a flat river plain. With careful examination, it is possible to see a boundary layer between the upper incised gully and a lower deposition region. The boundary marks a change in slope, the steep upper portion supports fast moving fluid that carves into the rim eroding materials. The change to a flatter slope causes the fluid to slow down and as it slows the materials carried by the fluid a deposited. Orbit Number: 75452 Latitude: -47.6995 Longitude: 170.871 Instrument: VIS Captured: 2018-12-17 23:46 https://photojournal.jpl.nasa.gov/catalog/PIA23185
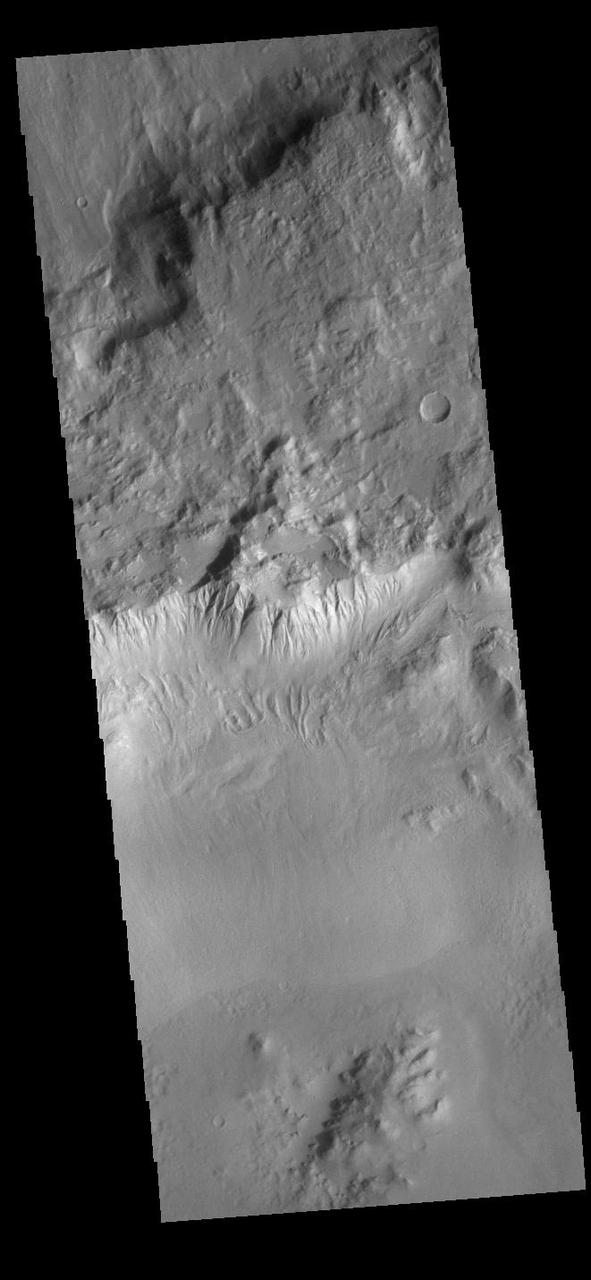
This VIS image shows part of the rim of an unnamed crater in Terra Sirenum. A group of channels dissect the rim in the center of the image. These channels are called gullies due to being on a steep slope rather than a flat river plain. In some images it is possible to see a boundary layer between the upper incised gully and a lower deposition region. The boundary marks a change in slope, the steep upper portion supports fast moving fluid that carves into the rim eroding materials. The change to a flatter slope causes the fluid to slow down and as it slows the materials carried by the fluid are deposited. Orbit Number: 91136 Latitude: -43.5736 Longitude: 206.861 Instrument: VIS Captured: 2022-07-01 10:26 https://photojournal.jpl.nasa.gov/catalog/PIA25542
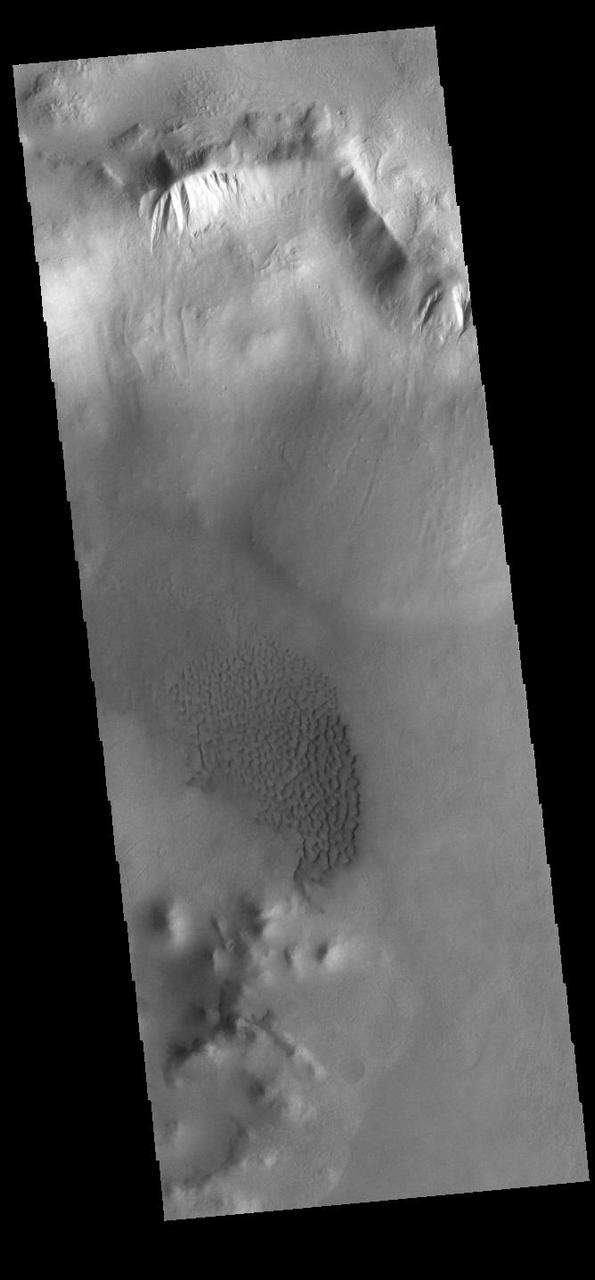
Today's VIS image shows part of an unnamed crater in Aonia Terra. At the top of the image numerous gullies dissect the crater rim. These channels are called gullies due to being on a steep slope rather than a flat river plain. In some images it is possible to see a boundary layer between the upper incised gully and a lower deposition region. The boundary marks a change in slope, the steep upper portion supports fast moving fluid that carves into the rim, eroding materials. The change to a flatter slope causes the fluid to slow down and as it slows the materials carried by the fluid are deposited. Sand dunes cover part of the crater floor. Orbit Number: 91821 Latitude: -52.412 Longitude: 246.698 Instrument: VIS Captured: 2022-08-26 20:03 https://photojournal.jpl.nasa.gov/catalog/PIA25648
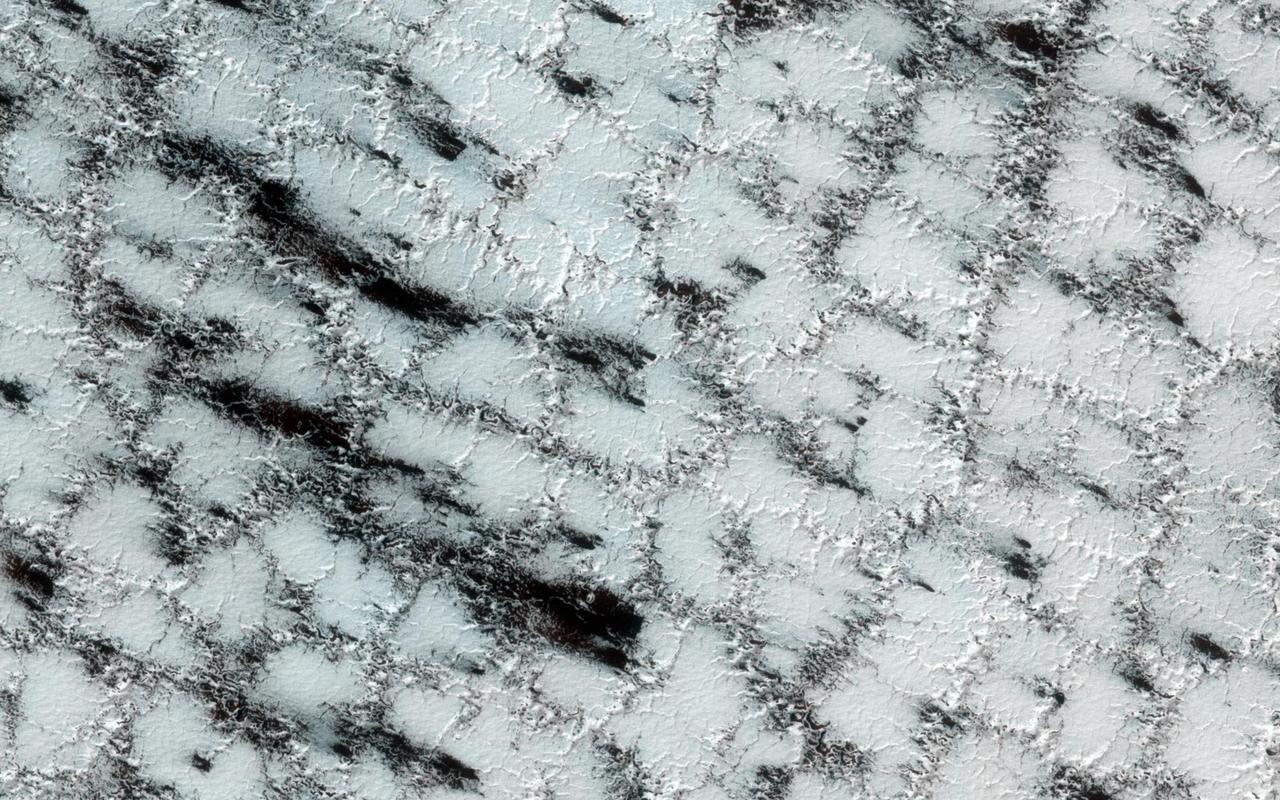
Although the season is late spring, carbon dioxide ice still covers much of the surface at this high latitude site. It is still a chilly -128 degrees Celsius. The weak boundaries of the polygonal structure of the surface have been eroded by spring sublimation of carbon dioxide as energy from the Sun turns ice to gas. The larger troughs in this image accentuate the surface polygonal structure, while the narrow cracks show the erosion caused when carbon dioxide gas escapes from under the seasonal ice layer carrying fine material from the surface. The dark fans in this image are made up of small particles from the surface deposited on top of the seasonal layer of ice. The fans originate at a crack, a weak spot that allows the gas to escape. The material is deposited in a direction determined by the direction of the wind as the gas was escaping. http://photojournal.jpl.nasa.gov/catalog/PIA19292
CAPE CANAVERAL, Fla. - In Orbiter Processing Facility 3 at NASA's Kennedy Space Center, boundary layer transition tiles have been placed on the underside of space shuttle Discovery for a fit check. Scheduled to launch on the STS-119 mission, Discovery will carry the S6 truss segment to complete the 361-foot-long backbone of the International Space Station. The truss includes the fourth pair of solar array wings and electronics that convert sunlight to power for the orbiting laboratory. Discovery is targeted to launch Feb. 12, 2009. Photo credit: NASA/Jim Grossmann
CAPE CANAVERAL, Fla. - In Orbiter Processing Facility 3 at NASA's Kennedy Space Center, a technician makes a fit check of boundary layer transition tile underneath space shuttle Discovery. Scheduled to launch on the STS-119 mission, Discovery will carry the S6 truss segment to complete the 361-foot-long backbone of the International Space Station. The truss includes the fourth pair of solar array wings and electronics that convert sunlight to power for the orbiting laboratory. Discovery is targeted to launch Feb. 12, 2009. Photo credit: NASA/Jim Grossmann
CAPE CANAVERAL, Fla. - In Orbiter Processing Facility 3 at NASA's Kennedy Space Center, a technician makes a fit check of boundary layer transition tile underneath space shuttle Discovery. Scheduled to launch on the STS-119 mission, Discovery will carry the S6 truss segment to complete the 361-foot-long backbone of the International Space Station. The truss includes the fourth pair of solar array wings and electronics that convert sunlight to power for the orbiting laboratory. Discovery is targeted to launch Feb. 12, 2009. Photo credit: NASA/Jim Grossmann
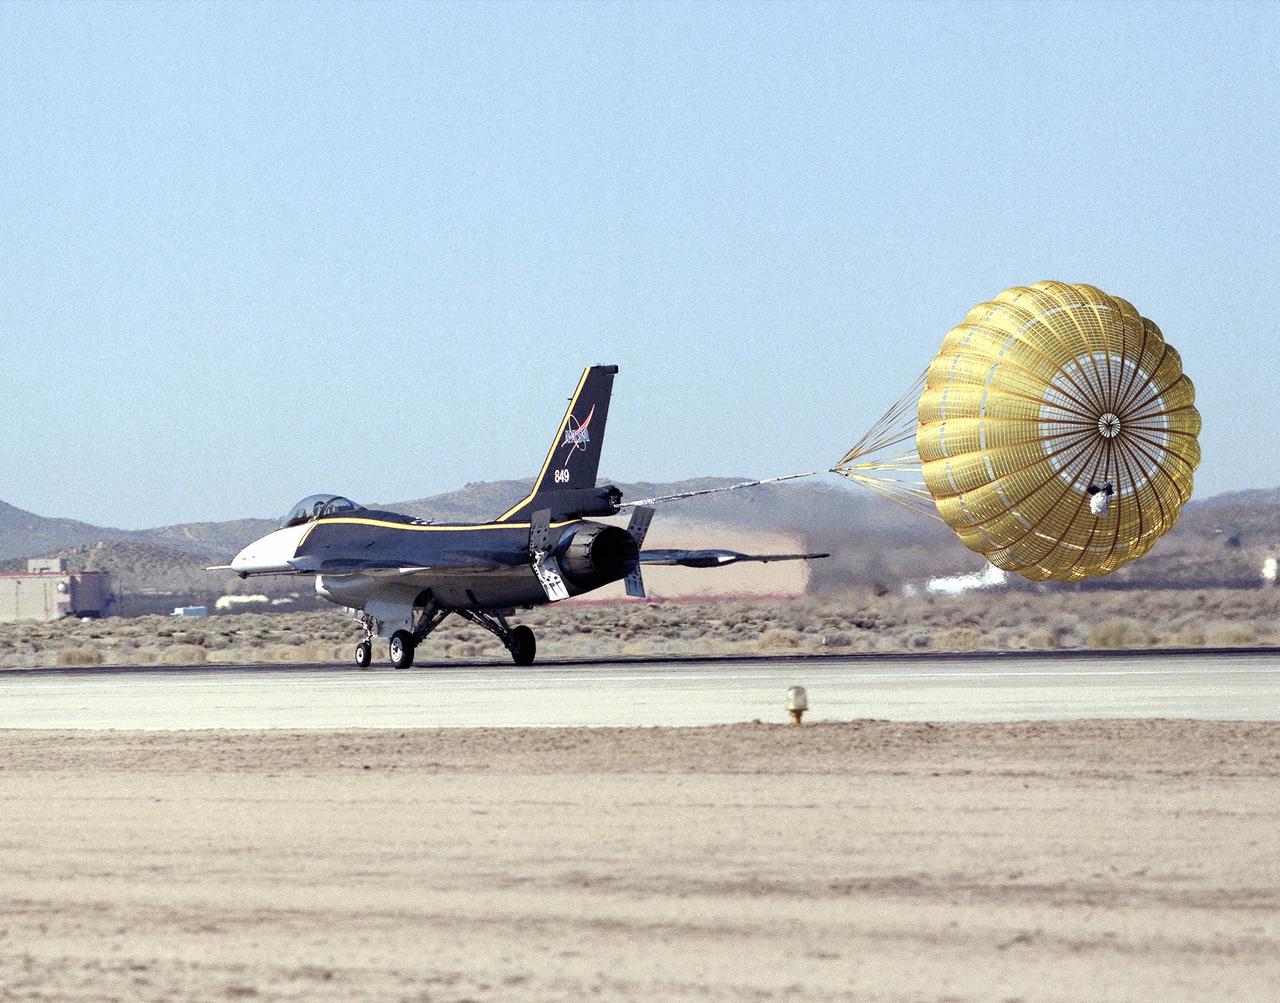
NASA's single-seat F-16XL makes a drag chute landing on the runway at Edwards Air Force Base in California's Mojave Desert. The aircraft was most recently used in the Cranked-Arrow Wing Aerodynamics Project (CAWAP) to test boundary layer pressures and distribution. Previously it had been used in a program to investigate the characteristics of sonic booms for NASA's High Speed Research Program. Data from the program will be used in the development of a high speed civilian transport. During the series of sonic boom research flights, the F-16XL was used to probe the shock waves being generated by a NASA SR-71 and record their shape and intensity.
Range : 190,000 km ( 118,000 mi.) This false color image of Triton is a composite of images taken through the violet, green and ultraviolet filters. The smallest visible features are about 4 km (2.5 mi.) across. The image shows a geologic boundary between completely dark materials and patchy light/dark materials. A layer of pinkish material stretches across the center of the image. The pinkish layer must be thin because underlying albedo patterns show through. Several features appear to be affected by the thin atmosphere; the elongated dark streaks may represent particulate materials blown in the same direction by previaling winds, and the white material may be frost deposits. Other features appear to be volcanic deposits including the smooth, dark materials alongside the long, narrow canyons. The streaks themselves appear to originate from very small circular sources, some of which are white, like the source of the prominent streak near the center of the image. The sources may be small volcanic vents with fumarolic-like activity. The colors may be due to irradiated methane, which is pink to red, and nitrogen, which is white.
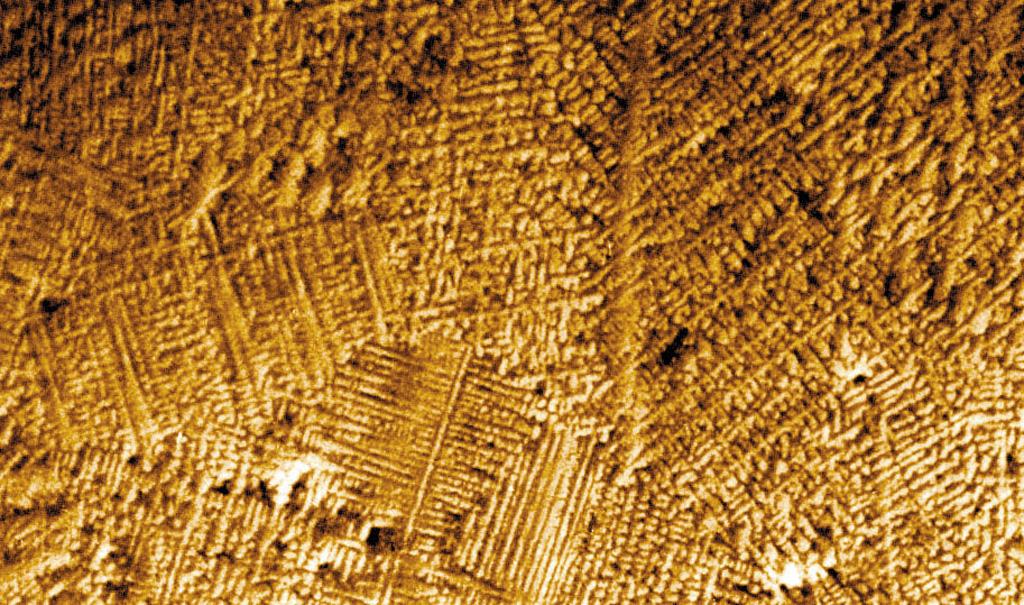
Researchers have found that as melted metals and alloys (combinations of metals) solidify, they can form with different arrangements of atoms, called microstructures. These microstructures depend on the shape of the interface (boundary) between the melted metal and the solid crystal it is forming. There are generally three shapes that the interface can take: planar, or flat; cellular, which looks like the cells of a beehive; and dendritic, which resembles tiny fir trees. Convection at this interface can affect the interface shape and hide the other phenomena (physical events). To reduce the effects of convection, researchers conduct experiments that examine and control conditions at the interface in microgravity. Microgravity also helps in the study of alloys composed of two metals that do not mix. On Earth, the liquid mixtures of these alloys settle into different layers due to gravity. In microgravity, the liquid metals do not settle, and a solid more uniform mixture of both metals can be formed.
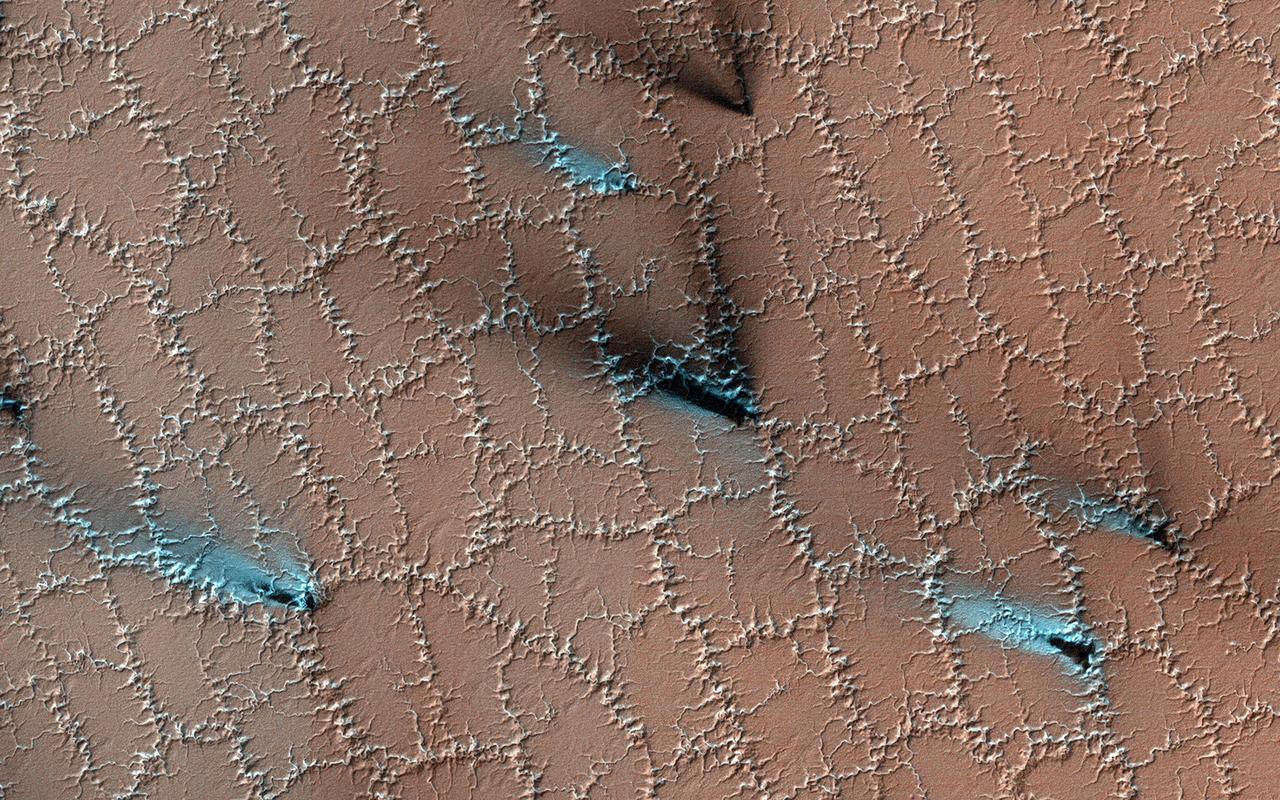
Both water and dry ice have a major role in sculpting Mars' surface at high latitudes. Water ice frozen in the soil splits the ground into polygons. Erosion of the channels forming the boundaries of the polygons by dry ice sublimating in the spring adds plenty of twists and turns to them. Spring activity is visible as the layer of translucent dry ice coating the surface develops vents that allow gas to escape. The gas carries along fine particles of material from the surface further eroding the channels. The particles drop to the surface in dark fan-shaped deposits. Sometimes the dark particles sink into the dry ice, leaving bright marks where the fans were originally deposited. Often the vent closes, then opens again, so we see two or more fans originating from the same spot but oriented in different directions as the wind changes. https://photojournal.jpl.nasa.gov/catalog/PIA25357
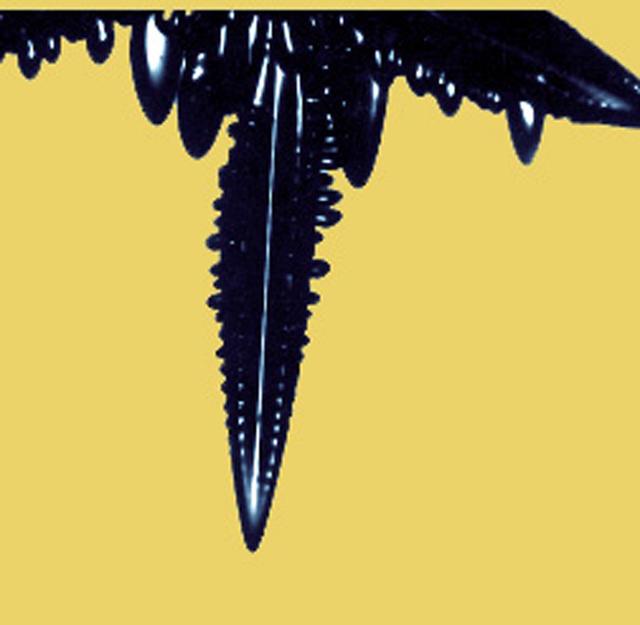
Researchers have found that as melted metals and alloys (combinations of metals) solidify, they can form with different arrangements of atoms, called microstructures. These microstructures depend on the shape of the interface (boundary) between the melted metal and the solid crystal it is forming. There are generally three shapes that the interface can take: planar, or flat; cellular, which looks like the cells of a beehive; and dendritic, which resembles tiny fir trees. Convection at this interface can affect the interface shape and hide the other phenomena (physical events). To reduce the effects of convection, researchers conduct experiments that examine and control conditions at the interface in microgravity. Microgravity also helps in the study of alloys composed of two metals that do not mix. On Earth, the liquid mixtures of these alloys settle into different layers due to gravity. In microgravity, the liquid metals do not settle, and a solid more uniform mixture of both metals can be formed.
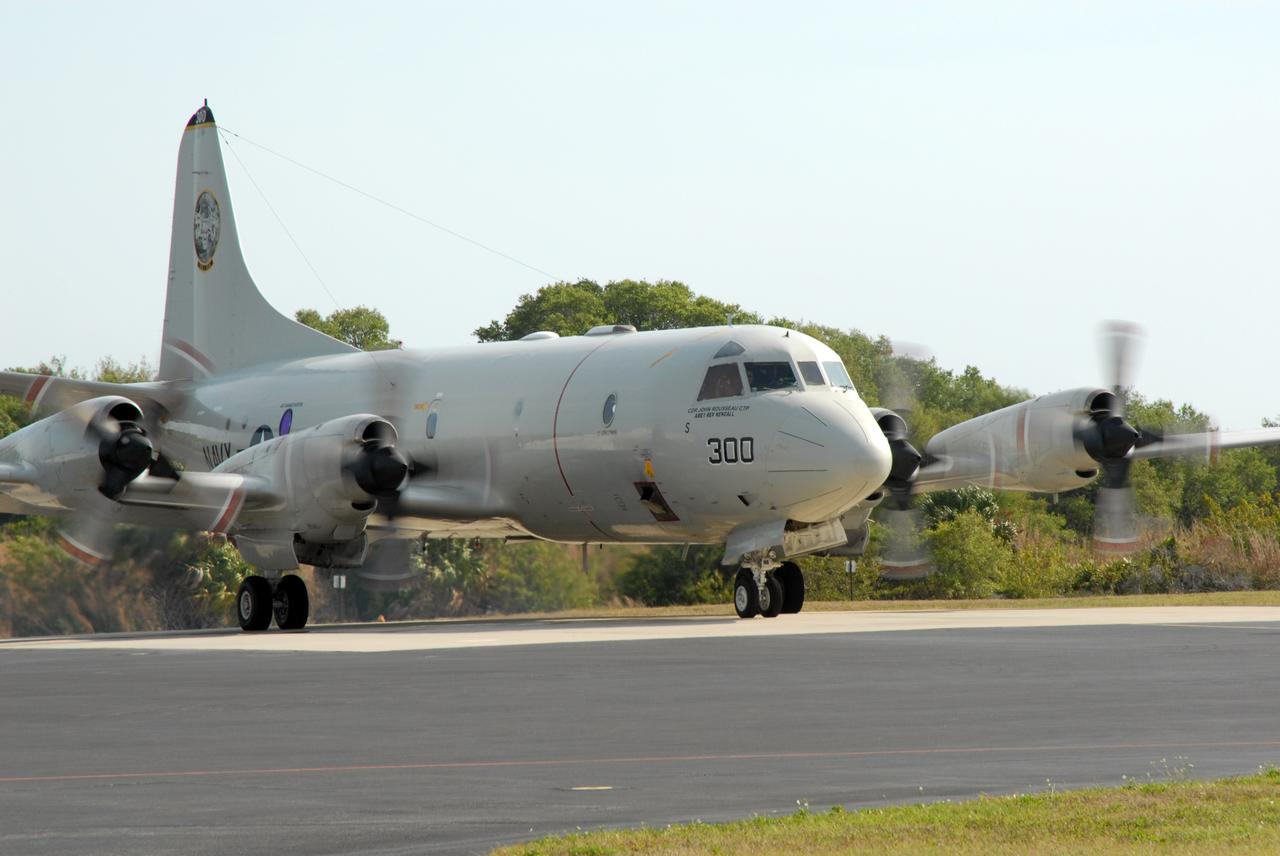
CAPE CANAVERAL, Fla. – The engines of U.S. Navy NP-3D Orion aircraft are started in preparation for takeoff from the Skid Strip at Cape Canaveral Air Force Station. The plane will fly below space shuttle Discovery as it approaches Kennedy Space Center for landing following the STS-119 mission. Onboard instruments will check the orbiter’s exterior temperatures and a long-range infrared camera will remotely monitor heating to the shuttle’s lower surface, part of the boundary layer transition flight experiment. For the experiment, a heat shield tile with a “speed bump” on it was installed under Discovery’s left wing to intentionally disturb the airflow in a controlled manner and make the airflow turbulent. The tile, a BRI-18, was originally developed as a potential heat shield upgrade on the orbiters and is being considered for use on the Constellation Program’s Orion crew exploration vehicles. The data will determine if a protuberance on a BRI-18 tile is safe to fly and will be used to verify and improve design efforts for future spacecraft. Photo credit: NASA/Jim Grossmann
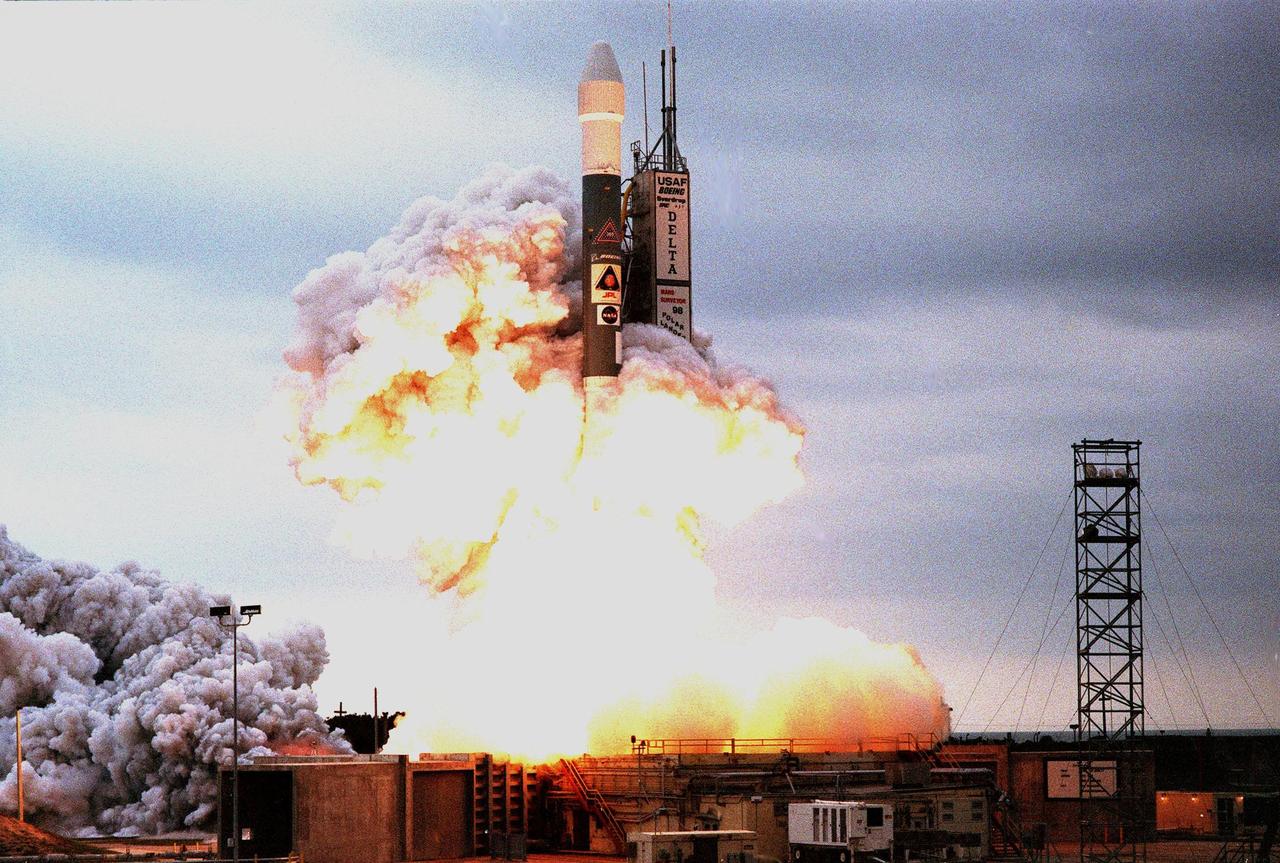
KENNEDY SPACE CENTER, FLA. -- Amid clouds of exhaust and into a gray-clouded sky , a Boeing Delta II expendable launch vehicle lifts off with NASA's Mars Polar Lander at 3:21:10 p.m. EST from Launch Complex 17B, Cape Canaveral Air Station. The lander is a solar-powered spacecraft designed to touch down on the Martian surface near the northern-most boundary of the south polar cap, which consists of carbon dioxide ice. The lander will study the polar water cycle, frosts, water vapor, condensates and dust in the Martian atmosphere. It is equipped with a robotic arm to dig beneath the layered terrain at the polar cap. In addition, Deep Space 2 microprobes, developed by NASA's New Millennium Program, are installed on the lander's cruise stage. After crashing into the planet's surface, they will conduct two days of soil and water experiments up to 1 meter (3 feet) below the Martian surface, testing new technologies for future planetary descent probes. The lander is the second spacecraft to be launched in a pair of Mars Surveyor '98 missions. The first is the Mars Climate Orbiter, which was launched aboard a Delta II rocket from Launch Complex 17A on Dec. 11, 1998.
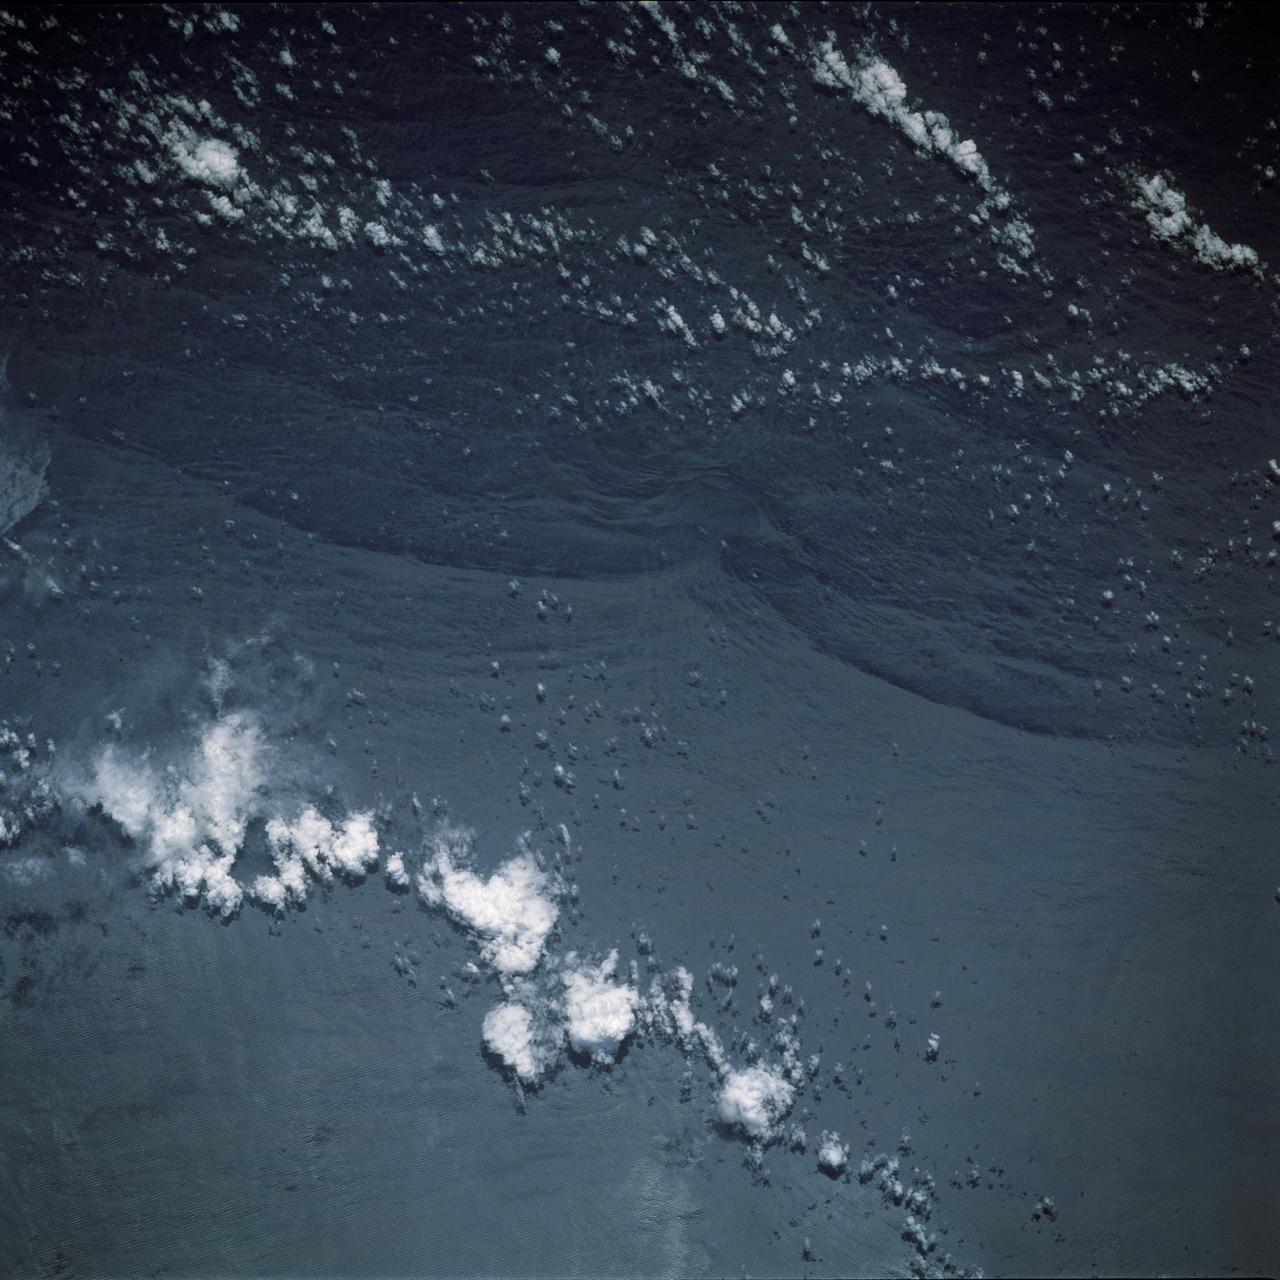
STS044-79-077 (24 Nov.-1 Dec. 1991) --- This photograph, captured from the Earth-orbiting Space Shuttle Atlantis, shows sunglint pattern in the western tropical Indian Ocean. Several large internal waves reflect around a shallow area on the sea floor. NASA scientists studying the STS-44 photography believe the shallow area to be a sediment (a submerged mountain) on top of the Mascarene Plateau, located northeast of Madagascar at approximately 5.6 degrees south latitude and 55.7 degrees east longitude. Internal waves are similar to surface ocean waves, except that they travel inside the water column along the boundary between water layers of different density. At the surface, their passage is marked on the sea surface by bands of smooth and rough water. These bands appear in the sunglint pattern as areas of brighter or darker water. NASA scientists point out that, when the waves encounter an obstacle, such as a near-surface seamount, they bend or refract around the obstacle in the same manner as surface waves bend around an island or headland.
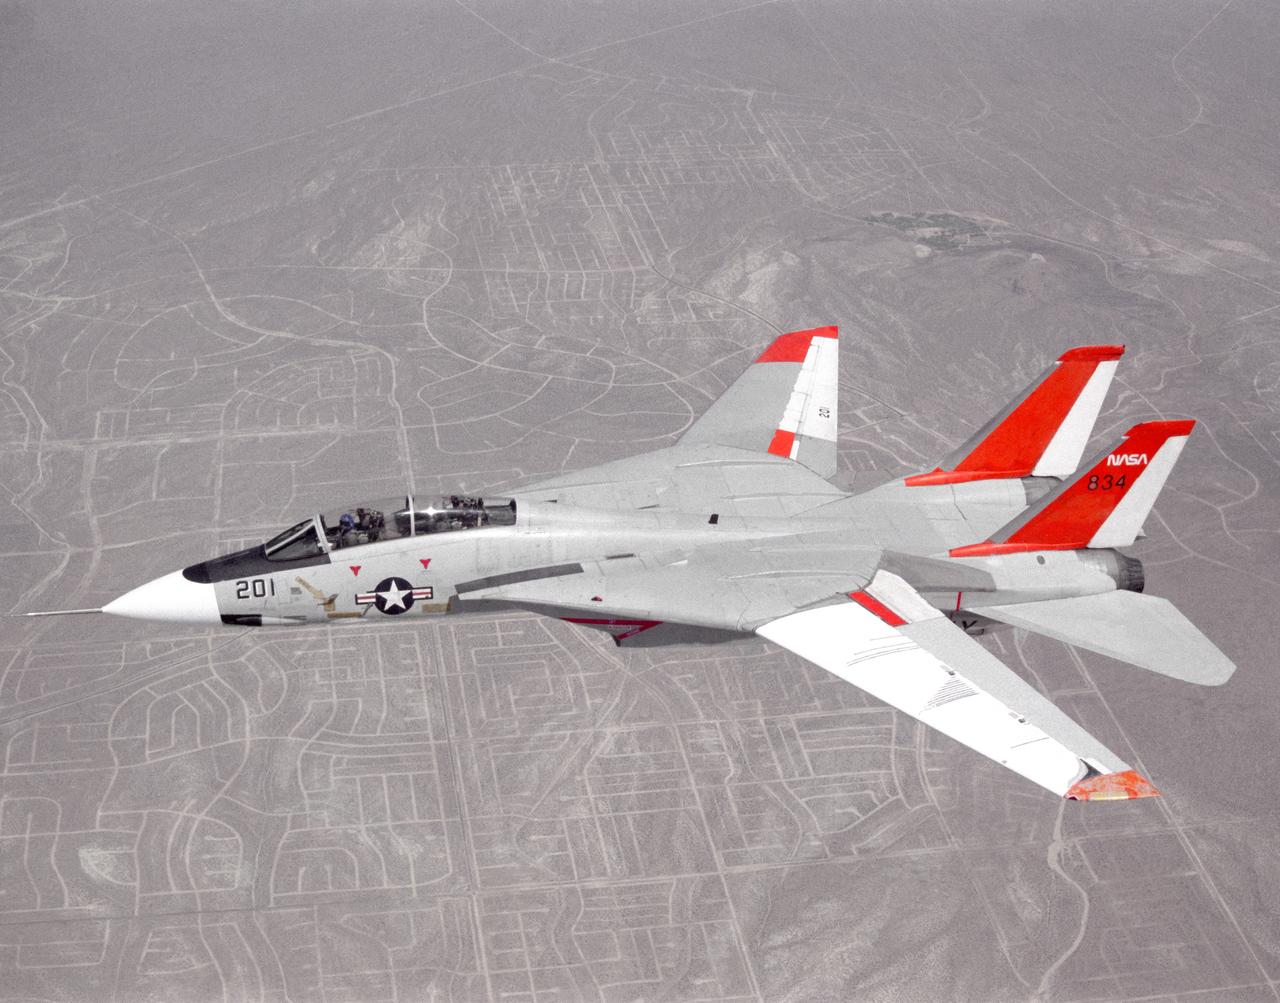
NASA 834, an F-14 Navy Tomcat, seen here in flight, was used at Dryden in 1986 and 1987 in a program known as the Variable-Sweep Transition Flight Experiment (VSTFE). This program explored laminar flow on variable sweep aircraft at high subsonic speeds. An F-14 aircraft was chosen as the carrier vehicle for the VSTFE program primarily because of its variable-sweep capability, Mach and Reynolds number capability, availability, and favorable wing pressure distribution. The variable sweep outer-panels of the F-14 aircraft were modified with natural laminar flow gloves to provide not only smooth surfaces but also airfoils that can produce a wide range of pressure distributions for which transition location can be determined at various flight conditions and sweep angles. Glove I, seen here installed on the upper surface of the left wing, was a "cleanup" or smoothing of the basic F-14 wing, while Glove II was designed to provide specific pressure distributions at Mach 0.7. Laminar flow research continued at Dryden with a research program on the NASA 848 F-16XL, a laminar flow experiment involving a wing-mounted panel with millions of tiny laser cut holes drawing off turbulent boundary layer air with a suction pump.
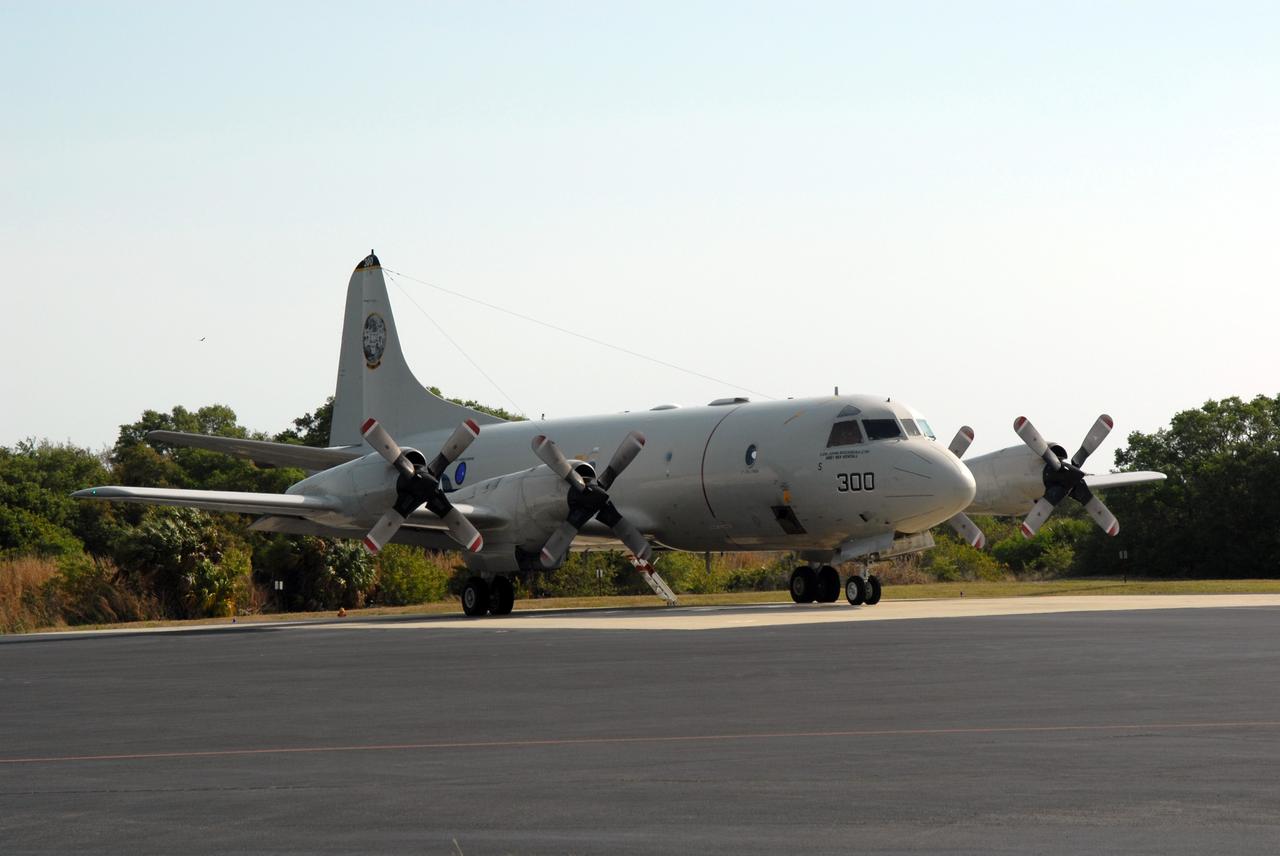
CAPE CANAVERAL, Fla. -- A U.S. Navy NP-3D Orion aircraft prepares for takeoff from the Skid Strip at Cape Canaveral Air Force Station. The plane will fly below space shuttle Discovery as it approaches Kennedy Space Center for landing following the STS-119 mission. Onboard instruments will check the orbiter’s exterior temperatures and a long-range infrared camera will remotely monitor heating to the shuttle’s lower surface, part of the boundary layer transition flight experiment. For the experiment, a heat shield tile with a “speed bump” on it was installed under Discovery’s left wing to intentionally disturb the airflow in a controlled manner and make the airflow turbulent. The tile, a BRI-18, was originally developed as a potential heat shield upgrade on the orbiters and is being considered for use on the Constellation Program’s Orion crew exploration vehicles. The data will determine if a protuberance on a BRI-18 tile is safe to fly and will be used to verify and improve design efforts for future spacecraft. Photo credit: NASA/Jim Grossmann
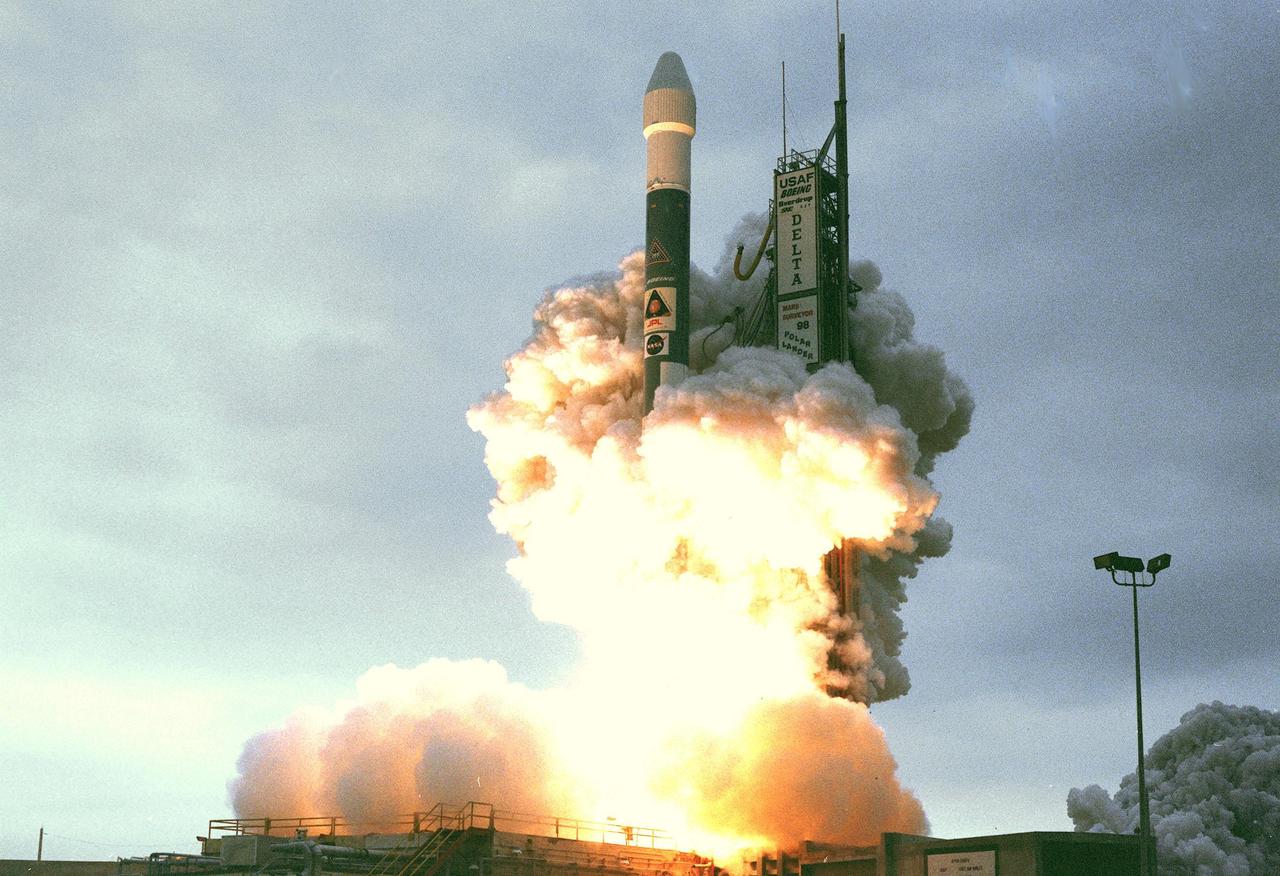
KENNEDY SPACE CENTER, FLA. -- Amid clouds of exhaust, a Boeing Delta II expendable launch vehicle with NASA's Mars Polar Lander clears Launch Complex 17B, Cape Canaveral Air Station, after launch at 3:21:10 p.m. EST. The lander is a solar-powered spacecraft designed to touch down on the Martian surface near the northern-most boundary of the south polar cap, which consists of carbon dioxide ice. The lander will study the polar water cycle, frosts, water vapor, condensates and dust in the Martian atmosphere. It is equipped with a robotic arm to dig beneath the layered terrain at the polar cap. In addition, Deep Space 2 microprobes, developed by NASA's New Millennium Program, are installed on the lander's cruise stage. After crashing into the planet's surface, they will conduct two days of soil and water experiments up to 1 meter (3 feet) below the Martian surface, testing new technologies for future planetary descent probes. The lander is the second spacecraft to be launched in a pair of Mars Surveyor '98 missions. The first is the Mars Climate Orbiter, which was launched aboard a Delta II rocket from Launch Complex 17A on Dec. 11, 1998.
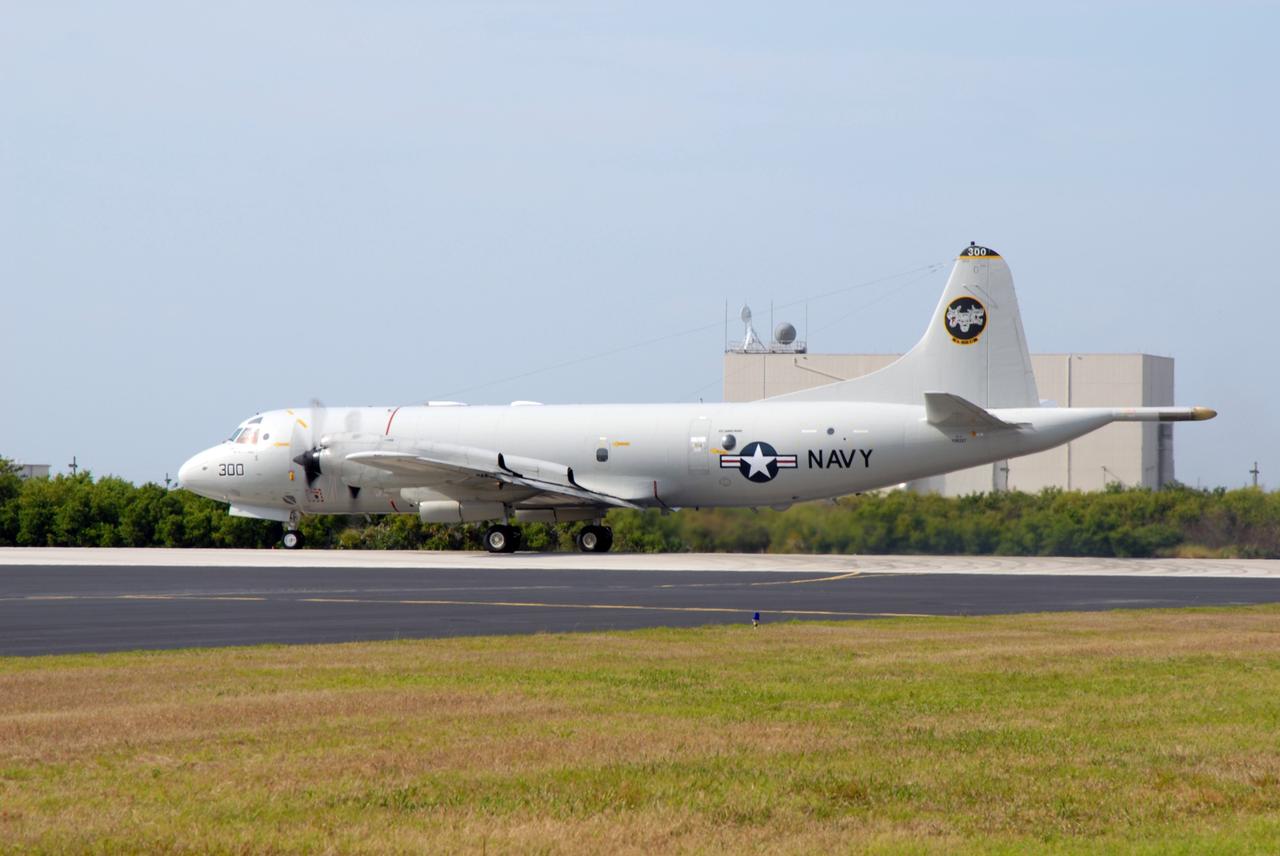
CAPE CANAVERAL, Fla. – A U.S. Navy NP-3D Orion aircraft takes off from the Skid Strip at Cape Canaveral Air Force Station. The plane will fly below space shuttle Discovery as it approaches Kennedy Space Center for landing following the STS-119 mission. Onboard instruments will check the orbiter’s exterior temperatures and a long-range infrared camera will remotely monitor heating to the shuttle’s lower surface, part of the boundary layer transition flight experiment. For the experiment, a heat shield tile with a “speed bump” on it was installed under Discovery’s left wing to intentionally disturb the airflow in a controlled manner and make the airflow turbulent. The tile, a BRI-18, was originally developed as a potential heat shield upgrade on the orbiters and is being considered for use on the Constellation Program’s Orion crew exploration vehicles. The data will determine if a protuberance on a BRI-18 tile is safe to fly and will be used to verify and improve design efforts for future spacecraft. Photo credit: NASA/Jim Grossmann
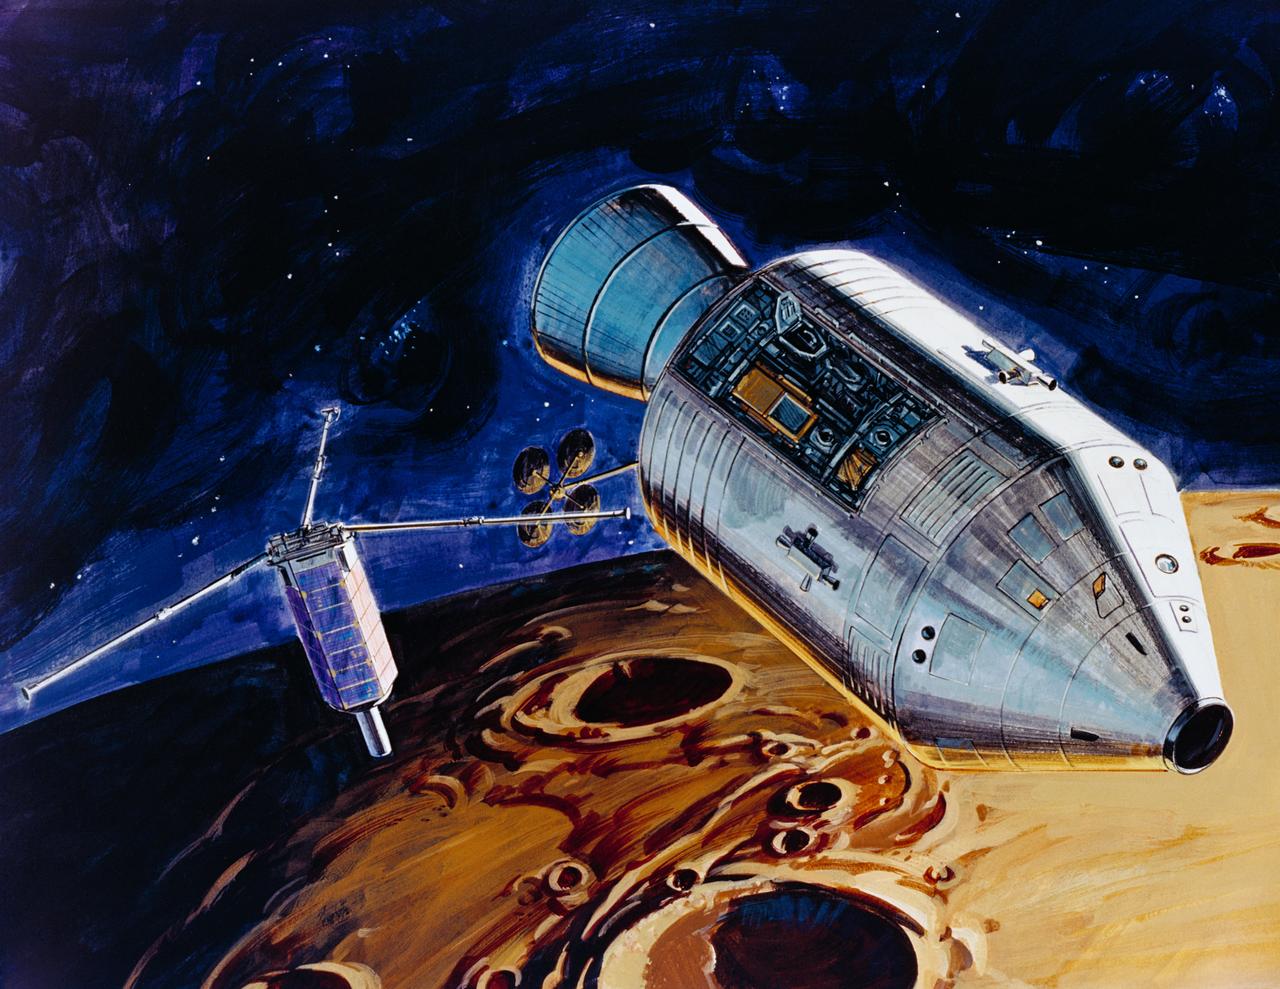
S71-39481 (July 1971) --- An artist's concept showing TRW's small lunar subsatellite being ejected into lunar orbit from the SIM bay of the Apollo 15 Service Module. The 80-pound satellite will remain in orbit a year or more, carrying scientific experiments to study space in the vicinity of the moon. The satellite carries three experiments: S-Band Transponder; Particle Shadows/Boundary Layer Experiment; and Subsatellite Magnetometer Experiment. The subsatellite is housed in a container resembling a rural mailbox, and when deployed is spring-ejected out-of-plane at 4 fps with a spin rate of 140 rpm. After the satellite booms are deployed, the spin rate is stabilized at about 12 rpm. The subsatellite is 31 inches long and has a 14 inch hexagonal diameter. The exact weight is 78.5 pounds. The folded booms deploy to a length of five feet. Subsatellite electrical power is supplied by a solar cell array outputting 25 watts for dayside operation and a rechargeable silver-cadmium battery for nightside passes.

KENNEDY SPACE CENTER, FLA. -- Silhouetted against the gray sky, a Boeing Delta II expendable launch vehicle with NASA's Mars Polar Lander lifts off from Launch Complex 17B, Cape Canaveral Air Station, at 3:21:10 p.m. EST. The lander is a solar-powered spacecraft designed to touch down on the Martian surface near the northern-most boundary of the south polar cap, which consists of carbon dioxide ice. The lander will study the polar water cycle, frosts, water vapor, condensates and dust in the Martian atmosphere. It is equipped with a robotic arm to dig beneath the layered terrain at the polar cap. In addition, Deep Space 2 microprobes, developed by NASA's New Millennium Program, are installed on the lander's cruise stage. After crashing into the planet's surface, they will conduct two days of soil and water experiments up to 1 meter (3 feet) below the Martian surface, testing new technologies for future planetary descent probes. The lander is the second spacecraft to be launched in a pair of Mars Surveyor '98 missions. The first is the Mars Climate Orbiter, which was launched aboard a Delta II rocket from Launch Complex 17A on Dec. 11, 1998.

This image of a "jet" in Jupiter's atmosphere was taken by the JunoCam public engagement camera aboard NASA's Juno spacecraft on May 23, 2022. Jupiter's atmosphere is organized into belts and zones, separated by jets, which are associated with turbulence along belt-zone boundaries, leading to chaotic regions of multicolored clouds. In this image, the color in these two regions has been enhanced to bring out detail and show the different layers of cloud decks. Juno's orbit around Jupiter changes every time the spacecraft passes the giant planet, with the point of closest approach – the perijove, or "PJ" – moving steadily northward. As the perijove changes, the resolution of images taken in the northern hemisphere steadily increases. This image of Jet N3 was acquired on PJ42, Juno's 42nd pass by Jupiter, at 41.6 degrees north from an altitude of 2,361 miles (3,800 kilometers). It shows features as small as 1.6 miles (2.6 kilometers) across. Citizen scientist Sergio Díaz processed the image to enhance the color and contrast. https://photojournal.jpl.nasa.gov/catalog/PIA25693
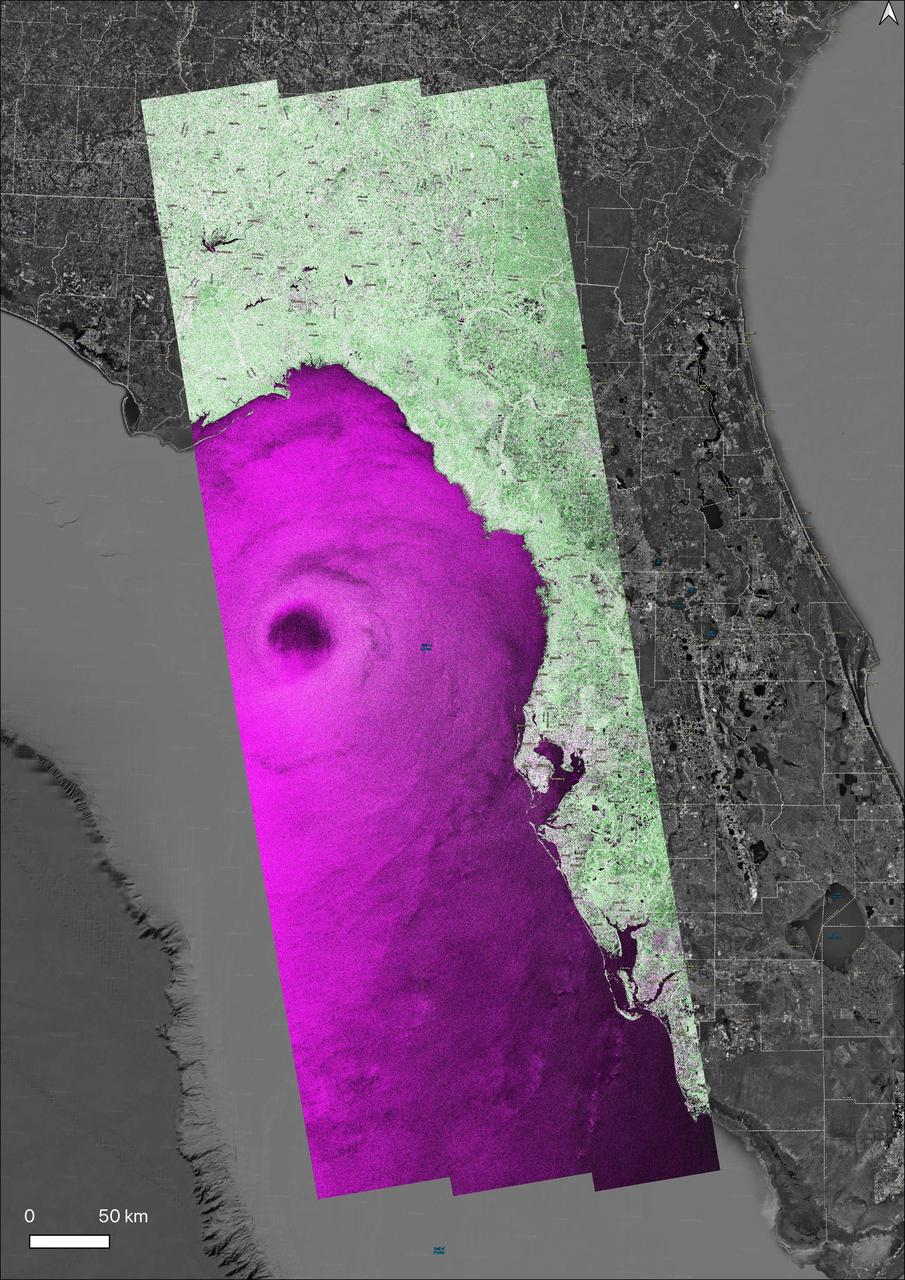
NASA's Observational Products for End-Users from Remote Sensing Analysis (OPERA) project generated a radar image of Hurricane Helene on Friday, Sept. 26, 2024, at 7:38 p.m. local time, as the storm approached the Florida coast. One of the largest storms to develop in the Gulf of Mexico in the last century, Helene made landfall as a Category 4 hurricane in the Big Bend area of Florida at about 11:10 p.m. The data shown in the image is from the synthetic aperture radar (SAR) instrument on the Copernicus Sentinel-1A satellite, operated by the European Space Agency (ESA), and processed by OPERA into a data product called OPERA RTC-S1. The OPERA RTC-S1 image was converted to a false color image. In this color scale, vegetated areas appear green, urban areas appear white/pink, calm water appears black, and rough water appears purple or magenta. The eye of the hurricane can be clearly seen as a large dark patch in the Gulf of Mexico. The OPERA RTC-S1 image was superimposed on a Google Earth satellite background shown in grayscale and the ESRI Boundaries Places layer. https://photojournal.jpl.nasa.gov/catalog/PIA26414
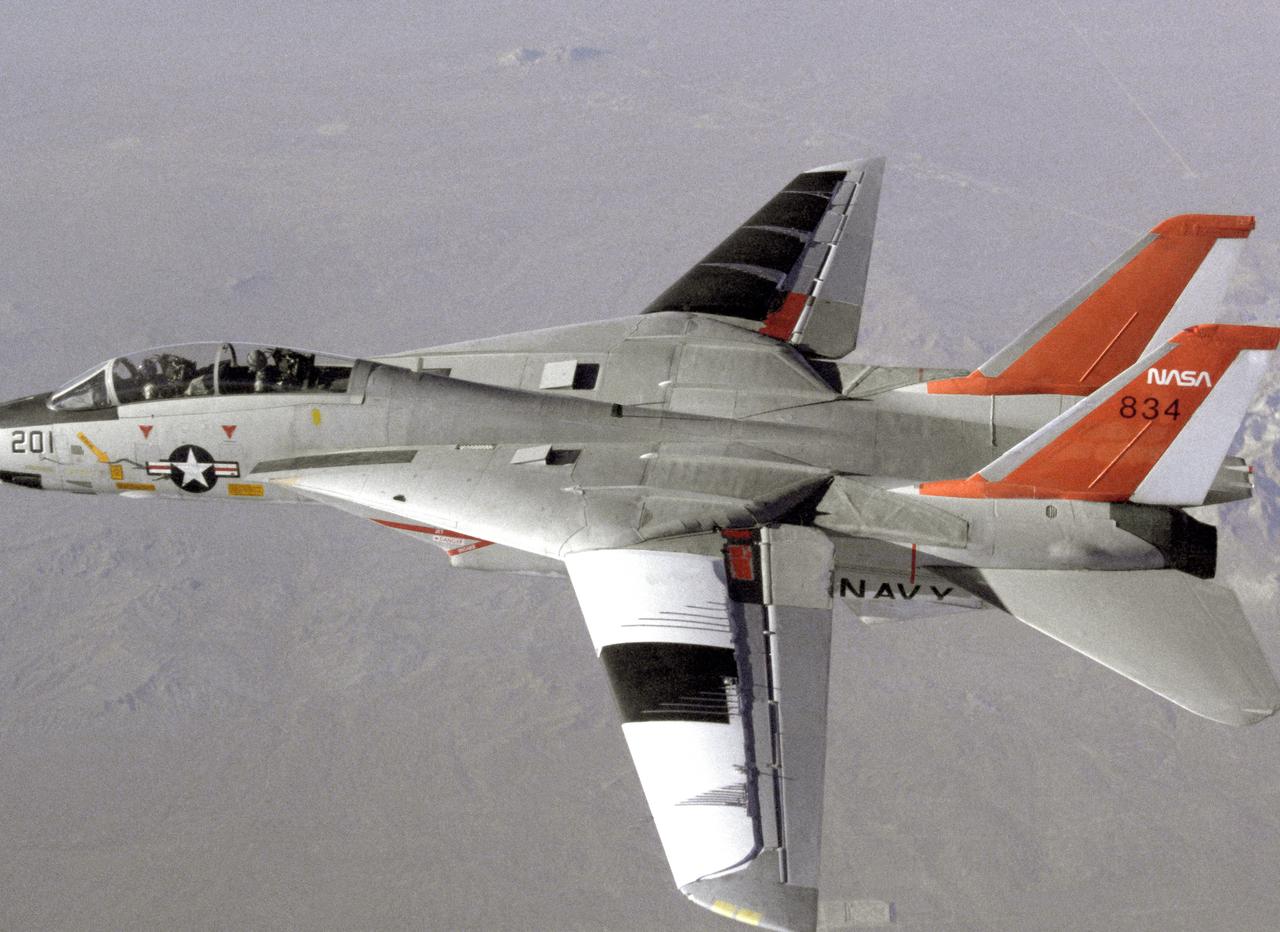
NASA 834, an F-14 Navy Tomcat, seen here in flight, was used at Dryden in 1986 and 1987 in a program known as the Variable-Sweep Transition Flight Experiment (VSTFE). This program explored laminar flow on variable sweep aircraft at high subsonic speeds. An F-14 aircraft was chosen as the carrier vehicle for the VSTFE program primarily because of its variable-sweep capability, Mach and Reynolds number capability, availability, and favorable wing pressure distribution. The variable sweep outer-panels of the F-14 aircraft were modified with natural laminar flow gloves to provide not only smooth surfaces but also airfoils that can produce a wide range of pressure distributions for which transition location can be determined at various flight conditions and sweep angles. Glove I, seen here installed on the upper surface of the left wing, was a "cleanup" or smoothing of the basic F-14 wing, while Glove II was designed to provide specific pressure distributions at Mach 0.7. Laminar flow research continued at Dryden with a research program on the NASA 848 F-16XL, a laminar flow experiment involving a wing-mounted panel with millions of tiny laser cut holes drawing off turbulent boundary layer air with a suction pump.
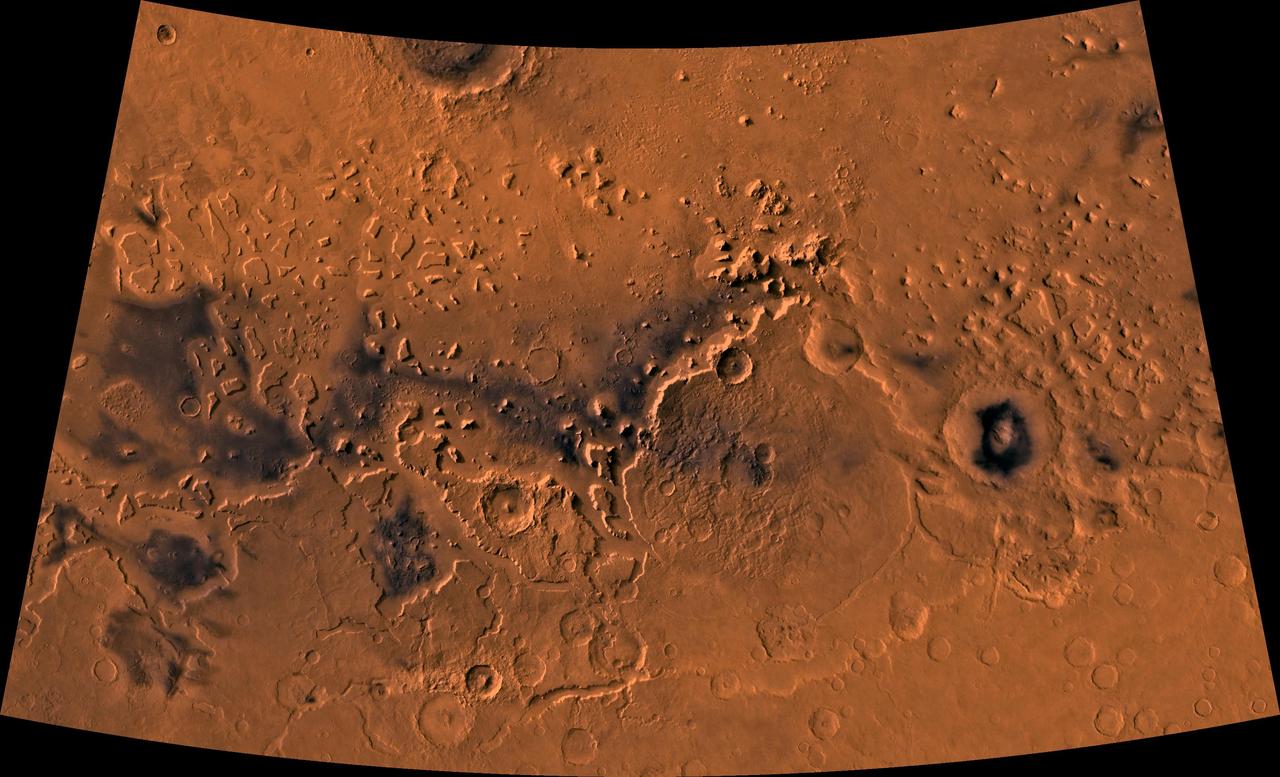
Color image of part of the Ismenius Lacus region of Mars (MC-5 quadrangle) containing the impact crater Moreux (right center); north toward top. The scene shows heavily cratered highlands in the south on relatively smooth lowland plains in the north separated by a belt of dissected terrain, containing flat-floored valleys, mesas, and buttes. This image is a composite of Viking medium-resolution images in black and white and low-resolution images in color. The image extends from latitude 36 degrees N. to 50 degrees N. and from longitude 310 degrees to 340 degrees; Lambert conformal conic projection. The dissected terrain along the highlands/lowlands boundary consists of the flat-floored valleys of Deuteronilus Mensae (on left) and Prontonilus Mensae (on right) and farther north the small, rounded hills of knobby terrain. Flows on the mensae floors contain striae that run parallel to valley walls; where valleys meet, the striae merge, similar to medial moraines on glaciers. Terraces within the valley hills have been interpreted as either layered rocks or wave terraces. The knobby terrain has been interpreted as remnants of the old, densely cratered highland terrain perhaps eroded by mass wasting. http://photojournal.jpl.nasa.gov/catalog/PIA00420

STS111-E-5451 (17 June 2002) --- Sharp air mass boundaries, such as this one photographed by astronauts on board the Space Shuttle Endeavour on June 17, 2002, often are the focus of development for severe thunderstorms. According to meteorologists, this storm formed in the late afternoon over Eastern China. The sunlit anvil tops of thunderstorms here are estimated to be in excess of 60,000 feet (18,300 meters) where icy cirrus clouds form near the top of the troposphere. The distribution and impact of such high clouds are a significant challenge to scientists modeling the Earth’s energy budget and climate. The crew of the International Space Station is attempting to acquire such imagery over Florida this summer in support of a large, multi-agency experiment CRYSTAL - FACE (Cirrus Regional Study of Tropical Anvils and Cirrus Layers - Florida Area Cirrus Experiment). This experiment is designed to collect measurements of clouds that will help improve climate models. Such photos have the potential to provide profound, synoptic visuals for use in describing and interpreting these measurements. More information on CRYSTAL - FACE as well as other images of the atmosphere are available at http://cloud1.arc.nasa.gov/crystalface/.
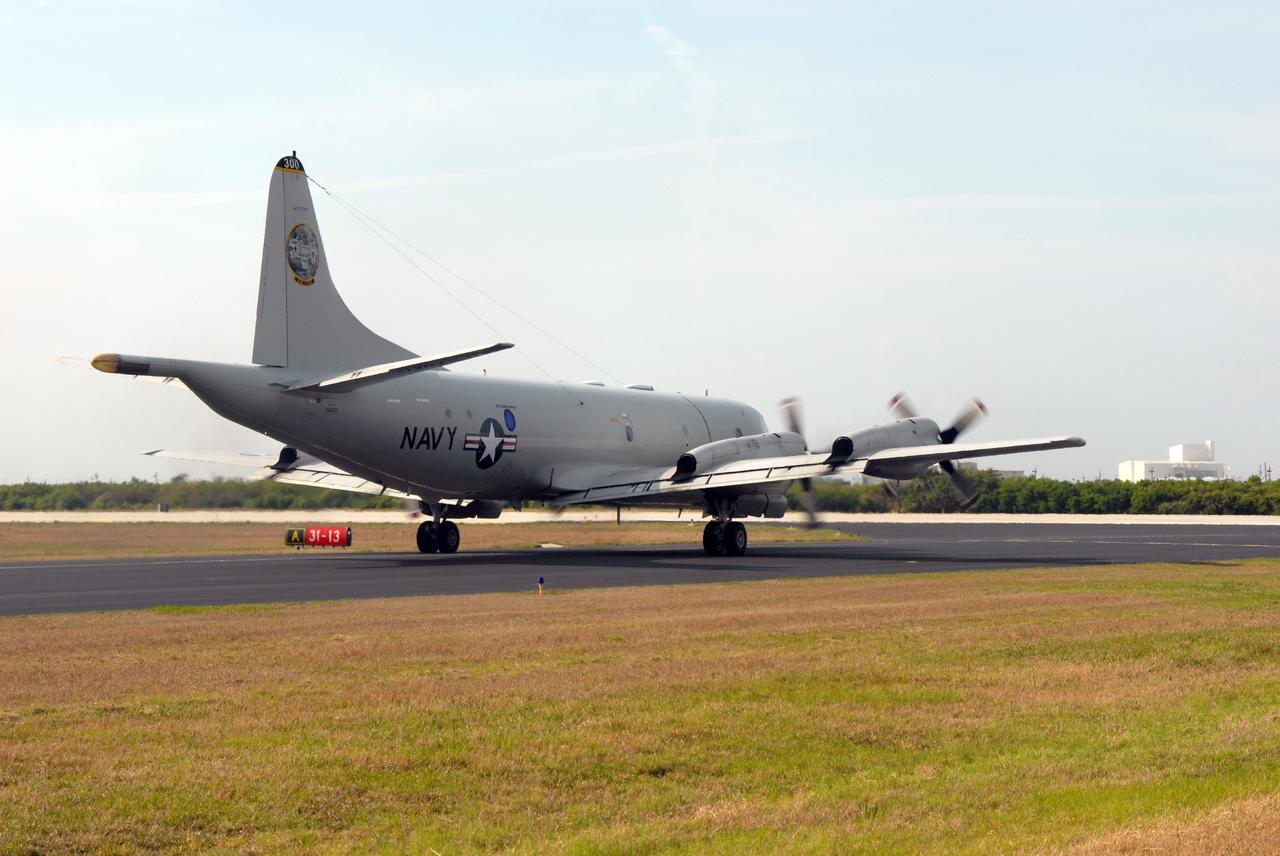
CAPE CANAVERAL, Fla. – A U.S. Navy NP-3D Orion aircraft taxies to the runway of the Skid Strip at Cape Canaveral Air Force Station in preparation for takeoff. The plane will fly below space shuttle Discovery as it approaches Kennedy Space Center for landing following the STS-119 mission. Onboard instruments will check the orbiter’s exterior temperatures and a long-range infrared camera will remotely monitor heating to the shuttle’s lower surface, part of the boundary layer transition flight experiment. For the experiment, a heat shield tile with a “speed bump” on it was installed under Discovery’s left wing to intentionally disturb the airflow in a controlled manner and make the airflow turbulent. The tile, a BRI-18, was originally developed as a potential heat shield upgrade on the orbiters and is being considered for use on the Constellation Program’s Orion crew exploration vehicles. The data will determine if a protuberance on a BRI-18 tile is safe to fly and will be used to verify and improve design efforts for future spacecraft. Photo credit: NASA/Jim Grossmann
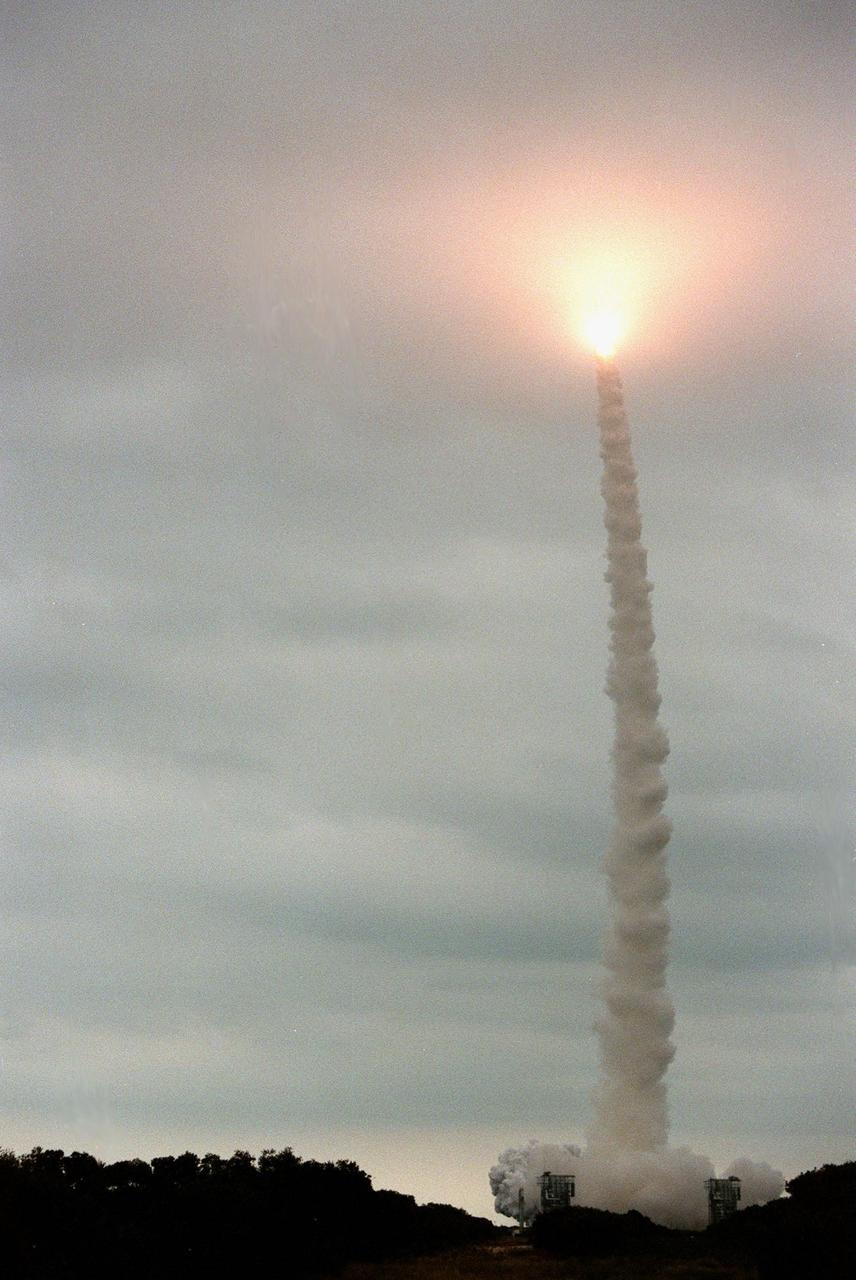
KENNEDY SPACE CENTER, FLA. -- Looking like a Roman candle, the exhaust from the Boeing Delta II rocket with the Mars Polar Lander aboard lights up the clouds as it hurtles skyward. The rocket was launched at 3:21:10 p.m. EST from Launch Complex 17B, Cape Canaveral Air Station. The lander is a solar-powered spacecraft designed to touch down on the Martian surface near the northern-most boundary of the south polar cap, which consists of carbon dioxide ice. The lander will study the polar water cycle, frosts, water vapor, condensates and dust in the Martian atmosphere. It is equipped with a robotic arm to dig beneath the layered terrain. In addition, Deep Space 2 microprobes, developed by NASA's New Millennium Program, are installed on the lander's cruise stage. After crashing into the planet's surface, they will conduct two days of soil and water experiments up to 1 meter (3 feet) below the Martian surface, testing new technologies for future planetary descent probes. The lander is the second spacecraft to be launched in a pair of Mars Surveyor '98 missions. The first is the Mars Climate Orbiter, which was launched aboard a Delta II rocket from Launch Complex 17A on Dec. 11, 1998.
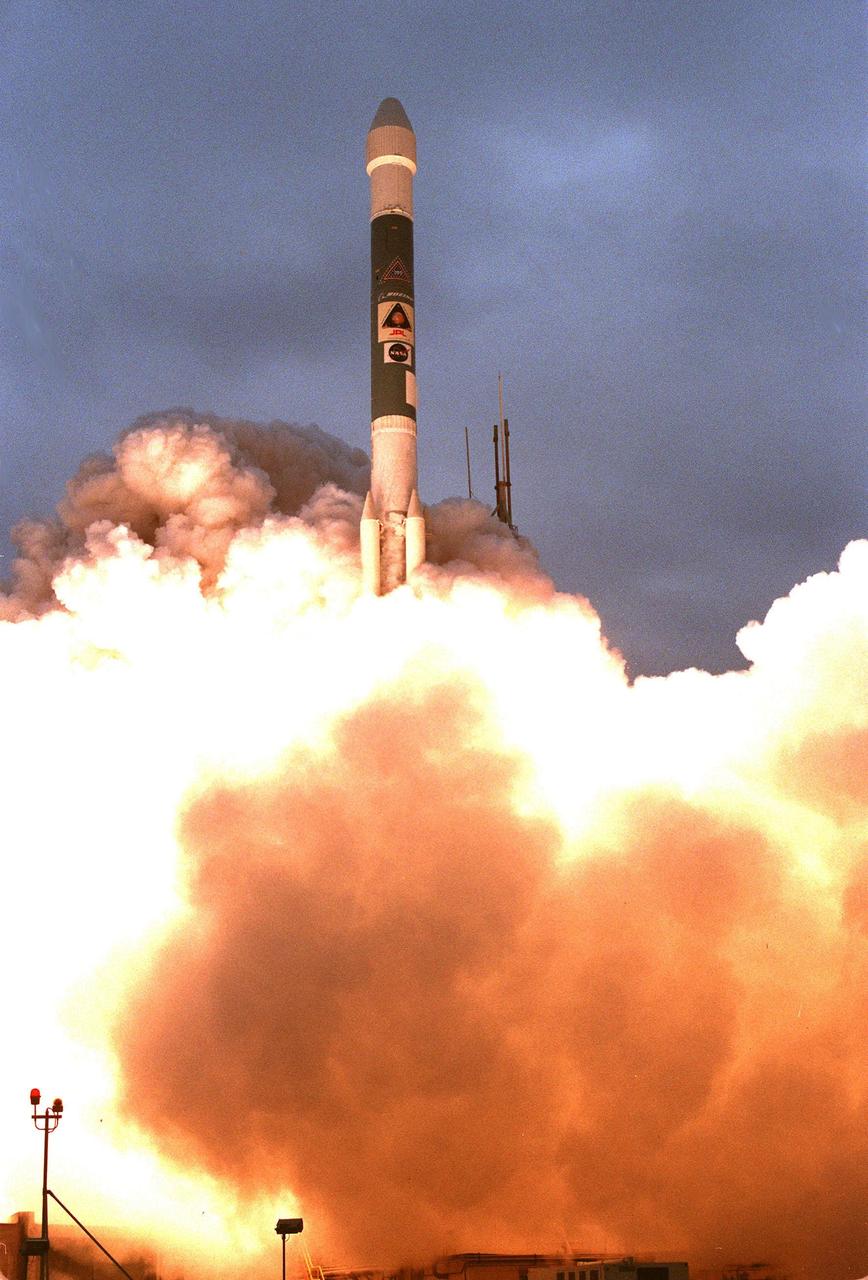
KENNEDY SPACE CENTER, FLA. -- A Boeing Delta II expendable launch vehicle lifts off with NASA's Mars Polar Lander into a cloud-covered sky at 3:21:10 p.m. EST from Launch Complex 17B, Cape Canaveral Air Station. The lander is a solar-powered spacecraft designed to touch down on the Martian surface near the northern-most boundary of the south polar cap, which consists of carbon dioxide ice. The lander will study the polar water cycle, frosts, water vapor, condensates and dust in the Martian atmosphere. It is equipped with a robotic arm to dig beneath the layered terrain at the polar cap. In addition, Deep Space 2 microprobes, developed by NASA's New Millennium Program, are installed on the lander's cruise stage. After crashing into the planet's surface, they will conduct two days of soil and water experiments up to 1 meter (3 feet) below the Martian surface, testing new technologies for future planetary descent probes. The lander is the second spacecraft to be launched in a pair of Mars Surveyor '98 missions. The first is the Mars Climate Orbiter, which was launched aboard a Delta II rocket from Launch Complex 17A on Dec. 11, 1998.

ISS027-E-012224 (12 April 2011) --- Sunset over western South America is featured in this image photographed by an Expedition 27 crew member on the International Space Station. Crew members onboard the space station see, on average, sixteen sunrises and sunsets during a 24-hour orbital period. Each changeover between day and night on the ground is marked by the terminator, or line separating the sunlit side of Earth from the side in darkness. While the terminator is conceptualized as a hard boundary?and is frequently presented as such in graphics and visualizations?in reality the boundary between light and dark is diffuse due to scattering of light by Earth?s atmosphere. This zone of diffuse lighting is experienced as dusk or twilight on the ground ? while the sun is no longer visible, some illumination is still present due to light scattering over the local horizon. The terminator is visible in this photograph trending across the image from lower left to upper right. This panoramic view across central South America, looking towards the northeast, was acquired at approximately 7:37 p.m. local time. Layers of Earth?s atmosphere, colored bright white to deep blue, are visible extending across the horizon (or limb). The highest cloud tops have a reddish glow from the direct light of the setting sun while lower clouds are in twilight. The Salar de Coipasa, a large salt lake in Bolivia, is dimly visible on the night side of the terminator. The salar provides a geographic reference point that allows the location and viewing orientation of the image to be determined.
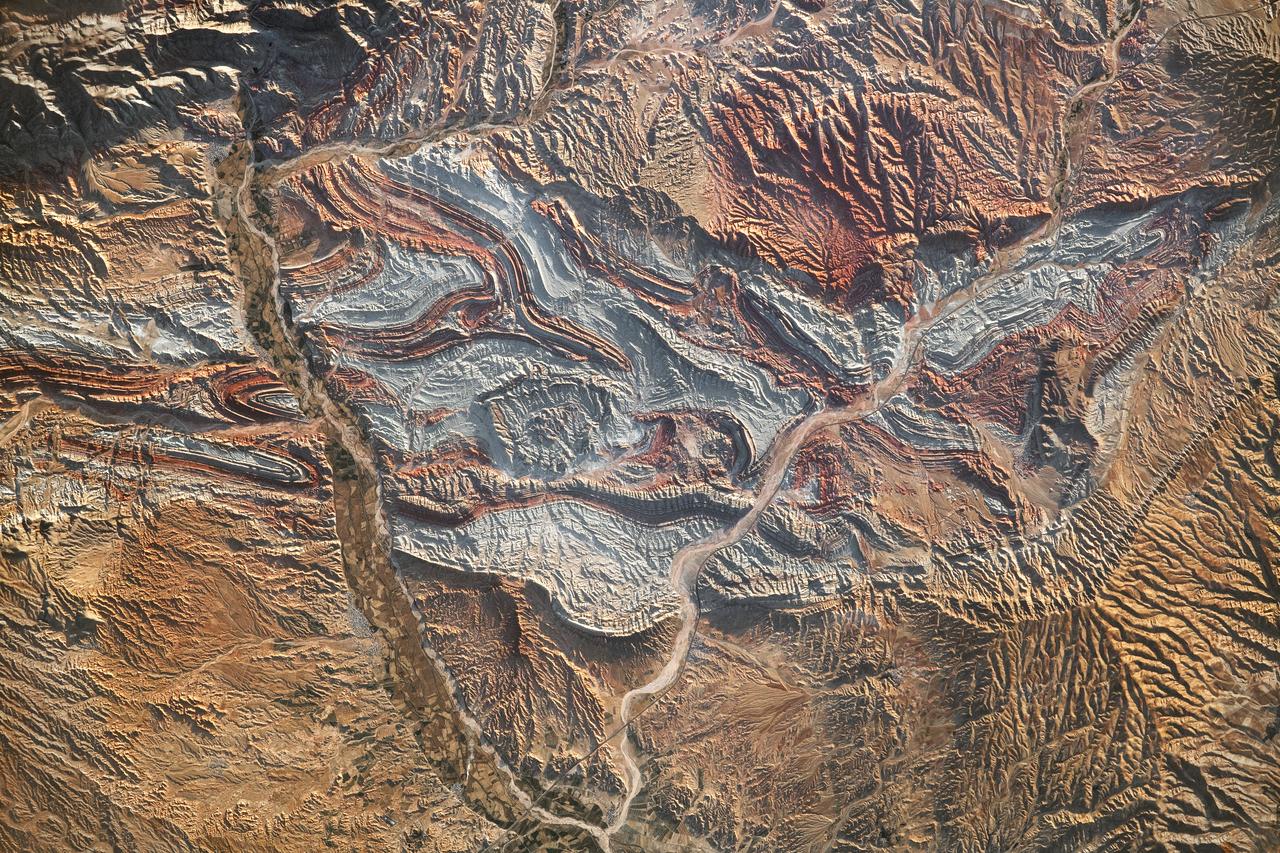
iss069-e-089946_lrg (09/19/2023) --- An astronaut aboard the International Space Station took this photograph of the rugged landscape of the Aladaghlar Mountains in northwestern Iran. Ridges cast shadows in the valleys and other low elevation areas, creating a three-dimensional appearance. Human alterations to the landscape are most evident in riverbeds, where the even topography is easier to build on and navigate. Natural processes over millions of years have folded rock layers of various compositions and colors into the curved patterns seen here. These folds are produced by tectonic forces operating along the convergent plate boundary of the Arabia and Eurasia plates. The convergence of these tectonic plates causes uplift, folding, and deformation of the colorful rock layers, and subsequent erosion exposes them. On the left side of this photo, the Qezel Ozan River, a major river in northern Iran, cuts across the landscape. Agricultural fields are visible along the riverbanks tucked between the mountains. The Qezel Ozan also intersects the Zanjan-Tabriz freeway (Freeway 2), a major thoroughfare built on a dried riverbed connecting the cities of Tehran and Tabriz. Astronaut photograph ISS069-E-89946 was acquired on September 19, 2023, with a Nikon D5 digital camera using a focal length of 400 millimeters. The image was provided by the ISS Crew Earth Observations Facility and the Earth Science and Remote Sensing Unit at Johnson Space Center. The image was taken by a member of the Expedition 69 crew. It has been cropped and enhanced to improve contrast, and lens artifacts have been removed. The International Space Station Program supports the laboratory as part of the ISS National Lab to help astronauts take pictures of Earth that will be of the greatest value to scientists and the public and to make those images freely available on the Internet. Additional images taken by astronauts and cosmonauts can be viewed at the NASA/JSC Gateway to Astronaut Photography of Earth. Caption by Sara Schmidt, GeoControl Systems, JETS II Contract at NASA-JSC and Andrea Wenzel, Jacobs-JETS II Contract at NASA-JSC.
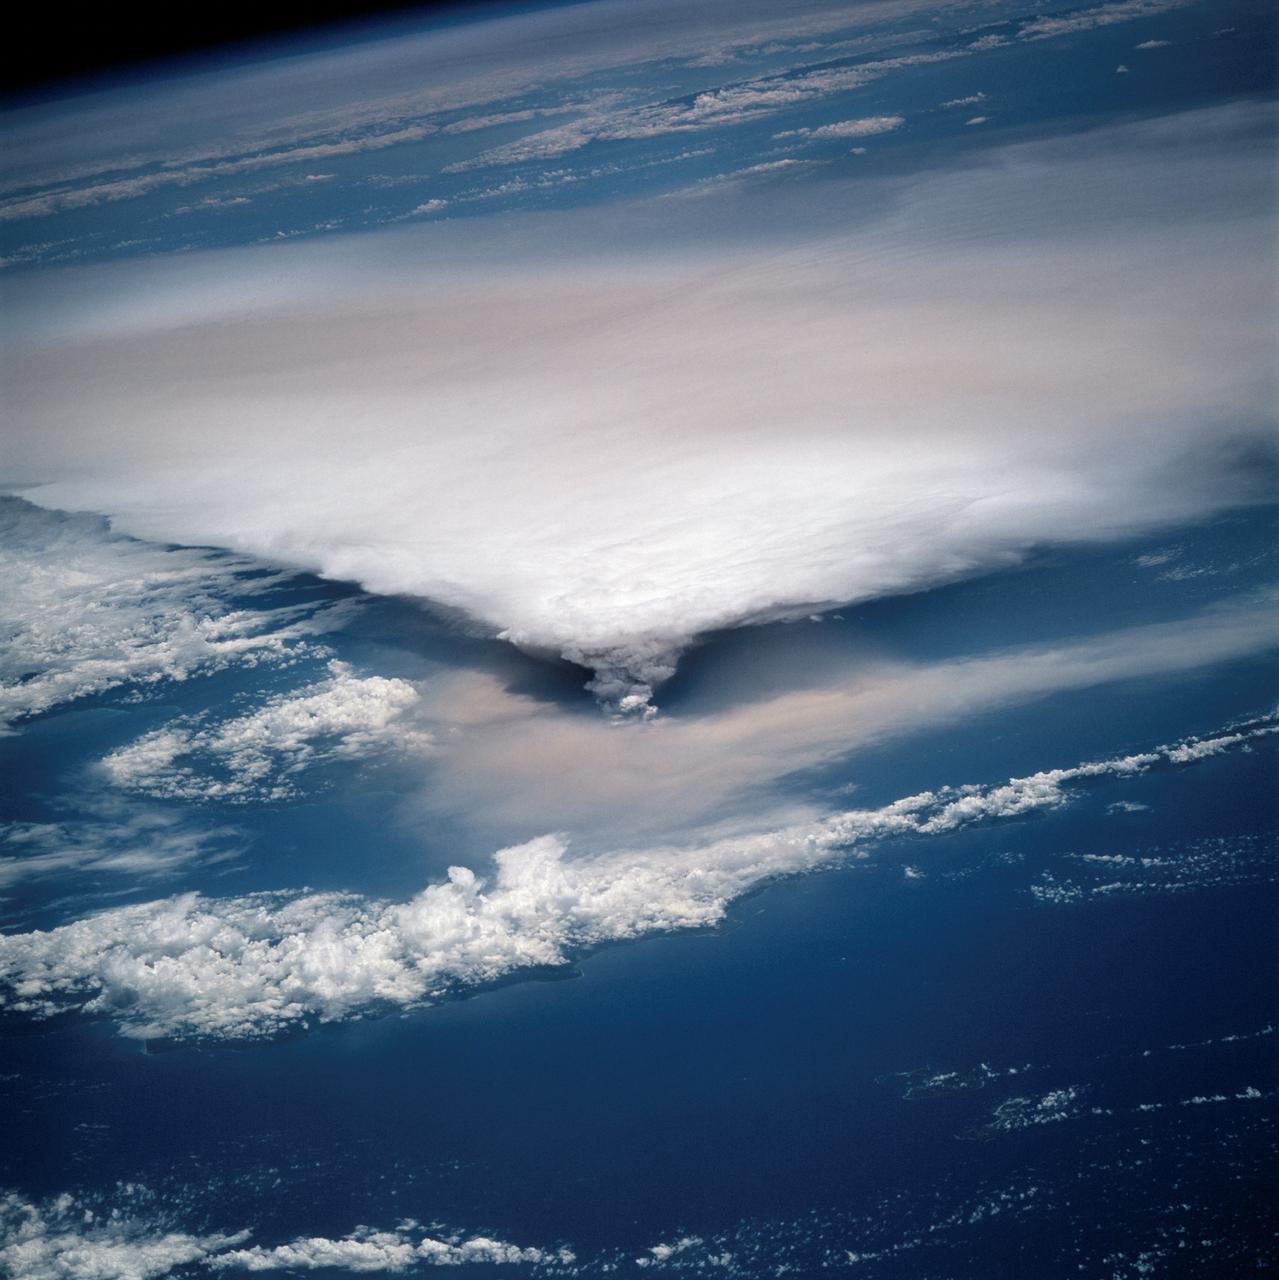
STS064-116-064 (20 Sept. 1994) --- Near the end of the mission, the crew aboard space shuttle Discovery was able to document the beginning of the second day of activity of the Rabaul volcano, on the east end of New Britain. On the morning of Sept. 19, 1994, two volcanic cones on the opposite sides of the 6-kilometer sea crater had begun to erupt with very little warning. Discovery flew just east of the eruption roughly 24 hours after it started and near the peak of its activity. New Ireland, the cloud-covered area in the foreground, lies just east of Rabaul harbor. The eruption, which sent a plume up to over 60,000 feet into the atmosphere, caused over 50,000 people to evacuate the area. Because winds were light at the time of the eruption, most of the ash was deposited in a region within 20 kilometers of the eruption zone. This photo shows the large white billowing eruption plume is carried in a westerly direction by the weak prevailing winds. At the base of the eruption column is a layer of yellow-brown ash being distributed by lower level winds. A sharp boundary moving outward from the center of the eruption in the lower cloud is a pulse of laterally-moving ash which results from a volcanic explosion. Geologists theorize that the large white column and the lower gray cloud are likely from the two main vents on each side of the harbor. The bay and harbor of Rabaul are covered with a layer of ash, possibly partly infilled with volcanic material. Matupit Island and the airport runway have disappeared into the bay. More than a meter of ash has fallen upon the city of Rabaul. Up to five vents were reported to have erupted at once, including the two cones Vulcan and Tavurvur, which are opposites of the harbor as well as new vents below the bay. Half of the Vulcan cone has collapsed into the sea. The extra day in space due to bad weather at the landing site afforded the crew the opportunity for both still and video coverage of the event. Photo credit: NASA or National Aeronautics and Space Administration

In this highest-resolution image from NASA's New Horizons spacecraft, great blocks of Pluto's water-ice crust appear jammed together in the informally named al-Idrisi mountains. Some mountain sides appear coated in dark material, while other sides are bright. Several sheer faces appear to show crustal layering, perhaps related to the layers seen in some of Pluto's crater walls. Other materials appear crushed between the mountains, as if these great blocks of water ice, some standing as much as 1.5 miles high, were jostled back and forth. The mountains end abruptly at the shoreline of the informally named Sputnik Planum, where the soft, nitrogen-rich ices of the plain form a nearly level surface, broken only by the fine trace work of striking, cellular boundaries and the textured surface of the plain's ices (which is possibly related to sunlight-driven ice sublimation). This view is about 50 miles wide. The top of the image is to Pluto's northwest. These images were made with the telescopic Long Range Reconnaissance Imager (LORRI) aboard New Horizons, in a timespan of about a minute centered on 11:36 UT on July 14 -- just about 15 minutes before New Horizons' closest approach to Pluto -- from a range of just 10,000 miles (17,000 kilometers). They were obtained with an unusual observing mode; instead of working in the usual "point and shoot," LORRI snapped pictures every three seconds while the Ralph/Multispectral Visual Imaging Camera (MVIC) aboard New Horizons was scanning the surface. This mode requires unusually short exposures to avoid blurring the images. http://photojournal.jpl.nasa.gov/catalog/PIA20198
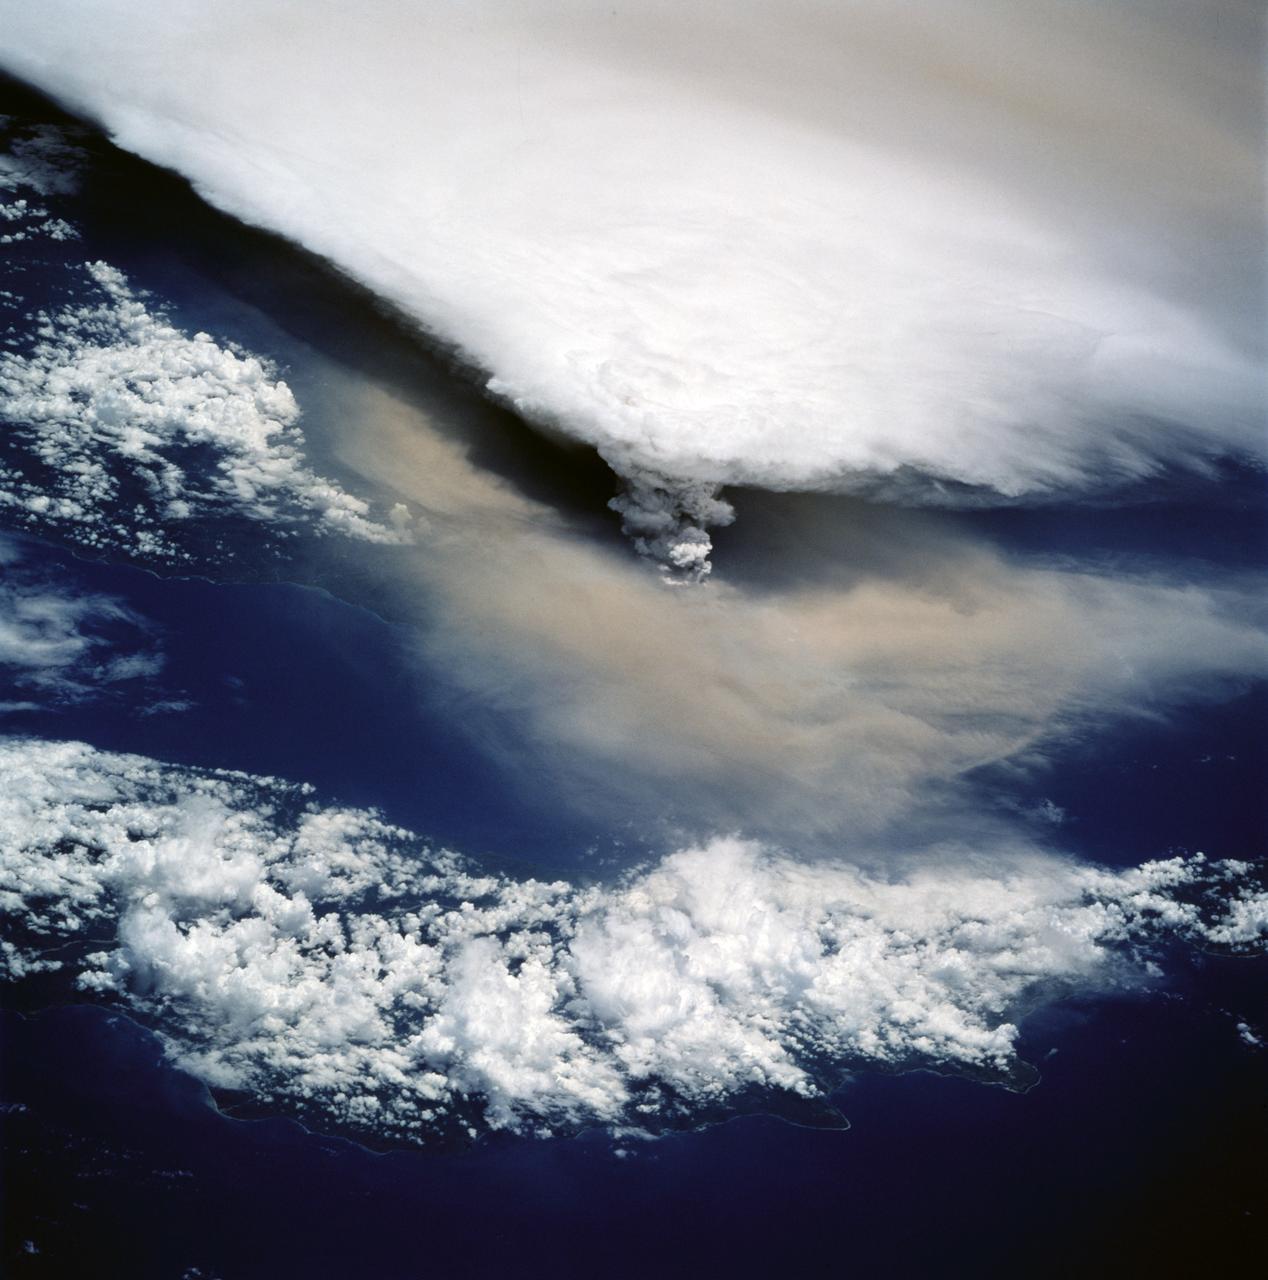
STS064-116-055 (20 Sept. 1994) --- Near the end of its mission, the crew aboard space shuttle Discovery was able to document the beginning of the second day of activity of the Rabaul volcano, on the east end of New Britain. On the morning of Sept. 19, 1994, two volcanic cones on the opposite sides of the 6-kilometer sea crater had begun to erupt with very little warning. Discovery flew just east of the eruption roughly 24 hours after it started and near the peak of its activity. The eruption, which sent a plume up to over 60,000 feet into the atmosphere, caused over 50,000 people to evacuate the area. Because winds were light at the time of the eruption, most of the ash was deposited in a region within 20 kilometers of the eruption zone. This photo shows the large white billowing eruption plume is carried in a westerly direction by the weak prevailing winds. At the base of the eruption column is a layer of yellow-brown ash being distributed by lower level winds. A sharp boundary moving outward from the center of the eruption in the lower cloud is a pulse of laterally-moving ash which results from a volcanic explosion. Geologists theorize that the large white column and the lower gray cloud are likely from the two main vents on each side of the harbor. The cloud-covered island in the foreground is New Ireland. The bay and harbor of Rabaul are covered with a layer of ash, possibly partly infilled with volcanic material. Matupit Island and the airport runway have disappeared into the bay. More than a meter of ash has fallen upon the city of Rabaul. Up to five vents were reported to have erupted at once, including the cones Vulcan and Tavurvur, which are opposites of the harbor as well as new vents below the bay. Half of the Vulcan cone has collapsed into the sea. The extra day in space due to bad weather at the landing site afforded the crew the opportunity for both still and video coverage of the event. Photo credit: NASA or National Aeronautics and Space Administration