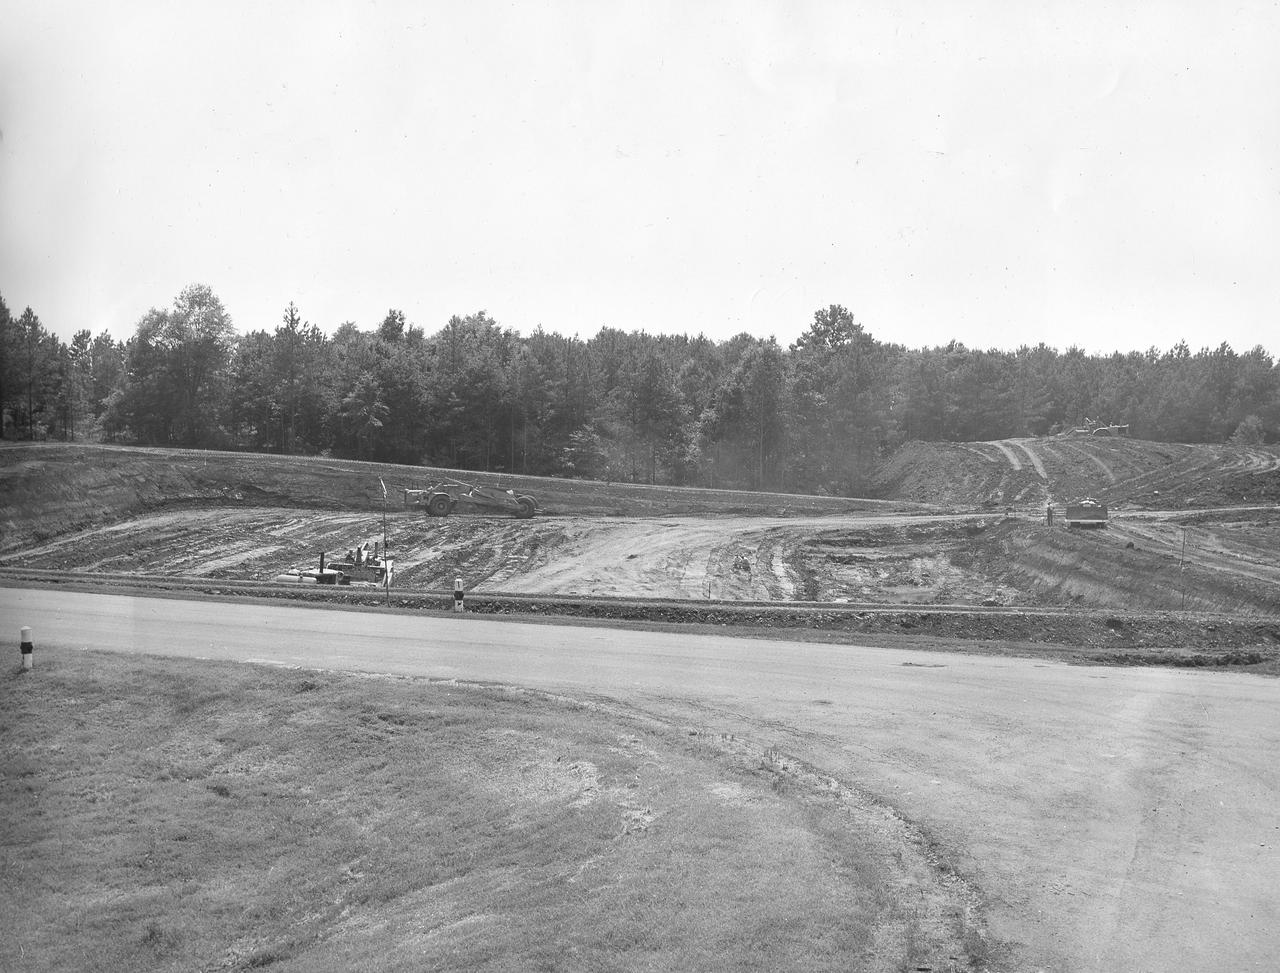
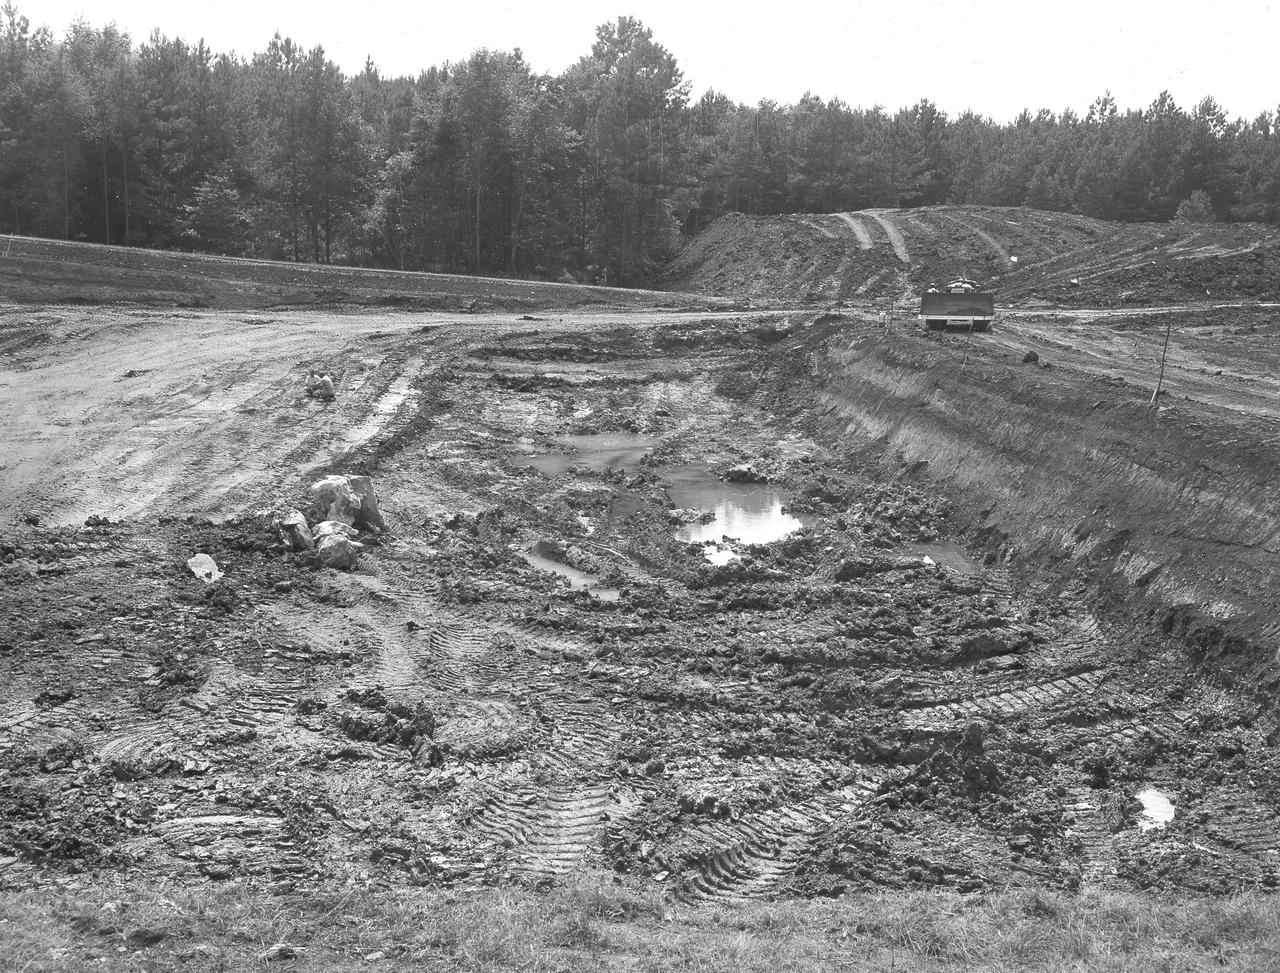
At its founding, the Marshall Space Flight Center (MSFC) inherited the Army’s Jupiter and Redstone test stands, but much larger facilities were needed for the giant stages of the Saturn V. From 1960 to 1964, the existing stands were remodeled and a sizable new test area was developed. The new comprehensive test complex for propulsion and structural dynamics was unique within the nation and the free world, and they remain so today because they were constructed with foresight to meet the future as well as on going needs. Construction of the S-IC Static test stand complex began in 1961 in the west test area of MSFC, and was completed in 1964. The S-IC static test stand was designed to develop and test the 138-ft long and 33-ft diameter Saturn V S-IC first stage, or booster stage, weighing in at 280,000 pounds. Required to hold down the brute force of a 7,500,000-pound thrust produced by 5 F-1 engines, the S-IC static test stand was designed and constructed with the strength of hundreds of tons of steel and 12,000,000 pounds of cement, planted down to bedrock 40 feet below ground level. The foundation walls, constructed with concrete and steel, are 4 feet thick. The base structure consists of four towers with 40-foot-thick walls extending upward 144 feet above ground level. The structure was topped by a crane with a 135-foot boom. With the boom in the upright position, the stand was given an overall height of 405 feet, placing it among the highest structures in Alabama at the time. In this photo, taken July 10, 1961, actual ground breaking has occurred for the S-IC test stand site.
At its founding, the Marshall Space Flight Center (MSFC) inherited the Army’s Jupiter and Redstone test stands, but much larger facilities were needed for the giant stages of the Saturn V. From 1960 to 1964, the existing stands were remodeled and a sizable new test area was developed. The new comprehensive test complex for propulsion and structural dynamics was unique within the nation and the free world, and they remain so today because they were constructed with foresight to meet the future as well as on going needs. Construction of the S-IC Static test stand complex began in 1961 in the west test area of MSFC, and was completed in 1964. The S-IC static test stand was designed to develop and test the 138-ft long and 33-ft diameter Saturn V S-IC first stage, or booster stage, weighing in at 280,000 pounds. Required to hold down the brute force of a 7,500,000-pound thrust produced by 5 F-1 engines, the S-IC static test stand was designed and constructed with the strength of hundreds of tons of steel and 12,000,000 pounds of cement, planted down to bedrock 40 feet below ground level. The foundation walls, constructed with concrete and steel, are 4 feet thick. The base structure consists of four towers with 40-foot-thick walls extending upward 144 feet above ground level. The structure was topped by a crane with a 135-foot boom. With the boom in the upright position, the stand was given an overall height of 405 feet, placing it among the highest structures in Alabama at the time. In this photo, taken July 10, 1961, actual ground breaking has occurred for the S-IC test stand site.

Acquired by NASA Terra spacecraft, this image shows the west coast of Greenland, one of Earth premiere incubators for icebergs -- large blocks of land ice that break off from glaciers or ice shelves and float in the ocean.
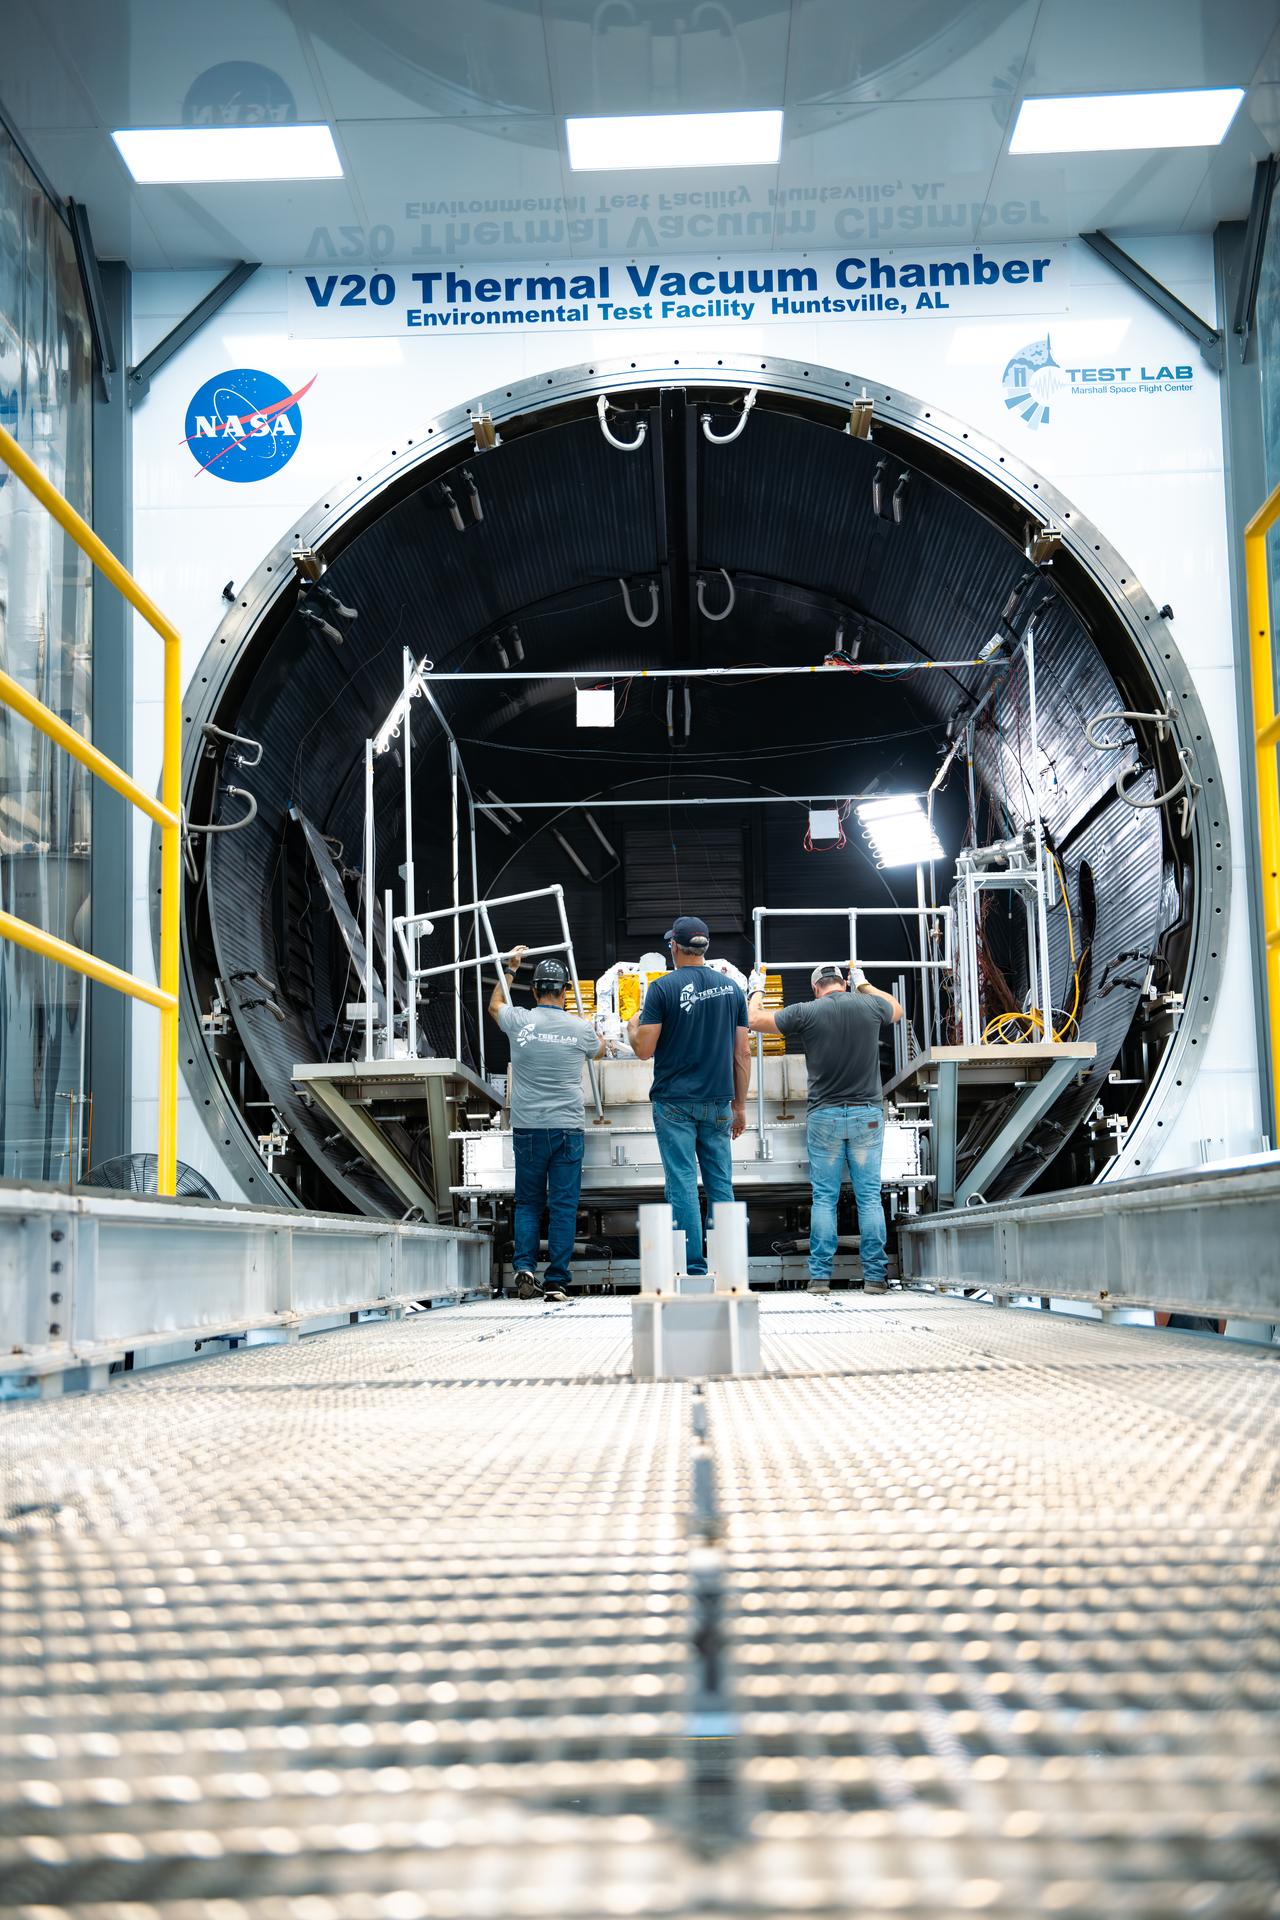
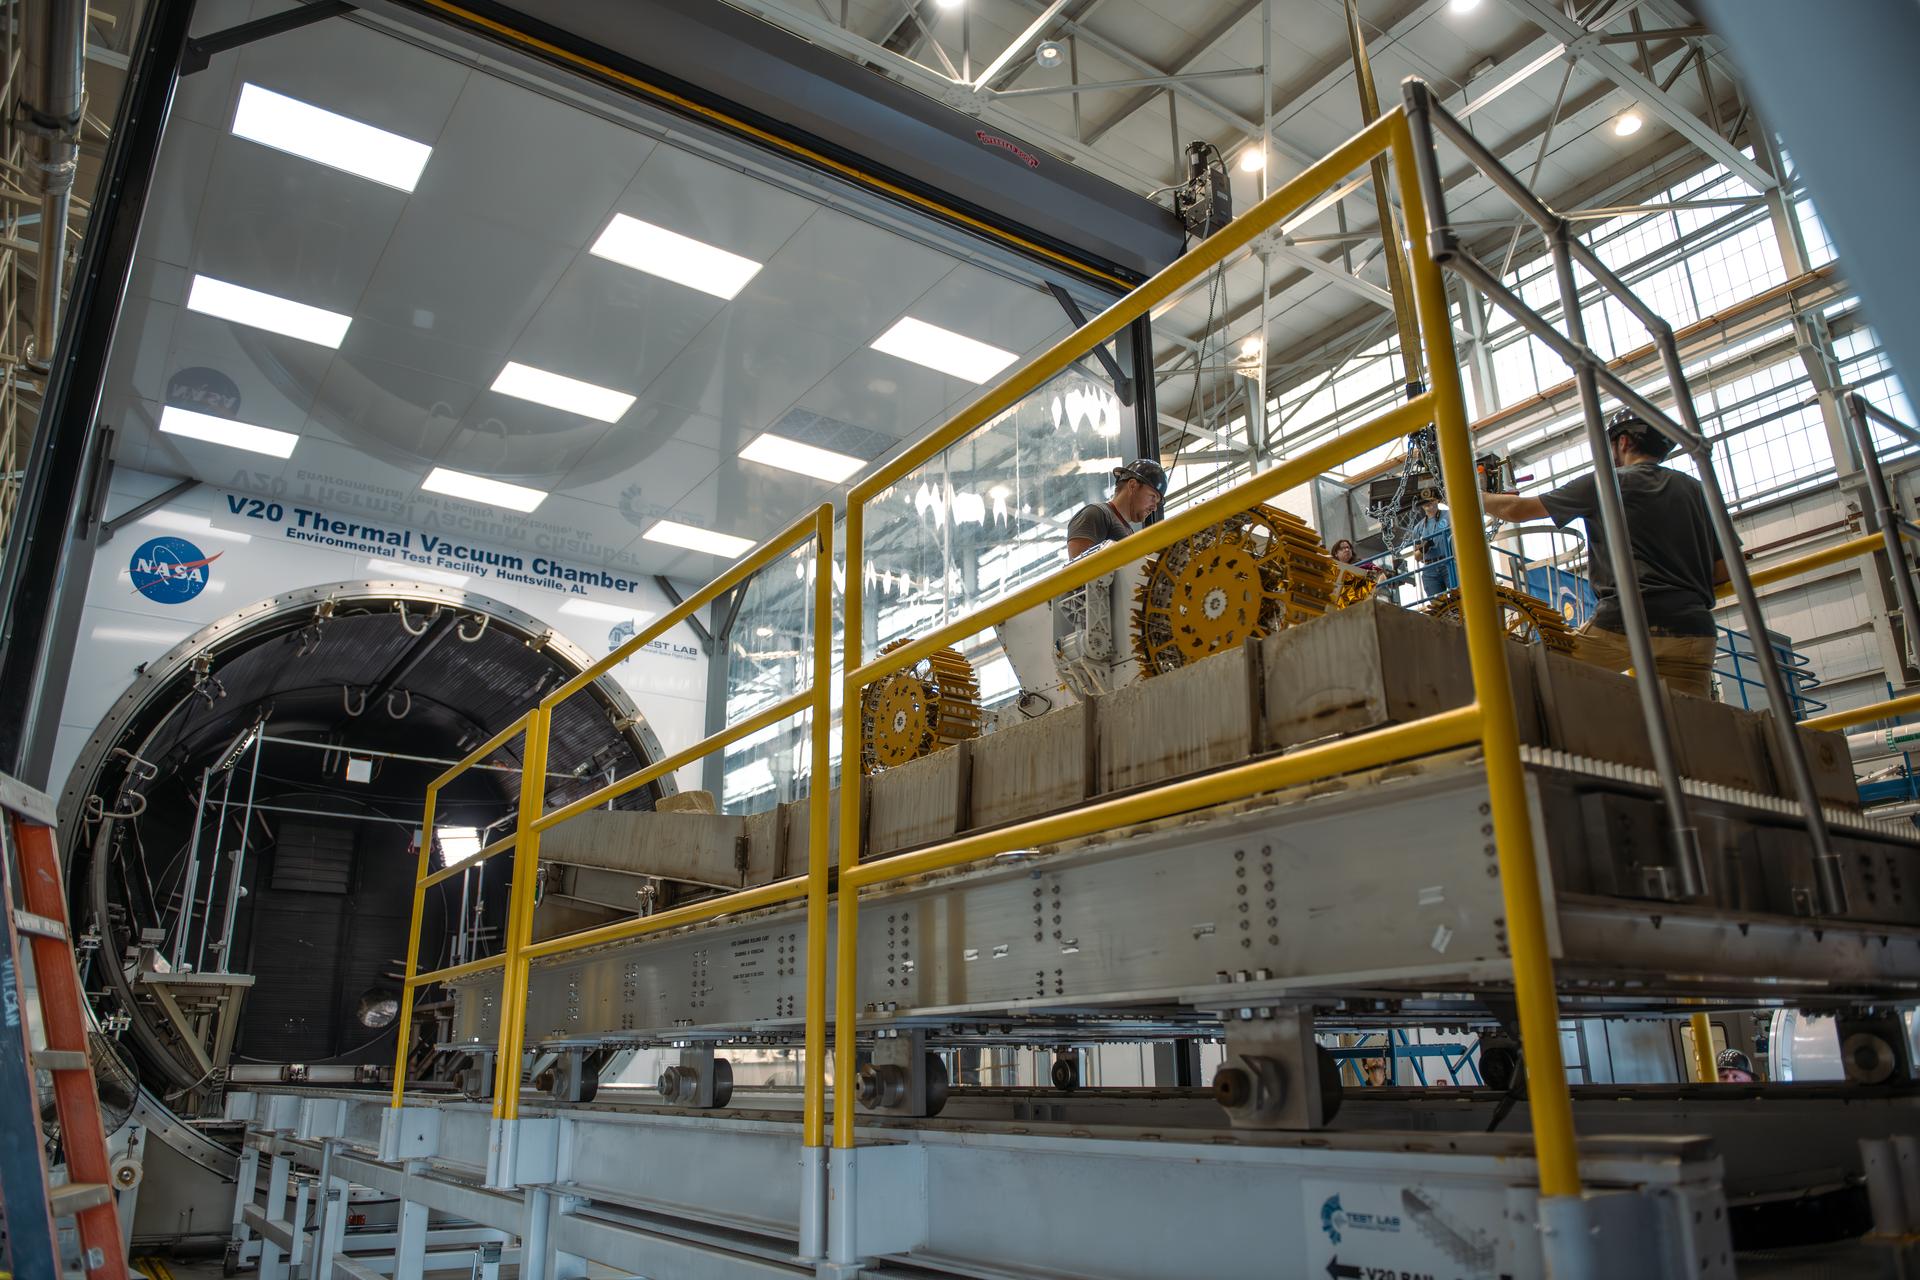
NASA Environmental Test Facility employees at the agency’s Marshall Space Flight Center in Huntsville, Alabama, work with members from the Starpath team to push the sliding platform into the thermal vacuum chamber, with the heavy rover and concrete slab in tow. The technology startup headquartered in Hawthorne, California, won second place overall at the agency’s Break the Ice Lunar Challenge’s live demonstration and finale in June 2024. This competition, one of NASA’s Centennial Challenges, tasked competitors to design, build, and demonstrate robotic technologies that could excavate and transport the icy, rocky dirt – otherwise known as regolith – found on the Moon. Starpath’s visit to NASA Marshall was part of their prize opportunity to test their upgraded lunar regolith excavation and transportation rover in the center’s 20-foot thermal vacuum chamber. For more information, contact NASA Marshall’s Office of Communications at 256-544-0034.
Starpath’s rover sits on a concrete slab that will be used to mimic the rugged lunar surface within a vacuum chamber at NASA’s Marshall Space Flight Center in Huntsville, Alabama, on July 30, 2025. The slab features a sandy, rocky terrain, and lamps within the chamber will turn on and off to simulate sunlight. The technology startup headquartered in Hawthorne, California, won second place overall at the agency’s Break the Ice Lunar Challenge’s live demonstration and finale in June 2024. This competition, one of NASA’s Centennial Challenges, tasked competitors to design, build, and demonstrate robotic technologies that could excavate and transport the icy, rocky dirt – otherwise known as regolith – found on the Moon. Starpath’s visit to NASA Marshall was part of their prize opportunity to test their upgraded lunar regolith excavation and transportation rover in the center’s 20-foot thermal vacuum chamber. For more information, contact NASA Marshall’s Office of Communications at 256-544-0034
Starpath’s rover freely rests on a concrete slab at the end of a platform at NASA’s Marshall Space Flight Center in Huntsville, Alabama. The large metal structure will slide into the chamber, bringing the rover and concrete slab with it. The technology startup headquartered in Hawthorne, California, won second place overall at the agency’s Break the Ice Lunar Challenge’s live demonstration and finale in June 2024. This competition, one of NASA’s Centennial Challenges, tasked competitors to design, build, and demonstrate robotic technologies that could excavate and transport the icy, rocky dirt – otherwise known as regolith – found on the Moon. Starpath’s visit to NASA Marshall was part of their prize opportunity to test their upgraded lunar regolith excavation and transportation rover in the center’s 20-foot thermal vacuum chamber. For more information, contact NASA Marshall’s Office of Communications at 256-544-0034.
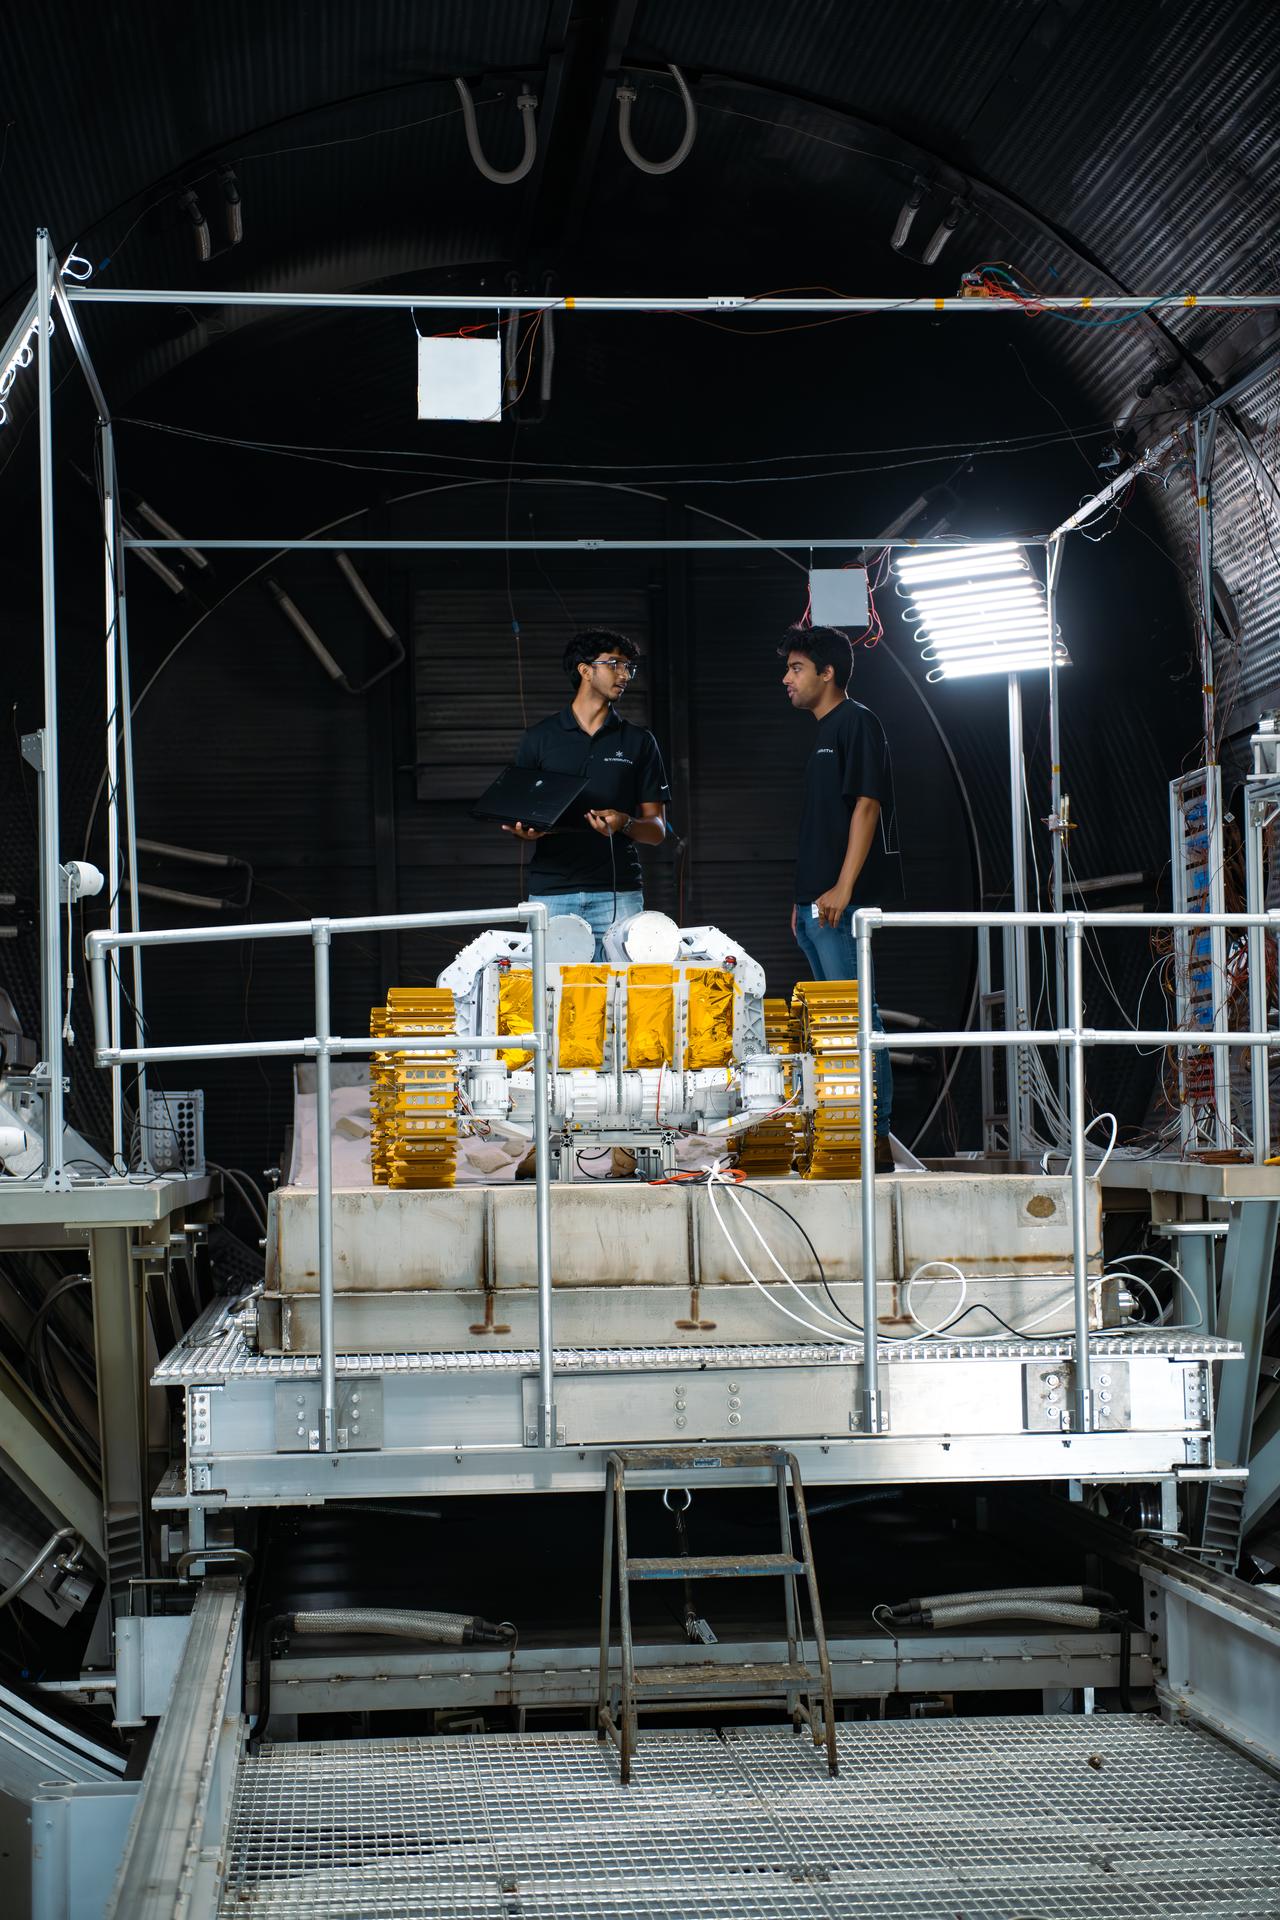
On July 30, 2025, members of the Starpath team discuss what final preparations need to be made before the chamber is closed for testing of their rover at NASA’s Marshall Space Flight Center in Huntsville, Alabama. The technology startup headquartered in Hawthorne, California, won second place overall at the Break the Ice Lunar Challenge’s live demonstration and finale in June 2024. This competition, one of NASA’s Centennial Challenges, tasked competitors to design, build, and demonstrate robotic technologies that could excavate and transport the icy, rocky dirt – otherwise known as regolith – found on the Moon. Starpath’s visit to NASA Marshall was part of their prize opportunity to test their upgraded lunar regolith excavation and transportation rover in the center’s 20-foot thermal vacuum chamber. For more information, contact NASA Marshall’s Office of Communications at 256-544-0034.

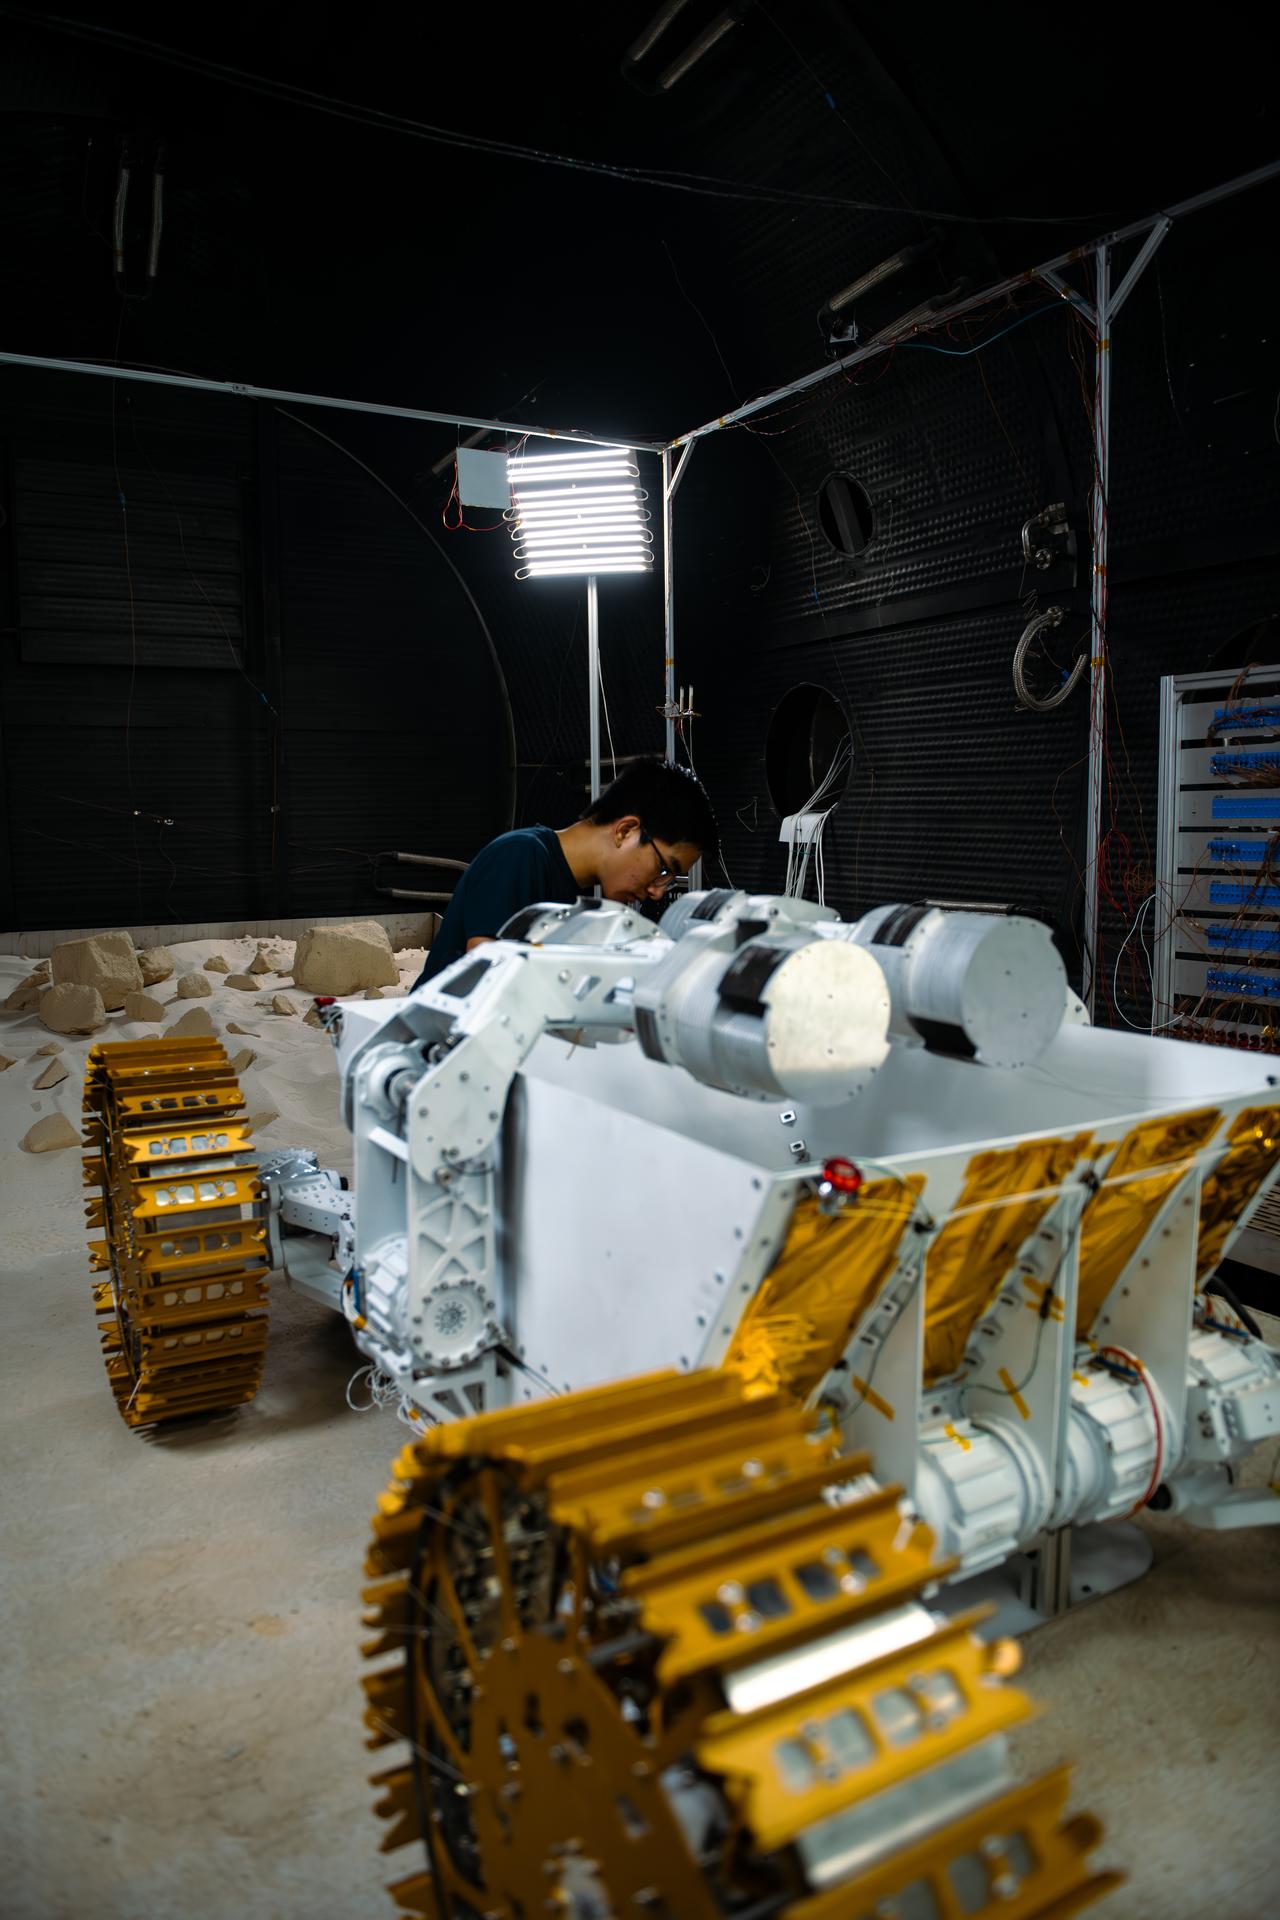
Starpath mechanical engineer Josh Kavilaveettil monitors a component of the rover, attached to wires, in preparation for testing at NASA’s Marshall Space Flight Center in Huntsville, Alabama on July 30, 2025. The technology startup headquartered in Hawthorne, California, won second place overall at the agency’s Break the Ice Lunar Challenge’s live demonstration and finale in June 2024. This competition, one of NASA’s Centennial Challenges, tasked competitors to design, build, and demonstrate robotic technologies that could excavate and transport the icy, rocky dirt – otherwise known as regolith – found on the Moon. Starpath’s visit to NASA Marshall was part of their prize opportunity to test their upgraded lunar regolith excavation and transportation rover in the center’s 20-foot thermal vacuum chamber. For more information, contact NASA Marshall’s Office of Communications at 256-544-0034.
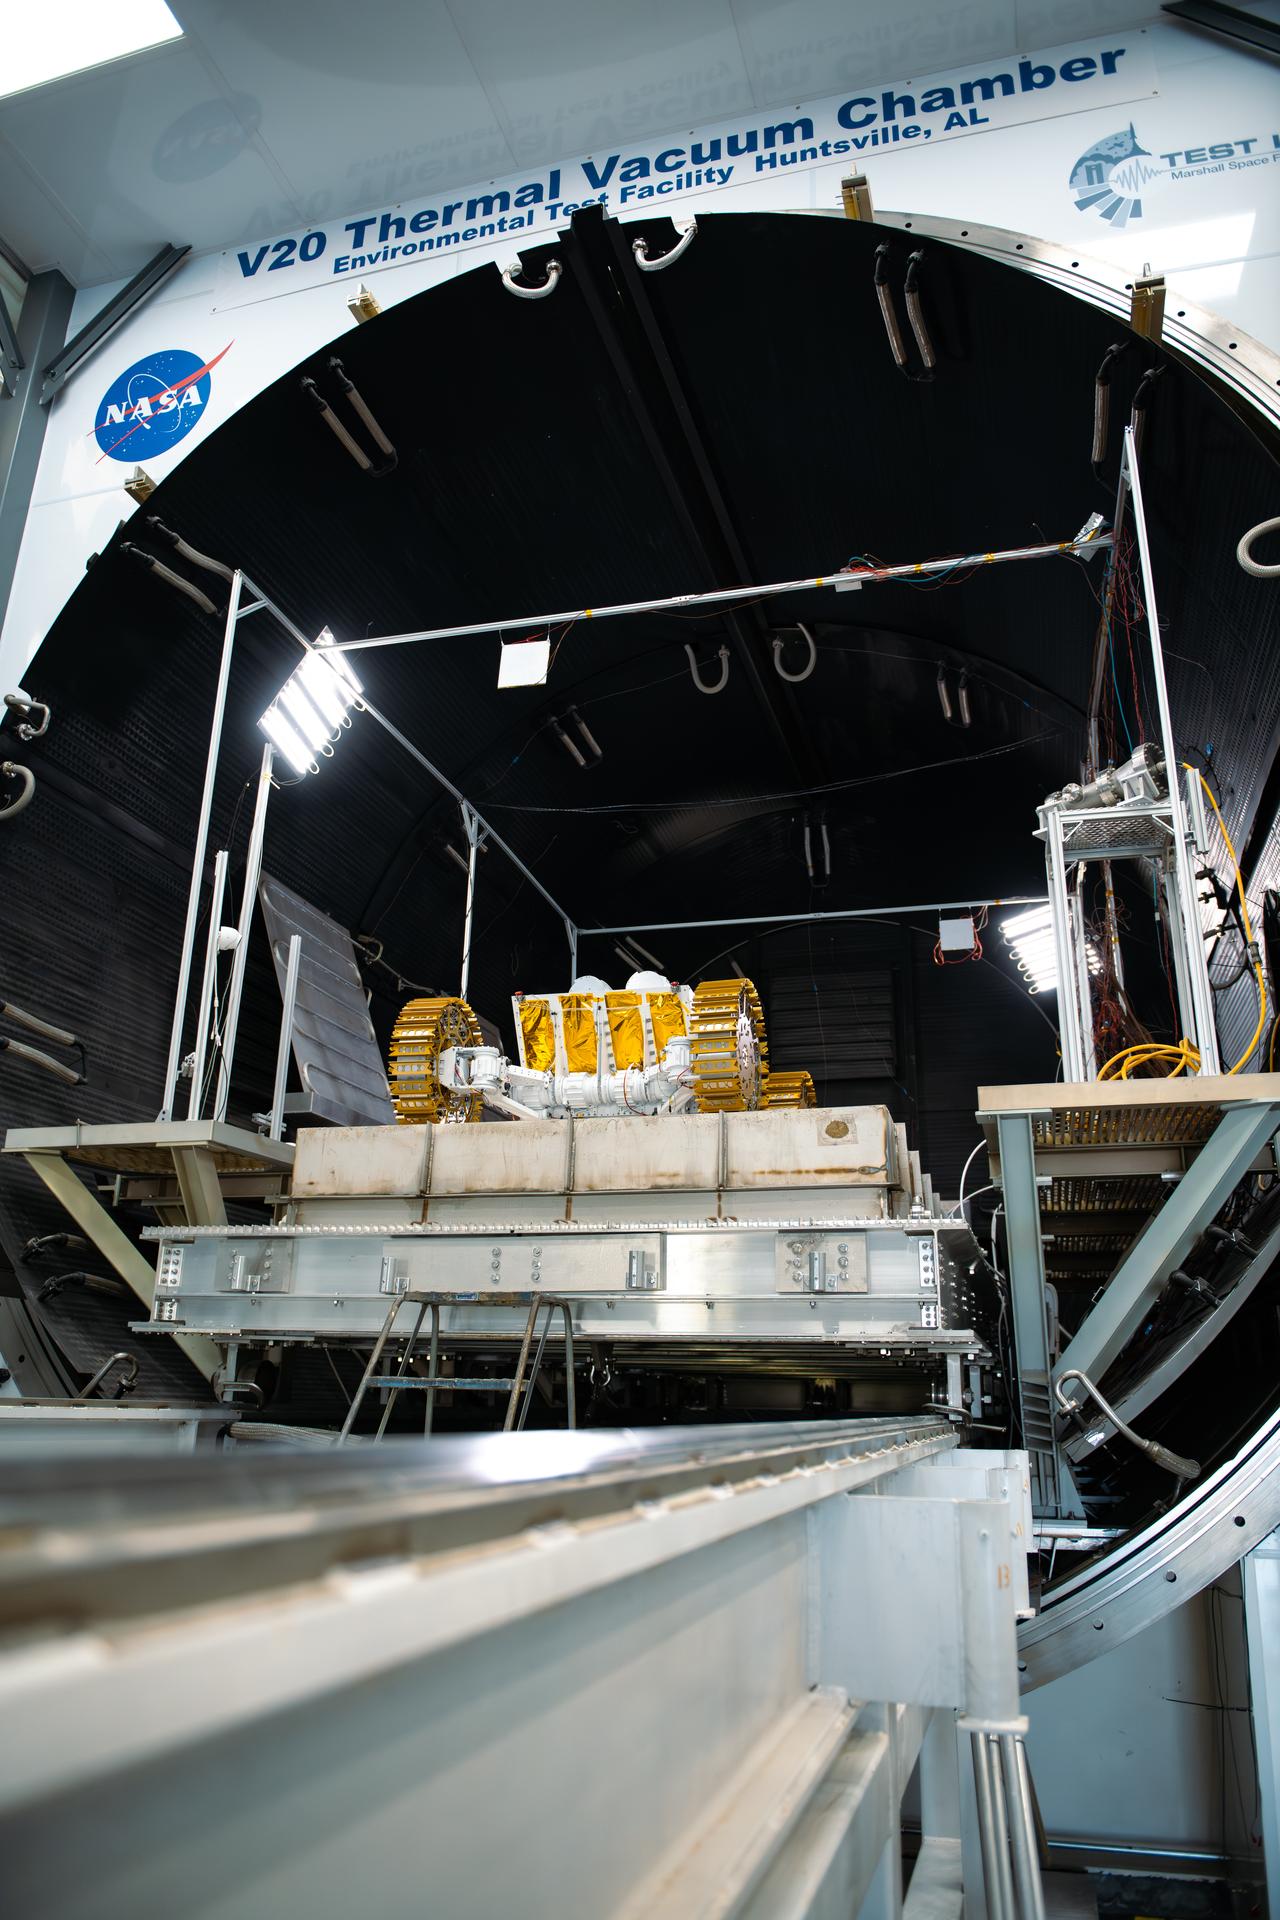
Starpath’s rover sits atop a concrete slab at the mouth of the thermal vacuum chamber, ready to be closed in and commence testing at NASA’s Marshall Space Flight Center in Huntsville, Alabama, on July 30, 2025. The technology startup headquartered in Hawthorne, California, won second place overall at the Break the Ice Lunar Challenge’s live demonstration and finale in June 2024. This competition, one of NASA’s Centennial Challenges, tasked competitors to design, build, and demonstrate robotic technologies that could excavate and transport the icy, rocky dirt – otherwise known as regolith – found on the Moon. Starpath’s visit to NASA Marshall was part of their prize opportunity to test their upgraded lunar regolith excavation and transportation rover in the center’s 20-foot thermal vacuum chamber. For more information, contact NASA Marshall’s Office of Communications at 256-544-0034.
Employees from Environmental Test Facility at NASA’s Marshall Space Flight Center in Huntsville, Alabama, work with the Starpath team on July 30, 2025, to carefully maneuver the rover onto a platform that will slide the rover into the chamber. The technology startup headquartered in Hawthorne, California, won second place overall at the agency’s Break the Ice Lunar Challenge’s live demonstration and finale in June 2024. Their visit to NASA Marshall was part of their prize opportunity to test their upgraded lunar regolith excavation and transportation rover in the center’s 20-foot thermal vacuum chamber. The competition, one of NASA’s Centennial Challenges, tasked competitors to design, build, and demonstrate robotic technologies that could excavate and transport the icy, rocky dirt – otherwise known as regolith – found on the Moon. For more information, contact NASA Marshall’s Office of Communications at 256-544-0034.

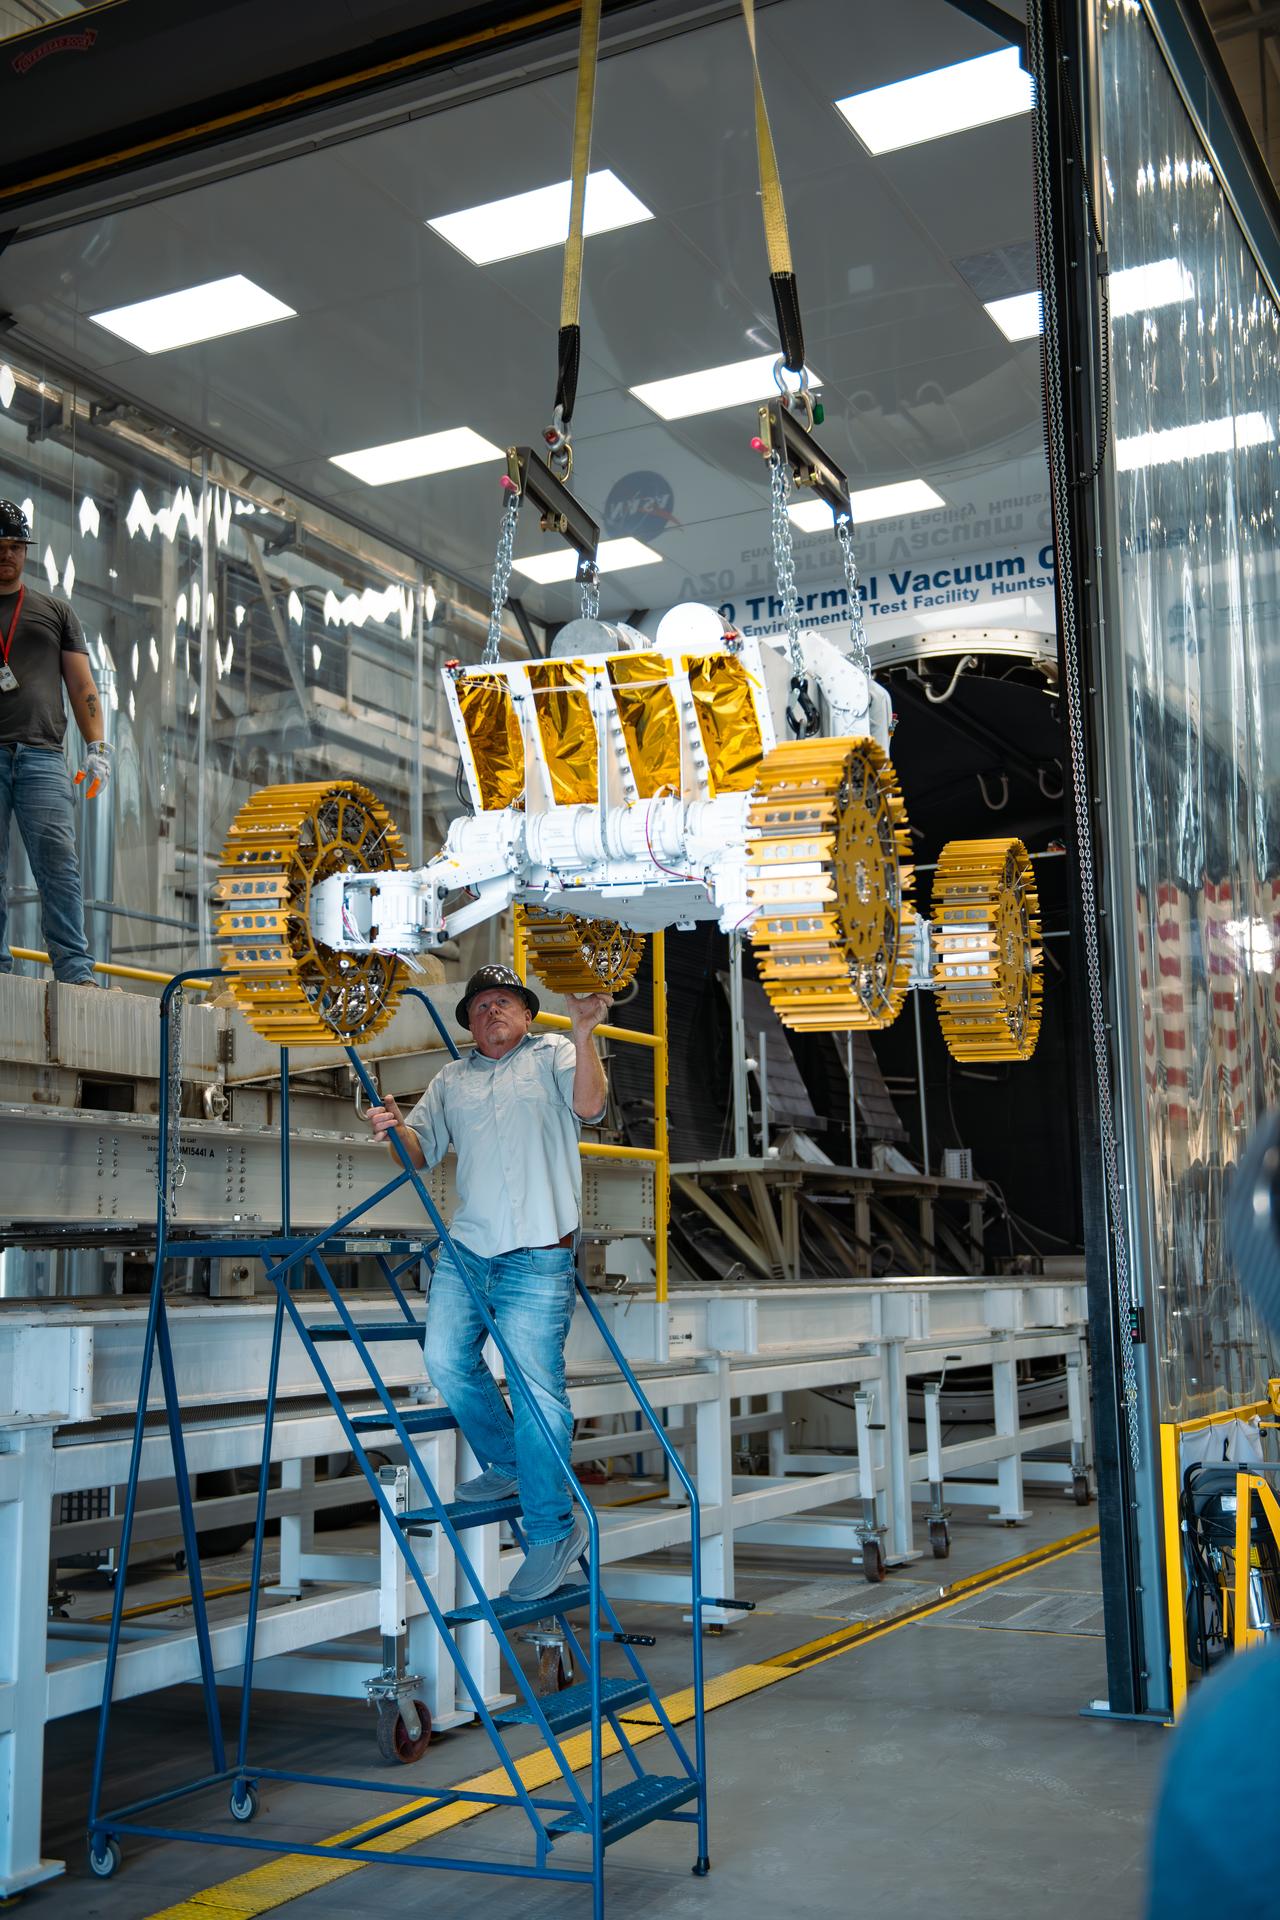
NASA test engineers with the Environmental Test Facility at NASA’s Marshall Space Flight Center situate the rover over the concrete slab that it will operate on before removing the suspension straps that lifted it onto the platform. The technology startup headquartered in Hawthorne, California, won second place overall at the agency’s Break the Ice Lunar Challenge’s live demonstration and finale in June 2024. This competition, one of NASA’s Centennial Challenges, tasked competitors to design, build, and demonstrate robotic technologies that could excavate and transport the icy, rocky dirt – otherwise known as regolith – found on the Moon. Starpath’s visit to NASA Marshall was part of their prize opportunity to test their upgraded lunar regolith excavation and transportation rover in the center’s 20-foot thermal vacuum chamber. For more information, contact NASA Marshall’s Office of Communications at 256-544-0034.
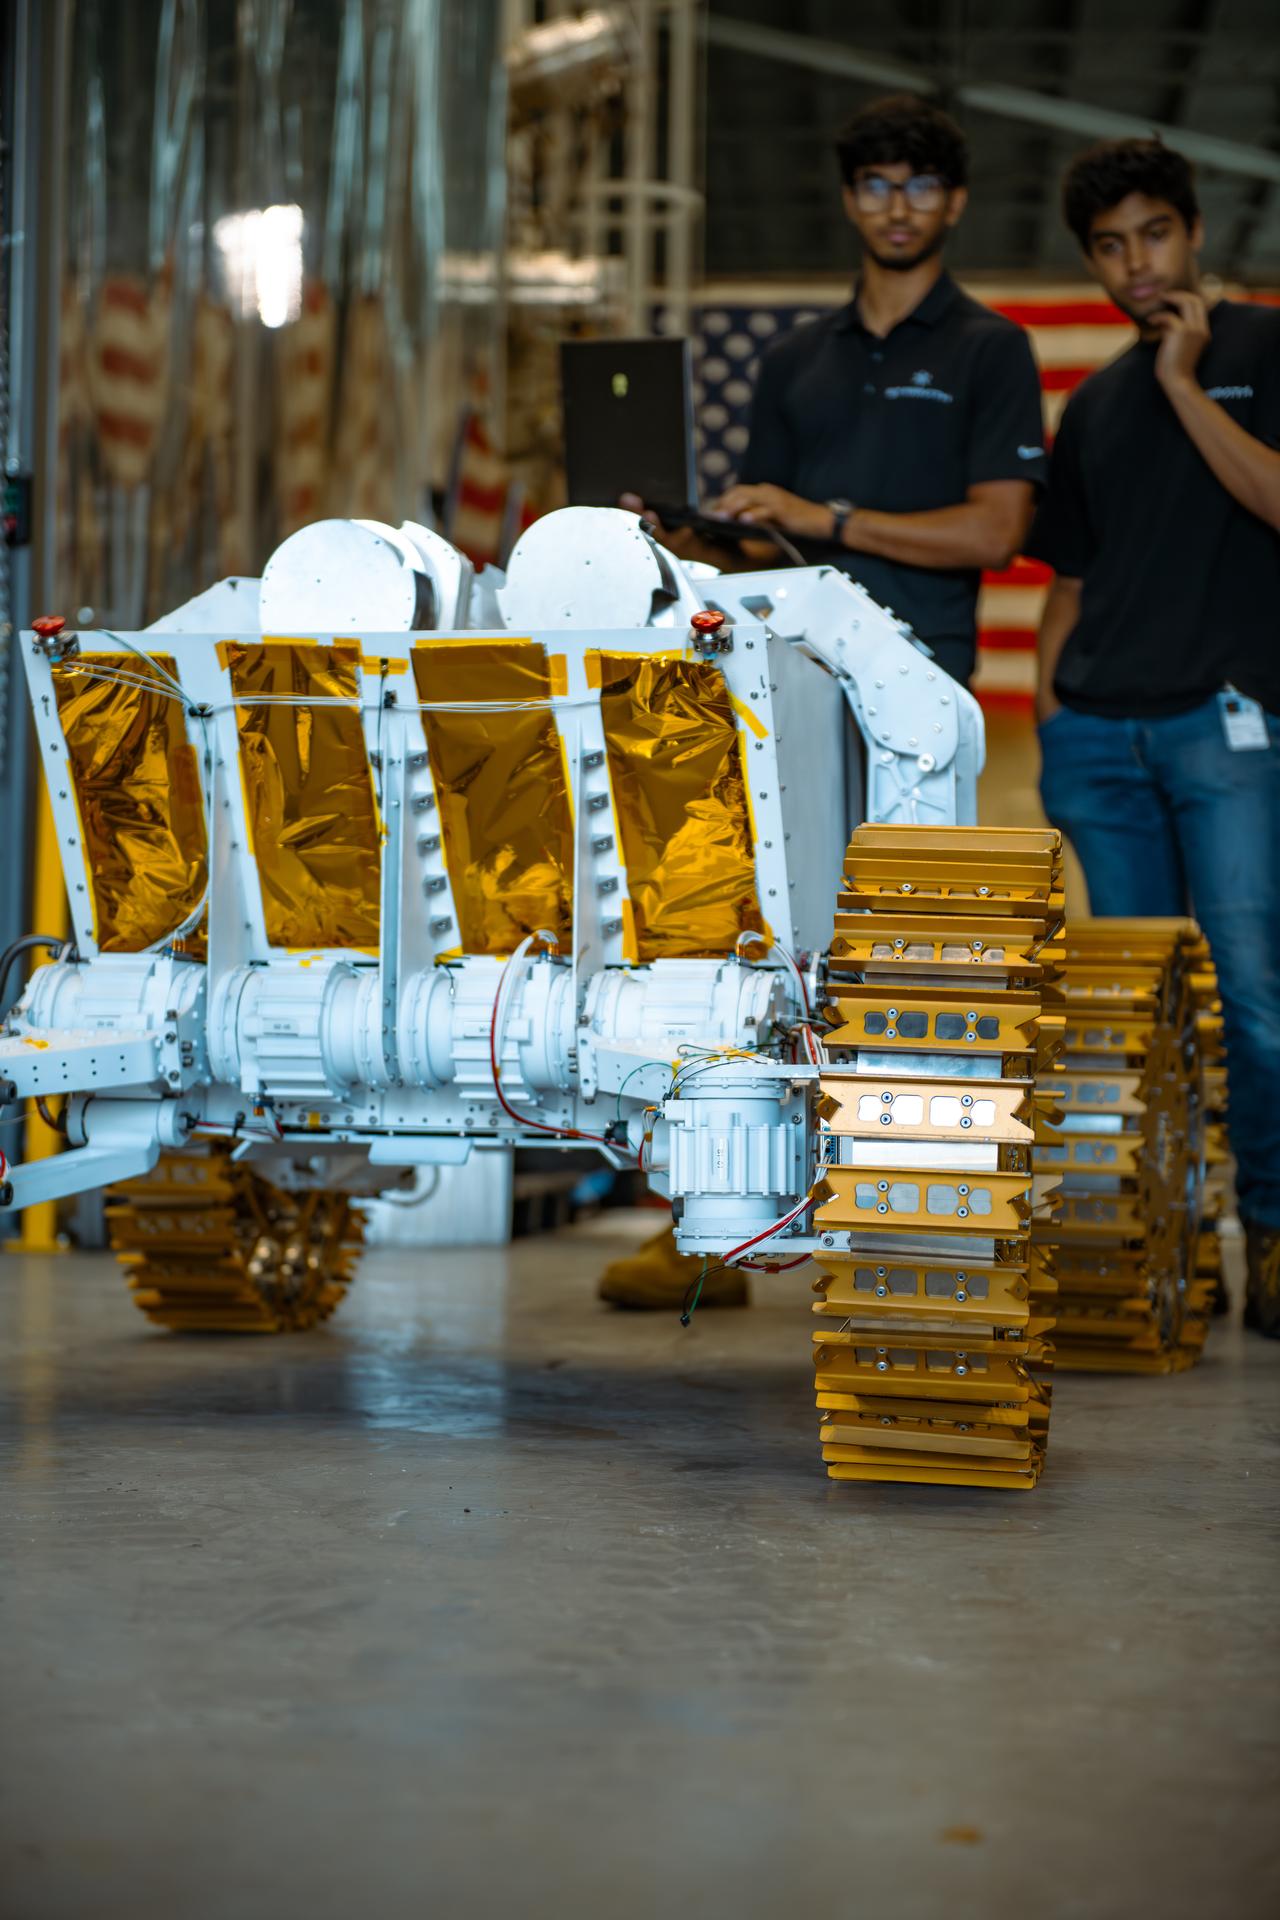
Members of the small business Starpath remotely operate the rover and run data in preparation for its entrance to the V20 Thermal Vacuum Chamber at NASA’s Marshall Space Flight Center in Huntsville, Alabama, on July 30, 2025. The technology startup headquartered in Hawthorne, California, won second place overall at the agency’s Break the Ice Lunar Challenge’s live demonstration and finale in June 2024. Their visit to NASA Marshall was part of their prize opportunity to test their upgraded lunar regolith excavation and transportation rover in the center’s 20-foot thermal vacuum chamber. The competition, one of NASA’s Centennial Challenges, tasked competitors to design, build, and demonstrate robotic technologies that could excavate and transport the icy, rocky dirt – otherwise known as regolith – found on the Moon. For more information, contact NASA Marshall’s Office of Communications at 256-544-0034.
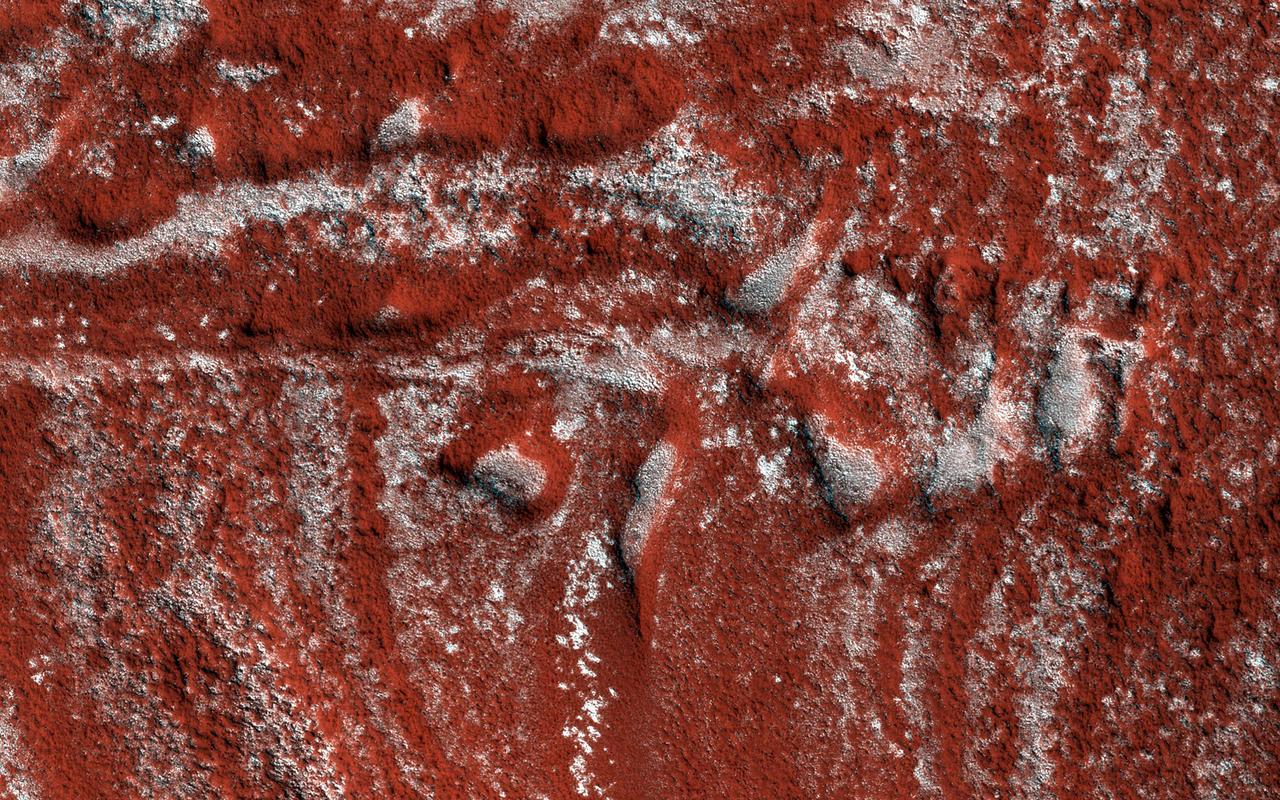
These North Polar layered deposits, composed of ice, captured by NASA Mars Reconnaissance Orbiter spacecraft, show what looks like drag folds, where rock layers bend fold before they break in a fault. However, the North Polar layered deposits are composed of ice, and this is a large scale for such a feature, compared to drag folds on Earth. This image is part of a stereo pair, so with a 3D picture, we can better interpret the structure. http://photojournal.jpl.nasa.gov/catalog/PIA20731
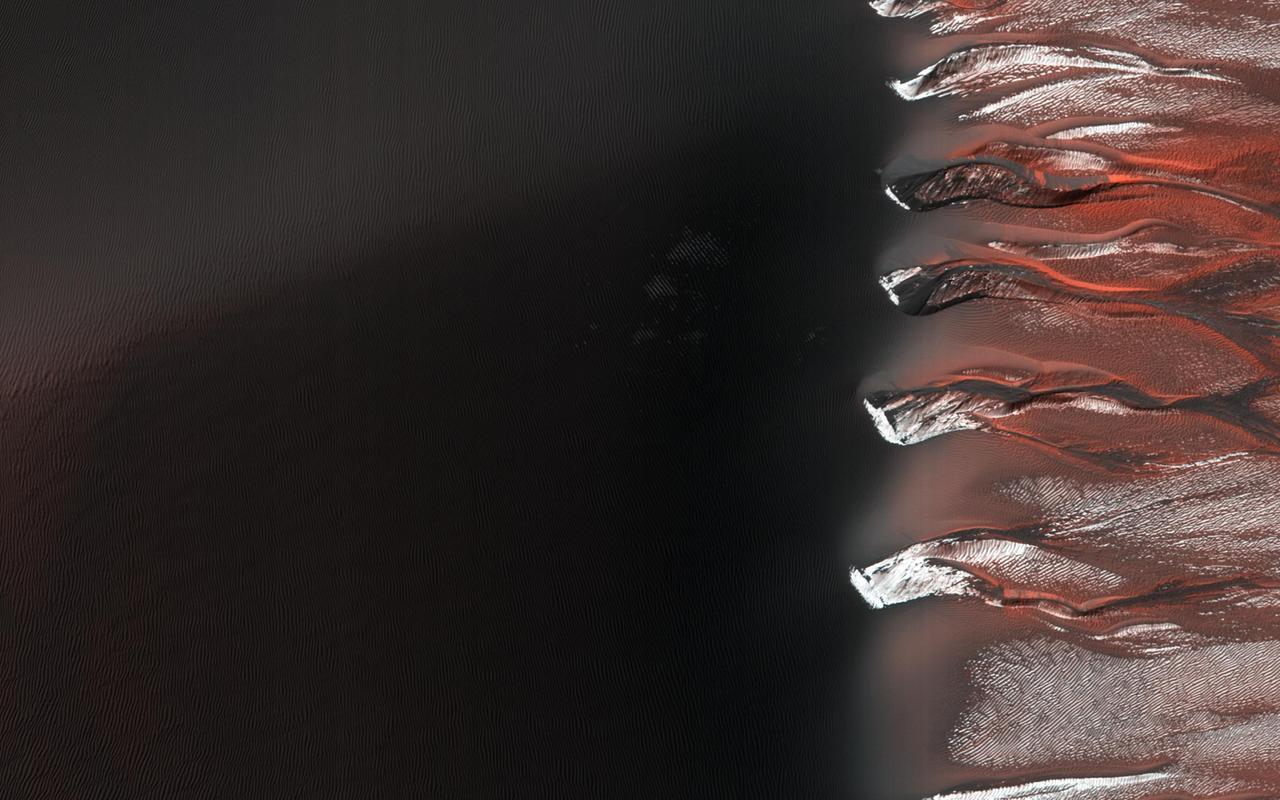
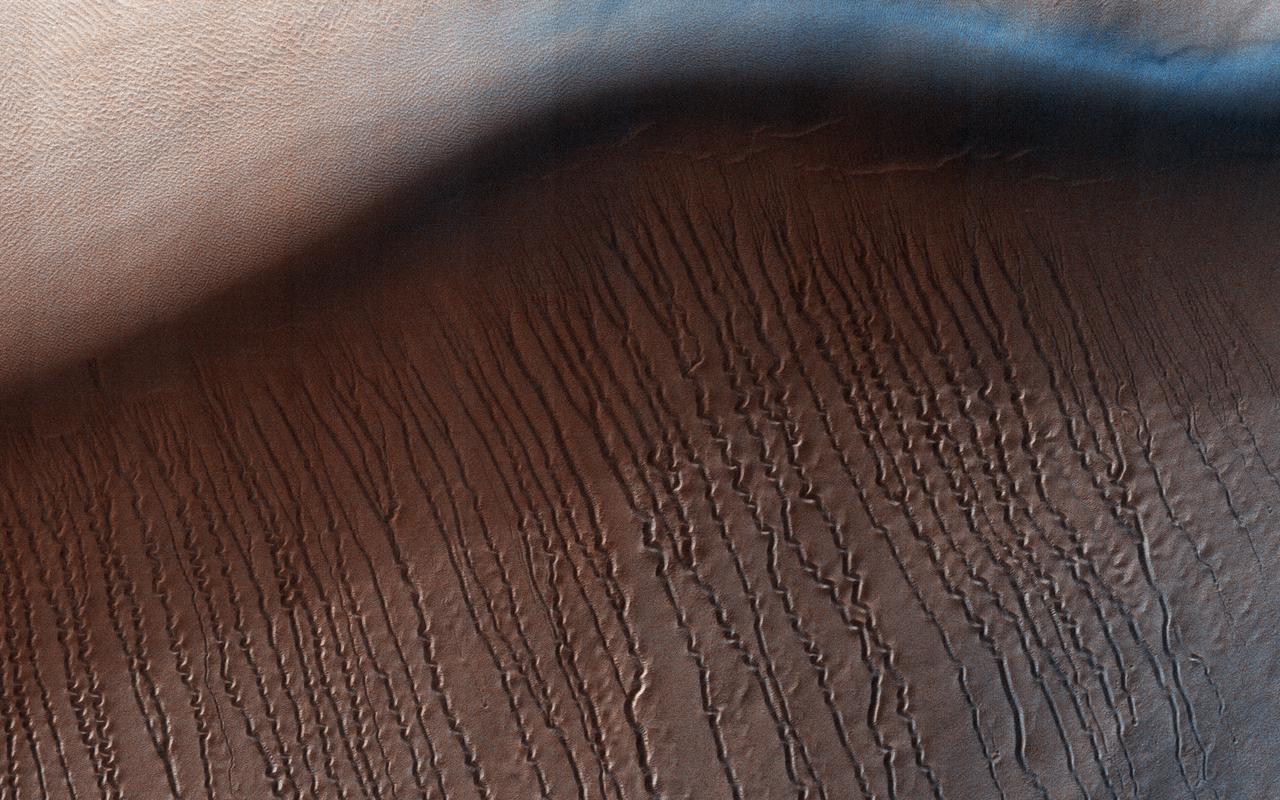
Kaiser Crater hosts a large field of sand dunes. Every winter the dunes are covered with a layer of seasonal carbon dioxide ice (dry ice). In early spring the ice begins to sublimate (going directly from solid ice to gas). In this image, the dunes are partially free of seasonal ice, with the contrast making it easy to see the ripples. Deep alcoves have been carved at the crest of the dune. We hypothesize that this is the result of the gas coming from the dry ice, destabilizing the sand at the crest. As blocks of ice protected in the cold shadows of the alcove break off they slide downslope, carving the channels we see. http://photojournal.jpl.nasa.gov/catalog/PIA21038
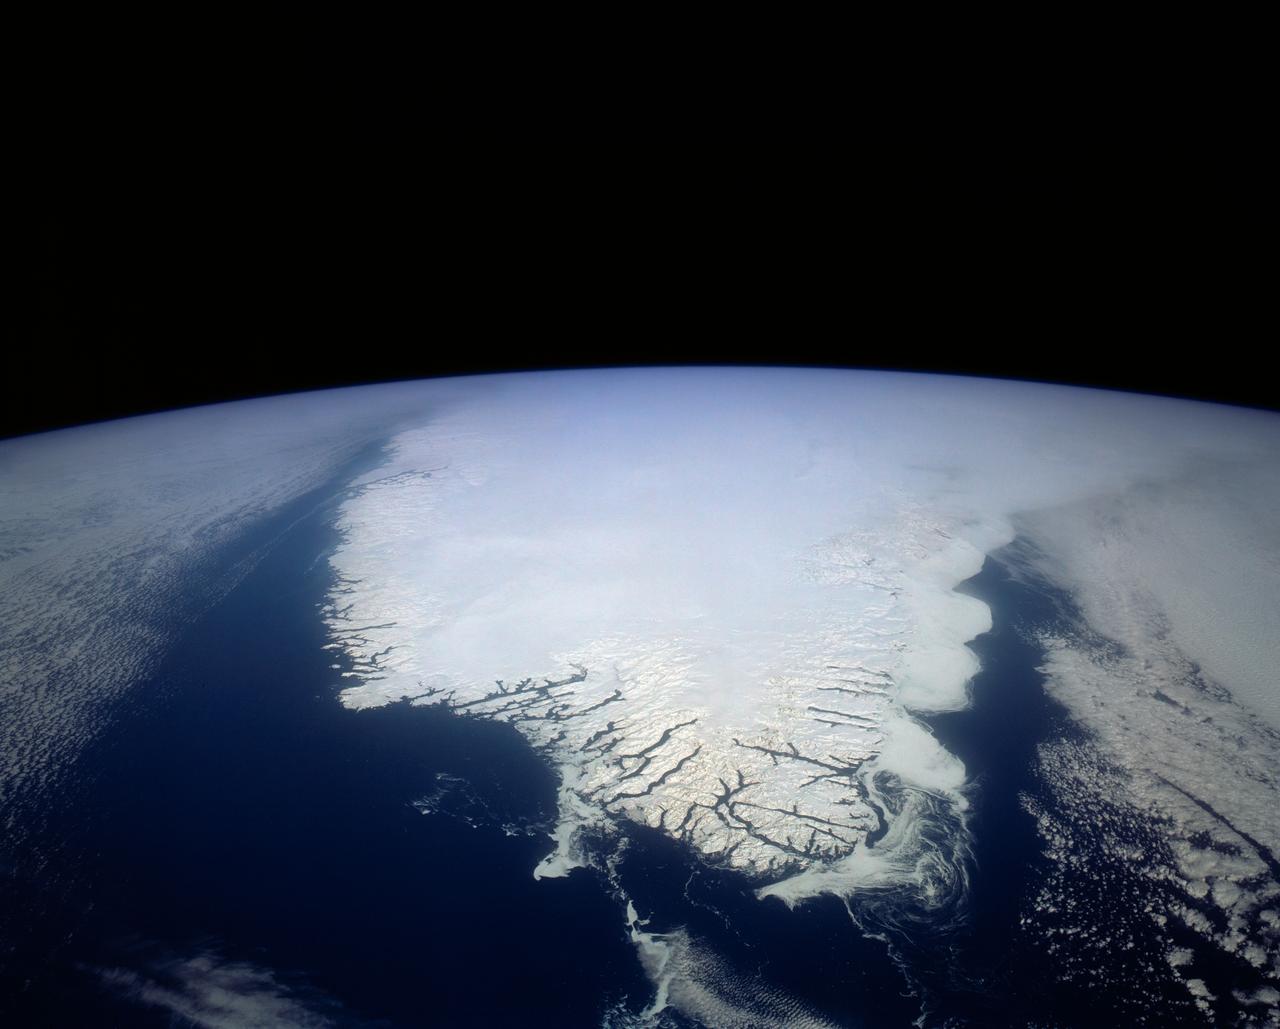
This spectacular north looking view of south Greenland (62.0N, 46.0W) shows numerous indentations along the coastline, many of which contain small settlements. These indentations are fiords carved by glaciers of the last ice age. Even today, ice in the center of Greenland is as much as 10,000 ft. thick and great rivers of ice continuously flow toward the sea, where they melt or break off as icebergs - some of which may be seen floating offshore.
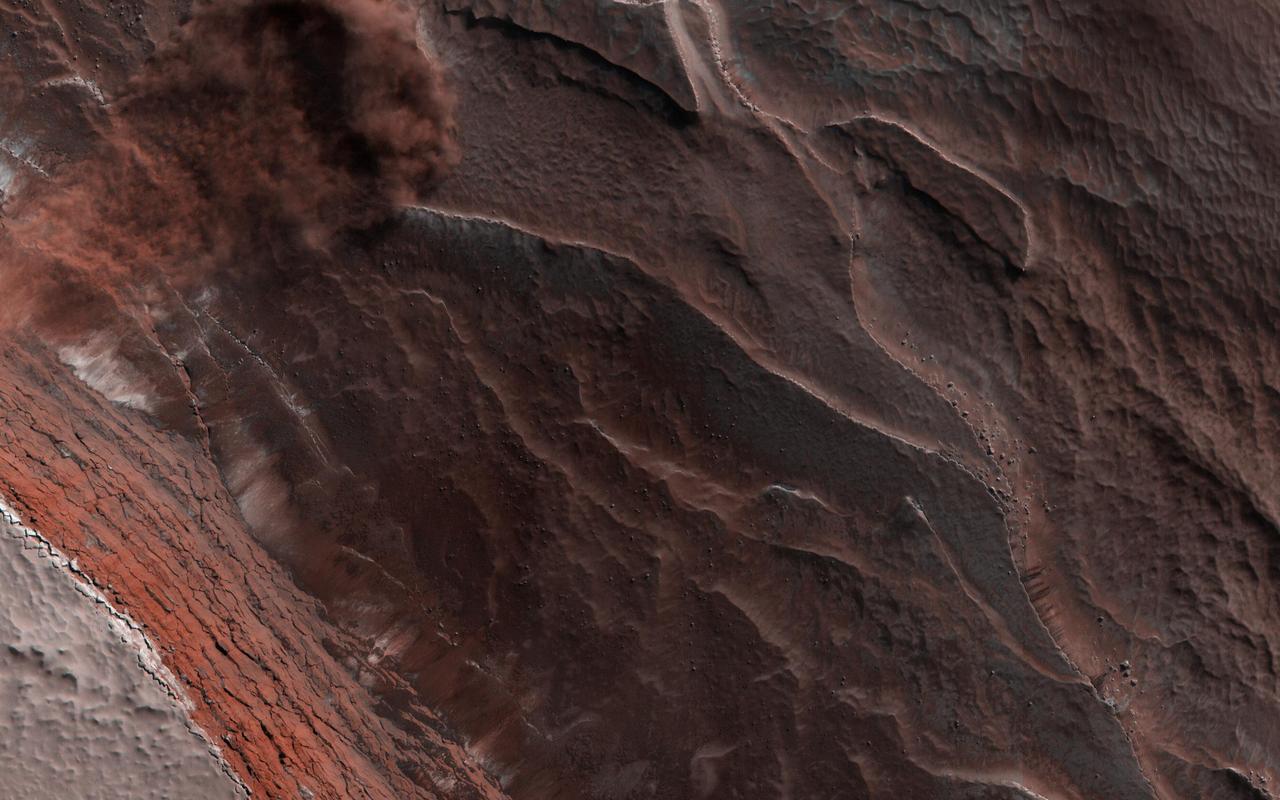
Every spring the sun shines on the side of the stack of layers at the North Pole of Mars known as the north polar layered deposits. The warmth destabilizes the ice and blocks break loose. When they reach the bottom of the more than 500 meter tall cliff face, the blocks kick up a cloud of dust. (In the cutout, the top layer of the north polar cap is to the lower left.) The layers beneath are different colors and textures depending on the amount of dust mixed with ice. https://photojournal.jpl.nasa.gov/catalog/PIA23453
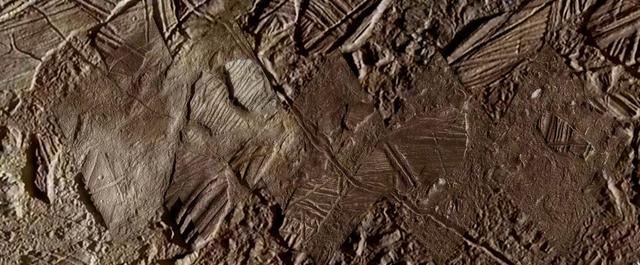
This image shows a close-up view of terrain within the region of Europa's surface named Conamara. This region sports ice rafts that look like those at Earth's poles, where large chunks of ice break away and float freely on the ocean. Much of the region bears the reddish/brownish discoloration seen here – the same as seen along many of Europa's fractures. Scientists believe this material may contain clues about the composition of an ocean beneath the icy surface, if it is proven to exist. https://photojournal.jpl.nasa.gov/catalog/PIA26446
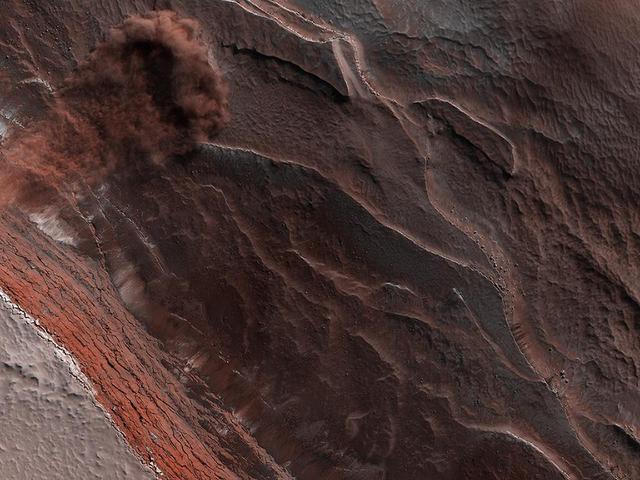
The High-Resolution Imaging Science Experiment (Hi-RISE) camera aboard NASA's Mars Reconnaissance Orbiter captured this avalanche plunging down a 1,640-foot-tall (500-meter-tall) cliff on May 29, 2019. The image also reveals layers at Mars' north pole during spring. As temperatures increase and vaporize ice, the destabilized ice blocks break loose and kick up dust. https://photojournal.jpl.nasa.gov/catalog/PIA24035
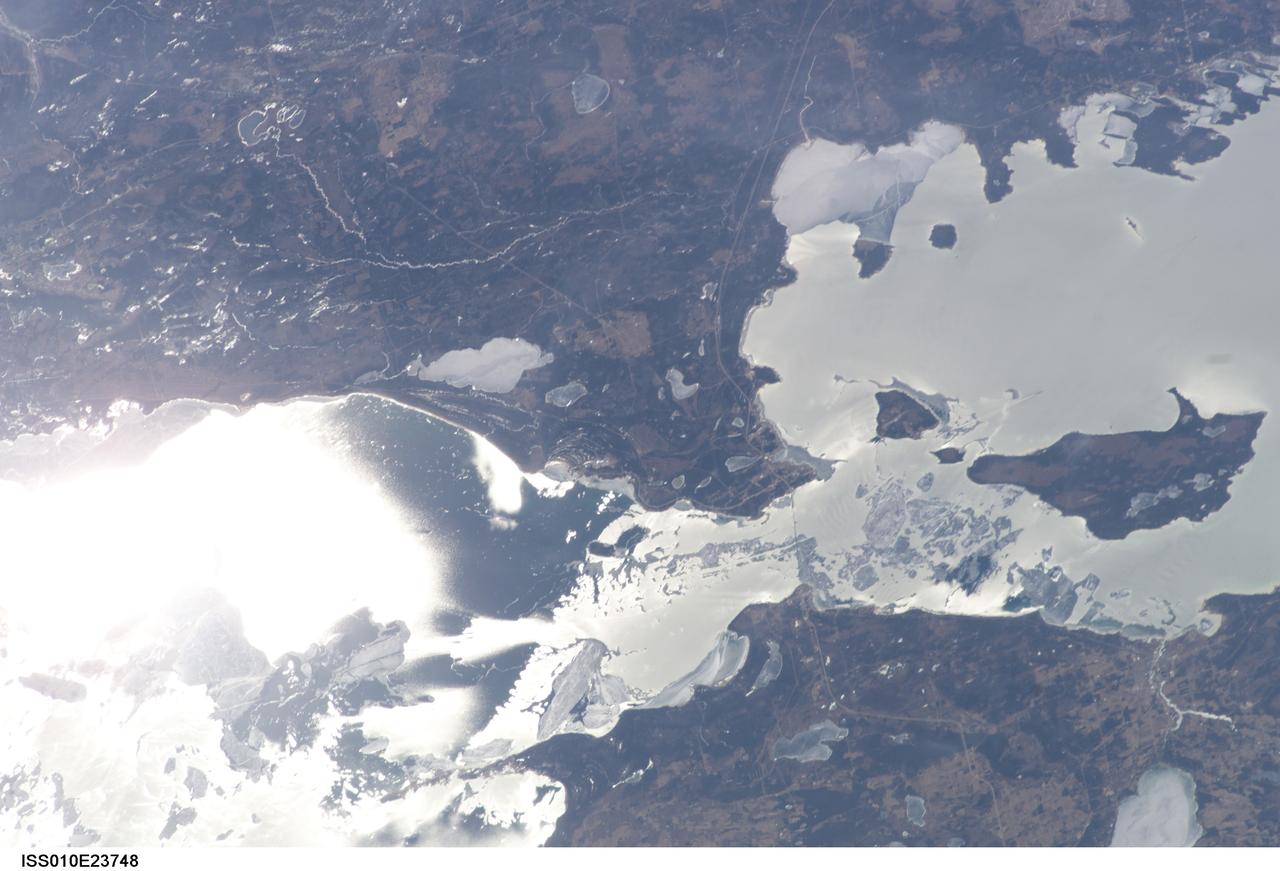
ISS010-E-23748 (9 April 2005) --- The Straits of Mackinac are featured in this image photographed by an Expedition 10 crewmember on the International Space Station (ISS). The Mackinac Bridge spans a stretch of water five miles wide between Michigan’s lower and upper peninsulas. The strait connects Lakes Michigan (left) and Huron (right). The bridge is a combination of pier-supported spans with a high, central suspension sector that allows passage of lake steamers. The suspension sector is the longest in the Americas (8614 feet or 1.6 miles). Prior to construction of the bridge, the only passage across the straits was by ferryboat. This view shows the ice broken into a series of irregular rafts that appear gray against bright water in this partial sunglint view. The shipping channel is maintained even through remnants of the ice mass, but the ice ridges can be hazardous to shipping during ice break-up.
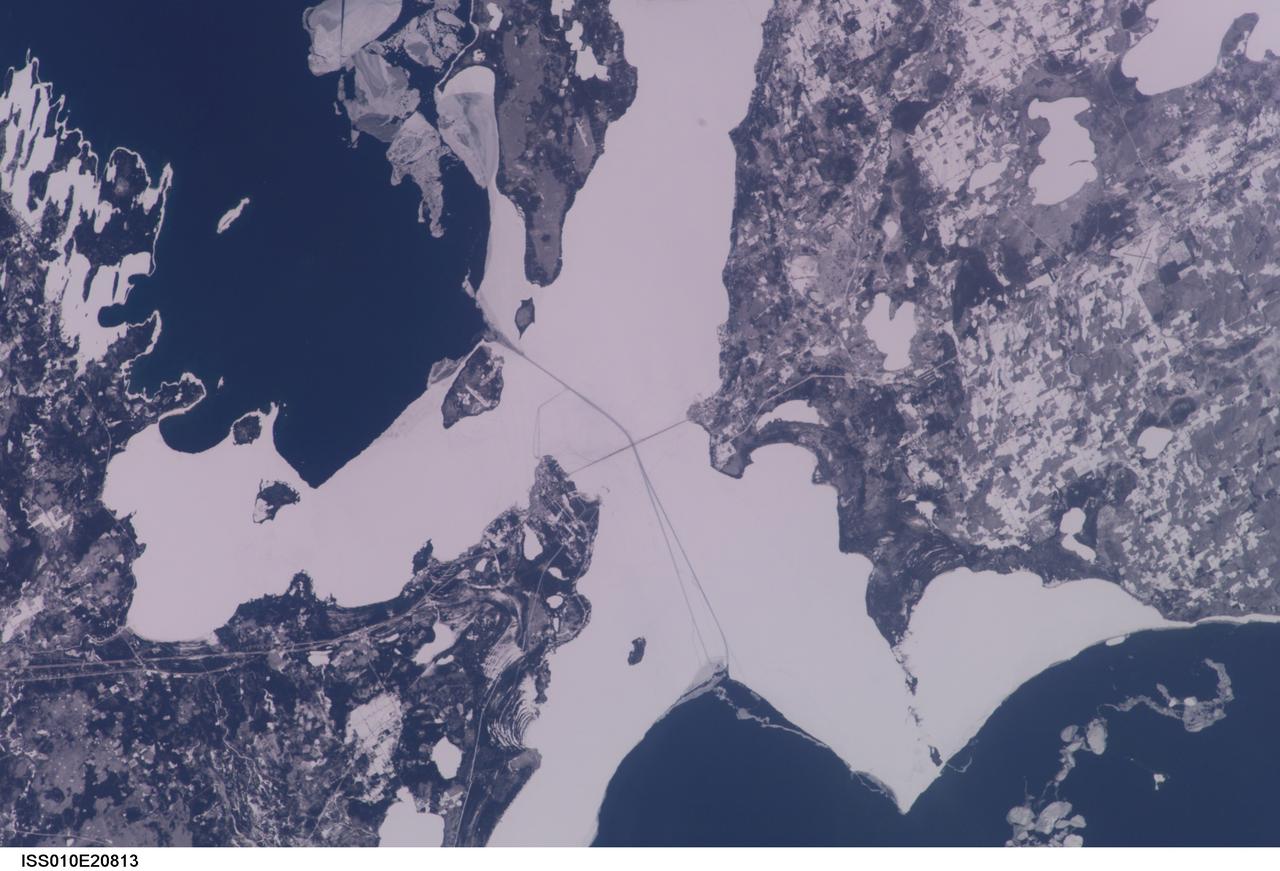
ISS010-E-20813 (22 March 2005) --- The Straits of Mackinac are featured in this image photographed by an Expedition 10 crewmember on the International Space Station (ISS). The Mackinac Bridge spans a stretch of water five miles wide between Michigan’s lower and upper peninsulas. The strait connects Lakes Michigan (left) and Huron (right). The bridge is a combination of pier-supported spans with a high, central suspension sector that allows passage of lake steamers. The suspension sector is the longest in the Americas (8614 feet or 1.6 miles). Prior to construction of the bridge, the only passage across the straits was by ferryboat. This view shows shipping lanes opened by ice breakers. A narrow passage leads to the small town of St. Ignace at the north end of the bridge (Mackinaw City appears at the south end). The shipping channel is maintained even through remnants of the ice mass, but the ice ridges can be hazardous to shipping during ice break-up.
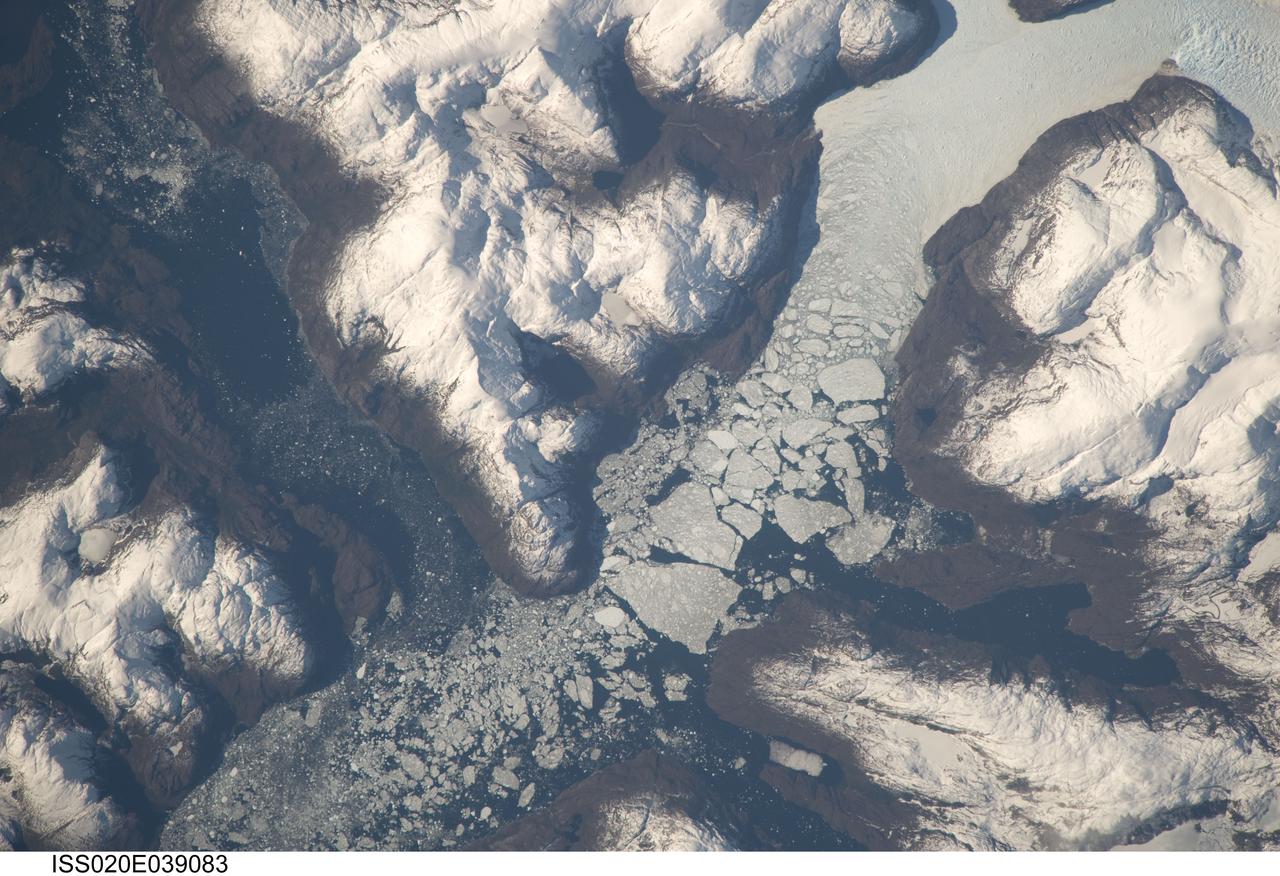
ISS020-E-039083 (6 Sept. 2009) --- Glacier outlet in the Southern Patagonian Ice Field of Chile is featured in this image photographed by an Expedition 20 crew member on the International Space Station. The Southern Patagonian Ice Field of Chile and Argentina hosts a spectacular array of glaciers and associated glacial features within the southern Andes Mountains. Glaciers flowing downhill on the eastern side of the mountains have outlets into several large freshwater lakes. On the western side of the mountains, glaciers release ice into the Pacific Ocean via an intricate network of fjords. Fjords are steep valleys originally cut by glaciers during periods of lower sea level that are now inundated. As glaciers flow into the fjord, ice at the front of the glacier begins to break off and form icebergs that can float out to sea ? a process known as calving. This detailed photograph shows the merged outlet of Penguin Glacier and HPS 19 into a fjord carved into the snow-covered mountains of the southern Andes. The designation HPS stands for Hielo Patagonico Sur (e.g. Southern Patagonian Ice field) and is used to identify glaciers that have no other geographic name. Ice flowing into the fjord begins to break up at center, forming numerous icebergs ? the largest visible in this image is approximately 2 kilometers in width. The large ice masses visible at center have a coarse granular appearance due to variable snow cover, and mixing and refreezing of ice fragments prior to floating free.
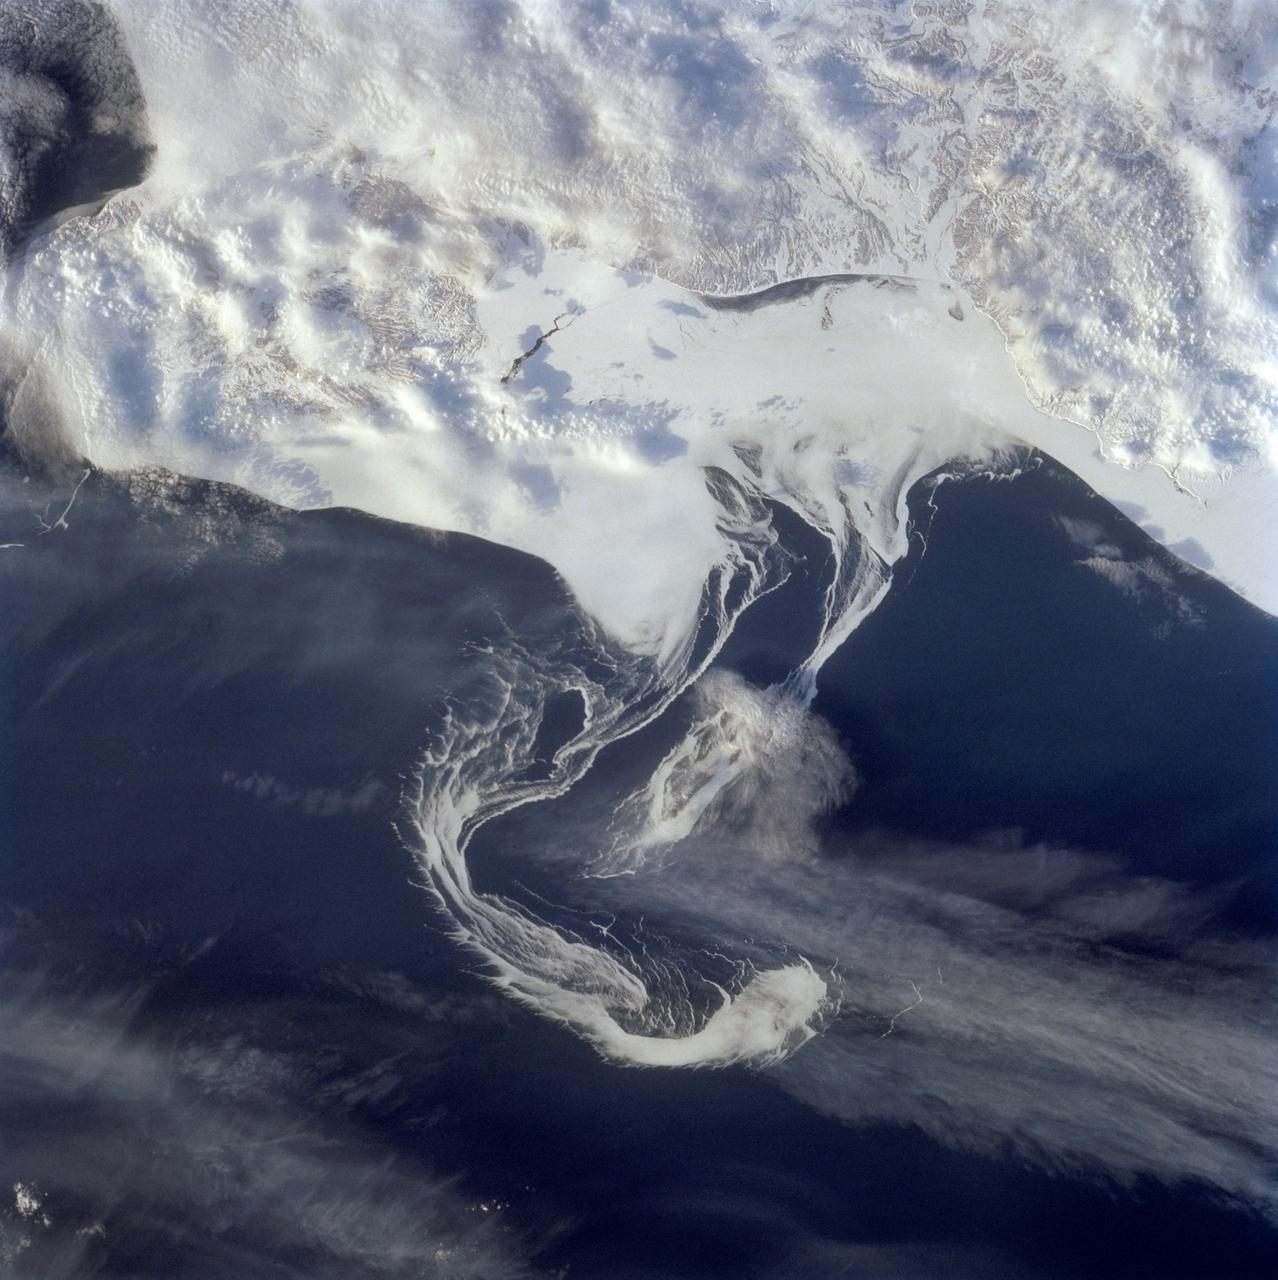
STS060-73-038 (3-11 Feb 1994) --- Pack ice is documented in this photograph along the coast of the Kamchatka Peninsula of Russia in Zaliv Ozernoj. Newly formed ice continually breaks away from the land and takes the form imposed by coastal currents. Detailed photographs of the ice provide information to scientists in both Russia and the united States about the location and fluctuation of ice edges, and how this new sea ice interacts with ocean and littoral currents. This information results in better ice warnings to shipping traffic and provides data points for long-range climate change research for both the Mission-To-Planet Earth and the Russian Priroda ("Nature") monitoring and assessment programs that are respectively coordinated by NASA and the Russian Academy of Sciences. This photography of ice development in the North Pacific, North Atlantic, the Southern Ocean, the Baltic and North Seas, and the Great Lakes is of great interest to the international scientific community. NASA scientists feel high-resolution analog and digital photography from the Space Shuttle and future craft can be a particularly important component in satisfying their data needs on both an operational and a long-term research basis.
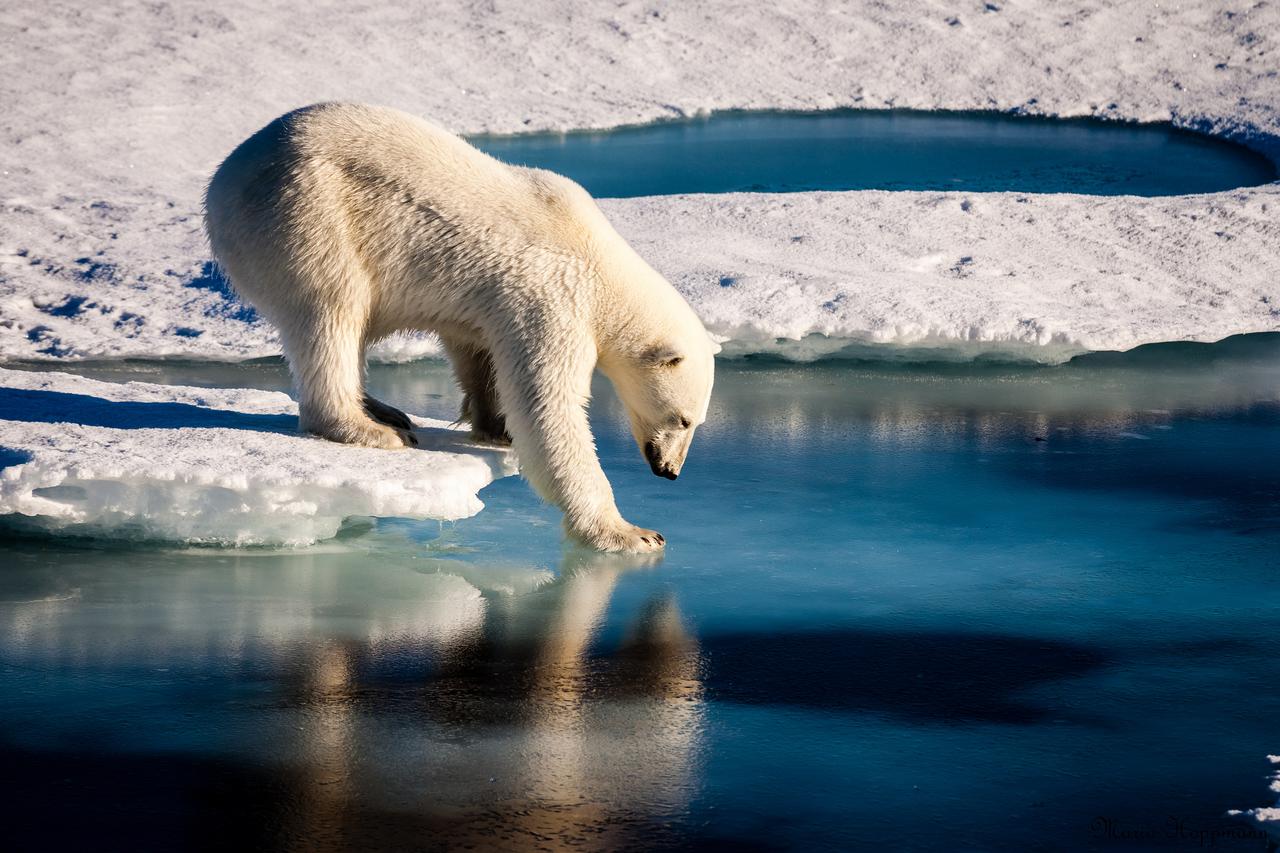
Polar bears already face shorter ice seasons - limiting prime hunting and breeding opportunities. Nineteen separate polar bear subpopulations live throughout the Arctic, spending their winters and springs roaming on sea ice and hunting. The bears have evolved mainly to eat seals, which provide necessary fats and nutrients in the harsh Arctic environment. Polar bears can't outswim their prey, so instead they perch on the ice as a platform and ambush seals at breathing holes or break through the ice to access their dens. The total number of ice-covered days declined at the rate of seven to 19 days per decade between 1979 and 2014. The decline was even greater in the Barents Sea and the Arctic basin. Sea ice concentration during the summer months — an important measure because summertime is when some subpopulations are forced to fast on land — also declined in all regions, by 1 percent to 9 percent per decade. Read more: <a href="http://go.nasa.gov/2cIZSSc" rel="nofollow">go.nasa.gov/2cIZSSc</a> Photo credit: Mario Hoppmann
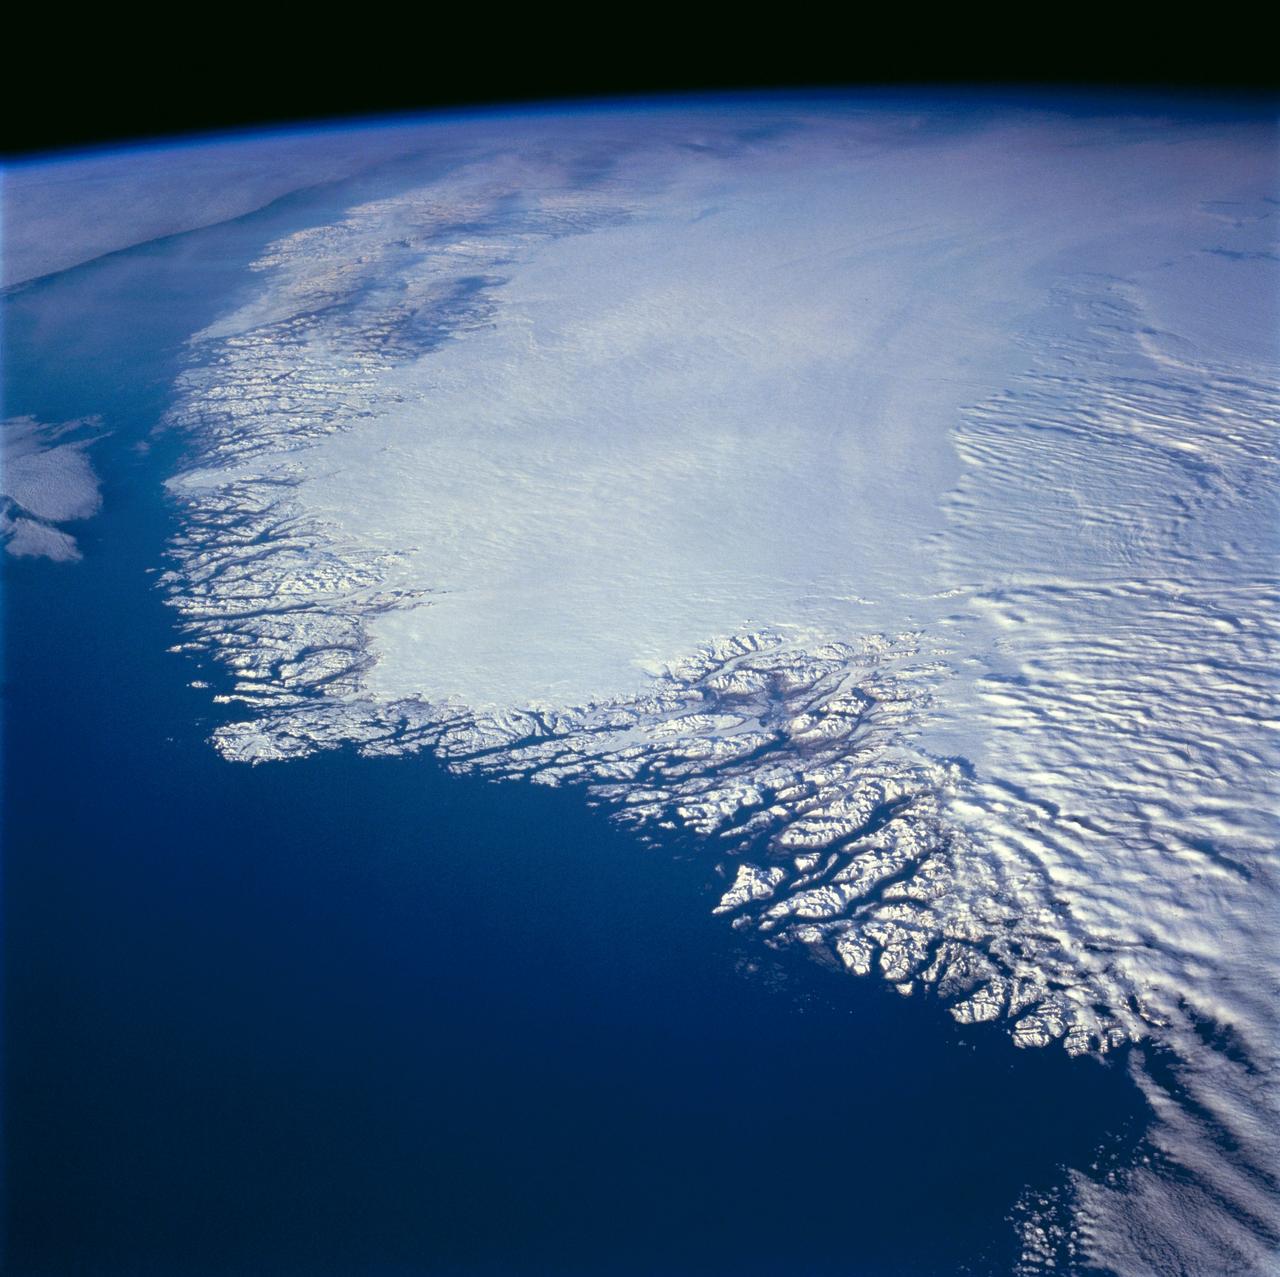
This north-looking view of southwestern Greenland was taken in November, 1994, and shows numerous indentations, many of which contain small settlements. These fjords were carved by the glaciers of the last ice age 10,000 years ago. Even today, the ice in the center of Greenland is nearly 3,500 meters (11,000 feet) thick and great rivers of ice continuously flow down toward the sea, where they melt or break off as icebergs. Some Icebergs exceed the size of small islands, weigh several million tons, and rise several hundred feet above the sea surface. Cape Farewell is visible toward the bottom right of the view. Julianehab Bay and the Bredev fjord can be seen toward the center of the photograph. Godthab, the main settlement on Greenland, is barely visible to the north of the Frederikeshabs Icefield near the left center of the view.
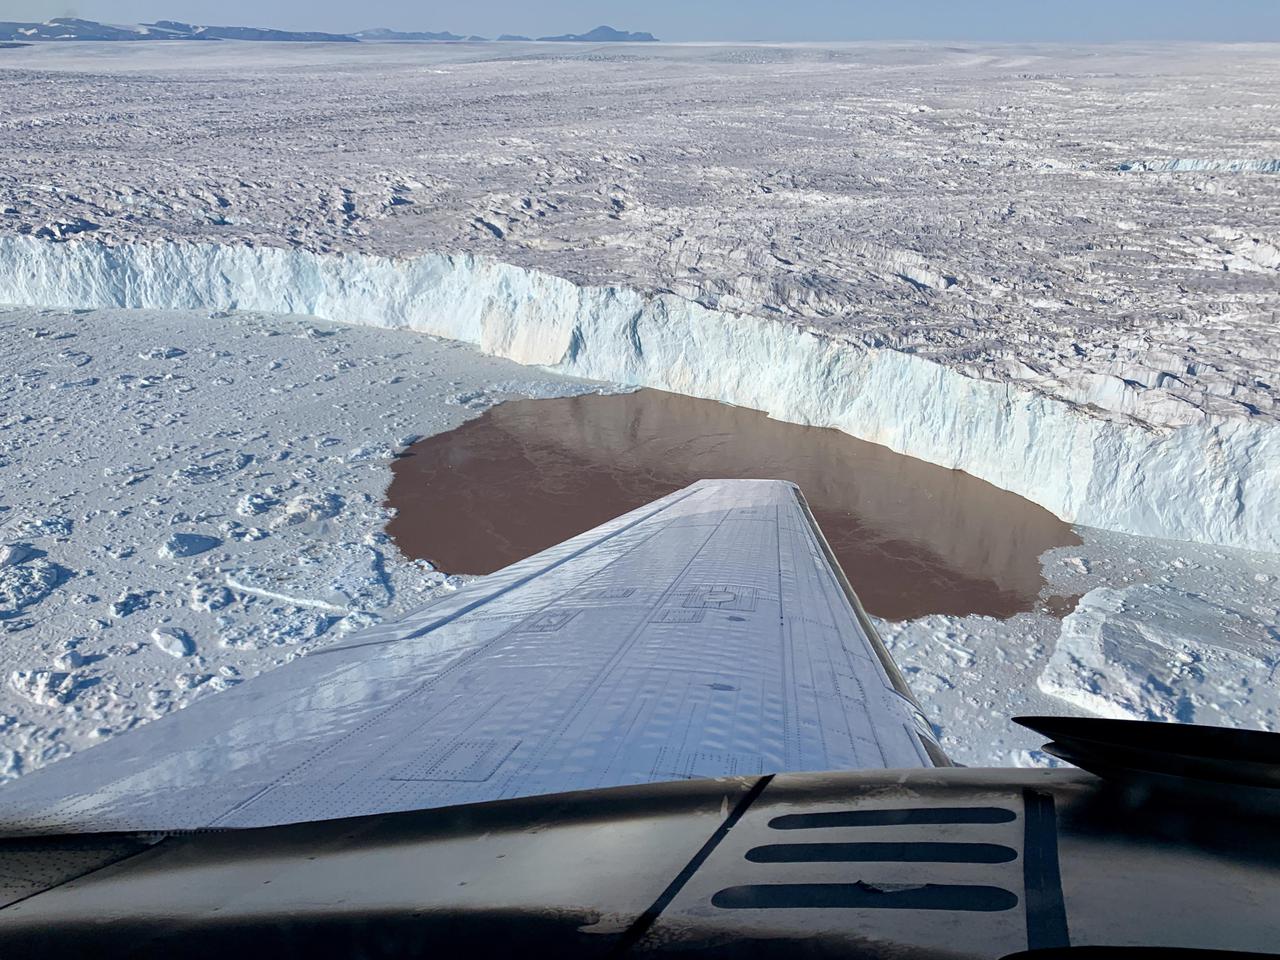
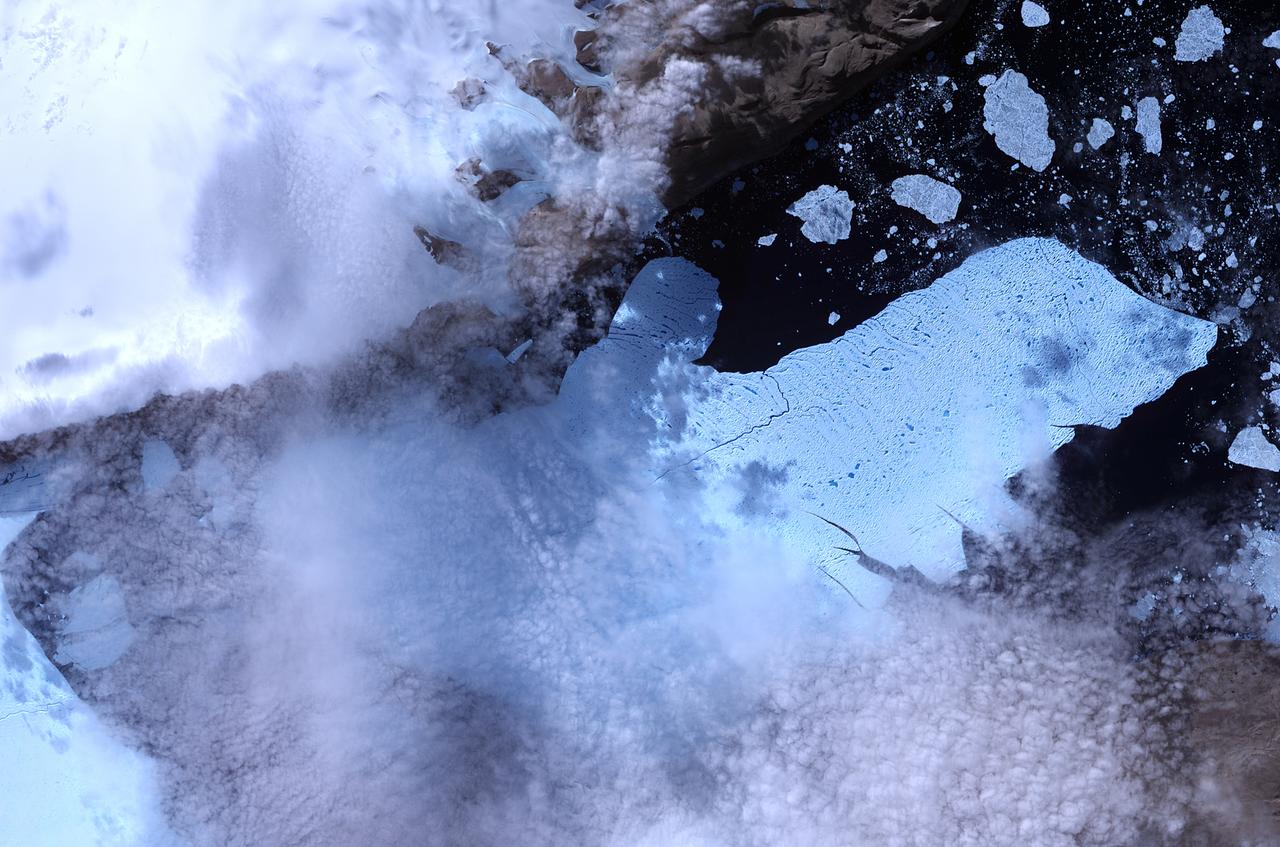
In this aerial view, a glacier along Greenland's craggy coastline is actively undergoing undercutting, a process in which meltwater flowing out from the bottom of the glacier enters the fjord. The brown water in front of the glacier is caused by sediment being dredged up from the base of the glacier by meltwater plumes reaching the surface of the fjord. Because the meltwater contains no salt, it is lighter and rises through the saltier ocean water, dragging the warm ocean water into contact with the ice at the glacier's base. The result is increased melting at the bottom of the glacier, which creates and overhanging layer of ice that breaks off (or calves) as icebergs. As the climate warms, the ocean water temperature and the amount of meltwater both increase, combining to hasten this undercutting process and speed up the ice loss from Greenland's Ice Sheet. The image was taken on Aug. 25, 2019 by a probe-dropping airplane as part of the Oceans Melting Greenland (OMG) mission. OMG has been studying glaciers that plunge into Greenland's steep-sided inlets, or fjords, for the past five years, gathering precise measurements of fjord depth and water salinity from probes dropped by plane, supplemented by measurements made by boat. The aim is to better understand how the warming ocean water around Greenland is hastening ice melt and calving of these marine-terminating glaciers. https://photojournal.jpl.nasa.gov/catalog/PIA24162
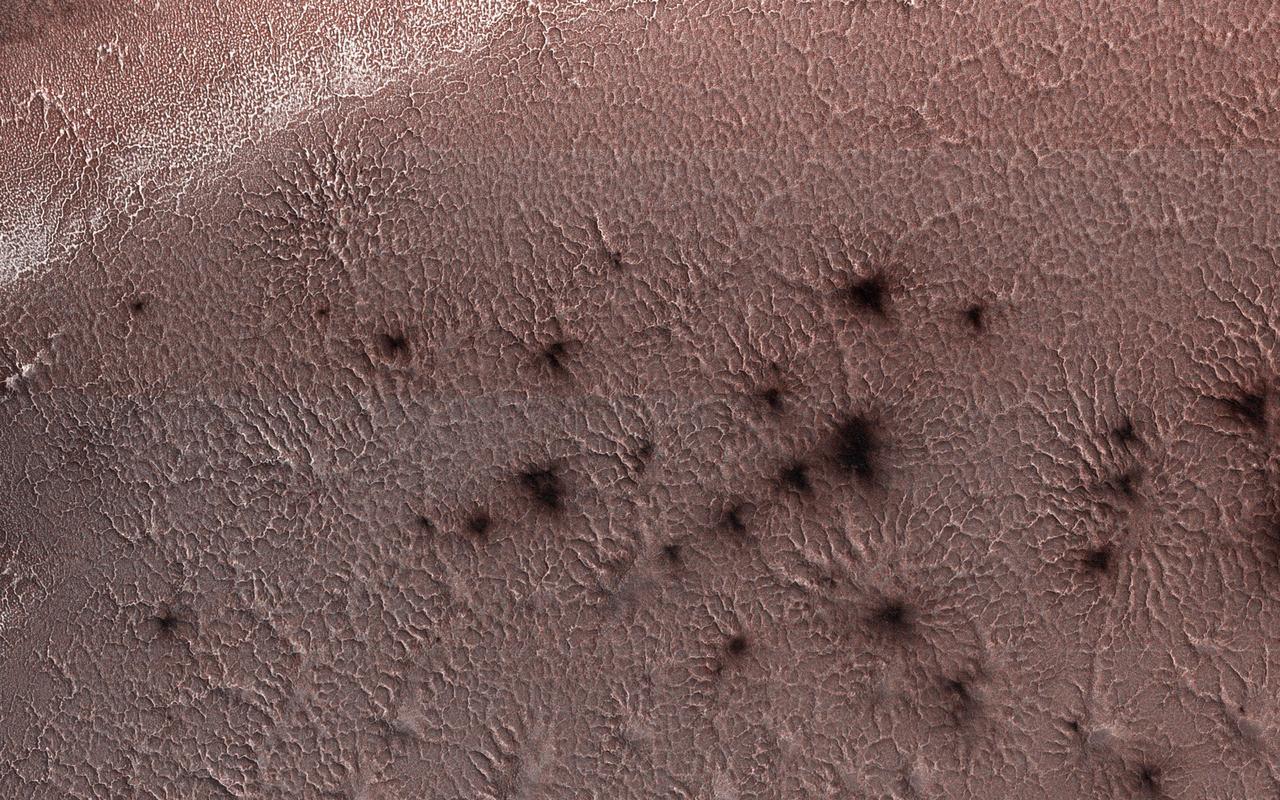
This image from NASA's Mars Reconnaissance Orbiter, acquired May 13, 2018 during winter at the South Pole of Mars, shows a carbon dioxide ice cap covering the region and as the sun returns in the spring, "spiders" begin to emerge from the landscape. But these aren't actual spiders. Called "araneiform terrain," describes the spider-like radiating mounds that form when carbon dioxide ice below the surface heats up and releases. This is an active seasonal process not seen on Earth. Like dry ice on Earth, the carbon dioxide ice on Mars sublimates as it warms (changes from solid to gas) and the gas becomes trapped below the surface. Over time the trapped carbon dioxide gas builds in pressure and is eventually strong enough to break through the ice as a jet that erupts dust. The gas is released into the atmosphere and darker dust may be deposited around the vent or transported by winds to produce streaks. The loss of the sublimated carbon dioxide leaves behind these spider-like features etched into the surface. More information is available at https://photojournal.jpl.nasa.gov/catalog/PIA22587
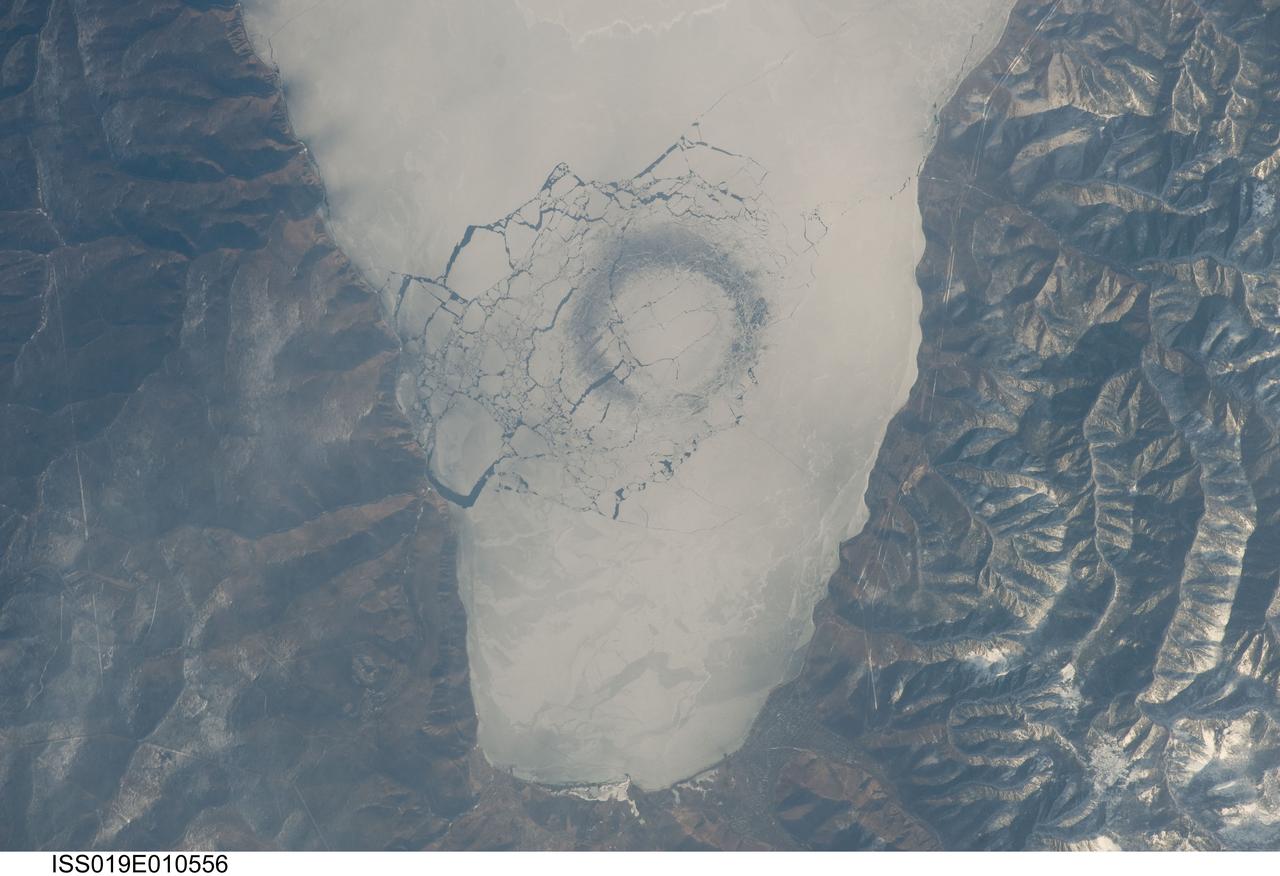
ISS019-E-010556 (23 April 2009) --- A circle in thin ice in Lake Baikal, Russia is featured in this image photographed by an Expedition 19 crewmember on the International Space Station. Late in April 2009, astronauts aboard the station observed a strange circular area of thinned ice (dark in color, with a diameter of about 4.4 kilometers) in the southern end of Lake Baikal in southern Siberia. Lake Baikal is unique in many regards. It is the largest (by volume) and deepest (1,637 meters at the deepest point) fresh water lake on Earth and, as a World Heritage Site, is considered one of Russia?s environmental jewels. The lake?s long, thin and deep profile results from its location in the Baikal Rift valley in Siberia. According to scientists, it is also one of the world?s oldest lakes (25-30 million years old); it contains up to 7 kilometers of sediment deposited on the bottom, and is home to an amazing array of plants and animals, many being found only in Lake Baikal. The lake?s biodiversity includes fresh water seals and several species of fish that are not found elsewhere on Earth. Siberia is remote and cold; ice cover can persist into June. This detailed image shows a circle of thin ice, which is the focal point for ice break up in the very southern end of the lake. While the origin of the circles is unknown, the peculiar pattern suggests convection in the lake?s water column. Ice cover changes rapidly at this time of year. Within a day, the ice can melt almost completely, and then freeze again overnight. Throughout April, the circles are persistent ? they appear when ice cover forms, and then disappear as ice melts. The pattern and appearance suggests that the ice is quite thin.
Between July 10 and 12, 2017, the Larsen C Ice Shelf in West Antarctica calved one of the largest icebergs in history (named "A-68"), weighing approximately one trillion tons. The rift in the ice shelf that spawned the iceberg has been present on the shelf since at least the beginning of the Landsat era (approximately the 1970s), but remained relatively dormant until around 2012, when it was observed actively moving through a suture zone in the ice shelf (Jansen et al., 2015). Suture zones are wide bands of ice that extend from glacier grounding lines (the boundary between a floating ice shelf and ice resting on bedrock) to the sea comprised of a frozen mixture of glacial ice and sea water, traditionally considered to be stabilizing features in ice shelves. When the Antarctic entered its annual dark period in late April, scientists knew the rift only had a few more miles to go before it completely calved the large iceberg. However, due to the lack of sunlight during the Antarctic winter, visible imagery is generally not available each year between May and August. This frame is from an animation that shows the ice shelf as imaged by the NASA/NOAA satellite Suomi NPP, which features the VIIRS (Visible Infrared Imaging Radiometer Suite) instrument. VIIRS has a day/night panchromatic band capable of collecting nighttime imagery of Earth with a spatial resolution of 2,460 feet (750 meters). An image from the Moderate Resolution Imaging Spectroradiometer (MODIS) instrument on NASA's Terra satellite shows the last cloud-free, daytime image of the ice shelf on April 6; the MODIS thermal imagery band is shown on April 29. The images from May 9 to July 14 show available cloud-free imagery from Suomi NPP. Luckily, despite several cloudy days leading up to the break, the weather mostly cleared on July 11, allowing scientists to see the newly formed iceberg on July 12. The animation is available at https://photojournal.jpl.nasa.gov/catalog/PIA21785
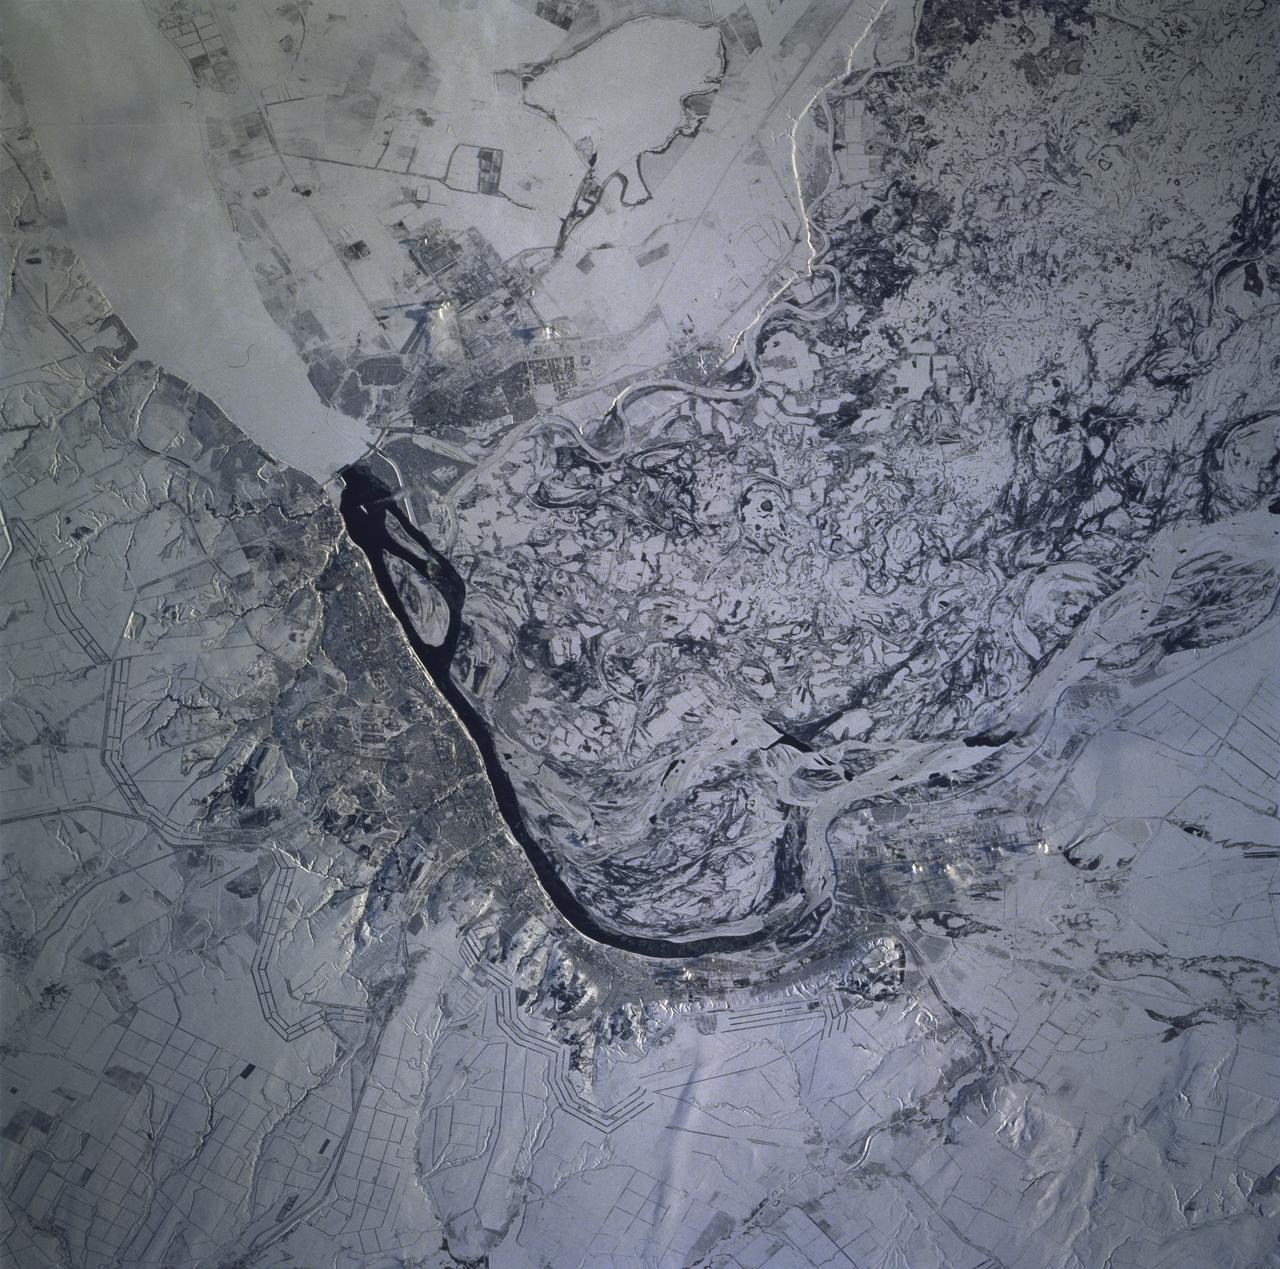
STS081-715-004 (12-22 Jan. 1997) --- As photographed with a 70mm camera aboard the Space Shuttle Atlantis, this scene features the Volga River and Volgograd under snow. Contrast in brightness shows up many features in this near-vertical view of the great bend of the Volga River's dark, open strip of water, center. The Volga flows south into the view from top right, then southeast from the center to the bottom. Volgograd appears as the gray zone along the left (west) side of the open water. Presumably the ice-free part of the river opposite Volgograd relates to the slightly warmer water which is spilled from prominent, ice-covered Lake Volgograd (top right). The wide patterns of swirls, center to lower right, are numerous meander bends on the Volga's floodplain (up to 20 miles wide), highlighted by snow. The main course of the Volga is once again ice covered in this floodplain belt. The Volga-Don Canal can be seen leaving the river just south of the bend, exiting the view center left. This canal, with others in the Moscow region, allows barge traffic to move through the Russian heartland, from the Black Sea to the Baltic at Leningrad. The long parallel lines in threes and fours are lines of trees used as wind breaks. They stretch across Russia for hundreds of miles.
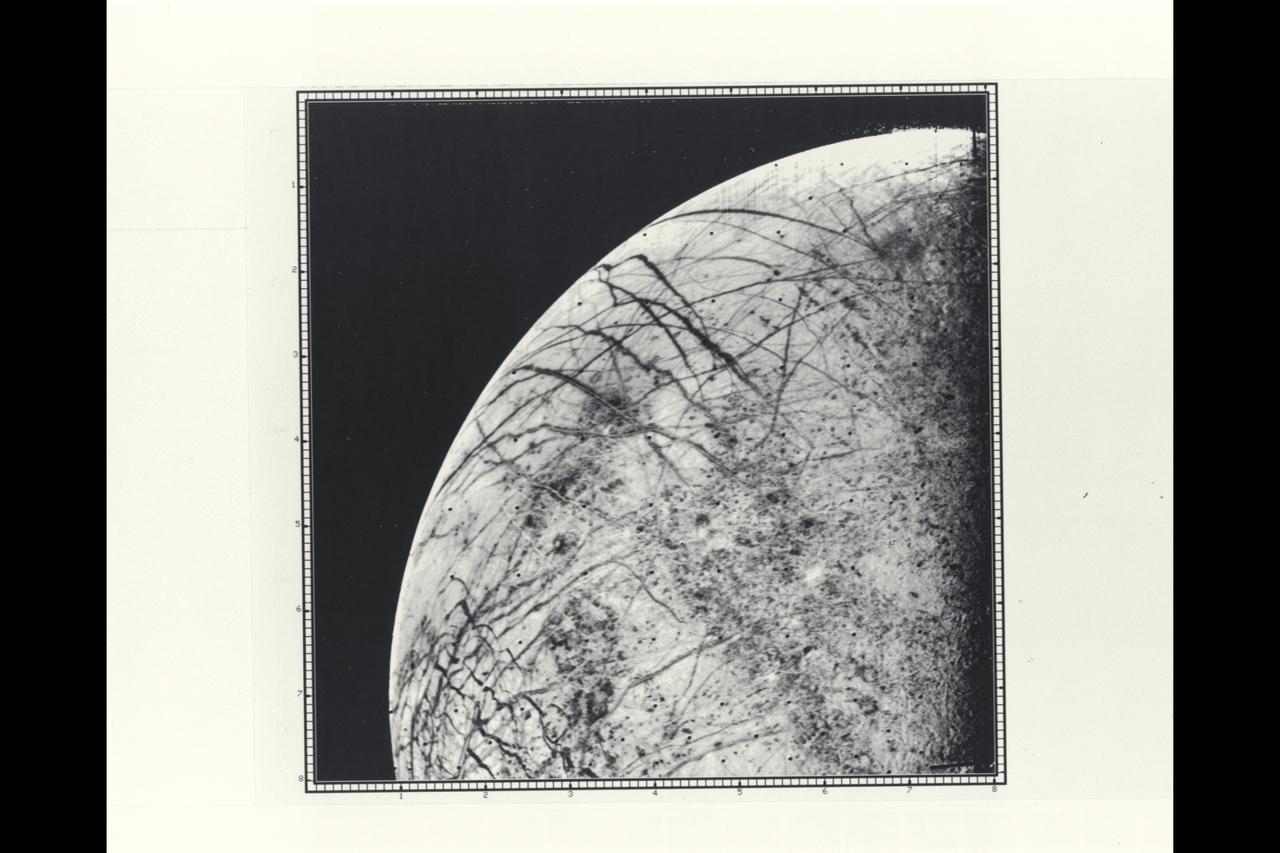
P-21758 BW Range: 246,000 kilometers (152,000 miles) This picture by Voyager 2 is the first close look ever obtained of Jupiter's satellite, Europa. The linear crack-like features had been seen from a much greater distance by Voyager 1 but this image provides a resolution of about four kilometers (2.5 miles). The complicated linear features appear even more like cracks or huge fractures in these images. Also seen are somewhat darker mottled regions which appear to have a slightly pitted appearance, perhaps due to small scale craters. No large craters (more than five kilometers in diameter) are easily identifiable in the Europa photographs to date, suggesting that this satellite has a young surface relative to Ganymede and Callisto, although not perhaps as young as Io's. Various models for Europa's structure will be tested during analysis of these images, including the possibility that the surface is a thin ice crust overlying water or softer ice and that the fracture systems seen are breaks in that crust. Resurfacing mechanisms such as production of fresh ice or snow along the cracks and cold glacier-like flows are being considered as possibilities for removing evidence of impact events. Europa thus appears to truly be a satellite with many properties intermediate between Ganymede and Io.
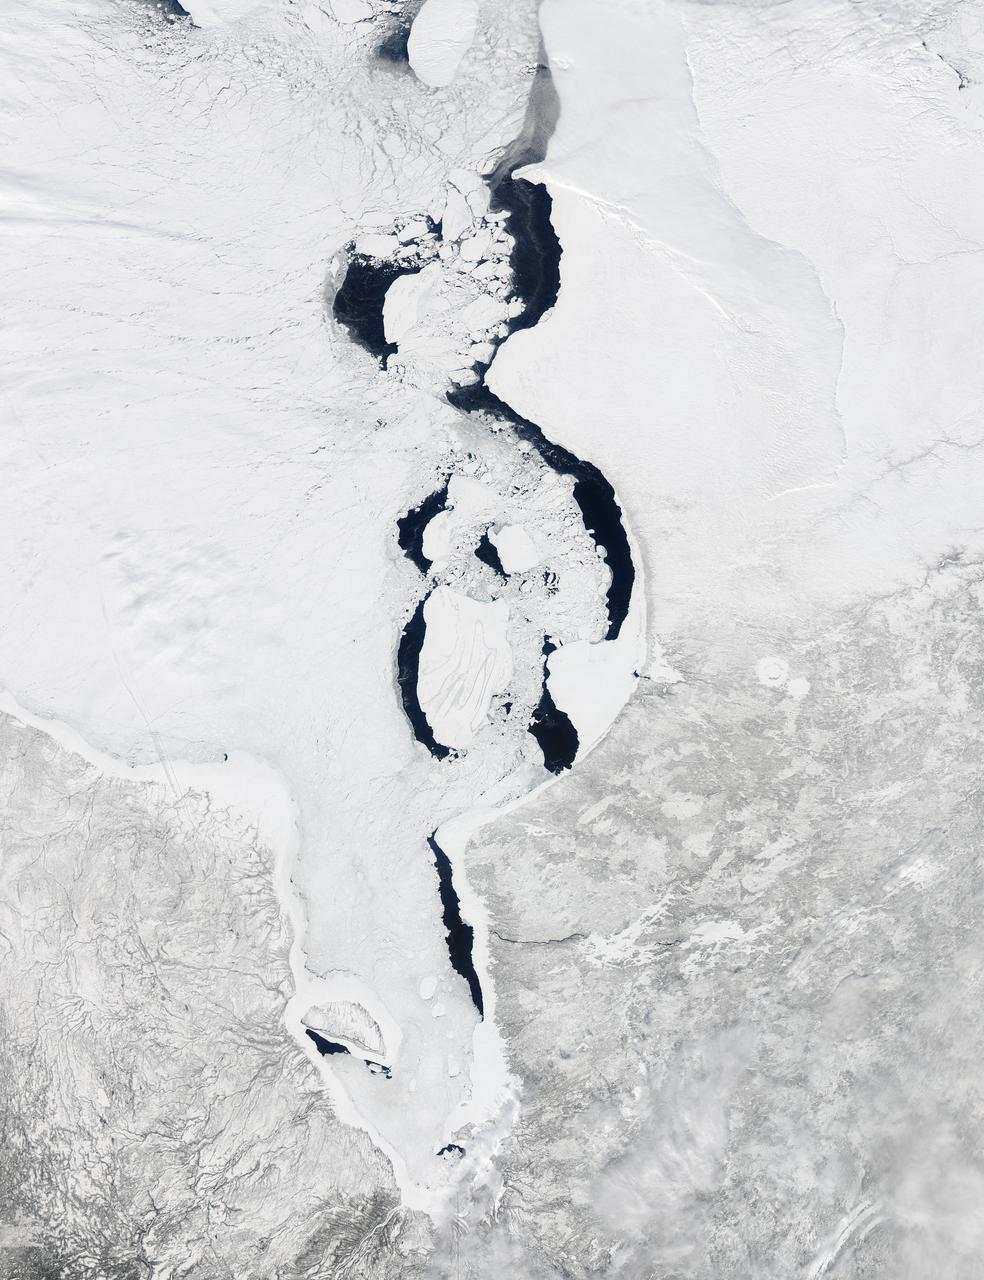
Each winter sea ice forms over the salty waters of frigid northeastern Canada's Hudson Bay. As sunlight lengthens and weather warms, ice begins to break up and melt, with retreat typically starting in May and melt-out completed sometime in July. Since the 1970s, the timing of sea ice breakup in Hudson Bay has changed, with melting beginning earlier in the spring. The Moderate Resolution Imaging Spectroradiometer (MODIS) aboard NASA’s Aqua satellite captured this a true-color image of Hudson Bay on March 26, 2013. Although snow still covers the surrounding land, ice has already begun to retreat from much of the eastern shore of the Bay visible in the image. A ring of bright white ice remains solidly frozen around the Belcher Islands in the southeast section of the Bay, but this ring is surrounded by blue waters and large chunks of ice. In the southwest, a similar situation is seen at Akimiski Island. The shelf of bright white ice gives way to open water in the south, as well as fractured, blue-tinted ice. The blue tint generally indicates water logging as ice begins to soften. The Aqua satellite captured a similar image of early ice melt on Hudson Bay on April 6, 2012. That image can be viewed at: <a href="http://modis.gsfc.nasa.gov/gallery/individual.php?db_date=2012-04-19" rel="nofollow">modis.gsfc.nasa.gov/gallery/individual.php?db_date=2012-0...</a> <b><a href="http://www.nasa.gov/audience/formedia/features/MP_Photo_Guidelines.html" rel="nofollow">NASA image use policy.</a></b> <b><a href="http://www.nasa.gov/centers/goddard/home/index.html" rel="nofollow">NASA Goddard Space Flight Center</a></b> enables NASA’s mission through four scientific endeavors: Earth Science, Heliophysics, Solar System Exploration, and Astrophysics. Goddard plays a leading role in NASA’s accomplishments by contributing compelling scientific knowledge to advance the Agency’s mission. <b>Follow us on <a href="http://twitter.com/NASA_GoddardPix" rel="nofollow">Twitter</a></b> <b>Like us on <a href="http://www.facebook.com/pages/Greenbelt-MD/NASA-Goddard/395013845897?ref=tsd" rel="nofollow">Facebook</a></b> <b>Find us on <a href="http://instagram.com/nasagoddard?vm=grid" rel="nofollow">Instagram</a></b>

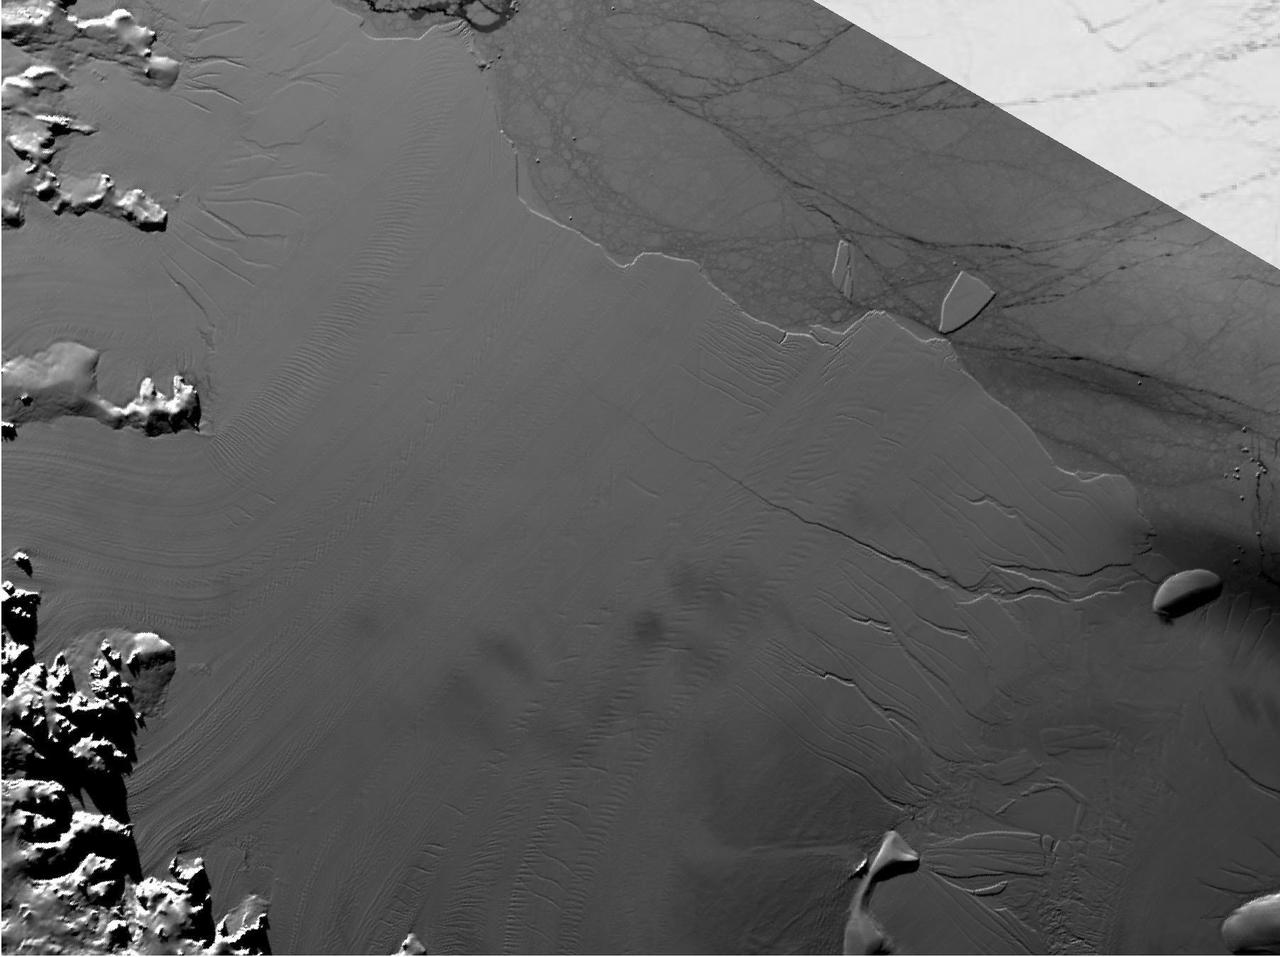
NASA image acquired September 6, 2010 The Matusevich Glacier flows toward the coast of East Antarctica, pushing through a channel between the Lazarev Mountains and the northwestern tip of the Wilson Hills. Constrained by surrounding rocks, the river of ice holds together. But stresses resulting from the glacier’s movement make deep crevasses, or cracks, in the ice. After passing through the channel, the glacier has room to spread out as it floats on the ocean. The expanded area and the jostling of ocean waves prompts the ice to break apart, which it often does along existing crevasses. On September 6, 2010, the Advanced Land Imager (ALI) on NASA’s Earth Observing-1 (EO-1) satellite captured this natural-color image of the margin of Matusevich Glacier. Shown here just past the rock-lined channel, the glacier is calving large icebergs. Low-angled sunlight illuminates north-facing surfaces and casts long shadows to the south. Fast ice anchored to the shore surrounds both the glacier tongue and the icebergs it has calved. Compared to the glacier and icebergs, the fast ice is thinner with a smoother surface. Out to sea (image left), the sea ice is even thinner and moves with winds and currents. Matusevich Glacier does not drain a significant amount of ice off of the Antarctic continent, so the glacier’s advances and retreats lack global significance. Like other Antarctic glaciers, however, Matusevich helps glaciologists form a larger picture of Antarctica’s glacial health and ice sheet volume. NASA Earth Observatory image created by Jesse Allen and Robert Simmon, using EO-1 ALI data provided courtesy of the NASA EO-1 team. Caption by Michon Scott based on image interpretation by Robert Bindschadler, NASA Goddard Space Flight Center, and Walt Meier, National Snow and Ice Data Center. Instrument: EO-1 - ALI Credit: <b><a href="http://www.earthobservatory.nasa.gov/" rel="nofollow"> NASA Earth Observatory</a></b> <b><a href="http://www.nasa.gov/centers/goddard/home/index.html" rel="nofollow">NASA Goddard Space Flight Center</a></b> enables NASA’s mission through four scientific endeavors: Earth Science, Heliophysics, Solar System Exploration, and Astrophysics. Goddard plays a leading role in NASA’s accomplishments by contributing compelling scientific knowledge to advance the Agency’s mission. <b>Follow us on <a href="http://twitter.com/NASA_GoddardPix" rel="nofollow">Twitter</a></b> <b>Join us on <a href="http://www.facebook.com/pages/Greenbelt-MD/NASA-Goddard/395013845897?ref=tsd" rel="nofollow">Facebook</a></b> To download the full resolution image go to: <a href="http://earthobservatory.nasa.gov/IOTD/view.php?id=46840" rel="nofollow">earthobservatory.nasa.gov/IOTD/view.php?id=46840</a>
At around 2,200 kilometers in diameter, Hellas Planitia is the largest visible impact basin in the Solar System, and hosts the lowest elevations on Mars' surface as well as a variety of landscapes. This image from NASA's Mars Reconnaisance Orbiter (MRO) covers a small central portion of the basin and shows a dune field with lots of dust devil trails. In the middle, we see what appears to be long and straight "scratch marks" running down the southeast (bottom-right) facing dune slopes. If we look closer, we can see these scratch marks actually squiggle back and forth on their way down the dune. These scratch marks are linear gullies. Just like on Earth, high-latitude regions on Mars are covered with frost in the winter. However, the winter frost on Mars is made of carbon dioxide ice (dry ice) instead of water ice. We believe linear gullies are the result of this dry ice breaking apart into blocks, which then slide or roll down warmer sandy slopes, sublimating and carving as they go. The linear gullies exhibit exceptional sinuosity (the squiggle pattern) and we believe this to be the result of repeated movement of dry ice blocks in the same path, possibly in combination with different hardness or flow resistance of the sand within the dune slopes. Determining the specific process that causes the formation and evolution of sinuosity in linear gullies is a question scientists are still trying to answer. What do you think causes the squiggles? https://photojournal.jpl.nasa.gov/catalog/PIA22052
NASA image acquired August 11, 2010. After breaking off the Petermann Glacier on August 5, 2010, a massive ice island floated slowly down the fjord toward the Nares Strait. The Advanced Spaceborne Thermal Emission and Reflection Radiometer (ASTER) on NASA’s Terra satellite captured this false-color image of the ice island on August 11, 2010. In this image, ice is light blue, water is nearly black, and clouds are nearly white. Although a bank of thin clouds hovers over the fjord, the southernmost margin of the ice island is still visible. Toward the north, the leading edge of the ice island retains the same shape it had days earlier, at the time of the initial calving. NASA Earth Observatory image created by Jesse Allen, using data provided courtesy of NASA/GSFC/METI/ERSDAC/JAROS, and U.S./Japan ASTER Science Team. Caption by Michon Scott. Instrument: Terra - ASTER To see more images from of the glacier go to: <a href="http://earthobservatory.nasa.gov/NaturalHazards/event.php?id=45116" rel="nofollow">earthobservatory.nasa.gov/NaturalHazards/event.php?id=45116</a> <b><a href="http://www.nasa.gov/centers/goddard/home/index.html" rel="nofollow">NASA Goddard Space Flight Center</a></b> is home to the nation's largest organization of combined scientists, engineers and technologists that build spacecraft, instruments and new technology to study the Earth, the sun, our solar system, and the universe. <b>Follow us on <a href="http://twitter.com/NASA_GoddardPix" rel="nofollow">Twitter</a></b> <b>Join us on <a href="http://www.facebook.com/pages/Greenbelt-MD/NASA-Goddard/395013845897?ref=tsd" rel="nofollow">Facebook</a><b></b></b>
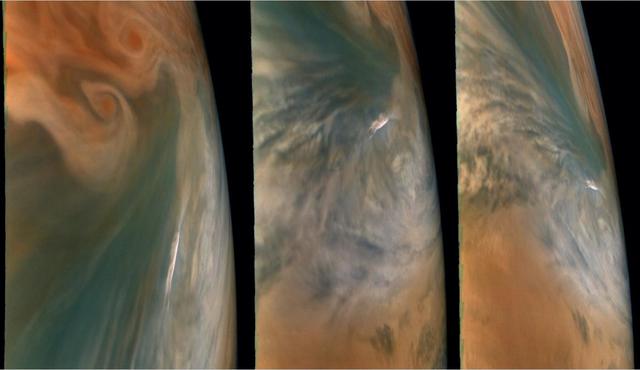
These images from NASA's Juno mission show three different views of a Jupiter "hot spot" — a break in Jupiter's cloud deck that provides a glimpse into Jupiter's deep atmosphere. Hot spots are flanked by clouds and active storms, and fueled by high-altitude electrical discharges recently discovered by Juno known as "shallow lightning." The pictures were taken by the JunoCam imager during its 29th close flyby of the giant planet on Sept. 16, 2020. Not all of Jupiter's clouds are the same. The planet is composed mostly of hydrogen and helium, and the vivid colors that appear in thick bands across Jupiter are likely plumes of sulfur compounds and phosphorus-containing gases rising from the planet's warmer interior. The small, bright cloud feature seen here is likely made of ammonia ice and water ice rising to a higher altitude than the surrounding features. The original JunoCam images used to produce these views were taken from altitudes between about 2,700 and 4,500 miles (4,300 and 7,200 kilometers) above Jupiter's cloud tops. Citizen scientist Brian Swift processed the images to enhance the color and contrast. https://photojournal.jpl.nasa.gov/catalog/PIA24298

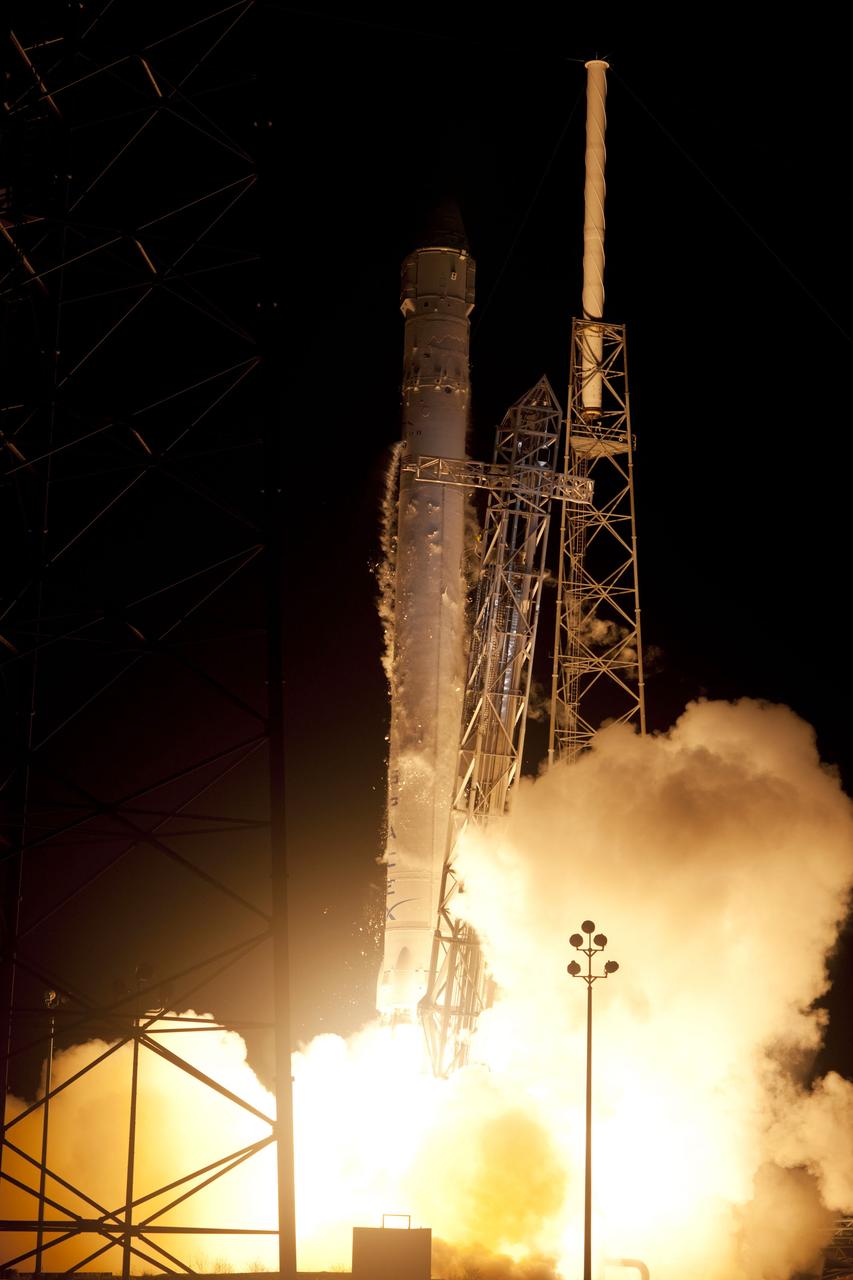
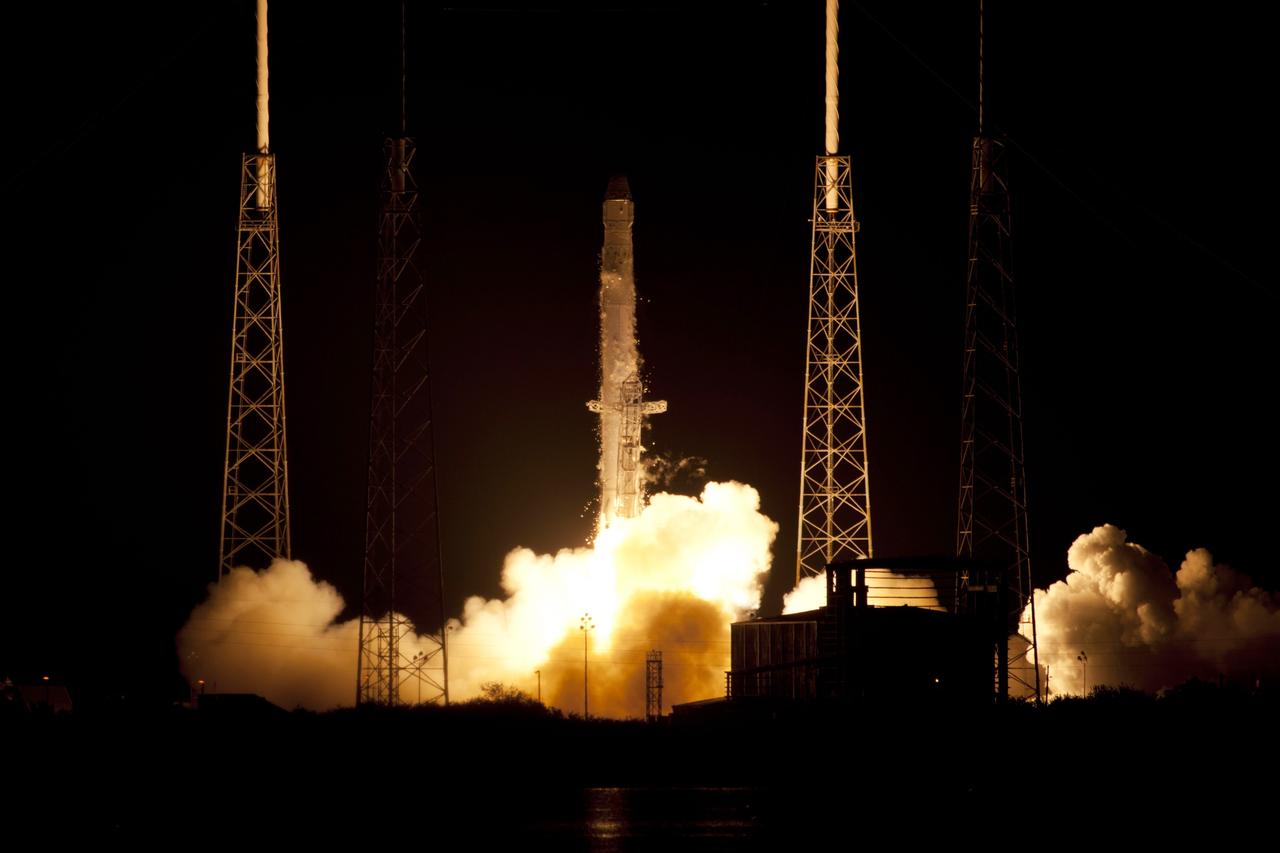
CAPE CANAVERAL, Fla. – Frost and ice breaks away from the SpaceX Falcon 9 rocket following ignition of its nine Merlin engines at 3:44 a.m. EDT at Space Launch Complex-40 on Cape Canaveral Air Force Station in Florida. The launch is the company's second demonstration test flight for NASA's Commercial Orbital Transportation Services, or COTS, Program. During the flight, the Dragon capsule will conduct a series of check-out procedures to test and prove its systems, including rendezvous and berthing with the International Space Station. If the capsule performs as planned, the cargo and experiments it is carrying will be transferred to the station. The cargo includes food, water and provisions for the station’s Expedition crews, such as clothing, batteries and computer equipment. Under COTS, NASA has partnered with two aerospace companies to deliver cargo to the station. For more information, visit http://www.nasa.gov/spacex. Photo credit: NASA/Rusty Backer

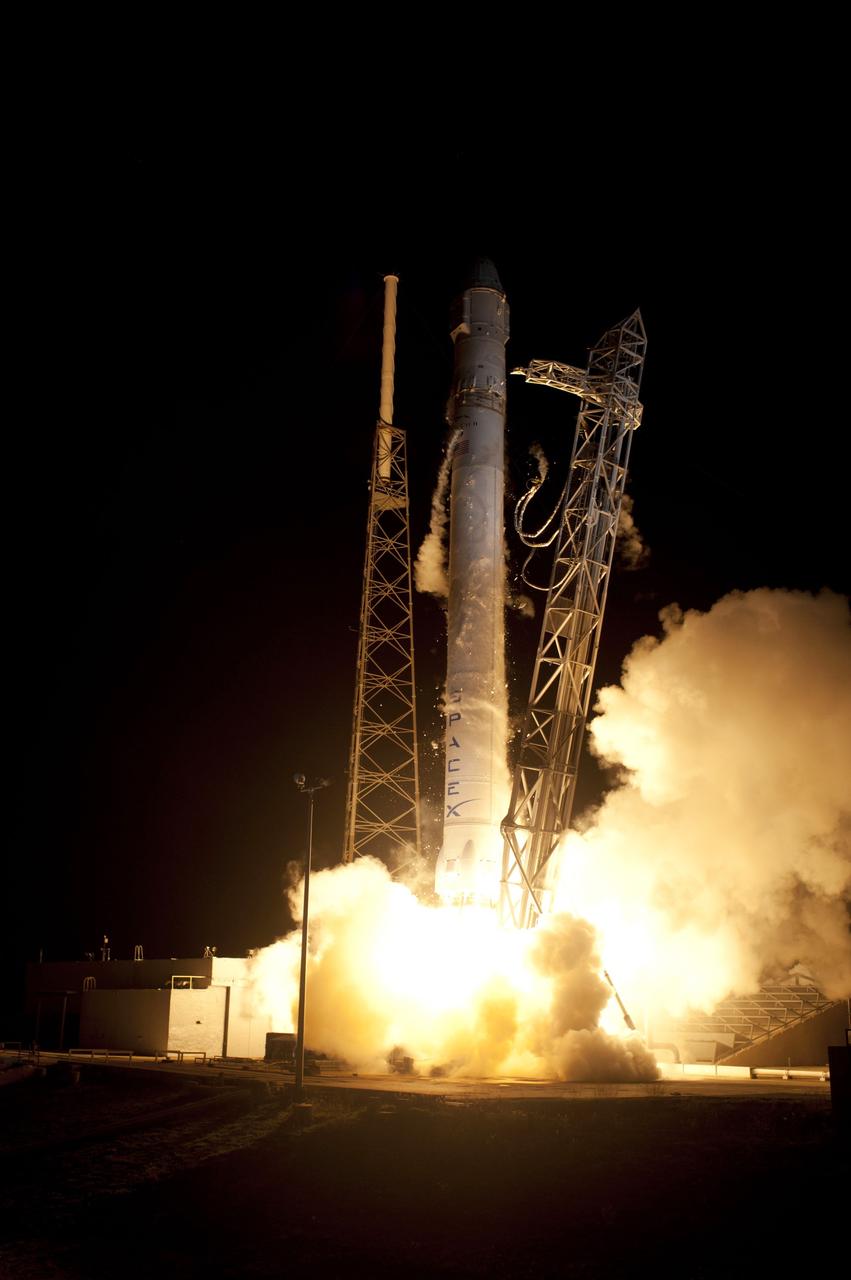
CAPE CANAVERAL, Fla. – Frost and ice breaks away from the SpaceX Falcon 9 rocket as its Merlin engines ignite at 3:44 a.m. EDT at Space Launch Complex-40 on Cape Canaveral Air Force Station in Florida. The launch is the company's second demonstration test flight for NASA's Commercial Orbital Transportation Services, or COTS, Program. During the flight, the Dragon capsule will conduct a series of check-out procedures to test and prove its systems, including rendezvous and berthing with the International Space Station. If the capsule performs as planned, the cargo and experiments it is carrying will be transferred to the station. The cargo includes food, water and provisions for the station’s Expedition crews, such as clothing, batteries and computer equipment. Under COTS, NASA has partnered with two aerospace companies to deliver cargo to the station. For more information, visit http://www.nasa.gov/spacex. Photo credit: NASA/Rick Wetherington, Tim Powers and Tim Terry

CAPE CANAVERAL, Fla. – Frost and ice breaks away from the SpaceX Falcon 9 rocket following ignition of its nine Merlin engines at 3:44 a.m. EDT at Space Launch Complex-40 on Cape Canaveral Air Force Station in Florida. The launch is the company's second demonstration test flight for NASA's Commercial Orbital Transportation Services, or COTS, Program. During the flight, the Dragon capsule will conduct a series of check-out procedures to test and prove its systems, including rendezvous and berthing with the International Space Station. If the capsule performs as planned, the cargo and experiments it is carrying will be transferred to the station. The cargo includes food, water and provisions for the station’s Expedition crews, such as clothing, batteries and computer equipment. Under COTS, NASA has partnered with two aerospace companies to deliver cargo to the station. For more information, visit http://www.nasa.gov/spacex. Photo credit: NASA/Rick Wetherington, Tim Powers and Tim Terry

CAPE CANAVERAL, Fla. – Frost and ice breaks away from the SpaceX Falcon 9 rocket following ignition of its nine Merlin engines at 3:44 a.m. EDT at Space Launch Complex-40 on Cape Canaveral Air Force Station in Florida. The launch is the company's second demonstration test flight for NASA's Commercial Orbital Transportation Services, or COTS, Program. During the flight, the Dragon capsule will conduct a series of check-out procedures to test and prove its systems, including rendezvous and berthing with the International Space Station. If the capsule performs as planned, the cargo and experiments it is carrying will be transferred to the station. The cargo includes food, water and provisions for the station’s Expedition crews, such as clothing, batteries and computer equipment. Under COTS, NASA has partnered with two aerospace companies to deliver cargo to the station. For more information, visit http://www.nasa.gov/spacex. Photo credit: NASA/Rick Wetherington, Tim Powers and Tim Terry
CAPE CANAVERAL, Fla. – Frost and ice breaks away from the SpaceX Falcon 9 rocket following ignition of its nine Merlin engines at 3:44 a.m. EDT at Space Launch Complex-40 on Cape Canaveral Air Force Station in Florida. The launch is the company's second demonstration test flight for NASA's Commercial Orbital Transportation Services, or COTS, Program. During the flight, the Dragon capsule will conduct a series of check-out procedures to test and prove its systems, including rendezvous and berthing with the International Space Station. If the capsule performs as planned, the cargo and experiments it is carrying will be transferred to the station. The cargo includes food, water and provisions for the station’s Expedition crews, such as clothing, batteries and computer equipment. Under COTS, NASA has partnered with two aerospace companies to deliver cargo to the station. For more information, visit http://www.nasa.gov/spacex. Photo credit: NASA/Rusty Backer
CAPE CANAVERAL, Fla. – Frost and ice breaks away from the SpaceX Falcon 9 rocket following ignition of its nine Merlin engines at 3:44 a.m. EDT at Space Launch Complex-40 on Cape Canaveral Air Force Station in Florida. The launch is the company's second demonstration test flight for NASA's Commercial Orbital Transportation Services, or COTS, Program. During the flight, the Dragon capsule will conduct a series of check-out procedures to test and prove its systems, including rendezvous and berthing with the International Space Station. If the capsule performs as planned, the cargo and experiments it is carrying will be transferred to the station. The cargo includes food, water and provisions for the station’s Expedition crews, such as clothing, batteries and computer equipment. Under COTS, NASA has partnered with two aerospace companies to deliver cargo to the station. For more information, visit http://www.nasa.gov/spacex. Photo credit: NASA/Rick Wetherington, Tim Powers and Tim Terry
CAPE CANAVERAL, Fla. – Frost and ice breaks away from the SpaceX Falcon 9 rocket as its Merlin engines ignite at 3:44 a.m. EDT at Space Launch Complex-40 on Cape Canaveral Air Force Station in Florida. The launch is the company's second demonstration test flight for NASA's Commercial Orbital Transportation Services, or COTS, Program. During the flight, the Dragon capsule will conduct a series of check-out procedures to test and prove its systems, including rendezvous and berthing with the International Space Station. If the capsule performs as planned, the cargo and experiments it is carrying will be transferred to the station. The cargo includes food, water and provisions for the station’s Expedition crews, such as clothing, batteries and computer equipment. Under COTS, NASA has partnered with two aerospace companies to deliver cargo to the station. For more information, visit http://www.nasa.gov/spacex. Photo credit: NASA/Rick Wetherington, Tim Powers and Tim Terry

CAPE CANAVERAL, Fla. – Frost and ice breaks away from the SpaceX Falcon 9 rocket following ignition of its nine Merlin engines at 3:44 a.m. EDT at Space Launch Complex-40 on Cape Canaveral Air Force Station in Florida. The launch is the company's second demonstration test flight for NASA's Commercial Orbital Transportation Services, or COTS, Program. During the flight, the Dragon capsule will conduct a series of check-out procedures to test and prove its systems, including rendezvous and berthing with the International Space Station. If the capsule performs as planned, the cargo and experiments it is carrying will be transferred to the station. The cargo includes food, water and provisions for the station’s Expedition crews, such as clothing, batteries and computer equipment. Under COTS, NASA has partnered with two aerospace companies to deliver cargo to the station. For more information, visit http://www.nasa.gov/spacex. Photo credit: NASA/Rick Wetherington, Tim Powers and Tim Terry

CAPE CANAVERAL, Fla. – Frost and ice breaks away from the SpaceX Falcon 9 rocket following ignition of its nine Merlin engines at 3:44 a.m. EDT at Space Launch Complex-40 on Cape Canaveral Air Force Station in Florida. The launch is the company's second demonstration test flight for NASA's Commercial Orbital Transportation Services, or COTS, Program. During the flight, the Dragon capsule will conduct a series of check-out procedures to test and prove its systems, including rendezvous and berthing with the International Space Station. If the capsule performs as planned, the cargo and experiments it is carrying will be transferred to the station. The cargo includes food, water and provisions for the station’s Expedition crews, such as clothing, batteries and computer equipment. Under COTS, NASA has partnered with two aerospace companies to deliver cargo to the station. For more information, visit http://www.nasa.gov/spacex. Photo credit: NASA/Rick Wetherington, Tim Powers and Tim Terry
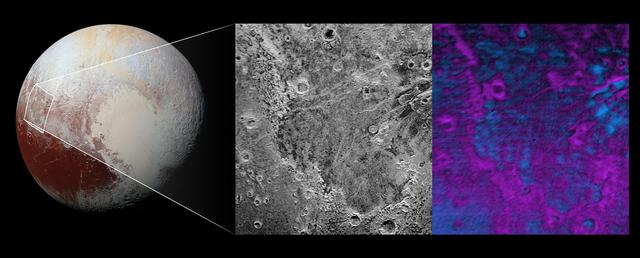
Scientists on NASA's New Horizons mission have discovered what looks like a giant bite-mark on the planet's surface. In this image, north is up. The southern portion of the left inset above shows the cratered plateau uplands informally named Vega Terra (note that all feature names are informal). This terrain is separated from the young, nearly uncratered, mottled plains of Piri Planitia in the center of the image by a generally north-facing jagged scarp called Piri Rupes. The scarp breaks up into isolated mesas in several places. Cutting diagonally across Piri Planitia is the long extensional fault of Inanna Fossa, which stretches eastward 370 miles (600 kilometers) from here to the western edge of the great nitrogen ice plains of Sputnik Planum. Compositional data from the New Horizons spacecraft's Ralph/Linear Etalon Imaging Spectral Array (LEISA) instrument, shown in the right inset, indicate that the plateau uplands south of Piri Rupes are rich in methane ice (shown in false color as purple). Scientists speculate that sublimation of methane may be causing the plateau material to erode along the face of the scarp cliffs, causing them to retreat south and leave the plains of Piri Planitia in their wake. Compositional data also show that the surface of Piri Planitia is more enriched in water ice (shown in false color as blue) than the plateau uplands, which may indicate that Piri Planitia's surface is made of water ice bedrock, on top of which the layer of retreating methane ice had been sitting. Because the surface of Pluto is so cold, the water ice behaves like rock and is immobile. The light/dark mottled pattern of Piri Planitia in the left inset is reflected in the composition map, with the lighter areas corresponding to areas richer in methane – these may be remnants of methane that have not yet sublimated away entirely. The inset at left shows about 650 feet (200 meters) per pixel; the image measures approximately 280 miles (450 kilometers) long by 255 miles (410 kilometers) wide. It was obtained by New Horizons at a range of approximately 21,100 miles (33,900 kilometers) from Pluto, about 45 minutes before the spacecraft's closest approach to Pluto on July 14, 2015.The LEISA data at right was gathered when the spacecraft was about 29,000 miles (47,000 kilometers) from Pluto; best resolution is 1.7 miles (2.7 kilometers) per pixel. http://photojournal.jpl.nasa.gov/catalog/PIA20531

The Visible Infrared Imaging Radiometer Suite (VIIRS) on the Suomi NPP satellite captured this view of extensive sea-ice fracturing off the northern coast of Alaska. The event began in late-January and spread west toward Banks Island throughout February and March 2013. Visualizations of the Arctic often give the impression that the ice cap is a continuous sheet of stationary, floating ice. In fact, it is a collection of smaller pieces that constantly shift, crack, and grind against one another as they are jostled by winds and ocean currents. Especially during the summer—but even during the height of winter—cracks—or leads—open up between pieces of ice. That was what was happening on the left side of the animation (seen here: <a href="http://bit.ly/10kE7sh" rel="nofollow">bit.ly/10kE7sh</a>) in late January. A high-pressure weather system was parked over the region, producing warmer temperatures and winds that flowed in a southwesterly direction. That fueled the Beaufort Gyre, a wind-driven ocean current that flows clockwise. The gyre was the key force pulling pieces of ice west past Point Barrow, the northern nub of Alaska that protrudes into the Beaufort Sea. “A fracturing event in this area is not unusual because the Beaufort Gyre tends to push ice away from Banks Island and the Canadian Archipelago,” explained Walt Meier of the National Snow & Ice Data Center (NSIDC). “Point Barrow can act like a ‘pin point’ where the ice catches and fractures to the north and east.” In February, however, a series of storms passing over central Alaska exacerbated the fracturing. Strong westerly winds prompted several large pieces of ice to break away in an arc-shaped wave that moved progressively east. By the end of February, large pieces of ice had fractured all the way to the western coast of Banks Island, a distance of about 1,000 kilometers (600 miles). The data used to create the animation came from the longwave infrared (thermal) portion of the electromagnetic spectrum, so the animation illustrates how much heat the surface was emitting as VIIRS surveyed the area. Cooler areas (sea ice) appear white, while warmer areas (open water) are dark. The light gray plume near the cracks is warmer, moister air escaping from the ocean and blowing downwind. Clouds do not show up well in the VIIRS thermal band, so the storms that fueled the fracturing are not readily visible. While fracturing events are common, few events sprawl across such a large area or produce cracks as long and wide as those seen here. The age of the sea ice in this area was one of the key reasons this event became so widespread. “The region is covered almost completely by seasonal or first-year ice—ice that has formed since last September,” said Meier. “This ice is thinner and weaker than the older, multi-year ice, so it responds more readily to winds and is more easily broken up.” NASA Earth Observatory images by Jesse Allen using VIIRS day-night band data from the Suomi National Polar-orbiting Partnership. Suomi NPP is the result of a partnership between NASA, the National Oceanic and Atmospheric Administration, and the Department of Defense. Caption by Adam Voiland. Instrument: Suomi NPP - VIIRS For more info go to: <a href="http://earthobservatory.nasa.gov/IOTD/view.php?id=80752" rel="nofollow">earthobservatory.nasa.gov/IOTD/view.php?id=80752</a> Credit: <b><a href="http://www.earthobservatory.nasa.gov/" rel="nofollow"> NASA Earth Observatory</a></b> <b><a href="http://www.nasa.gov/audience/formedia/features/MP_Photo_Guidelines.html" rel="nofollow">NASA image use policy.</a></b> <b><a href="http://www.nasa.gov/centers/goddard/home/index.html" rel="nofollow">NASA Goddard Space Flight Center</a></b> enables NASA’s mission through four scientific endeavors: Earth Science, Heliophysics, Solar System Exploration, and Astrophysics. Goddard plays a leading role in NASA’s accomplishments by contributing compelling scientific knowledge to advance the Agency’s mission. <b>Follow us on <a href="http://twitter.com/NASA_GoddardPix" rel="nofollow">Twitter</a></b> <b>Like us on <a href="http://www.facebook.com/pages/Greenbelt-MD/NASA-Goddard/395013845897?ref=tsd" rel="nofollow">Facebook</a></b> <b>Find us on <a href="http://instagram.com/nasagoddard?vm=grid" rel="nofollow">Instagram</a></b>

The Visible Infrared Imaging Radiometer Suite (VIIRS) on the Suomi NPP satellite captured this view of extensive sea-ice fracturing off the northern coast of Alaska. The event began in late-January and spread west toward Banks Island throughout February and March 2013. Visualizations of the Arctic often give the impression that the ice cap is a continuous sheet of stationary, floating ice. In fact, it is a collection of smaller pieces that constantly shift, crack, and grind against one another as they are jostled by winds and ocean currents. Especially during the summer—but even during the height of winter—cracks—or leads—open up between pieces of ice. That was what was happening on the left side of the animation (seen here: <a href="http://bit.ly/10kE7sh" rel="nofollow">bit.ly/10kE7sh</a>) in late January. A high-pressure weather system was parked over the region, producing warmer temperatures and winds that flowed in a southwesterly direction. That fueled the Beaufort Gyre, a wind-driven ocean current that flows clockwise. The gyre was the key force pulling pieces of ice west past Point Barrow, the northern nub of Alaska that protrudes into the Beaufort Sea. “A fracturing event in this area is not unusual because the Beaufort Gyre tends to push ice away from Banks Island and the Canadian Archipelago,” explained Walt Meier of the National Snow & Ice Data Center (NSIDC). “Point Barrow can act like a ‘pin point’ where the ice catches and fractures to the north and east.” In February, however, a series of storms passing over central Alaska exacerbated the fracturing. Strong westerly winds prompted several large pieces of ice to break away in an arc-shaped wave that moved progressively east. By the end of February, large pieces of ice had fractured all the way to the western coast of Banks Island, a distance of about 1,000 kilometers (600 miles). The data used to create the animation came from the longwave infrared (thermal) portion of the electromagnetic spectrum, so the animation illustrates how much heat the surface was emitting as VIIRS surveyed the area. Cooler areas (sea ice) appear white, while warmer areas (open water) are dark. The light gray plume near the cracks is warmer, moister air escaping from the ocean and blowing downwind. Clouds do not show up well in the VIIRS thermal band, so the storms that fueled the fracturing are not readily visible. While fracturing events are common, few events sprawl across such a large area or produce cracks as long and wide as those seen here. The age of the sea ice in this area was one of the key reasons this event became so widespread. “The region is covered almost completely by seasonal or first-year ice—ice that has formed since last September,” said Meier. “This ice is thinner and weaker than the older, multi-year ice, so it responds more readily to winds and is more easily broken up.” NASA Earth Observatory images by Jesse Allen using VIIRS day-night band data from the Suomi National Polar-orbiting Partnership. Suomi NPP is the result of a partnership between NASA, the National Oceanic and Atmospheric Administration, and the Department of Defense. Caption by Adam Voiland. Instrument: Suomi NPP - VIIRS For more info go to: <a href="http://earthobservatory.nasa.gov/IOTD/view.php?id=80752" rel="nofollow">earthobservatory.nasa.gov/IOTD/view.php?id=80752</a> Credit: <b><a href="http://www.earthobservatory.nasa.gov/" rel="nofollow"> NASA Earth Observatory</a></b> <b><a href="http://www.nasa.gov/audience/formedia/features/MP_Photo_Guidelines.html" rel="nofollow">NASA image use policy.</a></b> <b><a href="http://www.nasa.gov/centers/goddard/home/index.html" rel="nofollow">NASA Goddard Space Flight Center</a></b> enables NASA’s mission through four scientific endeavors: Earth Science, Heliophysics, Solar System Exploration, and Astrophysics. Goddard plays a leading role in NASA’s accomplishments by contributing compelling scientific knowledge to advance the Agency’s mission. <b>Follow us on <a href="http://twitter.com/NASA_GoddardPix" rel="nofollow">Twitter</a></b> <b>Like us on <a href="http://www.facebook.com/pages/Greenbelt-MD/NASA-Goddard/395013845897?ref=tsd" rel="nofollow">Facebook</a></b> <b>Find us on <a href="http://instagram.com/nasagoddard?vm=grid" rel="nofollow">Instagram</a></b>

The Visible Infrared Imaging Radiometer Suite (VIIRS) on the Suomi NPP satellite captured this view of extensive sea-ice fracturing off the northern coast of Alaska. The event began in late-January and spread west toward Banks Island throughout February and March 2013. Visualizations of the Arctic often give the impression that the ice cap is a continuous sheet of stationary, floating ice. In fact, it is a collection of smaller pieces that constantly shift, crack, and grind against one another as they are jostled by winds and ocean currents. Especially during the summer—but even during the height of winter—cracks—or leads—open up between pieces of ice. That was what was happening on the left side of the animation (seen here: <a href="http://bit.ly/10kE7sh" rel="nofollow">bit.ly/10kE7sh</a>) in late January. A high-pressure weather system was parked over the region, producing warmer temperatures and winds that flowed in a southwesterly direction. That fueled the Beaufort Gyre, a wind-driven ocean current that flows clockwise. The gyre was the key force pulling pieces of ice west past Point Barrow, the northern nub of Alaska that protrudes into the Beaufort Sea. “A fracturing event in this area is not unusual because the Beaufort Gyre tends to push ice away from Banks Island and the Canadian Archipelago,” explained Walt Meier of the National Snow & Ice Data Center (NSIDC). “Point Barrow can act like a ‘pin point’ where the ice catches and fractures to the north and east.” In February, however, a series of storms passing over central Alaska exacerbated the fracturing. Strong westerly winds prompted several large pieces of ice to break away in an arc-shaped wave that moved progressively east. By the end of February, large pieces of ice had fractured all the way to the western coast of Banks Island, a distance of about 1,000 kilometers (600 miles). The data used to create the animation came from the longwave infrared (thermal) portion of the electromagnetic spectrum, so the animation illustrates how much heat the surface was emitting as VIIRS surveyed the area. Cooler areas (sea ice) appear white, while warmer areas (open water) are dark. The light gray plume near the cracks is warmer, moister air escaping from the ocean and blowing downwind. Clouds do not show up well in the VIIRS thermal band, so the storms that fueled the fracturing are not readily visible. While fracturing events are common, few events sprawl across such a large area or produce cracks as long and wide as those seen here. The age of the sea ice in this area was one of the key reasons this event became so widespread. “The region is covered almost completely by seasonal or first-year ice—ice that has formed since last September,” said Meier. “This ice is thinner and weaker than the older, multi-year ice, so it responds more readily to winds and is more easily broken up.” NASA Earth Observatory images by Jesse Allen using VIIRS day-night band data from the Suomi National Polar-orbiting Partnership. Suomi NPP is the result of a partnership between NASA, the National Oceanic and Atmospheric Administration, and the Department of Defense. Caption by Adam Voiland. Instrument: Suomi NPP - VIIRS For more info go to: <a href="http://earthobservatory.nasa.gov/IOTD/view.php?id=80752" rel="nofollow">earthobservatory.nasa.gov/IOTD/view.php?id=80752</a> Credit: <b><a href="http://www.earthobservatory.nasa.gov/" rel="nofollow"> NASA Earth Observatory</a></b> <b><a href="http://www.nasa.gov/audience/formedia/features/MP_Photo_Guidelines.html" rel="nofollow">NASA image use policy.</a></b> <b><a href="http://www.nasa.gov/centers/goddard/home/index.html" rel="nofollow">NASA Goddard Space Flight Center</a></b> enables NASA’s mission through four scientific endeavors: Earth Science, Heliophysics, Solar System Exploration, and Astrophysics. Goddard plays a leading role in NASA’s accomplishments by contributing compelling scientific knowledge to advance the Agency’s mission. <b>Follow us on <a href="http://twitter.com/NASA_GoddardPix" rel="nofollow">Twitter</a></b> <b>Like us on <a href="http://www.facebook.com/pages/Greenbelt-MD/NASA-Goddard/395013845897?ref=tsd" rel="nofollow">Facebook</a></b> <b>Find us on <a href="http://instagram.com/nasagoddard?vm=grid" rel="nofollow">Instagram</a></b>

Though North America is a full month into astronomical spring, the Great Lakes have been slow to give up on winter. As of April 22, 2014, the Great Lakes were 33.9 percent ice covered. The lake they call Superior dominated the pack. In the early afternoon on April 20, 2014, the Moderate Resolution Imaging Spectroradiometer (MODIS) on NASA’s Aqua satellite captured this natural-color image of Lake Superior, which straddles the United States–Canada border. At the time Aqua passed over, the lake was 63.5 percent ice covered, according to the NOAA Great Lakes Environmental Research Lab (GLERL). Averaged across Lake Superior, ice was 22.6 centimeters (8.9 inches) thick; it was as much as twice that thickness in some locations. GLERL researcher George Leshkevich affirmed that ice cover this spring is significantly above normal. For comparison, Lake Superior had 3.6 percent ice cover on April 20, 2013; in 2012, ice was completely gone by April 12. In the last winter that ice cover grew so thick on Lake Superior (2009), it reached 93.7 percent on March 2 but was down to 6.7 percent by April 21. Average water temperatures on all of the Great Lakes have been rising over the past 30 to 40 years and ice cover has generally been shrinking. (Lake Superior ice was down about 79 percent since the 1970s.) But chilled by persistent polar air masses throughout the 2013-14 winter, ice cover reached 88.4 percent on February 13 and 92.2 percent on March 6, 2014, the second highest level in four decades of record-keeping. Air temperatures in the Great Lakes region were well below normal for March, and the cool pattern is being reinforced along the coasts because the water is absorbing less sunlight and warming less than in typical spring conditions. The graph below, based on data from Environment Canada, shows the 2014 conditions for all of the Great Lakes in mid-April compared to the past 33 years. Lake Superior ice cover got as high as 95.3 percent on March 19. By April 22, it was reported at 59.9 percent; Lake Huron was nearly 30.4 percent. News outlets noted that as many as 70 ships have been backed up in Lakes Michigan, Huron, and Erie, waiting for passage into ports on Lake Superior. The U.S. Coast Guard has been grouping ships together into small convoys after they pass through locks at Sault Ste. Marie, in order to maximize ice-breaking efficiency and to protect ships from damage. Superior is the world’s largest freshwater lake by area (82,100 square kilometers or 31,700 square miles) and the third largest by volume. The waters average 147 meters (483 feet) in depth, and the basin is believed to hold about 10 percent of the world’s liquid fresh water. NASA image courtesy Jeff Schmaltz LANCE/EOSDIS MODIS Rapid Response Team, GSFC. Caption by Mike Carlowicz. Read more: <a href="http://earthobservatory.nasa.gov/IOTD/view.php?id=83541&eocn=home&eoci=iotd_title" rel="nofollow">earthobservatory.nasa.gov/IOTD/view.php?id=83541&eocn...</a> Credit: <b><a href="http://www.earthobservatory.nasa.gov/" rel="nofollow"> NASA Earth Observatory</a></b> <b><a href="http://www.nasa.gov/audience/formedia/features/MP_Photo_Guidelines.html" rel="nofollow">NASA image use policy.</a></b> <b><a href="http://www.nasa.gov/centers/goddard/home/index.html" rel="nofollow">NASA Goddard Space Flight Center</a></b> enables NASA’s mission through four scientific endeavors: Earth Science, Heliophysics, Solar System Exploration, and Astrophysics. Goddard plays a leading role in NASA’s accomplishments by contributing compelling scientific knowledge to advance the Agency’s mission. <b>Follow us on <a href="http://twitter.com/NASAGoddardPix" rel="nofollow">Twitter</a></b> <b>Like us on <a href="http://www.facebook.com/pages/Greenbelt-MD/NASA-Goddard/395013845897?ref=tsd" rel="nofollow">Facebook</a></b> <b>Find us on <a href="http://instagram.com/nasagoddard?vm=grid" rel="nofollow">Instagram</a></b>

As one NASA spacecraft sailed past the distant ice world of Pluto, collecting never-before-seen vistas and invaluable science data, another spacecraft turned its gaze in that direction from its outpost at Saturn. NASA's Cassini spacecraft took a momentary break from its duties to capture this far-off portrait around the time of the New Horizons encounter with Pluto. The image was taken within a few minutes of New Horizons' closest approach to Pluto. After New Horizons, Cassini was the closest spacecraft to Pluto at the time of the flyby. Pluto is the bright dot closest to the center of the field of stars seen in this view. A labeled version of the image, indicating Pluto's position, is also presented here. The four stars identified in the labeled view have visual magnitudes between about 11 and 12. The entire Pluto system -- the dwarf planet and all of its moons -- is below the resolution of this image, thus the small bright specks near the main dot representing Pluto are likely noise (possibly due to what astronomers call the point-spread function). Charon and the other moons would not be resolved at this scale. The image was obtained using the Cassini spacecraft narrow-angle camera on July 14, 2015 at a distance of about 2.4 billion miles (3.9 billion kilometers) from Pluto. http://photojournal.jpl.nasa.gov/catalog/PIA19641
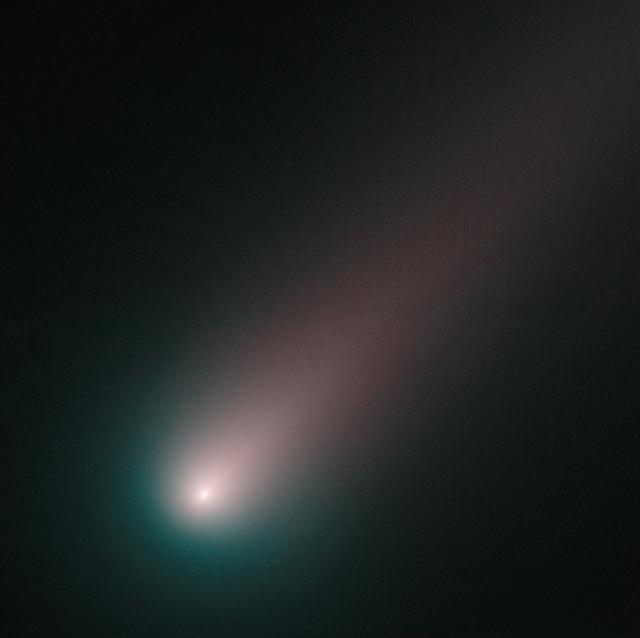
As of mid-November, ISON is officially upon us. Using Hubble, we've taken our closest look yet at the innermost region of the comet, where geysers of sublimating ice are fueling a spectacular tail. Made from observations on November 2nd, the image combines pictures of ISON taken through blue and red filters. As we expect, the round coma around ISON's nucleus is blue and the tail has a redder hue. Ice and gas in the coma reflect blue light from the Sun, while dust grains in the tail reflect more red light than blue light. This is the most color separation we've seen so far in ISON -- that's because the comet, nearer than ever to the Sun, is brighter and more structured than ever before. We've certainly come a long way since Hubble started observing Comet ISON, way back in April. Of course, our eight-month retrospective pales in comparison with ISON's own journey, which started some 10,000 years ago in the Oort cloud. ISON will come closest to the Sun on November 28, a point in its orbit known as perihelion. What's remarkable here is that the entire ISON, this awesome, shimmery space tadpole, is being produced from a dusty ball of ice estimated to be a few kilometers in diameter. Compared to ISON's full extent, Hubble's latest image is tiny. It only shows the very base of the tail. Yet even in this closest closeup we've ever had, a single pixel spans 24 km across the comet. Now that Comet ISON is close, amateur astromers rule the day. But Hubble observations, including this latest image, are still providing key insights into the science and spectacle of a comet we hope will continue to impress. Credit: NASA, ESA, and the Hubble Heritage Team (STScI/AURA) -------- More details on Comet ISON: Comet ISON began its trip from the Oort cloud region of our solar system and is now travelling toward the sun. The comet will reach its closest approach to the sun on Thanksgiving Day -- 28 Nov 2013 -- skimming just 730,000 miles above the sun's surface. If it comes around the sun without breaking up, the comet will be visible in the Northern Hemisphere with the naked eye, and from what we see now, ISON is predicted to be a particularly bright and beautiful comet. Catalogued as C/2012 S1, Comet ISON was first spotted 585 million miles away in September 2012. This is ISON's very first trip around the sun, which means it is still made of pristine matter from the earliest days of the solar system’s formation, its top layers never having been lost by a trip near the sun. Comet ISON is, like all comets, a dirty snowball made up of dust and frozen gases like water, ammonia, methane and carbon dioxide -- some of the fundamental building blocks that scientists believe led to the formation of the planets 4.5 billion years ago. NASA has been using a vast fleet of spacecraft, instruments, and space- and Earth-based telescope, in order to learn more about this time capsule from when the solar system first formed. The journey along the way for such a sun-grazing comet can be dangerous. A giant ejection of solar material from the sun could rip its tail off. Before it reaches Mars -- at some 230 million miles away from the sun -- the radiation of the sun begins to boil its water, the first step toward breaking apart. And, if it survives all this, the intense radiation and pressure as it flies near the surface of the sun could destroy it altogether. This collection of images show ISON throughout that journey, as scientists watched to see whether the comet would break up or remain intact. The comet reaches its closest approach to the sun on Thanksgiving Day -- Nov. 28, 2013 -- skimming just 730,000 miles above the sun’s surface. If it comes around the sun without breaking up, the comet will be visible in the Northern Hemisphere with the naked eye, and from what we see now, ISON is predicted to be a particularly bright and beautiful comet. ISON stands for International Scientific Optical Network, a group of observatories in ten countries who have organized to detect, monitor, and track objects in space. ISON is
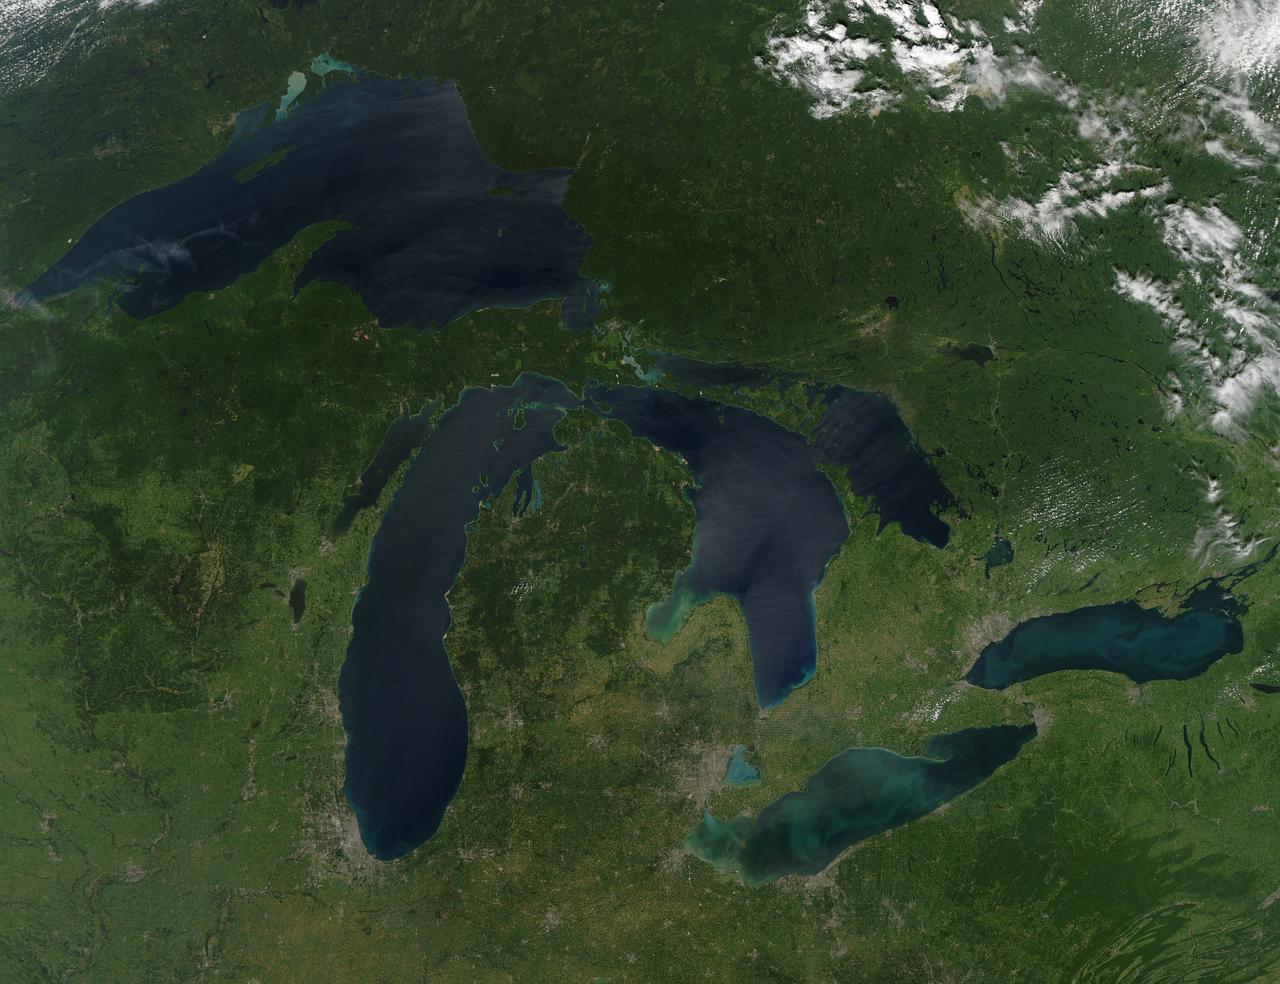
NASA image acquired August 28, 2010 Late August 2010 provided a rare satellite view of a cloudless summer day over the entire Great Lakes region. North Americans trying to sneak in a Labor Day weekend getaway on the lakes were hoping for more of the same. The Great Lakes comprise the largest collective body of fresh water on the planet, containing roughly 18 percent of Earth's supply. Only the polar ice caps contain more fresh water. The region around the Great Lakes basin is home to more than 10 percent of the population of the United States and 25 percent of the population of Canada. Many of those people have tried to escape record heat this summer by visiting the lakes. What they found, according to The Hamilton Spectator, was record-breaking water temperatures fueled by record-breaking air temperatures in the spring and summer. By mid-August, the waters of Lake Superior were 6 to 8°C (11 to 14°F) above normal. Lake Michigan set records at about 4°C (7°F) above normal. The other three Great Lakes – Huron, Erie, and Ontario -- were above normal temperatures, though no records were set. The image was gathered by the Moderate Resolution Imaging Spectroradiometer (MODIS) on NASA’s Aqua satellite at 1:30 p.m. Central Daylight Time (18:30 UTC) on August 28. Open water appears blue or nearly black. The pale blue and green swirls near the coasts are likely caused by algae or phytoplankton blooms, or by calcium carbonate (chalk) from the lake floor. The sweltering summer temperatures have produced an unprecedented bloom of toxic blue-green algae in western Lake Erie, according to the Cleveland Plain Dealer. NASA image by Jeff Schmaltz, MODIS Rapid Response Team, Goddard Space Flight Center. Caption by Mike Carlowicz. Instrument: Aqua - MODIS Click here to see more images from <b><a href="#//earthobservatory.nasa.gov/" rel="nofollow"> NASA Goddard’s Earth Observatory</a></b> <b><a href="http://www.nasa.gov/centers/goddard/home/index.html" rel="nofollow">NASA Goddard Space Flight Center</a></b> is home to the nation's largest organization of combined scientists, engineers and technologists that build spacecraft, instruments and new technology to study the Earth, the sun, our solar system, and the universe. <b>Follow us on <a href="http://twitter.com/NASA_GoddardPix" rel="nofollow">Twitter</a></b> <b>Join us on <a href="http://www.facebook.com/pages/Greenbelt-MD/NASA-Goddard/395013845897?ref=tsd" rel="nofollow">Facebook</a></b>
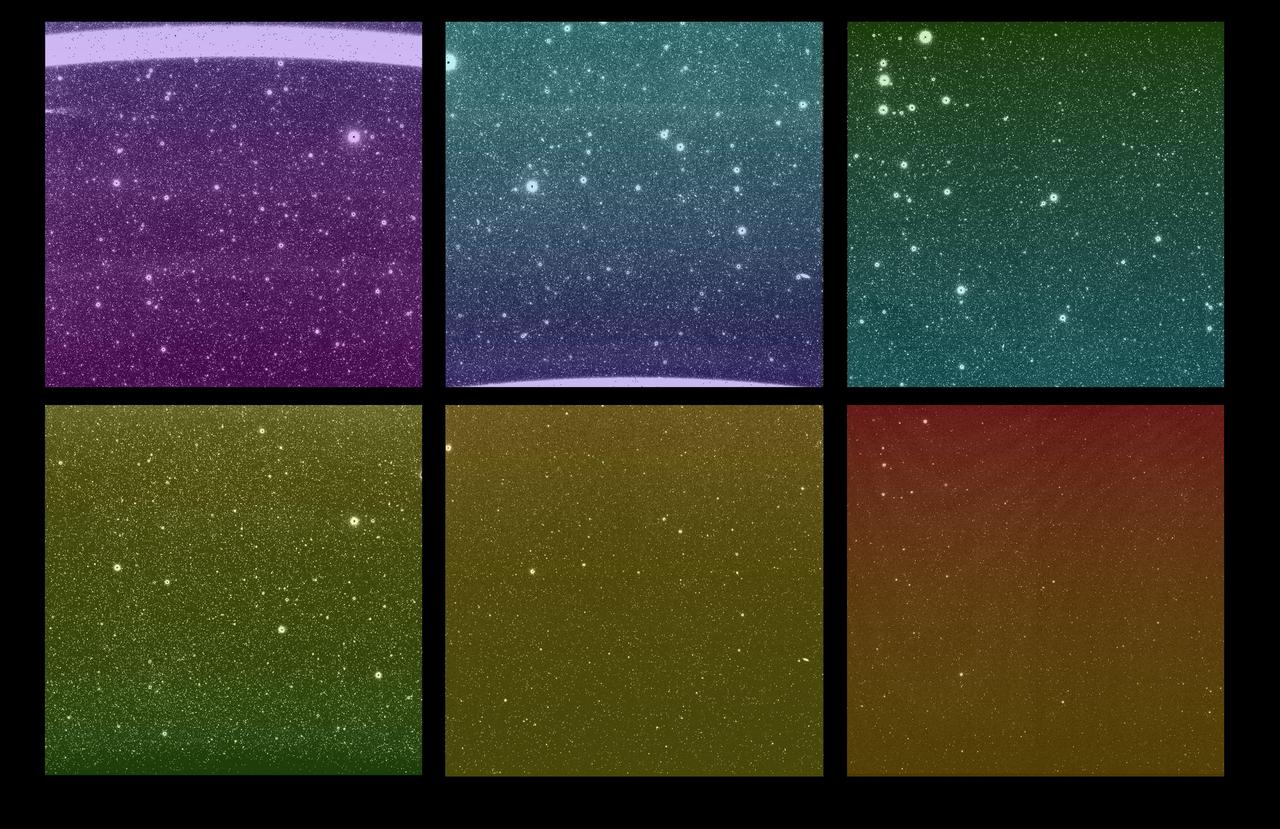
Some of the first images from NASA's SPHEREx (Spectro-Photometer for the History of the Universe, Epoch of Reionization and Ices Explorer) mission were captured March 27, 2025. Although the new images are uncalibrated and not yet ready to use for science, they give a tantalizing look at SPHEREx's wide view of the sky. Each bright spot is a source of light, like a star or galaxy, and each image is expected to contain more than 100,000 detected sources. There are six images in every SPHEREx exposure – one for each detector. The top three images show the same area of sky as the bottom three images; this is the observatory's full field of view, a rectangular area about 20 times wider than the full Moon. When the SPHEREx observatory begins routine science operations in April, it will take approximately 600 exposures every day. SPHEREx detects infrared light, which is invisible to the human eye. To make the images shown here, science team members assigned a visible color to each infrared wavelength captured by the observatory. With each detector capturing 17 unique infrared wavelength bands, there are 102 hues in this image. To detect so many infrared colors, SPHEREx uses color filters set on top of the detectors. (If the detectors are like SPHEREx's eyes, the filters are like color-tinted glasses). A standard color filter blocks all wavelengths but one, but the SPHEREx filters are more like rainbow-tinted glasses, in that the wavelengths they block change gradually from the top of the filter to the bottom. The legend at the top shows that the detectors are placed to observe infrared wavelengths from shortest to longest. Certain chemical elements are visible at specific wavelengths, as is the case with helium from Earth's atmosphere, which creates a bright line in the wavelength at the top of the top-left image. Breaking down color this way can reveal the composition of an object or the distance to a galaxy. With that data, scientists can study topics ranging from the physics that governed the universe less than a second after its birth to the origins of water in our galaxy. https://photojournal.jpl.nasa.gov/catalog/PIA26280
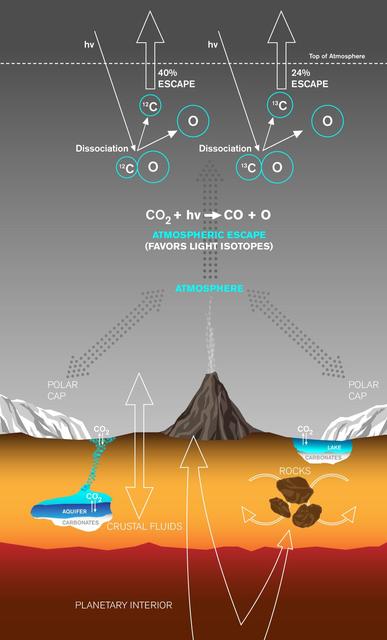
This graphic depicts paths by which carbon has been exchanged between Martian interior, surface rocks, polar caps, waters and atmosphere, and also depicts a mechanism by which carbon is lost from the atmosphere with a strong effect on isotope ratio. Carbon dioxide (CO2) to generate the Martian atmosphere originated in the planet's mantle and has been released directly through volcanoes or trapped in rocks crystallized from magmas and released later. Once in the atmosphere, the CO2 can exchange with the polar caps, passing from gas to ice and back to gas again. The CO2 can also dissolve into waters, which can then precipitate out solid carbonates, either in lakes at the surface or in shallow aquifers. Carbon dioxide gas in the atmosphere is continually lost to space at a rate controlled in part by the sun's activity. One loss mechanism is called ultraviolet photodissociation. It occurs when ultraviolet radiation (indicated on the graphic as "hv") encounters a CO2 molecule, breaking the bonds to first form carbon monoxide (CO) molecules and then carbon (C) atoms. The ratio of carbon isotopes remaining in the atmosphere is affected as these carbon atoms are lost to space, because the lighter carbon-12 (12C) isotope is more easily removed than the heavier carbon-13 (13C) isotope. This fractionation, the preferential loss of carbon-12 to space, leaves a fingerprint: enrichment of the heavy carbon-13 isotope, measured in the atmosphere of Mars today. http://photojournal.jpl.nasa.gov/catalog/PIA20163
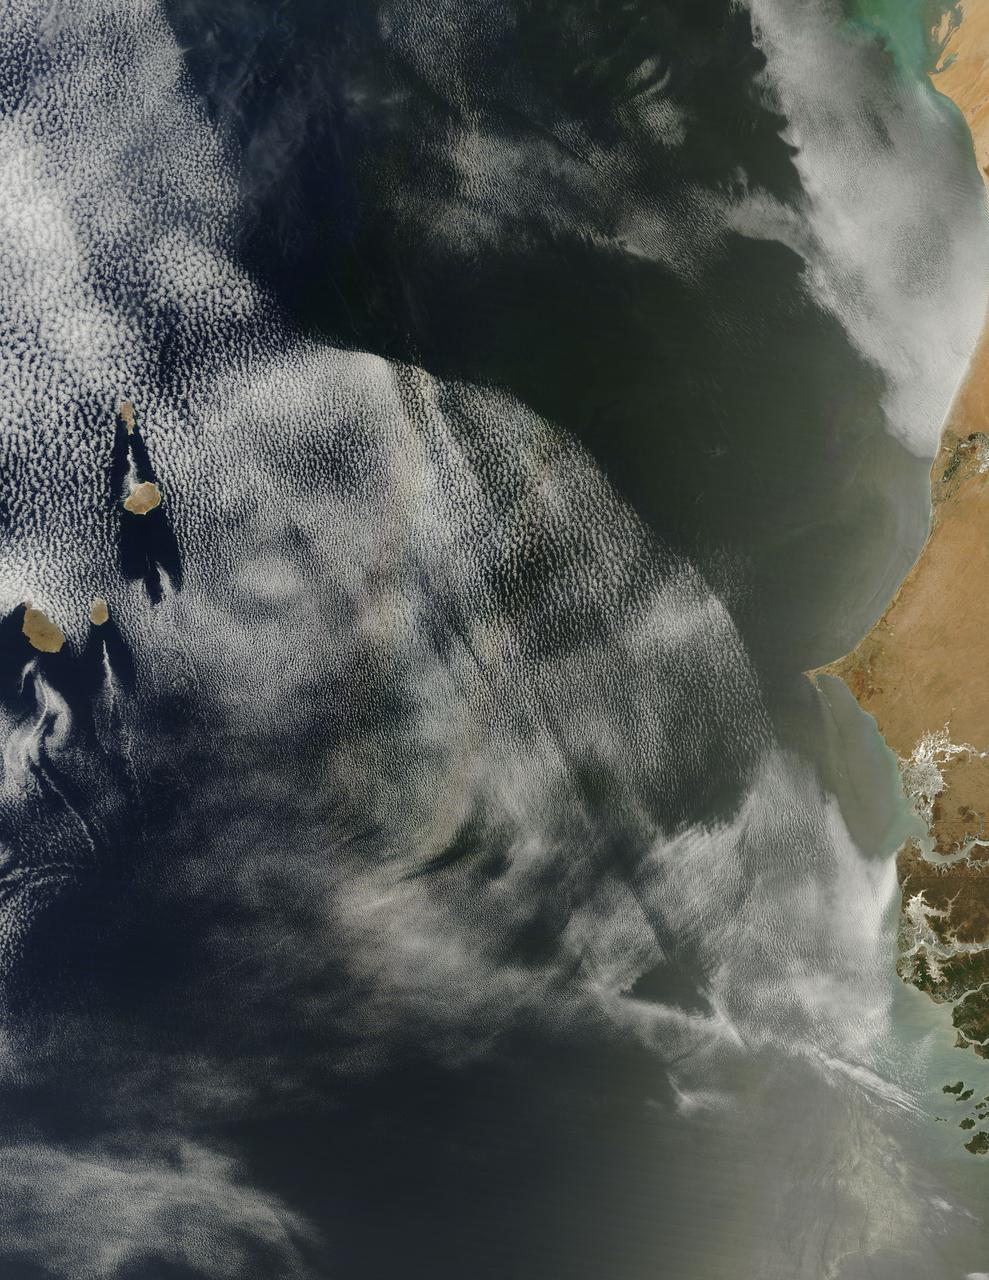
On April 23, 2013 NASA’s Terra satellite passed off the coast of West Africa, allowing the Moderate Resolution Imaging Spectroradiometer (MODIS) flying aboard to capture a curious phenomenon over the cloud deck below. The rainbow-like discoloration that can be seen streaking across the bank of marine cumulus clouds near the center of this image is known as a “glory”. A glory is caused by the scattering of sunlight by a cloud made of water droplets that are all roughly the same size, and is only produced when the light is just right. In order for a glory to be viewed, the observer’s anti-solar point must fall on the cloud deck below. In this case the observer is the Terra satellite, and the anti-solar point is where the sun is directly behind you – 180° from the MODIS line of sight. Water and ice particles in the cloud bend the light, breaking it into all its wavelengths, and the result is colorful flare, which may contain all of the colors of the rainbow. Credit: NASA/GSFC/Jeff Schmaltz/MODIS Land Rapid Response Team <b><a href="http://www.nasa.gov/audience/formedia/features/MP_Photo_Guidelines.html" rel="nofollow">NASA image use policy.</a></b> <b><a href="http://www.nasa.gov/centers/goddard/home/index.html" rel="nofollow">NASA Goddard Space Flight Center</a></b> enables NASA’s mission through four scientific endeavors: Earth Science, Heliophysics, Solar System Exploration, and Astrophysics. Goddard plays a leading role in NASA’s accomplishments by contributing compelling scientific knowledge to advance the Agency’s mission. <b>Follow us on <a href="http://twitter.com/NASA_GoddardPix" rel="nofollow">Twitter</a></b> <b>Like us on <a href="http://www.facebook.com/pages/Greenbelt-MD/NASA-Goddard/395013845897?ref=tsd" rel="nofollow">Facebook</a></b> <b>Find us on <a href="http://instagram.com/nasagoddard?vm=grid" rel="nofollow">Instagram</a></b>
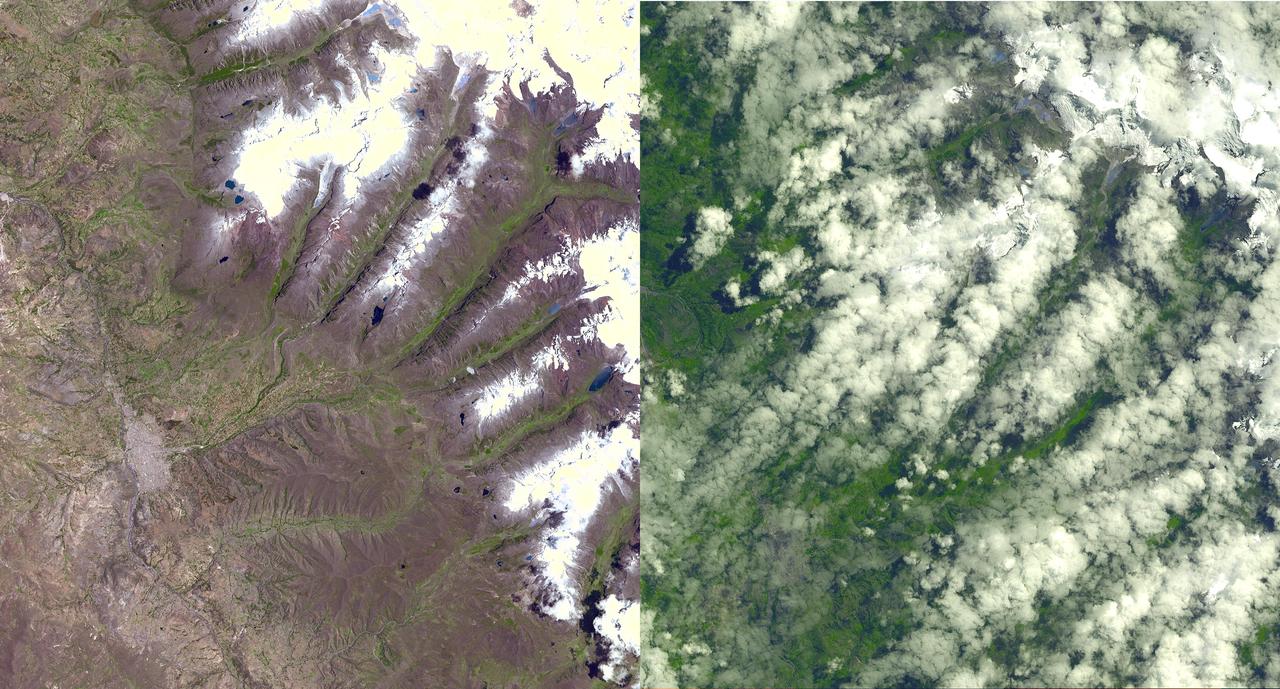
An Earth-monitoring instrument aboard NASA's Terra satellite is keeping a close eye on a potential glacial disaster in the making in Peru's spectacular, snow-capped Cordillera Blanca (White Mountains), the highest range of the Peruvian Andes. Data from NASA's Advanced Spaceborne Thermal Emission and Reflection Radiometer (Aster) is assisting Peruvian government officials and geologists in monitoring a glacier that feeds Lake Palcacocha, located high above the city of Huaraz, 270 kilometers (168 miles) north of Lima. An ominous crack has developed in the glacier. Should the large glacier chunk break off and fall into the lake, the ensuing flood could hurtle down the Cojup Valley into the Rio Santa Valley below, reaching Huaraz, population 60,000, in less than 15 minutes. "Glacial natural hazards like the one in Huaraz are an increasing threat to people in many parts of the world," said Dr. Michael Abrams, associate Aster team leader at NASA's Jet Propulsion Laboratory, Pasadena, Calif. "Remote sensing instruments like Aster can serve a vital role in mountain hazard management and disaster mapping by providing rapid access to data, even in regions not easily accessible by humans. Aster's unique vantage point from space gives scientists another tool with which to see early signs of potential glacial flood-burst events and to monitor changes in glacial behavior over time. In Huaraz, Peruvian authorities and scientists will incorporate Aster data along with data from ground-based monitoring techniques to better assess current conditions and take steps necessary to reduce risks to human lives and property." Comparison images of the area are available at: http://asterweb.jpl.nasa.gov . Huaraz can be seen in the images' left-center, with Lake Palcacocha in the images' upper right corners at the head of a valley, below the snow and glacier cap. The left image was acquired on November 5, 2001; the right on April 8, 2003. Glacial flood-bursts, known by Peruvians as "aluviones," occur periodically when water is released abruptly from a previously ice-dammed lake alongside, within, or above a glacier. The release can be caused by various triggering events. These flood-bursts typically arrive with little or no warning, carrying liquid mud, large rock boulders and blocks of ice. The Rio Santa Valley is no stranger to such disasters. Since 1702, floods caused by glaciological conditions have repeatedly caused death and destruction in the region. One particularly devastating event in 1941 destroyed approximately one-third of Huaraz, killing an estimated 5,000 to 7,000 people. Since then, the Peruvian government has emphasized control of the water level in Lake Palcacocha and other lakes in the region that pose similar threats. The efforts appear to have worked; since 1972, no destructive floods resulting from the breakout of glacial lakes have occurred. Nevertheless, officials are still monitoring the current situation closely. http://photojournal.jpl.nasa.gov/catalog/PIA03899
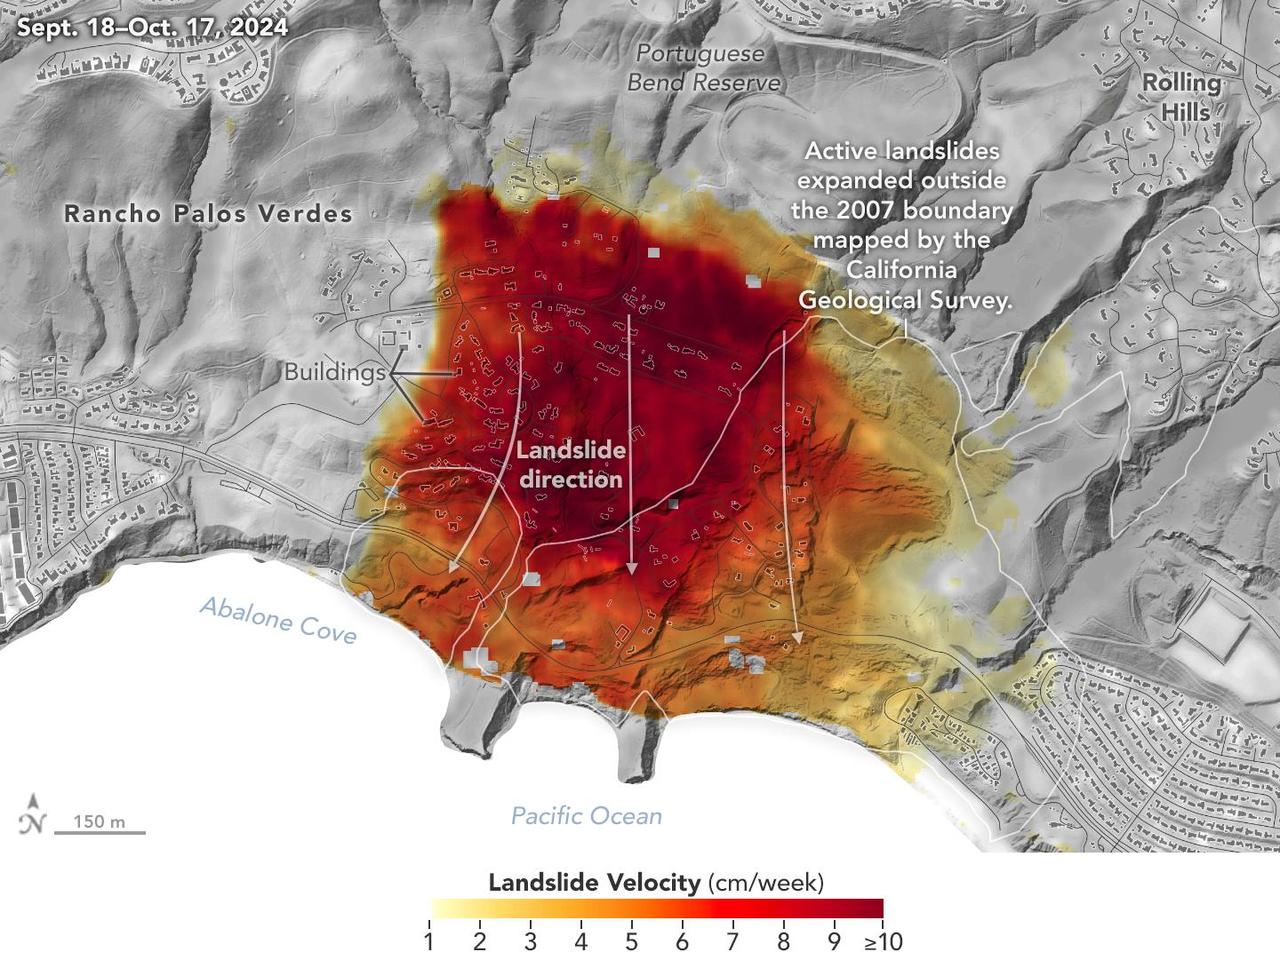
Researchers at NASA's Jet Propulsion Laboratory in Southern California used data from an airborne radar to measure the movement of the slow-moving landslides on the Palos Verdes Peninsula in Los Angeles County. The analysis determined that, during a period of four weeks in the fall of 2024, land in the residential area slid toward the ocean by as much as 4 inches (10 centimeters) per week. Portions of the peninsula, which juts into the Pacific Ocean just south of the city of Los Angeles, is part of an ancient complex of landslides and has been moving for at least the past six decades, affecting hundreds of buildings in local communities. The motion accelerated and the active area expanded following record-breaking rainfall in Southern California in 2023 and another heavy-precipitation winter in 2024. To create this visualization, the Advanced Rapid Imaging and Analysis (ARIA) team used data from four flights of NASA's Uninhabited Aerial Vehicle Synthetic Aperture Radar (UAVSAR) that took place between Sept. 18 and Oct. 17. The UAVSAR instrument was mounted to a Gulfstream III jet flown out of NASA's Armstrong Flight Research Center in Edwards, California, and the four flights were planned to estimate the speed and direction of the landslides in three dimensions. In the image, colors indicate how fast parts of the landslide complex were moving in late September and October, with the darkest reds indicating the highest speeds. The arrows represent the direction of horizontal motion. The white solid lines are the boundaries of active landslide areas as defined in 2007 by the California Geological Survey. The insights from the UAVSAR flights were part of a package of analyses by the ARIA team that also used data from ESA's (the European Space Agency's) Copernicus Sentinel-1A/B satellites. The analyses were provided to California officials to support the state's response to the landslides and made available to the public at NASA's Disaster Mapping Portal. The ARIA mission is a collaboration between JPL and Caltech, which manages JPL for NASA, to leverage radar and optical remote-sensing, GPS, and seismic observations for science as well as to aid in disaster response. The project investigates the processes and impacts of earthquakes, volcanoes, landslides, fires, subsurface fluid movement, and other natural hazards. UAVSAR has flown thousands of radar missions around the world since 2007 studying phenomena such as glaciers and ice sheets, vegetation in ecosystems, and natural hazards like earthquakes, volcanoes, and landslides. https://photojournal.jpl.nasa.gov/catalog/PIA26495
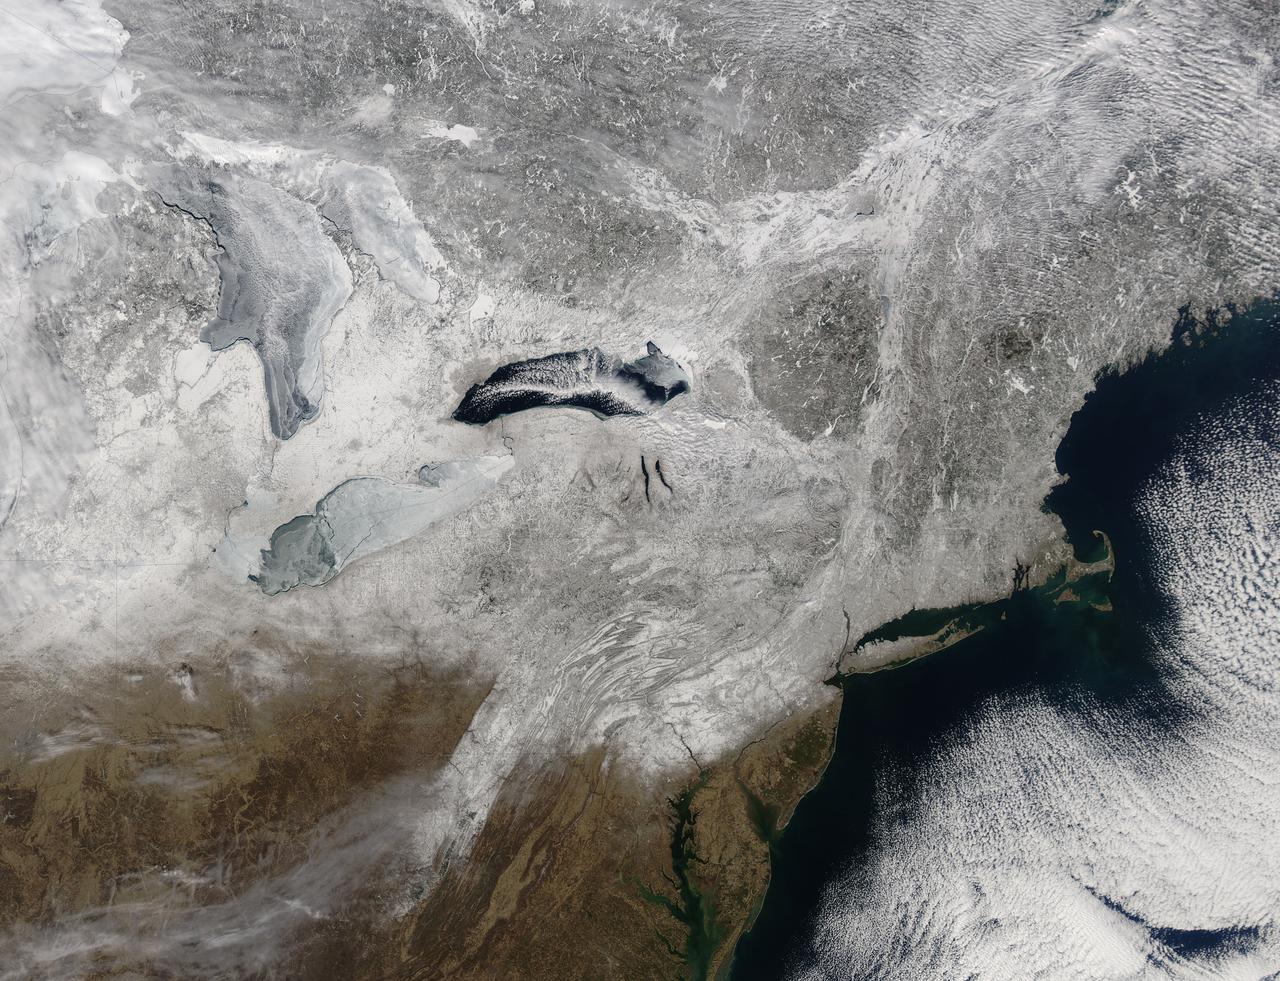
Snow covered the northeastern United States on last day of meteorological winter, 2014. Climatologists and meteorologists break seasons down into three-month groups, based on annual temperature and our calendar. This method is helpful for weather observing and forecasting, and for planning consistent agricultural dates, such as expected first frosts or best planting date. Meteorological winter – the season where temperatures are, on average, coldest and when snow is most likely to fall – runs from December 1 to February 28 in the United States and Canada. Winter can also be defined by the astronomical calendar, which is based on the rotation of the Earth around the sun. In this method, the seasons are defined by two solstices (times when the sun’s path is furthest from the Earth’s equator) and two equinoxes (the times when the sun passes directly above the equator). In the Northern Hemisphere, winter begins on the winter solstice, which falls on or around December 22 and ends on or around March 21, at the vernal (spring) equinox. On February 28, 2014, the Moderate Resolution Imaging Spectroradiometer aboard NASA’s Aqua satellite captured this true-color image of a sunny winter day in the northeastern United States. Snow stretches from Maine west to Indiana and south along the ridges of the Appalachian Mountains well into West Virginia. In Canada, the landscape appears greener, primarily because snow lies on conifers (evergreen) trees in the boreal forest regions. The Great Lakes, with the exception of Lake Ontario, are almost completely covered with ice. Credit: NASA/GSFC/Jeff Schmaltz/MODIS Land Rapid Response Team <b><a href="http://www.nasa.gov/audience/formedia/features/MP_Photo_Guidelines.html" rel="nofollow">NASA image use policy.</a></b> <b><a href="http://www.nasa.gov/centers/goddard/home/index.html" rel="nofollow">NASA Goddard Space Flight Center</a></b> enables NASA’s mission through four scientific endeavors: Earth Science, Heliophysics, Solar System Exploration, and Astrophysics. Goddard plays a leading role in NASA’s accomplishments by contributing compelling scientific knowledge to advance the Agency’s mission. <b>Follow us on <a href="http://twitter.com/NASAGoddardPix" rel="nofollow">Twitter</a></b> <b>Like us on <a href="http://www.facebook.com/pages/Greenbelt-MD/NASA-Goddard/395013845897?ref=tsd" rel="nofollow">Facebook</a></b> <b>Find us on <a href="http://instagram.com/nasagoddard?vm=grid" rel="nofollow">Instagram</a></b>