
Broken Ice
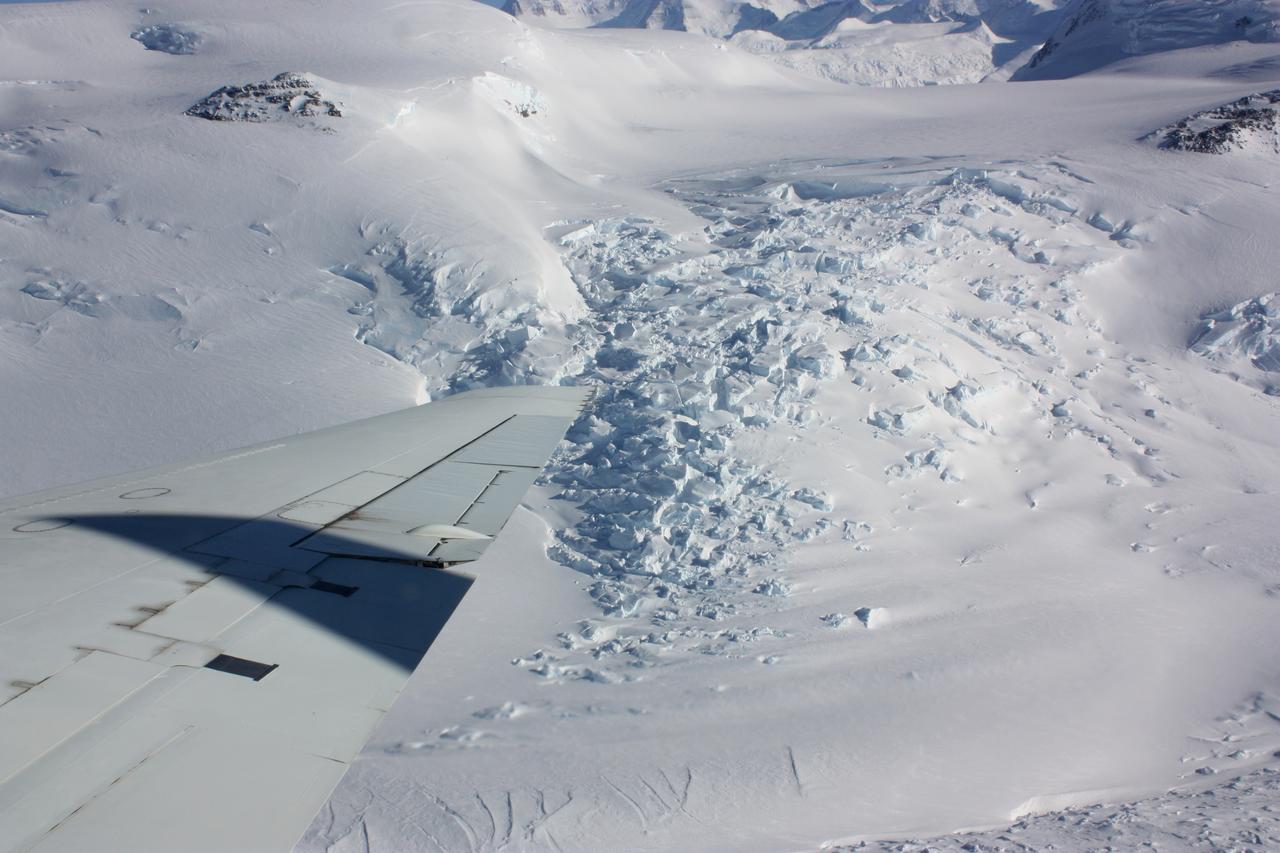
An area of broken glacier ice seen from the IceBridge DC-8 on Oct. 22, 2012. Credit: NASA / George Hale NASA's Operation IceBridge is an airborne science mission to study Earth's polar ice. For more information about IceBridge, visit: <a href="http://www.nasa.gov/icebridge" rel="nofollow">www.nasa.gov/icebridge</a> <b><a href="http://www.nasa.gov/audience/formedia/features/MP_Photo_Guidelines.html" rel="nofollow">NASA image use policy.</a></b> <b><a href="http://www.nasa.gov/centers/goddard/home/index.html" rel="nofollow">NASA Goddard Space Flight Center</a></b> enables NASA’s mission through four scientific endeavors: Earth Science, Heliophysics, Solar System Exploration, and Astrophysics. Goddard plays a leading role in NASA’s accomplishments by contributing compelling scientific knowledge to advance the Agency’s mission. <b>Follow us on <a href="http://twitter.com/NASA_GoddardPix" rel="nofollow">Twitter</a></b> <b>Like us on <a href="http://www.facebook.com/pages/Greenbelt-MD/NASA-Goddard/395013845897?ref=tsd" rel="nofollow">Facebook</a></b> <b>Find us on <a href="http://instagrid.me/nasagoddard/?vm=grid" rel="nofollow">Instagram</a></b>
Jupiter moon Europa, as seen in this image taken June 27, 1996 by NASA Galileo spacecraft, displays features in some areas resembling ice floes seen in Earth polar seas. http://photojournal.jpl.nasa.gov/catalog/PIA00291
Beaufort Sea surface temperatures where Canada Mackenzie River discharges into the Arctic Ocean, measured by NASA MODIS instrument; warm river waters had broken through a shoreline sea ice barrier to enhance sea ice melt.
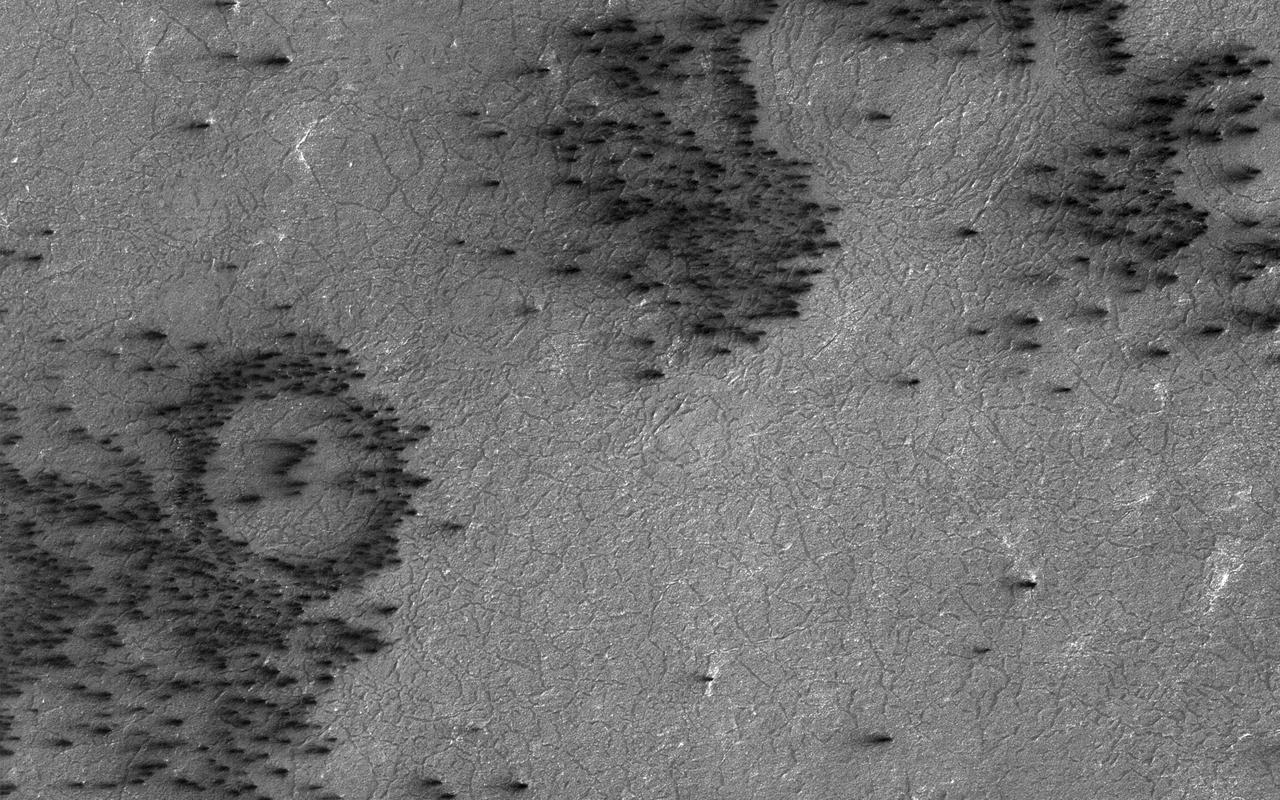
Gas under pressure will choose an easy escape route. In this image, the terrain is covered with a seasonal layer of dry ice. The weak spots, for gas sublimating from the bottom of the seasonal ice layer to escape, appear to be around craters, where the surface was broken and pulverized by an impact. Fans of surface material deposited on top of the seasonal ice layer show where the escape vents are. http://photojournal.jpl.nasa.gov/catalog/PIA21271
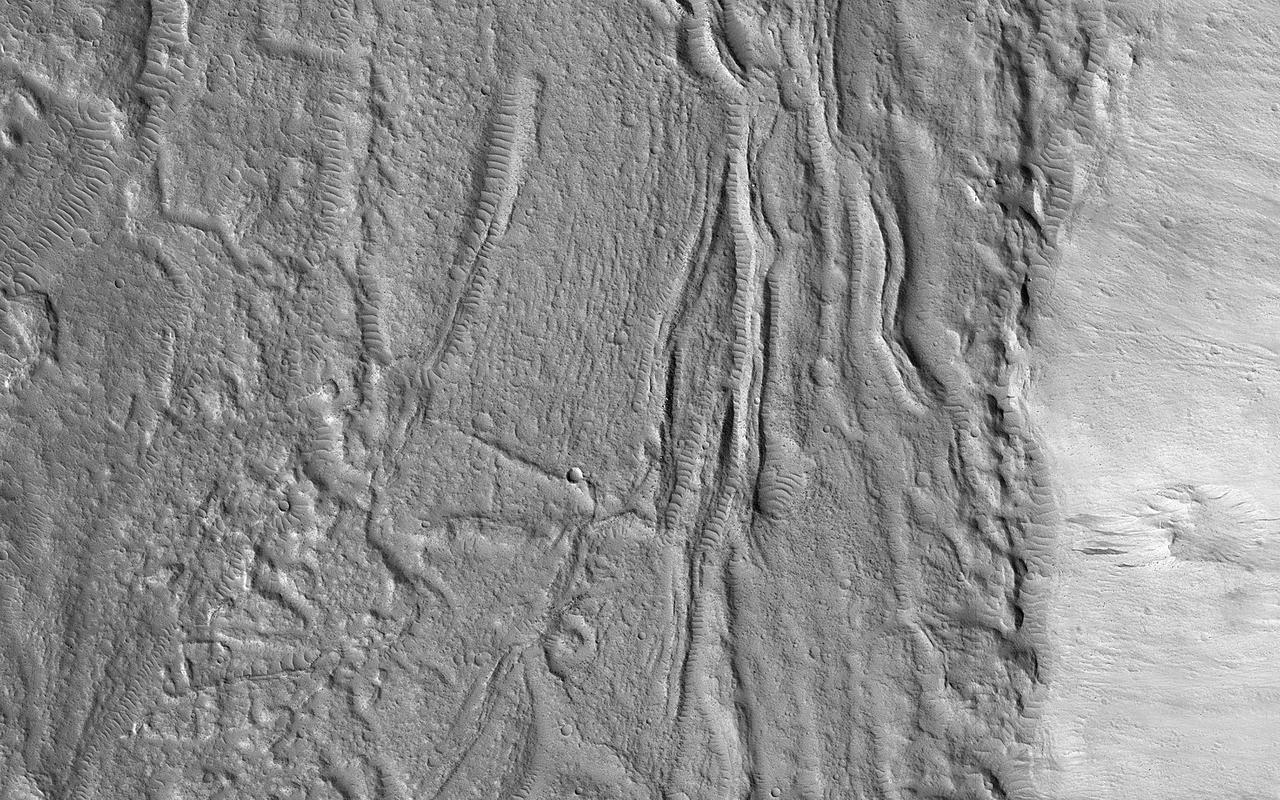
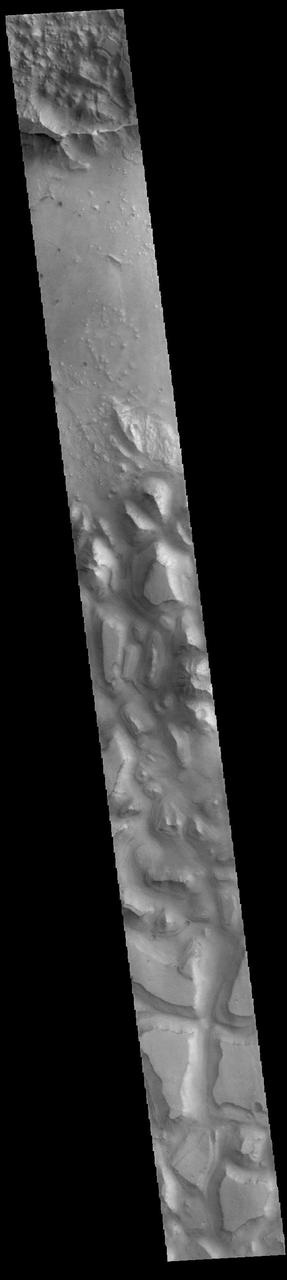
The geologic setting and latitude here suggest this is a glacial (ice-rich) flow, but the surface is broken into plates like many lava flows on Mars. An image was targeted here to get a better look. At the meter-scale resolution of HiRISE, we see a hummocky surface with boulders and craters plus some wind-blown landforms that seems consistent with either the glacial or lava hypothesis. This is a common result: getting a higher-resolution image doesn't necessarily provide more information about large-scale processes, instead providing information about how the surface has been modified. https://photojournal.jpl.nasa.gov/catalog/PIA25794
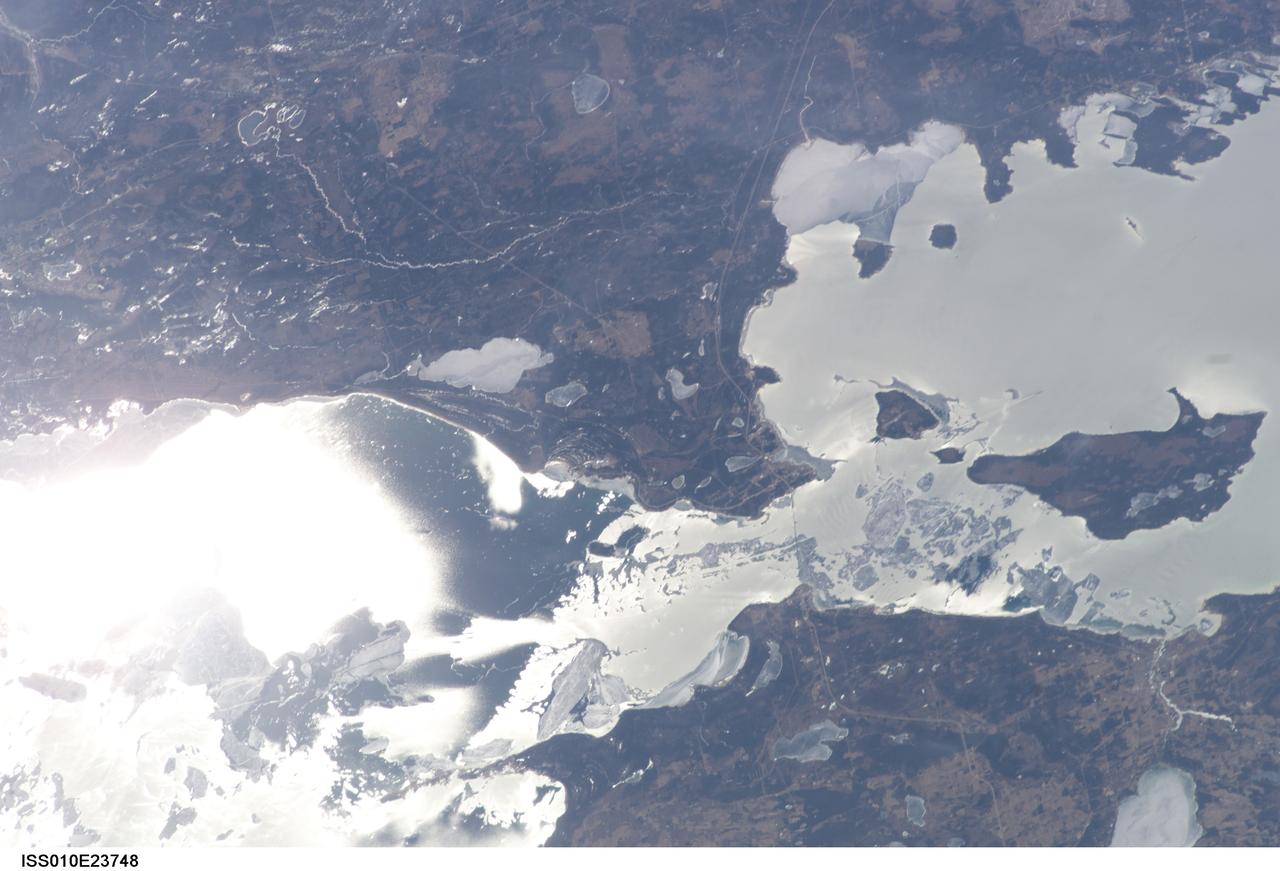
ISS010-E-23748 (9 April 2005) --- The Straits of Mackinac are featured in this image photographed by an Expedition 10 crewmember on the International Space Station (ISS). The Mackinac Bridge spans a stretch of water five miles wide between Michigan’s lower and upper peninsulas. The strait connects Lakes Michigan (left) and Huron (right). The bridge is a combination of pier-supported spans with a high, central suspension sector that allows passage of lake steamers. The suspension sector is the longest in the Americas (8614 feet or 1.6 miles). Prior to construction of the bridge, the only passage across the straits was by ferryboat. This view shows the ice broken into a series of irregular rafts that appear gray against bright water in this partial sunglint view. The shipping channel is maintained even through remnants of the ice mass, but the ice ridges can be hazardous to shipping during ice break-up.

This large tabular iceberg, broken off from the Antarctic Ice Sheet, was spotted in the South Atlantic Ocean (57.0S, 57.0W) southeast of the tip of South America as it was slowly being moved north and east by wind, current and tidal influences. This type of iceberg, never to be seen in the northern hemisphere, is typical for Antarctica. Although some such icebergs are as large as 100 km in length, this one measures about 35 by 69 km.
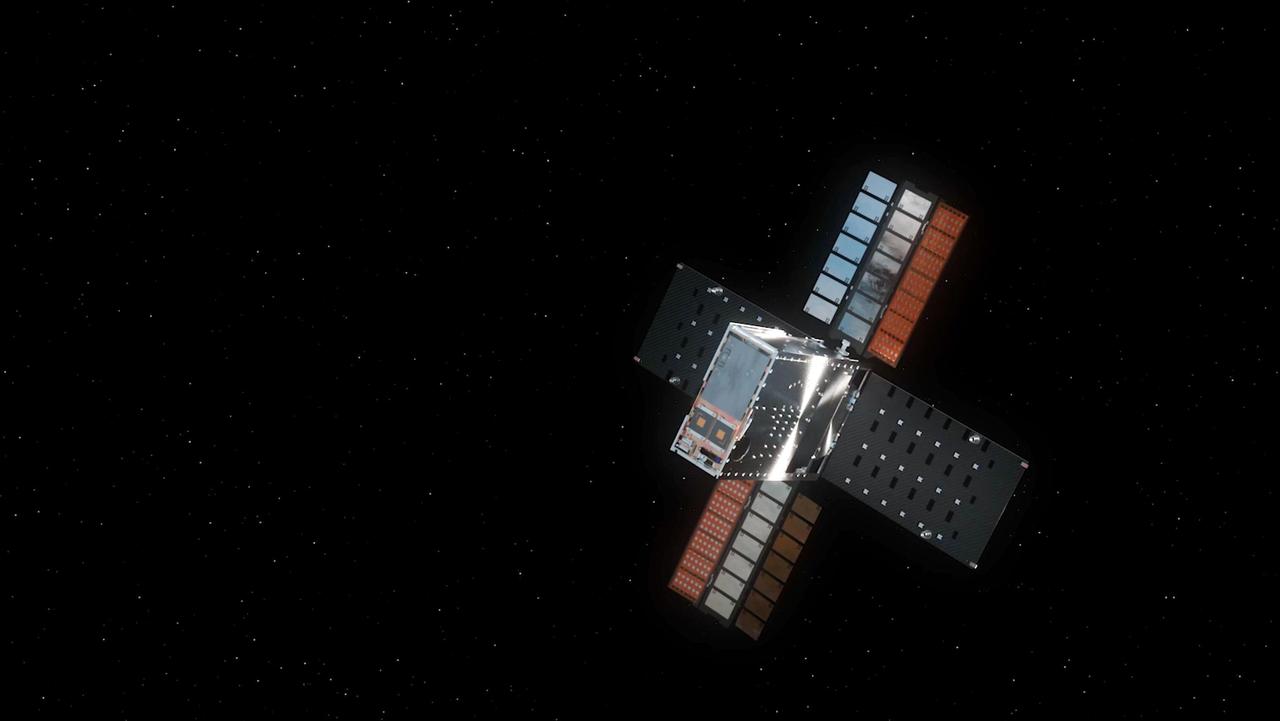
This illustration shows NASA's Lunar Flashlight, with its four solar arrays deployed, shortly after launch. The small satellite, or SmallSat, launched Nov. 30, 2022, aboard a SpaceX Falcon 9 rocket as a rideshare with ispace's HAKUTO-R Mission 1. It will take about three months to reach its science orbit to seek out surface water ice in the darkest craters of the Moon's South Pole. A technology demonstration, Lunar Flashlight will use a reflectometer equipped with four lasers that emit near-infrared light in wavelengths readily absorbed by surface water ice. This is the first time that multiple colored lasers will be used to seek out ice inside these dark regions on the Moon, which haven't seen sunlight in billions of years. Should the lasers hit bare rock or regolith (broken rock and dust), the light will reflect back to the spacecraft. But if the target absorbs the light, that would indicate the presence of water ice. The greater the absorption, the more ice there may be. The science data collected by the mission will be compared with observations made by other lunar missions to help reveal the distribution of surface water ice on the Moon for potential use by future astronauts. https://photojournal.jpl.nasa.gov/catalog/PIA25626
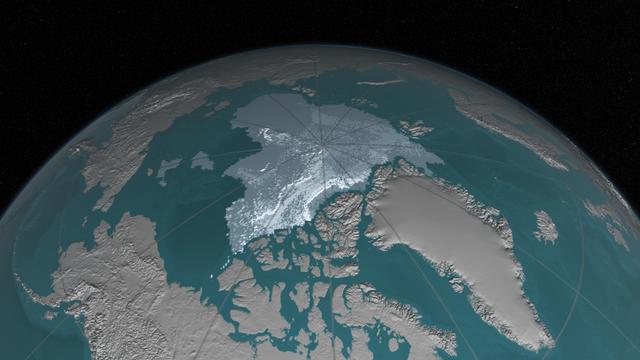
Arctic sea ice, the vast sheath of frozen seawater floating on the Arctic Ocean and its neighboring seas, has been hit with a double whammy over the past decades: as its extent shrunk, the oldest and thickest ice has either thinned or melted away, leaving the sea ice cap more vulnerable to the warming ocean and atmosphere. “What we’ve seen over the years is that the older ice is disappearing,” said Walt Meier, a sea ice researcher at NASA’s Goddard Space Flight Center in Greenbelt, Maryland. “This older, thicker ice is like the bulwark of sea ice: a warm summer will melt all the young, thin ice away but it can’t completely get rid of the older ice. But this older ice is becoming weaker because there’s less of it and the remaining old ice is more broken up and thinner, so that bulwark is not as good as it used to be.” Read more: <a href="http://go.nasa.gov/2dPJ9zT" rel="nofollow">go.nasa.gov/2dPJ9zT</a> <b><a href="http://www.nasa.gov/audience/formedia/features/MP_Photo_Guidelines.html" rel="nofollow">NASA image use policy.</a></b> <b><a href="http://www.nasa.gov/centers/goddard/home/index.html" rel="nofollow">NASA Goddard Space Flight Center</a></b> enables NASA’s mission through four scientific endeavors: Earth Science, Heliophysics, Solar System Exploration, and Astrophysics. Goddard plays a leading role in NASA’s accomplishments by contributing compelling scientific knowledge to advance the Agency’s mission. <b>Follow us on <a href="http://twitter.com/NASAGoddardPix" rel="nofollow">Twitter</a></b> <b>Like us on <a href="http://www.facebook.com/pages/Greenbelt-MD/NASA-Goddard/395013845897?ref=tsd" rel="nofollow">Facebook</a></b> <b>Find us on <a href="http://instagrid.me/nasagoddard/?vm=grid" rel="nofollow">Instagram</a></b>
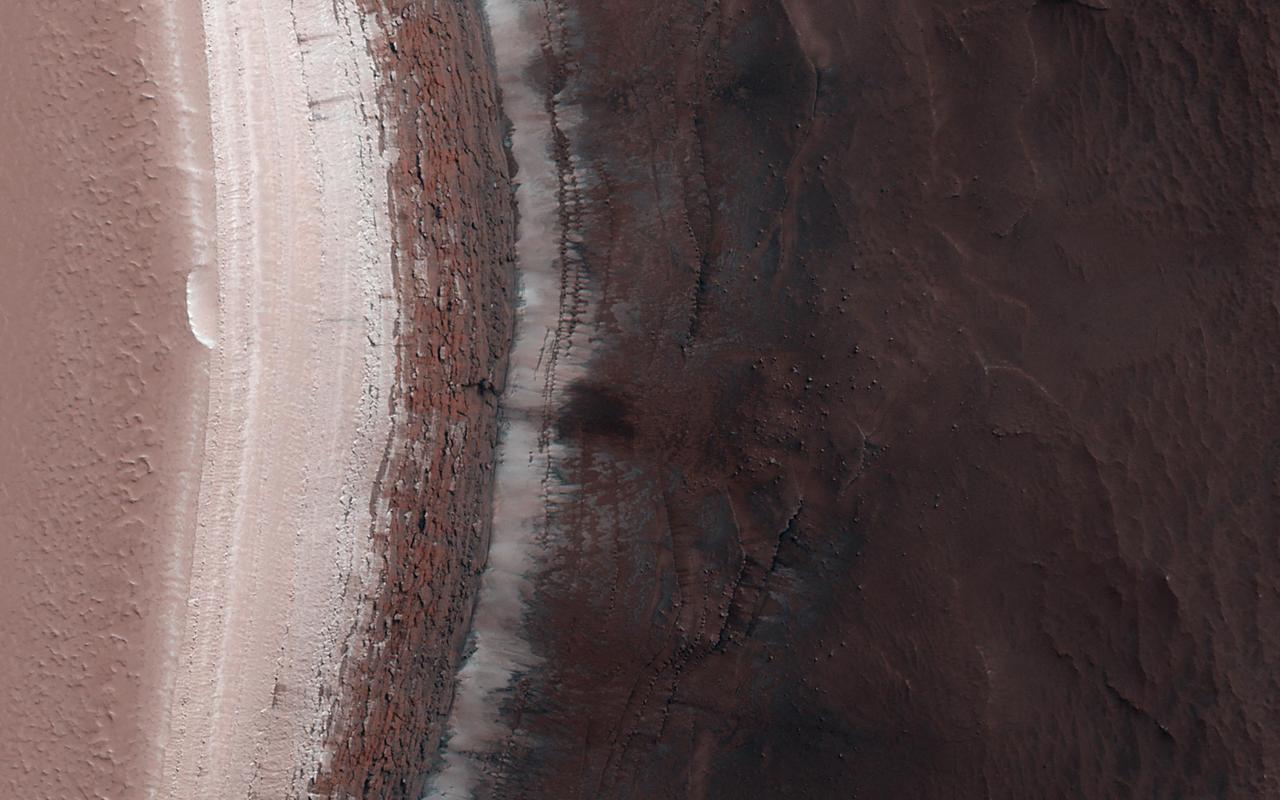
An ice cap about three kilometers (two miles) thick exists at the North Pole of Mars. In some locations its edge is a cliff about 800 meters (half a mile) high that is an almost-vertical wall of ice. With HiRISE images like this one we can look at this cliff face and see it is broken up into jagged blocks. Debris piles at the base of the cliff show where these blocks have fallen out. In the spring, we also sometimes see avalanches pouring down these cliff faces and this image was taken to search for more of them. No avalanches are visible this time., however. For reasons we don't understand, the number of avalanches varies from year to year and this spring appears to be a low-avalanche year. https://photojournal.jpl.nasa.gov/catalog/PIA25949
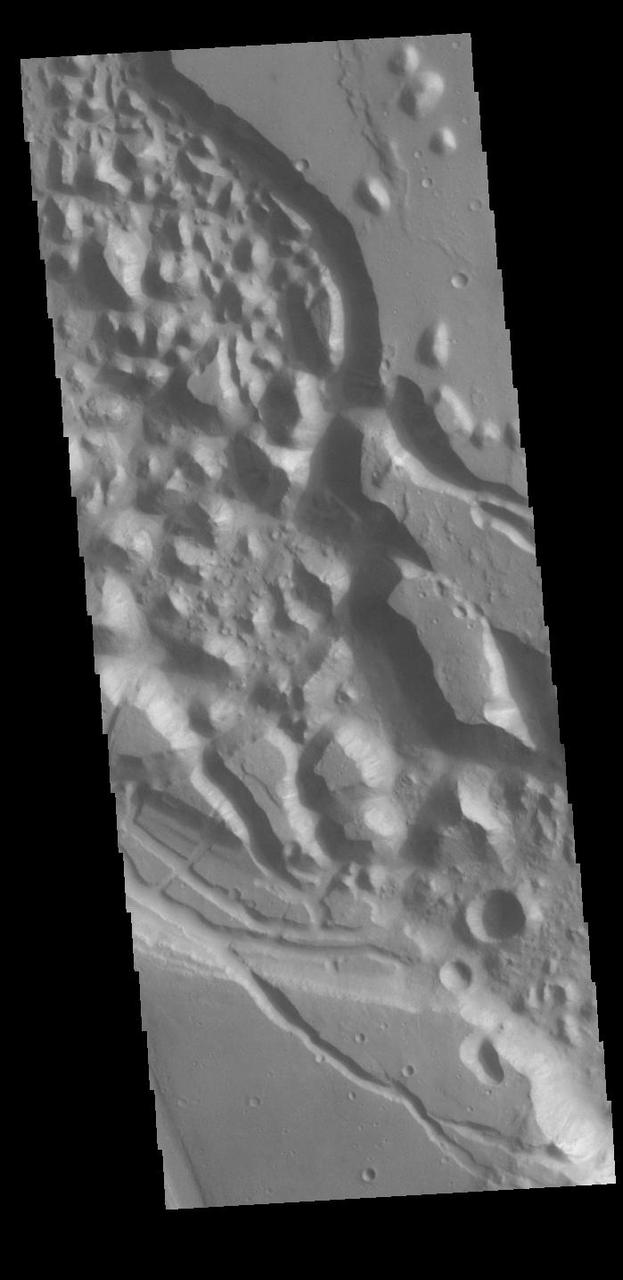
Today's VIS image shows Xanthe Chaos, a region of knobs and mesas within the channel of Shalbatana Vallis. In planetary nomenclature, the descriptor term chaos means "distinctive area of broken terrain". The general morphology of chaos is steep-sided mesas with intervening small valleys. With time and erosion the valleys widen and the mesas grow smaller. While on many planets chaos terrain results from tectonic forces, on Mars it is most likely that chaos terrain results from the release of melted subsurface ice. Orbit Number: 87588 Latitude: 11.818 Longitude: 317.879 Instrument: VIS Captured: 2021-09-12 07:17 https://photojournal.jpl.nasa.gov/catalog/PIA25225
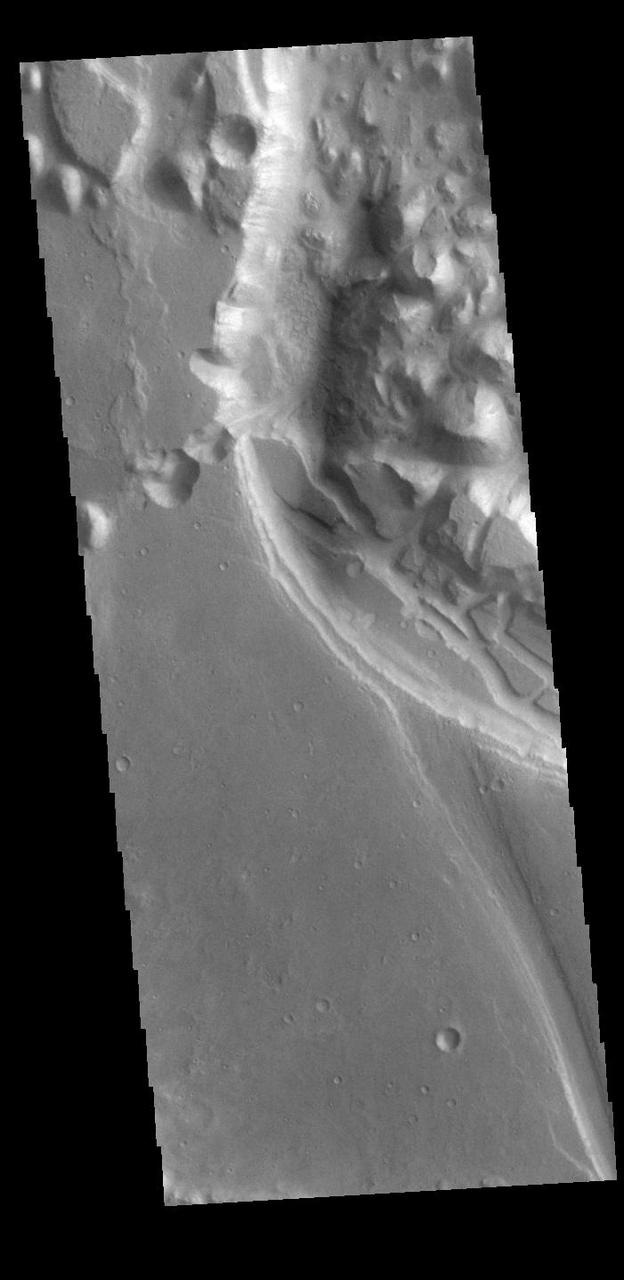
This VIS image shows part of Xanthe Chaos. Xanthe Chaos is a small region of mesas located within Shalbatana Vallis. In planetary nomenclature, the descriptor term chaos means "distinctive area of broken terrain". The general morphology of chaos is steep-sided mesas with intervening small valleys. With time and erosion the valleys widen and the mesas grow smaller. While on many planets chaos terrain results from tectonic forces, on Mars it is most likely that chaos terrain results from the release of melted subsurface ice. Orbit Number: 86415 Latitude: 11.6822 Longitude: 317.621 Instrument: VIS Captured: 2021-06-07 17:18 https://photojournal.jpl.nasa.gov/catalog/PIA24954
ISS039E14821 (22 April 2014) --- In this late afternoon shot, one of the Expedition 39 crew members aboard the International Space Station looked back toward the setting sun and used a 145mm lens on an electronic still camera to capture the hook-shaped southern half of Lake Baikal in eastern Russia on April 22, 2014. Most of the lake is covered with dull gray ice. The brightest point in the center of the image is the reflection of the sun’s rays off a small zone of open water (center) where the ice has begun to melt. Broken ice masses appear adjacent to the sunglint point (center). The sun’s rays are also reflected off the water surface of the straight Angara River, the main outlet of the lake (top right). Lake Baikal is 636 kilometers long (395 miles). It is the deepest lake in the world and holds the largest amount of fresh water. Individual smoke plumes from factories arc away from the north shore (top left). Large smoke palls from wildfires appear in upper right.
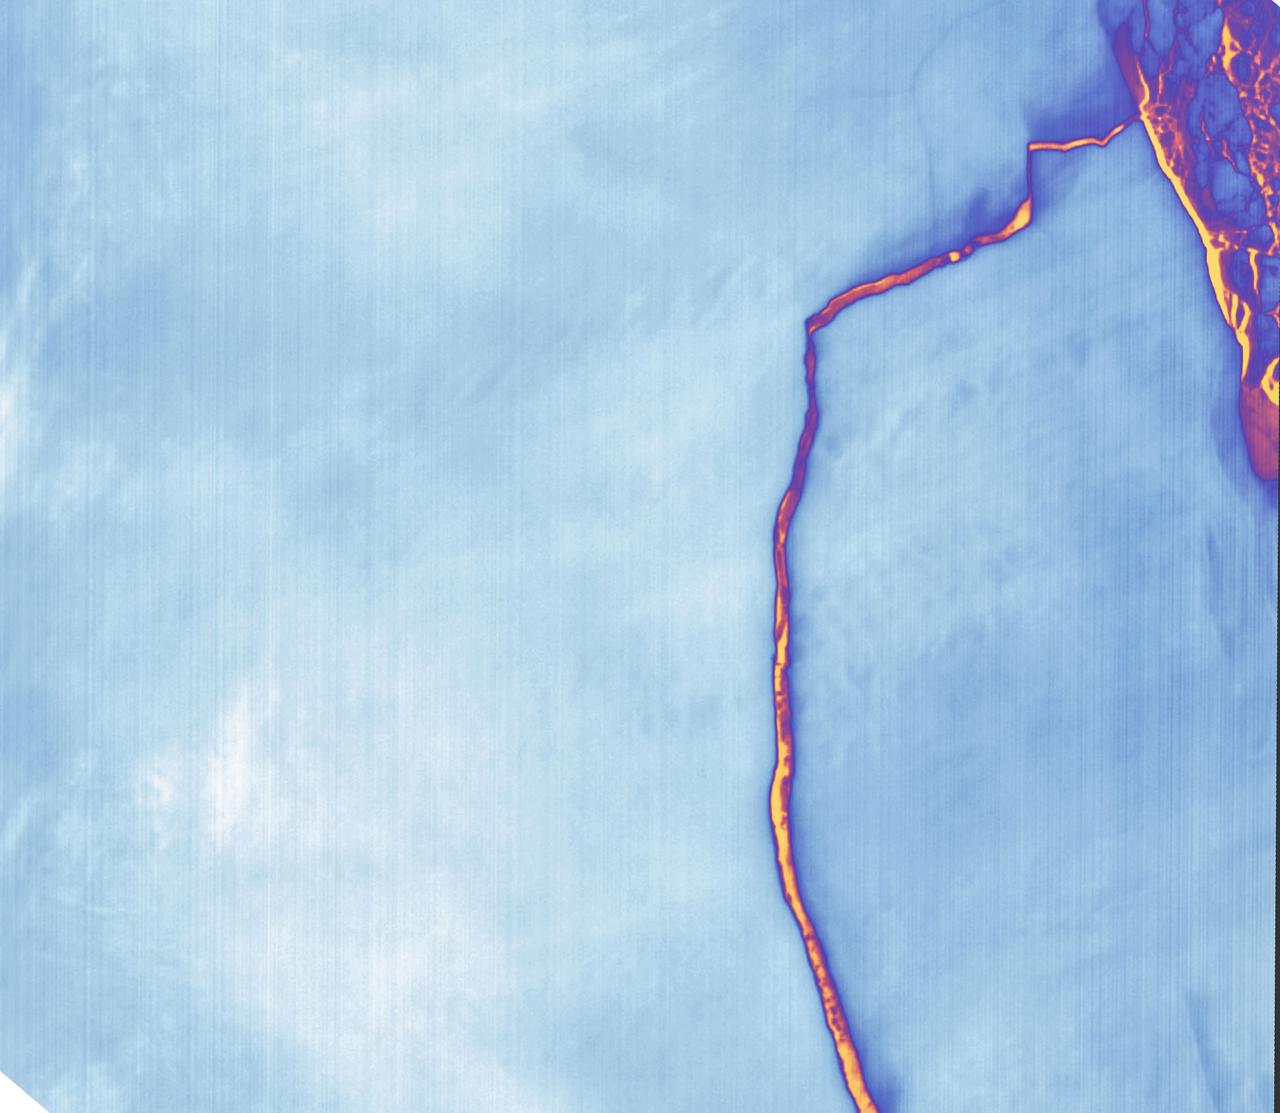
Sometime between July 10 and July 12, an iceberg about the size of Delaware split off from Antarctica’s Larsen C ice shelf. Now that nearly 5,800 square kilometers (2,200 square miles) of ice has broken away, the Larsen C shelf area has shrunk by approximately 10 percent. This false-color image was captured by Landsat’s Thermal Infrared Sensor (TIRS). It shows the relative warmth or coolness of the landscape. Orange indicates where the surface is the warmest, most notably the mélange between the new berg and the ice shelf. Light blues and whites are the coldest areas, including the ice shelf and the iceberg. On July 13, the U.S. National Ice Center issued a press release confirming the new iceberg and officially naming it A-68. Credit: NASA Earth Observatory images by Joshua Stevens, using Landsat data from the U.S. Geological Survey <b><a href="http://www.nasa.gov/audience/formedia/features/MP_Photo_Guidelines.html" rel="nofollow">NASA image use policy.</a></b> <b><a href="http://www.nasa.gov/centers/goddard/home/index.html" rel="nofollow">NASA Goddard Space Flight Center</a></b> enables NASA’s mission through four scientific endeavors: Earth Science, Heliophysics, Solar System Exploration, and Astrophysics. Goddard plays a leading role in NASA’s accomplishments by contributing compelling scientific knowledge to advance the Agency’s mission. <b>Follow us on <a href="http://twitter.com/NASAGoddardPix" rel="nofollow">Twitter</a></b> <b>Like us on <a href="http://www.facebook.com/pages/Greenbelt-MD/NASA-Goddard/395013845897?ref=tsd" rel="nofollow">Facebook</a></b> <b>Find us on <a href="http://instagrid.me/nasagoddard/?vm=grid" rel="nofollow">Instagram</a></b>

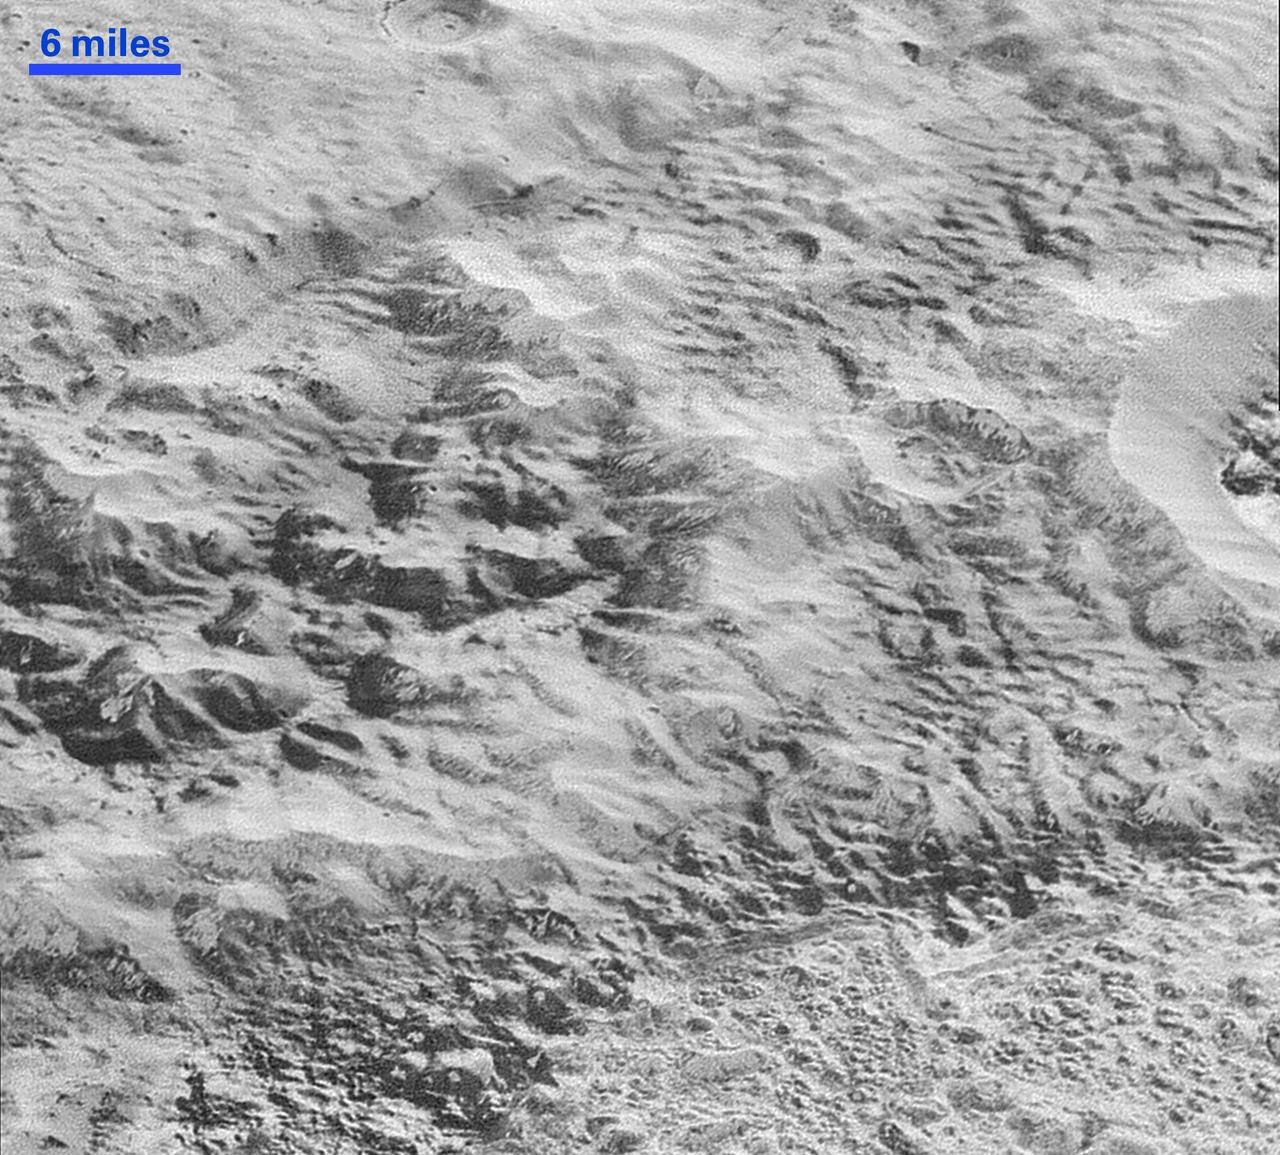
In this highest-resolution image from NASA's New Horizons spacecraft, great blocks of Pluto's water-ice crust appear jammed together in the informally named al-Idrisi mountains. Some mountain sides appear coated in dark material, while other sides are bright. Several sheer faces appear to show crustal layering, perhaps related to the layers seen in some of Pluto's crater walls. Other materials appear crushed between the mountains, as if these great blocks of water ice, some standing as much as 1.5 miles high, were jostled back and forth. The mountains end abruptly at the shoreline of the informally named Sputnik Planum, where the soft, nitrogen-rich ices of the plain form a nearly level surface, broken only by the fine trace work of striking, cellular boundaries and the textured surface of the plain's ices (which is possibly related to sunlight-driven ice sublimation). This view is about 50 miles wide. The top of the image is to Pluto's northwest. These images were made with the telescopic Long Range Reconnaissance Imager (LORRI) aboard New Horizons, in a timespan of about a minute centered on 11:36 UT on July 14 -- just about 15 minutes before New Horizons' closest approach to Pluto -- from a range of just 10,000 miles (17,000 kilometers). They were obtained with an unusual observing mode; instead of working in the usual "point and shoot," LORRI snapped pictures every three seconds while the Ralph/Multispectral Visual Imaging Camera (MVIC) aboard New Horizons was scanning the surface. This mode requires unusually short exposures to avoid blurring the images. http://photojournal.jpl.nasa.gov/catalog/PIA20198

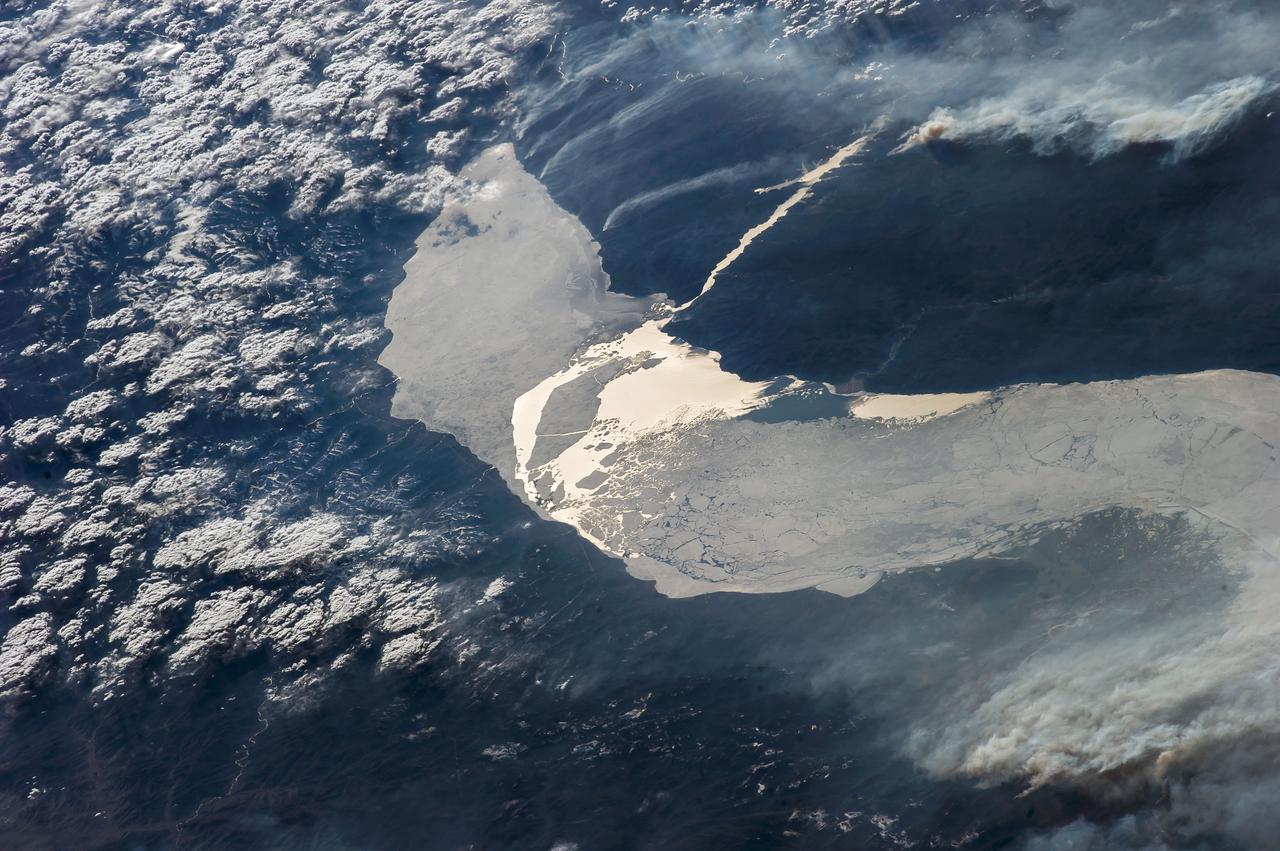
Antarctica—the continent at the southernmost reach of the planet—is fringed by cold, often frozen waters of the Southern Ocean. The extent of sea ice around the continent typically reaches a peak in September and a minimum in February. The photograph above shows Antarctic sea ice on November 5, 2014, during the annual cycle of melt. The image was acquired by the Digital Mapping System (DMS), a digital camera installed in the belly of research aircraft to capture images of terrain below. In this case, the system flew on the DC-8 during a flight as part of NASA’s Operation IceBridge. Most of the view shows first-year sea ice in the Bellingshausen Sea, as it appeared from an altitude of 328 meters (1,076 feet). The block of ice on the right side of the image is older, thicker, and was once attached to the Antarctic Ice Sheet. By the time this image was acquired, however, the ice had broken away to form an iceberg. Given its close proximity to the ice sheet, this could have been a relatively new berg. Read more: <a href="http://earthobservatory.nasa.gov/IOTD/view.php?id=86721" rel="nofollow">earthobservatory.nasa.gov/IOTD/view.php?id=86721</a> Credit: NASA/Goddard/IceBridge DMS L0 Raw Imagery courtesy of the Digital Mapping System (DMS) team and the NASA DAAC at the National Snow and Ice Data Center Credit: <b><a href="http://www.earthobservatory.nasa.gov/" rel="nofollow"> NASA Earth Observatory</a></b> <b><a href="http://www.nasa.gov/audience/formedia/features/MP_Photo_Guidelines.html" rel="nofollow">NASA image use policy.</a></b> <b><a href="http://www.nasa.gov/centers/goddard/home/index.html" rel="nofollow">NASA Goddard Space Flight Center</a></b> enables NASA’s mission through four scientific endeavors: Earth Science, Heliophysics, Solar System Exploration, and Astrophysics. Goddard plays a leading role in NASA’s accomplishments by contributing compelling scientific knowledge to advance the Agency’s mission. <b>Follow us on <a href="http://twitter.com/NASAGoddardPix" rel="nofollow">Twitter</a></b> <b>Like us on <a href="http://www.facebook.com/pages/Greenbelt-MD/NASA-Goddard/395013845897?ref=tsd" rel="nofollow">Facebook</a></b> <b>Find us on <a href="http://instagrid.me/nasagoddard/?vm=grid" rel="nofollow">Instagram</a></b>
This VIS image shows part of Hydraotes Chaos. Hydraotes Chaos measures about 300 kilometers (190 miles) wide by roughly 350 km (220 mi) north-south. The chaos lies in a valley leading northeast out of Ganges Chasma at the east end of Valles Marineris. Tiu Valles flows northward from Hydraotes Chaos to empty into Chryse Planitia. In planetary nomenclature, the descriptor term chaos means "distinctive area of broken terrain". The general morphology of chaos is steep-sided mesas in close proximity. With time and erosion the valleys widen and the mesas grow smaller. The initial breakup of the land can be due to tectonic forces, but on Mars it is thought that the release of melted, subsurface ice created the terrain. Large channels, like Tiu Valles, usually originate from regions of chaos. Orbit Number: 86003 Latitude: 2.07857 Longitude: 324.563 Instrument: VIS Captured: 2021-05-04 19:05 https://photojournal.jpl.nasa.gov/catalog/PIA24219
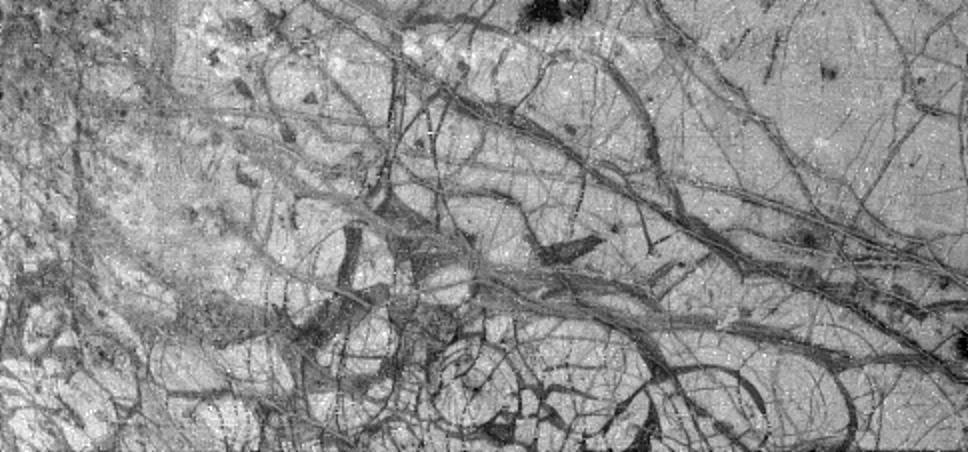
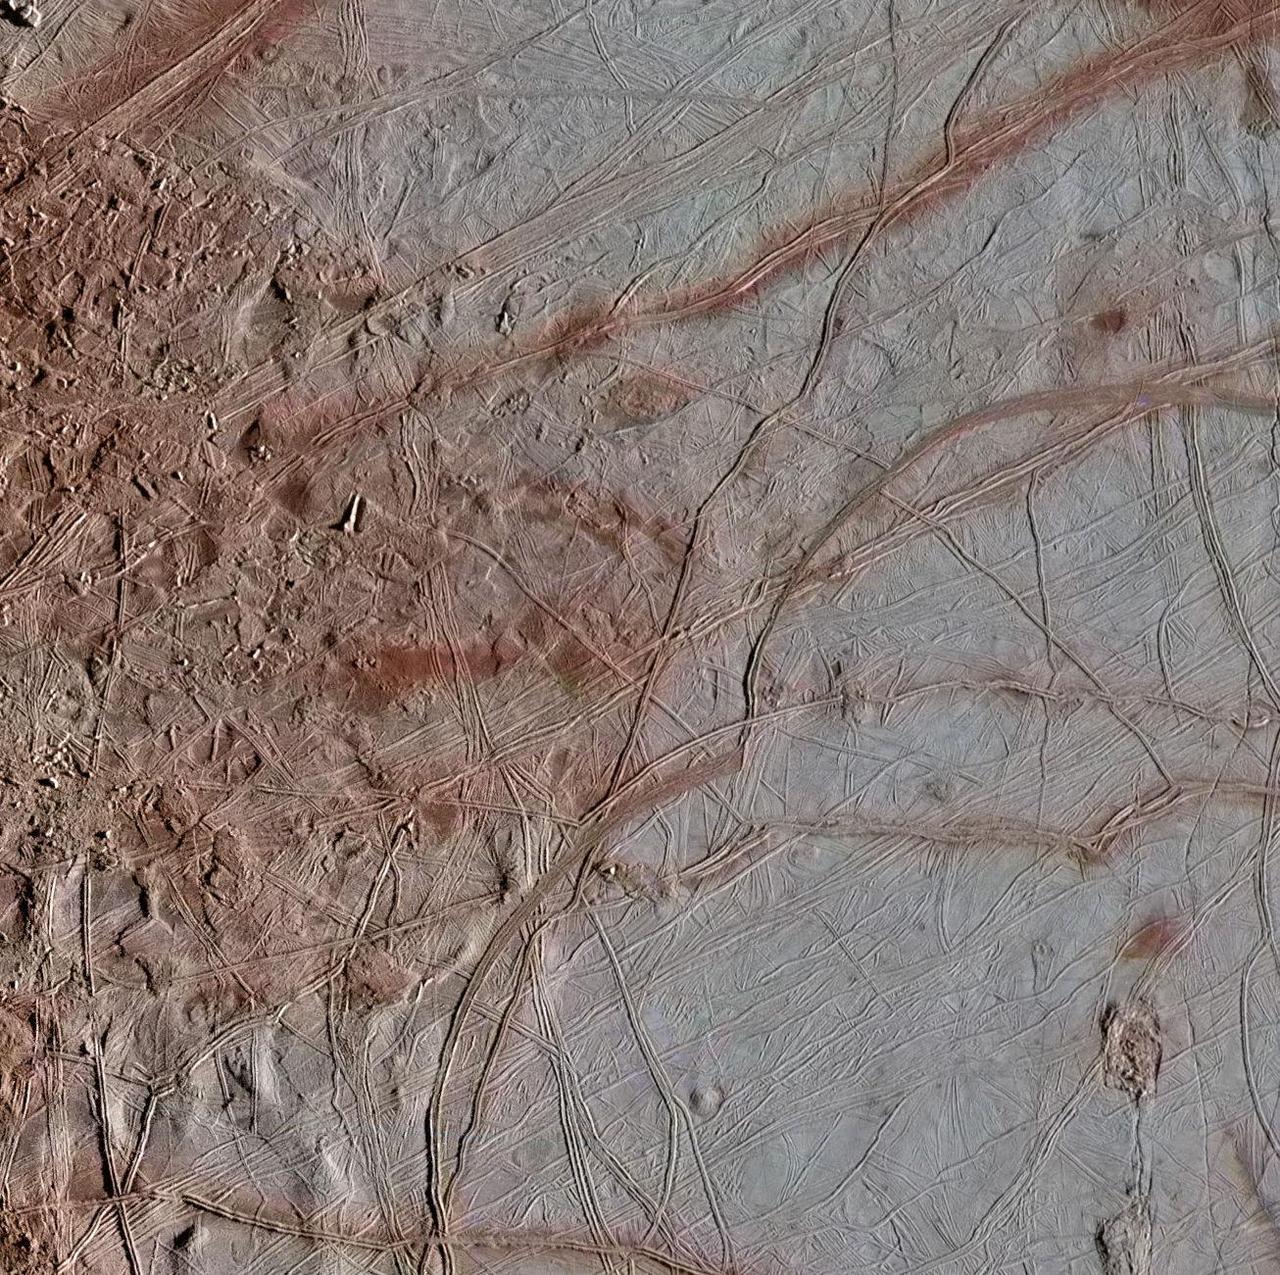
![The puzzling, fascinating surface of Jupiter icy moon Europa looms large in this newly-reprocessed [sic] color view, made from images taken by NASA Galileo spacecraft in the late 1990s. This is the color view of Europa from Galileo that shows the largest portion of the moon's surface at the highest resolution. The view was previously released as a mosaic with lower resolution and strongly enhanced color (see PIA02590). To create this new version, the images were assembled into a realistic color view of the surface that approximates how Europa would appear to the human eye. The scene shows the stunning diversity of Europa's surface geology. Long, linear cracks and ridges crisscross the surface, interrupted by regions of disrupted terrain where the surface ice crust has been broken up and re-frozen into new patterns. Color variations across the surface are associated with differences in geologic feature type and location. For example, areas that appear blue or white contain relatively pure water ice, while reddish and brownish areas include non-ice components in higher concentrations. The polar regions, visible at the left and right of this view, are noticeably bluer than the more equatorial latitudes, which look more white. This color variation is thought to be due to differences in ice grain size in the two locations. Images taken through near-infrared, green and violet filters have been combined to produce this view. The images have been corrected for light scattered outside of the image, to provide a color correction that is calibrated by wavelength. Gaps in the images have been filled with simulated color based on the color of nearby surface areas with similar terrain types. This global color view consists of images acquired by the Galileo Solid-State Imaging (SSI) experiment on the spacecraft's first and fourteenth orbits through the Jupiter system, in 1995 and 1998, respectively. Image scale is 1 mile (1.6 kilometers) per pixel. North on Europa is at right. http://photojournal.jpl.nasa.gov/catalog/PIA19048](https://images-assets.nasa.gov/image/PIA19048/PIA19048~medium.jpg)
The puzzling, fascinating surface of Jupiter icy moon Europa looms large in this newly-reprocessed [sic] color view, made from images taken by NASA Galileo spacecraft in the late 1990s. This is the color view of Europa from Galileo that shows the largest portion of the moon's surface at the highest resolution. The view was previously released as a mosaic with lower resolution and strongly enhanced color (see PIA02590). To create this new version, the images were assembled into a realistic color view of the surface that approximates how Europa would appear to the human eye. The scene shows the stunning diversity of Europa's surface geology. Long, linear cracks and ridges crisscross the surface, interrupted by regions of disrupted terrain where the surface ice crust has been broken up and re-frozen into new patterns. Color variations across the surface are associated with differences in geologic feature type and location. For example, areas that appear blue or white contain relatively pure water ice, while reddish and brownish areas include non-ice components in higher concentrations. The polar regions, visible at the left and right of this view, are noticeably bluer than the more equatorial latitudes, which look more white. This color variation is thought to be due to differences in ice grain size in the two locations. Images taken through near-infrared, green and violet filters have been combined to produce this view. The images have been corrected for light scattered outside of the image, to provide a color correction that is calibrated by wavelength. Gaps in the images have been filled with simulated color based on the color of nearby surface areas with similar terrain types. This global color view consists of images acquired by the Galileo Solid-State Imaging (SSI) experiment on the spacecraft's first and fourteenth orbits through the Jupiter system, in 1995 and 1998, respectively. Image scale is 1 mile (1.6 kilometers) per pixel. North on Europa is at right. http://photojournal.jpl.nasa.gov/catalog/PIA19048

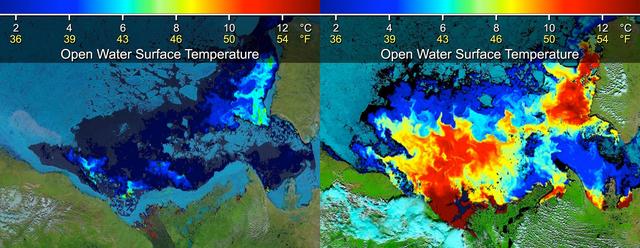
The Visible Infrared Imaging Radiometer Suite (VIIRS) on the Suomi NPP satellite captured this view of extensive sea-ice fracturing off the northern coast of Alaska. The event began in late-January and spread west toward Banks Island throughout February and March 2013. Visualizations of the Arctic often give the impression that the ice cap is a continuous sheet of stationary, floating ice. In fact, it is a collection of smaller pieces that constantly shift, crack, and grind against one another as they are jostled by winds and ocean currents. Especially during the summer—but even during the height of winter—cracks—or leads—open up between pieces of ice. That was what was happening on the left side of the animation (seen here: <a href="http://bit.ly/10kE7sh" rel="nofollow">bit.ly/10kE7sh</a>) in late January. A high-pressure weather system was parked over the region, producing warmer temperatures and winds that flowed in a southwesterly direction. That fueled the Beaufort Gyre, a wind-driven ocean current that flows clockwise. The gyre was the key force pulling pieces of ice west past Point Barrow, the northern nub of Alaska that protrudes into the Beaufort Sea. “A fracturing event in this area is not unusual because the Beaufort Gyre tends to push ice away from Banks Island and the Canadian Archipelago,” explained Walt Meier of the National Snow & Ice Data Center (NSIDC). “Point Barrow can act like a ‘pin point’ where the ice catches and fractures to the north and east.” In February, however, a series of storms passing over central Alaska exacerbated the fracturing. Strong westerly winds prompted several large pieces of ice to break away in an arc-shaped wave that moved progressively east. By the end of February, large pieces of ice had fractured all the way to the western coast of Banks Island, a distance of about 1,000 kilometers (600 miles). The data used to create the animation came from the longwave infrared (thermal) portion of the electromagnetic spectrum, so the animation illustrates how much heat the surface was emitting as VIIRS surveyed the area. Cooler areas (sea ice) appear white, while warmer areas (open water) are dark. The light gray plume near the cracks is warmer, moister air escaping from the ocean and blowing downwind. Clouds do not show up well in the VIIRS thermal band, so the storms that fueled the fracturing are not readily visible. While fracturing events are common, few events sprawl across such a large area or produce cracks as long and wide as those seen here. The age of the sea ice in this area was one of the key reasons this event became so widespread. “The region is covered almost completely by seasonal or first-year ice—ice that has formed since last September,” said Meier. “This ice is thinner and weaker than the older, multi-year ice, so it responds more readily to winds and is more easily broken up.” NASA Earth Observatory images by Jesse Allen using VIIRS day-night band data from the Suomi National Polar-orbiting Partnership. Suomi NPP is the result of a partnership between NASA, the National Oceanic and Atmospheric Administration, and the Department of Defense. Caption by Adam Voiland. Instrument: Suomi NPP - VIIRS For more info go to: <a href="http://earthobservatory.nasa.gov/IOTD/view.php?id=80752" rel="nofollow">earthobservatory.nasa.gov/IOTD/view.php?id=80752</a> Credit: <b><a href="http://www.earthobservatory.nasa.gov/" rel="nofollow"> NASA Earth Observatory</a></b> <b><a href="http://www.nasa.gov/audience/formedia/features/MP_Photo_Guidelines.html" rel="nofollow">NASA image use policy.</a></b> <b><a href="http://www.nasa.gov/centers/goddard/home/index.html" rel="nofollow">NASA Goddard Space Flight Center</a></b> enables NASA’s mission through four scientific endeavors: Earth Science, Heliophysics, Solar System Exploration, and Astrophysics. Goddard plays a leading role in NASA’s accomplishments by contributing compelling scientific knowledge to advance the Agency’s mission. <b>Follow us on <a href="http://twitter.com/NASA_GoddardPix" rel="nofollow">Twitter</a></b> <b>Like us on <a href="http://www.facebook.com/pages/Greenbelt-MD/NASA-Goddard/395013845897?ref=tsd" rel="nofollow">Facebook</a></b> <b>Find us on <a href="http://instagram.com/nasagoddard?vm=grid" rel="nofollow">Instagram</a></b>

The Visible Infrared Imaging Radiometer Suite (VIIRS) on the Suomi NPP satellite captured this view of extensive sea-ice fracturing off the northern coast of Alaska. The event began in late-January and spread west toward Banks Island throughout February and March 2013. Visualizations of the Arctic often give the impression that the ice cap is a continuous sheet of stationary, floating ice. In fact, it is a collection of smaller pieces that constantly shift, crack, and grind against one another as they are jostled by winds and ocean currents. Especially during the summer—but even during the height of winter—cracks—or leads—open up between pieces of ice. That was what was happening on the left side of the animation (seen here: <a href="http://bit.ly/10kE7sh" rel="nofollow">bit.ly/10kE7sh</a>) in late January. A high-pressure weather system was parked over the region, producing warmer temperatures and winds that flowed in a southwesterly direction. That fueled the Beaufort Gyre, a wind-driven ocean current that flows clockwise. The gyre was the key force pulling pieces of ice west past Point Barrow, the northern nub of Alaska that protrudes into the Beaufort Sea. “A fracturing event in this area is not unusual because the Beaufort Gyre tends to push ice away from Banks Island and the Canadian Archipelago,” explained Walt Meier of the National Snow & Ice Data Center (NSIDC). “Point Barrow can act like a ‘pin point’ where the ice catches and fractures to the north and east.” In February, however, a series of storms passing over central Alaska exacerbated the fracturing. Strong westerly winds prompted several large pieces of ice to break away in an arc-shaped wave that moved progressively east. By the end of February, large pieces of ice had fractured all the way to the western coast of Banks Island, a distance of about 1,000 kilometers (600 miles). The data used to create the animation came from the longwave infrared (thermal) portion of the electromagnetic spectrum, so the animation illustrates how much heat the surface was emitting as VIIRS surveyed the area. Cooler areas (sea ice) appear white, while warmer areas (open water) are dark. The light gray plume near the cracks is warmer, moister air escaping from the ocean and blowing downwind. Clouds do not show up well in the VIIRS thermal band, so the storms that fueled the fracturing are not readily visible. While fracturing events are common, few events sprawl across such a large area or produce cracks as long and wide as those seen here. The age of the sea ice in this area was one of the key reasons this event became so widespread. “The region is covered almost completely by seasonal or first-year ice—ice that has formed since last September,” said Meier. “This ice is thinner and weaker than the older, multi-year ice, so it responds more readily to winds and is more easily broken up.” NASA Earth Observatory images by Jesse Allen using VIIRS day-night band data from the Suomi National Polar-orbiting Partnership. Suomi NPP is the result of a partnership between NASA, the National Oceanic and Atmospheric Administration, and the Department of Defense. Caption by Adam Voiland. Instrument: Suomi NPP - VIIRS For more info go to: <a href="http://earthobservatory.nasa.gov/IOTD/view.php?id=80752" rel="nofollow">earthobservatory.nasa.gov/IOTD/view.php?id=80752</a> Credit: <b><a href="http://www.earthobservatory.nasa.gov/" rel="nofollow"> NASA Earth Observatory</a></b> <b><a href="http://www.nasa.gov/audience/formedia/features/MP_Photo_Guidelines.html" rel="nofollow">NASA image use policy.</a></b> <b><a href="http://www.nasa.gov/centers/goddard/home/index.html" rel="nofollow">NASA Goddard Space Flight Center</a></b> enables NASA’s mission through four scientific endeavors: Earth Science, Heliophysics, Solar System Exploration, and Astrophysics. Goddard plays a leading role in NASA’s accomplishments by contributing compelling scientific knowledge to advance the Agency’s mission. <b>Follow us on <a href="http://twitter.com/NASA_GoddardPix" rel="nofollow">Twitter</a></b> <b>Like us on <a href="http://www.facebook.com/pages/Greenbelt-MD/NASA-Goddard/395013845897?ref=tsd" rel="nofollow">Facebook</a></b> <b>Find us on <a href="http://instagram.com/nasagoddard?vm=grid" rel="nofollow">Instagram</a></b>

The Visible Infrared Imaging Radiometer Suite (VIIRS) on the Suomi NPP satellite captured this view of extensive sea-ice fracturing off the northern coast of Alaska. The event began in late-January and spread west toward Banks Island throughout February and March 2013. Visualizations of the Arctic often give the impression that the ice cap is a continuous sheet of stationary, floating ice. In fact, it is a collection of smaller pieces that constantly shift, crack, and grind against one another as they are jostled by winds and ocean currents. Especially during the summer—but even during the height of winter—cracks—or leads—open up between pieces of ice. That was what was happening on the left side of the animation (seen here: <a href="http://bit.ly/10kE7sh" rel="nofollow">bit.ly/10kE7sh</a>) in late January. A high-pressure weather system was parked over the region, producing warmer temperatures and winds that flowed in a southwesterly direction. That fueled the Beaufort Gyre, a wind-driven ocean current that flows clockwise. The gyre was the key force pulling pieces of ice west past Point Barrow, the northern nub of Alaska that protrudes into the Beaufort Sea. “A fracturing event in this area is not unusual because the Beaufort Gyre tends to push ice away from Banks Island and the Canadian Archipelago,” explained Walt Meier of the National Snow & Ice Data Center (NSIDC). “Point Barrow can act like a ‘pin point’ where the ice catches and fractures to the north and east.” In February, however, a series of storms passing over central Alaska exacerbated the fracturing. Strong westerly winds prompted several large pieces of ice to break away in an arc-shaped wave that moved progressively east. By the end of February, large pieces of ice had fractured all the way to the western coast of Banks Island, a distance of about 1,000 kilometers (600 miles). The data used to create the animation came from the longwave infrared (thermal) portion of the electromagnetic spectrum, so the animation illustrates how much heat the surface was emitting as VIIRS surveyed the area. Cooler areas (sea ice) appear white, while warmer areas (open water) are dark. The light gray plume near the cracks is warmer, moister air escaping from the ocean and blowing downwind. Clouds do not show up well in the VIIRS thermal band, so the storms that fueled the fracturing are not readily visible. While fracturing events are common, few events sprawl across such a large area or produce cracks as long and wide as those seen here. The age of the sea ice in this area was one of the key reasons this event became so widespread. “The region is covered almost completely by seasonal or first-year ice—ice that has formed since last September,” said Meier. “This ice is thinner and weaker than the older, multi-year ice, so it responds more readily to winds and is more easily broken up.” NASA Earth Observatory images by Jesse Allen using VIIRS day-night band data from the Suomi National Polar-orbiting Partnership. Suomi NPP is the result of a partnership between NASA, the National Oceanic and Atmospheric Administration, and the Department of Defense. Caption by Adam Voiland. Instrument: Suomi NPP - VIIRS For more info go to: <a href="http://earthobservatory.nasa.gov/IOTD/view.php?id=80752" rel="nofollow">earthobservatory.nasa.gov/IOTD/view.php?id=80752</a> Credit: <b><a href="http://www.earthobservatory.nasa.gov/" rel="nofollow"> NASA Earth Observatory</a></b> <b><a href="http://www.nasa.gov/audience/formedia/features/MP_Photo_Guidelines.html" rel="nofollow">NASA image use policy.</a></b> <b><a href="http://www.nasa.gov/centers/goddard/home/index.html" rel="nofollow">NASA Goddard Space Flight Center</a></b> enables NASA’s mission through four scientific endeavors: Earth Science, Heliophysics, Solar System Exploration, and Astrophysics. Goddard plays a leading role in NASA’s accomplishments by contributing compelling scientific knowledge to advance the Agency’s mission. <b>Follow us on <a href="http://twitter.com/NASA_GoddardPix" rel="nofollow">Twitter</a></b> <b>Like us on <a href="http://www.facebook.com/pages/Greenbelt-MD/NASA-Goddard/395013845897?ref=tsd" rel="nofollow">Facebook</a></b> <b>Find us on <a href="http://instagram.com/nasagoddard?vm=grid" rel="nofollow">Instagram</a></b>
This highest-resolution image from NASA's New Horizons spacecraft shows how erosion and faulting has sculpted this portion of Pluto's icy crust into rugged badlands. The prominent 1.2-mile-high cliff at the top, running from left to upper right, is part of a great canyon system that stretches for hundreds of miles across Pluto's northern hemisphere. New Horizons team members think that the mountains in the middle are made of water ice, but have been modified by the movement of nitrogen or other exotic ice glaciers over long periods of time, resulting in a muted landscape of rounded peaks and intervening sets of short ridges. At the bottom of this 50-mile-wide image, the terrain transforms dramatically into a fractured and finely broken up floor at the northwest margin of the giant ice plain informally called Sputnik Planum. The top of the image is to Pluto's northwest. These images were made with the telescopic Long Range Reconnaissance Imager (LORRI) aboard New Horizons, in a timespan of about a minute centered on 11:36 UT on July 14 -- just about 15 minutes before New Horizons' closest approach to Pluto -- from a range of just 10,000 miles (17,000 kilometers). They were obtained with an unusual observing mode; instead of working in the usual "point and shoot," LORRI snapped pictures every three seconds while the Ralph/Multispectral Visual Imaging Camera (MVIC) aboard New Horizons was scanning the surface. This mode requires unusually short exposures to avoid blurring the images. http://photojournal.jpl.nasa.gov/catalog/PIA20199

The surface of Jupiter's moon Europa features a widely varied landscape, including ridges, bands, small rounded domes and disrupted spaces that geologists called "chaos terrain." This newly reprocessed image, along with two others along the same longitude (see PIA23871 and PIA23872), were taken by NASA's Galileo spacecraft on Sept. 26, 1998, and reveal details of diverse surface features on Europa. All three images were captured along the same longitude of Europa as Galileo flew by on Sept. 26, 1998, in the spacecraft's 17th orbit of Jupiter (orbit E17). It was the eighth of Galileo's 11 targeted flybys of Europa. High-resolution images were taken through a clear filter in grayscale (black and white). Using lower-resolution, color images of the same region from a different flyby (orbit E14), technicians recently mapped color onto the higher-resolution images. (Orbit E14 resulted in this global view of Europa (see PIA19048). The color information gathered on that flyby was used to reprocess these new images.) Enhanced-color images like these allow scientists to highlight geologic features with different colors, which are related to chemical compositions of the surface. Areas that appear light blue or white are made up of relatively pure water ice, and reddish areas have more non-ice materials. This image shows a region of blocky chaos terrain, where the surface has broken apart into many smaller chaos blocks that are surrounded by featureless matrix material. Many of the chaos blocks have moved sideways, rotated, or tilted before being refrozen into their new locations, and some larger blocks preserve features of the pre-existing terrain before it was broken up. Using these features as clues, scientists have been able to reconstruct some chaos regions like jjgsaw puzzles to track the motion of blocks. Cutting through the chaos terrain near the bottom, from left to right, is a broad flat band. Called Agenor Linea, it is one of the longest bands on Europa and is distinctive for its two-color appearance, with a bright region at the top and a darker region below. Another rare bright band, Katreus Linea, cuts across the top portion of this image. The image resolution is 243 yards (222 meters) per pixel, and this image depicts an area about 170 miles (280 kilometers) across. This image was produced by Mario Valenti at the SETI Institute in Mountain View, Calif. https://photojournal.jpl.nasa.gov/catalog/PIA23873
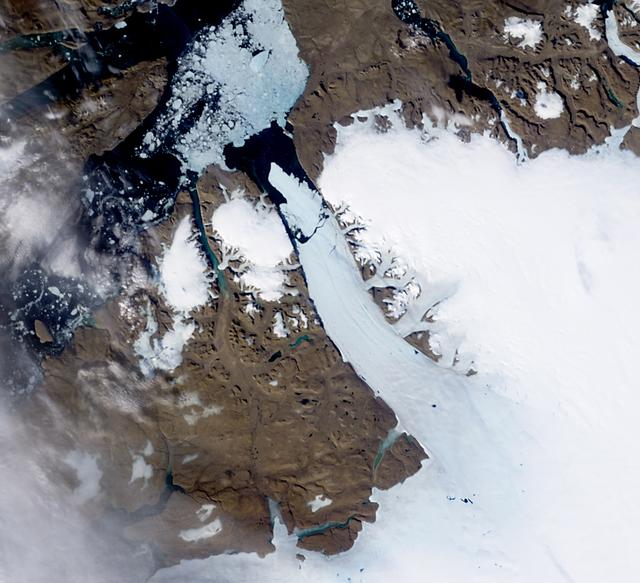
NASA image acquired August 5, 2010 On August 5, 2010, an enormous chunk of ice, roughly 97 square miles (251 square kilometers) in size, broke off the Petermann Glacier, along the northwestern coast of Greenland. The Canadian Ice Service detected the remote event within hours in near real-time data from the Moderate Resolution Imaging Spectroradiometer (MODIS) on NASA’s Aqua satellite. The Peterman Glacier lost about one-quarter of its 70-kilometer (40-mile) long floating ice shelf, said researchers who analyzed the satellite data at the University of Delaware. The Moderate Resolution Imaging Spectroradiometer (MODIS) on NASA’s Terra satellite captured these natural-color images of Petermann Glacier 18:05 UTC on August 5, 2010 (top), and 17:15 UTC on July 28, 2010 (bottom). The Terra image of the Petermann Glacier on August 5 was acquired almost 10 hours after the Aqua observation that first recorded the event. By the time Terra took this image, skies were less cloudy than they had been earlier in the day, and the oblong iceberg had broken free of the glacier and moved a short distance down the fjord. Icebergs calving off the Petermann Glacier are not unusual. Petermann Glacier’s floating ice tongue is the Northern Hemisphere’s largest, and it has occasionally calved large icebergs. The recently calved iceberg is the largest to form in the Arctic since 1962, said the University of Delaware. To read more and or to download the high res go here: <a href="http://www.nasa.gov/topics/earth/features/petermann-calve.html" rel="nofollow">www.nasa.gov/topics/earth/features/petermann-calve.html</a> or Click here to see more images from <b><a href="#//earthobservatory.nasa.gov/" rel="nofollow"> NASA Goddard’s Earth Observatory</a></b> NASA Earth Observatory image created by Jesse Allen and Robert Simmon, using data obtained from the Goddard Level 1 and Atmospheric Archive and Distribution System (LAADS). Caption by Holli Riebeek and Michon Scott. Instrument: Terra - MODIS <b><a href="http://www.nasa.gov/centers/goddard/home/index.html" rel="nofollow">NASA Goddard Space Flight Center</a></b> is home to the nation's largest organization of combined scientists, engineers and technologists that build spacecraft, instruments and new technology to study the Earth, the sun, our solar system, and the universe. <b>Follow us on <a href="http://twitter.com/NASA_GoddardPix" rel="nofollow">Twitter</a></b> <b>Join us on <a href="http://www.facebook.com/pages/Greenbelt-MD/NASA-Goddard/395013845897?ref=tsd" rel="nofollow">Facebook</a><b></b></b>
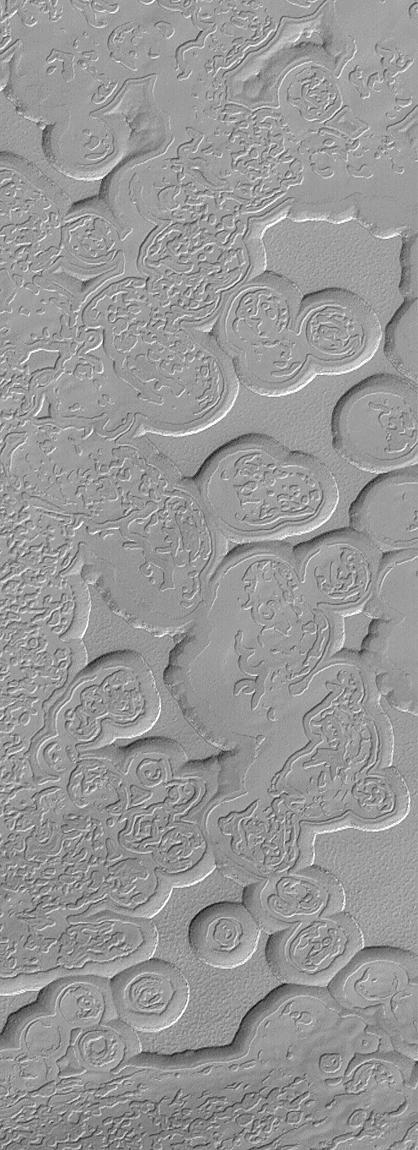
This image is illuminated by sunlight from the upper left. Looking like pieces of sliced and broken swiss cheese, the upper layer of the martian south polar residual cap has been eroded, leaving flat-topped mesas into which are set circular depressions such as those shown here. The circular features are depressions, not hills. The largest mesas here stand about 4 meters (13 feet) high and may be composed of frozen carbon dioxide and/or water. Nothing like this has ever been seen anywhere on Mars except within the south polar cap, leading to some speculation that these landforms may have something to do with the carbon dioxide thought to be frozen in the south polar region. On Earth, we know frozen carbon dioxide as "dry ice." On Mars, as this picture might be suggesting, there may be entire landforms larger than a small town and taller than 2 to 3 men and women that consist, in part, of dry ice. No one knows for certain whether frozen carbon dioxide has played a role in the creation of the "swiss cheese" and other bizarre landforms seen in this picture. The picture covers an area 3 x 9 kilometers (1.9 x 5.6 miles) near 85.6°S, 74.4°W at a resolution of 7.3 meters (24 feet) per pixel. This picture was taken by the Mars Global Surveyor (MGS) Mars Orbiter Camera (MOC) during early southern spring on August 3, 1999. http://photojournal.jpl.nasa.gov/catalog/PIA02367
The surface of Jupiter's moon Europa features a widely varied landscape, including ridges, bands, small rounded domes and disrupted spaces that geologists called "chaos terrain." This newly reprocessed image, along with two others along the same longitude (see PIA23872 and PIA23873), were taken by NASA's Galileo spacecraft on Sept. 26, 1998, and reveal details of diverse surface features on Europa. All three images were captured along the same longitude of Europa as Galileo flew by on Sept. 26, 1998, in the spacecraft's 17th orbit of Jupiter (orbit E17). It was the eighth of Galileo's 11 targeted flybys of Europa. High-resolution images were taken through a clear filter in grayscale (black and white). Using lower-resolution, color images of the same region from a different flyby (orbit E14), technicians recently mapped color onto the higher-resolution images. (Orbit E14 resulted in this global view of Europa (see PIA19048). The color information gathered on that flyby was used to reprocess these new images.) Enhanced-color images like these allow scientists to highlight geologic features with different colors, which are related to chemical compositions of the surface. Areas that appear light blue or white are made up of relatively pure water ice, and reddish areas have more non-ice materials. This image shows a transitional location between blocky chaos terrain, on the left, and ridged plains on the right. A few chaos blocks are visible on the left as individually broken and rotated pieces of preexisting surface material; their shadows indicate that some of these blocks have tilted as well. A ridge passes through the center of this image. These ridges, which contain arc-shaped segments joined together by a series of cusps, may be related to how the icy surface crust of Europa fractures when subjected to stresses from Jupiter's strong gravity. The right side of this image shows a few lenticulae, which are small rounded surface features, commonly domed in appearance. The image resolution is 247 yards (226 meters per pixel, and this image depicts an area about 180 miles (300 kilometers) across. The image was produced by Mario Valenti at the SETI Institute in Mountain View, Calif. https://photojournal.jpl.nasa.gov/catalog/PIA23871
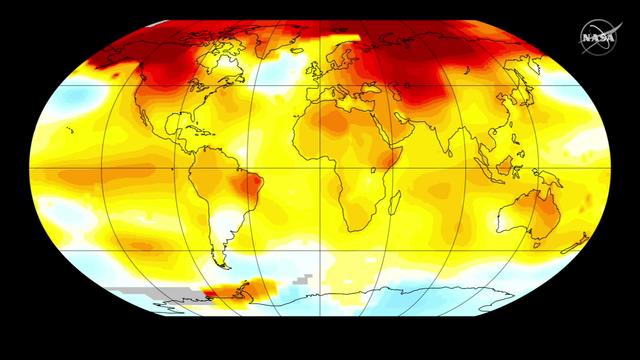
Two key climate change indicators -- global surface temperatures and Arctic sea ice extent -- have broken numerous records through the first half of 2016, according to NASA analyses of ground-based observations and satellite data. Each of the first six months of 2016 set a record as the warmest respective month globally in the modern temperature record, which dates to 1880, according to scientists at NASA's Goddard Institute for Space Studies (GISS) in New York. The six-month period from January to June was also the planet's warmest half-year on record, with an average temperature 1.3 degrees Celsius (2.4 degrees Fahrenheit) warmer than the late nineteenth century. Read more: <a href="http://go.nasa.gov/29SQngq" rel="nofollow">go.nasa.gov/29SQngq</a> Credit: NASA/Goddard <b><a href="http://www.nasa.gov/audience/formedia/features/MP_Photo_Guidelines.html" rel="nofollow">NASA image use policy.</a></b> <b><a href="http://www.nasa.gov/centers/goddard/home/index.html" rel="nofollow">NASA Goddard Space Flight Center</a></b> enables NASA’s mission through four scientific endeavors: Earth Science, Heliophysics, Solar System Exploration, and Astrophysics. Goddard plays a leading role in NASA’s accomplishments by contributing compelling scientific knowledge to advance the Agency’s mission. <b>Follow us on <a href="http://twitter.com/NASAGoddardPix" rel="nofollow">Twitter</a></b> <b>Like us on <a href="http://www.facebook.com/pages/Greenbelt-MD/NASA-Goddard/395013845897?ref=tsd" rel="nofollow">Facebook</a></b> <b>Find us on <a href="http://instagrid.me/nasagoddard/?vm=grid" rel="nofollow">Instagram</a></b>

ISS034-E-057550 (28 Feb. 2013) --- One of the Expedition 34 crew members aboard the Earth-orbiting International Space Station photographed this image featuring the Southern High Plains of northwestern Texas, directly south of the city of Amarillo (off the image to the north). At first glance the picture appears more like a map than an actual photo. The winter of 2012-2013 has been marked by powerful snowstorms with record-setting snowfall throughout much of the Midwestern United States The snowstorm that passed through this area left a record snowfall of approximately 43 centimeters (17 inches). Snow blankets the city of Canyon, Texas. Urban street grids and stream channels appear etched into the landscape by the snow, a result of both melting and street clearing in the urban regions and of the incised nature of stream channels in the surrounding plains. Agricultural fields are easily identified due to the even snow cover broken only by roadways between the fields. Palo Duro Canyon is largely free of snow along the Prairie Dog Town Fork of the Red River channel and at lower elevations, allowing the red sedimentary rocks of the canyon walls to be visible. Lake Tanglewood, a reservoir to the northeast of Canyon, appears dark due to a lack of ice cover. Another dark region to the northwest of Canyon is a feed yard for cattle; any snowfall in this area has been removed by the actions of the livestock. The image was recorded with a digital camera using a 400 millimeter lens,