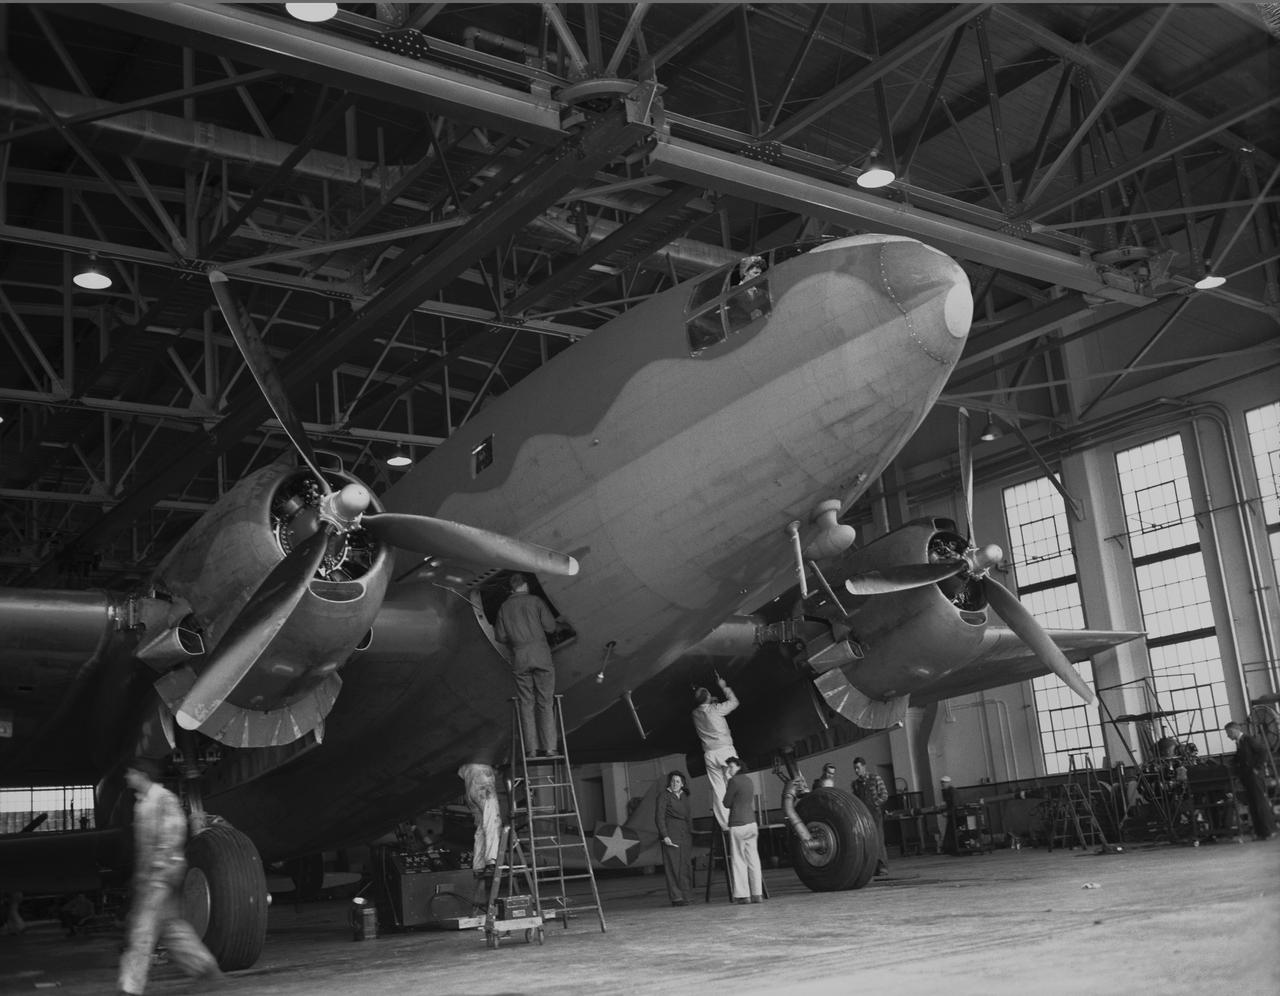
Ames mechanics working on C-46 airplane in front of hangar
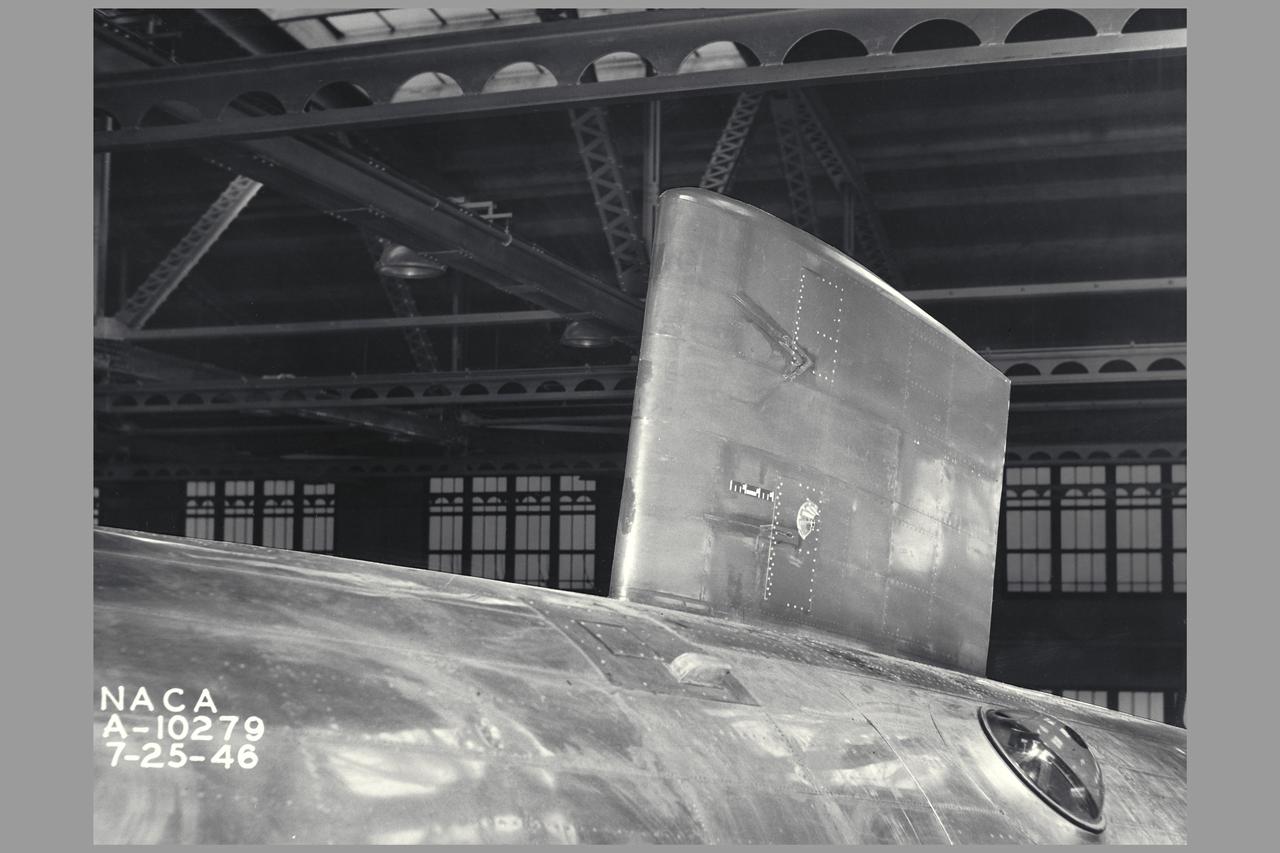
NACA Photographer Electrically heated airfoil - wing glove on C-46 airplane

NACA Photographer Electrically heated airfoil - wing glove on C-46 airplane
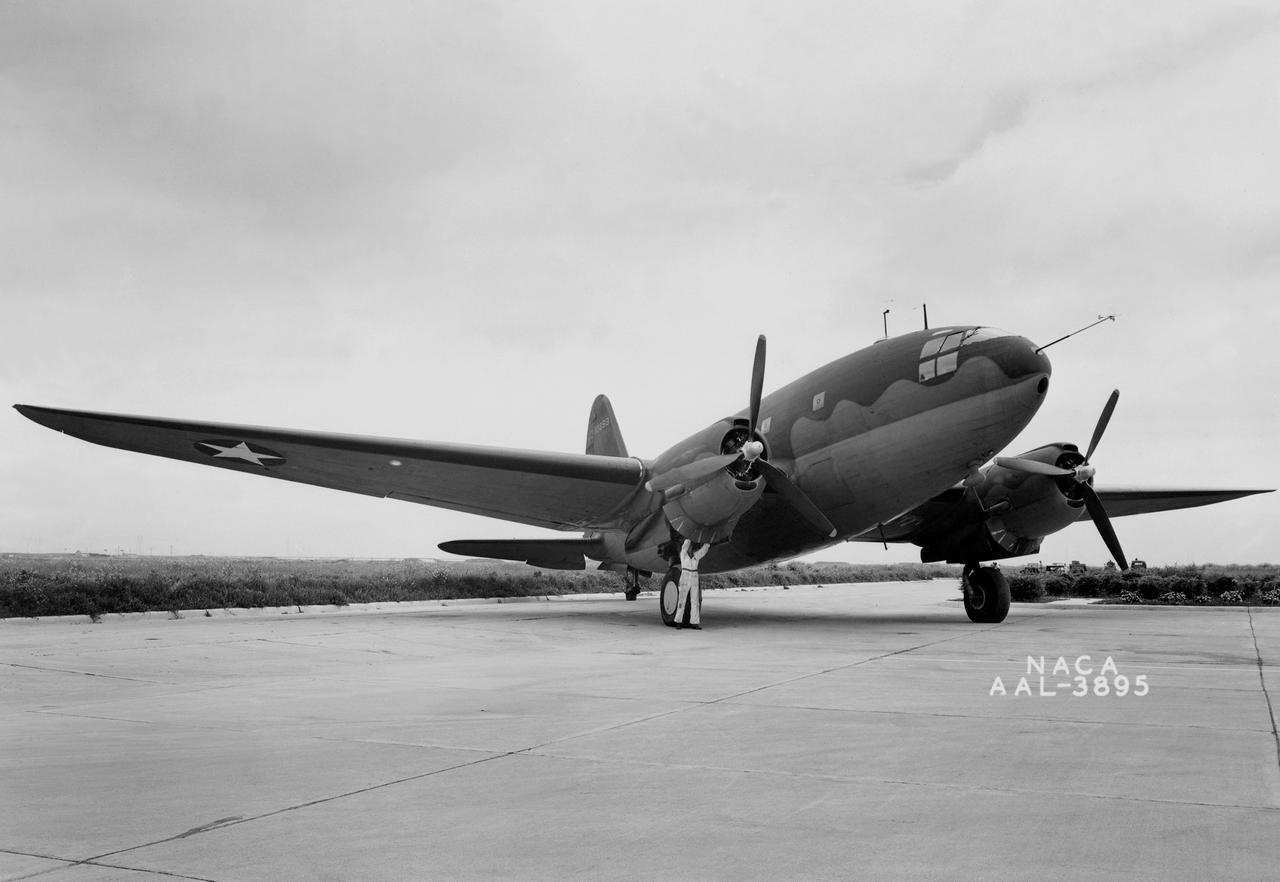
NACA Photographer 3/4 front view Curtiss C-46 airplane in which the thermal ice-prevention equipment was installed
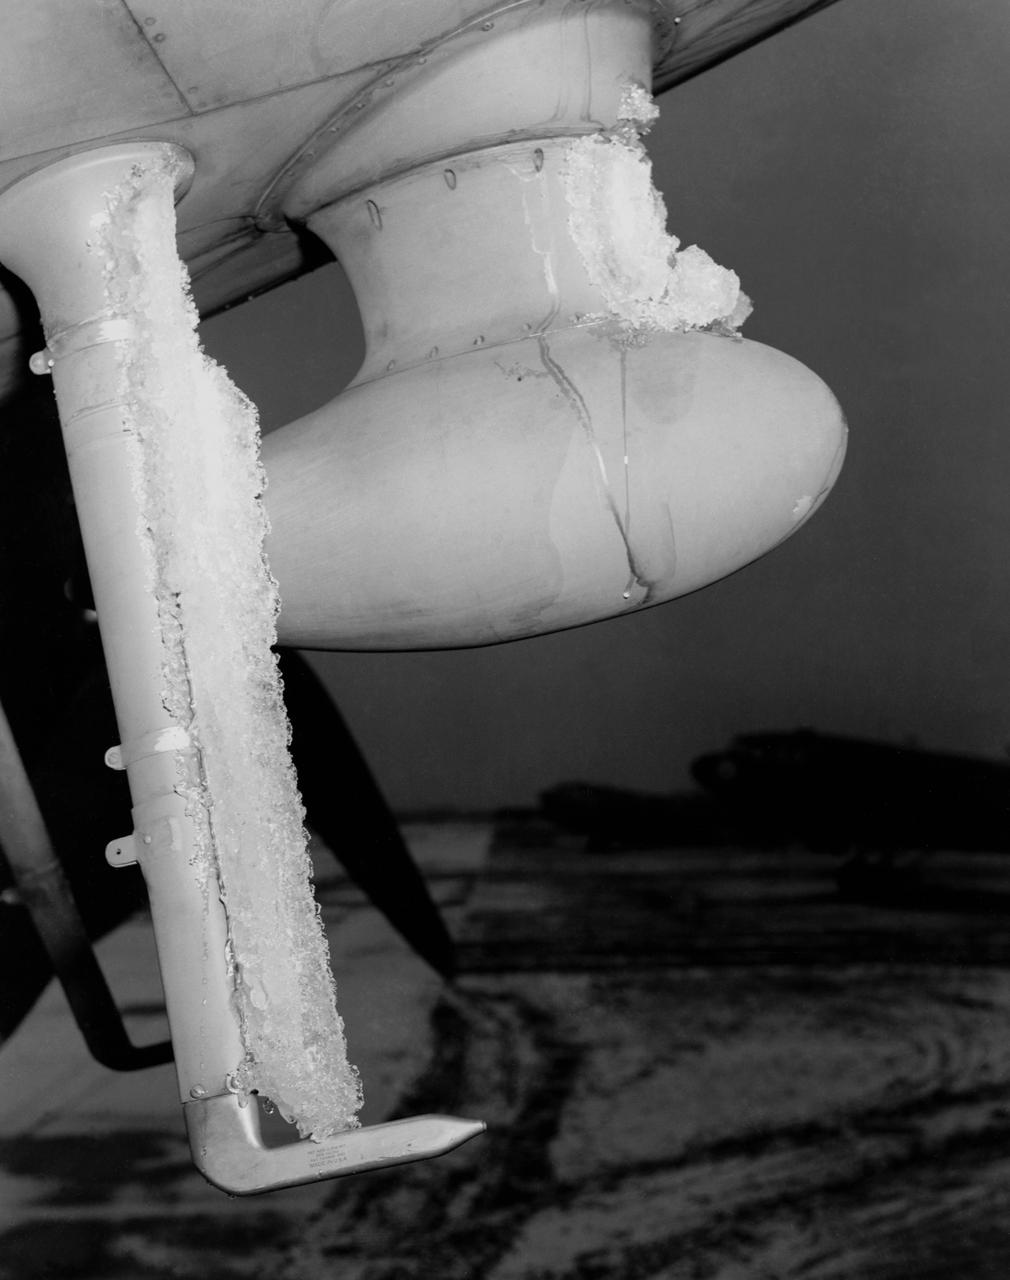
De-icing Research conducted at the NASA Ames Research Center. Icing flight test on C-46 airplane (flight 29 11:25am to 12:50 am) glaze ice on loop antenna co-pilots airspeed mast.
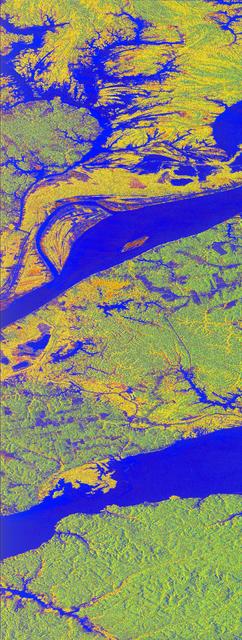
This false-color L-band image of the Manaus region of Brazil was acquired by NASA Spaceborne Imaging Radar-C and X-Band Synthetic Aperture Radar SIR-C/X-SAR aboard the space shuttle Endeavour on orbit 46 of the mission.
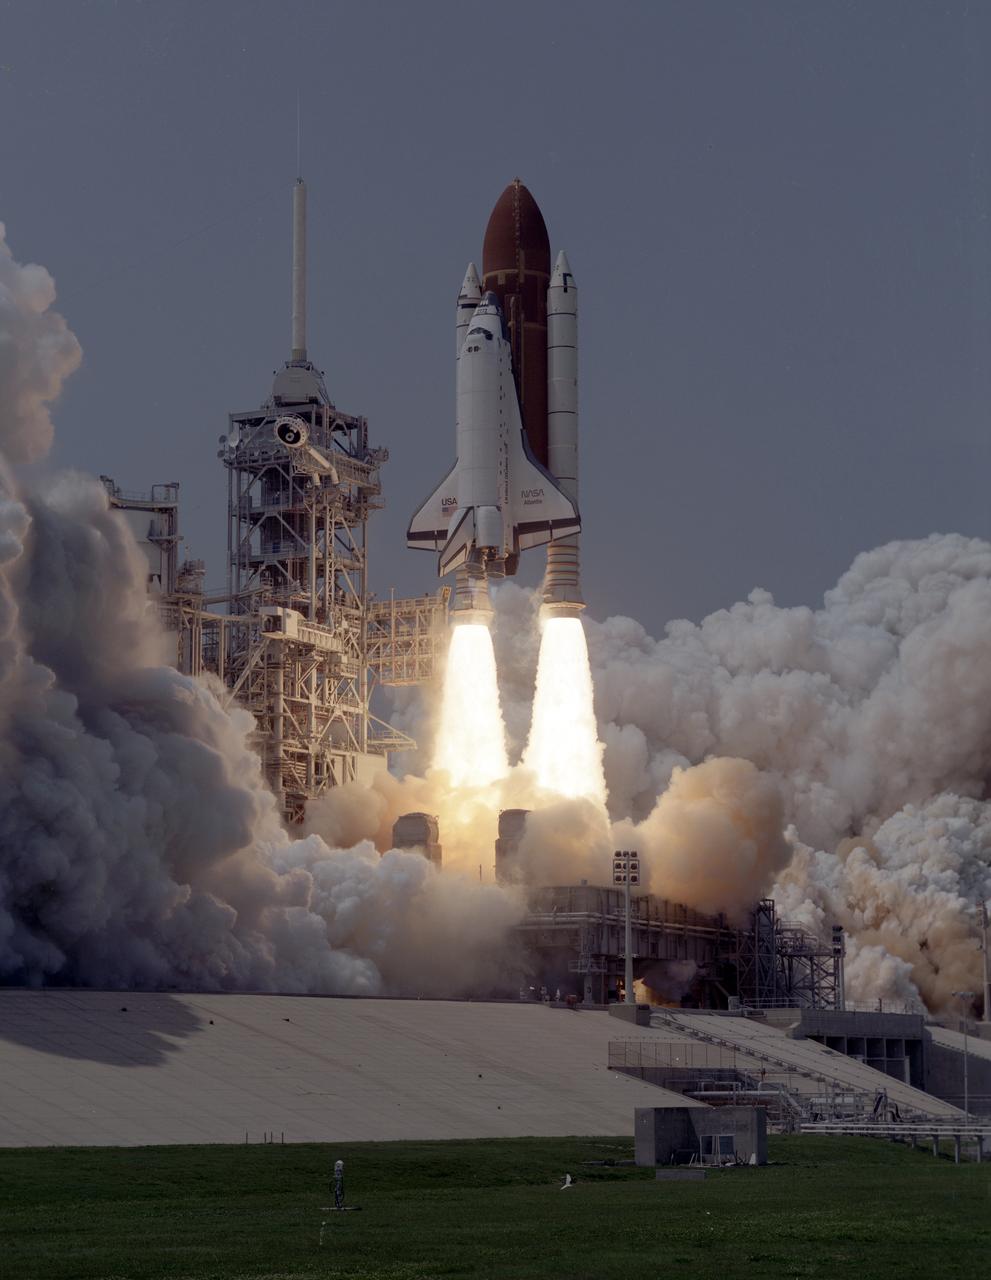
The STS-30 mission launched aboard the Space Shuttle Atlantis on May 4, 1989 at 2:46:59pm (EDT) carrying a crew of five. Aboard were Ronald J. Grabe, pilot; David M. Walker, commander; and mission specialists Norman E. Thagard, Mary L. Cleave, and Mark C. Lee. The primary payload for the mission was the Magellan/Venus Radar mapper spacecraft and attached Inertial Upper Stage (IUS).

Five astronauts composed the STS-30 crew. Pictured (left to right) are Ronald J. Grabe, pilot; David M. Walker, commander; and mission specialists Norman E. Thagard, Mary L. Cleave, and Mark C. Lee. The STS-30 mission launched aboard the Space Shuttle Atlantis on May 4, 1989 at 2:46:59pm (EDT). The primary payload was the Magellan/Venus Radar mapper spacecraft and attached Inertial Upper Stage (IUS).
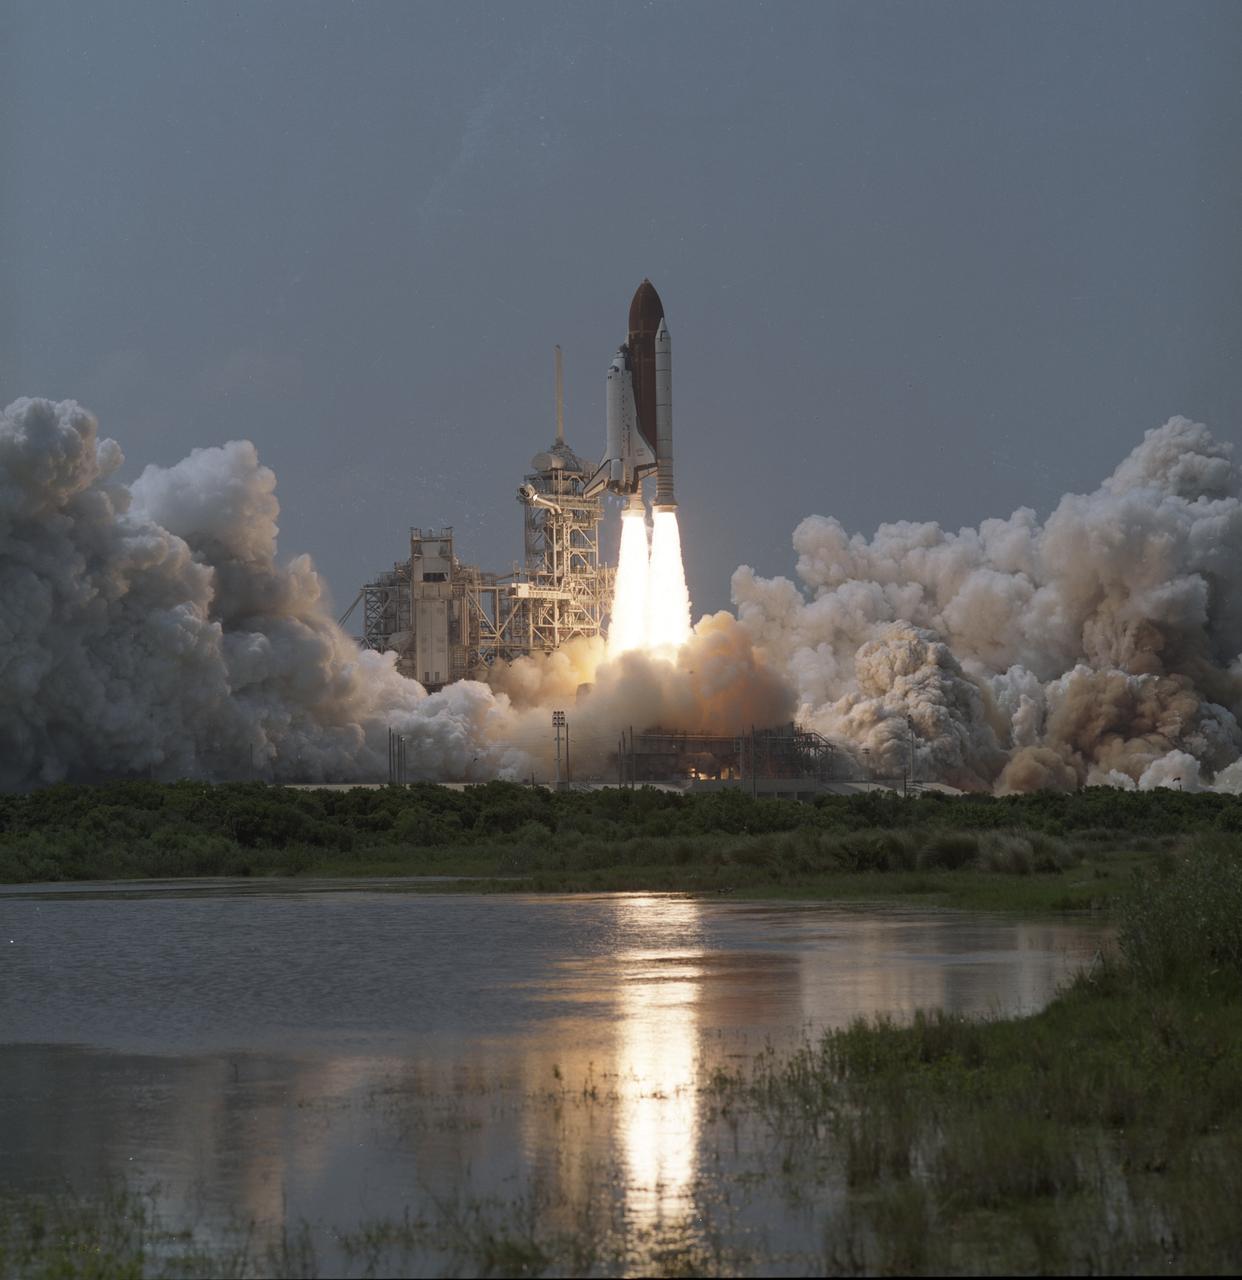
STS030-S-108 (4 May 1989) --- Backdropped against slight gray Florida skies, Space Shuttle Atlantis heads for a four-day mission in earth orbit with five astronaut crewmembers aboard. Onboard were astronauts David. M. Walker, Ronald J. Grabe, Norman E. Thagard, Mary L. Cleave and Mark C. Lee. Launch occurred at 2:46:58 P.M. (EDT), May 4, 1989.
The STS-30 mission launched aboard the Space Shuttle Atlantis on May 4, 1989 at 2:46:59pm (EDT) carrying a crew of five. Aboard were Ronald J. Grabe, pilot; David M. Walker, commander; and mission specialists Norman E. Thagard, Mary L. Cleave, and Mark C. Lee. The primary payload for the mission was the Magellan/Venus Radar mapper spacecraft and attached Inertial Upper Stage (IUS).

The STS-30 mission launched aboard the Space Shuttle Atlantis on May 4, 1989 at 2:46:59pm (EDT) carrying a crew of five. Aboard were Ronald J. Grabe, pilot; David M. Walker, commander; and mission specialists Norman E. Thagard, Mary L. Cleave, and Mark C. Lee. The primary payload for the mission was the Magellan/Venus Radar mapper spacecraft and attached Inertial Upper Stage (IUS).
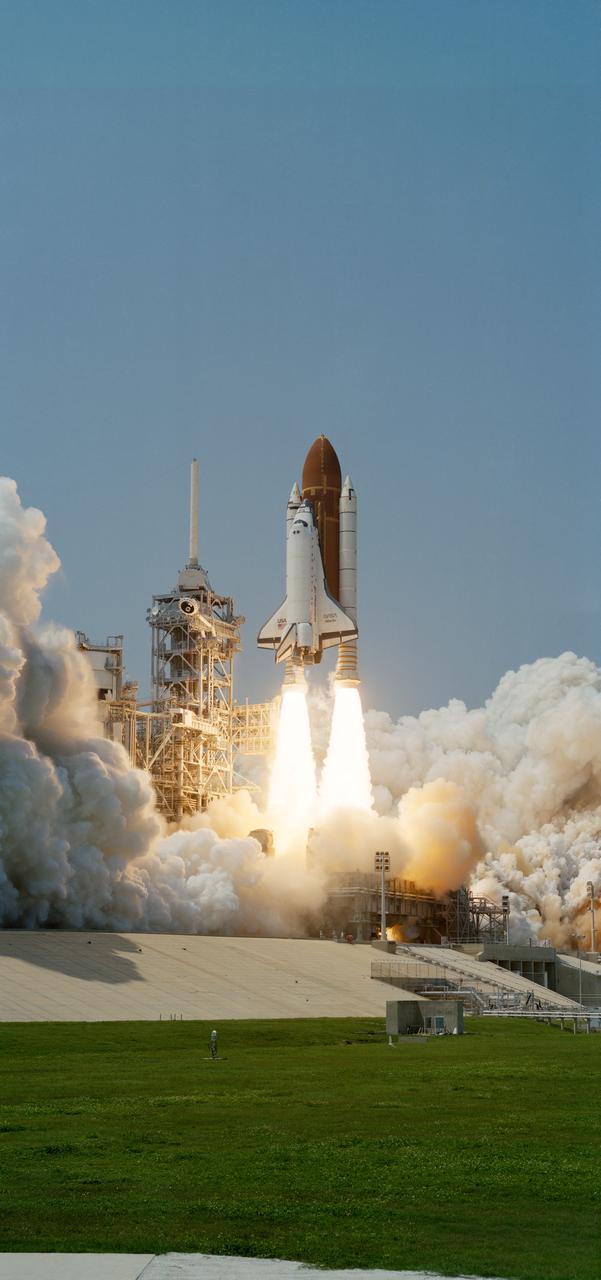
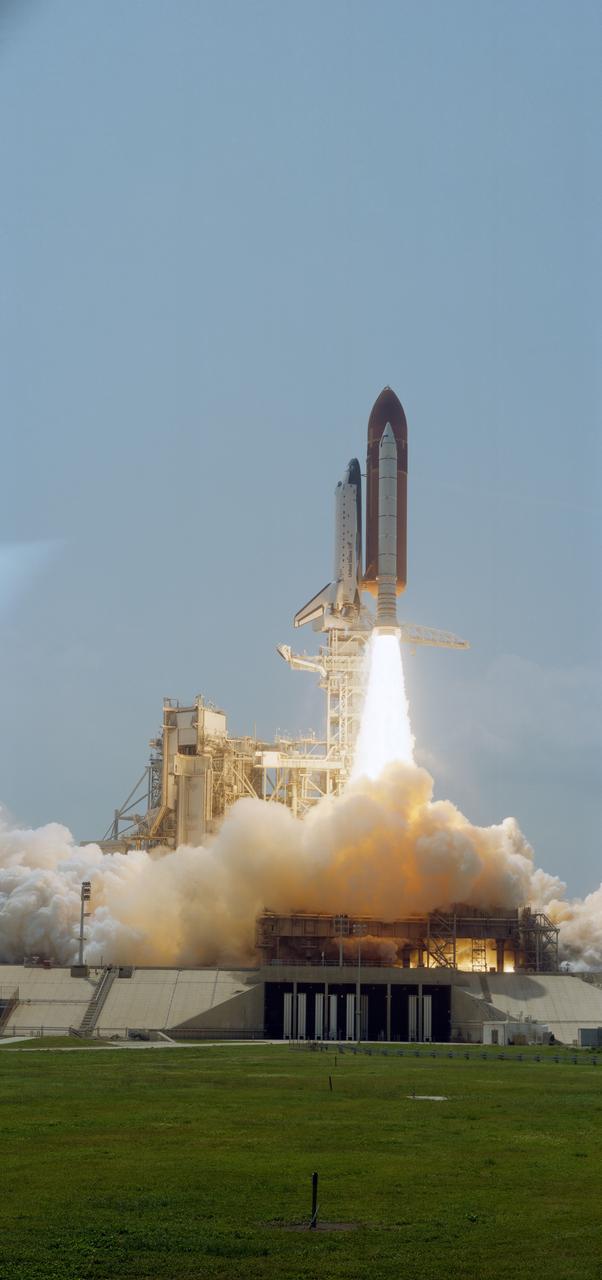
STS030-S-109 (4 May 1989) --- Moments after ignition, Space Shuttle Atlantis heads for a four-day mission in Earth-orbit with five astronaut crew members aboard. Onboard were astronauts David M. Walker, Ronald. J. Grabe, Norman E. Thagard, Mary L. Cleave and Mark C. Lee. Launch occurred at 2:46:58 p.m. (EDT), May 4, 1989.

National Advisory Committee for Aeronautics (NACA) design engineers added the Icing Research Tunnel to the new Aircraft Engine Research Laboratory’s original layout to take advantage of the massive refrigeration system being constructed for the Altitude Wind Tunnel. The Icing Research Tunnel was built to study the formation of ice on aircraft surfaces and methods of preventing or eradicating that ice. Ice buildup adds extra weight, effects aerodynamics, and sometimes blocks airflow through engines. The Icing Research Tunnel is a closed-loop atmospheric wind tunnel with a 6- by 9-foot test section. The tunnel can produce speeds up to 300 miles per hour and temperatures from about 30 to –45⁰ F. Initially the tunnel used a spray bar system to introduce moisture into the airstream. NACA engineers struggled for nearly 10 years to perfect the spray system. The Icing Research Tunnel began testing in June of 1944. Initial testing, seen in this photograph, studied ice accumulation on propellers of a military aircraft. NACA reserach also produced a protected air scoop for the C–46 transport aircraft. A large number of C–46 aircraft were lost due to icing while flying supply runs over the Himalayas during World War II.

STS047-46-027 (12-20 Sept. 1992) --- Astronauts N. Jan Davis (left) and Mae C. Jemison, STS-47 mission specialists, prepare to deploy the Lower Body Negative Pressure (LBNP) apparatus in this 35mm frame photographed in the Science Module aboard the Earth-orbiting Space Shuttle Endeavour. Making their first flight in space, the two were joined by four other NASA astronauts and a Japanese payload specialist for eight days of research. The Spacelab-J mission is a joint effort between Japan and the United States of America.
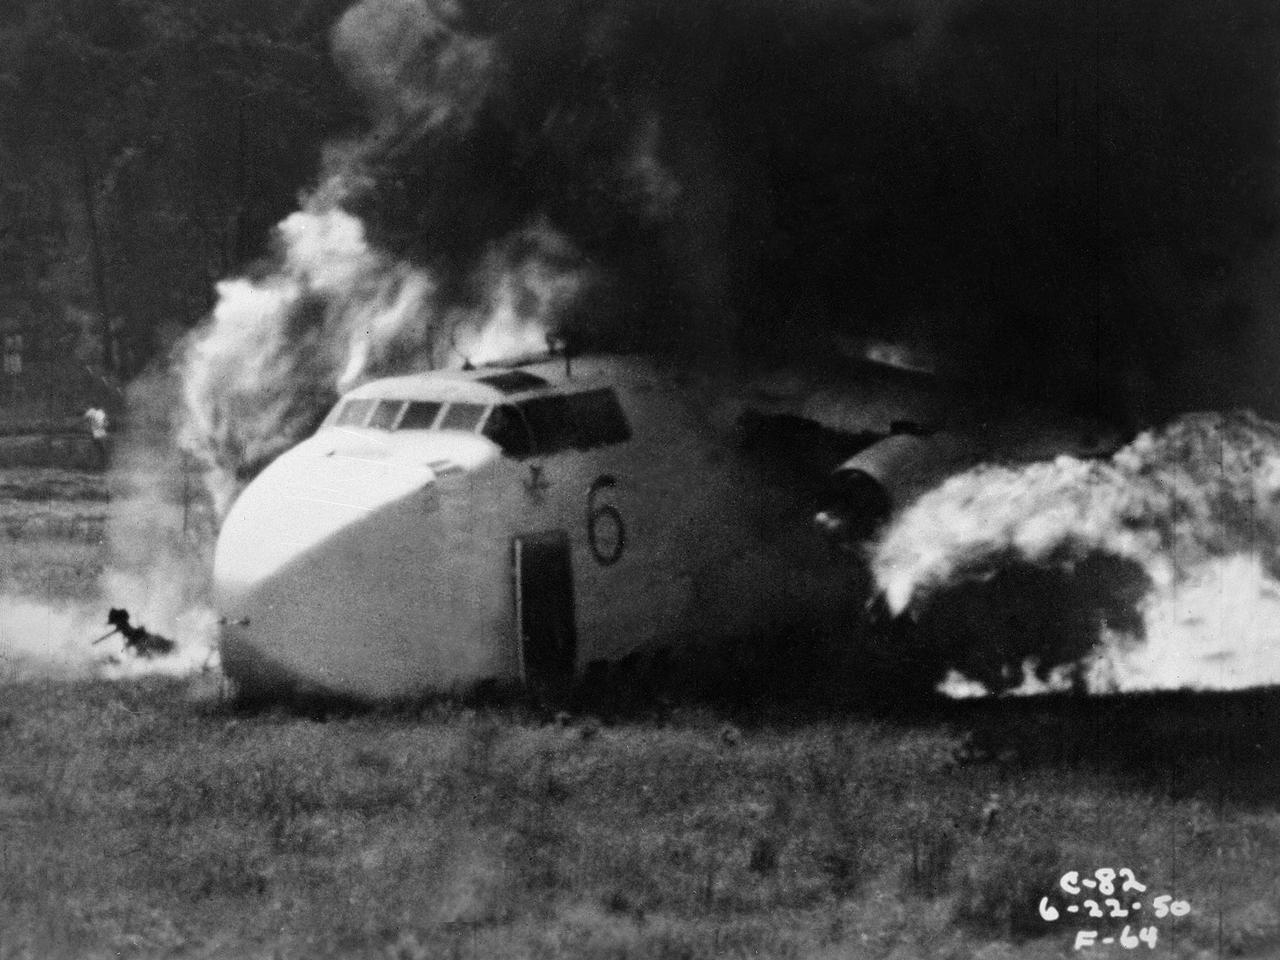
Researchers at the National Advisory Committee for Aeronautics (NACA) Lewis Flight Propulsion Laboratory purposely crash a Fairchild C-82 Packet aircraft to study flame propagation. A rash of passenger aircraft crashes in 1946 and 1947 spurred a White House call for an investigatory board staffed by members of the Civil Aeronautics Board, military, and the NACA. The group addressed fire segregation, extinguishment, and prevention. The NACA established a Subcommittee on Aircraft Fire Prevention in February 1948 to coordinate its efforts. The Lewis team simulated situations in which an aircraft failed to become airborne during takeoff resulting in crashes into embankments and other objects. The Lewis researchers initially used surplus C-46 and C-82 military transport planes. In these situations, the aircraft generally suffered damage to its fuel system and other components, but was structurally survivable. The aircraft were mounted to a rail that ran down a 1700-foot long test runway. The aircraft was secured at the starting point with an anchor pier so it could get its engines up to takeoff speed before launching down the track. Barriers at the end of the runway were designed to simulate a variety of different types of crashes. Telemetry and high-speed cameras were crucial elements in these studies. The preliminary testing phase identified potential ignition sources and analyzed the spread of flammable materials.
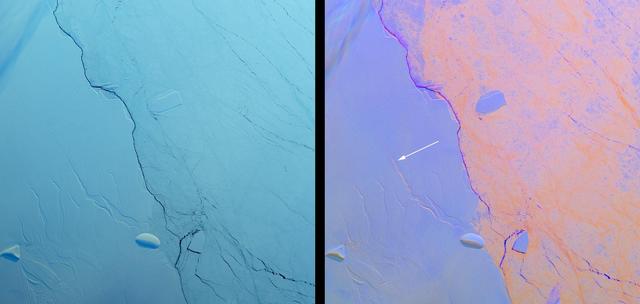
Project MIDAS, a United Kingdom-based group that studies the Larsen Ice Shelf in Antarctica, reported Aug. 18, 2016, that a large crack in the Larsen C shelf has grown by another 13 miles (22 kilometers) in the past six months. The crack is now more than 80 miles (130 kilometers) long. Larsen C is the fourth largest ice shelf in Antarctica, with an area of about 19,300 square miles (50,000 square kilometers), greater than the size of Maryland. Computer modeling by Project MIDAS predicts that the crack will continue to grow and eventually cause between nine and twelve percent of the ice shelf to collapse, resulting in the loss of 2,300 square miles (6,000 square kilometers) of ice -- more than the area of Delaware. This follows the collapse of the Larsen B shelf in 2002 and the Larsen A shelf in 1995, which removed about 1,255 square miles (3,250 square kilometers) and 580 square miles (1,500 square kilometers) of ice, respectively. The Multiangle Imaging SpectroRadiometer (MISR) instrument aboard NASA's Terra satellite flew over Larsen C on Aug. 22, 2016. The MISR instrument views Earth with nine cameras pointed at different angles, which provides information about the texture of the surface. On the left is a natural-color image of the shelf from MISR's vertical-viewing camera. Antarctica is slowly emerging from its polar night, and the low light gives the scene a bluish tint. The Larsen C shelf is on the left, while thinner sea ice is present on the right. A variety of cracks are visible in the Larsen C shelf, all appearing roughly the same. The image is about 130 by 135 miles (210 by 220 kilometers) in size. On the right is a composite image made by combining data from MISR's 46-degree backward-pointing camera (plotted as blue), the vertical-pointing camera (plotted as green), and the 46-degree forward-pointing camera (plotted as red). This has the effect of highlighting surface roughness; smooth surfaces appear as blue-purple, while rough surfaces appear as orange. Clouds near the upper left appear multi-hued because their elevation above the surface causes the different angular views to be slightly displaced. In this composite, the difference between the rough sea ice and the smoother ice shelf is immediately apparent. An examination of the cracks in the ice shelf shows that the large crack Project MIDAS is tracking (indicated by an arrow) is orange in color, demonstrating that it is actively growing. These data were acquired during Terra orbit 88717 http://photojournal.jpl.nasa.gov/catalog/PIA20894
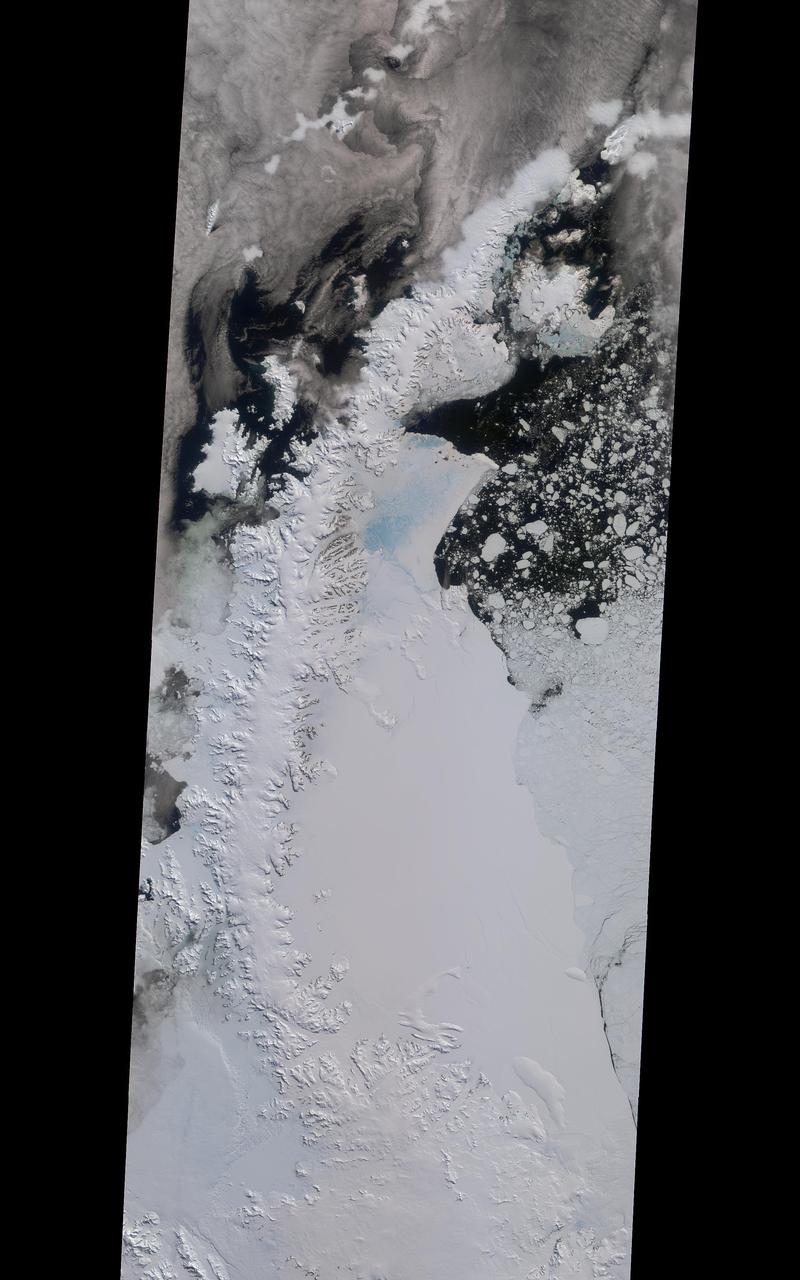
A rift in Antarctica's Larsen C ice shelf has grown to 110 miles (175 km) long, making it inevitable that an iceberg larger than Rhode Island will soon calve from the ice shelf. Larsen C is the fourth largest ice shelf in Antarctica, with an area of almost 20,000 square miles (50,000 square kilometers). The calving event will remove approximately 10 percent of the ice shelf's mass, according to the Project for Impact of Melt on Ice Shelf Dynamics and Stability (MIDAS), a UK-based team studying the ice shelf. Only 12 miles (20 km) of ice now separates the end of the rift from the ocean. The rift has grown at least 30 miles (50 km) in length since August, but appears to be slowing recently as Antarctica returns to polar winter. Project MIDAS reports that the calving event might destabilize the ice shelf, which could result in a collapse similar to what occurred to the Larsen B ice shelf in 2002. The Multi-angle Imaging SpectroRadiometer (MISR) instrument aboard NASA's Terra satellite captured views of Larsen C on August 22, 2016, when the rift was 80 miles (130 km) in length; December 8, 2016, when the rift was approximately 90 miles (145 km) long; and April 6, 2017. The MISR instrument has nine cameras, which view the Earth at different angles. The overview image, from December 8, shows the entire Antarctic Peninsula -- home to Larsen A, B, and C ice shelves -- in natural color (similar to how it would appear to the human eye) from MISR's vertical-viewing camera. Combining information from several MISR cameras pointed at different angles gives information about the texture of the ice. The accompanying GIF depicts the inset area shown on the larger image and displays data from all three dates in false color. These multiangular views -- composited from MISR's 46-degree backward-pointing camera, the nadir (vertical-viewing) camera, and the 46-degree forward-pointing camera -- represent variations in ice texture as changes in color, such that areas of rough ice appear orange and smooth ice appears blue. The Larsen C shelf is on the left in the GIF, bordered by the Weddell Sea on the upper right. The ice within the rift is orange, indicating movement, and the end of the rift can be tracked across the shelf between images. In addition, between December and April, the rift widened, pushing the future iceberg away from the shelf at its southern end. These data were acquired during Terra orbits 88717, 90290 and 92023. https://photojournal.jpl.nasa.gov/catalog/PIA21581
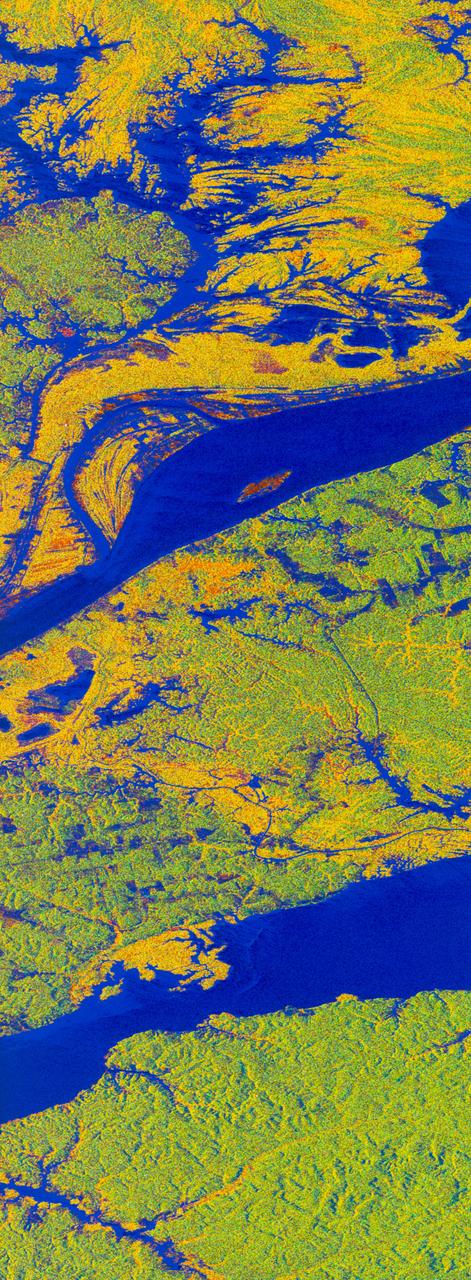
STS059-S-068 (13 April 1994) --- This false-color L-Band image of the Manaus region of Brazil was acquired by the Spaceborne Imaging Radar-C and X-Band Synthetic Aperture Radar (SIR-C/X-SAR) aboard the Space Shuttle Endeavour on orbit 46 of the mission. The area shown is approximately 8 kilometers by 40 kilometers (5 by 25 miles). At the top of the image are the Solimoes and Rio Negro Rivers just before they combine at Manaus to form the Amazon River. The image is centered at about 3 degrees south latitude, and 61 degrees west longitude. The false colors are created by displaying three L-Band polarization channels; red areas correspond to high backscatter at HH polarization, while green areas exhibit high backscatter at HV polarization. Blue areas show low returns at VV polarization; hence the bright blue colors of the smooth river surfaces. Using this color scheme, green areas in the image are heavily forested, while blue areas are either cleared forest or open water. The yellow and red areas are flooded forest. Between Rio Solimoes and Rio Negro a road can be seen running from some cleared areas (visible as blue rectangles north of Rio Solimoes) north towards a tributary of Rio Negro. SIR-C/X-SAR is part of NASA's Mission to Planet Earth (MTPE). SIR-C/X-SAR radars illuminate Earth with microwaves allowing detailed observations at any time, regardless of weather or sunlight conditions. SIR-C/X-SAR uses three microwave wavelengths: L-Band (24 cm), C-Band (6 cm), and X-Band (3 cm). The multi-frequency data will be used by the international scientific community to better understand the global environment and how it is changing. The SIR-C/X-SAR data, complemented by aircraft and ground studies, will give scientists clearer insights into those environmental changes which are caused by nature and those changes which are induced by human activity. SIR-C was developed by NASA's Jet Propulsion Laboratory (JPL). X-SAR was developed by the Dornire and Alenia Spazio Companies for the German Space Agency, Deutsche Agentur fuer Raumfahrtangelegenheiten (DARA), and the Italian Space Agency, Agenzia Spaziale Italiana (ASI). JPL Photo ID: P-43895
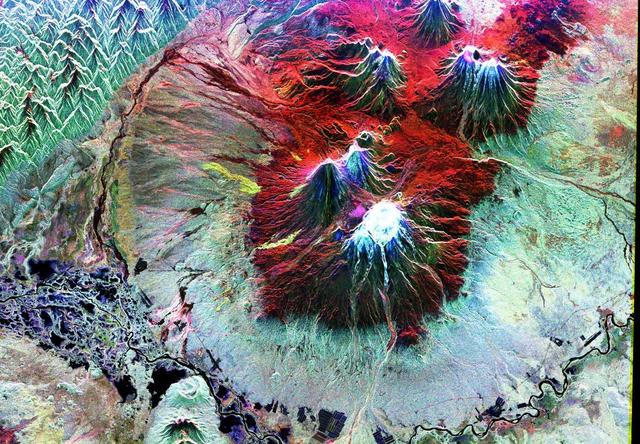
This is an image of the area of Kliuchevskoi volcano, Kamchatka, Russia, which began to erupt on September 30, 1994. Kliuchevskoi is the blue triangular peak in the center of the image, towards the left edge of the bright red area that delineates bare snow cover. The image was acquired by the Spaceborne Imaging Radar-C/X-band Synthetic Aperture Radar (SIR-C/X-SAR) aboard the space shuttle Endeavour on its 88th orbit on October 5, 1994. The image shows an area approximately 75 kilometers by 100 kilometers (46 miles by 62 miles) that is centered at 56.07 degrees north latitude and 160.84 degrees east longitude. North is toward the bottom of the image. The radar illumination is from the top of the image. The Kamchatka volcanoes are among the most active volcanoes in the world. The volcanic zone sits above a tectonic plate boundary, where the Pacific plate is sinking beneath the northeast edge of the Eurasian plate. The Endeavour crew obtained dramatic video and photographic images of this region during the eruption, which will assist scientists in analyzing the dynamics of the recent activity. The colors in this image were obtained using the following radar channels: red represents the L-band (horizontally transmitted and received); green represents the L-band (horizontally transmitted and vertically received); blue represents the C-band (horizontally transmitted and vertically received). In addition to Kliuchevskoi, two other active volcanoes are visible in the image. Bezymianny, the circular crater above and to the right of Kliuchevskoi, contains a slowly growing lava dome. Tolbachik is the large volcano with a dark summit crater near the upper right edge of the red snow covered area. The Kamchatka River runs from right to left across the bottom of the image. The current eruption of Kliuchevskoi included massive ejections of gas, vapor and ash, which reached altitudes of 15,000 meters (50,000 feet). Melting snow mixed with volcanic ash triggered mud flows on the flanks of the volcano. Paths of these flows can be seen as thin lines in various shades of blue and green on the north flank in the center of the image. http://photojournal.jpl.nasa.gov/catalog/PIA01765

Five NASA astronauts and two cosmonauts representing the Russian Aviation and Space Agency take a break in training from their scheduled September 2000 visit to the International Space Station (ISS). Astronauts Terrence W. Wilcutt (right front), and Scott D. Altman (left front) are mission commander and pilot, respectively. On the back row (from the left) are mission specialists Boris V. Morukov, cosmonaut, along with astronauts Richard A. Mastracchio, Edward T. Lu, and Daniel C. Burbank, and cosmonaut Yuri I. Malenchenko. Morukov and Malenchenko represent the Russian Aviation and Space Agency. Launched aboard the Space Shuttle Atlantis on September 8, 2000 at 7:46 a.m. (CDT), the STS-106 crew successfully prepared the International Space Station (ISS) for occupancy. Acting as plumbers, movers, installers and electricians, they installed batteries, power converters, a toilet and a treadmill on the outpost. They also delivered more than 2,993 kilograms (6,600 pounds) of supplies. Lu and Malenchenko performed a space walk to connect power, and data and communications cables to the newly arrived Zvezda Service Module and the Station.
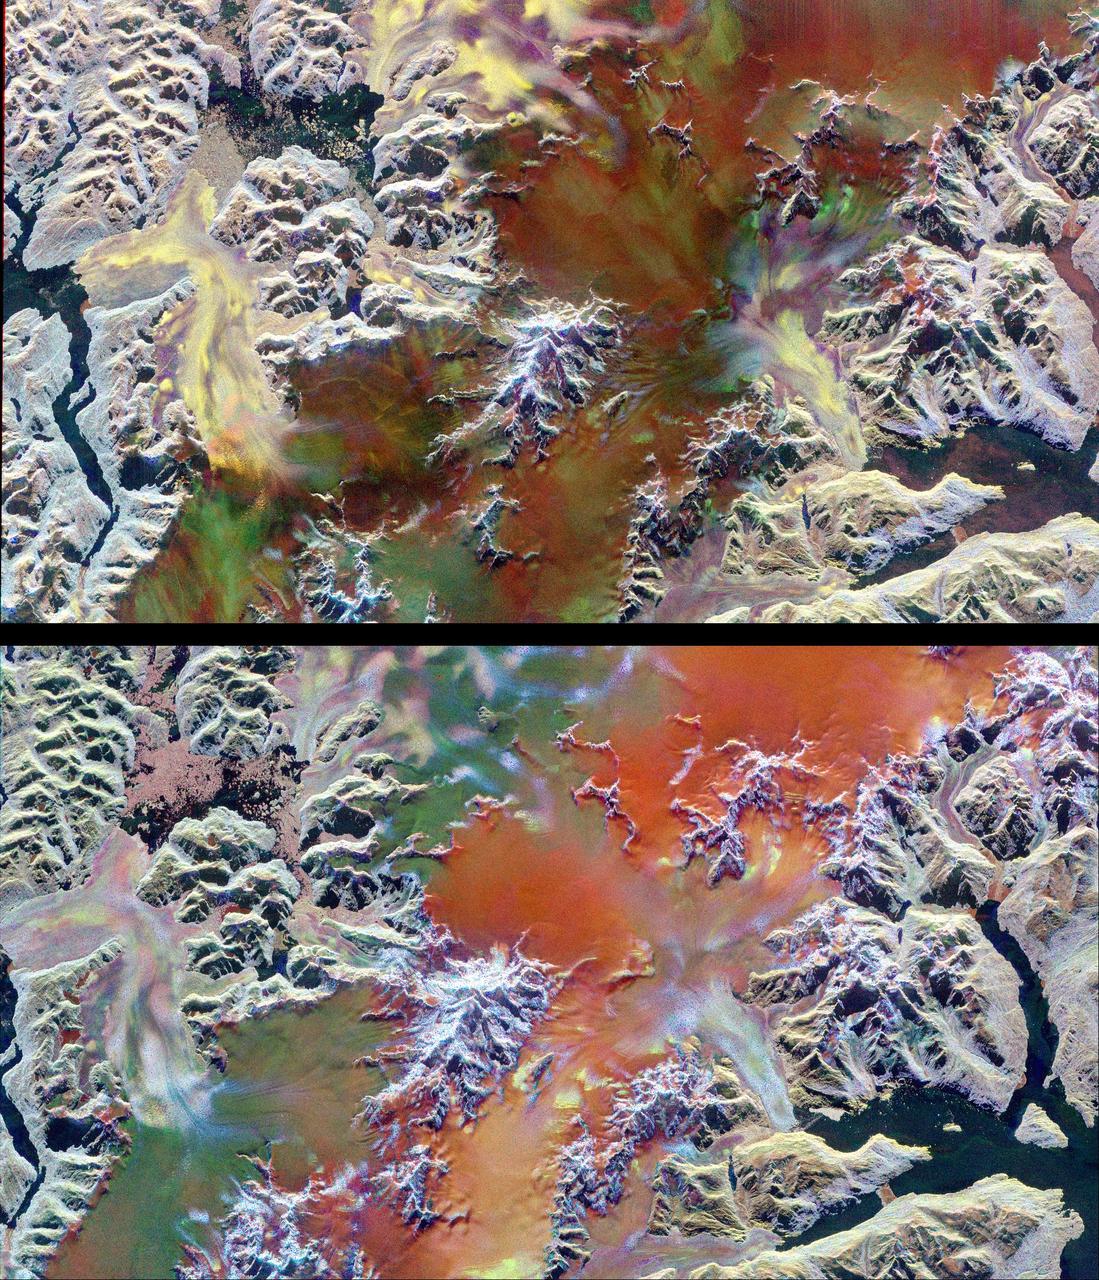
This pair of images illustrates the ability of multi-parameter radar imaging sensors such as the Spaceborne Imaging Radar-C/X-band Synthetic Aperture radar to detect climate-related changes on the Patagonian ice fields in the Andes Mountains of Chile and Argentina. The images show nearly the same area of the south Patagonian ice field as it was imaged during two space shuttle flights in 1994 that were conducted five-and-a-half months apart. The images, centered at 49.0 degrees south latitude and 73.5degrees west longitude, include several large outlet glaciers. The images were acquired by SIR-C/X-SAR on board the space shuttle Endeavour during April and October 1994. The top image was acquired on April 14, 1994, at 10:46 p.m. local time, while the bottom image was acquired on October 5,1994, at 10:57 p.m. local time. Both were acquired during the 77th orbit of the space shuttle. The area shown is approximately 100 kilometers by 58 kilometers (62 miles by 36 miles) with north toward the upper right. The colors in the images were obtained using the following radar channels: red represents the C-band (horizontally transmitted and received); green represents the L-band (horizontally transmitted and received); blue represents the L-band (horizontally transmitted and vertically received). The overall dark tone of the colors in the central portion of the April image indicates that the interior of the ice field is covered with thick wet snow. The outlet glaciers, consisting of rough bare ice, are the brightly colored yellow and purple lobes which terminate at calving fronts into the dark waters of lakes and fiords. During the second mission the temperatures were colder and the corresponding change in snow and ice conditions is readily apparent by comparing the images. The interior of the ice field is brighter because of increased radar return from the dryer snow. The distinct green/orange boundary on the ice field indicates an abrupt change in the structure of the snowcap, a direct indication of the steep meteorological gradients known to exist in this region. The bluer color of the outlet glaciers is probably due to a thin snow cover. A portion of the terminus of the outlet glacier at the top left center of the images has advanced approximately 600 meters (1,970 feet) in the five-and-a-half months between the two missions. Because of the persistent cloud cover this observation was only possible by using the orbiting, remote imaging radar system. http://photojournal.jpl.nasa.gov/catalog/PIA01778
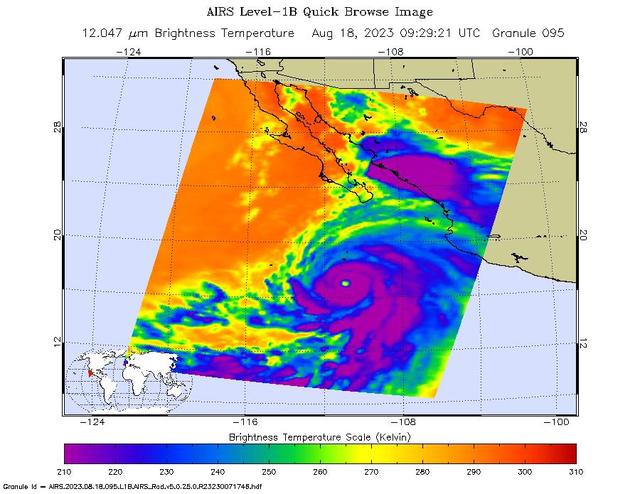
NASA's Atmospheric Infrared Sounder (AIRS) captured Hurricane Hilary on the morning of Aug. 18, 2023, when it was a Category 4 storm roughly 470 miles (760 kilometers) south of Baja California. Hilary could be the first tropical storm to make landfall in California since 1939, according to the National Weather Service. Hilary grew from a tropical storm into a Category 2 hurricane within 24 hours on Aug. 17. Another period of rapid intensification – an increase in maximum sustained wind speed of at least 30 knots (35 mph) within 24 hours – occurred Aug. 17-18. The animation shows some of this rapid growth, with images taken by AIRS Aug. 15-18. This intensification was driven by very warm ocean surface waters and weak wind shear, a term for vertical changes in wind speed. Strong wind shear can keep hurricanes from forming, or can tear them apart. AIRS measures cloud temperatures in infrared wavelengths, which can reveal information about the atmosphere not visible to the human eye. Hilary shows several indicators of a powerful hurricane: a well-defined eye surrounded by a ring of very cold clouds in purple, with warmer outer regions seen in yellows and oranges. Purple and violet areas are colder, between about minus 82 degrees Fahrenheit and minus 46 F (minus 63 degrees Celsius to minus 44 C). Blue and green regions are roughly minus 28 F to 26 F (minus 33 C to minus 3 C). The cooler parts of the clouds are associated with very heavy rainfall. Most hurricanes in the Pacific Ocean off Mexico travel westward, following tropical trade winds. Occasionally, one of these storms will head northward. Hurricane Hilary is being steered by a weak low-pressure system off the coast of California, an area normally dominated by high pressure and an atmospheric circulation pattern that would deflect storms from the region. The current forecast from the National Hurricane Center has Hilary closely following the western coastline of the Baja California peninsula, weakening as it moves north. Rainfall projections for Southern California range from 2 inches (5 centimeters) in coastal areas to 8 or more inches (20 or more centimeters) in local mountains. For comparison, San Diego and Los Angeles receive no rain in August most years, and the wettest parts of the local mountains receive about 1 inch (3 centimeters) of rain over a normal summer. In conjunction with the Advanced Microwave Sounding Unit (AMSU), AIRS senses emitted infrared and microwave radiation from Earth to provide a 3D look at the planet's weather and climate. Working in tandem, the two instruments make simultaneous observations down to Earth's surface. With more than 2,000 channels sensing different regions of the atmosphere, the system creates a global, 3D map of atmospheric temperature and humidity, cloud amounts and heights, greenhouse gas concentrations, and many other atmospheric phenomena. Launched into Earth orbit in 2002 aboard NASA's Aqua spacecraft, the AIRS and AMSU instruments are managed by NASA's Jet Propulsion Laboratory in Southern California, under contract to NASA. JPL is a division of Caltech. Animation available at https://photojournal.jpl.nasa.gov/catalog/PIA25779