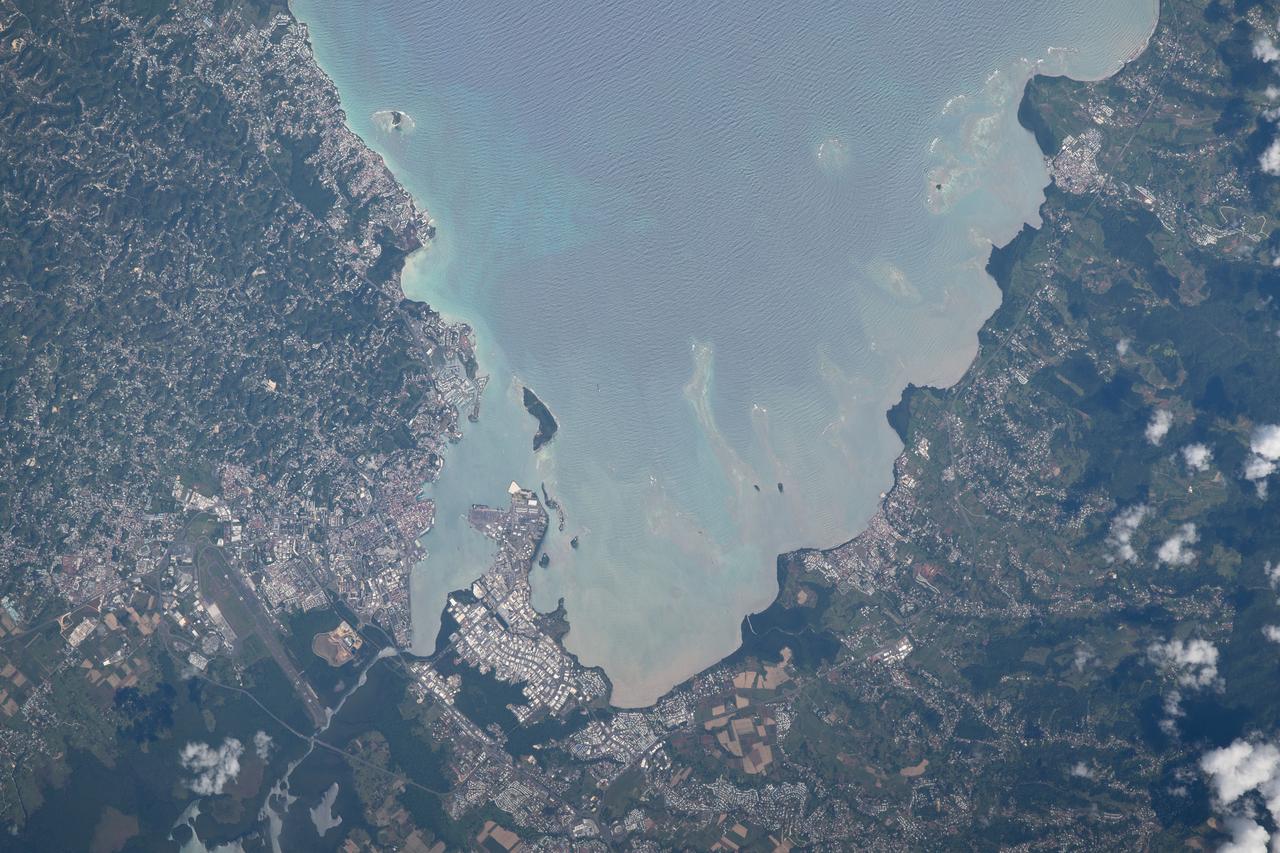
iss063e002083 (April 22, 2020) --- Baie-Mahault (bottom center) is a city in the French overseas region of Guadeloupe, an island group in the southern Caribbean Sea.
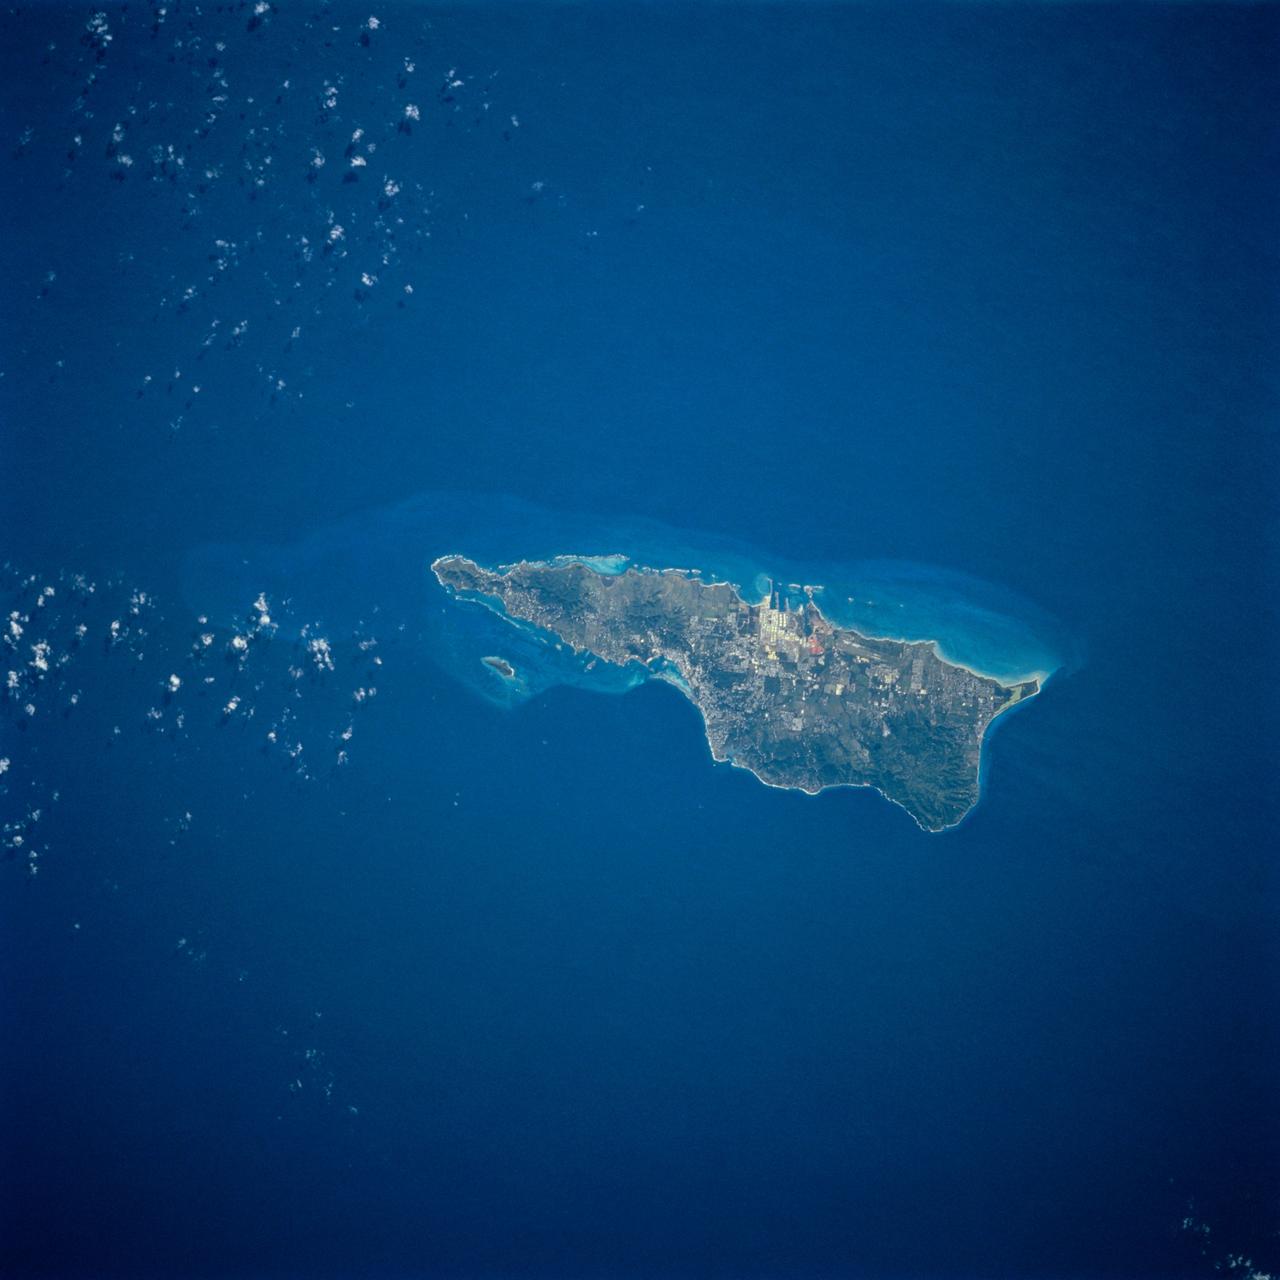
STS054-74-049 (13-19 Jan. 1993) --- St. Croix is the largest, and most industrial of the U.S. Virgin Islands. This photograph captures St. Croix's features in great detail. The large industrial complex in the middle of the southern shore is the world's largest petroleum refinery. The main city, Christiansted, can be seen across the island on the north shore. The reefs around the eastern end of St. Croix are preserved as a submarine national park -- Buck Island Reef National Park -- around the small island off the north shore of the eastern end of St. Croix.
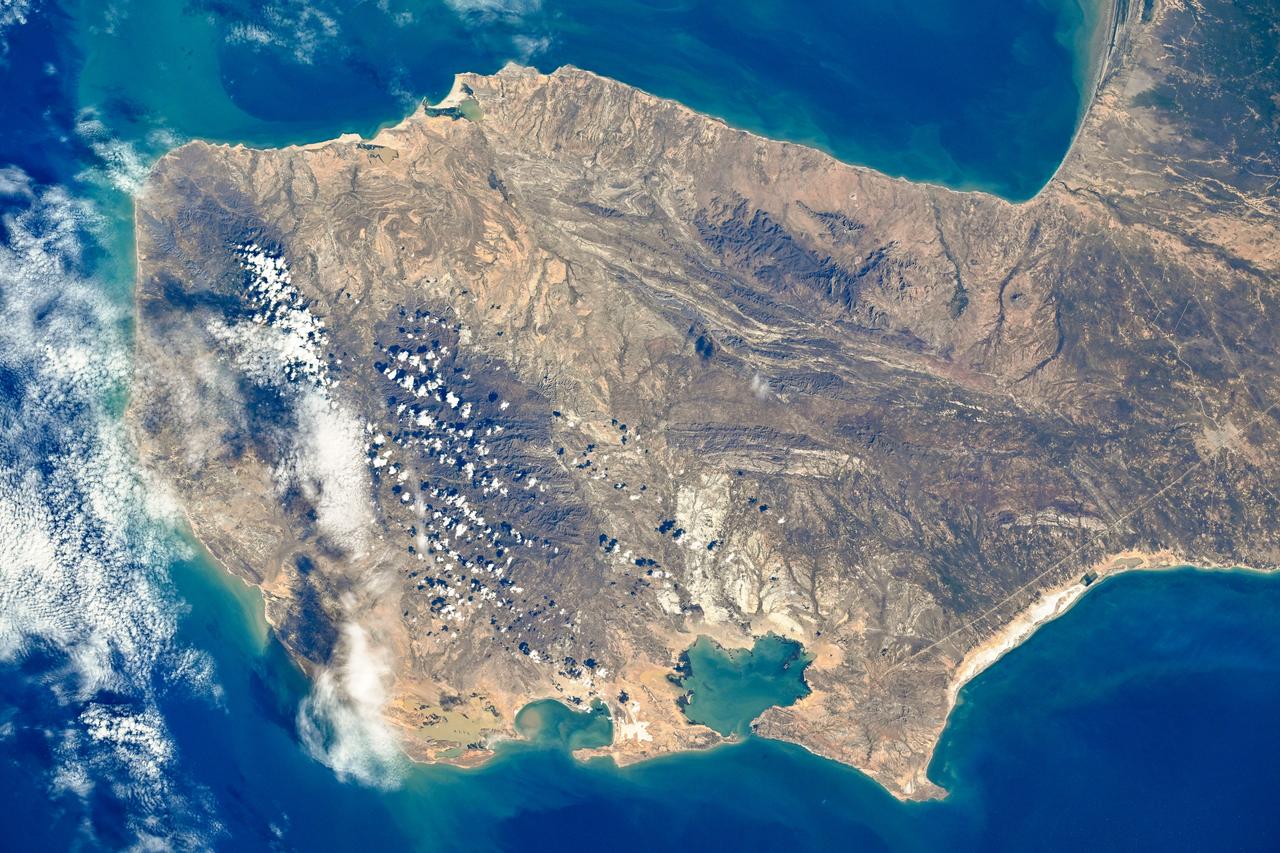
iss073e0379768 (July 20, 2025) --- Colombia's La Guajira Peninsula on the Caribbean Sea, with its desert region and beautiful coastline, is pictured from the International Space Station as it orbited 258 miles above.
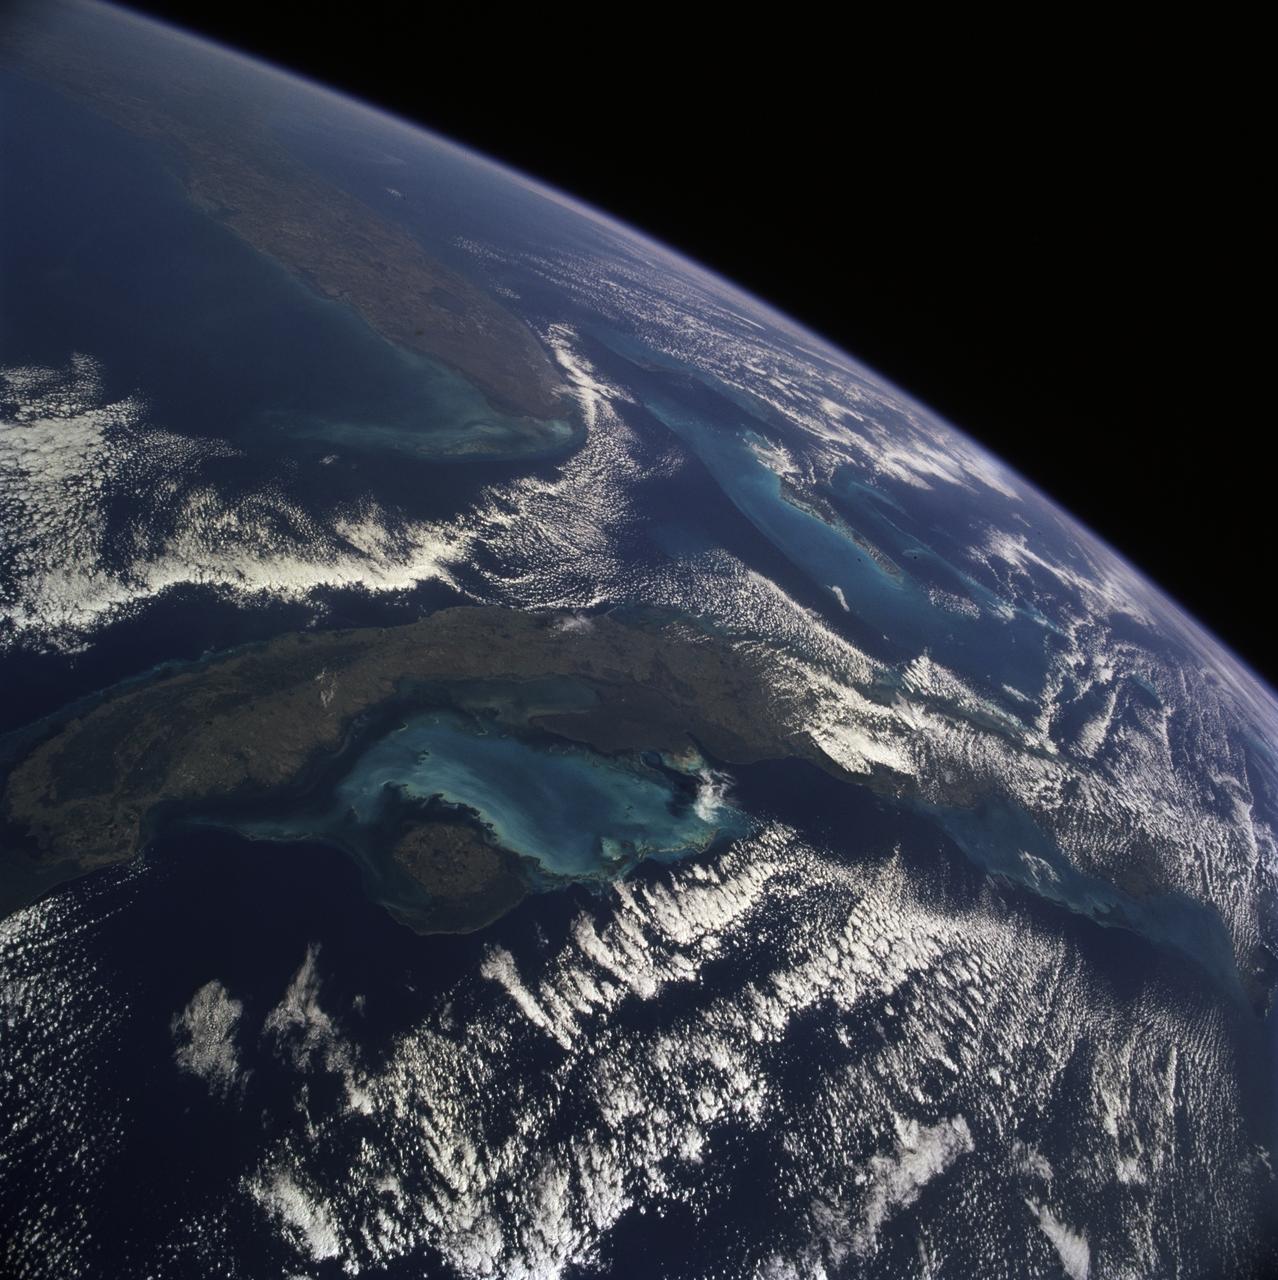
STS081-711-009 (12-22 Jan. 1997) --- As photographed with a 70mm handheld camera from the Earth-orbiting Space Shuttle Atlantis, this image provides a northeastward panorama of the Florida peninsula, the northern Bahamas and Cuba as well as a synoptic view of the northern Caribbean region. Lake Okeechobee and the urban region around Miami are the two key visual points in Florida. The turquoise shallow water platforms around the Florida Keys, the Bahamas, and south of Cuba contrast with the deep blue color of the deeper channels which separate Florida from Cuba and the Bahamas. Offshore breezes keep the coastal areas clear of clouds.
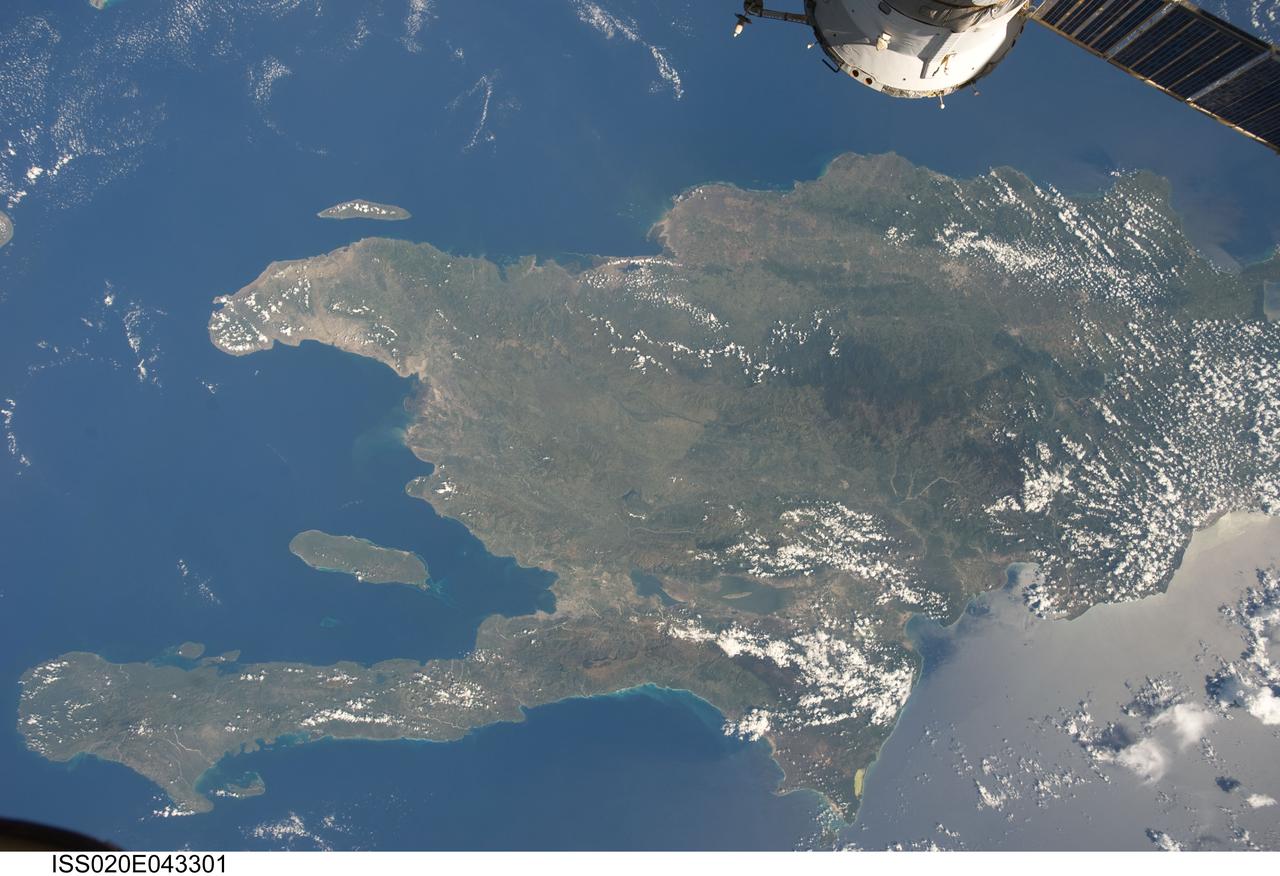
ISS020-E-043301 (28 Sept. 2009) ?-- A view of the Caribbean island of Hispaniola from the International Space Station. This island is comprised of Haiti (in the center left of the image) and the Dominican Republic and is part of the Greater Antilles island chain which lies along the geological boarder of the North America Plate and the Caribbean Plate. A major fault line in the region, Enriquillo-Plantain Garden Fault, runs along the longer peninsula, in the foreground, and just south of Port-Au-Prince. Part of a docked Russian spacecraft can be seen in the foreground. The epicenter of the recent disastrous earthquake occurred near this fault. This image was taken by the Expedition 20 crew on the International Space Station on Sept. 28, 2009 using a 25 mm lens setting.

International Space University (ISU) and Singularity University (SU) Emerging Space Nations Panel held at NASA's Ames Research Center 2009 host site. (From let to right) The panel moderator, Ray Williamson, ISU SSP09 distinguished lecturer and exectuive director of the Secure World Foundation and panelsists Sergio Camacho, secretary genreal, Regional Center for Space Science and Tecnology Education fo rLatin America and the Caribbean, and Nicole Jordan, associate liaison for space prizes for the X Prize Foundation, Playa Vista, Calif., prepare before the discussion begins.
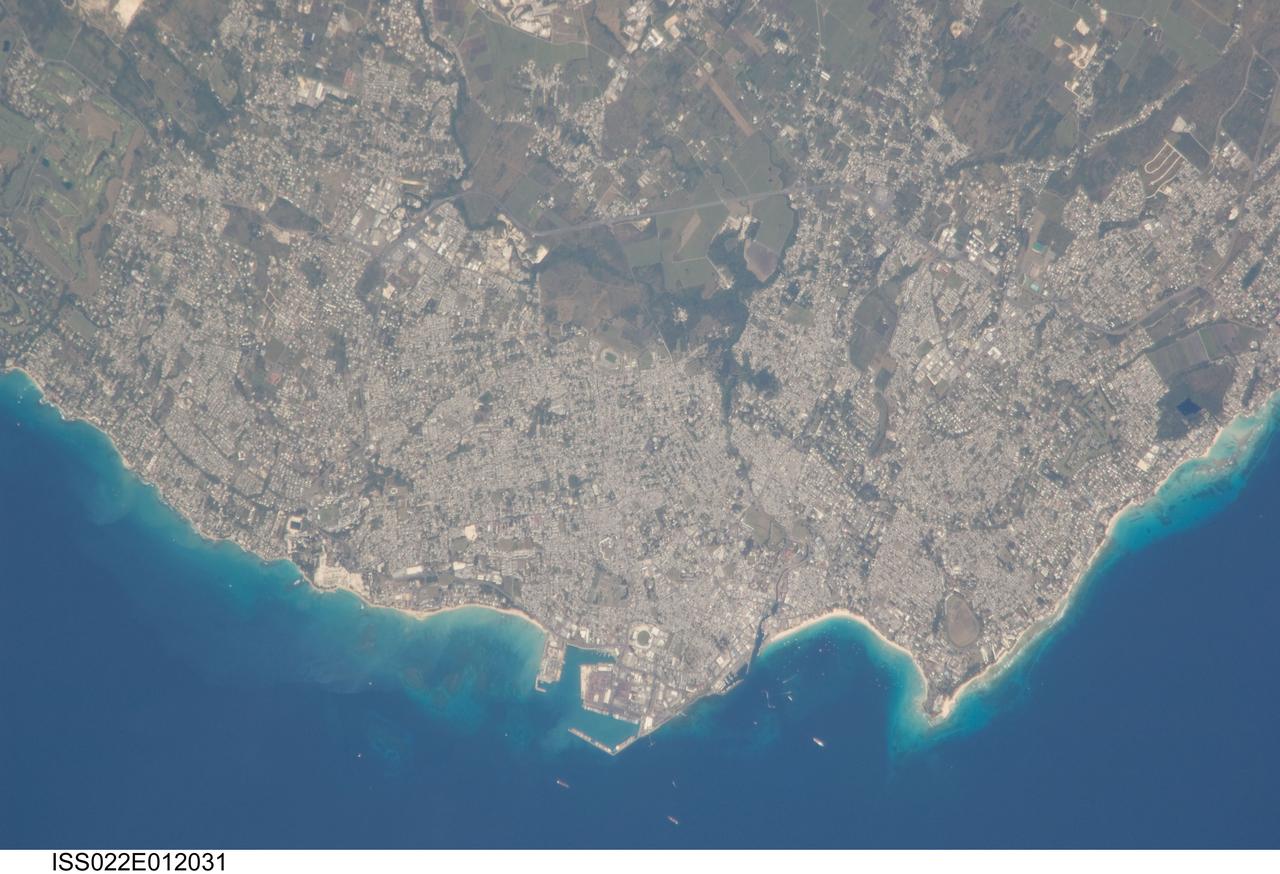
ISS022-E-012031 (16 Dec. 2009) --- Greater Bridgetown area, Barbados is featured in this image photographed by an Expedition 22 crew member on the International Space Station. Bridgetown is the capital city of the island nation of Barbados, located to the east of the Lesser Antilles Island chain. While Barbados is considered to be part of the Lesser Antilles, it is located within the western Atlantic Ocean rather than the Caribbean Sea region. Bridgetown is the largest city in Barbados in addition to being the seat of government. Barbados is a member of the British Commonwealth, and considers Queen Elizabeth II to be its constitutional monarch. Bridgetown, and the surrounding towns that make up the Greater Bridgetown area, is located along the southwestern coastline of the island. The metropolitan area is readily recognized in this image due to the gray and white rooftops and street grids (center) that contrast with green vegetated fields and riparian areas of the island?s interior to the northeast (top center). Bridgetown is a major port destination for both commercial and cruise ships serving the eastern Caribbean ? several ships are visible within Carlisle Bay. Water color in the image changes from light blue along the coastline ? indicating shallow water ? to the dark blue of deeper water away from the island.

In this ASTER image of Soufriere Hills Volcano on Montserrat in the Caribbean, continued eruptive activity is evident by the extensive smoke and ash plume streaming towards the west-southwest. Significant eruptive activity began in 1995, forcing the authorities to evacuate more than 7,000 of the island's original population of 11,000. The primary risk now is to the northern part of the island and to the airport. Small rockfalls and pyroclastic flows (ash, rock and hot gases) are common at this time due to continued growth of the dome at the volcano's summit. This image was acquired on October 29, 2002 by the Advanced Spaceborne Thermal Emission and Reflection Radiometer (ASTER) on NASA's Terra satellite. With its 14 spectral bands from the visible to the thermal infrared wavelength region, and its high spatial resolution of 15 to 90 meters (about 50 to 300 feet), ASTER images Earth to map and monitor the changing surface of our planet. http://photojournal.jpl.nasa.gov/catalog/PIA03880
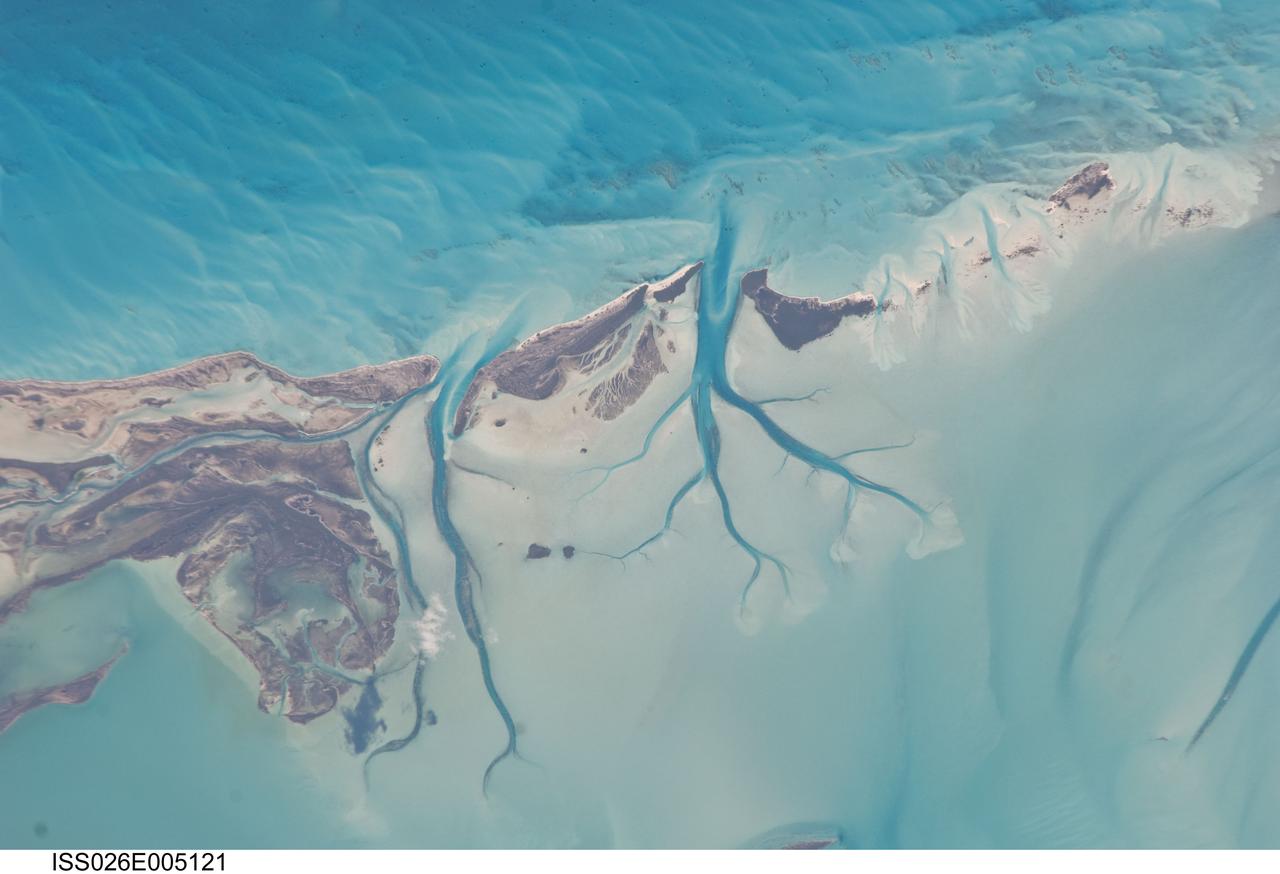
ISS026-E-005121 (27 Nov. 2010) --- Tidal flats and channels on Long Island, Bahamas are featured in this image photographed by an Expedition 26 crew member on the International Space Station. The islands of the Bahamas in the Caribbean Sea are situated on large depositional platforms (the Great and Little Bahama Banks) composed mainly of carbonate sediments ringed by fringing reefs – the islands themselves are only the parts of the platform currently exposed above sea level. The sediments are formed mostly from the skeletal remains of organisms settling to the sea floor; over geologic time, these sediments will consolidate to form carbonate sedimentary rocks such as limestone. This detailed photograph provides a view of tidal flats and tidal channels near Sandy Cay on the western side of Long Island, located along the eastern margin of the Great Bahama Bank. The continually exposed parts of the island have a brown coloration in the image, a result of soil formation and vegetation growth (left). To the north of Sandy Cay an off-white tidal flat composed of carbonate sediments is visible; light blue-green regions indicate shallow water on the tidal flat. Tidal flow of seawater is concentrated through gaps in the anchored land surface, leading to formation of relatively deep tidal channels that cut into the sediments of the tidal flat. The channels, and areas to the south of the island, have a vivid blue coloration that provides a clear indication of deeper water (center).
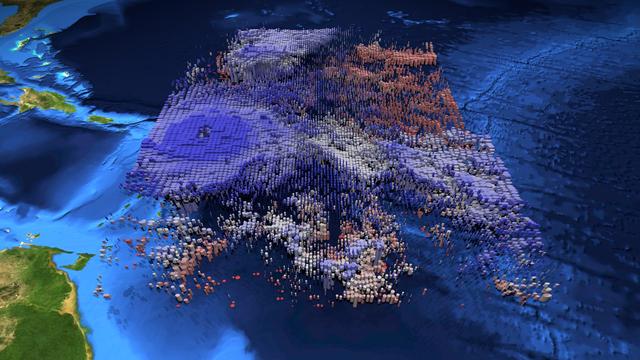
The large-scale structure of clouds in and around Hurricane Irma is seen in this animation and still image created with data from the Atmospheric Infrared Sounder (AIRS) instrument on NASA's Aqua satellite. The clouds are typical of tropical areas both nearby and away from tropical cyclones. Observations were taken at 1 p.m. EDT (5 p.m. UTC) on Tuesday, Sept. 5, 2017, as Irma approached the Caribbean islands and was just becoming a powerful Category 5 storm. Each cylinder represents a volume of cloud detected by AIRS. The oval cylinder ends represent a region viewed by AIRS, with the oval sizes adjusted to reflect the proportion of clouds filling the area viewed. The largest ovals are about 30 miles (45 kilometers) across. The height of the cylinders indicates the cloud thickness, with thickest clouds reaching down to the surface. The vertical scale is exaggerated 15 times. Colors represent temperatures at the tops of the clouds. The perspective views the storm diagonally from above with an initial view toward the north-northwest, with the perspective rotating clockwise for a full circle. The area depicted is about 1,000 miles by 800 miles across (1,600 by 1,300 kilometers). At the start of the loop, North America is seen at the top of the image, and coastal Venezuela at the lower right. In the initial perspective, cirrus clouds (thin and blue), associated with flow outward from the top of the hurricane, overlie warmer (pink and red) shallow clouds. About five seconds into the loop, the deep clouds in the middle of Irma are easily seen. The most dangerous parts of Irma are within the region of high and cold (blue), thick clouds surrounding the central eye. The clouds are cold because they are carried to high, cold altitudes by vigorous thunderstorms within the hurricane. The eye itself is nearly cloud free, but the few clouds within it are low and warm. As the perspective shift toward the south-southeast around seven seconds into the loop, another storm system well north of Irma can be seen. It contains high, thick clouds, with more cirrus carried outward over shallow clouds. At about nine seconds, more outflow from Irma is seen, with high, thin clouds over shallow clouds once again apparent. Shortly afterward when the view is toward the southwest, yet more deep clouds and their outflowing cirrus clouds are apparent. This image depicts many of the clouds typical of the tropics even when cyclones are not present: high, cold thunderstorms pushing cirrus clouds over nearby regions containing many warm, shallow clouds. The animation also shows the structure typical of tropical cyclones around the world: very strong thunderstorms lifting clouds into cold parts of the atmosphere, with strong outflow at upper levels carrying cirrus clouds away from the storm center, and the storm organized symmetrically around a central eye. https://photojournal.jpl.nasa.gov/catalog/PIA21950
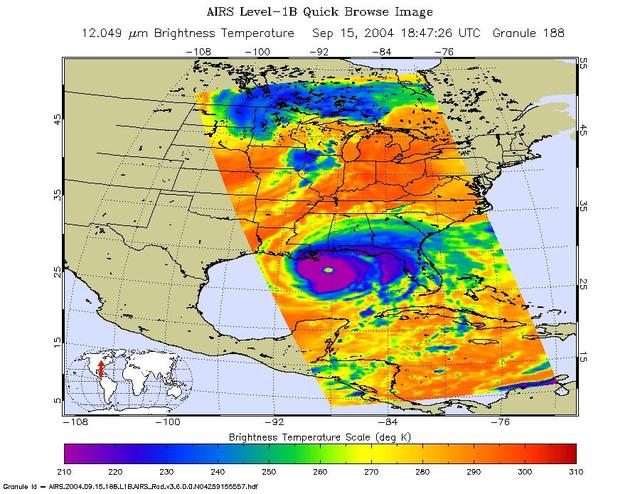
Hurricane Ivan is the most powerful hurricane to hit the Caribbean in 10 years. On September 7 and 8 it damaged 90 percent of the homes in Grenada and killed at least 16 people as it swept over Grenada, Barbados and the other islands in the area. By Thursday morning on September 9, Ivan's sustained winds reached 160 mph making it a rare category 5 hurricane on the Saffir-Simpson scale. By Monday September 13, Ivan is blamed for 67 deaths and skirts western Cuba with winds clocked at 156 mph. The National Hurricane Center predicted the eye of Ivan will make landfall across Mobile Bay in Alabama late Wednesday or early Thursday. These images of Hurricane Ivan were acquired by the AIRS infrared, microwave, and visible sensors on September 15 at 1:30 pm local time as the storm moves in to Alabama. Ivan at category 4 strength is about 150 miles south of Mobile, Alabama and is moving north at 14 mph. Maximum sustained winds are reported to be at 135 mph and extend 105 miles from the center, while tropical storm-force winds extend 290 miles from the center. Ivan pounded the Gulf coast all day Wednesday, and is expected to make landfall between midnight and 3am in Mobile Bay, Alabama. This image shows how the storm looks through an AIRS Infrared window channel, and reveals a very large eye - about 75 km (50 miles) across. Window channels measure the temperature of the cloud tops or the surface of the Earth in cloud-free regions. The lowest temperatures are associated with high, cold cloud tops that make up the top of the hurricane. The infrared signal does not penetrate through clouds, so the purple color indicates the cool cloud tops of the storm. In cloud-free areas, the infrared signal is retrieved at the Earth's surface, revealing warmer temperatures. Cooler areas are pushing to purple and warmer areas are pushing to red. http://photojournal.jpl.nasa.gov/catalog/PIA00431
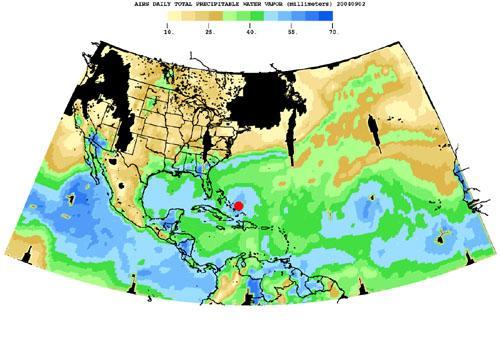
Born in the Atlantic, Hurricane Frances became a category 4 hurricane on August 31, 2004, as seen by the Atmospheric Infrared Sounding System AIRS on NASA Aqua. Expectations are the hurricane will hit the Space Coast of Florida in Brevard County early Sunday morning. This frame from a movie is a time-series of maps that show AIRS observations of the total amount of water vapor present in the atmospheric column above each point of the Earth's surface. If all the water vapor in the column were forced to fall as rain, the depth of the resulting puddle on the surface at that point is equal to the value shown on the map. Fifty millimeters (mm) is about 2 inches. The large band of maximum water vapor in the neighborhood of the equator is the Intertropical Convergence Zone (ITCZ), a region of strong convection and powerful thunderstorms. The movie (see PIA00433) shows the total precipitable water vapor from August 23 through September 2, 2004. You can see Hurricane Frances as it moves through the Caribbean toward Florida, and the changes in intensity are visible. The eye has been marked with a red spot. The water vapor encompassed by the hurricane is also the result of the very strong convection which is an integral part of the formation and intensification of tropical storms. If you look at the last frame of the movie in the lower right corner, you can see the emergence of a new tropical storm. Ivan makes its debut in the Atlantic. http://photojournal.jpl.nasa.gov/catalog/PIA00433
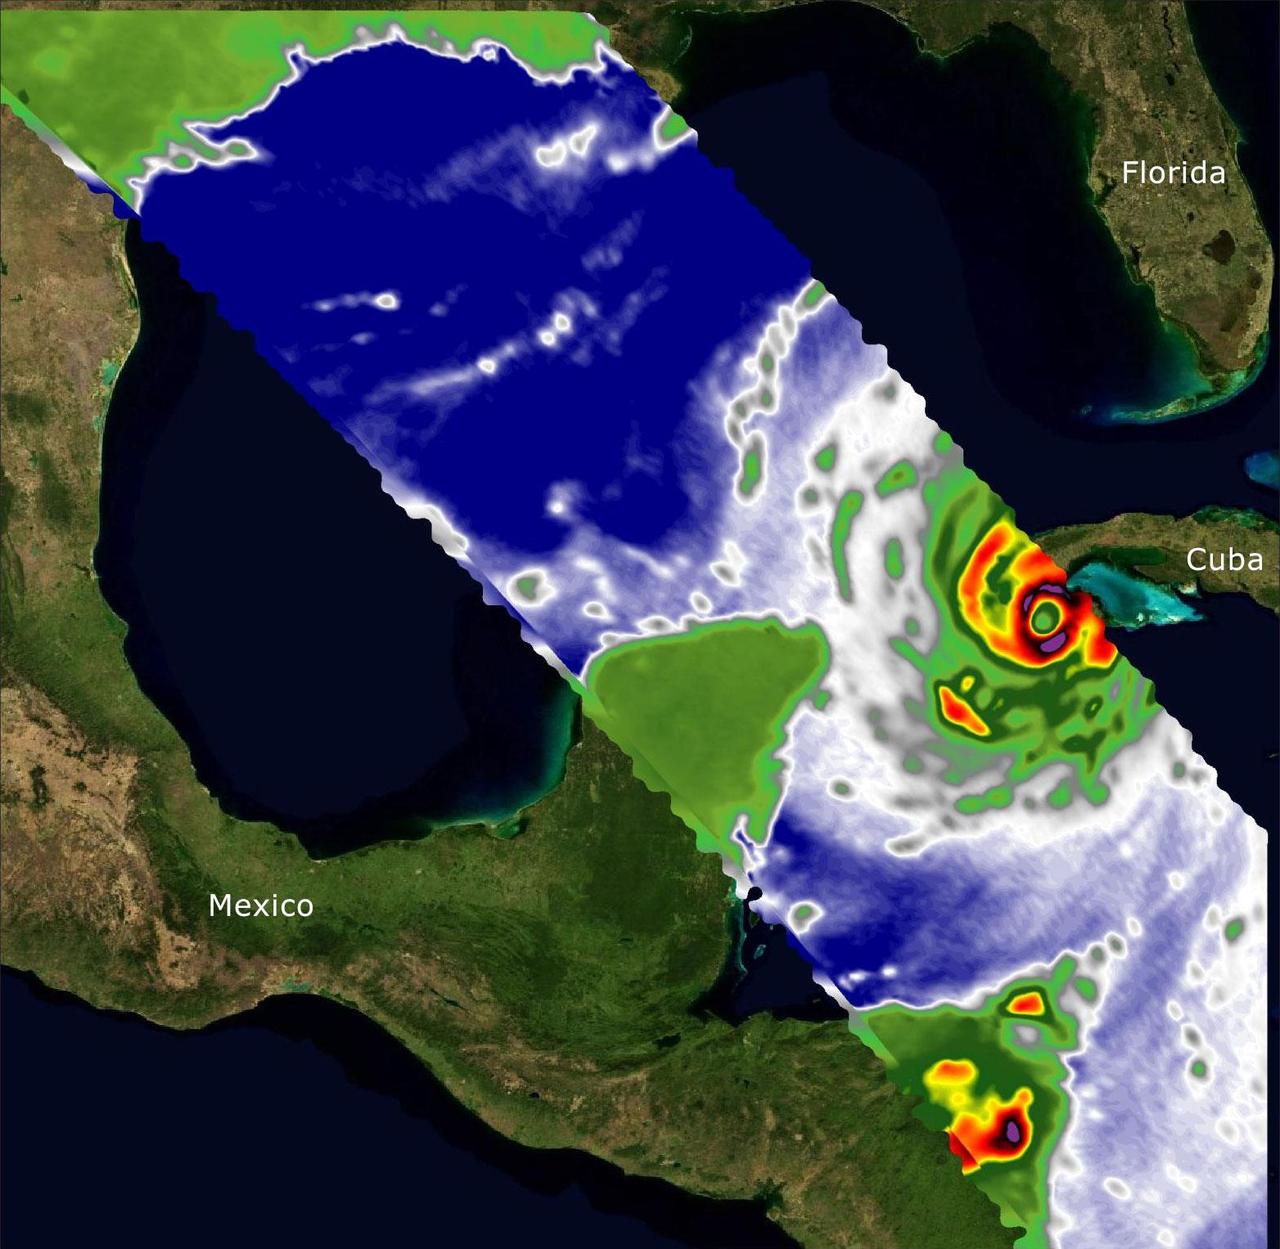
Two recently launched instruments that were designed and built at NASA's Jet Propulsion Laboratory in Southern California to provide forecasters data on weather over the open ocean captured images of Hurricane Ian on Sept. 27, 2022, as the storm approached Cuba on its way north toward the U.S. mainland. The instruments, Compact Ocean Wind Vector Radiometer (COWVR) and Temporal Experiment for Storms and Tropical Systems (TEMPEST), observe the planet's atmosphere and surface from aboard the International Space Station, which passed in low-Earth orbit over the Caribbean Sea at about 12:30 a.m. EDT. Ian made landfall in Cuba's Pinar del Rio province at 4:30 a.m. EDT, according to the National Hurricane Center. At that time, it was a Category 3 hurricane, with estimated wind speeds of 125 mph (205 kph). The image above combines microwave emissions measurements from both COWVR and TEMPEST. White sections indicate the presence of clouds. Green portions indicate rain. Yellow, red, and black indicate where air and water vapor were moving most swiftly. Ian's center is seen just off of Cuba's southern coast, and the storm is shown covering the island with rain and wind. COWVR and TEMPEST sent the data for this image back to Earth in a direct stream via NASA's tracking and data relay satellite (TDRS) constellation. The data were processed at JPL and made available to forecasters less than two hours after collection. About the size of a minifridge, COWVR measures natural microwave emissions over the ocean. The magnitude of the emissions increases with the amount of rain in the atmosphere, and the strongest rain produces the strongest microwave emissions. TEMPEST – comparable in size to a cereal box – tracks microwaves at a much shorter wavelength, allowing it to see ice particles within the hurricane's cloudy regions that are thrust into the upper atmosphere by the storm. Both microwave radiometers were conceived to demonstrate that smaller, more energy-efficient, more simply designed sensors can perform most of the same measurements as current space-based weather instruments that are heavier, consume more power, and cost much more to construct. COWVR's development was funded by the U.S. Space Force, and TEMPEST was developed with NASA funding. The U.S. Space Test Program-Houston 8 (STP-H8) is responsible for hosting the instruments on the space station under Space Force funding in partnership with NASA. Data from the instruments are being used by government and university weather forecasters and scientists. The mission will inform development of future space-based weather sensors, and scientists are working on mission concepts that would take advantage of the low-cost microwave sensor technologies to study long-standing questions, such as how heat from the ocean fuels global weather patterns. https://photojournal.jpl.nasa.gov/catalog/PIA25425