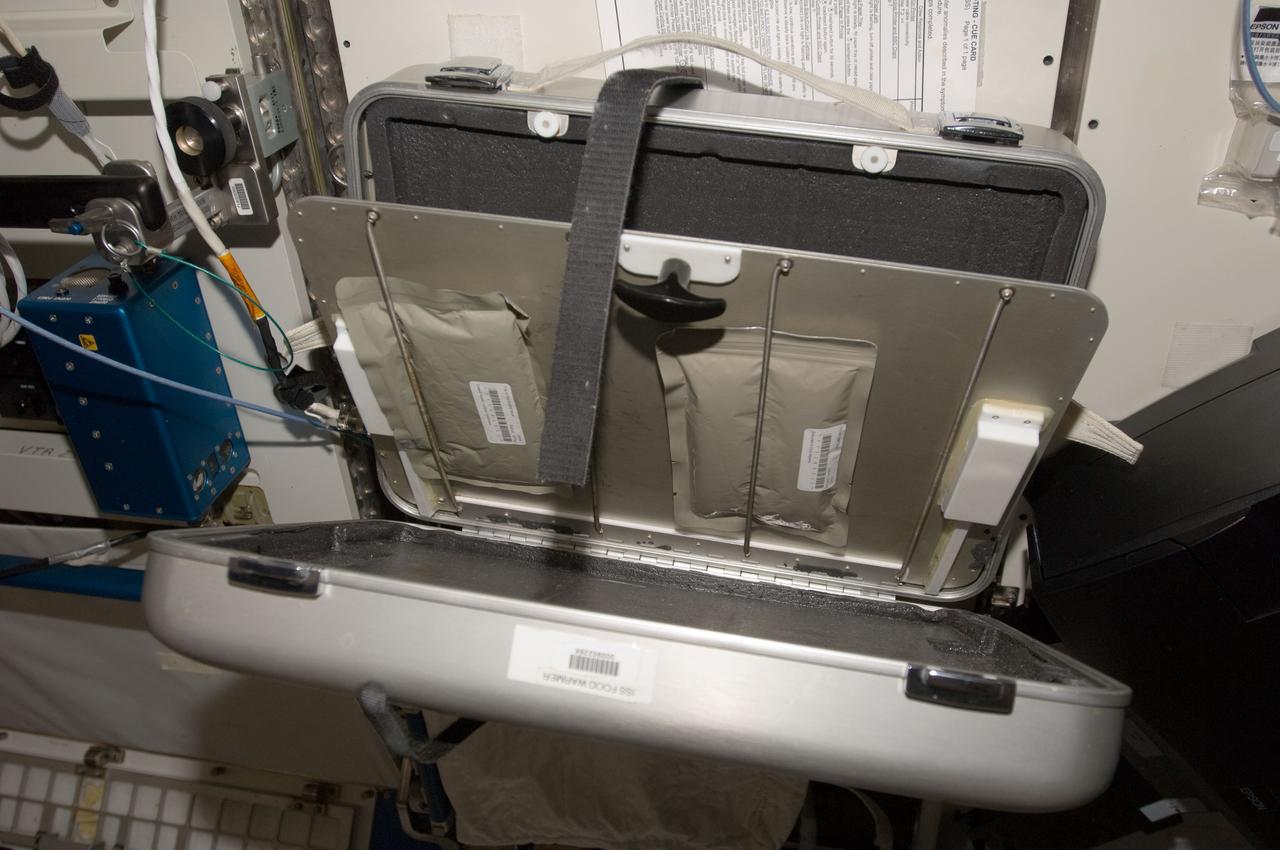
View of food packets tied down within suitcase. Photo was taken during Expedition 34.
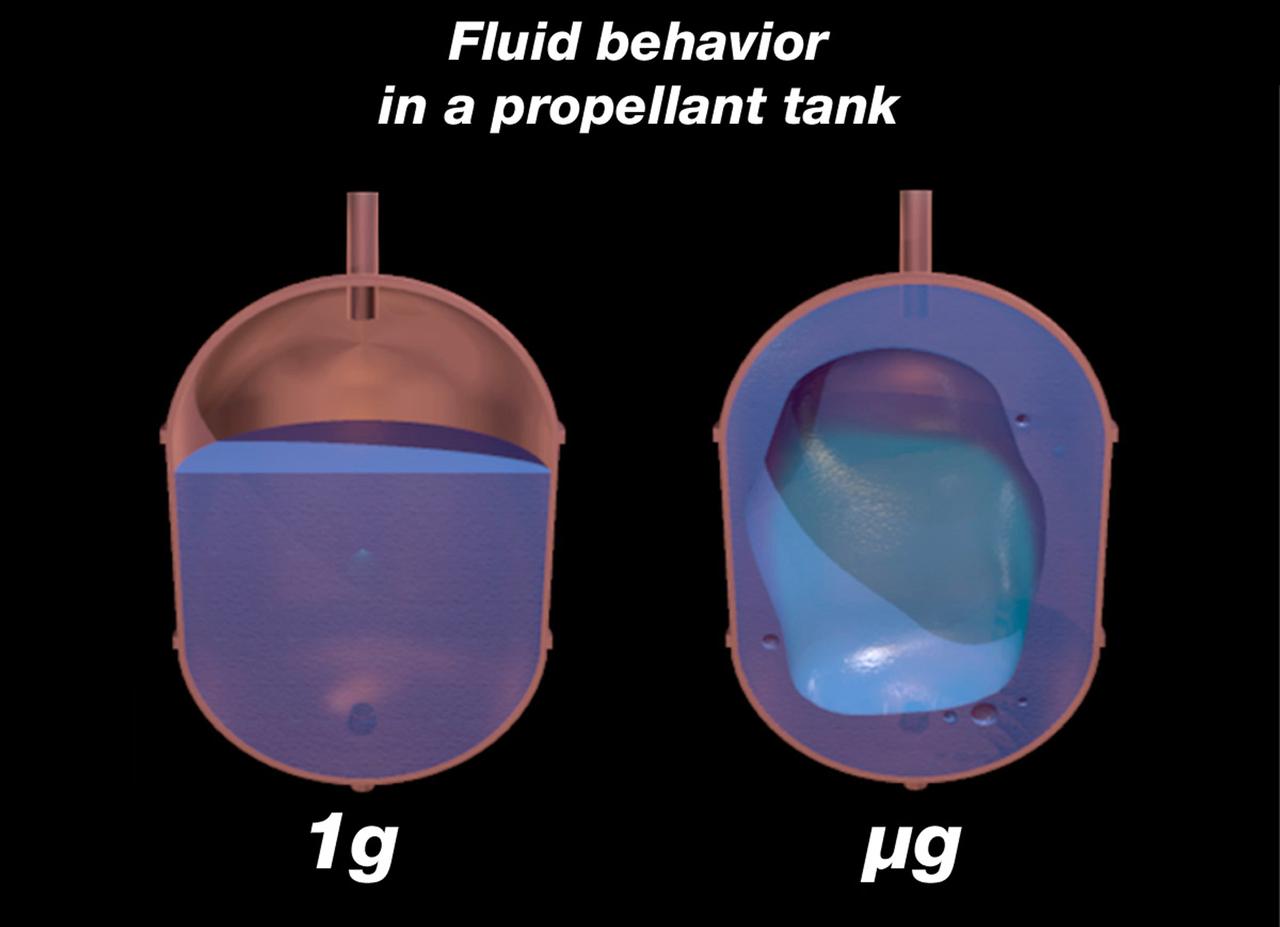
Some of the earliest concerns about fluid behavior in microgravity was the management of propellants in spacecraft tanks as they orbited the Earth. On the ground, gravity pulls a fluid to a bottom of a tank (ig, left). In orbit, fluid behavior depends on surface tension, viscosity, wetting effects with the container wall, and other factors. In some cases, a propellant can wet a tank and leave a large gas bubbles in the center (ug, right). Similar probelms can affect much smaller experiments using fluids in small spaces. Photo credit: NASA/Glenn Research Center.

iss024e014711 (9/15/2010) --- A view of a Bioecology Case containing a stowed BTKh-27 ASTROVAKTSINA (Astrovaccine) payload aboard the International Space Station (ISS). The Cultivating Escheria coli Producer of CAF1 Protein in Weightlessness (Astrovaktsina) studies the effect of spaceflight factors on the processes of biosynthesis, secretion, capsule formation, and the biological properties of the E. coli producer of the genetically engineered CAF1 antigen protein of Yersinia pestis during its exposure to microgravity.

iss024e014714 (9/15/2010) --- A view of a Bioecology Case containing a stowed BTKh-27 ASTROVAKTSINA (Astrovaccine) payload aboard the International Space Station (ISS). The Cultivating Escheria coli Producer of CAF1 Protein in Weightlessness (Astrovaktsina) studies the effect of spaceflight factors on the processes of biosynthesis, secretion, capsule formation, and the biological properties of the E. coli producer of the genetically engineered CAF1 antigen protein of Yersinia pestis during its exposure to microgravity.

iss023e056026 (6/1/2010) --- Photo documentation of Bioecology Cases containing Bioecology, BTKh-40/Bifidobacterius, and BTKh-41/Bacteriophage hardware aboard the International Space Station (ISS). The Study of the Effects of Spaceflight Factors on Bacterophages (Bakteriofag) investigation examines the therapeutic, diagnostic, and genetic properties of bacteriophages to discover possible changes in the physical, chemical, morphological, and genetic properties of therapeutic and diagnostic bacteriophages exposed to microgravity.
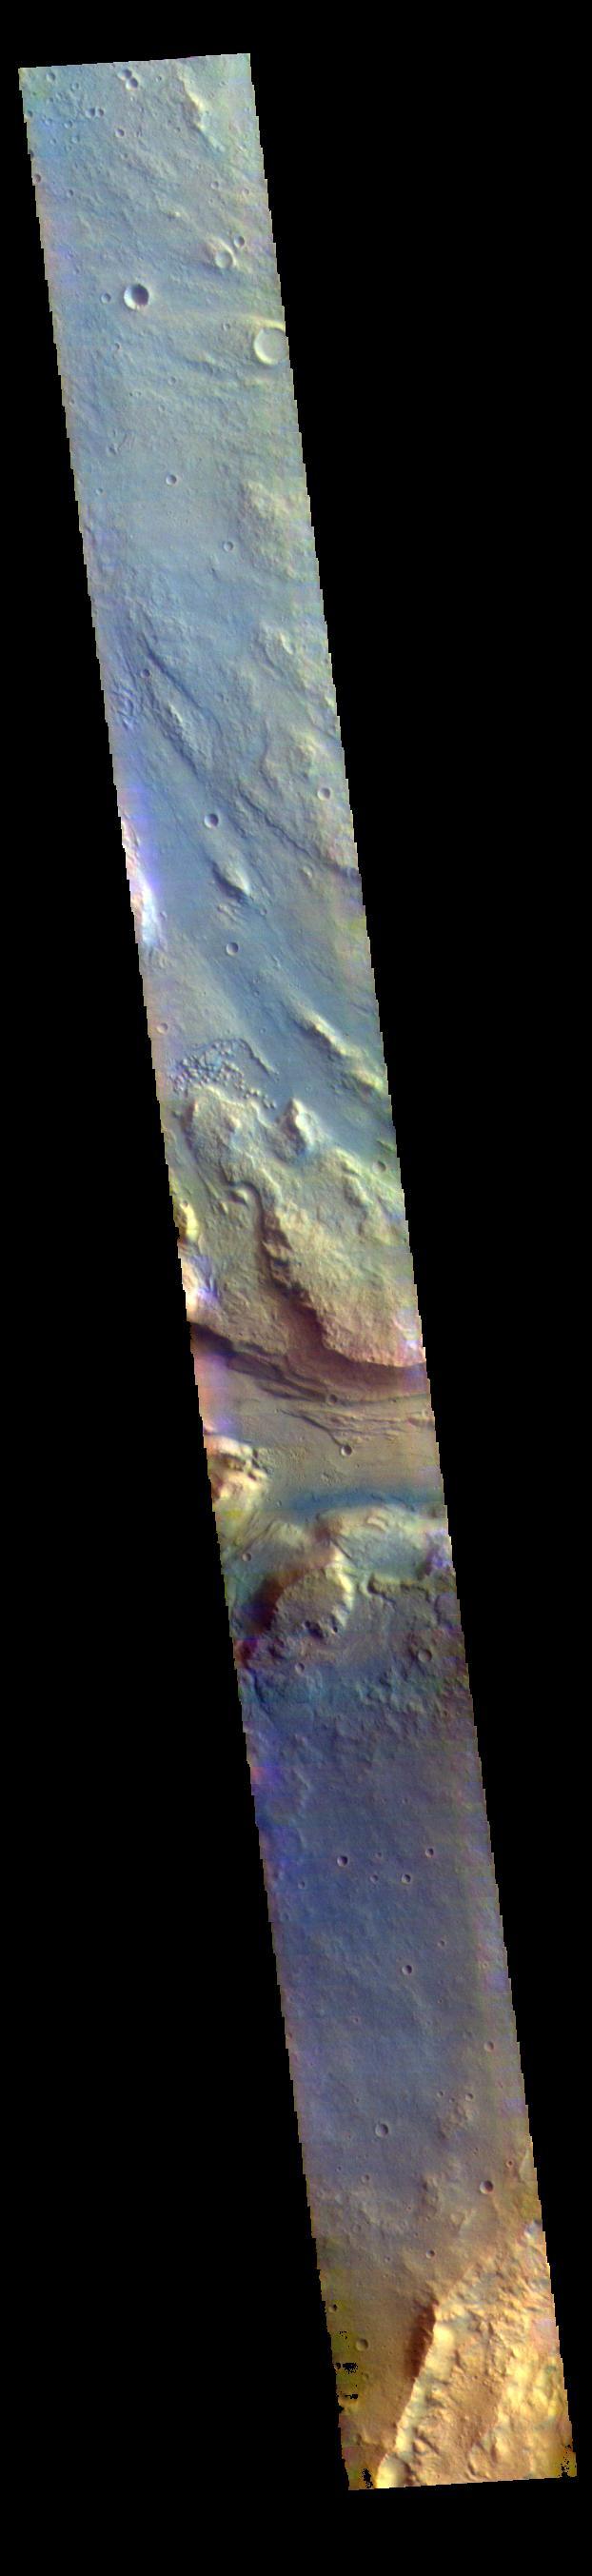
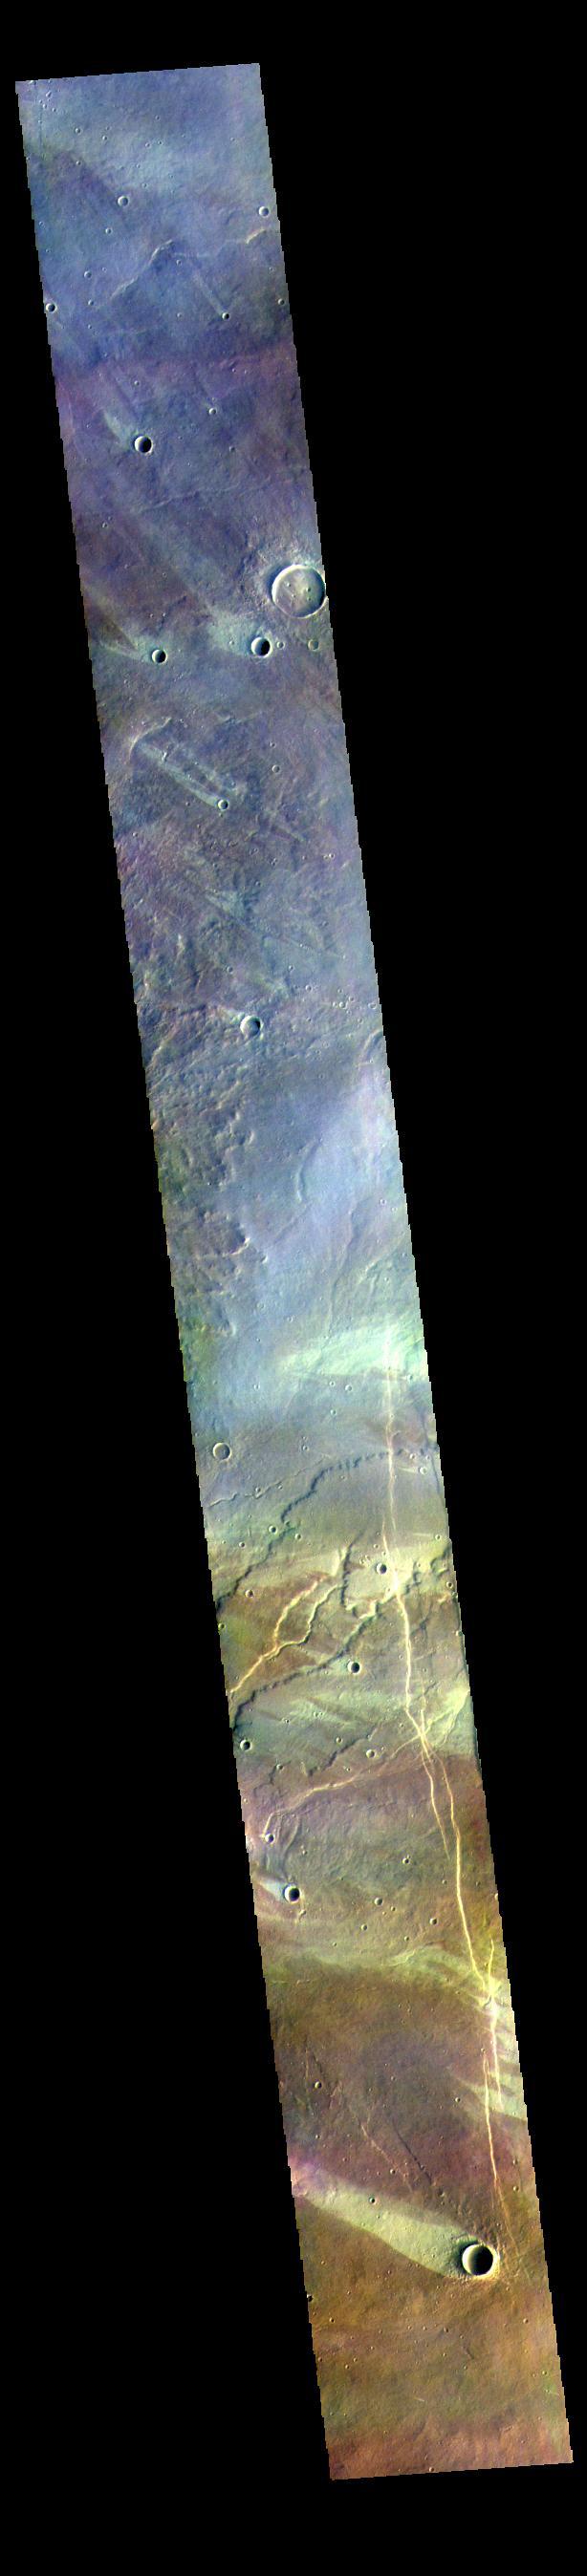
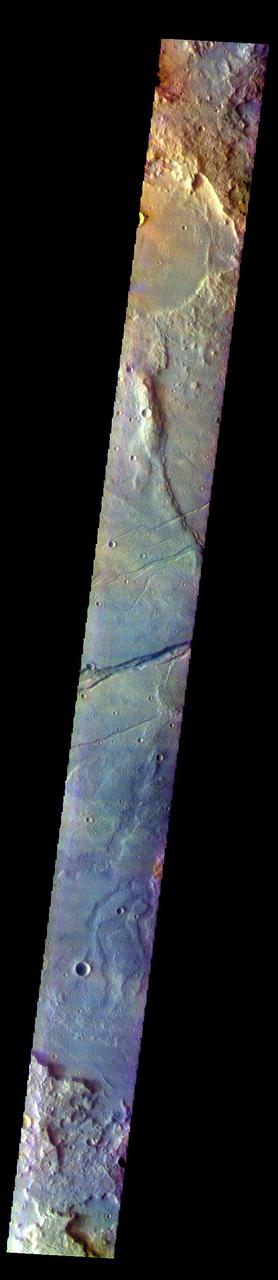
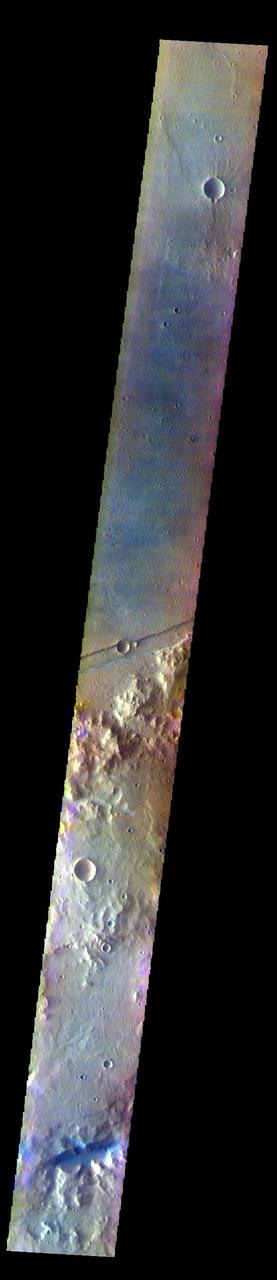
This false color image contains several channel features. Towards the top of the image are several stream-lined islands, created by liquid flow eroding preexisting rock. The islands have a tear-drop shape, with the pointy end down stream from the rounded end. In this case the fluid flowed from the bottom right of the frame towards the upper left. Just below the center of the image is a larger, deeper channel. All these channel features merge into Ares Vallis, a huge outflow channel that empties into Chryse Planitia. The THEMIS VIS camera contains 5 filters. The data from different filters can be combined in multiple ways to create a false color image. These false color images may reveal subtle variations of the surface not easily identified in a single band image. Orbit Number: 61501 Latitude: 4.31188 Longitude: 343.17 Instrument: VIS Captured: 2015-10-25 18:03 https://photojournal.jpl.nasa.gov/catalog/PIA23066
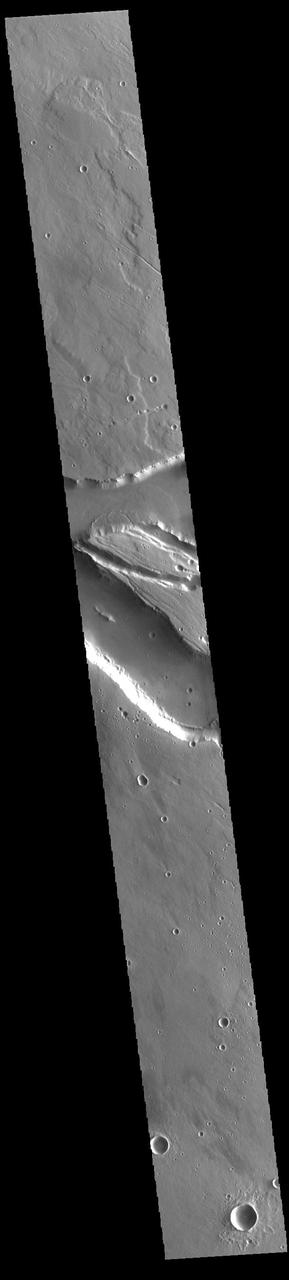
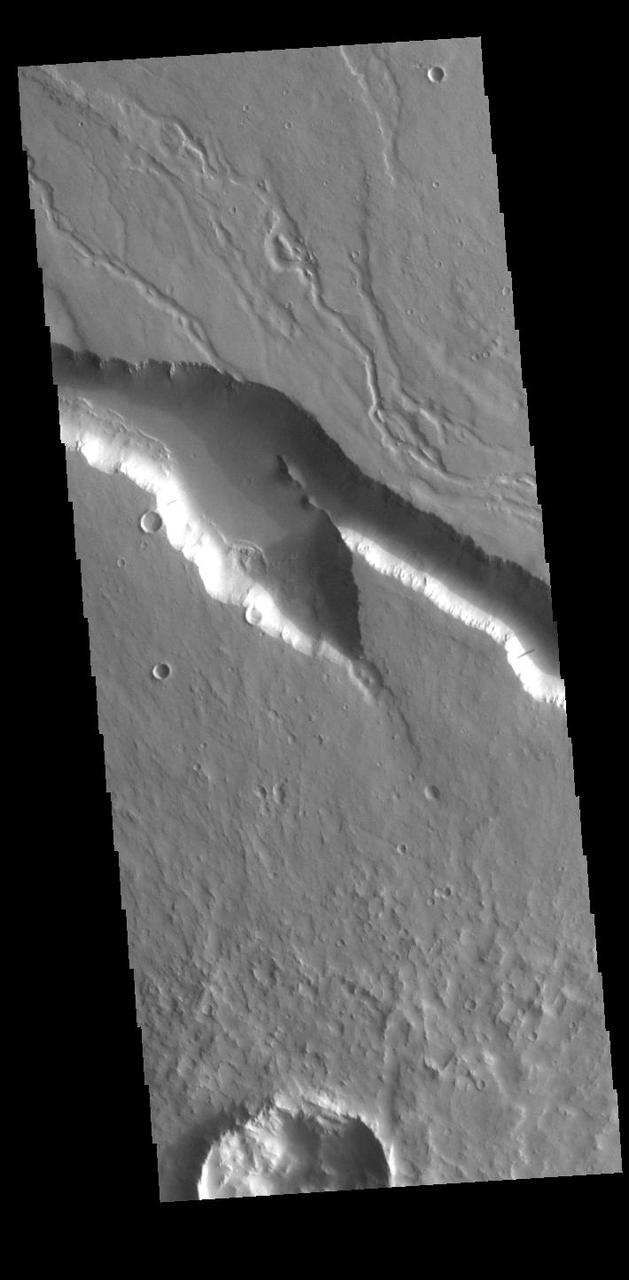
Today's VIS image contains a section of one of the many channel forms found radial to the Elysium Mons volcanic complex. In this case the fossae are located to the west of Elysium Mons. Elysium Fossae are comprised of both linear and sinuous channels, usually interpreted to have both fluid and tectonic forces playing a part in the formation. The linear depression resembles a graben (formed by tectonic forces) and sinuous channel more closely resembles features caused by fluid flow – either lava or water created by melting subsurface ice due to volcanic heating. Orbit Number: 94969 Latitude: 25.7616 Longitude: 137.829 Instrument: VIS Captured: 2023-05-13 01:21 https://photojournal.jpl.nasa.gov/catalog/PIA26223
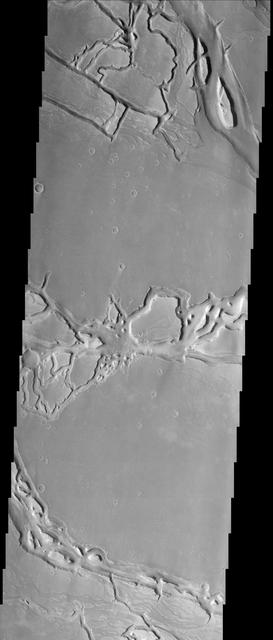
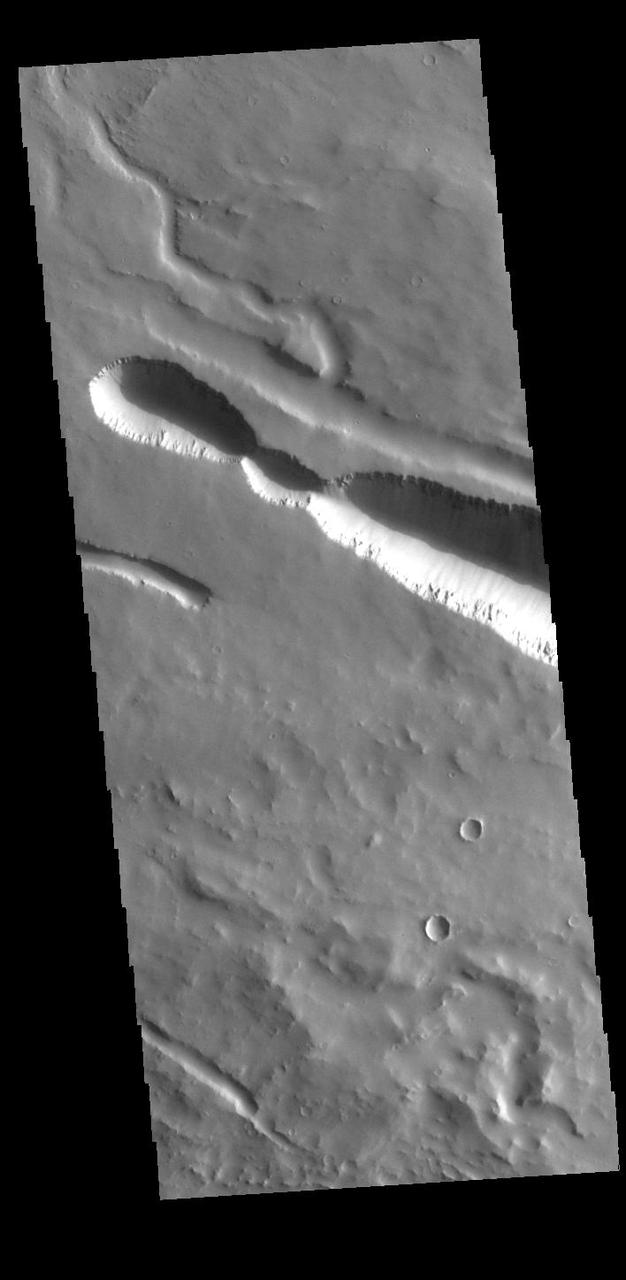
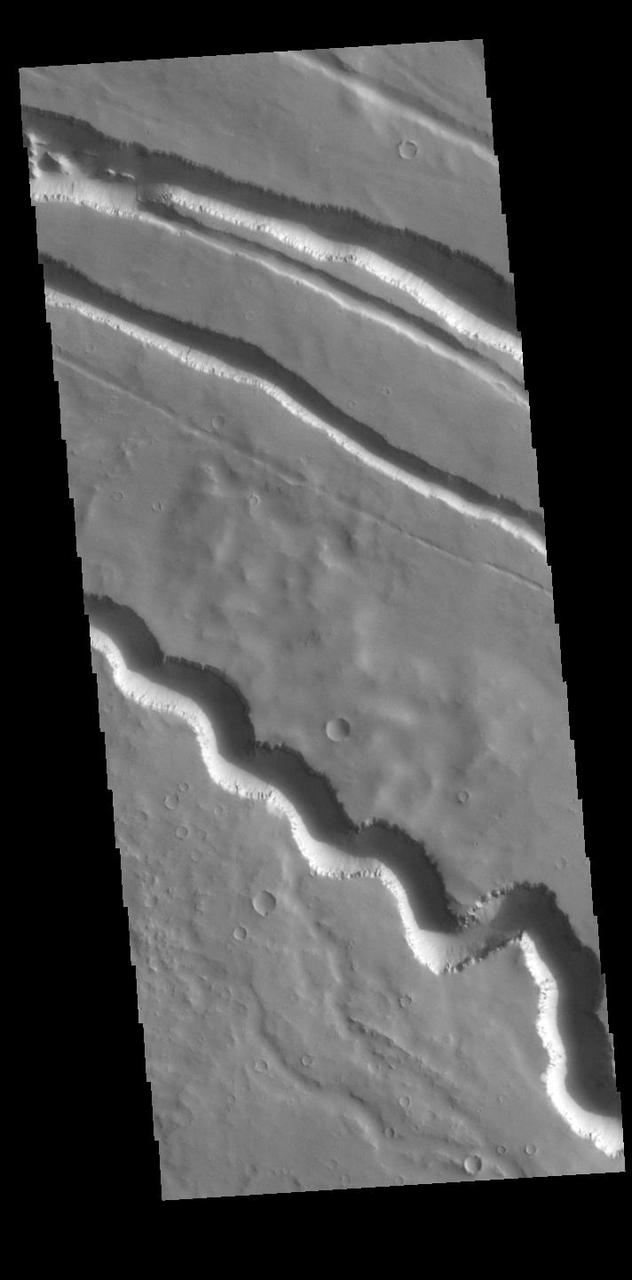
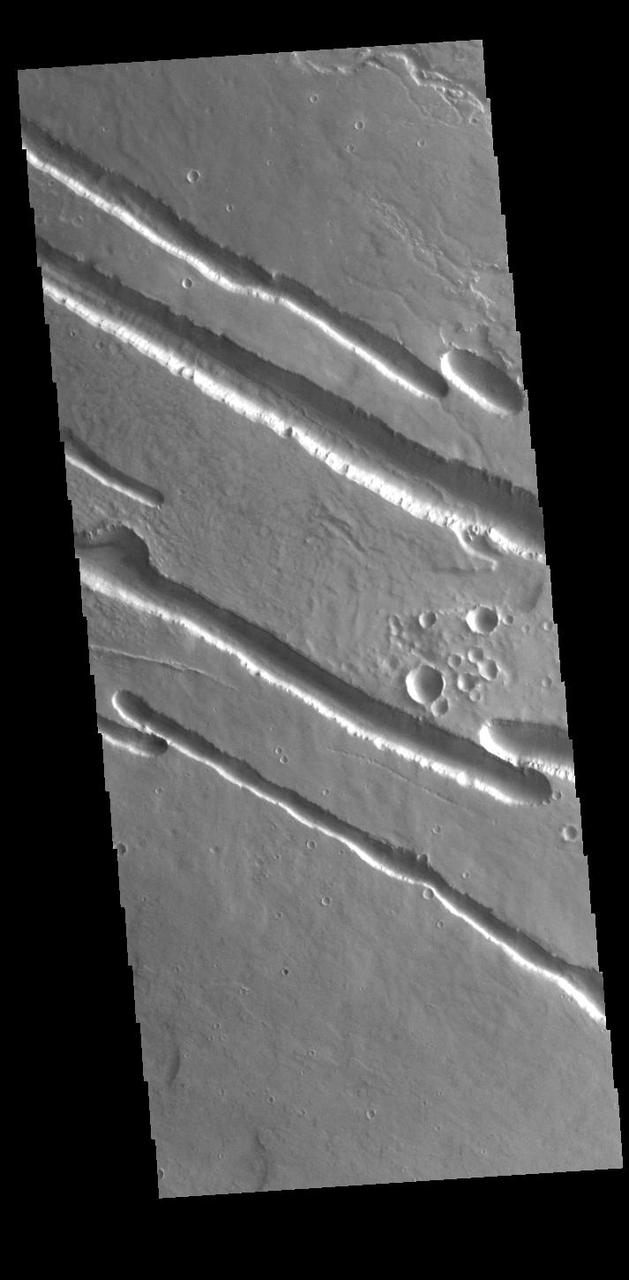
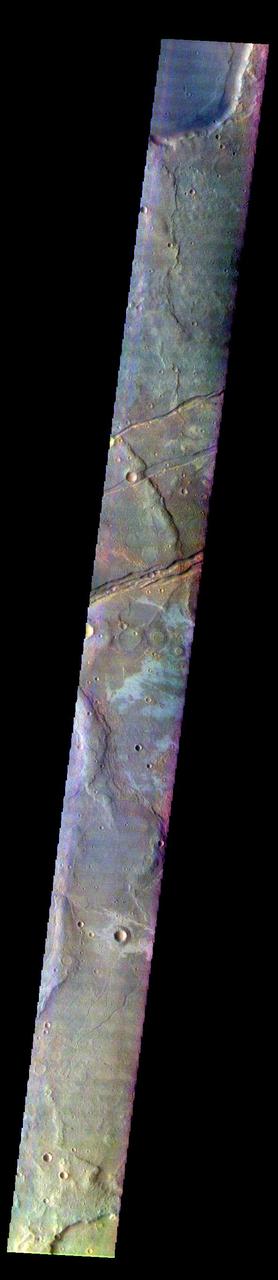
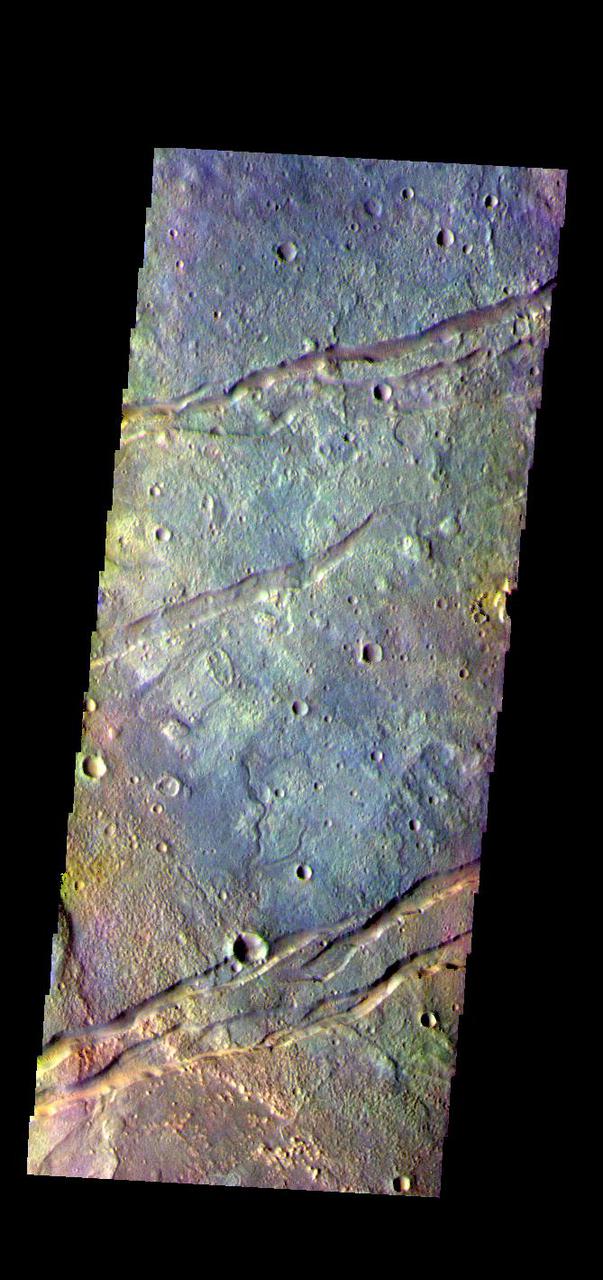
The force of moving water from a flood carved these teardrop-shaped islands within Granicus Valles. The orientation of the islands can be used as an indicator of the direction the water flowed. In this case, the water flowed primarily towards the upper left of the image. The image also contains many narrow sinuous channels. Geologists can determine that the floods occurred before a later tectonic event in the region. This event caused the crust to fracture into numerous blocks and fissures (grabens). Many fissures can be seen cutting across the former flood pathways. http://photojournal.jpl.nasa.gov/catalog/PIA04037
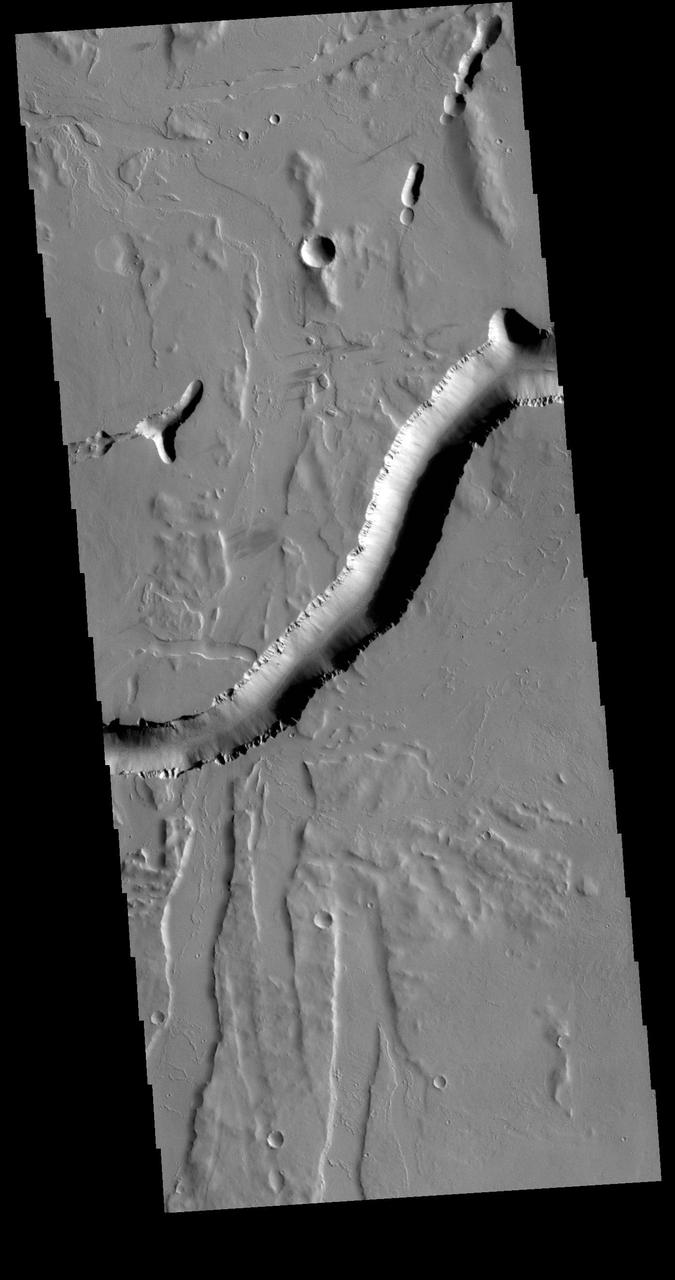
Olympica Fossae is a complex channel located on the volcanic plains between Alba Mons and Olympus Mons. The sinuosity of the large channel in the middle of the image indicates that this is a channel created by liquid flow. In this case the location and other surface features point to lava rather than water as the liquid. The more linear depressions at the bottom third of the image are possibly tectonic features called graben and formed by movement along fault lines. The Alba Mons region contains extensive faulting which formed due to collapse of the volcano. Orbit Number: 71183 Latitude: 25.8417 Longitude: 247.895 Instrument: VIS Captured: 2017-12-31 08:32 https://photojournal.jpl.nasa.gov/catalog/PIA22367
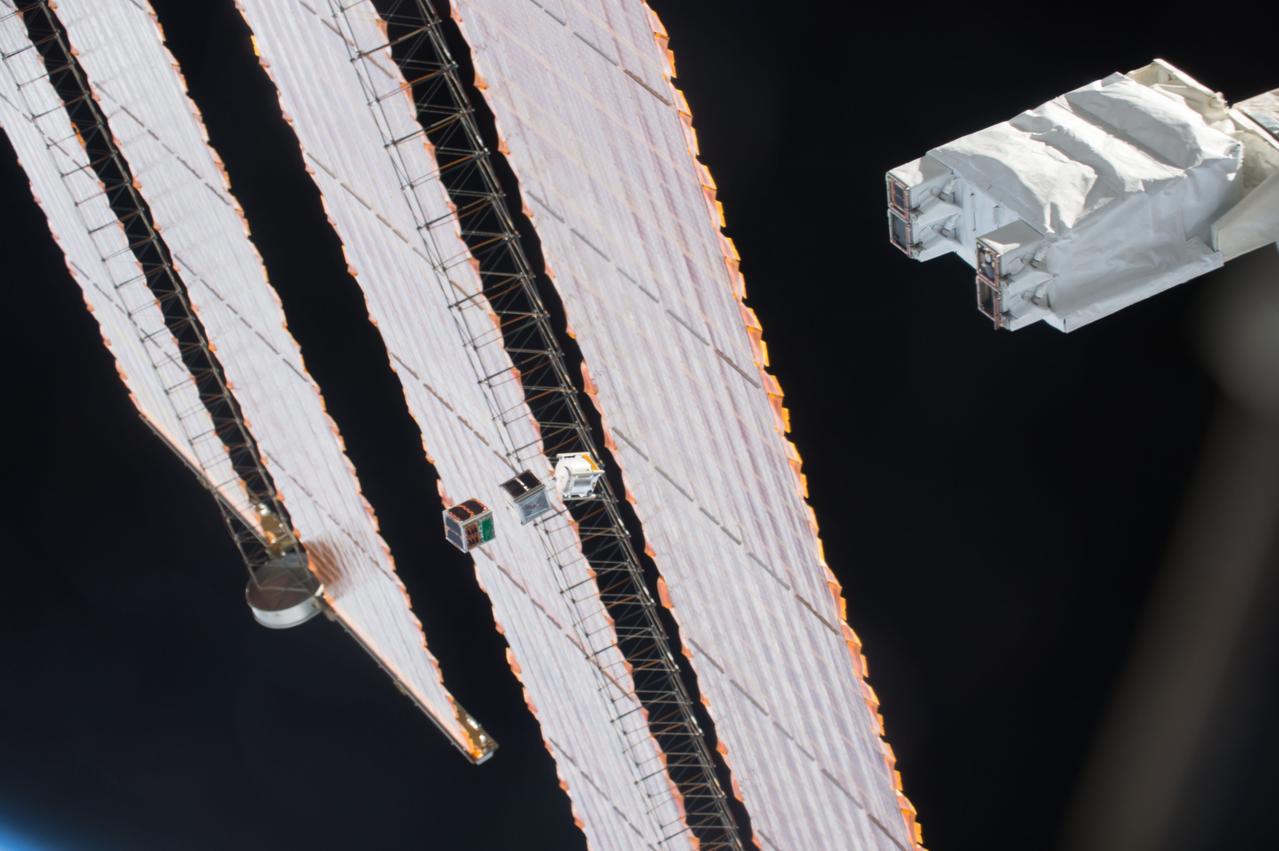
iss050e031207 (1/6/2017) --- A view during the Japanese-Small Satellite Orbital Deployer-6 (J-SSOD-6) deployment of the following satellites: Freedom (1U), Waseda-SAT3, ITF-2 (1U), Egg (3U), AOBA-Velox-III (U), TuPOD (3U). J-SSOD is a unique satellite launcher, handled by the Japanese Experiment Module Remote Manipulator System (JEMRMS), which provides containment and deployment mechanisms for several individual small satellites. Once the J-SSOD including satellite install cases with small satellites are installed on the Multi-Purpose Experiment Platform (MPEP) by crewmembers, it is passed through the JEM airlock for retrieval, positioning and deployment by the JEMRMS.
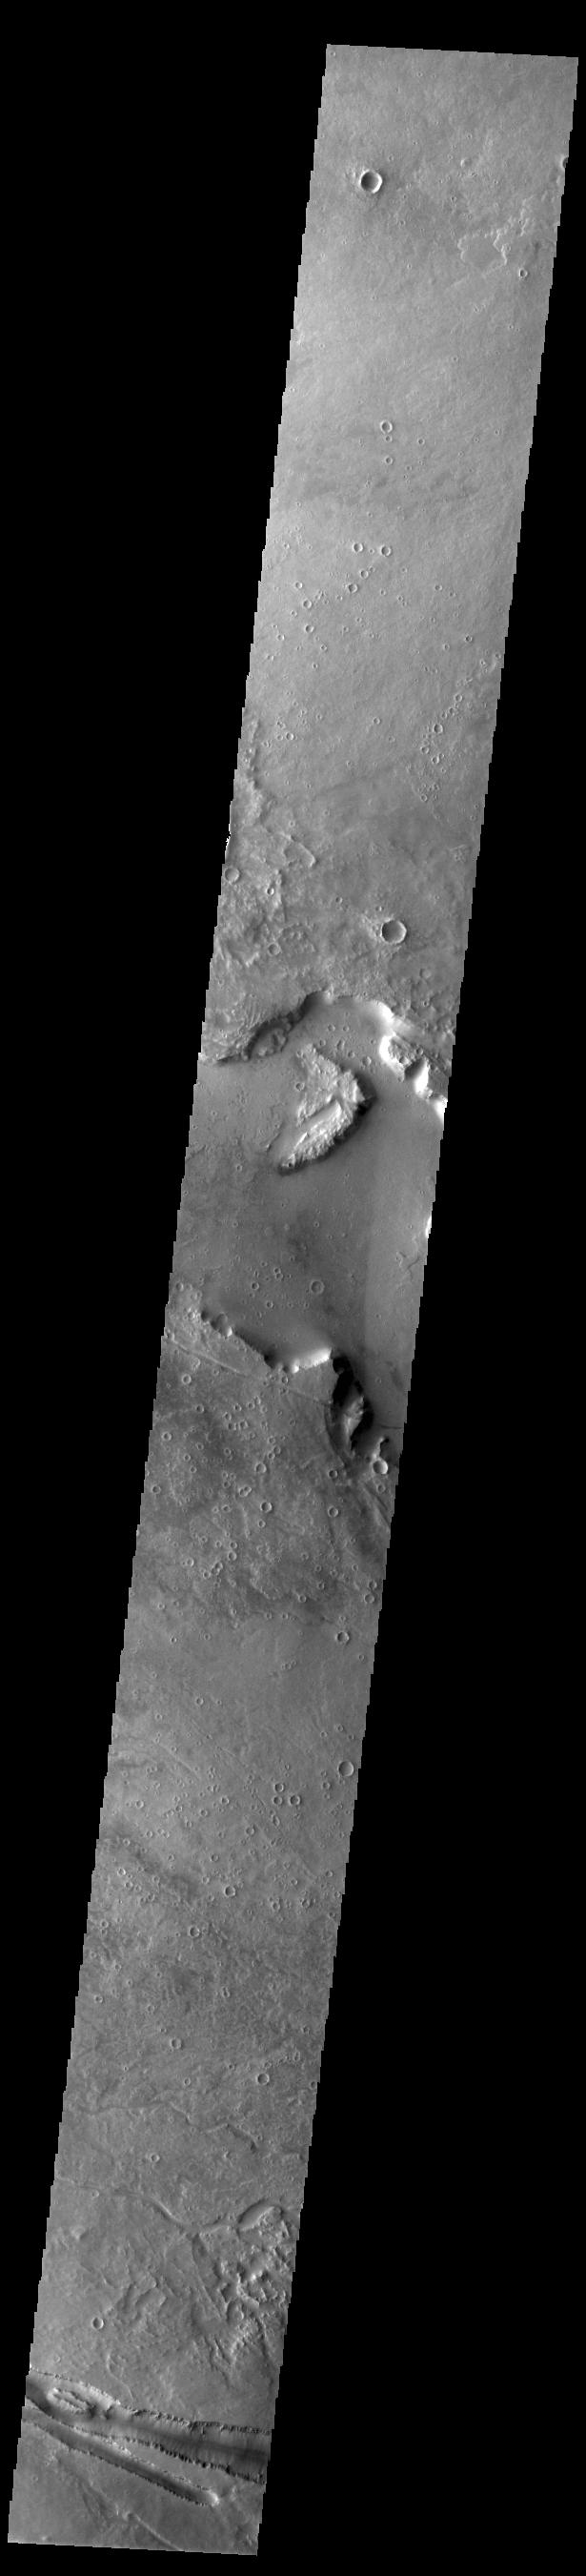
Today's VIS image contains a section of one of the many channel forms found radial to the Elysium Mons volcanic complex. In this case the fossae is located to the east of the volcano. The channel features are thought to have both a tectonic and volcanic origin. The linear depression resembles a graben (formed by tectonic forces) and the smaller sinuous channel below the large linear depression more closely resembles features caused by fluid flow — either lava or water created by melting subsurface ice by volcanic heating. Orbit Number: 79133 Latitude: 23.9518 Longitude: 153.966 Instrument: VIS Captured: 2019-10-17 03:13 https://photojournal.jpl.nasa.gov/catalog/PIA23571
Today's VIS image contains a section of the many channel forms found radial to the Elysium Mons volcanic complex. In this case the fossae are located to the west of Elysium Mons. Elysium Fossae are comprised of both linear and sinuous channels, usually interpreted to have both fluid and tectonic forces playing a part in the formation. The linear depressions resemble grabens (formed by tectonic forces) and sinuous channel more closely resembles features caused by fluid flow – either lava or water created by melting subsurface ice due to volcanic heating. Orbit Number: 94994 Latitude: 25.539 Longitude: 136.625 Instrument: VIS Captured: 2023-05-15 02:45 https://photojournal.jpl.nasa.gov/catalog/PIA26227
Today's VIS image contains a section of one of the many channel forms found radial to the Elysium Mons volcanic complex. In this case the fossae are located to the west of Elysium Mons. Elysium Fossae are comprised of both linear and sinuous channels, usually interpreted to have both fluid and tectonic forces playing a part in the formation. The linear depression resembles a graben (formed by tectonic forces) and sinuous channels more closely resembles features caused by fluid flow – either lava or water created by melting subsurface ice due to volcanic heating. Orbit Number: 93771 Latitude: 25.4228 Longitude: 138.846 Instrument: VIS Captured: 2023-02-03 09:57 https://photojournal.jpl.nasa.gov/catalog/PIA25876
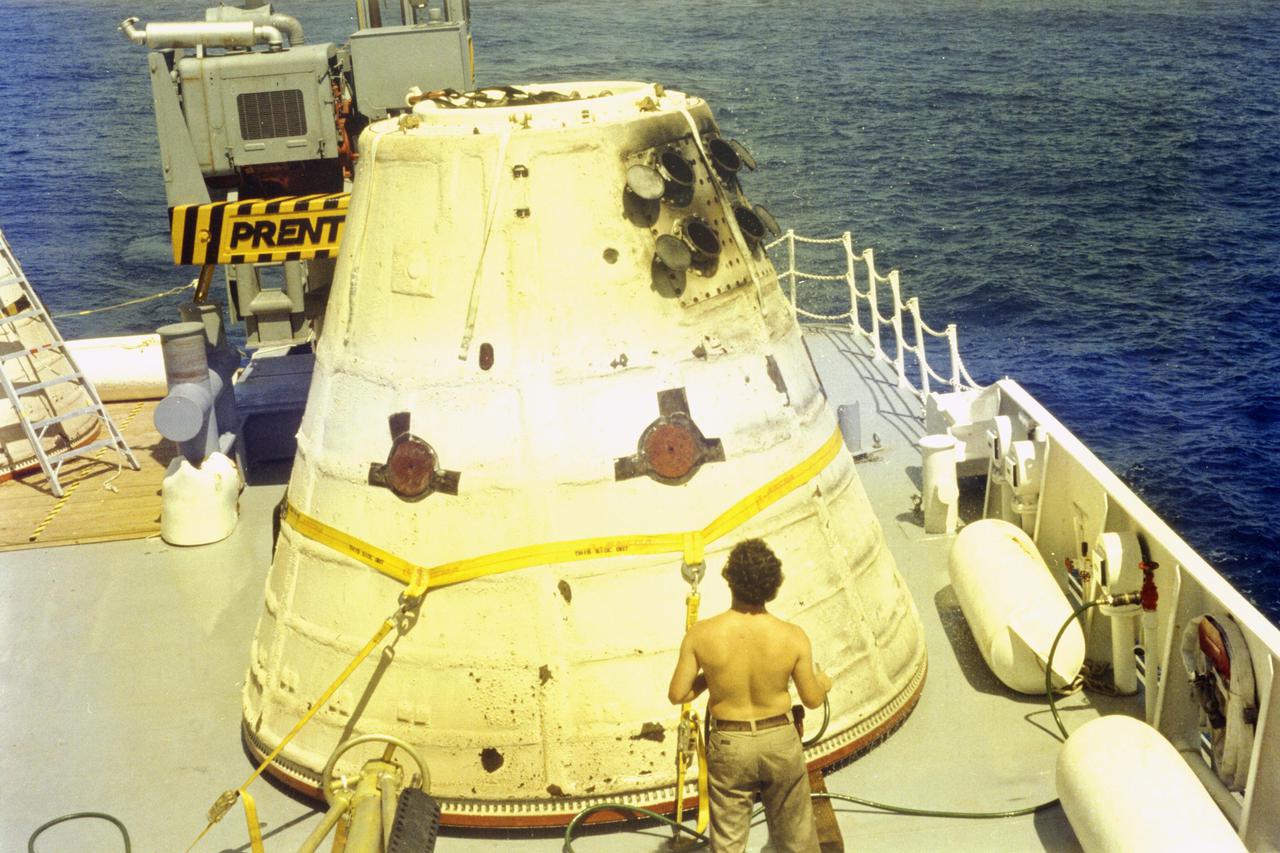
KENNEDY SPACE CENTER, FLA. - A frustum from one of the two solid rocket boosters that helped launch Space Shuttle Columbia on her maiden voyage is recovered at sea on April 13, by one of the two recovery ships, UTC Freedom and UTC Liberty, specifically built for the purpose. The frustum, located just aft of the nose cone, contains the main parachute that lowers the expended rocket casing into the sea for recovery and reuse. Columbia was launched April 12 on mission STS-1, known as a shuttle systems test flight. The flight seeks to demonstrate safe launch into orbit and safe return of the orbiter and crew and verify the combined performance of the entire shuttle vehicle -- orbiter, solid rocket boosters and external tank.
Today's VIS image contains a section of one of the many channel forms found radial to the Elysium Mons volcanic complex. In this case the fossae are located to the west of Elysium Mons. Elysium Fossae are comprised of both linear and sinuous channels, usually interpreted to have both fluid and tectonic forces playing a part in the formation. The linear depression resembles a graben (formed by tectonic forces) and sinuous channels more closely resembles features caused by fluid flow – either lava or water created by melting subsurface ice due to volcanic heating. The Elysium Fossae system is 1044 km (649 miles) in length. Orbit Number: 93983 Latitude: 27.1871 Longitude: 142.629 Instrument: VIS Captured: 2023-02-20 20:54 https://photojournal.jpl.nasa.gov/catalog/PIA25941

CAPE CANAVERAL, Fla. – Inside the Vehicle Assembly Building at NASA’s Kennedy Space Center in Florida, ground support technicians apply heat to a casing that contains an old bearing on the B truck tread of crawler-transporter 2, or CT-2. The bearing will separate and out for removal. New roller bearing assemblies will be installed on CT-2. Work continues in high bay 2 to upgrade CT-2. The modifications are designed to ensure CT-2’s ability to transport launch vehicles currently in development, such as the agency’s Space Launch System, to the launch pad. The Ground Systems Development and Operations Program office at Kennedy is overseeing the upgrades. For more than 45 years the crawler-transporters were used to transport the mobile launcher platform and the Apollo-Saturn V rockets and, later, space shuttles to Launch Pads 39A and B. For more information, visit: http://www.nasa.gov/exploration/systems/ground/crawler-transporter. Photo credit: NASA/Dimitri Gerondidakis
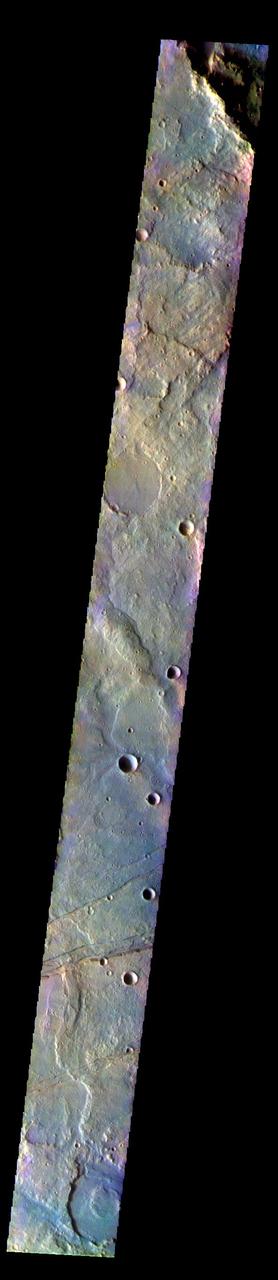
The THEMIS VIS camera contains 5 filters. The data from different filters can be combined in multiple ways to create a false color image. These false color images may reveal subtle variations of the surface not easily identified in a single band image. Today's false color image shows multiple windstreaks on the plains west of Alba Mons. The color variation shows where wind action has removed or concentrated surface dust. The "tails" of the windstreaks indicate wind direction, in this case from the lower right of the image towards the upper left. Orbit Number: 81738 Latitude: 38.9673 Longitude: 239.118 Instrument: VIS Captured: 2020-05-18 15:10 https://photojournal.jpl.nasa.gov/catalog/PIA24704

Today's VIS image contains sections of two of the many channel forms found radial to the Elysium Mons volcanic complex. In this case the fossae are located to the west of Elysium Mons. Elysium Fossae are comprised of both linear and sinuous channels, usually interpreted to have both fluid and tectonic forces playing a part in the formation. The linear depression resembles a graben (formed by tectonic forces) and sinuous channel more closely resembles features caused by fluid flow – either lava or water created by melting subsurface ice due to volcanic heating. The Elysium Fossae system is 1044 km (649 miles) in length. Orbit Number: 94395 Latitude: 25.0308 Longitude: 137.23 Instrument: VIS Captured: 2023-03-26 19:03 https://photojournal.jpl.nasa.gov/catalog/PIA26023

CAPE CANAVERAL, Fla. – Inside the Vehicle Assembly Building at NASA’s Kennedy Space Center in Florida, a ground support technician applies heat to a casing that contains an old bearing on the B truck tread of crawler-transporter 2, or CT-2. The bearing will separate and out for removal. New roller bearing assemblies will be installed on CT-2. Work continues in high bay 2 to upgrade CT-2. The modifications are designed to ensure CT-2’s ability to transport launch vehicles currently in development, such as the agency’s Space Launch System, to the launch pad. The Ground Systems Development and Operations Program office at Kennedy is overseeing the upgrades. For more than 45 years the crawler-transporters were used to transport the mobile launcher platform and the Apollo-Saturn V rockets and, later, space shuttles to Launch Pads 39A and B. For more information, visit: http://www.nasa.gov/exploration/systems/ground/crawler-transporter. Photo credit: NASA/Dimitri Gerondidakis
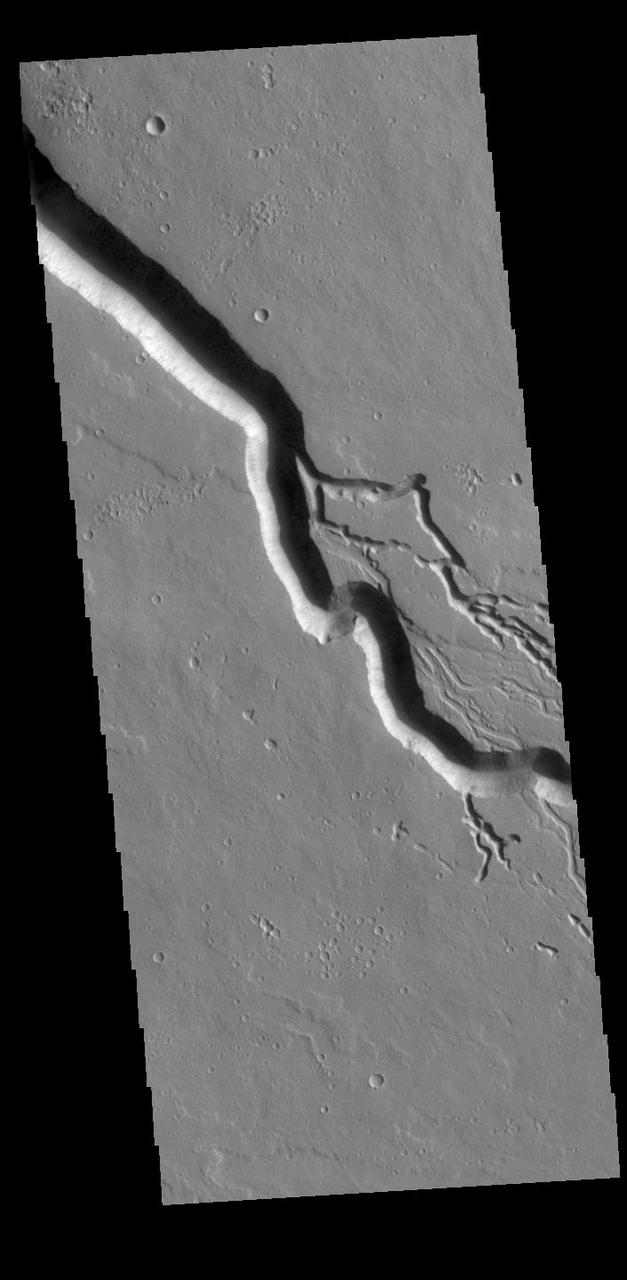
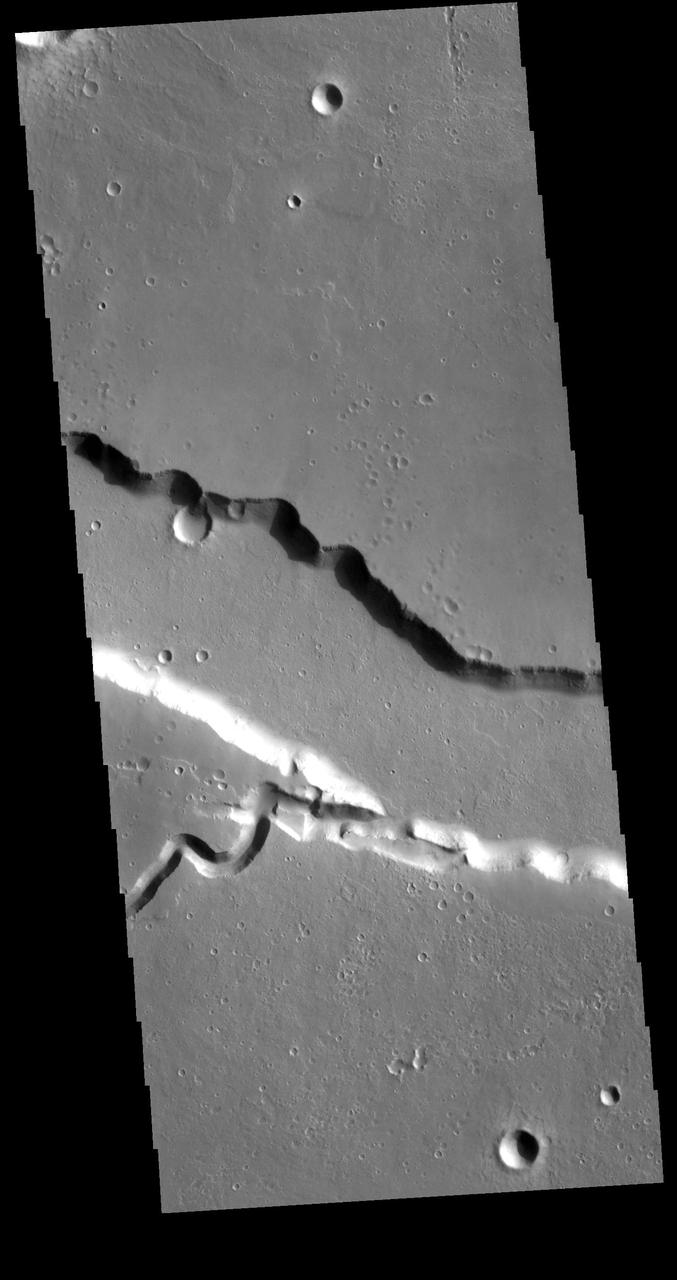
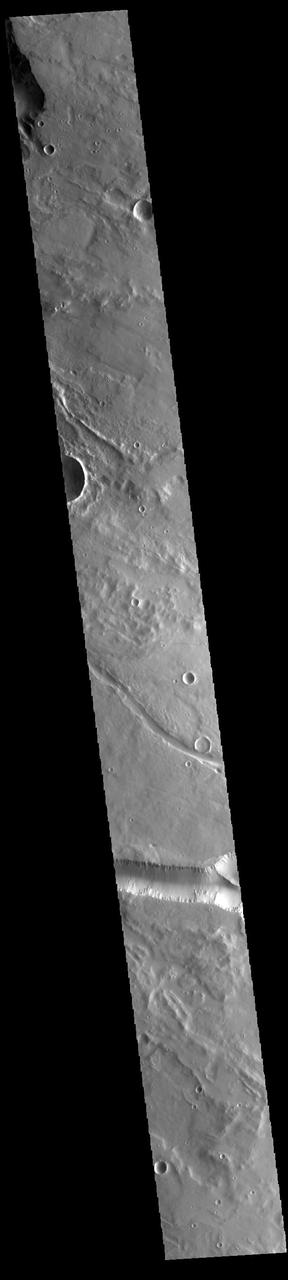
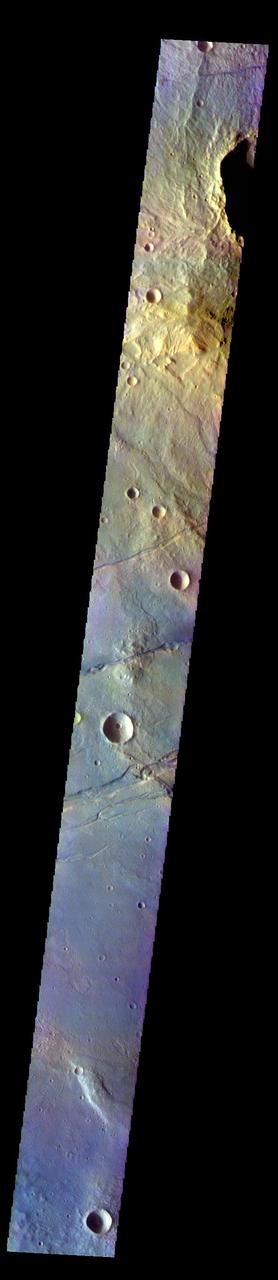
Today's VIS image contains a section of one of the many channel forms found radial to the Elysium Mons volcanic complex. In this case the fossae is located to the southeast of the volcano. The channel feature is thought to have both a tectonic and volcanic origin. The linear depression at the upper left of the image resembles a graben (formed by tectonic forces) and the smaller sinuous channels below the large linear depression more closely resemble features caused by fluid flow – either lava or water created by melting subsurface ice by volcanic heating. The linear depression is called Elysium Fossae, and the sinuous channel is called Iberus Vallis. Iberus Vallis is 87 km long (54 miles). Orbit Number: 88018 Latitude: 21.5352 Longitude: 151.454 Instrument: VIS Captured: 2021-10-17 17:04 https://photojournal.jpl.nasa.gov/catalog/PIA25110
Today's VIS image contains a section of one of the many channel forms found radial to the Elysium Mons volcanic complex. In this case the fossae are located to the west of Elysium Mons. Elysium Fossae are comprised of both linear and sinuous channels, usually interpreted to have both fluid and tectonic forces playing a part in the formation. The linear depression resembles a graben (formed by tectonic forces) and sinuous channels more closely resembles features caused by fluid flow – either lava or water created by melting subsurface ice due to volcanic heating. The Elysium Fossae system is 1044 km (649 miles) in length. Orbit Number: 93802 Latitude: 27.5316 Longitude: 137.172 Instrument: VIS Captured: 2023-02-05 23:55 https://photojournal.jpl.nasa.gov/catalog/PIA25901

CAPE CANAVERAL, Fla. -- At NASA's Kennedy Space Center Visitor Complex's Astronaut Memorial Mirror, Jerry Ross, chief of the Vehicle Integration Test Office holds onto the secure case containing the U.S. Honor Flag accompanied by Mark Borsi NASA security director (right) and a security guard. The flag is presented to NASA to be prepared to fly aboard space shuttle Atlantis on the Space Shuttle Program's final mission, STS-135. The U.S. Honor Flag has been flown nationwide, at Ground Zero and throughout the world to honor heroes who have lost their lives while serving their community and country, including police officers, firefighters, members of the Armed Forces and astronauts. More than 100 honor guard members traveled to the Space Coast to take part in the ceremony. After the flag returns to Earth, it will continue as a traveling memorial. Photo credit: NASA/Kim Shiflett
Today's VIS image contains a section of one of the many channel forms found radial to the Elysium Mons volcanic complex. In this case the fossae are located to the west of Elysium Mons. Elysium Fossae are comprised of both linear and sinuous channels, usually interpreted to have both fluid and tectonic forces playing a part in the formation. The linear depression resembles a graben (formed by tectonic forces) and sinuous channels more closely resembles features caused by fluid flow – either lava or water created by melting subsurface ice due to volcanic heating. The Elysium Fossae system is 1044 km (649 miles) in length. Orbit Number: 94320 Latitude: 29.5145 Longitude: 140.23 Instrument: VIS Captured: 2023-03-20 14:52 https://photojournal.jpl.nasa.gov/catalog/PIA26004
Today's VIS image contains a section of one of the many channel forms found radial to the Elysium Mons volcanic complex. In this case the fossae are located to the northwest of Elysium Mons. Elysium Fossae are comprised of both linear and sinuous channels, usually interpreted to have both fluid and tectonic forces playing a part in the formation. The linear depression resembles a graben (formed by tectonic forces) and sinuous channels more closely resembles features caused by fluid flow – either lava or water created by melting subsurface ice due to volcanic heating. The Elysium Fossae system is 1044 km (649 miles) in length. Orbit Number: 94058 Latitude: 29.9986 Longitude: 138.589 Instrument: VIS Captured: 2023-02-27 01:08 https://photojournal.jpl.nasa.gov/catalog/PIA25976
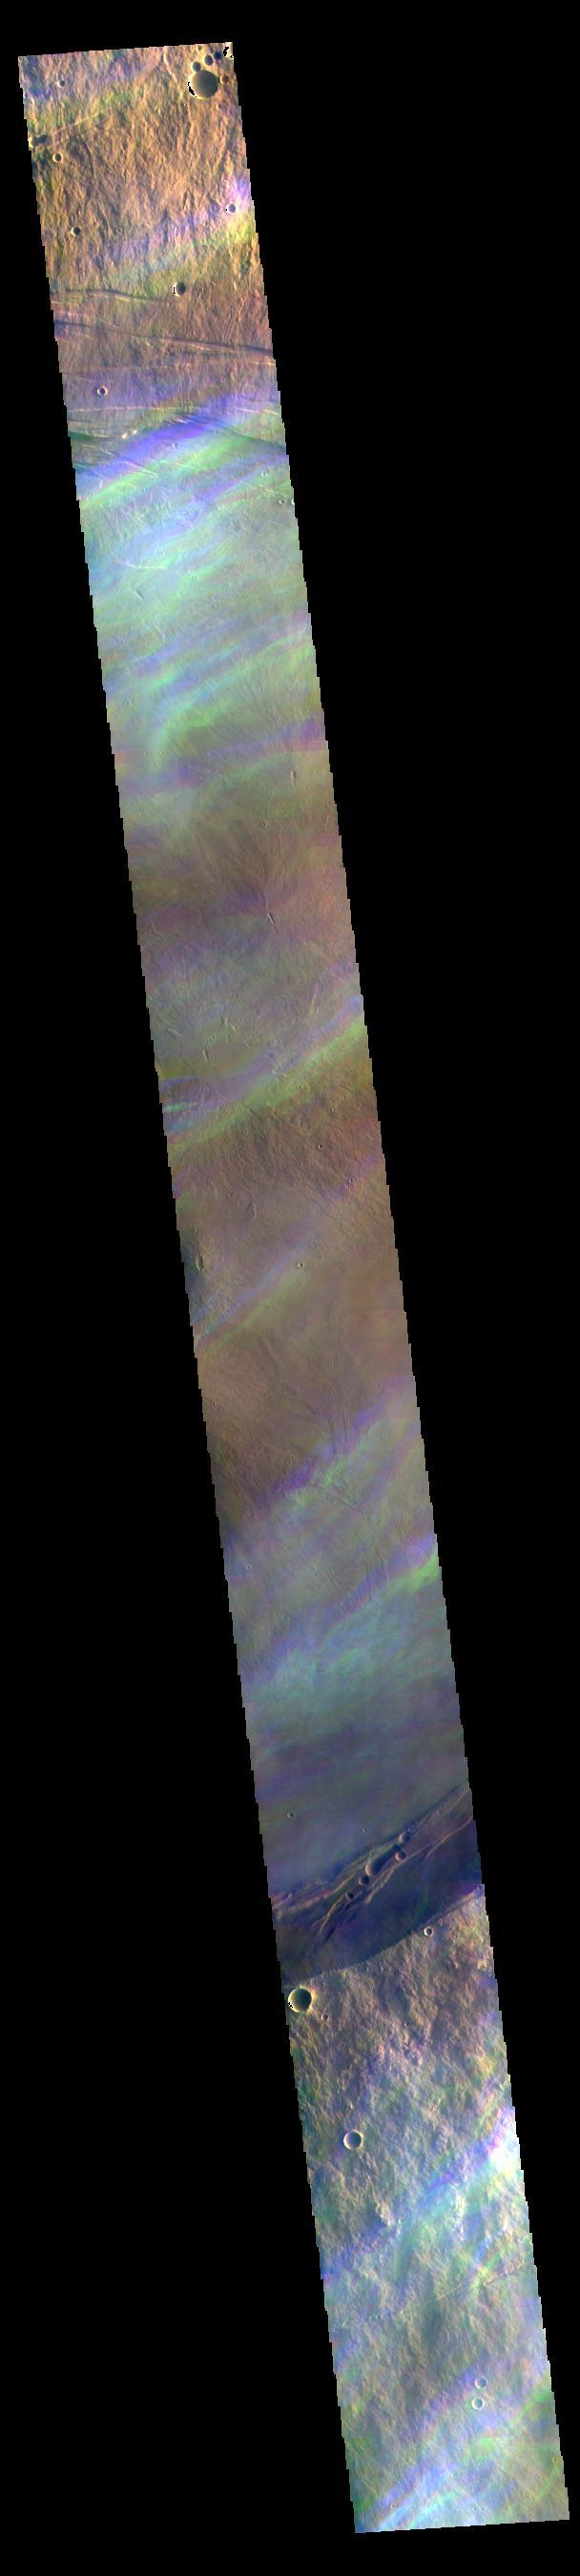
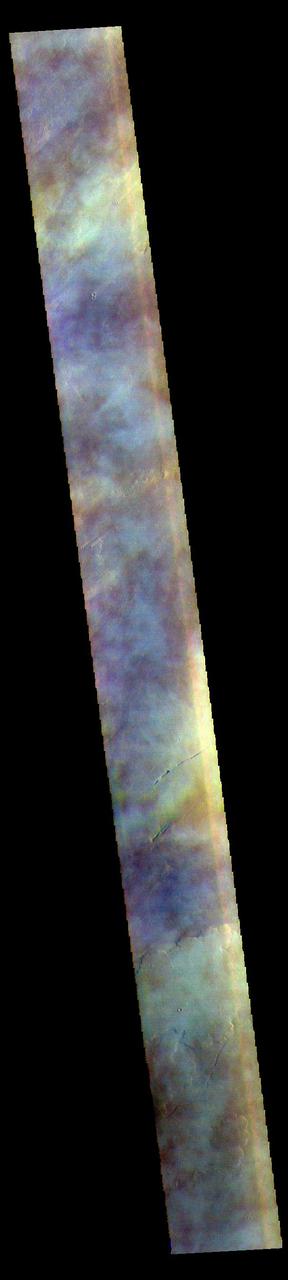
The THEMIS VIS camera contains 5 filters. The data from different filters can be combined in multiple ways to create a false color image. These false color images may reveal subtle variations of the surface not easily identified in a single band image. The 5 filters are collected with a short delay between them. In creating false color images of the surface, the surface is stable and each filter image is overlaid and "connected" based of the location of identical surface features. However, when there is movement occurring during the delay, the filters don't overlay well. In this case the movement is seen as bands of blue and yellow. These are ice rich clouds over the summit of Arsia Mons. The altitude of the clouds and speed they are blown by the wind is enough that there is significant difference in cloud locations between the short delay separating the filters. Imaging transient clouds allows for study of the atmosphere of Mars. Orbit Number: 60706 Latitude: -9.2731 Longitude: 239.942 Instrument: VIS Captured: 2015-08-21 06:46 https://photojournal.jpl.nasa.gov/catalog/PIA22713
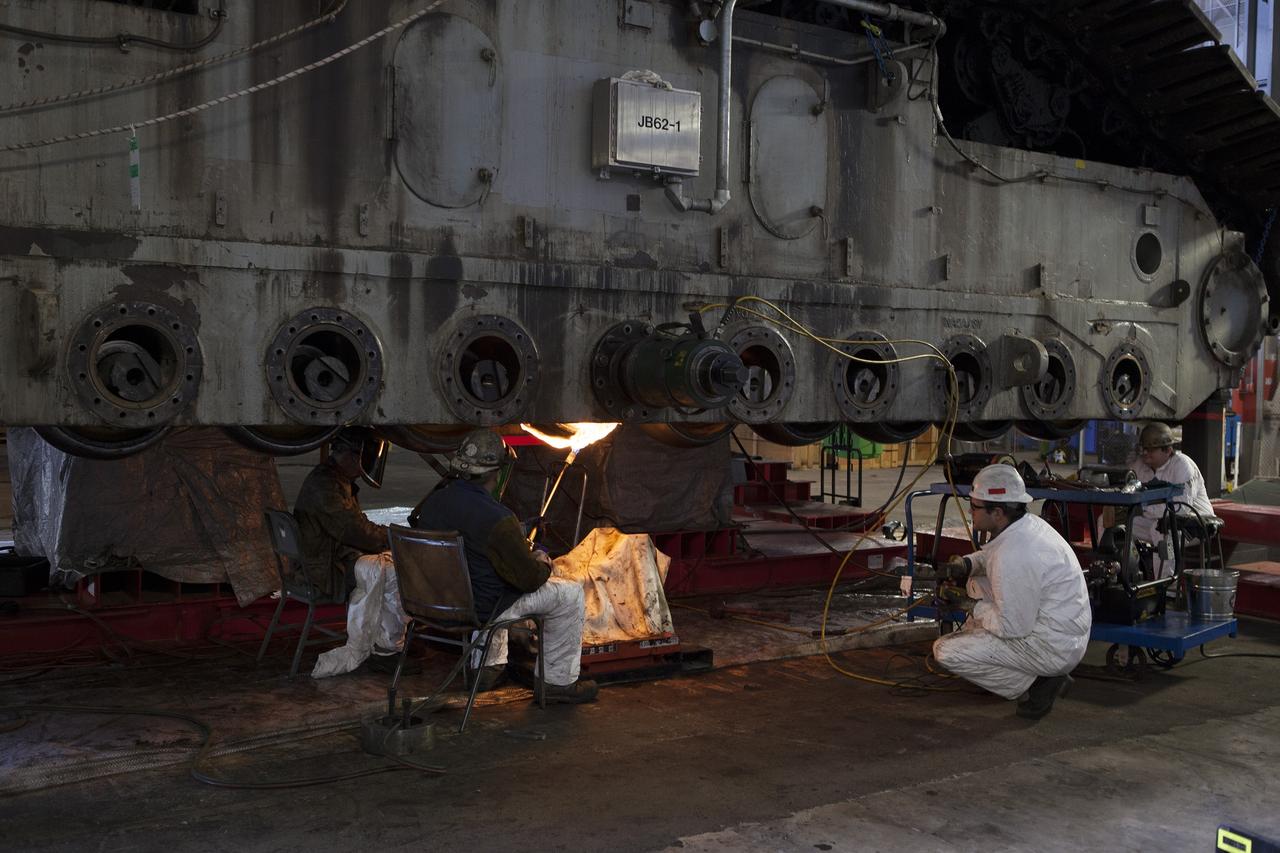
CAPE CANAVERAL, Fla. – Inside the Vehicle Assembly Building at NASA’s Kennedy Space Center in Florida, a ground support technician applies heat to a casing that contains an old bearing on the B truck tread of crawler-transporter 2, or CT-2, as other technicians monitor the progress. The bearing will separate and out for removal. New roller bearing assemblies will be installed on CT-2. Work continues in high bay 2 to upgrade CT-2. The modifications are designed to ensure CT-2’s ability to transport launch vehicles currently in development, such as the agency’s Space Launch System, to the launch pad. The Ground Systems Development and Operations Program office at Kennedy is overseeing the upgrades. For more than 45 years the crawler-transporters were used to transport the mobile launcher platform and the Apollo-Saturn V rockets and, later, space shuttles to Launch Pads 39A and B. For more information, visit: http://www.nasa.gov/exploration/systems/ground/crawler-transporter. Photo credit: NASA/Dimitri Gerondidakis
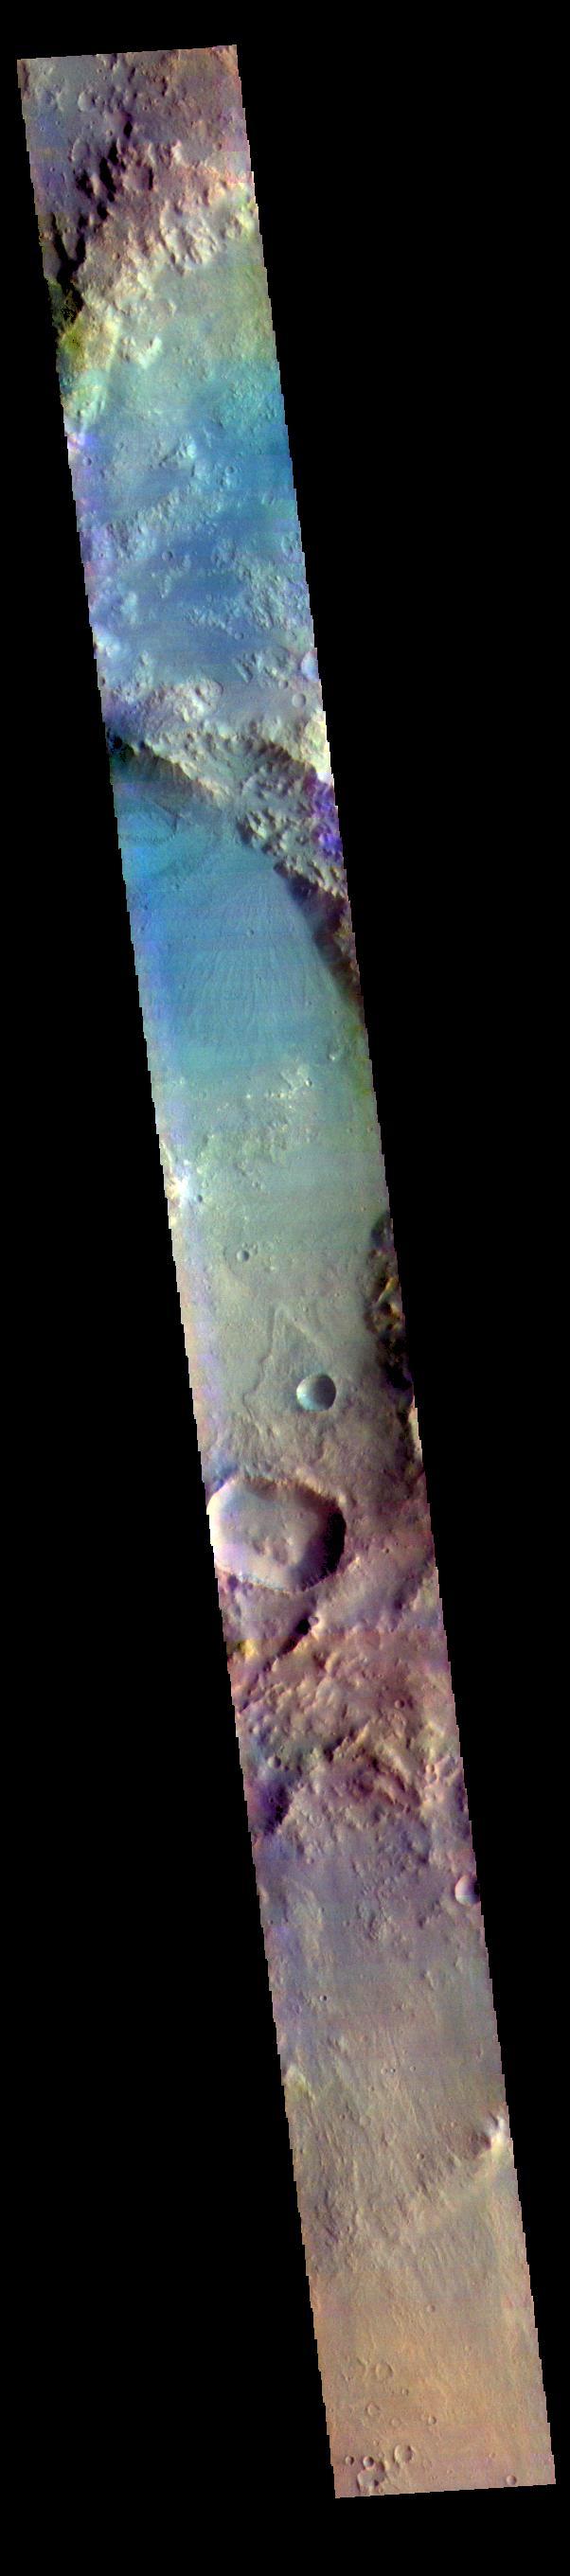
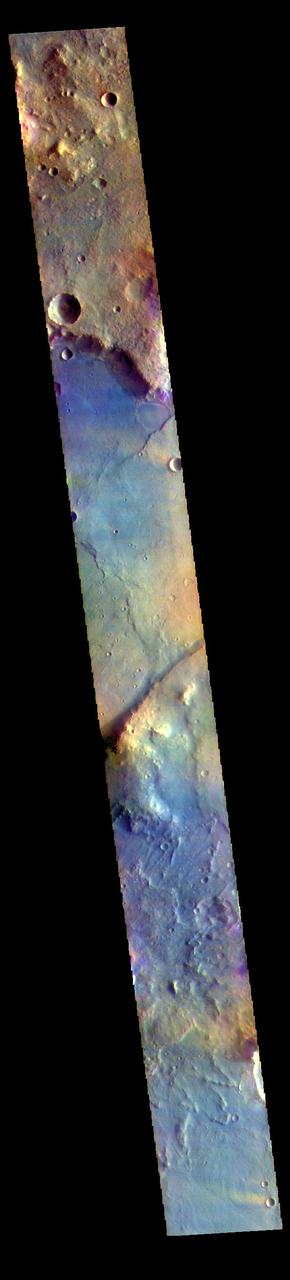
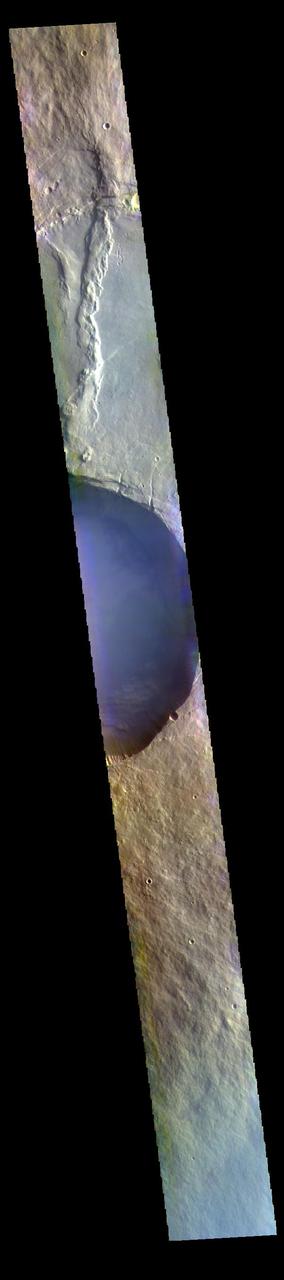
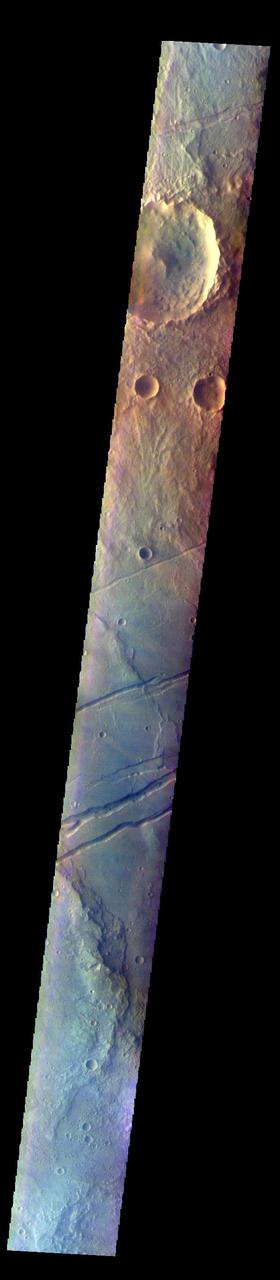
This false color image shows part of Harris crater (center of image) and an unnamed crater (top of image). These craters are located north of Hellas Planitia. At the upper right part of the Harris Crater rim, there is a fan shaped form. Fans can be created by different processes. Delta deposit fans are created under water, when a river flow slows down and drops sediments from the water column. These sediments are typically fine grained silts. Deltas form over time and can take many shapes as the river changes channels. The Mississippi River delta is formed this way. Alluvial fans are created in dry climates with short fluid seasons. In this case a single stream hits a topographic opening (think ravine) and sheds the rocks and sand down hill. The alluvial fan shape is created from the single opening. Either way, fans form by the action of a fluid. The THEMIS VIS camera contains 5 filters. The data from different filters can be combined in multiple ways to create a false color image. These false color images may reveal subtle variations of the surface not easily identified in a single band image. Orbit Number: 64642 Latitude: -21.9957 Longitude: 67.2664 Instrument: VIS Captured: 2016-07-10 10:43 https://photojournal.jpl.nasa.gov/catalog/PIA23611
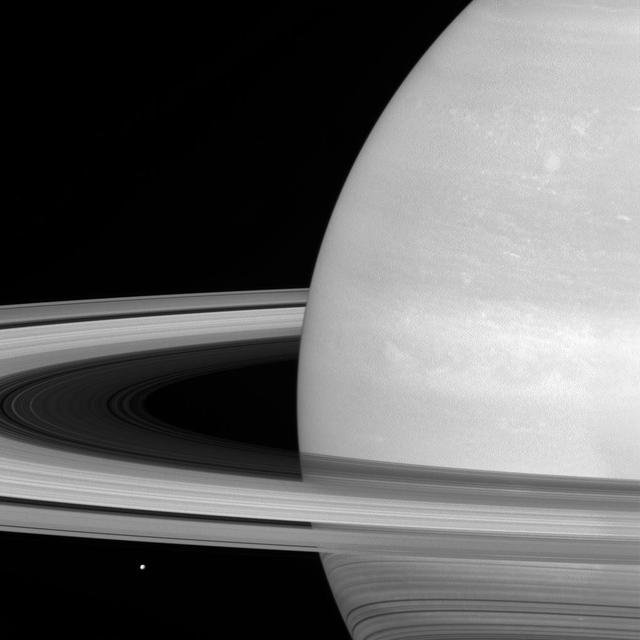
Saturn's icy moon Mimas is dwarfed by the planet's enormous rings. Because Mimas (near lower left) appears tiny by comparison, it might seem that the rings would be far more massive, but this is not the case. Scientists think the rings are no more than a few times as massive as Mimas, or perhaps just a fraction of Mimas' mass. Cassini is expected to determine the mass of Saturn's rings to within just a few hundredths of Mimas' mass as the mission winds down by tracking radio signals from the spacecraft as it flies close to the rings. The rings, which are made of small, icy particles spread over a vast area, are extremely thin -- generally no thicker than the height of a house. Thus, despite their giant proportions, the rings contain a surprisingly small amount of material. Mimas is 246 miles (396 kilometers) wide. This view looks toward the sunlit side of the rings from about 6 degrees above the ring plane. The image was taken in red light with the Cassini spacecraft wide-angle camera on July 21, 2016. The view was obtained at a distance of approximately 564,000 miles (907,000 kilometers) from Saturn and at a Sun-Saturn-spacecraft, or phase, angle of 31 degrees. Image scale is 34 miles (54 kilometers) per pixel. http://photojournal.jpl.nasa.gov/catalog/PIA20509
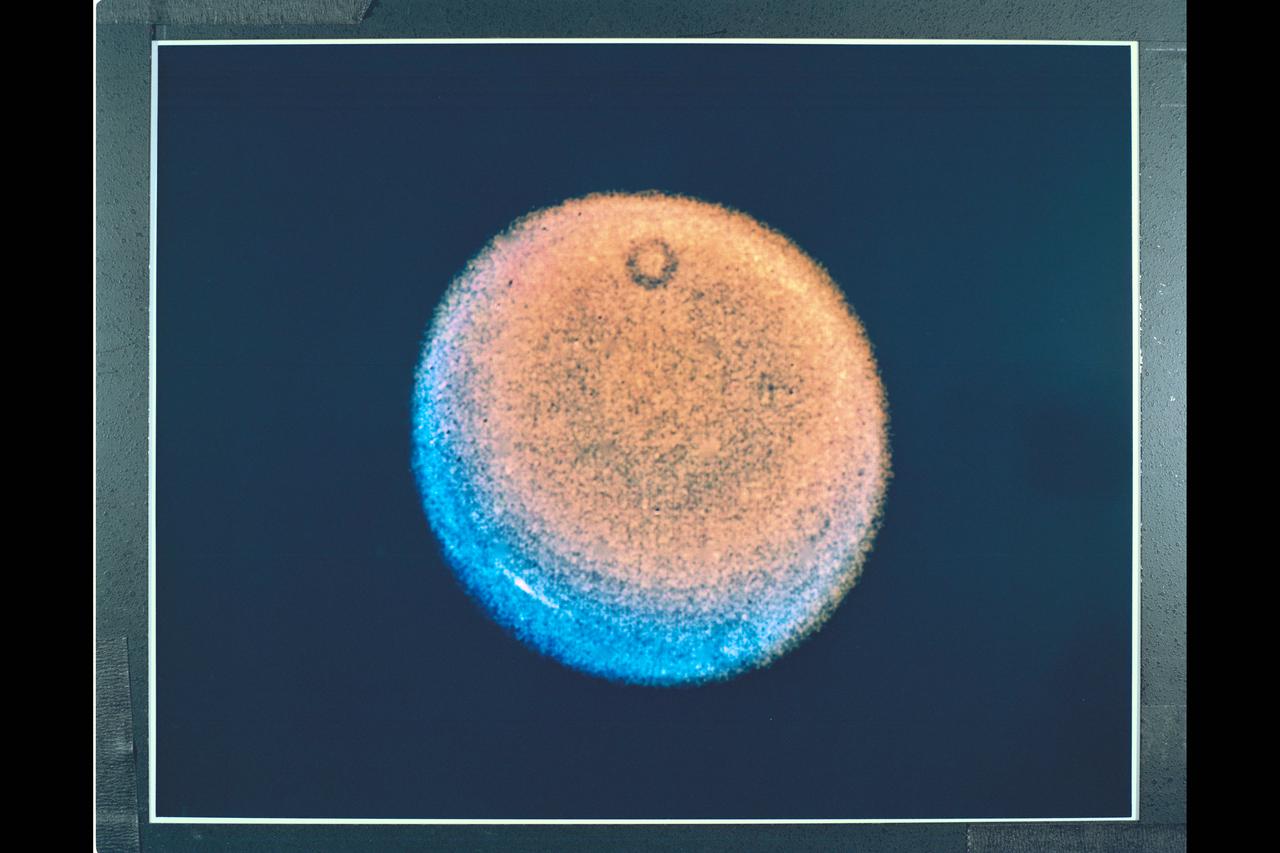
Range : 12.9 million miles (8.0 million miles) P-29468C This false color Voyager photograph of Uranus shows a discrete cloud seen as a bright streak near the planets limb. The cloud visible here is the most prominent feature seen in a series of Voyager images designed to track atmospheric motions. The occasional donut shaped features, including one at the bottom, are shadows cast by dust on the camera optics. The picture is a highly processed composite of three images. The processing necessary to bring out the faint features on the planet also brings out these camera blemishes. The three seperate images used where shot through violet, blue, and orange filters. Each color image showd the cloud to a different degree; because they were not exposed at the same time , the images were processed to provide a good spatial match. In a true color image, the cloud would be barely discernable; the false color helps to bring out additional details. The different colors imply variations in vertical structure, but as of yet it is not possible to be specific about such differences. One possiblity is that the uranian atmosphere may contain smog like constituents, in which case some color differences may represent differences in how these molecules are distributed.
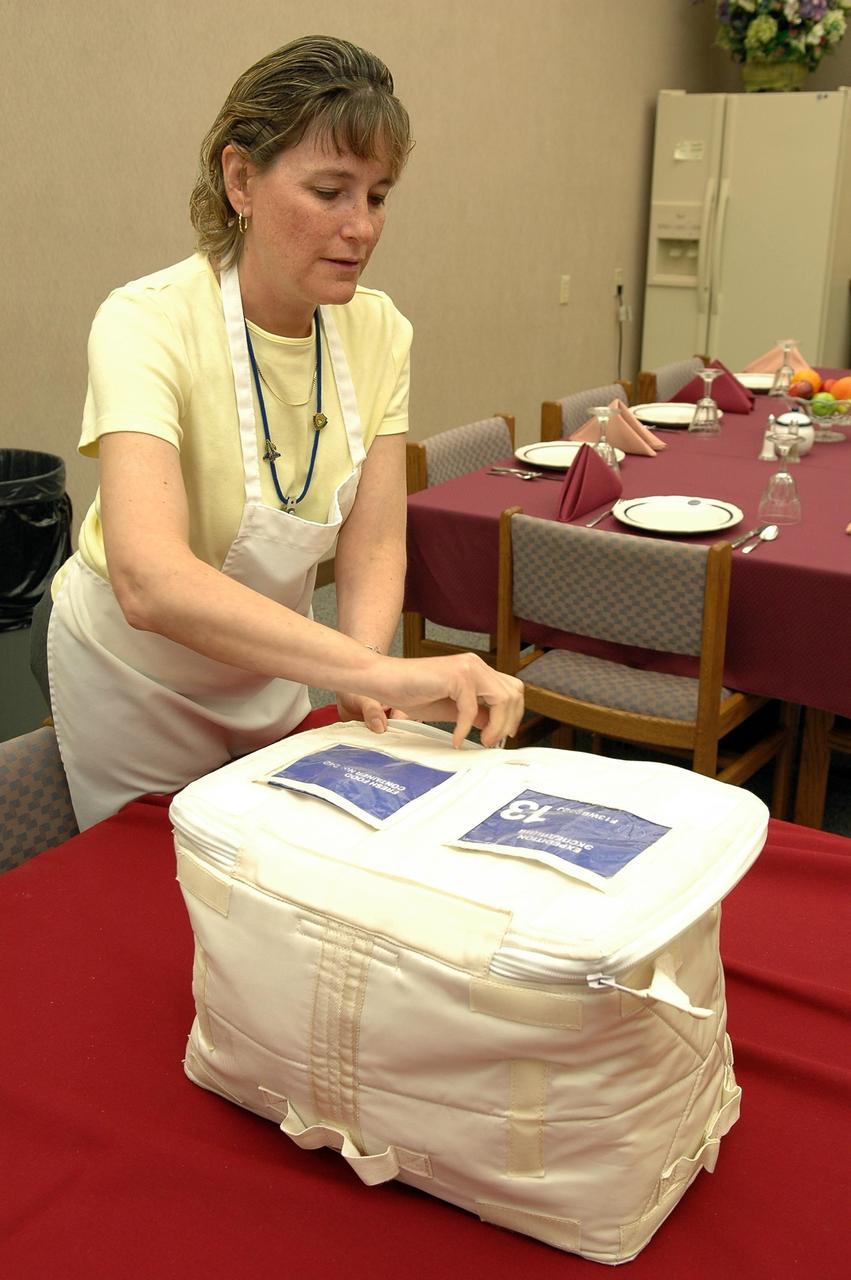
KENNEDY SPACE CENTER, FLA. - In the Operations and Checkout Building, Michele Perchonok closes a container of food packages that the STS-121 crew will eat on the 12-day mission. Perchonok is a NASA Subsystem manager for Shuttle Food Systems from Johnson Space Center. Astronauts select their own menus from a large array of food items. Astronauts are supplied with three balanced meals, plus snacks. Diets are designed to supply each astronaut with 100 percent of the daily value of vitamins and minerals necessary for the environment of space. Foods flown on space missions are researched and developed at the Space Food Systems Laboratory at the Johnson Space Center (JSC) in Houston, which is staffed by food scientists, dietitians and engineers. Foods are analyzed through nutritional analysis, sensory evaluation, storage studies, packaging evaluations and many other methods. Each astronaut’s food is stored aboard the space shuttle and is identified by a colored dot affixed to each package. A supplementary food supply (pantry) consisting of two extra days per person is stowed aboard the space shuttle for each flight. Pantry items are flown in addition to the menu in case the flight is unexpectedly extended because of bad weather at the landing site or for some other unforeseen reason. Photo credit: NASA/Kim Shiflett
The THEMIS VIS camera contains 5 filters. The data from different filters can be combined in multiple ways to create a false color image. These false color images may reveal subtle variations of the surface not easily identified in a single band image. Today's false color image shows a small portion of Tempe Fossae. The linear features are tectonic graben. Graben are formed by extension of the crust and faulting. When large amounts of pressure or tension are applied to rocks on timescales that are fast enough that the rock cannot respond by deforming, the rock breaks along faults. In the case of a graben, two parallel faults are formed by extension of the crust and the rock in between the faults drops downward into the space created by the extension. The complete fossae system in almost 2000 km (1242 miles) long. The THEMIS VIS camera is capable of capturing color images of the Martian surface using five different color filters. In this mode of operation, the spatial resolution and coverage of the image must be reduced to accommodate the additional data volume produced from using multiple filters. To make a color image, three of the five filter images (each in grayscale) are selected. Each is contrast enhanced and then converted to a red, green, or blue intensity image. These three images are then combined to produce a full color, single image. Because the THEMIS color filters don't span the full range of colors seen by the human eye, a color THEMIS image does not represent true color. Also, because each single-filter image is contrast enhanced before inclusion in the three-color image, the apparent color variation of the scene is exaggerated. Nevertheless, the color variation that does appear is representative of some change in color, however subtle, in the actual scene. Note that the long edges of THEMIS color images typically contain color artifacts that do not represent surface variation. Orbit Number: 94065 Latitude: 46.5357 Longitude: 293.867 Instrument: VIS Captured: 2023-02-27 15:03 https://photojournal.jpl.nasa.gov/catalog/PIA26125
The THEMIS VIS camera contains 5 filters. The data from different filters can be combined in multiple ways to create a false color image. These false color images may reveal subtle variations of the surface not easily identified in a single band image. Today's false color image shows part of the vast volcanic plains in the Tharsis region, in this case east of Pavonis Mons. The mottled appearance of the image is being caused by high altitude cloud cover. These clouds will be primarily composed of ice rather than dust. The THEMIS VIS camera is capable of capturing color images of the Martian surface using five different color filters. In this mode of operation, the spatial resolution and coverage of the image must be reduced to accommodate the additional data volume produced from using multiple filters. To make a color image, three of the five filter images (each in grayscale) are selected. Each is contrast enhanced and then converted to a red, green, or blue intensity image. These three images are then combined to produce a full color, single image. Because the THEMIS color filters don't span the full range of colors seen by the human eye, a color THEMIS image does not represent true color. Also, because each single-filter image is contrast enhanced before inclusion in the three-color image, the apparent color variation of the scene is exaggerated. Nevertheless, the color variation that does appear is representative of some change in color, however subtle, in the actual scene. Note that the long edges of THEMIS color images typically contain color artifacts that do not represent surface variation. Orbit Number: 85818 Latitude: 6.41017 Longitude: 260.984 Instrument: VIS Captured: 2021-04-19 13:31 https://photojournal.jpl.nasa.gov/catalog/PIA25096
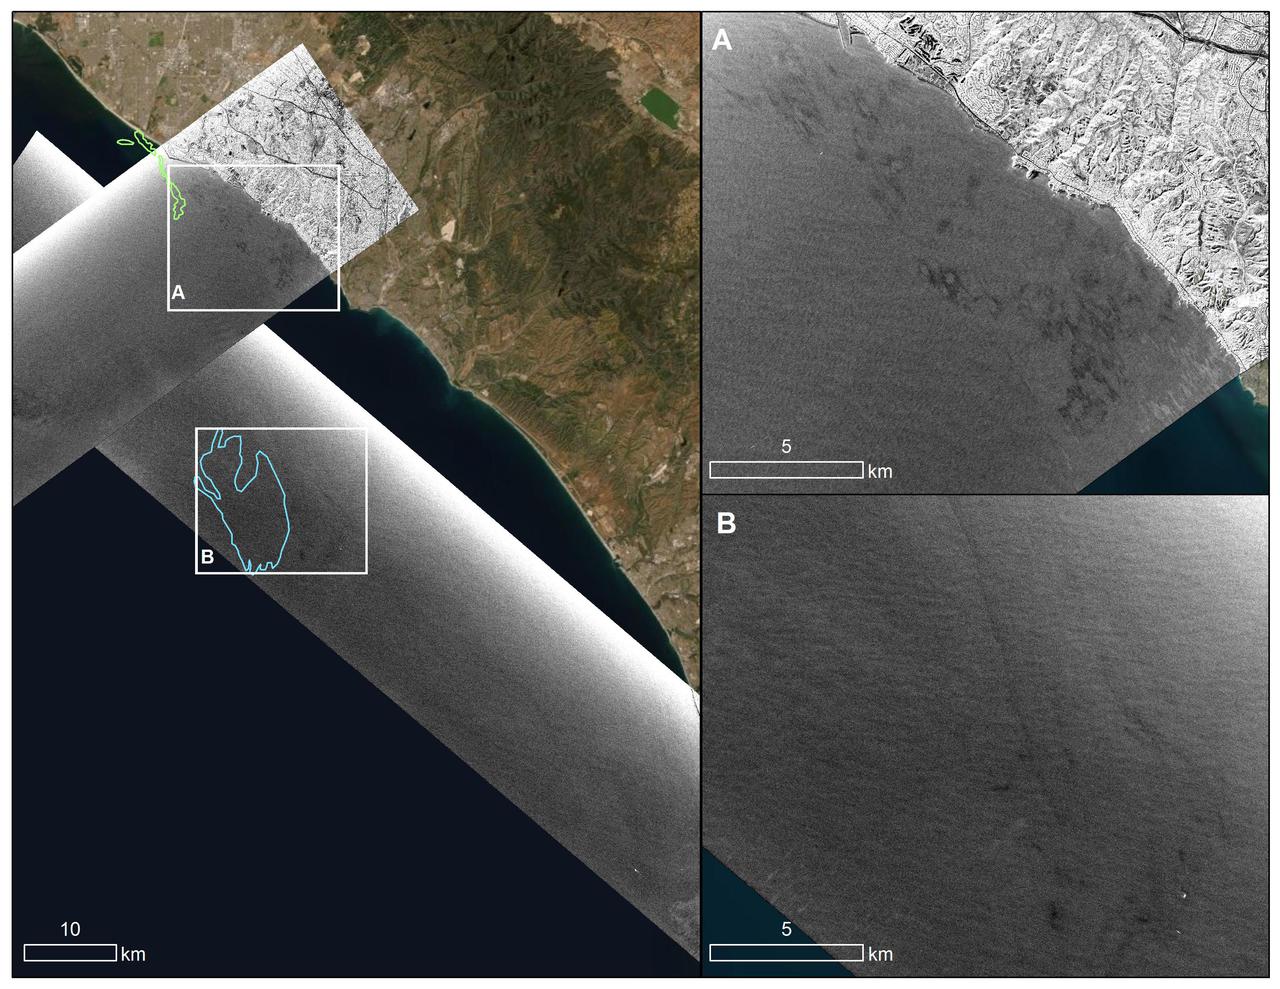
An oil spill off the Southern California coast – first reported to the U.S. Coast Guard on Oct. 2, 2021 – prompted an effort by NASA's Applied Sciences Disasters Program to determine what NASA resources and capabilities could be available to support response efforts for the spill. As part of those efforts, a team from NASA's Jet Propulsion Laboratory in Southern California flew an airplane equipped with an instrument known as the Uninhabited Aerial Vehicle Synthetic Aperture Radar (UAVSAR) over the spill area on Oct. 6 to corroborate the presence and location of oil slicks. Mapping the location of oil slicks and determining how thick the oil is can also help with clean-up activities. The JPL researchers collected the UAVSAR data in support of the National Oceanic and Atmospheric Administration (NOAA), which regularly monitors U.S. coastal waters for potential spills. This image shows a composite of two images taken during passes (grayscale regions) made by the UAVSAR instrument off the coast of Huntington Beach. Dark smudges off the coast in the close-up images to the right (labeled A and B) are potential oil slicks – NOAA researchers will analyze the data to look for the presence of oil. The area outlined in light green (image on the left) was identified by NOAA using satellite data as a region possibly containing oil on Oct.3, while the blue outline shows an area on Oct. 6 that could also contain oil. Attached to the bottom of a Gulfstream-III based at NASA's Armstrong Flight Research Center near Palmdale, California, UAVSAR is an all-weather tool that bounces radar signals off of Earth's surface. Repeated images of the same areas, taken at different times, enable scientists to detect changes in those regions. The radar signals will reflect differently off of different surfaces, including oil and seawater. These signal variations can tell researchers about the presence of an oil slick in the ocean, and in some cases provide information about its thickness. https://photojournal.jpl.nasa.gov/catalog/PIA23782
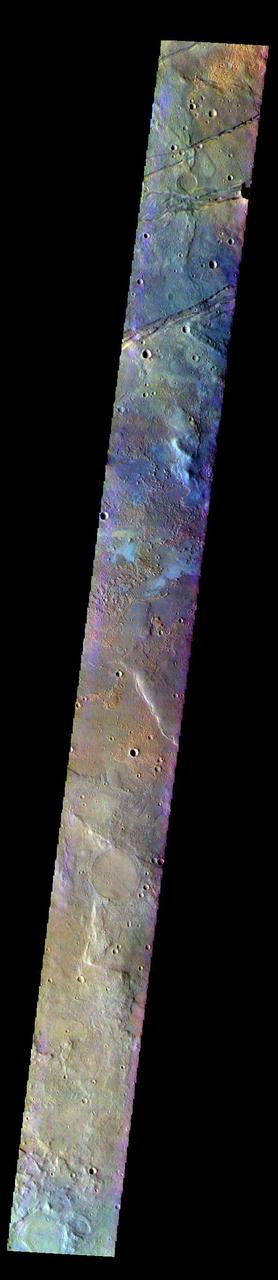
The THEMIS VIS camera contains 5 filters. The data from different filters can be combined in multiple ways to create a false color image. These false color images may reveal subtle variations of the surface not easily identified in a single band image. Today's false color image shows part of Nili Fossae. Nili Fossae is a collection of curved faults and down-dropped blocks of crust between the faults called graben. The graben lie northeast of the large volcano Syrtis Major and northwest of the ancient impact basin Isidis Planitia. The linear ridge in the center of the image is one side of a very large graben. When large amounts of pressure or tension are applied to rocks on timescales that are fast enough that the rock cannot respond by deforming, the rock breaks along faults. In the case of a graben, two parallel faults are formed by extension of the crust and the rock in between the faults drops downward into the space created by the extension. The THEMIS VIS camera is capable of capturing color images of the Martian surface using five different color filters. In this mode of operation, the spatial resolution and coverage of the image must be reduced to accommodate the additional data volume produced from using multiple filters. To make a color image, three of the five filter images (each in grayscale) are selected. Each is contrast enhanced and then converted to a red, green, or blue intensity image. These three images are then combined to produce a full color, single image. Because the THEMIS color filters don't span the full range of colors seen by the human eye, a color THEMIS image does not represent true color. Also, because each single-filter image is contrast enhanced before inclusion in the three-color image, the apparent color variation of the scene is exaggerated. Nevertheless, the color variation that does appear is representative of some change in color, however subtle, in the actual scene. Note that the long edges of THEMIS color images typically contain color artifacts that do not represent surface variation. Orbit Number: 85787 Latitude: 19.3564 Longitude: 73.5306 Instrument: VIS Captured: 2021-04-17 00:20 https://photojournal.jpl.nasa.gov/catalog/PIA25093

This image was captured by the NASA/ESA Hubble Space Telescope’s Advanced Camera for Surveys (ACS), a highly efficient wide-field camera covering the optical and near-infrared parts of the spectrum. While this lovely image contains hundreds of distant stars and galaxies, one vital thing is missing — the object Hubble was actually studying at the time! This is not because the target has disappeared. The ACS actually uses two detectors: the first captures the object being studied — in this case an open star cluster known as NGC 299 — while the other detector images the patch of space just ‘beneath’ it. This is what can be seen here. Technically, this picture is merely a sidekick of the actual object of interest — but space is bursting with activity, and this field of bright celestial bodies offers plenty of interest on its own. It may initially seem to show just stars, but a closer look reveals many of these tiny objects to be galaxies. The spiral galaxies have arms curving out from a bright center. The fuzzier, less clearly shaped galaxies might be ellipticals. Some of these galaxies contain millions or even billions of stars, but are so distant that all of their starry residents are contained within just a small pinprick of light that appears to be the same size as a single star! The bright blue dots are very hot stars, sometimes distorted into crosses by the struts supporting Hubble’s secondary mirror. The redder dots are cooler stars, possibly in the red giant phase when a dying star cools and expands. Credit: ESA/Hubble & NASA <b><a href="http://www.nasa.gov/audience/formedia/features/MP_Photo_Guidelines.html" rel="nofollow">NASA image use policy.</a></b> <b><a href="http://www.nasa.gov/centers/goddard/home/index.html" rel="nofollow">NASA Goddard Space Flight Center</a></b> enables NASA’s mission through four scientific endeavors: Earth Science, Heliophysics, Solar System Exploration, and Astrophysics. Goddard plays a leading role in NASA’s accomplishments by contributing compelling scientific knowledge to advance the Agency’s mission. <b>Follow us on <a href="http://twitter.com/NASAGoddardPix" rel="nofollow">Twitter</a></b> <b>Like us on <a href="http://www.facebook.com/pages/Greenbelt-MD/NASA-Goddard/395013845897?ref=tsd" rel="nofollow">Facebook</a></b> <b>Find us on <a href="http://instagrid.me/nasagoddard/?vm=grid" rel="nofollow">Instagram</a></b>
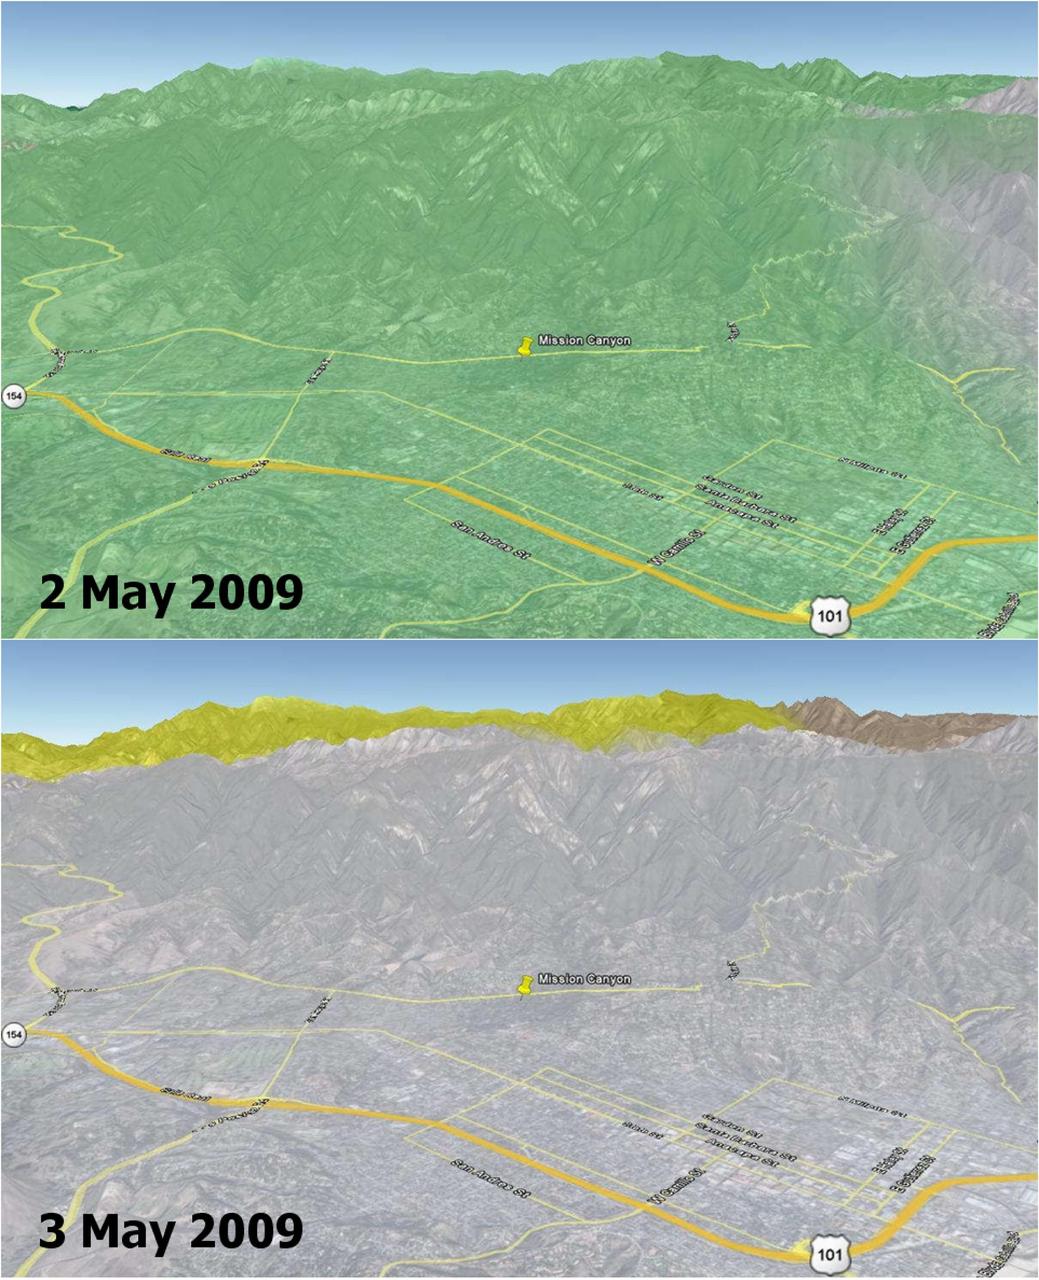
Wildfires are a recurring natural hazard faced by Californians. In Santa Barbara County, a wildfire, called the Jesusita fire, ignited on May 5, 2009 in the Cathedral Peak area northwest of Mission Canyon. As of midday May 8, the fire, which was 10-percent contained, had scorched 3,500 acres, damaged or destroyed 75 structures, and had forced the evacuation of tens of thousands of residents. This image shows soil moisture change in the top soil layer (2-inches deep) on 2 and 3 May 2009, as measured by the NASA QuikSCAT satellite scatterometer (radar). Rainwater increased the amount of moisture in the soil by a moderate 4 percent (represented by the green color) on May 2, which rapidly dried up on the next day (0 percent, as depicted by the grey color on May 3). Son Nghiem of JPL is leading a science team to develop wildfire applications using QuikScat data. “Information critical to assessing the conditions leading to wildfires can be obtained from NASA’s SeaWinds scatterometer, a stable and accurate radar aboard the QuikScat satellite,” says Dr. Son Nghiem, a JPL scientist in remote sensing. This is accomplished by using QuikScat data to map moisture changes in the topsoil. As such, QuikScat can detect rainwater that actually reaches the land surface and accumulates on it, rather than raindrops in the air. While rain radars may detect a significant rain rate, rainwater may evaporate in part before reaching the surface. For example, in the case of dry thunderstorm (known as virga), raindrops disappear on the way down, leaving the land dry, while the associated lightning ignites fires. For the case of the current fire in Santa Barbara, QuikScat detected a moderate increase of 4 percent in soil moisture on May 2, while rain radar data seemed to indicate a significant and extensive rain. The next day, QuikScat revealed that whatever rainwater that had accumulated earlier quickly dried up over the whole area. The maximum temperature in Santa Barbara approached 90 degrees Fahrenheit and broke the record set in 1984. An important characteristic of QuikScat measurements is that they represent the average conditions over the whole area, rather than some disparate data collected at a few localized points. The rapid dry-up in Santa Barbara together with high temperatures and high winds led to the devastating Jesusita fire. http://photojournal.jpl.nasa.gov/catalog/PIA12006
This image from NASA’s James Webb Space Telescope, containing nearly 800,000 galaxies, is overlaid with a map of dark matter, represented in blue. Brighter blue areas indicate a higher density of dark matter. Researchers used Webb data to find the dark matter — which is invisible — via its gravitational influence on regular matter. The area of sky shown here is 0.54 square degrees (about 2½ times the size of the full Moon) and located in the constellation Sextans. Webb’s Near-Infrared Camera (NIRCam) peered at this region for a total of about 255 hours. Dark matter doesn’t emit, reflect, absorb, or even block light, and is therefore not visible to the human eye or traditional telescopes. But it does interact with the universe through gravity, and large clumps or clusters of dark matter have enough mass to curve space itself. Light traveling to Earth from distant galaxies becomes slightly distorted as it passes through the curved fabric of spacetime. In some cases, the warping is significant enough that it is apparent to the naked eye, almost as if the galaxy were being viewed through a warped windowpane, an effect called strong gravitational lensing. In the case of the dark matter map shown here, scientists inferred dark matter’s distribution by relying instead on an effect called weak gravitational lensing, which leads to much more subtle distortions of the light from thousands of galaxies. The dark matter in this area of sky was also mapped in 2007 using data from NASA’s Hubble Space Telescope. The Webb map contains about 10 times more galaxies than do maps of the area made by ground-based observatories and twice as many as Hubble’s map. It reveals new clumps of dark matter and captures a higher-resolution view compared to the Hubble map. Both the Hubble and Webb dark matter maps are part of a project called the Cosmic Evolution Survey (COSMOS). The full COSMOS “field” is 2 square degrees (about 10 times the size of the full Moon) and has been imaged by at least 15 telescopes in space and on the ground. Observing the same region with many different telescopes allows scientists to combine complementary views to understand how galaxies grow and how dark matter influences their evolution. Only Webb and Hubble data have been used to map dark matter in the region. To refine measurements of the distance to many galaxies for the map, the team used Webb’s Mid-Infrared Instrument (MIRI), designed and managed through launch by the agency’s Jet Propulsion Laboratory, along with other space- and ground-based telescopes. The wavelengths that MIRI detects also make it adept at detecting galaxies obscured by cosmic dust clouds. The James Webb Space Telescope is solving mysteries in our solar system, looking beyond to distant worlds around other stars, and probing the mysterious structures and origins of our universe and our place in it. Webb is an international program led by NASA with its partners, ESA (European Space Agency) and CSA (Canadian Space Agency). Webb’s MIRI was developed through a 50-50 partnership between NASA and ESA. A division of Caltech in Pasadena, California, JPL led the U.S. contribution to MIRI. JPL also led development of MIRI’s cryocooler, done in collaboration with Northrop Grumman in Redondo Beach, California, and NASA’s Goddard Space Flight Center in Greenbelt, Maryland. To learn more about Webb, visit: https://science.nasa.gov/webb
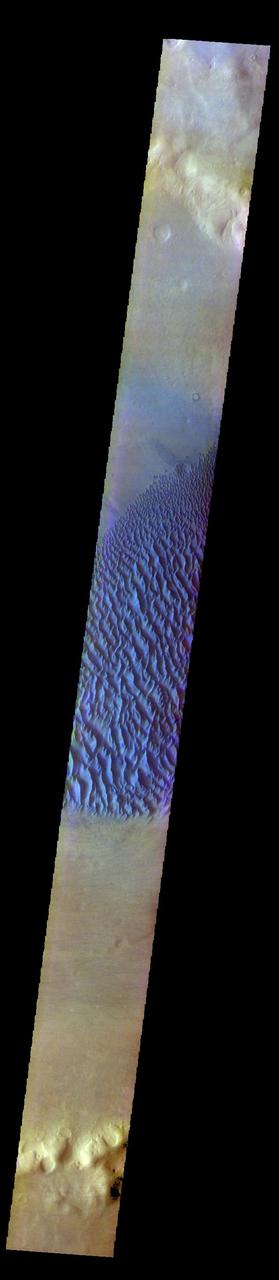
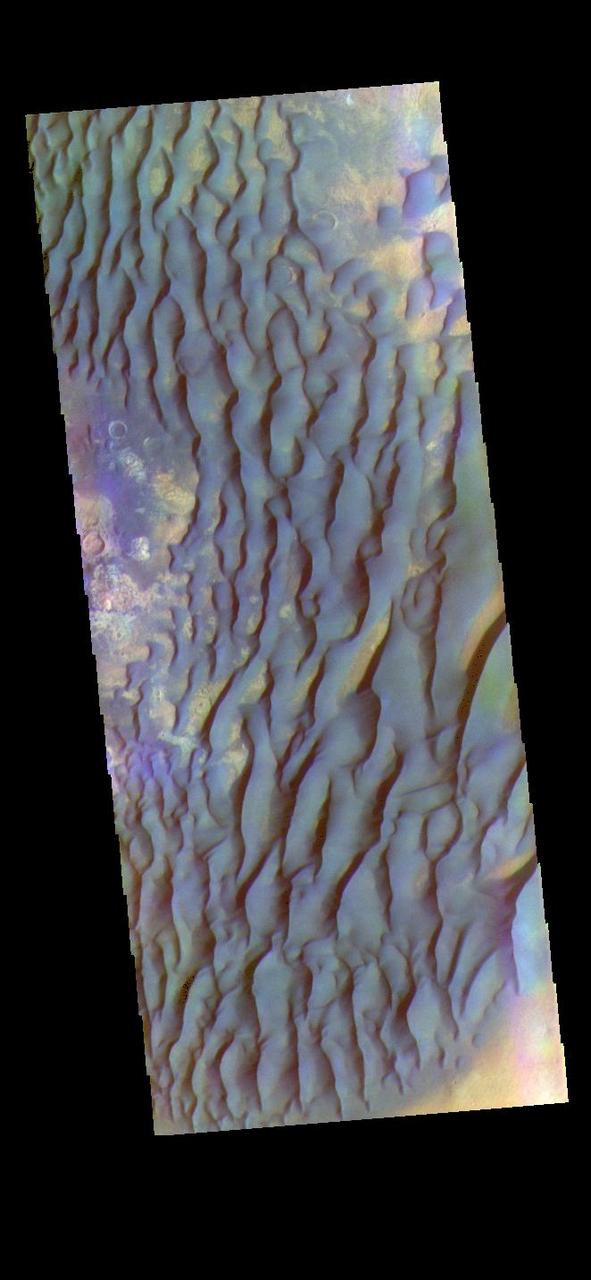
The THEMIS VIS camera contains 5 filters. The data from different filters can be combined in multiple ways to create a false color image. These false color images may reveal subtle variations of the surface not easily identified in a single band image. Today's false color image shows Proctor Crater and the large dune field on the crater floor. These dunes are composed of basaltic sand that has collected in the bottom of the crater. The topographic depression of the crater forms a sand trap that prevents the sand from escaping. Dune fields are common in the bottoms of craters on Mars and appear as dark splotches that lean up against the downwind walls of the craters. Dunes are useful for studying both the geology and meteorology of Mars. The sand forms by erosion of larger rocks, but it is unclear when and where this erosion took place on Mars or how such large volumes of sand could be formed. The dunes also indicate the local wind directions by their morphology. In this case, there are few clear slipfaces that would indicate the downwind direction. The crests of the dunes also typically run north-south in the image. This dune form indicates that there are probably two prevailing wind directions that run east and west (left to right and right to left). Proctor Crater is located in Noachis Terra and is 172km (107miles) in diameter. The THEMIS VIS camera is capable of capturing color images of the Martian surface using five different color filters. In this mode of operation, the spatial resolution and coverage of the image must be reduced to accommodate the additional data volume produced from using multiple filters. To make a color image, three of the five filter images (each in grayscale) are selected. Each is contrast enhanced and then converted to a red, green, or blue intensity image. These three images are then combined to produce a full color, single image. Because the THEMIS color filters don't span the full range of colors seen by the human eye, a color THEMIS image does not represent true color. Also, because each single-filter image is contrast enhanced before inclusion in the three-color image, the apparent color variation of the scene is exaggerated. Nevertheless, the color variation that does appear is representative of some change in color, however subtle, in the actual scene. Note that the long edges of THEMIS color images typically contain color artifacts that do not represent surface variation. Orbit Number: 93120 Latitude: -47.5698 Longitude: 30.2743 Instrument: VIS Captured: 2022-12-11 18:38 https://photojournal.jpl.nasa.gov/catalog/PIA26124
The THEMIS VIS camera contains 5 filters. The data from different filters can be combined in multiple ways to create a false color image. These false color images may reveal subtle variations of the surface not easily identified in a single band image. Today's false color image shows a cross section of Pavonis Mons, including part of the summit caldera (circular depression). This caldera is approximately 5km (3 miles) deep, much deeper that the larger caldera that surrounds the northern and eastern sides of the small caldera. Pavonis Mons, like the other large volcanoes in the region, is a shield volcano. Shield volcanoes are formed by lava flows originating near or at the summit, building up layers upon layers of lava. In shield volcanoes summit calderas are typically formed where the surface collapses into the void formed by an emptied magma chamber. Pavonis Mons is one of the three aligned Tharsis Volcanoes. In order from north to south are Ascreaus Mons, Pavonis Mons and Arsia Mons. The three aligned volcanoes are located along a topographic rise in the Tharsis region. Along this trend there are increased tectonic features and additional lava flows that arose from the flanks of the volcanoes rather than the summit. Pavonis Mons is the smallest of the three volcanoes, rising 14 km (8 miles) above the mean Mars surface level with a width of 375 km (233 miles). Like most shield volcanoes the surface has a low profile. In the case of Pavonis Mons the average slope is only 4 degrees. The THEMIS VIS camera is capable of capturing color images of the Martian surface using five different color filters. In this mode of operation, the spatial resolution and coverage of the image must be reduced to accommodate the additional data volume produced from using multiple filters. To make a color image, three of the five filter images (each in grayscale) are selected. Each is contrast enhanced and then converted to a red, green, or blue intensity image. These three images are then combined to produce a full color, single image. Because the THEMIS color filters don't span the full range of colors seen by the human eye, a color THEMIS image does not represent true color. Also, because each single-filter image is contrast enhanced before inclusion in the three-color image, the apparent color variation of the scene is exaggerated. Nevertheless, the color variation that does appear is representative of some change in color, however subtle, in the actual scene. Note that the long edges of THEMIS color images typically contain color artifacts that do not represent surface variation. Orbit Number: 94566 Latitude: 0.498282 Longitude: 247.385 Instrument: VIS Captured: 2023-04-09 20:50 https://photojournal.jpl.nasa.gov/catalog/PIA26130
The THEMIS VIS camera contains 5 filters. The data from different filters can be combined in multiple ways to create a false color image. These false color images may reveal subtle variations of the surface not easily identified in a single band image. Today's false color image shows part of Terra Sirenum. The linear features at the top of the image are tectonic features called graben. These graben are part of Sirenum Fossae. Graben are formed by extension of the crust and faulting. When large amounts of pressure or tension are applied to rocks on timescales that are fast enough that the rock cannot respond by deforming, the rock breaks along faults. In the case of a graben, two parallel faults are formed by extension of the crust and the rock in between the faults drops downward into the space created by the extension.The graben in this image are trending from north-northeast to south-southwest. Because the faults defining the graben are formed perpendicular to the direction of the applied stress, we know that extensional forces were pulling the crust apart in the west-northwest/east-southeast direction. The Sirenum Fossae graben are 2735km (1700 miles) long. The THEMIS VIS camera is capable of capturing color images of the Martian surface using five different color filters. In this mode of operation, the spatial resolution and coverage of the image must be reduced to accommodate the additional data volume produced from using multiple filters. To make a color image, three of the five filter images (each in grayscale) are selected. Each is contrast enhanced and then converted to a red, green, or blue intensity image. These three images are then combined to produce a full color, single image. Because the THEMIS color filters don't span the full range of colors seen by the human eye, a color THEMIS image does not represent true color. Also, because each single-filter image is contrast enhanced before inclusion in the three-color image, the apparent color variation of the scene is exaggerated. Nevertheless, the color variation that does appear is representative of some change in color, however subtle, in the actual scene. Note that the long edges of THEMIS color images typically contain color artifacts that do not represent surface variation. Orbit Number: 91654 Latitude: -33.0364 Longitude: 206.174 Instrument: VIS Captured: 2022-08-13 01:31 https://photojournal.jpl.nasa.gov/catalog/PIA26083
The THEMIS VIS camera contains 5 filters. The data from different filters can be combined in multiple ways to create a false color image. These false color images may reveal subtle variations of the surface not easily identified in a single band image. Today's false color image shows part of Sirenum Fossae. The linear depressions in this VIS image are tectonic graben. Graben are formed by extension of the crust and faulting. When large amounts of pressure or tension are applied to rocks on timescales that are fast enough that the rock cannot respond by deforming, the rock breaks along faults. In the case of a graben, two parallel faults are formed by extension of the crust and the rock in between the faults drops downward into the space created by the extension. Several graben are visible in this THEMIS VIS image, trending from north-northeast to south-southwest. Because the faults defining the graben are formed parallel to the direction of the applied stress, we know that extensional forces were pulling the crust apart in the west-northwest/east-southeast direction. The Sirenum Fossae graben are 2735km (1700 miles) long. The THEMIS VIS camera is capable of capturing color images of the Martian surface using five different color filters. In this mode of operation, the spatial resolution and coverage of the image must be reduced to accommodate the additional data volume produced from using multiple filters. To make a color image, three of the five filter images (each in grayscale) are selected. Each is contrast enhanced and then converted to a red, green, or blue intensity image. These three images are then combined to produce a full color, single image. Because the THEMIS color filters don't span the full range of colors seen by the human eye, a color THEMIS image does not represent true color. Also, because each single-filter image is contrast enhanced before inclusion in the three-color image, the apparent color variation of the scene is exaggerated. Nevertheless, the color variation that does appear is representative of some change in color, however subtle, in the actual scene. Note that the long edges of THEMIS color images typically contain color artifacts that do not represent surface variation. Orbit Number: 84379 Latitude: -32.7134 Longitude: 204.562 Instrument: VIS Captured: 2020-12-22 01:06 https://photojournal.jpl.nasa.gov/catalog/PIA25004
The THEMIS VIS camera contains 5 filters. The data from different filters can be combined in multiple ways to create a false color image. These false color images may reveal subtle variations of the surface not easily identified in a single band image. Today's false color image shows part of the floor of Kaiser Crater. Kaiser Crater is 207 km (129 miles) in diameter and is located in Noachis Terra west of Hellas Planitia. This sand dune field is one of several regions of sand dunes located on the southern part of the crater floor. The image also shows the complex crater floor beneath the dunes. These dunes are composed of basaltic sand that has collected in the bottom of the crater. The topographic depression of the crater forms a sand trap that prevents the sand from escaping. Dune fields are common in the bottoms of craters on Mars and appear as dark splotches that often lean up against the downwind walls of the craters. Dunes are useful for studying both the geology and meteorology of Mars. The sand forms by erosion of larger rocks, but it is unclear when and where this erosion took place on Mars or how such large volumes of sand could be formed. The dunes also indicate the local wind directions by their morphology. In this case, there are few clear slipfaces that would indicate the downwind direction. The crests of the dunes also typically run north-south in the image. This dune form indicates that there are probably two prevailing wind directions that run east and west (left to right and right to left). The THEMIS VIS camera is capable of capturing color images of the Martian surface using five different color filters. In this mode of operation, the spatial resolution and coverage of the image must be reduced to accommodate the additional data volume produced from using multiple filters. To make a color image, three of the five filter images (each in grayscale) are selected. Each is contrast enhanced and then converted to a red, green, or blue intensity image. These three images are then combined to produce a full color, single image. Because the THEMIS color filters don't span the full range of colors seen by the human eye, a color THEMIS image does not represent true color. Also, because each single-filter image is contrast enhanced before inclusion in the three-color image, the apparent color variation of the scene is exaggerated. Nevertheless, the color variation that does appear is representative of some change in color, however subtle, in the actual scene. Note that the long edges of THEMIS color images typically contain color artifacts that do not represent surface variation. Orbit Number: 91442 Latitude: -46.9777 Longitude: 19.5189 Instrument: VIS Captured: 2022-07-26 15:07 https://photojournal.jpl.nasa.gov/catalog/PIA26060
The THEMIS VIS camera contains 5 filters. The data from different filters can be combined in multiple ways to create a false color image. These false color images may reveal subtle variations of the surface not easily identified in a single band image. Today's false color image shows part of Sirenum Fossae. The linear depressions in this VIS image are tectonic graben. Graben are formed by extension of the crust and faulting. When large amounts of pressure or tension are applied to rocks on timescales that are fast enough that the rock cannot respond by deforming, the rock breaks along faults. In the case of a graben, two parallel faults are formed by extension of the crust and the rock in between the faults drops downward into the space created by the extension. Several graben are visible in this THEMIS VIS image, trending from north-northeast to south-southwest. Because the faults defining the graben are formed perpendicular to the direction of the applied stress, we know that extensional forces were pulling the crust apart in the west-northwest/east-southeast direction. The Sirenum Fossae graben are 2735km (1700 miles) long. The THEMIS VIS camera is capable of capturing color images of the Martian surface using five different color filters. In this mode of operation, the spatial resolution and coverage of the image must be reduced to accommodate the additional data volume produced from using multiple filters. To make a color image, three of the five filter images (each in grayscale) are selected. Each is contrast enhanced and then converted to a red, green, or blue intensity image. These three images are then combined to produce a full color, single image. Because the THEMIS color filters don't span the full range of colors seen by the human eye, a color THEMIS image does not represent true color. Also, because each single-filter image is contrast enhanced before inclusion in the three-color image, the apparent color variation of the scene is exaggerated. Nevertheless, the color variation that does appear is representative of some change in color, however subtle, in the actual scene. Note that the long edges of THEMIS color images typically contain color artifacts that do not represent surface variation. Orbit Number: 92540 Latitude: -32.6048 Longitude: 205.563 Instrument: VIS Captured: 2022-10-25 00:23 https://photojournal.jpl.nasa.gov/catalog/PIA26122
The THEMIS VIS camera contains 5 filters. The data from different filters can be combined in multiple ways to create a false color image. These false color images may reveal subtle variations of the surface not easily identified in a single band image. Today's false color image shows part of Sirenum Fossae. The linear depressions in this VIS image are tectonic graben. Graben are formed by extension of the crust and faulting. When large amounts of pressure or tension are applied to rocks on timescales that are fast enough that the rock cannot respond by deforming, the rock breaks along faults. In the case of a graben, two parallel faults are formed by extension of the crust and the rock in between the faults drops downward into the space created by the extension. Several graben are visible in this THEMIS VIS image, trending from north-northeast to south-southwest. Because the faults defining the graben are formed perpendicular to the direction of the applied stress, we know that extensional forces were pulling the crust apart in the west-northwest/east-southeast direction. The Sirenum Fossae graben are 2735km (1700 miles) long. The THEMIS VIS camera is capable of capturing color images of the Martian surface using five different color filters. In this mode of operation, the spatial resolution and coverage of the image must be reduced to accommodate the additional data volume produced from using multiple filters. To make a color image, three of the five filter images (each in grayscale) are selected. Each is contrast enhanced and then converted to a red, green, or blue intensity image. These three images are then combined to produce a full color, single image. Because the THEMIS color filters don't span the full range of colors seen by the human eye, a color THEMIS image does not represent true color. Also, because each single-filter image is contrast enhanced before inclusion in the three-color image, the apparent color variation of the scene is exaggerated. Nevertheless, the color variation that does appear is representative of some change in color, however subtle, in the actual scene. Note that the long edges of THEMIS color images typically contain color artifacts that do not represent surface variation. Orbit Number: 92203 Latitude: -31.0389 Longitude: 208.065 Instrument: VIS Captured: 2022-09-27 06:25 https://photojournal.jpl.nasa.gov/catalog/PIA26087
The THEMIS VIS camera contains 5 filters. The data from different filters can be combined in multiple ways to create a false color image. These false color images may reveal subtle variations of the surface not easily identified in a single band image. Today's false color image shows part of Sirenum Fossae. The linear depressions in this VIS image are tectonic graben. Graben are formed by extension of the crust and faulting. When large amounts of pressure or tension are applied to rocks on timescales that are fast enough that the rock cannot respond by deforming, the rock breaks along faults. In the case of a graben, two parallel faults are formed by extension of the crust and the rock in between the faults drops downward into the space created by the extension. Several graben are visible in this THEMIS VIS image, trending from north-northeast to south-southwest. Because the faults defining the graben are formed parallel to the direction of the applied stress, we know that extensional forces were pulling the crust apart in the west-northwest/east-southeast direction. The Sirenum Fossae graben are 2735km (1700 miles) long. The THEMIS VIS camera is capable of capturing color images of the Martian surface using five different color filters. In this mode of operation, the spatial resolution and coverage of the image must be reduced to accommodate the additional data volume produced from using multiple filters. To make a color image, three of the five filter images (each in grayscale) are selected. Each is contrast enhanced and then converted to a red, green, or blue intensity image. These three images are then combined to produce a full color, single image. Because the THEMIS color filters don't span the full range of colors seen by the human eye, a color THEMIS image does not represent true color. Also, because each single-filter image is contrast enhanced before inclusion in the three-color image, the apparent color variation of the scene is exaggerated. Nevertheless, the color variation that does appear is representative of some change in color, however subtle, in the actual scene. Note that the long edges of THEMIS color images typically contain color artifacts that do not represent surface variation. Orbit Number: 84841 Latitude: -35.7019 Longitude: 196.266 Instrument: VIS Captured: 2021-01-29 02:03 https://photojournal.jpl.nasa.gov/catalog/PIA25005
The THEMIS VIS camera contains 5 filters. The data from different filters can be combined in multiple ways to create a false color image. These false color images may reveal subtle variations of the surface not easily identified in a single band image. Today's false color image shows part of Sirenum Fossae. The linear depressions in this VIS image are tectonic graben. Graben are formed by extension of the crust and faulting. When large amounts of pressure or tension are applied to rocks on timescales that are fast enough that the rock cannot respond by deforming, the rock breaks along faults. In the case of a graben, two parallel faults are formed by extension of the crust and the rock in between the faults drops downward into the space created by the extension. Several graben are visible in this THEMIS VIS image, trending from north-northeast to south-southwest. Because the faults defining the graben are formed parallel to the direction of the applied stress, we know that extensional forces were pulling the crust apart in the west-northwest/east-southeast direction. The Sirenum Fossae graben are 2735km (1700 miles) long. The THEMIS VIS camera is capable of capturing color images of the Martian surface using five different color filters. In this mode of operation, the spatial resolution and coverage of the image must be reduced to accommodate the additional data volume produced from using multiple filters. To make a color image, three of the five filter images (each in grayscale) are selected. Each is contrast enhanced and then converted to a red, green, or blue intensity image. These three images are then combined to produce a full color, single image. Because the THEMIS color filters don't span the full range of colors seen by the human eye, a color THEMIS image does not represent true color. Also, because each single-filter image is contrast enhanced before inclusion in the three-color image, the apparent color variation of the scene is exaggerated. Nevertheless, the color variation that does appear is representative of some change in color, however subtle, in the actual scene. Note that the long edges of THEMIS color images typically contain color artifacts that do not represent surface variation. Orbit Number: 84903 Latitude: -30.8518 Longitude: 208.42 Instrument: VIS Captured: 2021-02-03 04:32 https://photojournal.jpl.nasa.gov/catalog/PIA25007
The THEMIS VIS camera contains 5 filters. The data from different filters can be combined in multiple ways to create a false color image. These false color images may reveal subtle variations of the surface not easily identified in a single band image. Today's false color image shows part of Sirenum Fossae. The linear depressions in this VIS image are tectonic graben. Graben are formed by extension of the crust and faulting. When large amounts of pressure or tension are applied to rocks on timescales that are fast enough that the rock cannot respond by deforming, the rock breaks along faults. In the case of a graben, two parallel faults are formed by extension of the crust and the rock in between the faults drops downward into the space created by the extension. Several graben are visible in this THEMIS VIS image, trending from north-northeast to south-southwest. Because the faults defining the graben are formed parallel to the direction of the applied stress, we know that extensional forces were pulling the crust apart in the west-northwest/east-southeast direction. The Sirenum Fossae graben are 2735km (1700 miles) long. The THEMIS VIS camera is capable of capturing color images of the Martian surface using five different color filters. In this mode of operation, the spatial resolution and coverage of the image must be reduced to accommodate the additional data volume produced from using multiple filters. To make a color image, three of the five filter images (each in grayscale) are selected. Each is contrast enhanced and then converted to a red, green, or blue intensity image. These three images are then combined to produce a full color, single image. Because the THEMIS color filters don't span the full range of colors seen by the human eye, a color THEMIS image does not represent true color. Also, because each single-filter image is contrast enhanced before inclusion in the three-color image, the apparent color variation of the scene is exaggerated. Nevertheless, the color variation that does appear is representative of some change in color, however subtle, in the actual scene. Note that the long edges of THEMIS color images typically contain color artifacts that do not represent surface variation. Orbit Number: 83755 Latitude: -32.1324 Longitude: 205.871 Instrument: VIS Captured: 2020-10-31 16:02 https://photojournal.jpl.nasa.gov/catalog/PIA25001
The THEMIS VIS camera contains 5 filters. The data from different filters can be combined in multiple ways to create a false color image. These false color images may reveal subtle variations of the surface not easily identified in a single band image. Today's false color image shows part of Terra Sirenum. The linear features at the bottom of the image are tectonic features called graben. These graben are part of Sirenum Fossae. Graben are formed by extension of the crust and faulting. When large amounts of pressure or tension are applied to rocks on timescales that are fast enough that the rock cannot respond by deforming, the rock breaks along faults. In the case of a graben, two parallel faults are formed by extension of the crust and the rock in between the faults drops downward into the space created by the extension.The graben in this image are trending from north-northeast to south-southwest. Because the faults defining the graben are formed perpendicular to the direction of the applied stress, we know that extensional forces were pulling the crust apart in the west-northwest/east-southeast direction. The Sirenum Fossae graben are 2735km (1700 miles) long. The THEMIS VIS camera is capable of capturing color images of the Martian surface using five different color filters. In this mode of operation, the spatial resolution and coverage of the image must be reduced to accommodate the additional data volume produced from using multiple filters. To make a color image, three of the five filter images (each in grayscale) are selected. Each is contrast enhanced and then converted to a red, green, or blue intensity image. These three images are then combined to produce a full color, single image. Because the THEMIS color filters don't span the full range of colors seen by the human eye, a color THEMIS image does not represent true color. Also, because each single-filter image is contrast enhanced before inclusion in the three-color image, the apparent color variation of the scene is exaggerated. Nevertheless, the color variation that does appear is representative of some change in color, however subtle, in the actual scene. Note that the long edges of THEMIS color images typically contain color artifacts that do not represent surface variation. Orbit Number: 91704 Latitude: -32.2019 Longitude: 203.852 Instrument: VIS Captured: 2022-08-17 04:19 https://photojournal.jpl.nasa.gov/catalog/PIA26084
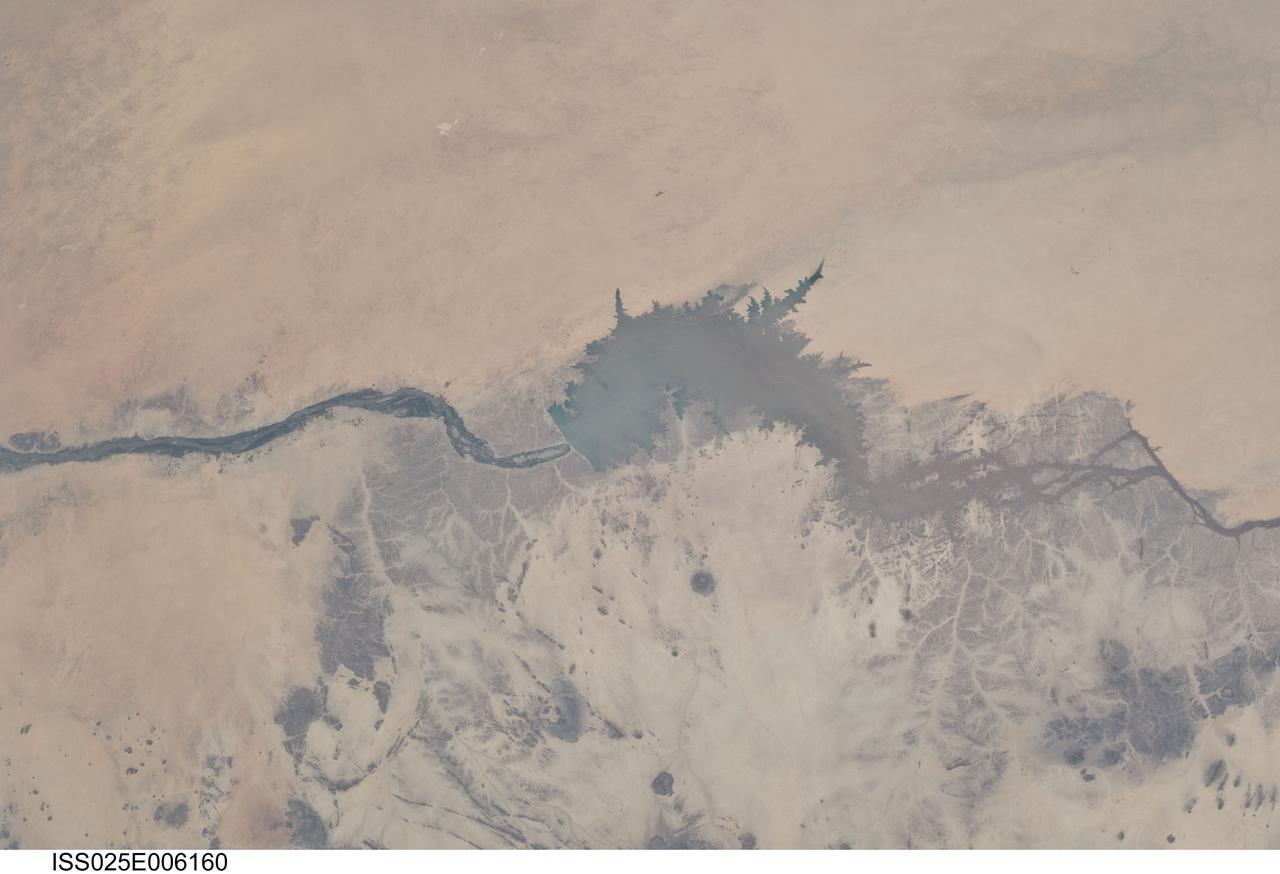
ISS025-E-006160 (5 Oct. 2010) --- Merowe Dam, Nile River and the Republic of the Sudan are featured in this image photographed by an Expedition 25 crew member on the International Space Station. The Merowe Dam is located near the 4th cataract of the Nile River, in the Nubian Desert of the northeastern Republic of the Sudan (also known as Sudan). The dam was built to generate hydroelectric power—electricity intended to further industrial and agricultural development of the country. This photograph illustrates the current extent of the reservoir filling behind the dam; the final spill gate was closed in 2008. The Merowe Dam is located approximately 350 kilometers (215 miles) to the northwest of Sudan’s capital, Khartoum. The nearest settlement downstream of the dam is Karima. Following Sudan’s independence from Egypt and the United Kingdom in 1956, allocation and control of Nile River water was divided between Egypt and Sudan by the Nile Waters Treaty signed in 1959. Today, other countries within the Nile basin—including Ethiopia, Kenya, Rwanda, Tanzania, and Uganda—are seeking more equitable allocation and utilization of the water and recently (2010) signed a new water use pact challenging the 1959 treaty. Beyond the issues of water rights, several local tribes will be displaced by the planned 170 kilometer-long reservoir, and the flooded region contains significant but little-studied archeological sites. The Sudanese government has a resettlement program in place for the tribes. A variety of international institutions have been conducting “salvage” or “rescue” archeological surveys since 1999. Such rescue surveys seek to preserve as much information as possible from sites that will be destroyed or otherwise made inaccessible (in this case by flooding).
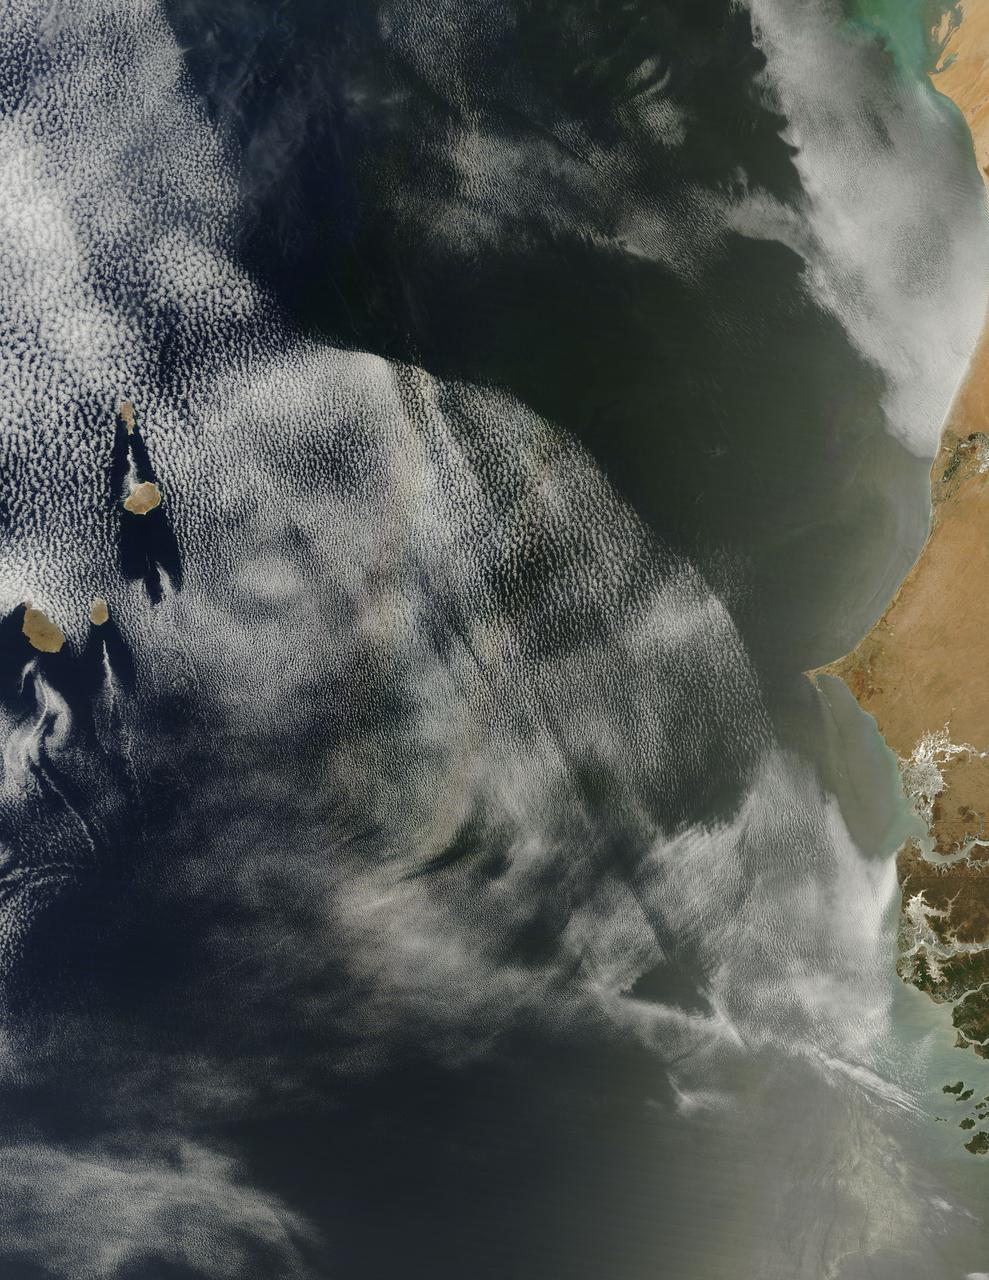
On April 23, 2013 NASA’s Terra satellite passed off the coast of West Africa, allowing the Moderate Resolution Imaging Spectroradiometer (MODIS) flying aboard to capture a curious phenomenon over the cloud deck below. The rainbow-like discoloration that can be seen streaking across the bank of marine cumulus clouds near the center of this image is known as a “glory”. A glory is caused by the scattering of sunlight by a cloud made of water droplets that are all roughly the same size, and is only produced when the light is just right. In order for a glory to be viewed, the observer’s anti-solar point must fall on the cloud deck below. In this case the observer is the Terra satellite, and the anti-solar point is where the sun is directly behind you – 180° from the MODIS line of sight. Water and ice particles in the cloud bend the light, breaking it into all its wavelengths, and the result is colorful flare, which may contain all of the colors of the rainbow. Credit: NASA/GSFC/Jeff Schmaltz/MODIS Land Rapid Response Team <b><a href="http://www.nasa.gov/audience/formedia/features/MP_Photo_Guidelines.html" rel="nofollow">NASA image use policy.</a></b> <b><a href="http://www.nasa.gov/centers/goddard/home/index.html" rel="nofollow">NASA Goddard Space Flight Center</a></b> enables NASA’s mission through four scientific endeavors: Earth Science, Heliophysics, Solar System Exploration, and Astrophysics. Goddard plays a leading role in NASA’s accomplishments by contributing compelling scientific knowledge to advance the Agency’s mission. <b>Follow us on <a href="http://twitter.com/NASA_GoddardPix" rel="nofollow">Twitter</a></b> <b>Like us on <a href="http://www.facebook.com/pages/Greenbelt-MD/NASA-Goddard/395013845897?ref=tsd" rel="nofollow">Facebook</a></b> <b>Find us on <a href="http://instagram.com/nasagoddard?vm=grid" rel="nofollow">Instagram</a></b>
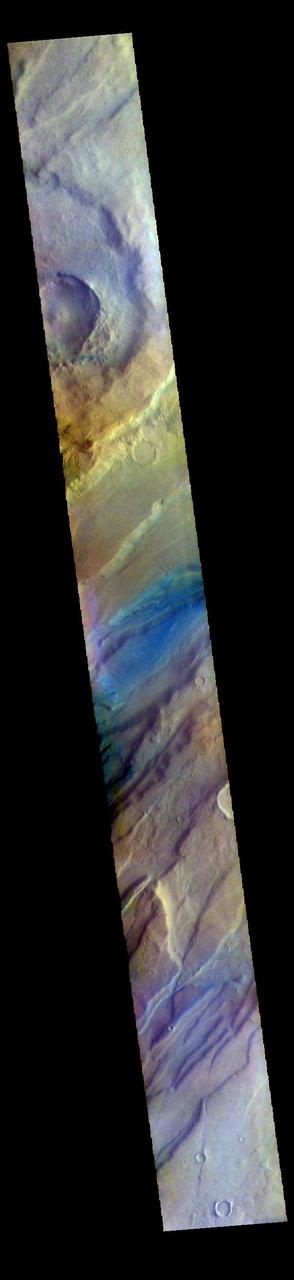
![In many ways, Mars bears remarkable similarities to Earth, but in some ways it is drastically different. Scientists often use Earth as an example, or analog, to help us to understand the geologic history of the Red Planet. As we continue to study Mars, it is vitally important to remember in what ways it differs from Earth. One very apparent way, readily observed from orbit, has to do with its preservation of numerous craters of all sizes, which are densest in its Southern hemisphere. Earth has comparatively little preserved craters -- about 1,000 to 1,500 times fewer -- due to very active geologic processes, especially involving water. When it comes to impact craters, there are some things that can no longer be observed on Earth, but can be observed on Mars. This color composite shows one such example. It covers a portion of the northern central peak of an unnamed, 20-kilometer crater that contains abundant fragmental bedrock called "breccia." The geological relationships here suggest that these breccias include ones formed by the host crater, and others formed from numerous impacts in the distant past. Because there are fewer craters preserved on Earth, terrestrial central uplifts do not expose bedrock formed by previous craters. It may have been the case in the past, but such craters were destroyed over geologic time. The map is projected here at a scale of 25 centimeters (9.9 inches) per pixel. [The original image scale is 28 centimeters (11 inches) per pixel (with 1 x 1 binning); objects on the order of 82 centimeters (32 inches) across are resolved.] North is up. http://photojournal.jpl.nasa.gov/catalog/PIA21455](https://images-assets.nasa.gov/image/PIA21455/PIA21455~medium.jpg)
In many ways, Mars bears remarkable similarities to Earth, but in some ways it is drastically different. Scientists often use Earth as an example, or analog, to help us to understand the geologic history of the Red Planet. As we continue to study Mars, it is vitally important to remember in what ways it differs from Earth. One very apparent way, readily observed from orbit, has to do with its preservation of numerous craters of all sizes, which are densest in its Southern hemisphere. Earth has comparatively little preserved craters -- about 1,000 to 1,500 times fewer -- due to very active geologic processes, especially involving water. When it comes to impact craters, there are some things that can no longer be observed on Earth, but can be observed on Mars. This color composite shows one such example. It covers a portion of the northern central peak of an unnamed, 20-kilometer crater that contains abundant fragmental bedrock called "breccia." The geological relationships here suggest that these breccias include ones formed by the host crater, and others formed from numerous impacts in the distant past. Because there are fewer craters preserved on Earth, terrestrial central uplifts do not expose bedrock formed by previous craters. It may have been the case in the past, but such craters were destroyed over geologic time. The map is projected here at a scale of 25 centimeters (9.9 inches) per pixel. [The original image scale is 28 centimeters (11 inches) per pixel (with 1 x 1 binning); objects on the order of 82 centimeters (32 inches) across are resolved.] North is up. http://photojournal.jpl.nasa.gov/catalog/PIA21455
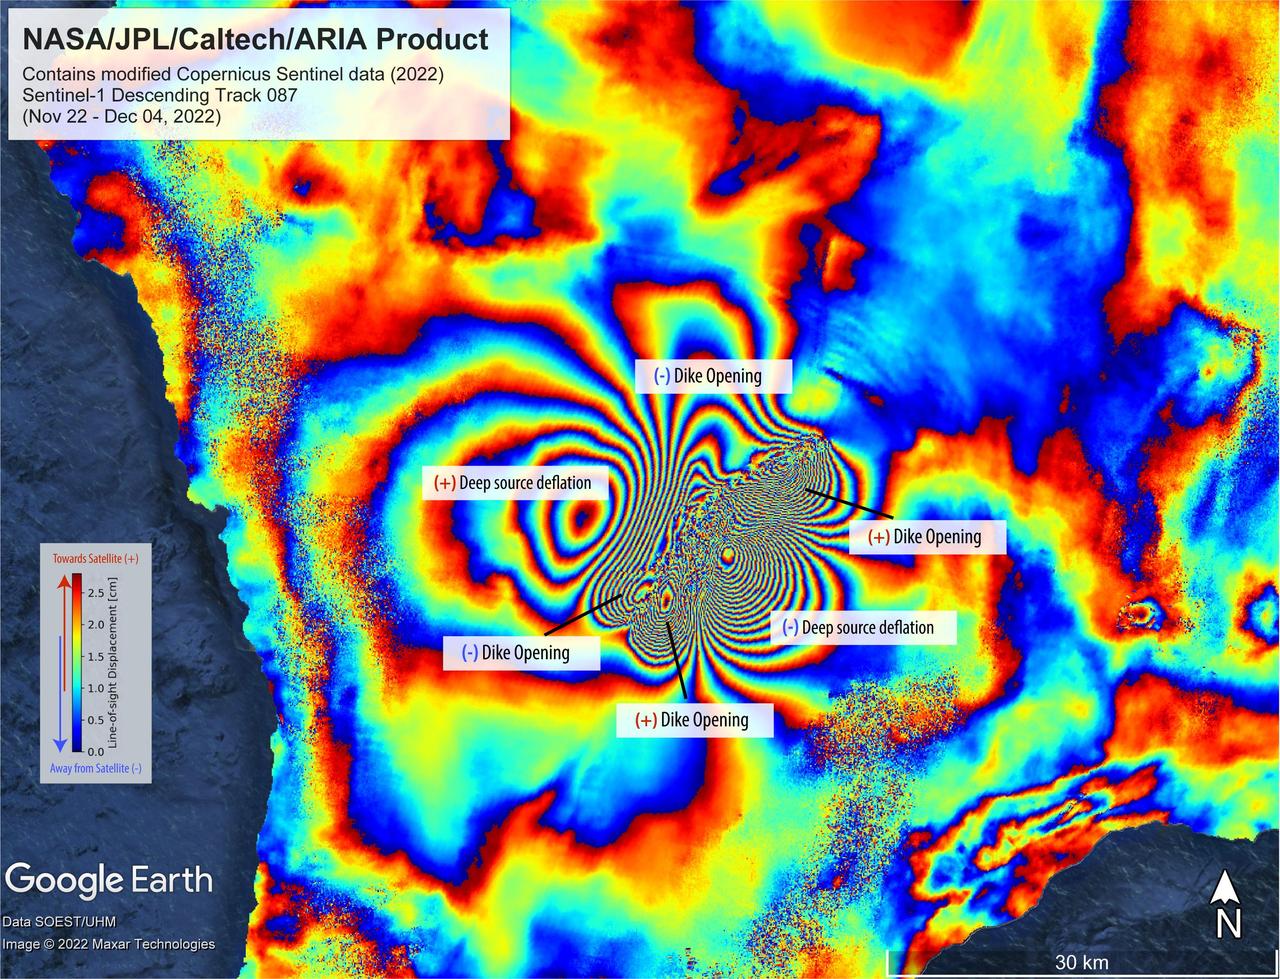
On Nov. 27, 2022, Mauna Loa, Earth's largest active volcano, began erupting from the summit caldera inside Hawaii Volcanoes National Park. Scientists with the Advanced Rapid Imaging and Analysis project (ARIA), a collaboration between NASA's Jet Propulsion Laboratory and the California Institute of Technology, which manages JPL for the agency, analyzed synthetic aperture radar images from the Copernicus Sentinel-1 satellites operated by ESA (European Space Agency) to calculate a map of the Earth's ground movement as a result of the eruption. Using images acquired before and after the start of the eruption – Nov. 22 and Dec. 4, 2022, respectively – scientists produced this false-color map showing the amount of ground surface movement, or displacement, the eruption caused. In the map, surface displacements are seen as color contours, or "fringes," where each color cycle represents about 2.8 centimeters of surface motion. The direction of the ground movement (whether toward or away from the satellite) is indicated by the color cycle (from outer to inner direction). A positive (+) indication, meaning "ground moved towards satellite," has a color cycle of blue-green-yellow-orange-red. A negative (-) indication, meaning "ground moved away from the satellite," has a color cycle of red-orange-yellow-green-blue. The broader fringes are representative of deep source processes within the volcano. In this case, a broad tabular source of magma deflated and fed the eruption as magma or lava was being supplied, somewhat like a deflating balloon (only tabular in shape) that shrank because pressure was relieved. The dense fringes marked as "dike opening" are a signature of the ground rupturing (or opening) as the magma made its way towards the Earth's surface. Scientists use these maps to build detailed models of subsurface volcanic processes to better forecast and understand the impact of future volcanic activity. The Sentinel-1 data were provided by ESA. The image contains modified Copernicus 2022 data, processed by ESA and analyzed by NASA-JPL. https://photojournal.jpl.nasa.gov/catalog/PIA25525
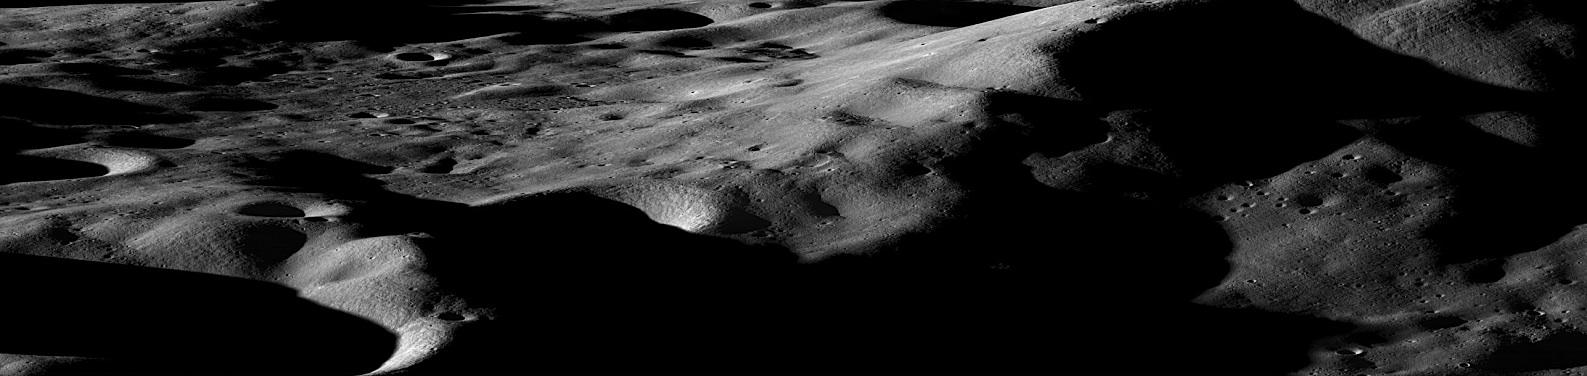
Mountains on the Moon On the Earth, we are taught that mountains form over millions of years, the result of gradual shifting and colliding plates. On the moon however, the situation is quite different. Even the largest lunar mountains were formed in minutes or less as asteroids and comets slammed into the surface at tremendous velocities, displacing and uplifting enough crust to create peaks that easily rival those found on Earth. On a few occasions in the past year, NASA has tilted the angle of LRO to do calibrations and other tests. In such cases the camera has the opportunity to gather oblique images of the lunar surface like the one featured here of Cabeus Crater providing a dramatic view of the moon's mountainous terrain. Cabeus Crater is located near the lunar south pole and contains the site of the LCROSS mission's impact. Early measurements by several instruments on LRO were used to guide the decision to send LCROSS to Cabeus. During the LCROSS impact LRO was carefully positioned to observe both the gas cloud generated in the impact, as well as the heating at the impact site. Credit: NASA/Goddard/Arizona State University To see the other nine images go to: <a href="http://www.nasa.gov/mission_pages/LRO/news/first-year.html" rel="nofollow">www.nasa.gov/mission_pages/LRO/news/first-year.html</a> <b><a href="http://www.nasa.gov/centers/goddard/home/index.html" rel="nofollow">NASA Goddard Space Flight Center</a></b> is home to the nation's largest organization of combined scientists, engineers and technologists that build spacecraft, instruments and new technology to study the Earth, the sun, our solar system, and the universe.
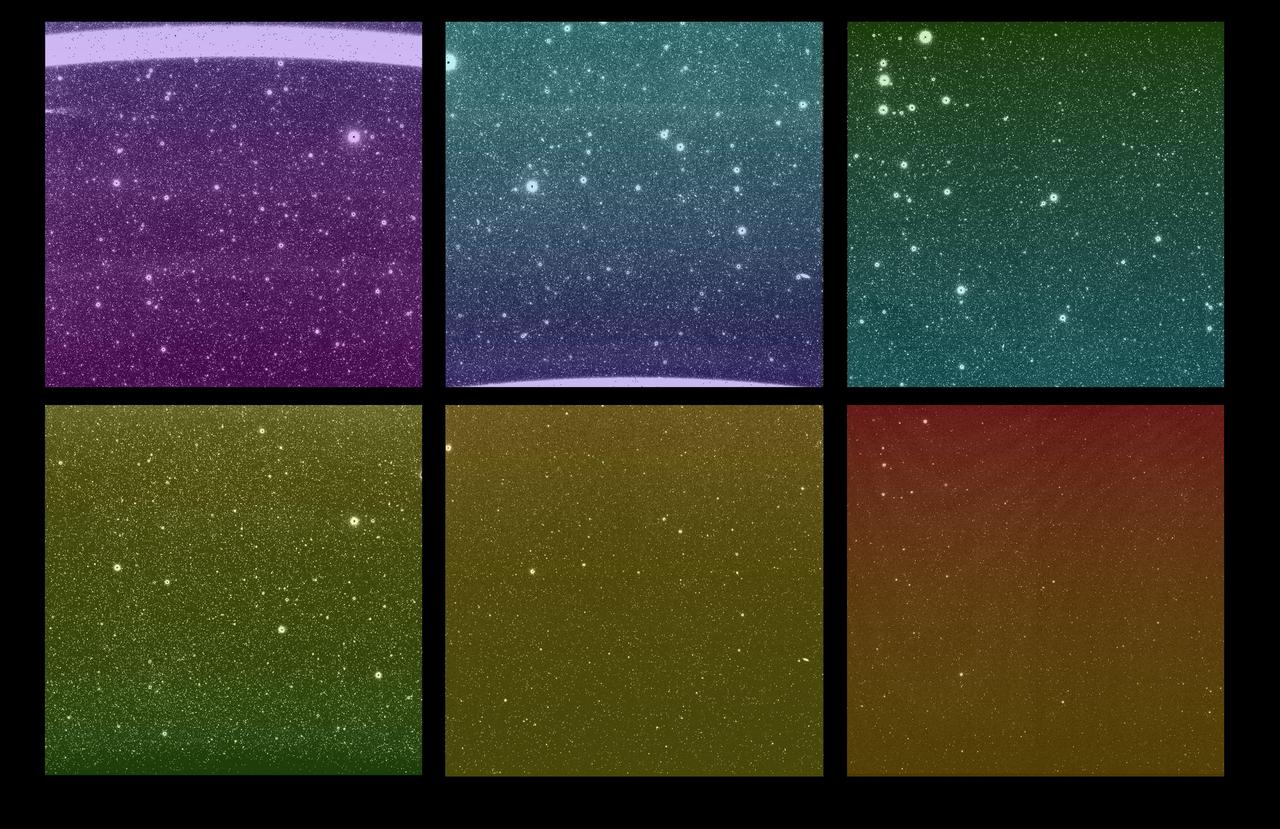
Some of the first images from NASA's SPHEREx (Spectro-Photometer for the History of the Universe, Epoch of Reionization and Ices Explorer) mission were captured March 27, 2025. Although the new images are uncalibrated and not yet ready to use for science, they give a tantalizing look at SPHEREx's wide view of the sky. Each bright spot is a source of light, like a star or galaxy, and each image is expected to contain more than 100,000 detected sources. There are six images in every SPHEREx exposure – one for each detector. The top three images show the same area of sky as the bottom three images; this is the observatory's full field of view, a rectangular area about 20 times wider than the full Moon. When the SPHEREx observatory begins routine science operations in April, it will take approximately 600 exposures every day. SPHEREx detects infrared light, which is invisible to the human eye. To make the images shown here, science team members assigned a visible color to each infrared wavelength captured by the observatory. With each detector capturing 17 unique infrared wavelength bands, there are 102 hues in this image. To detect so many infrared colors, SPHEREx uses color filters set on top of the detectors. (If the detectors are like SPHEREx's eyes, the filters are like color-tinted glasses). A standard color filter blocks all wavelengths but one, but the SPHEREx filters are more like rainbow-tinted glasses, in that the wavelengths they block change gradually from the top of the filter to the bottom. The legend at the top shows that the detectors are placed to observe infrared wavelengths from shortest to longest. Certain chemical elements are visible at specific wavelengths, as is the case with helium from Earth's atmosphere, which creates a bright line in the wavelength at the top of the top-left image. Breaking down color this way can reveal the composition of an object or the distance to a galaxy. With that data, scientists can study topics ranging from the physics that governed the universe less than a second after its birth to the origins of water in our galaxy. https://photojournal.jpl.nasa.gov/catalog/PIA26280
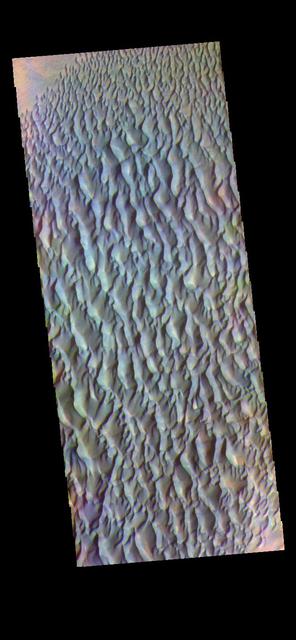
The THEMIS VIS camera contains 5 filters. The data from different filters can be combined in multiple ways to create a false color image. These false color images may reveal subtle variations of the surface not easily identified in a single band image. Today's false color image shows sand dunes within Proctor Crater. These dunes are composed of basaltic sand that has collected in the bottom of the crater. The topographic depression of the crater forms a sand trap that prevents the sand from escaping. Dune fields are common in the bottoms of craters on Mars and appear as dark splotches that lean up against the downwind walls of the craters. Dunes are useful for studying both the geology and meteorology of Mars. The sand forms by erosion of larger rocks, but it is unclear when and where this erosion took place on Mars or how such large volumes of sand could be formed. The dunes also indicate the local wind directions by their morphology. In this case, there are few clear slipfaces that would indicate the downwind direction. The crests of the dunes also typically run north-south in the image. This dune form indicates that there are probably two prevailing wind directions that run east and west (left to right and right to left). Proctor Crater is located in Noachis Terra and is 172km (107miles) in diameter. Orbit Number: 83605 Latitude: -47.5325 Longitude: 30.3915 Instrument: VIS Captured: 2020-10-19 08:09 https://photojournal.jpl.nasa.gov/catalog/PIA24712

This illustration shows three possible interiors of the seven rocky exoplanets in the TRAPPIST-1 system, based on precision measurements of the planet densities. Overall the TRAPPIST-1 worlds have remarkably similar densities, which suggests they may share the same ratio of common planet-forming elements. The planet densities are slightly lower than those of Earth or Venus, which could mean they contain fractionally less iron (a highly dense material) or more low-density materials, such as water or oxygen. In the first model (left), the interior of the planet is composed of rock mixed with iron bound to oxygen. There is no solid iron core, which is the case with Earth and the other rocky planets in our own solar system. The second model shows an overall composition similar to Earth's, in which the densest materials have settled to the center of the planet, forming an iron-rich core proportionally smaller than Earth's core. A variation is shown in the third panel, where a larger, denser core could be balanced by an extensive low-density ocean on the planet's surface. However, this scenario can be applied only to the outer four planets in the TRAPPIST-1 system. On the inner three planets, any oceans would vaporize due to the higher temperatures near their star, and a different composition model is required. Since all seven planets have remarkably similar densities, it is more likely that all the planets share a similar bulk composition, making this fourth scenario unlikely but not impossible. The high-precision mass and diameter measurements of the exoplanets in the TRAPPIST-1 system have allowed astronomers to calculate the overall densities of these worlds with an unprecedented degree of accuracy in exoplanet research. Density measurements are a critical first step in determining the composition and structure of exoplanets, but they must be interpreted through the lens of scientific models of planetary structure. https://photojournal.jpl.nasa.gov/catalog/PIA24372
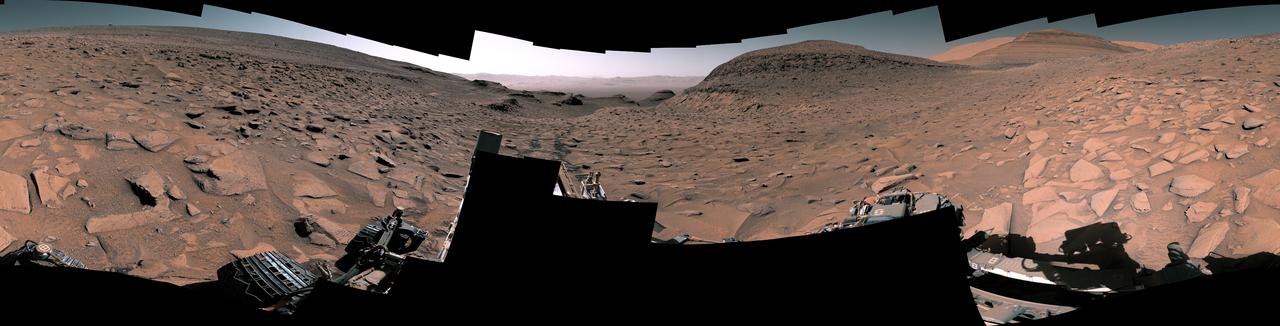
NASA's Curiosity Mars rover captured this 360-degree panorama at a site nicknamed "Ubajara" on April 30, 2023, the 3,815th Martian day, or sol, of the mission. Taken by the rover's Mastcam, this panorama was stitched together from 141 images after they were sent to Earth. Dark rover tracks recede into the distance in the center of the scene. Curiosity used the drill on the end of its robotic arm to take a sample from Ubajara, then dropped the pulverized rock into instruments within the rover's body. One of those instruments, called CheMin (Chemistry & Mineralogy), used X-ray diffraction to discover the presence of an iron carbonate mineral called siderite in samples from this site and two others: one above and one below Ubajara in a region enriched with salty minerals called sulfates. The discovery of siderite may help solve one of Mars' mysteries: There is strong evidence that liquid water coursed over the planet's surface billions of years ago, suggesting Mars had a thick, carbon-rich atmosphere rather than the wispy one it has today (a thicker carbon dioxide atmosphere is required to provide enough pressure and warmth for water to remain liquid on a planet's surface; otherwise, it rapidly vaporizes or freezes – which is the case on Mars today). That carbon dioxide and water should have reacted with Martian rocks to create carbonate minerals. However, when scientists study the planet with satellites that ample carbonate hasn't been apparent – even at Curiosity's site. It's possible that other minerals may be masking carbonate from satellite near-infrared analysis, particularly in sulfate-rich areas. If other such layers across Mars also contain hidden carbonates, the amount of stored carbon dioxide would be part of that needed in the ancient atmosphere to create conditions warm enough to support liquid water. The rest could be hidden in other deposits or have been lost to space over time. https://photojournal.jpl.nasa.gov/catalog/PIA26554
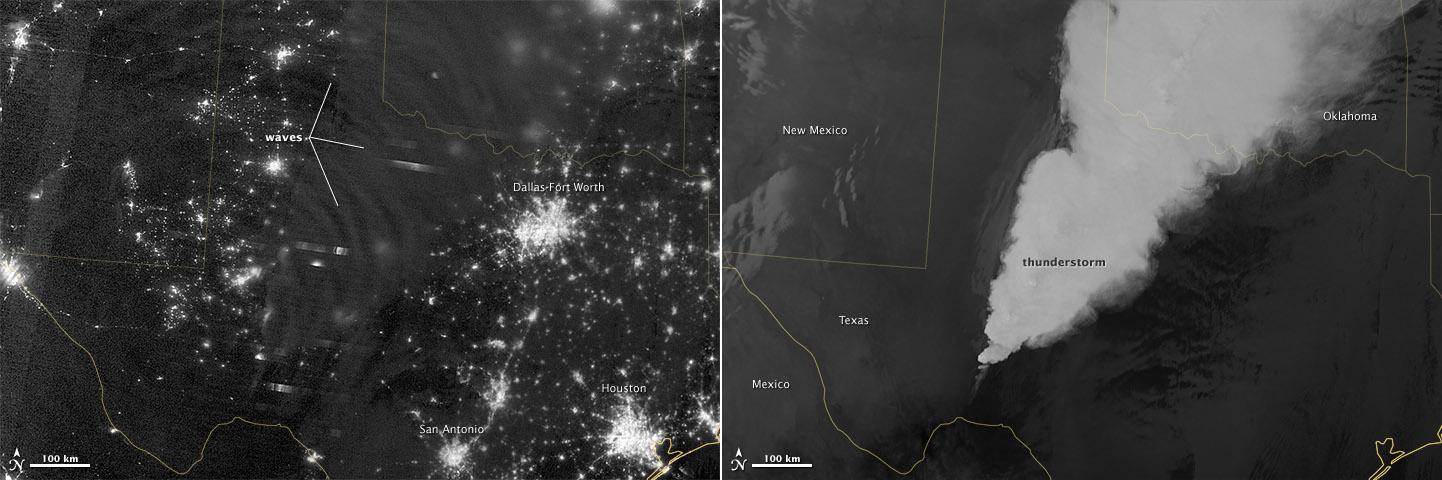
In April 2012, waves in Earth’s “airglow” spread across the nighttime skies of northern Texas like ripples in a pond. In this case, the waves were provoked by a massive thunderstorm. Airglow is a layer of nighttime light emissions caused by chemical reactions high in Earth’s atmosphere. A variety of reactions involving oxygen, sodium, ozone and nitrogen result in the production of a very faint amount of light. In fact, it’s approximately one billion times fainter than sunlight (~10-11 to 10-9 W·cm-2· sr-1). This chemiluminescence is similar to the chemical reactions that light up a glow stick or glow-in-the-dark silly putty. The “day-night band,” of the Visible Infrared Imaging Radiometer Suite (VIIRS) on the Suomi NPP satellite captured these glowing ripples in the night sky on April 15, 2012 (top image). The day-night band detects lights over a range of wavelengths from green to near-infrared and uses highly sensitive electronics to observe low light signals. (The absolute minimum signals detectable are at the levels of nightglow emission.) The lower image shows the thunderstorm as observed by a thermal infrared band on VIIRS. This thermal band, which is sensitive only to heat emissions (cold clouds appear white), is not sensitive to the subtle visible-light wave structures seen by the day-night band. Technically speaking, airglow occurs at all times. During the day it is called “dayglow,” at twilight “twilightglow,” and at night “nightglow.” There are slightly different processes taking place in each case, but in the image above the source of light is nightglow. The strongest nightglow emissions are mostly constrained to a relatively thin layer of atmosphere between 85 and 95 kilometers (53 and 60 miles) above the Earth’s surface. Little emission occurs below this layer since there’s a higher concentration of molecules, allowing for dissipation of chemical energy via collisions rather than light production. Likewise, little emission occurs above that layer because the atmospheric density is so tenuous that there are too few light-emitting reactions to yield an appreciable amount of light. Suomi NPP is in orbit around Earth at 834 kilometers (about 518 miles), well above the nightglow layer. The day-night band imagery therefore contains signals from the direction upward emission of the nightglow layer and the reflection of the downward nightglow emissions by clouds and the Earth’s surface. The presence of these nightglow waves is a graphic visualization of the usually unseen energy transfer processes that occur continuously between the lower and upper atmosphere. While nightglow is a well-known phenomenon, it’s not typically considered by Earth-viewing meteorological sensors. In fact, scientists were surprised at Suomi NPP’s ability to detect it. During the satellite’s check-out procedure, this unanticipated source of visible light was thought to indicate a problem with the sensor until scientists realized that what they were seeing was the faintest of light in the darkness of night. NASA Earth Observatory image by Jesse Allen and Robert Simmon, using VIIRS Day-Night Band data from the Suomi National Polar-orbiting Partnership. Suomi NPP is the result of a partnership between NASA, the National Oceanic and Atmospheric Administration, and the Department of Defense. Caption by Aries Keck and Steve Miller. Instrument: Suomi NPP - VIIRS Credit: <b><a href="http://www.earthobservatory.nasa.gov/" rel="nofollow"> NASA Earth Observatory</a></b> <b>Click here to view all of the <a href="http://earthobservatory.nasa.gov/Features/NightLights/" rel="nofollow"> Earth at Night 2012 images </a></b> <b>Click here to <a href="http://earthobservatory.nasa.gov/NaturalHazards/view.php?id=79817" rel="nofollow"> read more </a> about this image </b> <b><a href="http://www.nasa.gov/audience/formedia/features/MP_Photo_Guidelines.html" rel="nofollow">NASA image use policy.</a></b> <b><a href="http://www.nasa.gov/centers/goddard/home/index.html" rel="nofollow">NASA Goddard Space</a></b>
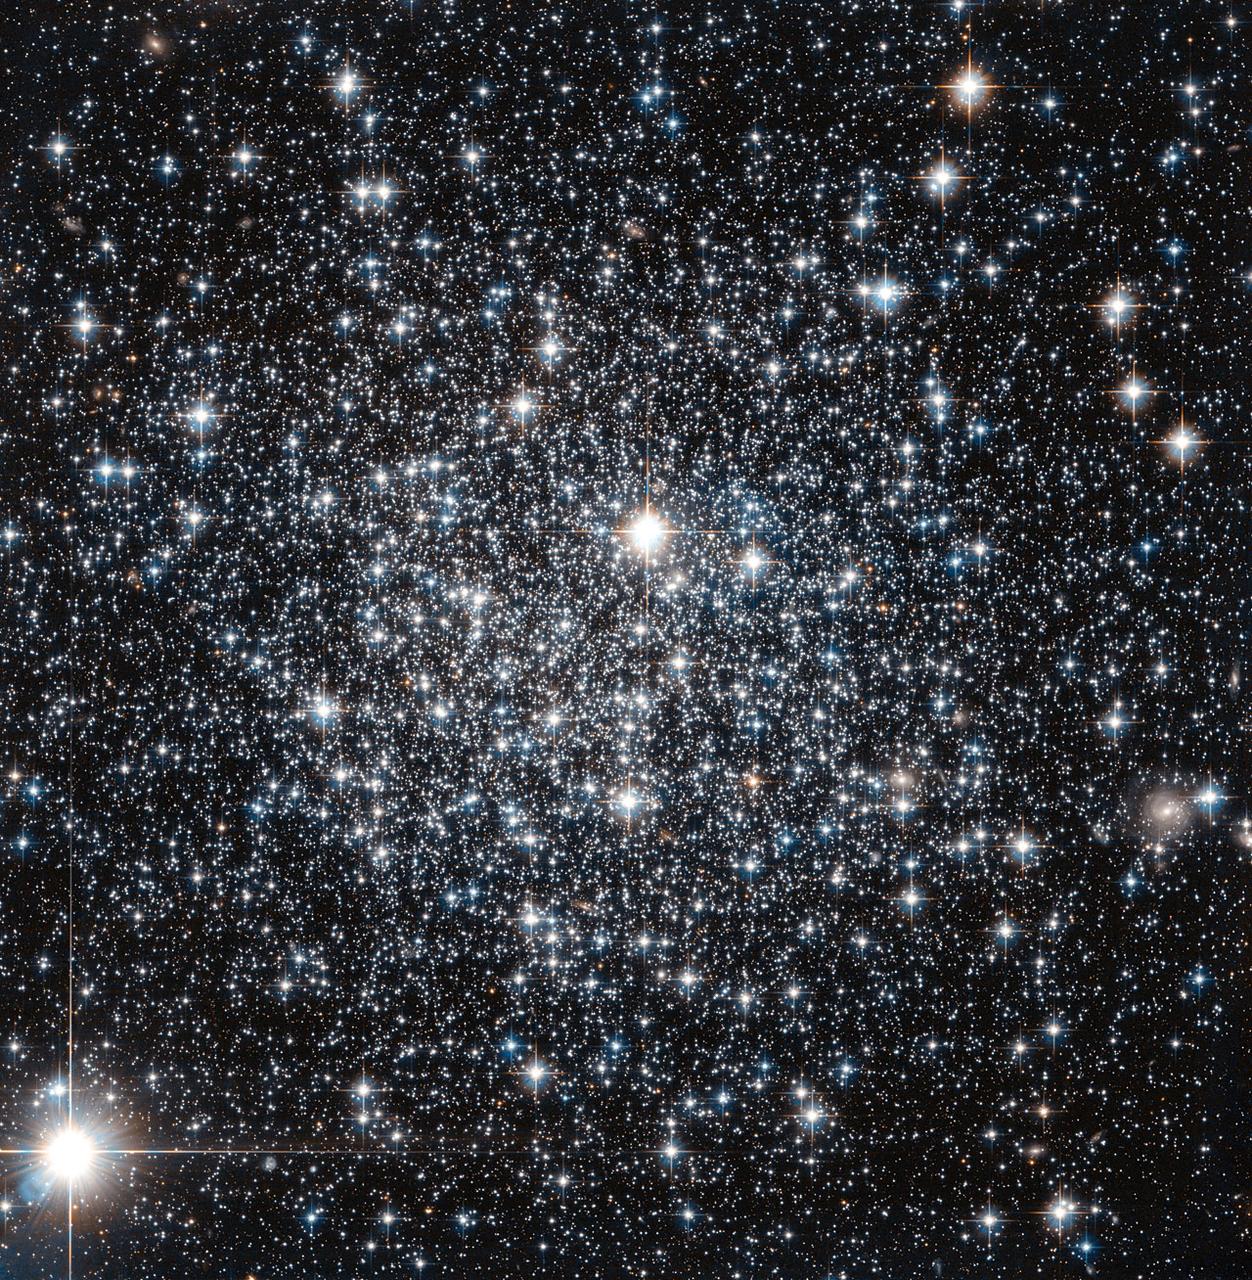
This new NASA/ESA Hubble Space Telescope image shows the globular cluster IC 4499. Globular clusters are big balls of old stars that orbit around their host galaxy. It has long been believed that all the stars within a globular cluster form at the about same time, a property which can be used to determine the cluster's age. For more massive globulars however, detailed observations have shown that this is not entirely true — there is evidence that they instead consist of multiple populations of stars born at different times. One of the driving forces behind this behavior is thought to be gravity: more massive globulars manage to grab more gas and dust, which can then be transformed into new stars. IC 4499 is a somewhat special case. Its mass lies somewhere between low-mass globulars, which show a single generation build-up, and the more complex and massive globulars which can contain more than one generation of stars. By studying objects like IC 4499 astronomers can therefore explore how mass affects a cluster's contents. Astronomers found no sign of multiple generations of stars in IC 4499 — supporting the idea that less massive clusters in general only consist of a single stellar generation. Hubble observations of IC 4499 have also helped to pinpoint the cluster's age: observations of this cluster from the 1990s suggested a puzzlingly young age when compared to other globular clusters within the Milky Way. However, since those first estimates new Hubble data have been obtained and it has been found to be much more likely that IC 4499 is actually roughly the same age as other Milky Way clusters at approximately 12 billion years old. Credit: ESA and NASA <b><a href="http://www.nasa.gov/audience/formedia/features/MP_Photo_Guidelines.html" rel="nofollow">NASA image use policy.</a></b> <b><a href="http://www.nasa.gov/centers/goddard/home/index.html" rel="nofollow">NASA Goddard Space Flight Center</a></b> enables NASA’s mission through four scientific endeavors: Earth Science, Heliophysics, Solar System Exploration, and Astrophysics. Goddard plays a leading role in NASA’s accomplishments by contributing compelling scientific knowledge to advance the Agency’s mission. <b>Follow us on <a href="http://twitter.com/NASAGoddardPix" rel="nofollow">Twitter</a></b> <b>Like us on <a href="http://www.facebook.com/pages/Greenbelt-MD/NASA-Goddard/395013845897?ref=tsd" rel="nofollow">Facebook</a></b> <b>Find us on <a href="http://instagram.com/nasagoddard?vm=grid" rel="nofollow">Instagram</a></b>
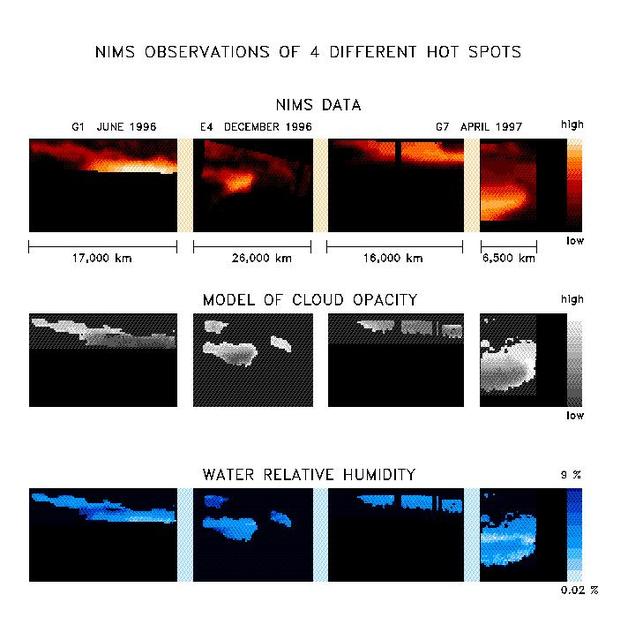
With the NIMS instrument high quality observations are being obtained from all parts of Jupiter. The images in the upper panel are taken at a wavelength of 4.8 microns. At this wavelength thermal radiation from about 100 km deep below the visible cloud deck is escaping, allowing us to study the deep atmospheric region. The overlying cloud deck absorbs a part of the radiation, but there are places where it is thin and more radiation can escape. These are called hot spot regions. Many hotspots regions occur in a zone between the equator and 15 degrees north latitude, the North Equatorial Belt (NEB), but thermal radiation is seen from much of the planet. The uniqueness of NIMS is that it is capable of observing the same spatial region at a maximum of 408 different wavelengths between 0.7 and 5.2 micron simultaneously. Every picture element (pixel) contains a spectrum of up to 408 wavelengths. The gases that compose the atmosphere leave there traces in the spectra. In this particular case, 48 wavelengths were available between 4.6 and 5.2 micron, and we see spectral signatures of water, ammonia, and phosphine. Also, the total amount of radiation is determined by the amount of overlying cloud, characterized by the cloud opacity. By means of model calculations, we can determine the amount of water and the cloud opacity for each individual spectrum. The amount ammonia and phosphine is more difficult to obtain because its influence on the spectra is weaker. The results of these calculations are shown in the form of maps in the next two panels. With NIMS, we can now have a detailed look at the spatial distribution of the water and ammonia amounts and the cloud opacity in the atmosphere. Not all the pixels from the observations have good spectra, so for some data points no reliable determination of the water and cloud opacity could be made. We find that the atmosphere is extremely dry in, and close to, the hot spot, with relative humidities between 0.02 % and 10 %, with the dryest places being inside the hot spot. This corroborates the in-situ Galileo Entry Probe measurements. The Probe entered the atmosphere, on December 5 1995, in a hot spot region. Whereas the Probe obtained only a very localized snapshot, with NIMS we can do observations of larger areas and over longer periods. The spatial distribution of water is more complex than expected. More detailed investigations will be necessary to fully understand these results. http://photojournal.jpl.nasa.gov/catalog/PIA01224
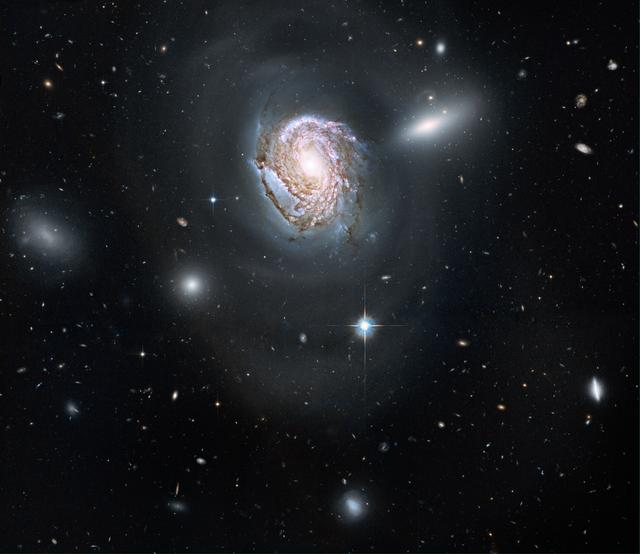
NASA image release August 10, 2010 A long-exposure Hubble Space Telescope image shows a majestic face-on spiral galaxy located deep within the Coma Cluster of galaxies, which lies 320 million light-years away in the northern constellation Coma Berenices. The galaxy, known as NGC 4911, contains rich lanes of dust and gas near its center. These are silhouetted against glowing newborn star clusters and iridescent pink clouds of hydrogen, the existence of which indicates ongoing star formation. Hubble has also captured the outer spiral arms of NGC 4911, along with thousands of other galaxies of varying sizes. The high resolution of Hubble's cameras, paired with considerably long exposures, made it possible to observe these faint details. NGC 4911 and other spirals near the center of the cluster are being transformed by the gravitational tug of their neighbors. In the case of NGC 4911, wispy arcs of the galaxy's outer spiral arms are being pulled and distorted by forces from a companion galaxy (NGC 4911A), to the upper right. The resultant stripped material will eventually be dispersed throughout the core of the Coma Cluster, where it will fuel the intergalactic populations of stars and star clusters. The Coma Cluster is home to almost 1,000 galaxies, making it one of the densest collections of galaxies in the nearby universe. It continues to transform galaxies at the present epoch, due to the interactions of close-proximity galaxy systems within the dense cluster. Vigorous star formation is triggered in such collisions. Galaxies in this cluster are so densely packed that they undergo frequent interactions and collisions. When galaxies of nearly equal masses merge, they form elliptical galaxies. Merging is more likely to occur in the center of the cluster where the density of galaxies is higher, giving rise to more elliptical galaxies. This natural-color Hubble image, which combines data obtained in 2006, 2007, and 2009 from the Wide Field Planetary Camera 2 and the Advanced Camera for Surveys, required 28 hours of exposure time. The Hubble Space Telescope is a project of international cooperation between NASA and the European Space Agency. NASA's Goddard Space Flight Center manages the telescope. The Space Telescope Science Institute (STScI) conducts Hubble science operations. STScI is operated for NASA by the Association of Universities for Research in Astronomy, Inc. in Washington, D.C. Credit: NASA, ESA, and the Hubble Heritage Team (STScI/AURA) Acknowledgment: K. Cook (Lawrence Livermore National Laboratory) To learn more about Hubble go to: <a href="http://www.nasa.gov/mission_pages/hubble/main/index.html" rel="nofollow">www.nasa.gov/mission_pages/hubble/main/index.html</a> <b><a href="http://www.nasa.gov/centers/goddard/home/index.html" rel="nofollow">NASA Goddard Space Flight Center</a></b> is home to the nation's largest organization of combined scientists, engineers and technologists that build spacecraft, instruments and new technology to study the Earth, the sun, our solar system, and the universe. <b>Follow us on <a href="http://twitter.com/NASA_GoddardPix" rel="nofollow">Twitter</a></b> <b>Join us on <a href="http://www.facebook.com/pages/Greenbelt-MD/NASA-Goddard/395013845897?ref=tsd" rel="nofollow">Facebook</a><b></b></b>
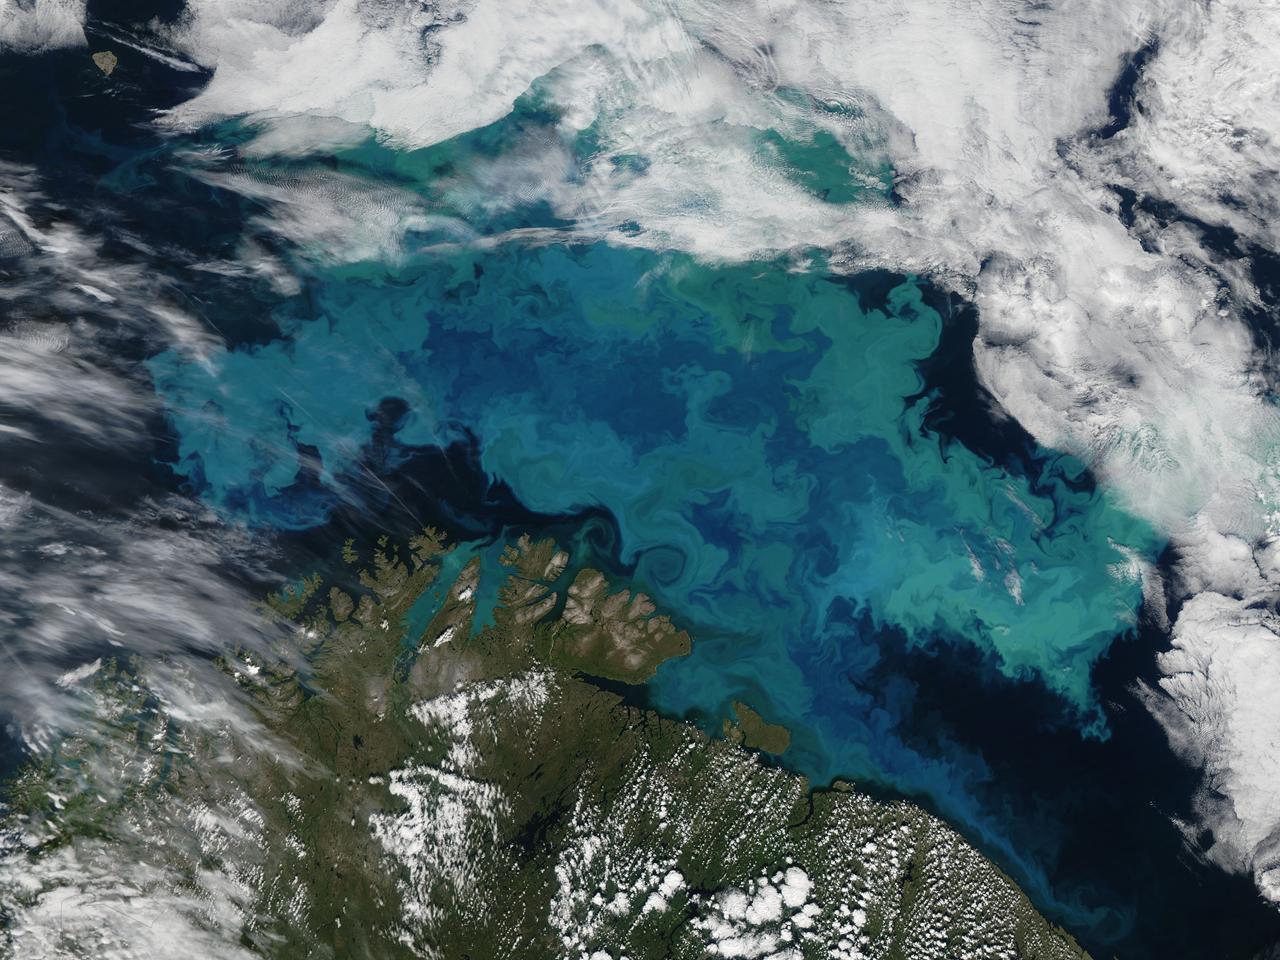
Phytoplankton bloom in the Barents Sea captured August 14, 2011. At times nature exceeds the ability of the artist’s brush to blend brilliant colors, interweave textures and combine patterns to create stunning panoramas, while using only the palette of land, water, cloud and vegetation. This stunning and artistic image of a phytoplankton bloom in the Barents Sea was by the Moderate Resolution Imaging Spectroradiometer (MODIS) aboard the Aqua satellite was captured on August 14, 2011. The peacock-hued swirls of blues and green that paint the navy-blue sea water are created by light reflecting off of millions of phytoplankton, microscopic plants that grow in the sunlit surface water of the world’s oceans. Different types of phytoplankton reflect different colored light, so a multi-color bloom such as this typically contains multiple species. The depth of the bloom also affects coloration – the deeper the organism, the less light is reflected and the duller the color. Coccolithophores, a type of phytoplankton which flourish in nutrient-poor, sub-polar waters, have unique limestone (calcite) scales. This white coating makes the plant highly reflective, and thus a bloom can appear to be a bright, almost iridescent blue. The chalky coating can also cause whitish swirls in the water, making the blues washed out with a milky hue. August is a highly active month for phytoplankton blooms in the Barents Sea, but the timing, development, abundance and species composition is variable in this area. The distribution of phytoplankton is largely controlled by the polar front, ice cover, freshwater runoff and ice melting. Each water source – the Artic, the Atlantic and the coastal water – all bring their own characteristic species into the Barents Sea, creating a multi-specie and multi-color spectacle. Because phytoplankton are the base of the marine food chain, places were blooms are large and frequent often support a thriving marine population. This is certainly the case in the Barents Sea where the fisheries, particularly the cod fisheries, are of great importance for both Norway and Russia. The coastlines of both of these countries can be seen in the bottom of the image. Russia forms the south-eastern most coast, while the remaining three-quarters of the coastline belongs to Norway. Two fjords in the west, Porsangerfjorden and Laksefjord are tinted bright blue with phytoplankton. Just to the east of these fjords, freshwater from the Tana River flows through Tanafjord, turning the waters here are a duller blue. As fresh water flows into the Barents Sea, phytoplankton bloom is affected by the flowing water, creating paisley-like patterns in the coastal eddies. Credit: NASA/GSFC/Jeff Schmaltz/MODIS Land Rapid Response Team <b><a href="http://www.nasa.gov/centers/goddard/home/index.html" rel="nofollow">NASA Goddard Space Flight Center</a></b> enables NASA’s mission through four scientific endeavors: Earth Science, Heliophysics, Solar System Exploration, and Astrophysics. Goddard plays a leading role in NASA’s accomplishments by contributing compelling scientific knowledge to advance the Agency’s mission. <b>Follow us on <a href="http://twitter.com/NASA_GoddardPix" rel="nofollow">Twitter</a></b> <b>Like us on <a href="http://www.facebook.com/pages/Greenbelt-MD/NASA-Goddard/395013845897?ref=tsd" rel="nofollow">Facebook</a></b> <b>Find us on <a href="http://web.stagram.com/n/nasagoddard/?vm=grid" rel="nofollow">Instagram</a></b>

NASA's Lunar Reconnaissance Orbiter (LRO) recently captured a unique view of Earth from the spacecraft's vantage point in orbit around the moon. "The image is simply stunning," said Noah Petro, Deputy Project Scientist for LRO at NASA's Goddard Space Flight Center in Greenbelt, Maryland. "The image of the Earth evokes the famous 'Blue Marble' image taken by Astronaut Harrison Schmitt during Apollo 17, 43 years ago, which also showed Africa prominently in the picture." In this composite image we see Earth appear to rise over the lunar horizon from the viewpoint of the spacecraft, with the center of the Earth just off the coast of Liberia (at 4.04 degrees North, 12.44 degrees West). The large tan area in the upper right is the Sahara Desert, and just beyond is Saudi Arabia. The Atlantic and Pacific coasts of South America are visible to the left. On the moon, we get a glimpse of the crater Compton, which is located just beyond the eastern limb of the moon, on the lunar farside. LRO was launched on June 18, 2009, and has collected a treasure trove of data with its seven powerful instruments, making an invaluable contribution to our knowledge about the moon. LRO experiences 12 earthrises every day; however the spacecraft is almost always busy imaging the lunar surface so only rarely does an opportunity arise such that its camera instrument can capture a view of Earth. Occasionally LRO points off into space to acquire observations of the extremely thin lunar atmosphere and perform instrument calibration measurements. During these movements sometimes Earth (and other planets) pass through the camera's field of view and dramatic images such as the one shown here are acquired. This image was composed from a series of images taken Oct. 12, when LRO was about 83 miles (134 kilometers) above the moon's farside crater Compton. Capturing an image of the Earth and moon with LRO's Lunar Reconnaissance Orbiter Camera (LROC) instrument is a complicated task. First the spacecraft must be rolled to the side (in this case 67 degrees), then the spacecraft slews with the direction of travel to maximize the width of the lunar horizon in LROC's Narrow Angle Camera image. All this takes place while LRO is traveling faster than 3,580 miles per hour (over 1,600 meters per second) relative to the lunar surface below the spacecraft! The high-resolution Narrow Angle Camera (NAC) on LRO takes black-and-white images, while the lower resolution Wide Angle Camera (WAC) takes color images, so you might wonder how we got a high-resolution picture of the Earth in color. Since the spacecraft, Earth, and moon are all in motion, we had to do some special processing to create an image that represents the view of the Earth and moon at one particular time. The final Earth image contains both WAC and NAC information. WAC provides the color, and the NAC provides high-resolution detail. "From the Earth, the daily moonrise and moonset are always inspiring moments," said Mark Robinson of Arizona State University in Tempe, principal investigator for LROC. "However, lunar astronauts will see something very different: viewed from the lunar surface, the Earth never rises or sets. Since the moon is tidally locked, Earth is always in the same spot above the horizon, varying only a small amount with the slight wobble of the moon. The Earth may not move across the 'sky', but the view is not static. Future astronauts will see the continents rotate in and out of view and the ever-changing pattern of clouds will always catch one's eye, at least on the nearside. The Earth is never visible from the farside; imagine a sky with no Earth or moon - what will farside explorers think with no Earth overhead?" NASA's first Earthrise image was taken with the Lunar Orbiter 1 spacecraft in 1966. Perhaps NASA's most iconic Earthrise photo was taken by the crew of the Apollo 8 mission as the spacecraft entered lunar orbit on Christmas Eve Dec. 24, 1968. That evening, the astronauts -- Commander Frank Borman, Command Module Pilot Jim Lovell, and Lunar Module Pilot William Anders -- held a live broadcast from lunar orbit, in which they showed pictures of the Earth and moon as seen from their spacecraft. Said Lovell, "The vast loneliness is awe-inspiring and it makes you realize just what you have back there on Earth." Credit: NASA/Goddard/Arizona State University <b><a href="http://www.nasa.gov/audience/formedia/features/MP_Photo_Guidelines.html" rel="nofollow">NASA image use policy.</a></b> <b><a href="http://www.nasa.gov/centers/goddard/home/index.html" rel="nofollow">NASA Goddard Space Flight Center</a></b> enables NASA’s mission through four scientific endeavors: Earth Science, Heliophysics, Solar System Exploration, and Astrophysics. Goddard plays a leading role in NASA’s accomplishments by contributing compelling scientific knowledge to advance the Agency’s mission. <b>Follow us on <a href="http://twitter.com/NASAGoddardPix" rel="nofollow">Twitter</a></b> <b>Like us on <a href="http://www.facebook.com/pages/Greenbelt-MD/NASA-Goddard/395013845897?ref=tsd" rel="nofollow">Facebook</a></b> <b>Find us on <a href="http://instagrid.me/nasagoddard/?vm=grid" rel="nofollow">Instagram</a></b>