
DAVE EDWARDS, CHIEF ENGINEER FOR THE SCIENCE AND TECHNOLOGY OFFICE AT MARSHALL, POSES FOR “I CHART THE PATH” SERIES PHOTO
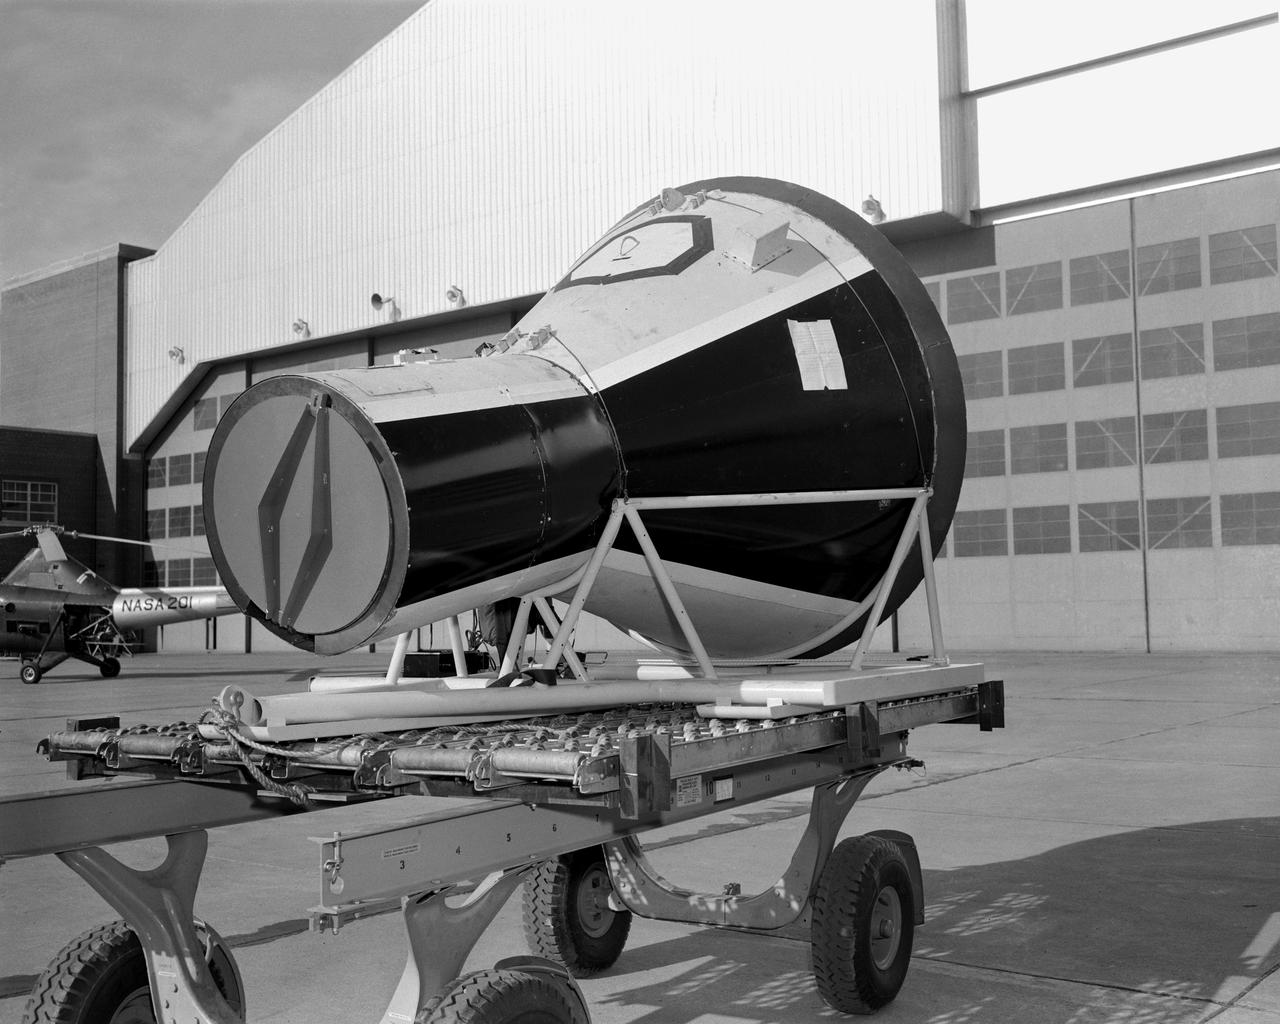
Miscellaneous Charts, space capsule
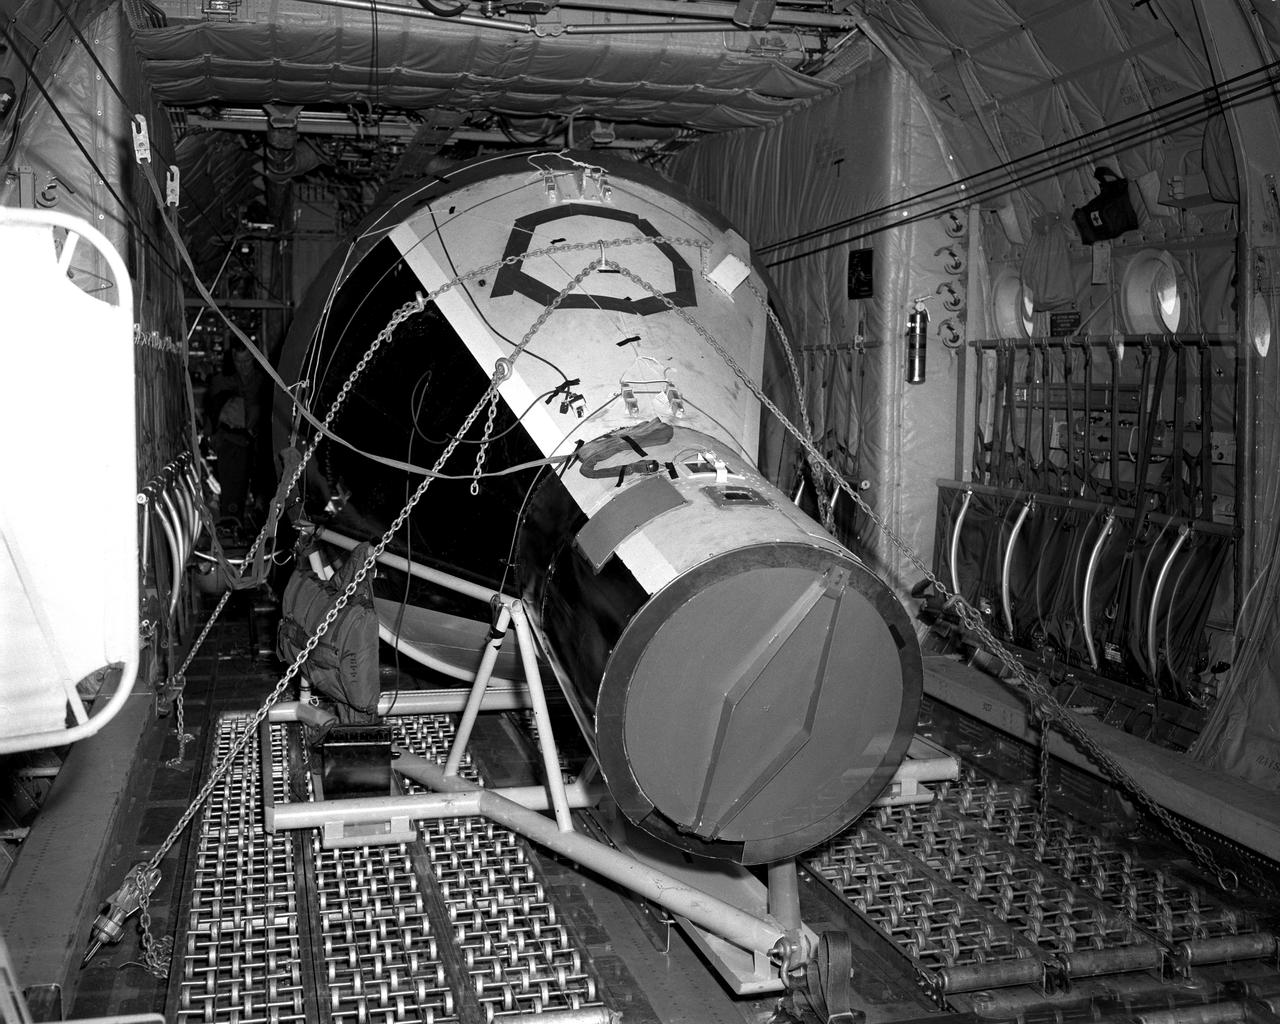
Miscellaneous Charts, Space Capsule
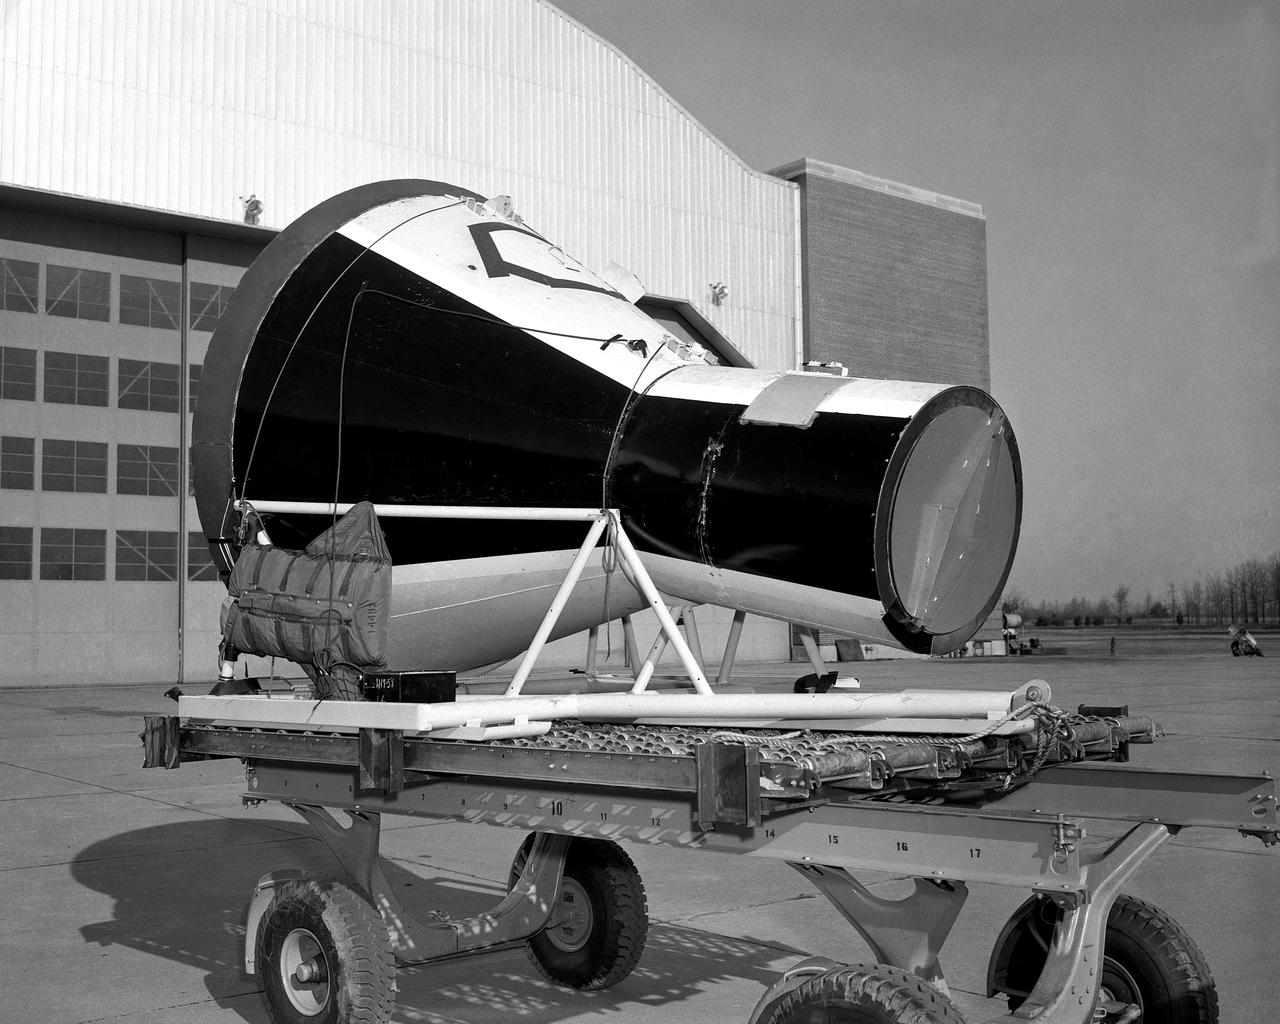
Miscellaneous Charts, Space Capsule
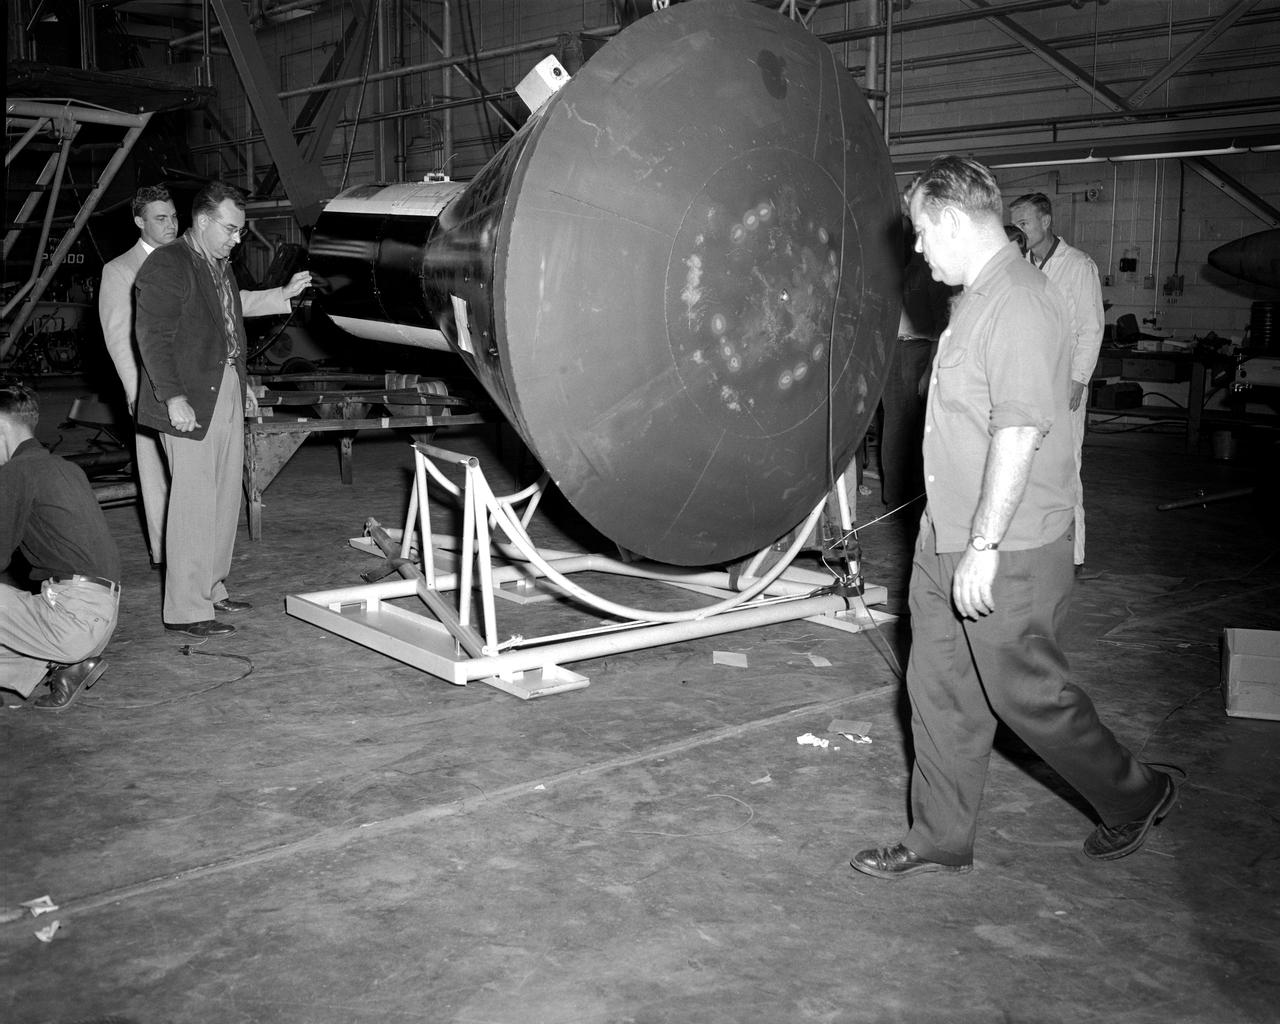
Miscellaneous Charts, Space Capsule
Miscellaneous Charts, Space Capsule
Miscellaneous Charts, space capsule,
Miscellaneous Charts, Space Capsule
Miscellaneous Charts, Space Capsule
Space Flight Charts, Space Capsule
Space Flight Charts, Space Capsule
Space Flight Charts, Space Capsule
Space Flight Charts, Space Capsule
Space Flight Charts, Space Capsule
Space Flight Charts, Space Capsule
Vehicles and Missions Studies Charts, Space Capsule
Vehicles and Missions Studies Charts, Space Capsule
Vehicles and Missions Studies Charts, Space Capsule
Vehicles and Missions Studies Charts, Space Capsule
Vehicles and Missions Studies Charts, Space Capsule
Vehicles and Missions Studies Charts, Space Capsule

Vehicles and Missions Studies Charts, Space Capsule
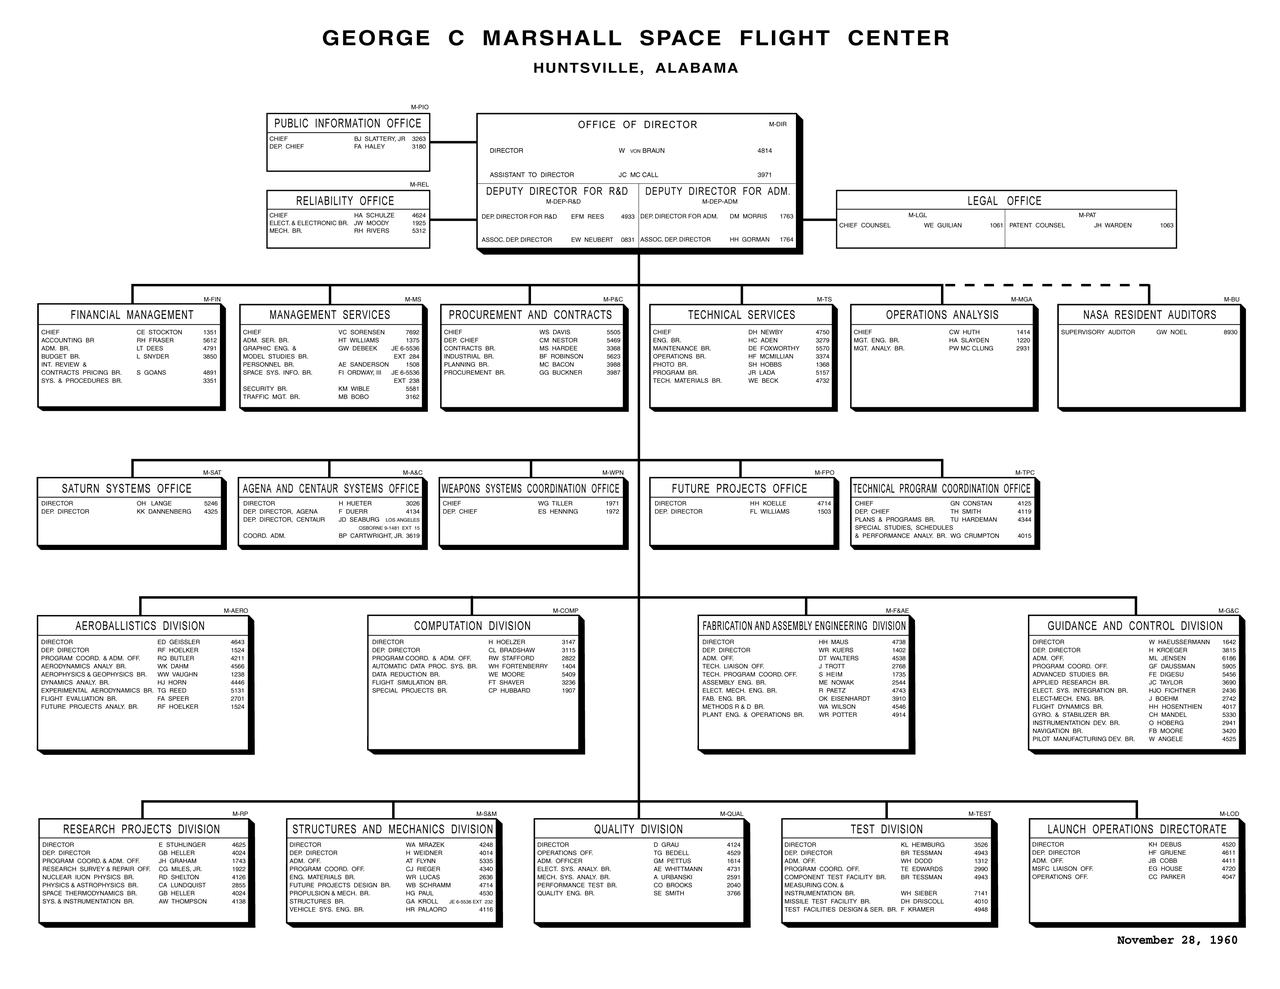
The first organizational chart for the George C. Marshall Space Flight Center (MSFC) with individual assignments, dated November 28, 1960.
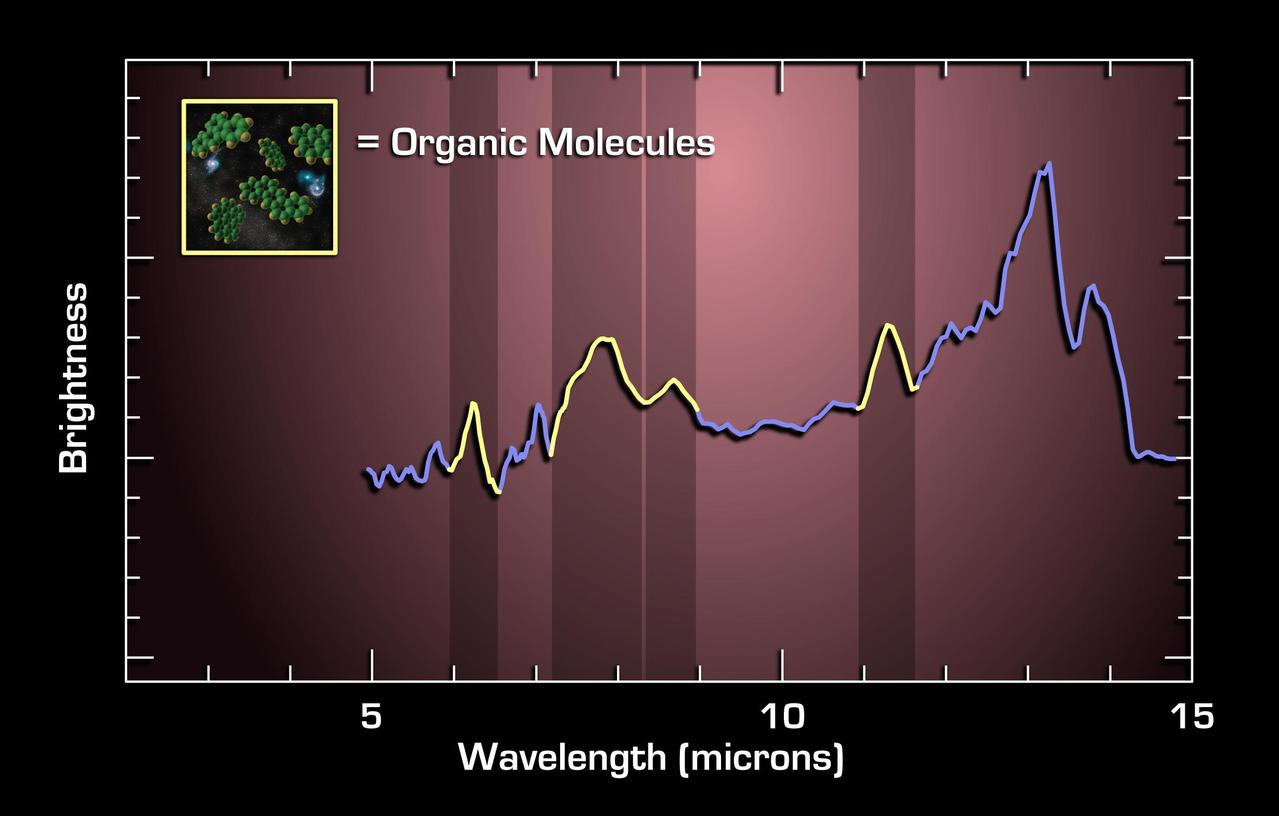
This graph, or spectrum, from NASA Spitzer Space Telescope, charts light from a faraway galaxy located 10 billion light years from Earth. It tracks mid-infrared light from an extremely luminous galaxy when the universe was only 1/4 of its current age.
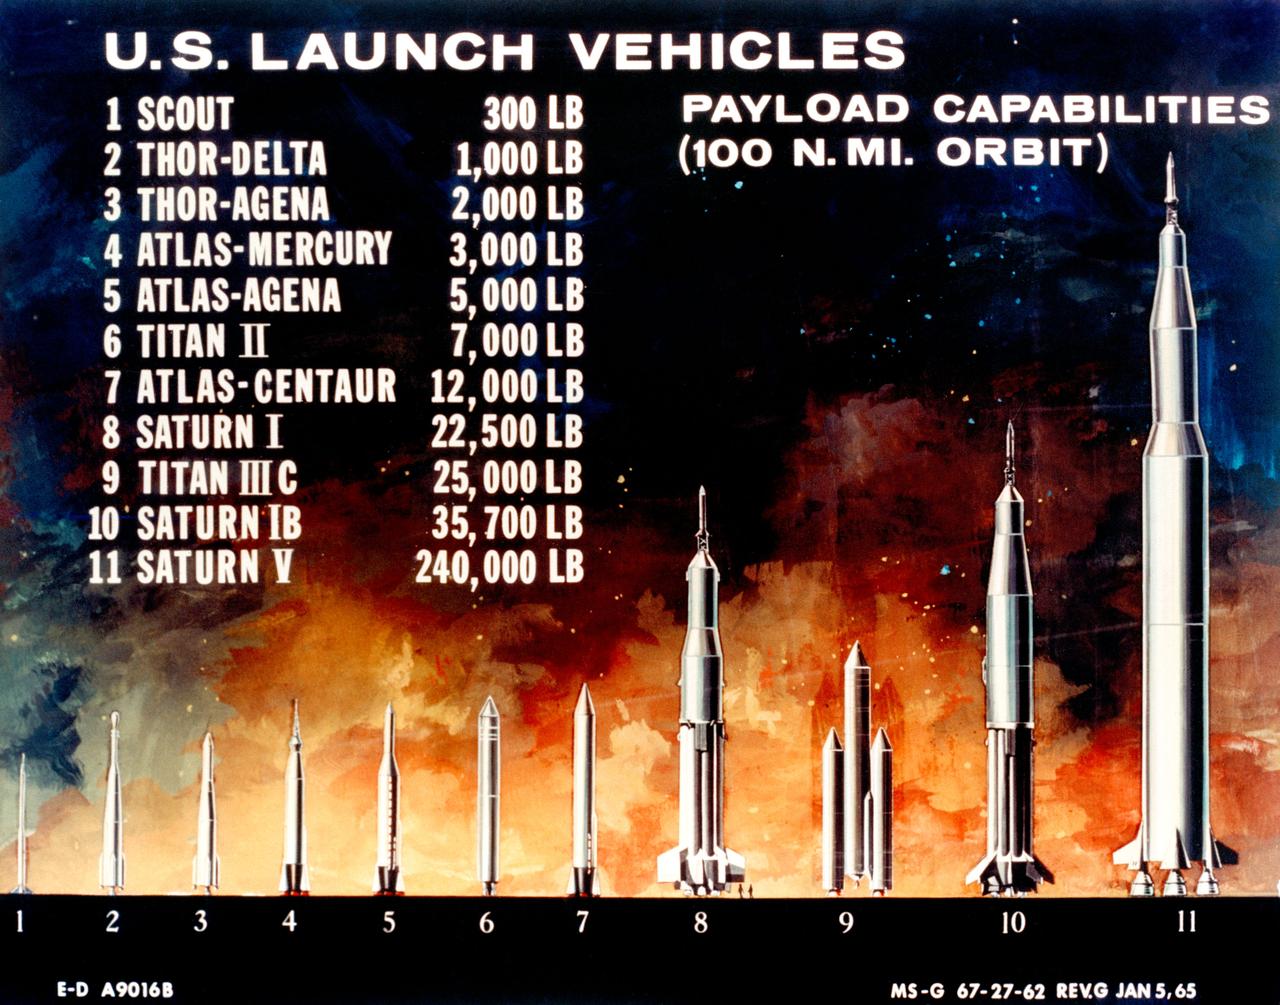
S67-20423 (1967) --- Comparison chart of U.S. launch vehicles. Photo credit: NASA
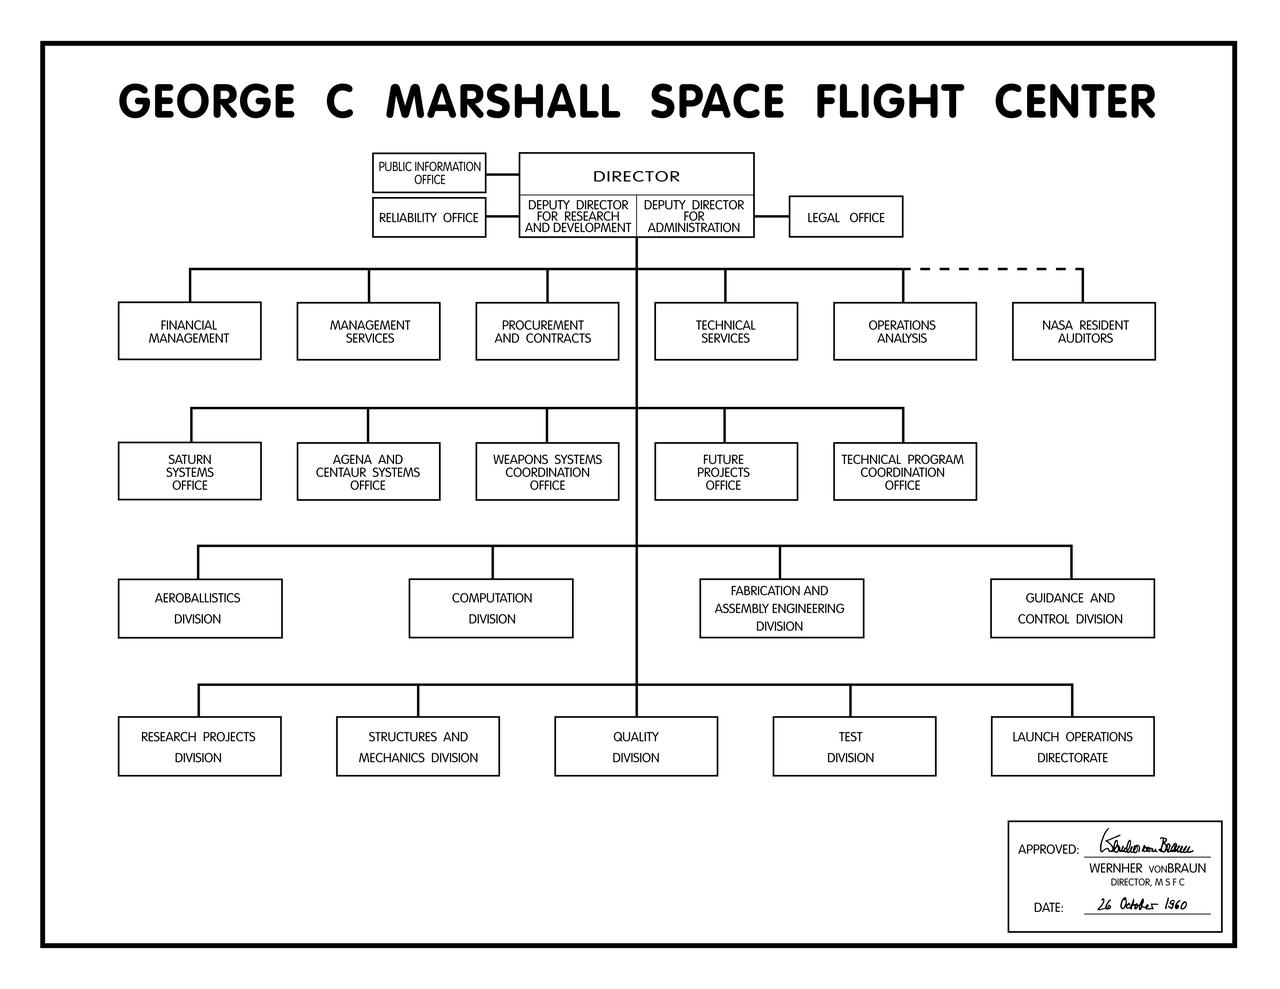
The first organizational chart of the George C. Marshall Space Flight Center (MSFC) which was approved and signed by Dr. Wernher von Braun, Director, MSFC, on 26 October 1960.

This chart illustrates relative masses of super-dense cosmic objects, ranging from white dwarfs to supermassive black holes encased in the cores of most galaxies. The first three dead stars left all form when stars more massive than our sun explode.
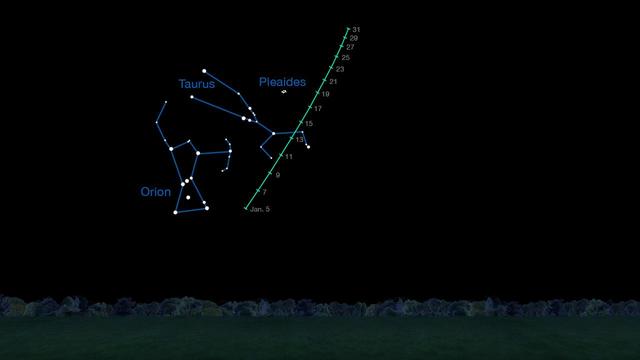
On clear nights in January 2015, comet C/2014 Q2 Lovejoy is visible in the Taurus region of the sky to observers using binoculars. This chart indicates where to look for it on different dates during the month.
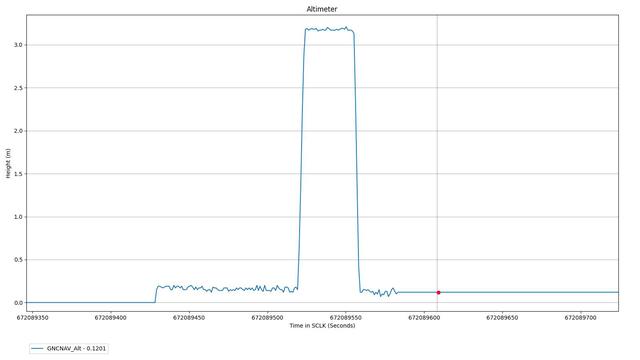
This altimeter chart shows data from the first flight of NASA's Ingenuity Mars Helicopter, which occurred on April 19, 2021. The Ingenuity Mars Helicopter was built by JPL, which also manages this technology demonstration project for NASA Headquarters. It is supported by NASA's Science Mission Directorate, Aeronautics Research Mission Directorate, and Space Technology Mission Directorate. NASA's Ames Research Center and Langley Research Center provided significant flight performance analysis and technical assistance during Ingenuity's development. A key objective for Perseverance's mission on Mars is astrobiology, including the search for signs of ancient microbial life. The rover will characterize the planet's geology and past climate, pave the way for human exploration of the Red Planet, and be the first mission to collect and cache Martian rock and regolith (broken rock and dust). Subsequent NASA missions, in cooperation with ESA (European Space Agency), would send spacecraft to Mars to collect these sealed samples from the surface and return them to Earth for in-depth analysis. The Mars 2020 Perseverance mission is part of NASA's Moon to Mars exploration approach, which includes Artemis missions to the Moon that will help prepare for human exploration of the Red Planet. https://photojournal.jpl.nasa.gov/catalog/PIA24587
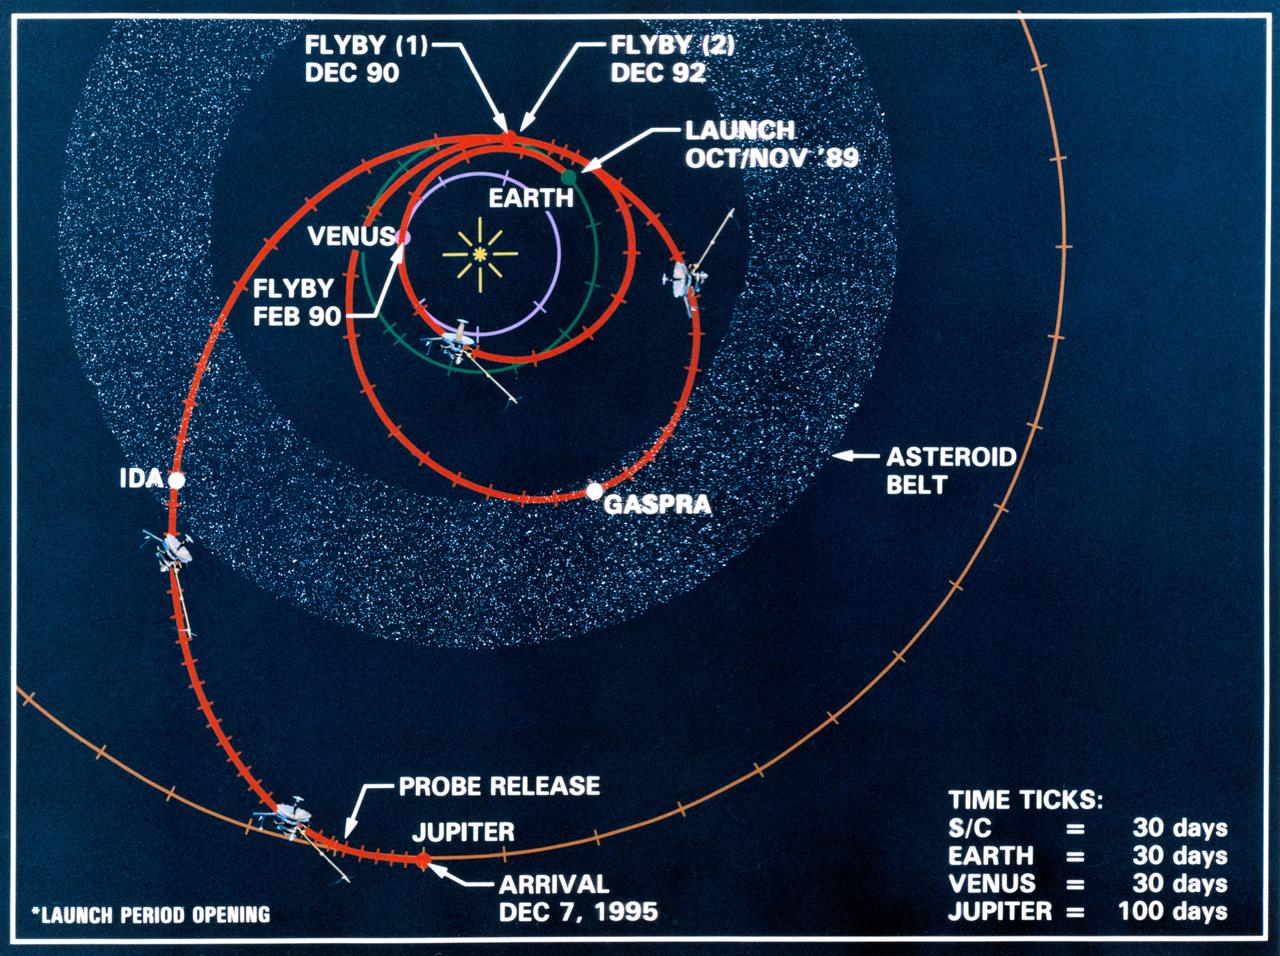
Line drawing charts the Galileo spacecraft's launch from low Earth orbit and its three planetary and two asteroid encounters in the course of its gravity-assisted flight to Jupiter. These encounters include Venus (February 1990), two Earth passes (December 1990 and December 1992), and the asteroids Gaspra and Ida in the asteroid belt. Galileo will release a probe and will arrive at Jupiter, 12-07-95.
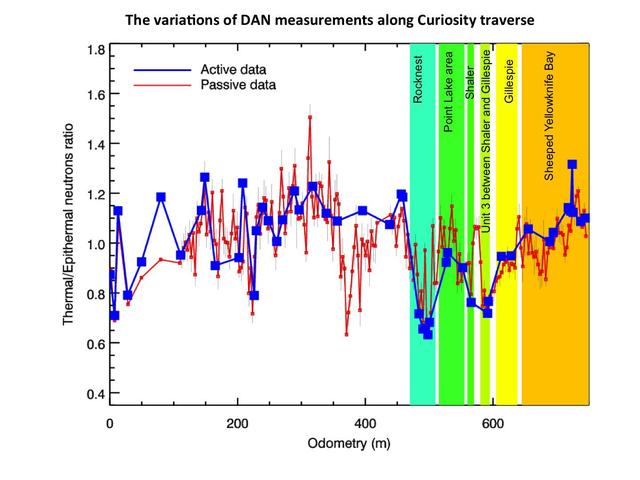
This chart graphs measurements made by the Dynamic Albedo of Neutrons DAN instrument on NASA Mars rover Curiosity against the distance the rover has driven, in meters.
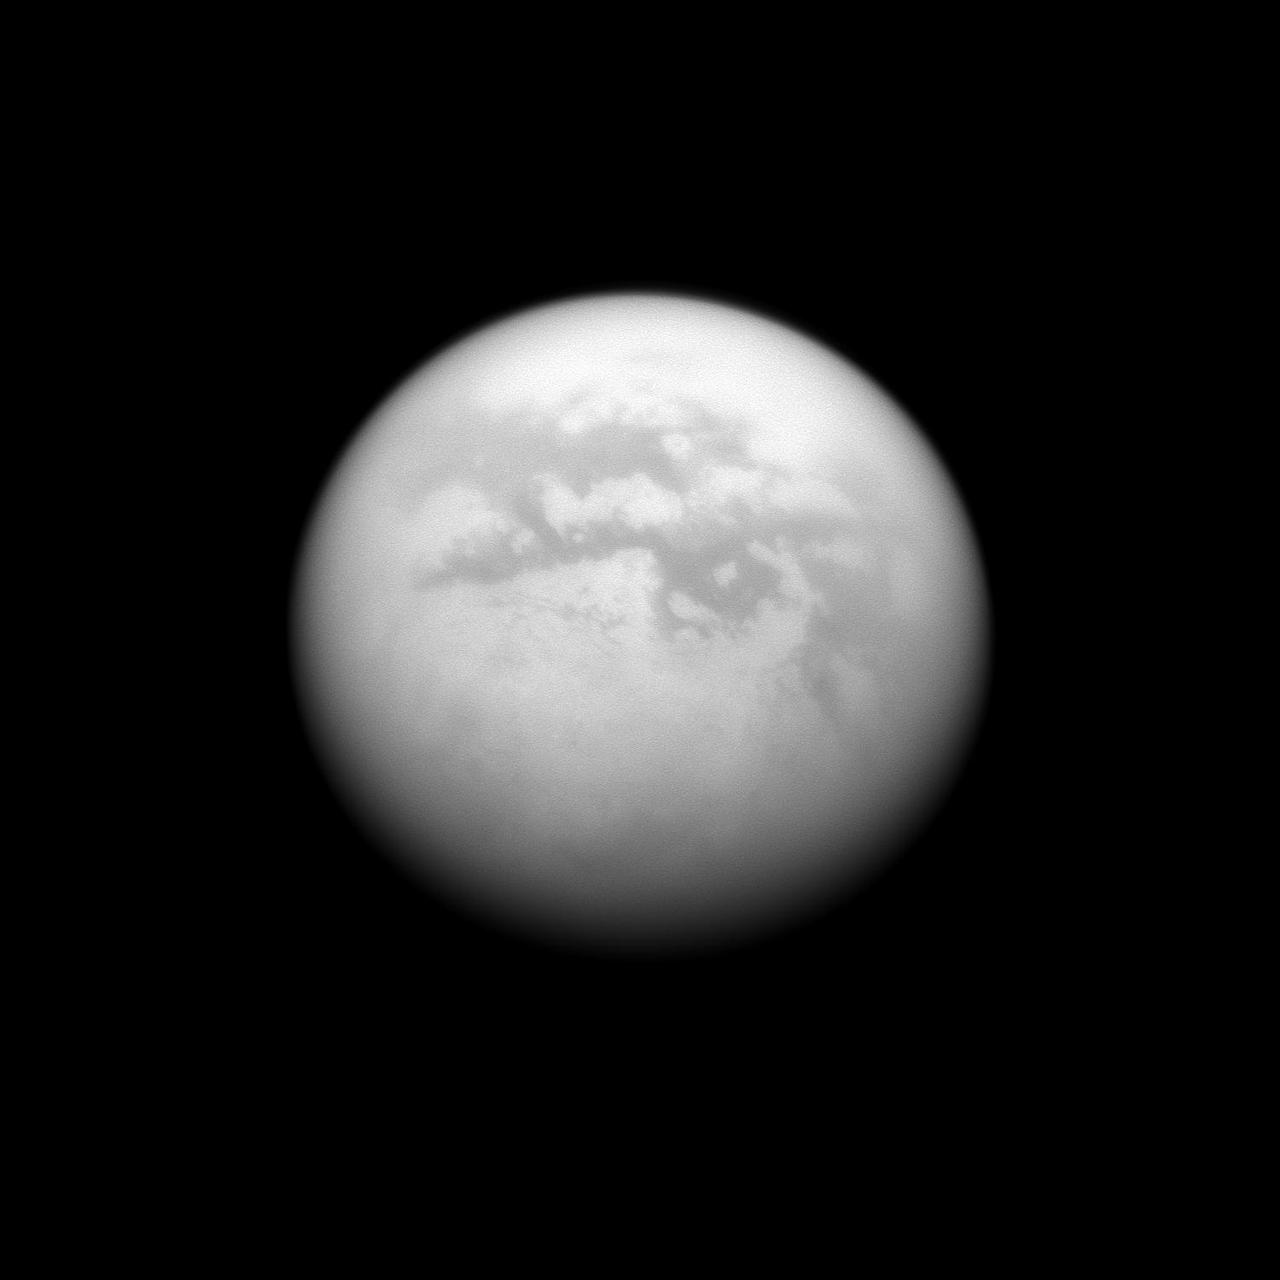
The Cassini spacecraft charts a quartet of dark albedo features on the moon Titan. From upper left to lower right of the image are Fenzal, Aztlan, Aaru and Senkyo.
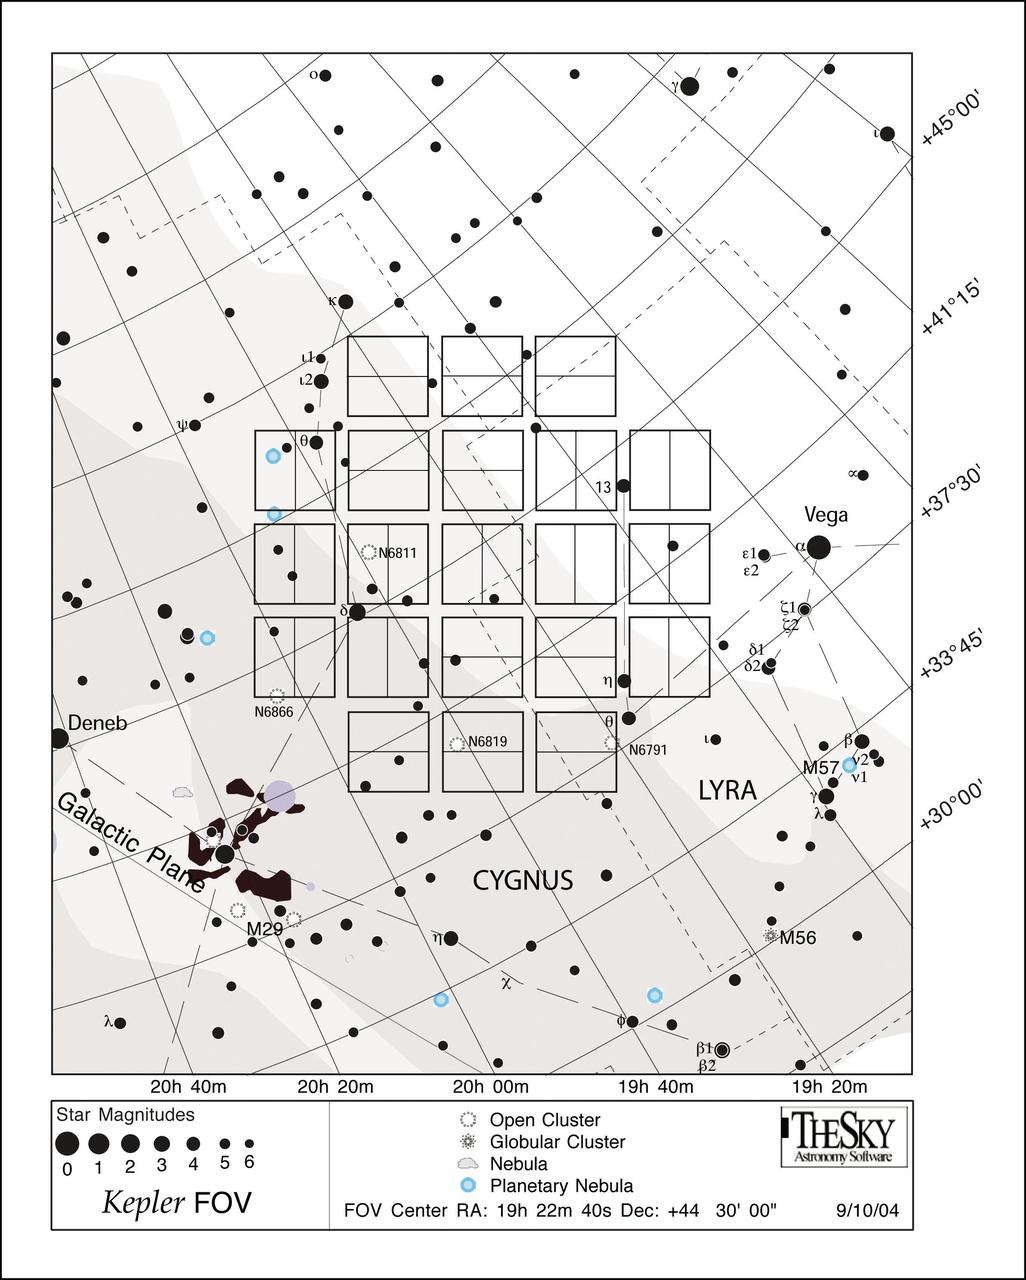
This star chart illustrates the large patch of sky that NASA Kepler mission will stare at for the duration of its three-and-a-half-year lifetime. The planet hunter's full field of view occupies 100 square degrees of our Milky Way galaxy, in the constellations Cygnus and Lyra. Kepler's focal plane, or the area where starlight is focused, is depicted on the star chart as a series of 42 vertical and horizontal rectangles. These rectangles represent the 95-megapixel camera's 42 charge-coupled devices, or CCDs. Scientists selected the orientation of the focal plane's field of view to avoid the region's brightest stars, which are shown as the largest black dots. Some of these bright stars can be seen falling in between the CCD modules, in areas that are not imaged. This was done so that the brightest stars will not saturate large portions of the detectors. Saturation causes signals from the bright stars to spill, or "bloom," into nearby planet-hunting territory. http://photojournal.jpl.nasa.gov/catalog/PIA11983
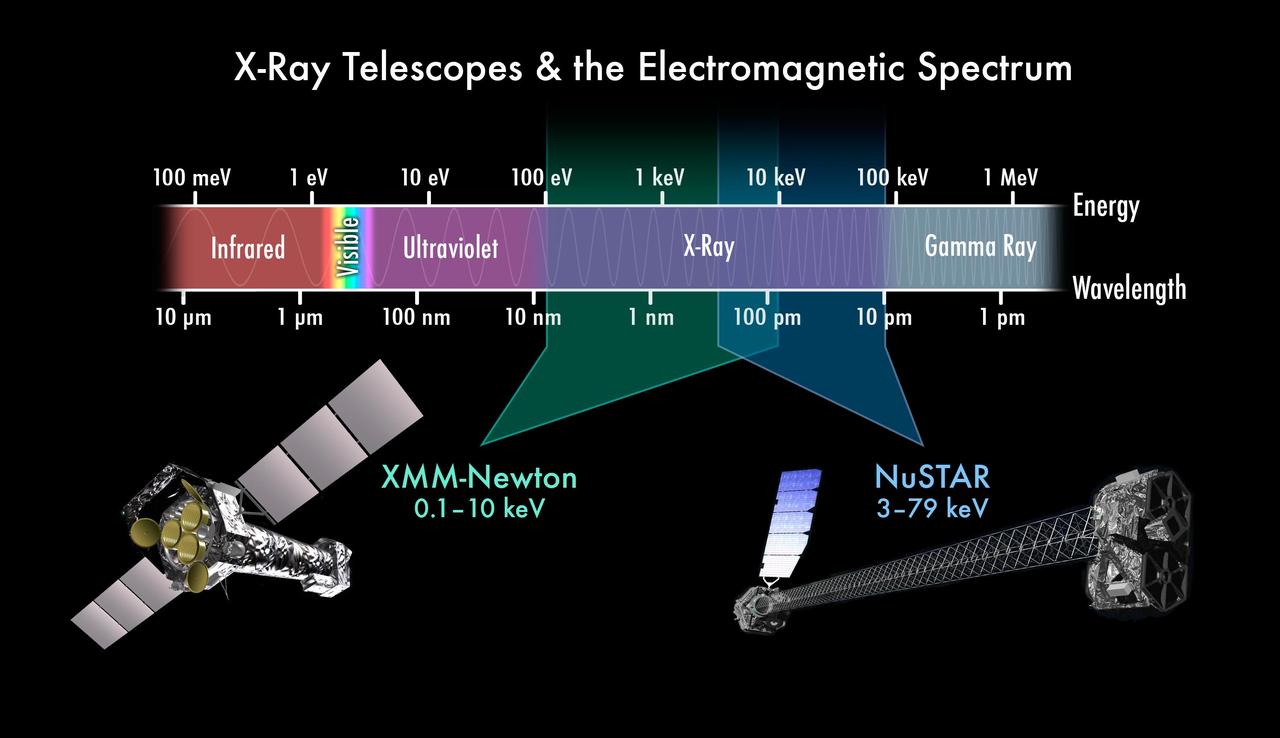
This chart depicts the electromagnetic spectrum, highlighting the X-ray portion. NASA NuSTAR and ESA XMM-Newton telescope complement each other by seeing different colors of X-ray light.

Black holes are tremendous objects whose immense gravity can distort and twist space-time, the fabric that shapes our universe as this chart from NASA NuSTAR and ESA XMM-Newton telescope illustrates.

This chart shows data from NASA Kepler space telescope, which looks for planets by monitoring changes in the brightness of stars. As planets orbit in front of a star, they block the starlight, causing periodic dips.
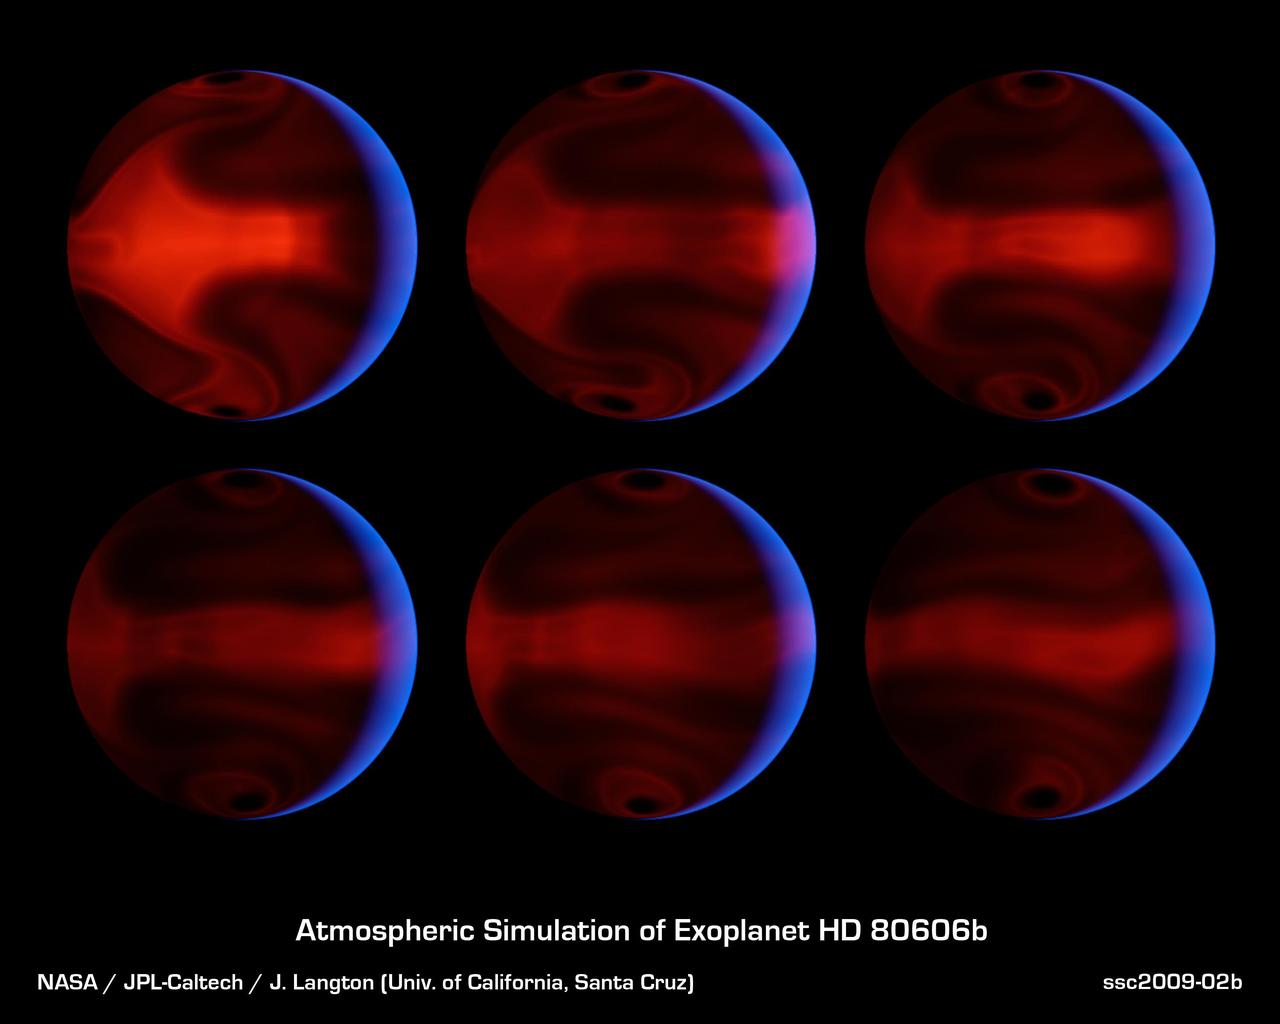
These computer-generated images from NASA Spitzer Space Telescope chart the development of severe weather patterns on the highly eccentric exoplanet HD 80606b during the days after its closest approach to its parent star.

This chart based on data from NASA Wide-field Infrared Survey Explorer illustrates why infrared-sensing telescopes are more suited to finding small, dark asteroids than telescopes that detect visible light.
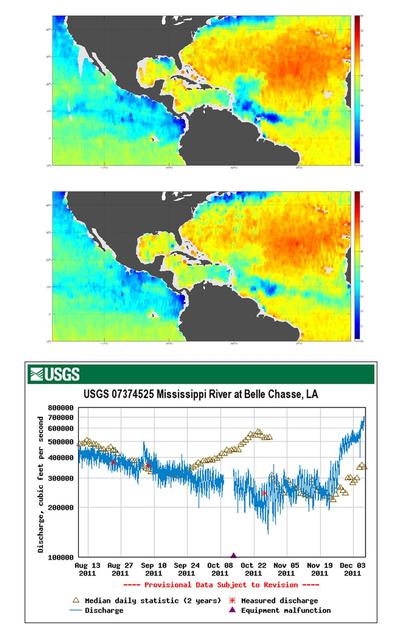
Tropical Storm Lee made landfall over New Orleans on Sept. 2-3, 2011, with predicted rainfall of 15 to 20 inches 38 to 51 centimeters over southern Louisiana. These charts are from NASA Aquarius spacecraft.
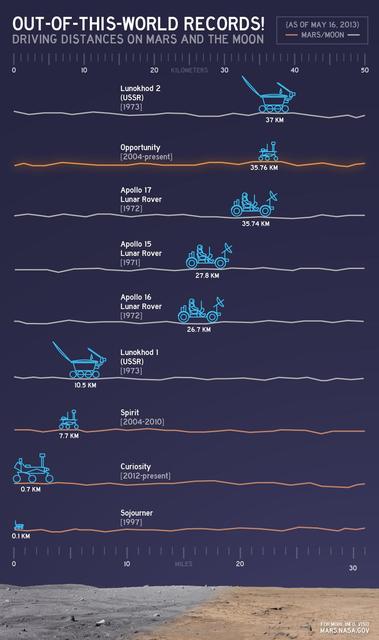
This chart illustrates comparisons among the distances driven by various wheeled vehicles on the surface of Earth moon and Mars. Of the vehicles shown, the NASA Mars rovers Opportunity and Curiosity are still active.
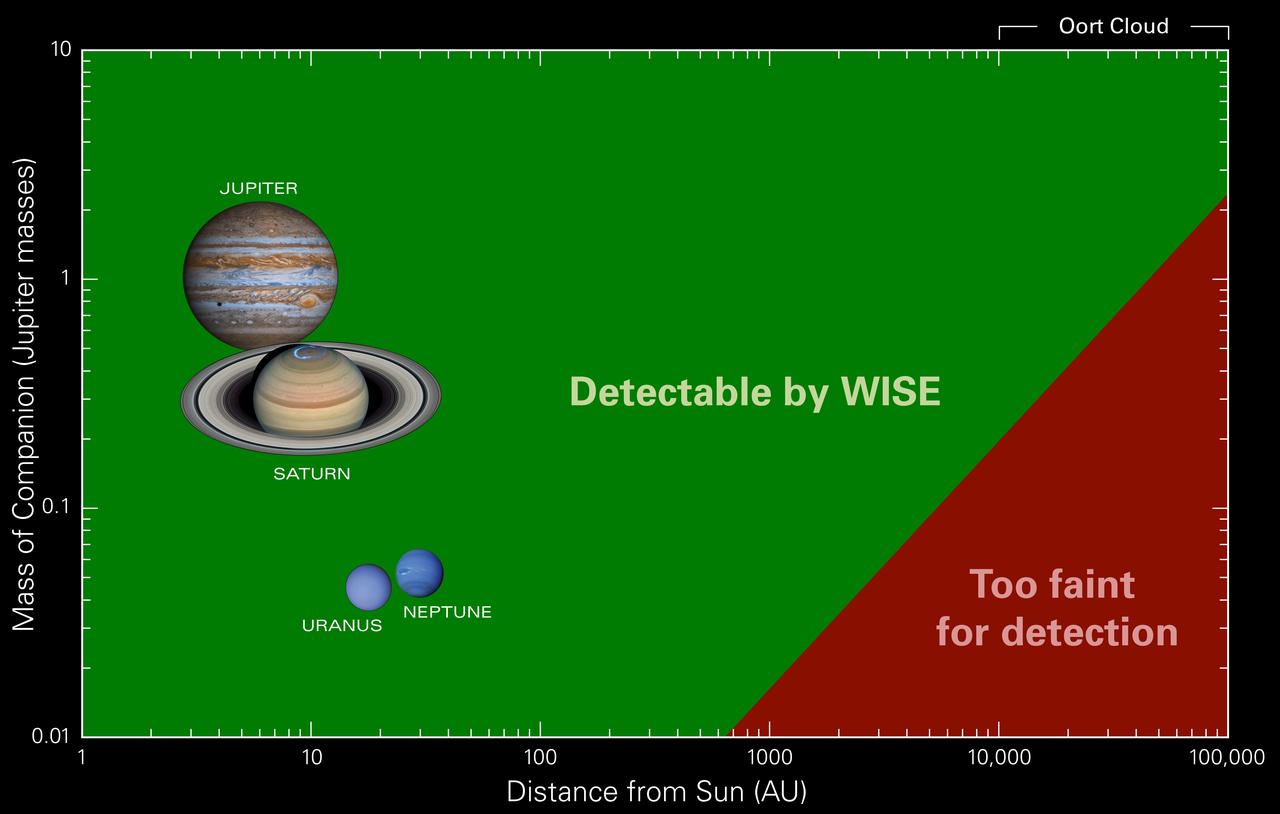
This chart shows what types of objects WISE can and cannot see at certain distances from our sun. Bodies with larger masses are brighter, and therefore can be seen at greater distances.

This chart plots the minimum daily atmospheric temperature measured by NASA Phoenix Mars Lander spacecraft since landing on Mars. As the temperature increased through the summer season, the atmospheric humidity also increased.

This figure charts 30 hours of observations taken by NASA Spitzer Space Telescope of a strongly irradiated exoplanet an planet orbiting a star beyond our own. Spitzer measured changes in the planet heat, or infrared light.
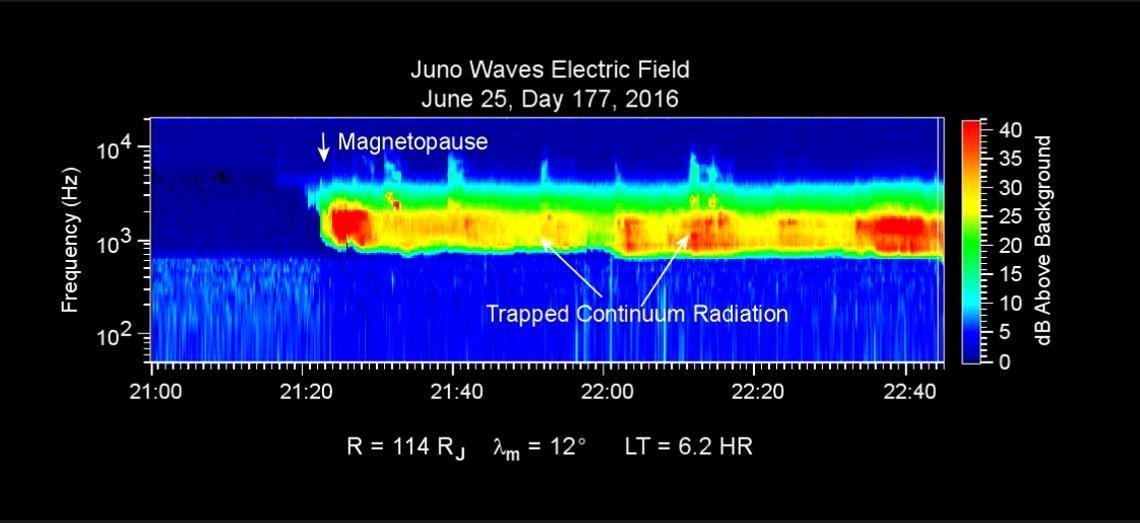
This chart presents data that the Waves investigation on NASA's Juno spacecraft recorded as the spacecraft crossed the bow shock just outside of Jupiter's magnetosphere on June 24, 2016, while approaching Jupiter. Audio accompanies the animation, with volume and pitch correlated to the amplitude and frequency of the recorded waves. The graph is a frequency-time spectrogram with color coding to indicate wave amplitudes as a function of wave frequency (vertical axis, in hertz) and time (horizontal axis, with a total elapsed time of two hours). During the hour before Juno reached the bow shock, the Waves instrument was detecting mainly plasma oscillations just below 10,000 hertz (10 kilohertz). The frequency of these oscillations is related to the local density of electrons; the data yield an estimate of approximately one electron per cubic centimeter (about 16 per cubic inch) in this region just outside Jupiter's bow shock. The broadband burst of noise marked "Bow Shock" is the region of turbulence where the supersonic solar wind is heated and slowed by encountering the Jovian magnetosphere. The shock is analogous to a sonic boom generated in Earth's atmosphere by a supersonic aircraft. The region after the shock is called the magnetosheath. The vertical bar to the right of the chart indicates the color coding of wave amplitude, in decibels (dB) above the background level detected by the Waves instrument. Each step of 10 decibels marks a tenfold increase in wave power. When Juno collected these data, the distance from the spacecraft to Jupiter was about 5.56 million miles (8.95 million kilometers), indicated on the chart as 128 times the radius of Jupiter. Jupiter's magnetic field is tilted about 10 degrees from the planet's axis of rotation. The note of 22 degrees on the chart indicates that at the time these data were recorded, the spacecraft was 22 degrees north of the magnetic-field equator. The "LT" notation is local time on Jupiter at the longitude of the planet directly below the spacecraft, with a value of 6.2 indicating approximately dawn. http://photojournal.jpl.nasa.gov/catalog/PIA20753
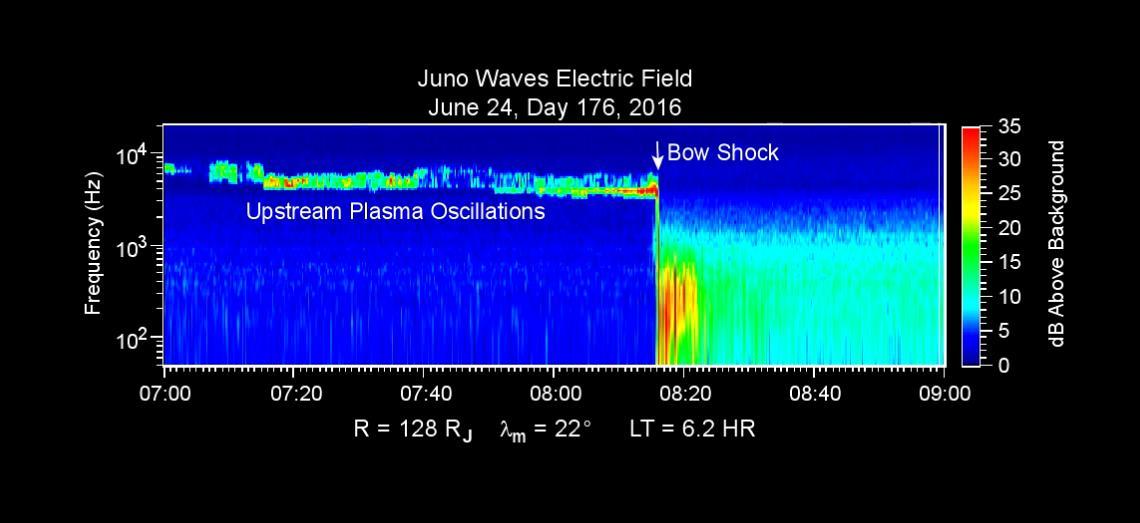
This chart presents data that the Waves investigation on NASA's Juno spacecraft recorded as the spacecraft crossed the bow shock just outside of Jupiter's magnetosphere on June 24, 2016, while approaching Jupiter. Audio accompanies the animation, with volume and pitch correlated to the amplitude and frequency of the recorded waves. The graph is a frequency-time spectrogram with color coding to indicate wave amplitudes as a function of wave frequency (vertical axis, in hertz) and time (horizontal axis, with a total elapsed time of two hours). During the hour before Juno reached the bow shock, the Waves instrument was detecting mainly plasma oscillations just below 10,000 hertz (10 kilohertz). The frequency of these oscillations is related to the local density of electrons; the data yield an estimate of approximately one electron per cubic centimeter (about 16 per cubic inch) in this region just outside Jupiter's bow shock. The broadband burst of noise marked "Bow Shock" is the region of turbulence where the supersonic solar wind is heated and slowed by encountering the Jovian magnetosphere. The shock is analogous to a sonic boom generated in Earth's atmosphere by a supersonic aircraft. The region after the shock is called the magnetosheath. The vertical bar to the right of the chart indicates the color coding of wave amplitude, in decibels (dB) above the background level detected by the Waves instrument. Each step of 10 decibels marks a tenfold increase in wave power. When Juno collected these data, the distance from the spacecraft to Jupiter was about 5.56 million miles (8.95 million kilometers), indicated on the chart as 128 times the radius of Jupiter. Jupiter's magnetic field is tilted about 10 degrees from the planet's axis of rotation. The note of 22 degrees on the chart indicates that at the time these data were recorded, the spacecraft was 22 degrees north of the magnetic-field equator. The "LT" notation is local time on Jupiter at the longitude of the planet directly below the spacecraft, with a value of 6.2 indicating approximately dawn. http://photojournal.jpl.nasa.gov/catalog/PIA20753
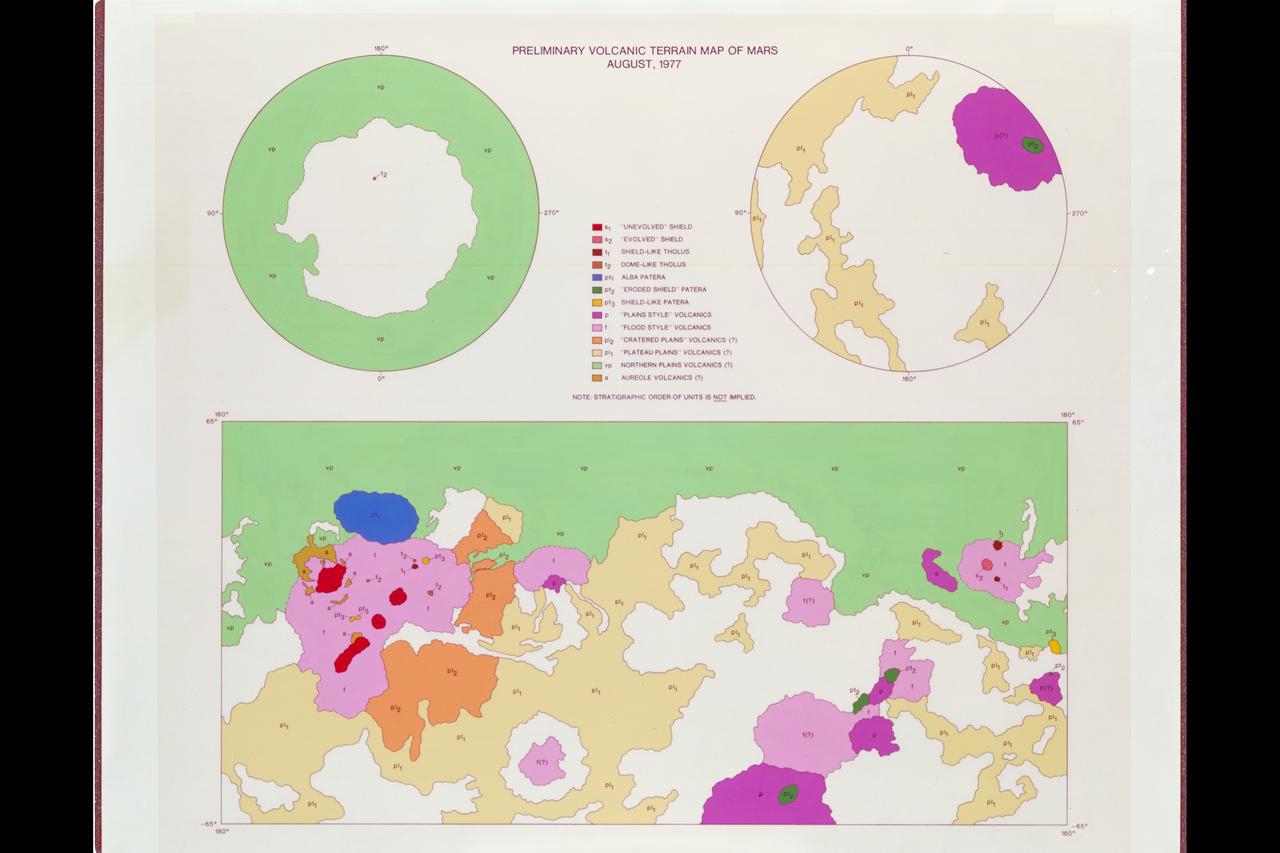
Illustration Preliminary Volcanic Terrain Map of Mars Regional Chart
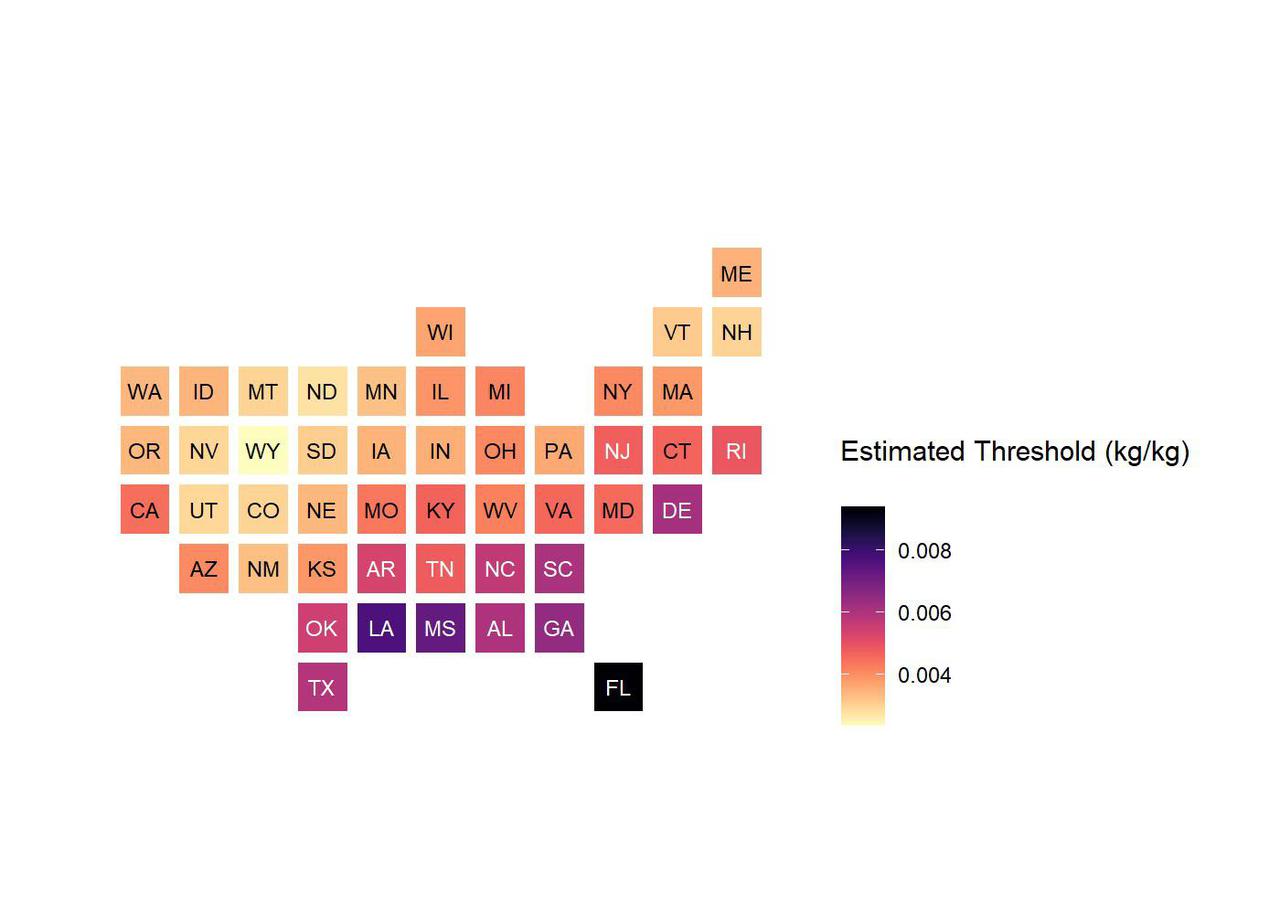
This chart shows low-humidity thresholds that signal flu outbreaks in 48 U.S. states, calculated using water vapor data from NASA's Atmospheric Infrared Sounder (AIRS) instrument on the Aqua satellite with data on U.S. flu cases from 2003 to 2015. The color range from lighter to darker indicates lower to higher humidity thresholds, with the driest state, Wyoming, having the lowest threshold and Florida the highest. Units are kilograms of water per kilogram of air. https://photojournal.jpl.nasa.gov/catalog/PIA24986

Chief astronaut and director of flight crew operations, Donald K. Slayton (right front) reviews lunar charts with Apollo 11 astronauts Michael Collins (left), Neil Armstrong, and Edwin Aldrin (next to Slayton) during breakfast a short time before the three men launched for the first Moon landing mission. Sharing breakfast with the crew was William Anders (left rear), Lunar Module pilot for the Apollo 8 lunar orbit mission. The Apollo 11 mission launched from the NASA Kennedy Space Center (KSC) in Florida via the Marshall Space Flight Center (MSFC) developed Saturn V launch vehicle on July 16, 1969 and safely returned to Earth on July 24, 1969. The CM, “Columbia”, piloted by Collins, remained in a parking orbit around the Moon while the LM, “Eagle’’, carrying astronauts Armstrong and Aldrin, landed on the Moon. On July 20, 1969, Armstrong was the first human to ever stand on the lunar surface, followed by Aldrin. During 2½ hours of surface exploration, the crew collected 47 pounds of lunar surface material for analysis back on Earth. With the success of Apollo 11, the national objective to land men on the Moon and return them safely to Earth had been accomplished.
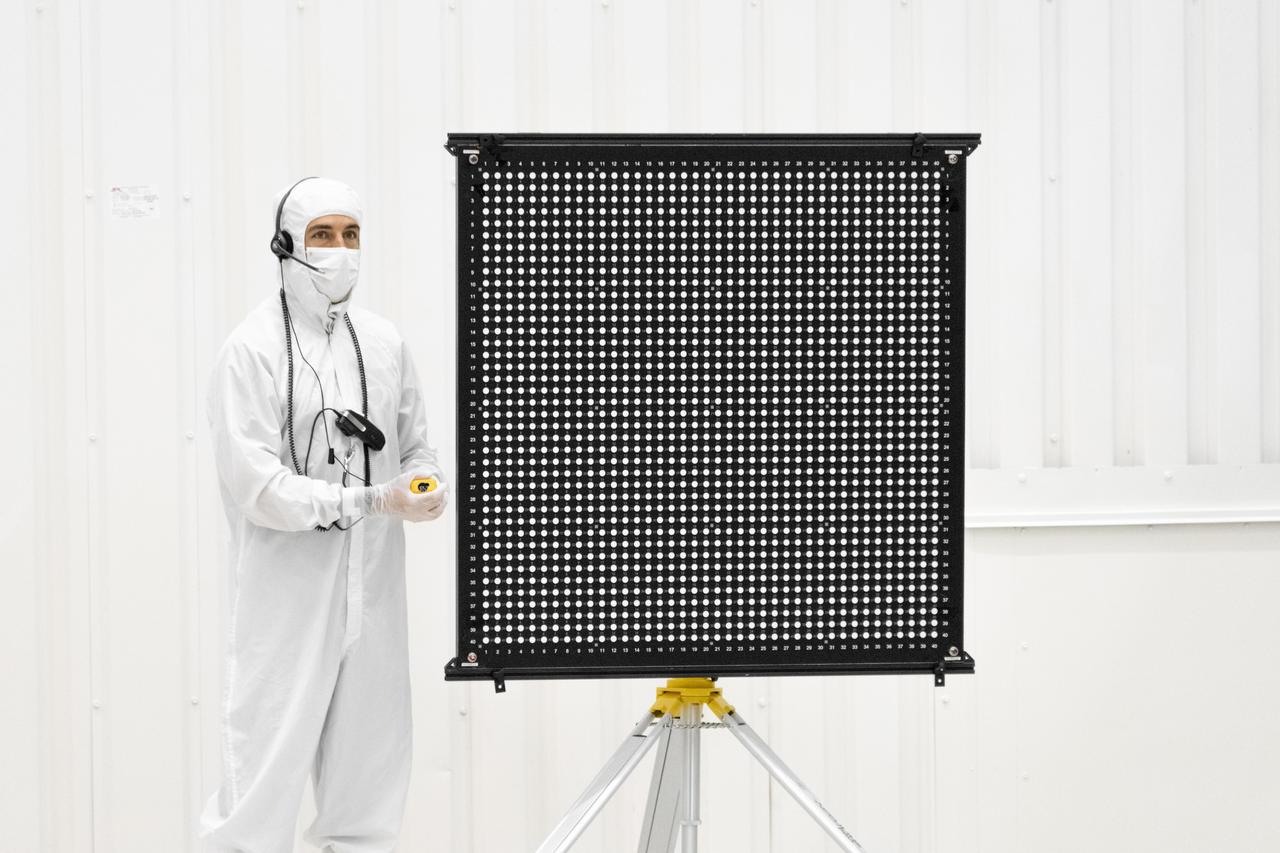
Engineer Chris Chatellier stands next to a target board with 1,600 dots. The board was one of several used on July 23, 2019, in the Spacecraft Assembly Facility's High Bay 1 at NASA's Jet Propulsion Laboratory in Pasadena, California, to calibrate the forward-facing cameras on the Mars 2020 rover. https://photojournal.jpl.nasa.gov/catalog/PIA23313
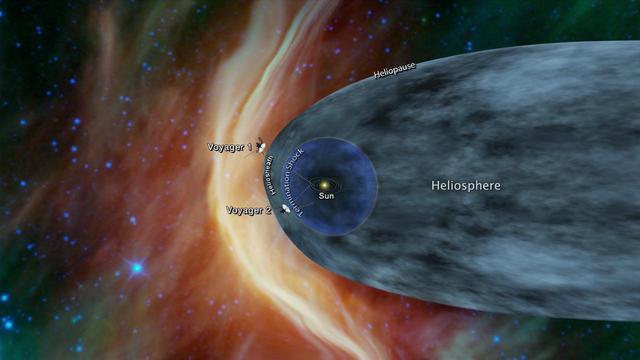
This graphic shows the position of the Voyager 1 and Voyager 2 probes, relative to the heliosphere, a protective bubble created by the Sun that extends well past the orbit of Pluto. Voyager 1 crossed the heliopause, or the edge of the heliosphere, in 2012. Voyager 2 is still in the heliosheath, or the outermost part of the heliosphere. https://photojournal.jpl.nasa.gov/catalog/PIA22566
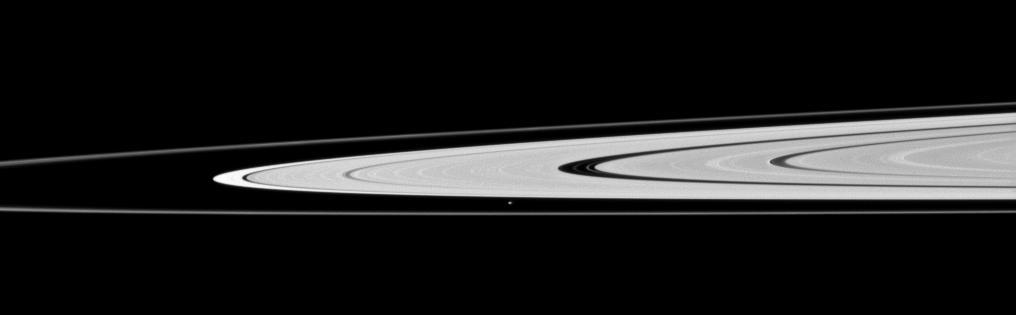
Saturn moon Atlas, just below the center of this image taken by NASA Cassini spacecraft, orbits in the Roche Division between the A ring and thin F ring.
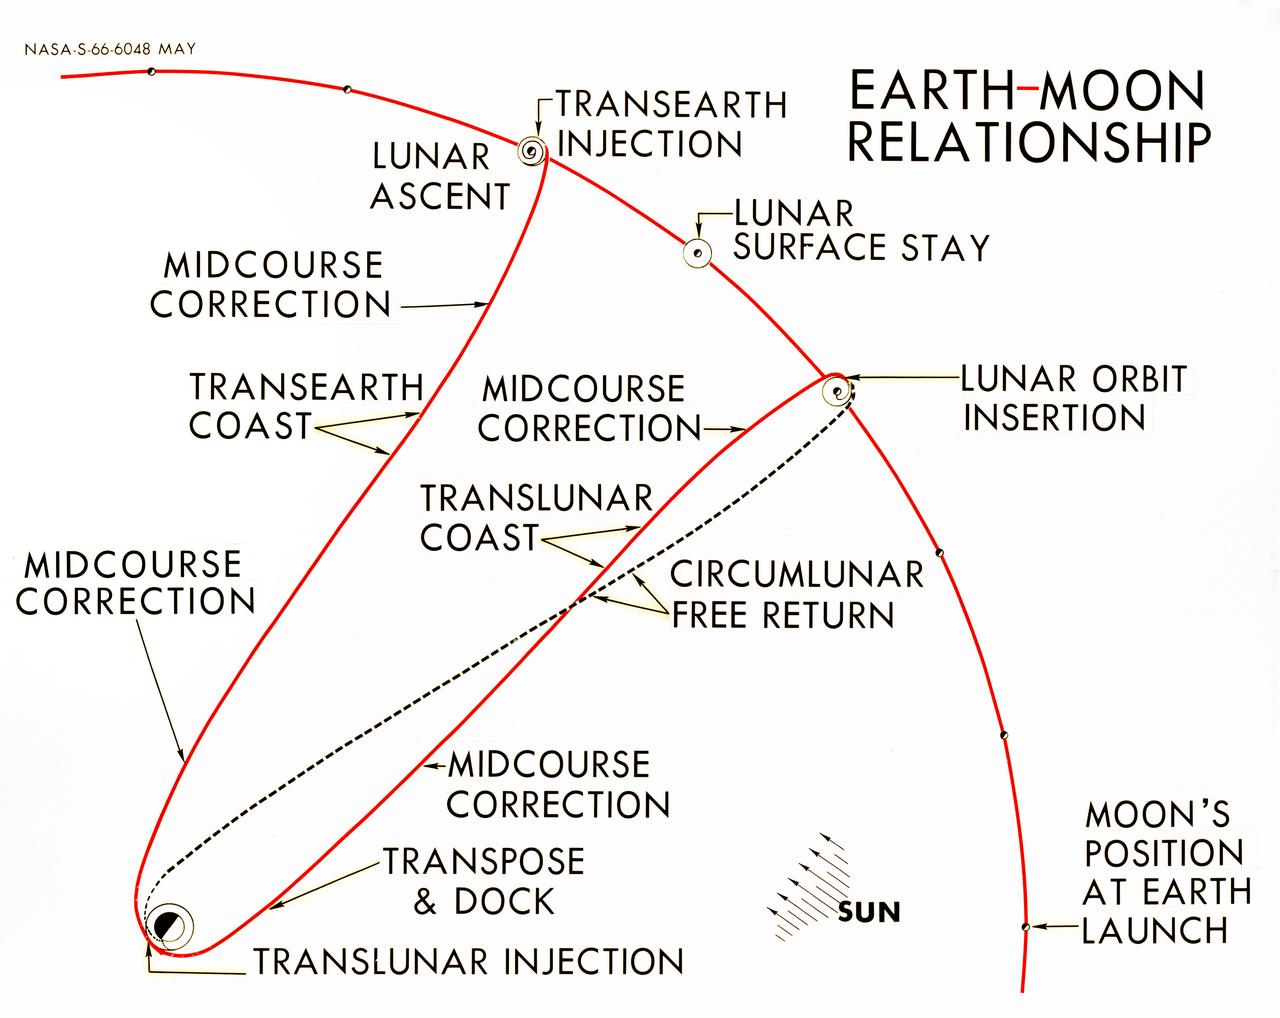
S66-06048 (1966) --- This chart depicts a nominal mission profile for an Apollo lunar landing mission. Photo credit: NASA
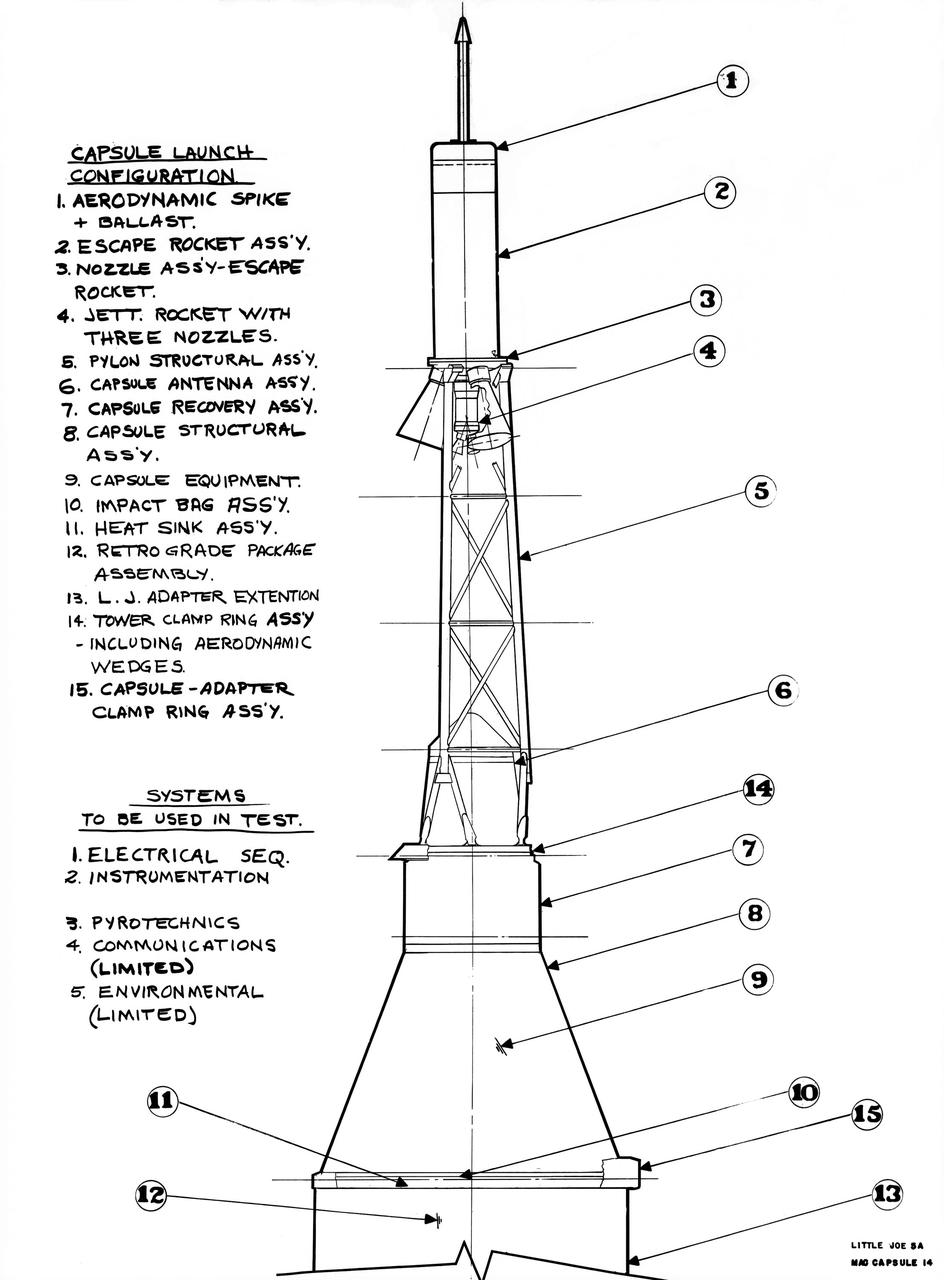
S61-01600 (11 March 1961) --- This is the G2498 Little Joe 5A mission preparedness chart. Photo credit: NASA
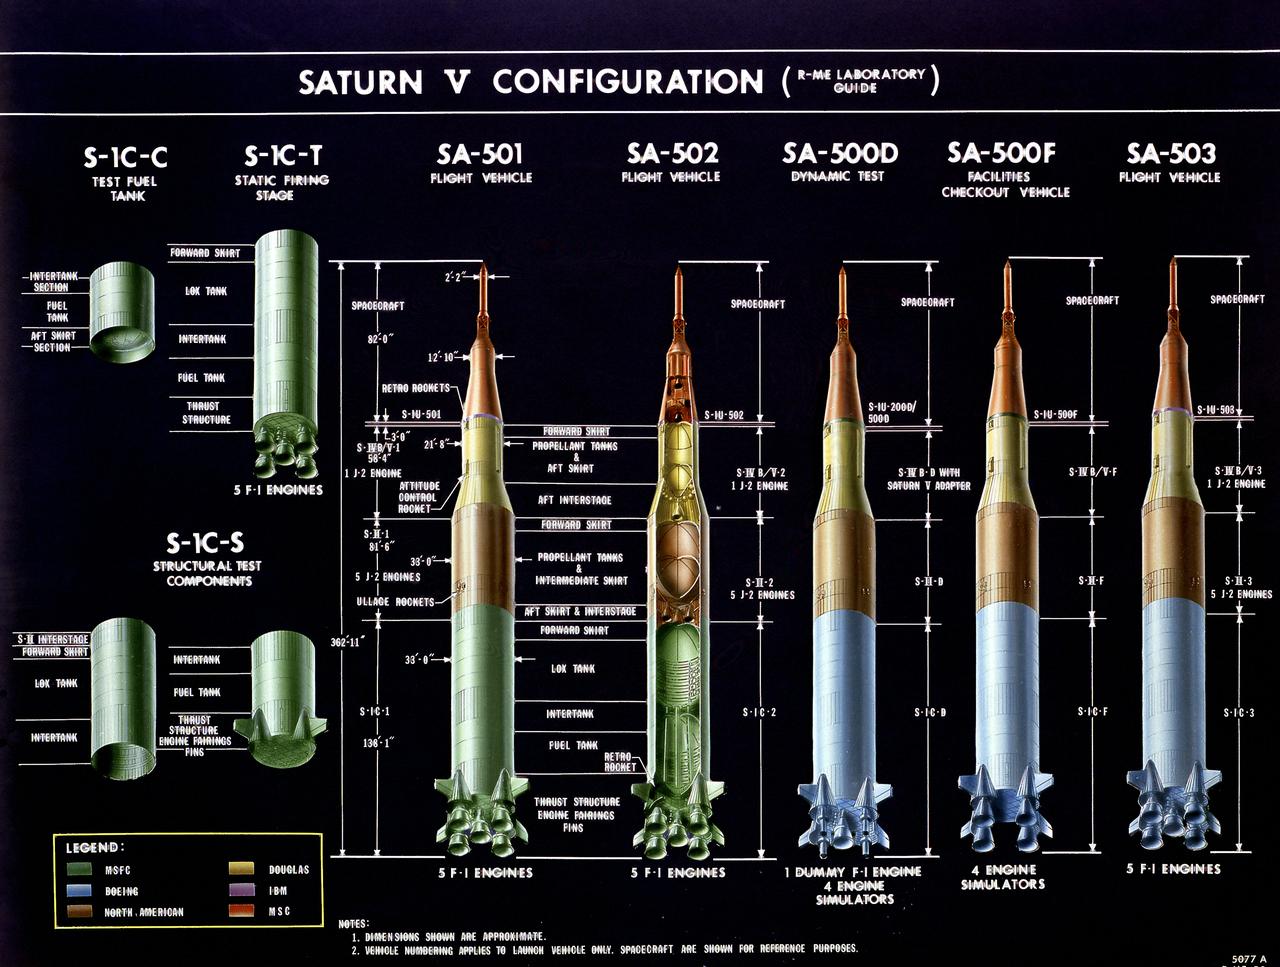
This chart illustrates the testing vehicle and flight vehicle configurations, in addition to the approximate dimensions of the stages of the Saturn V launch vehicle.

51F-08-010 (29 July-6 Aug 1985) --- C. Gordon Fullerton with consummables charts.

Severnaya Zemlya is an archipelago in the Russian high Arctic. It was first charted in 1930, making it the last large archipelago on Earth to be explored. It consists of four main islands: October Revolution, Bolshevik, Komsomolets, and Pioneer. All are mostly glaciated; the glaciers have a characteristic dome shape. This image of the center of October Revolution Island shows two of these glaciers. The ice-free areas between the glaciers expose folded sedimentary rocks. The image was acquired September 18, 2012, covers an area of 45.6 by 48.3 kilometers, and is located at 79.8 degrees north, 96.1 degrees east. https://photojournal.jpl.nasa.gov/catalog/PIA23018

This chart illustrates how NASA Curiosity rover talks to Earth. While the rover can send direct messages, it communicates more efficiently with the help of spacecraft in orbit, including NASA Odyssey and MRO, and European Space Agency Mars Express.
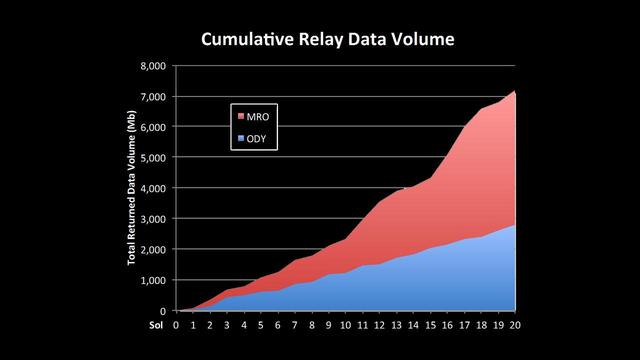
This chart shows increases in the volume of data coming back from NASA Mars Curiosity over recent sols. New capabilities of the Electra relay-radios on MRO and Curiosity have greatly increased the volume of data the rover is sending back from Mars.
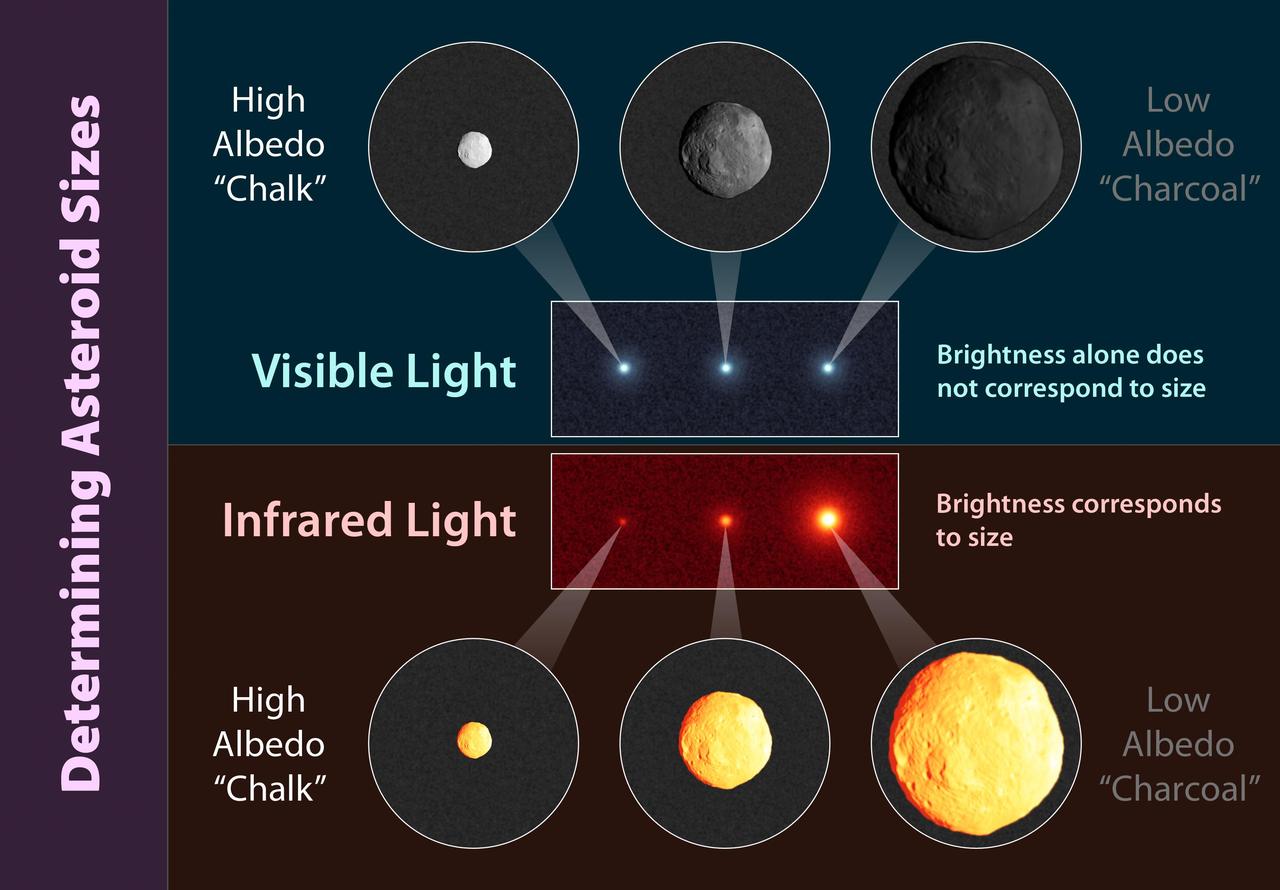
This chart based on data from NASA Wide-field Infrared Survey Explorer illustrates how infrared is used to more accurately determine an asteroid size; three asteroids of different sizes can look similar when viewed in visible-light.

This chart compares the first Earth-size planets found around a sun-like star to planets in our own solar system, Earth and Venus. NASA Kepler mission discovered the newfound planets, called Kepler-20e and Kepler-20f.
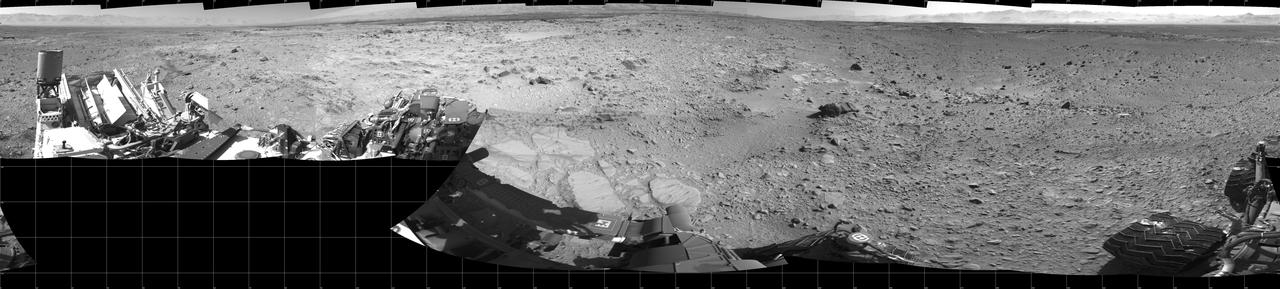
The rock-studded terrain NASA Mars rover Curiosity has traversed since October 2013 appears to have accelerated the pace of wear and tear on the rover wheels. Future drives may be charted to cross smoother ground where available.
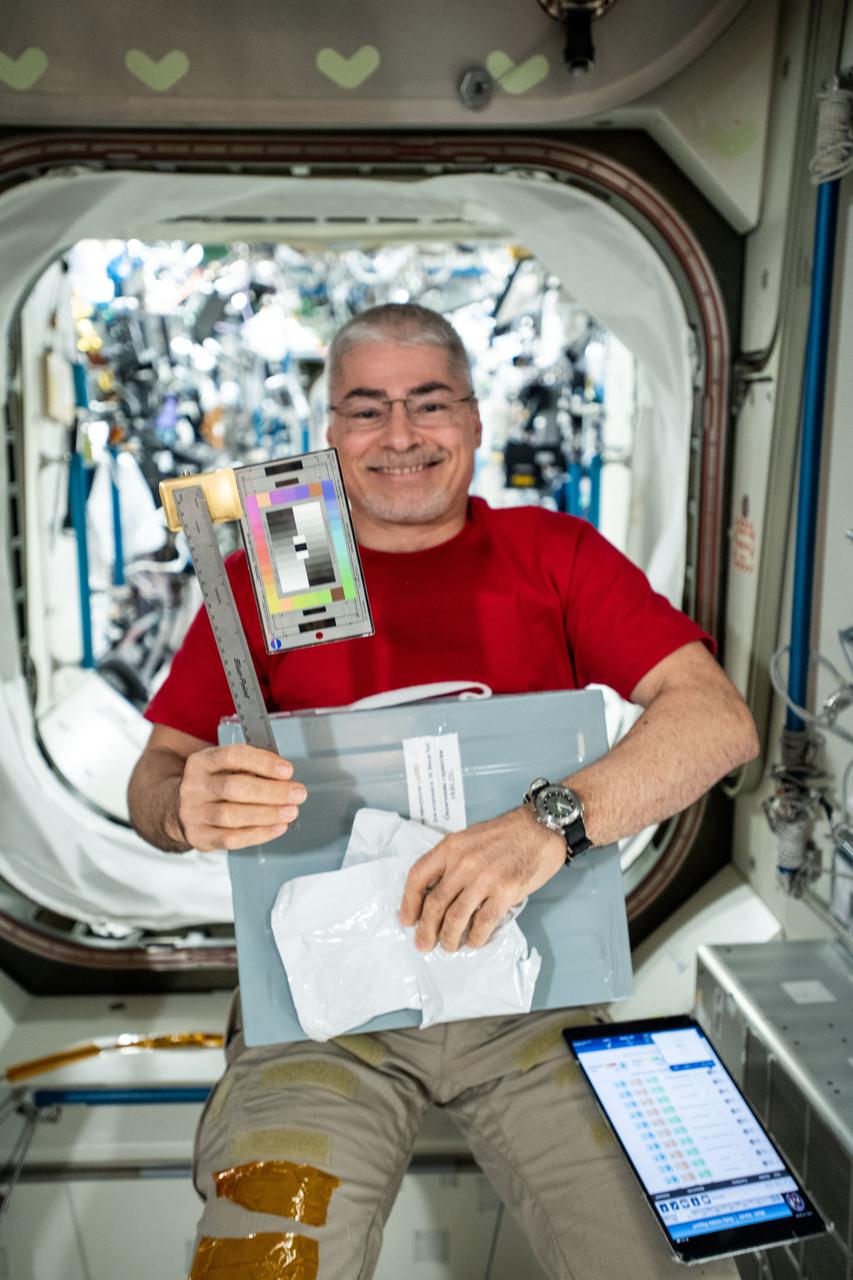
iss066e129772 (Jan. 28, 2022) --- NASA astronaut and Expedition 66 Flight Engineer Mark Vande Hei poses with a ruler and color chart aboard the International Space Station. The ruler and chart are used for the SQuARES study looking at how crew members use different objects and spaces over time. This investigation may provide information that helps improve the design of future space craft and habitats.
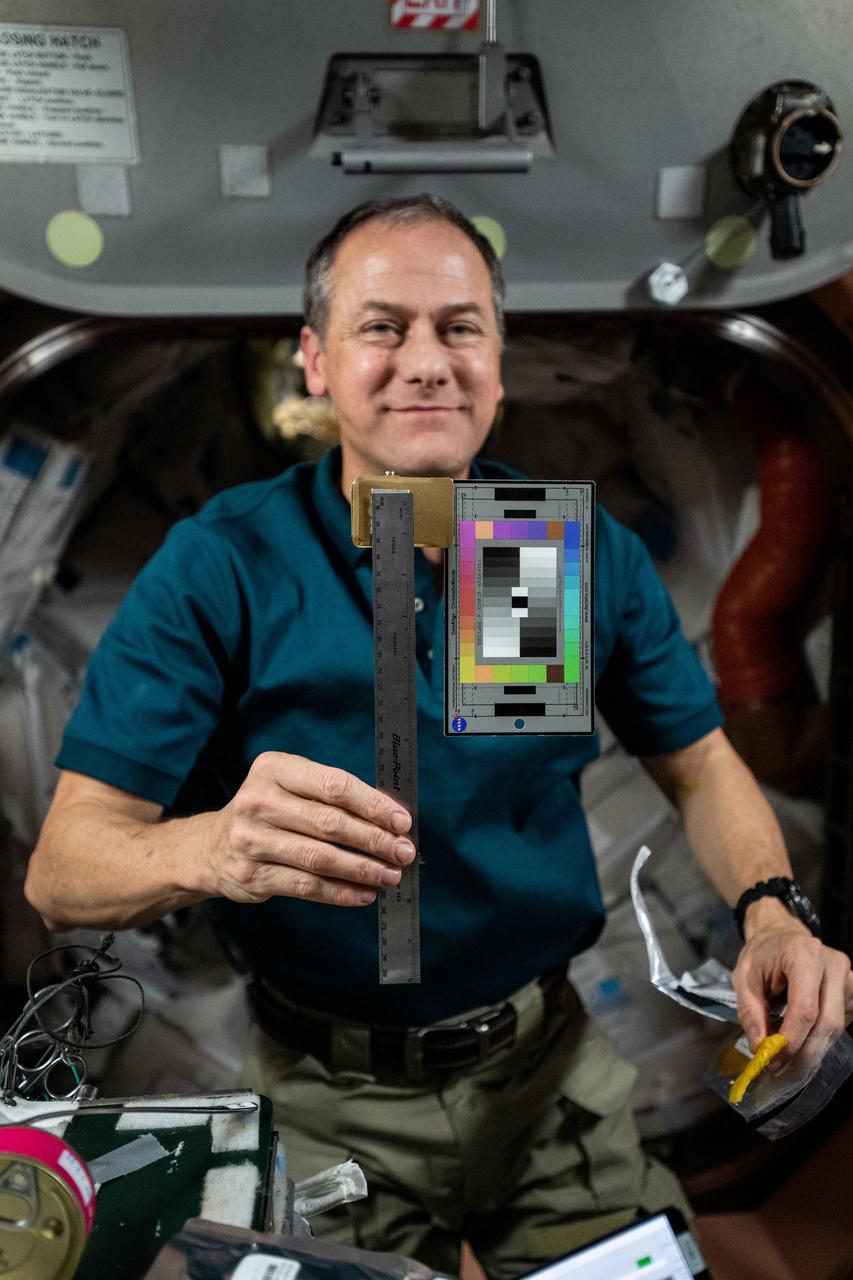
iss066e129769 (Jan. 28, 2022) --- NASA astronaut and Expedition 66 Flight Engineer Thomas Marshburn poses with a ruler and color chart aboard the International Space Station. The ruler and chart are used for the SQuARES study looking at how crew members use different objects and spaces over time. This investigation may provide information that helps improve the design of future space craft and habitats.
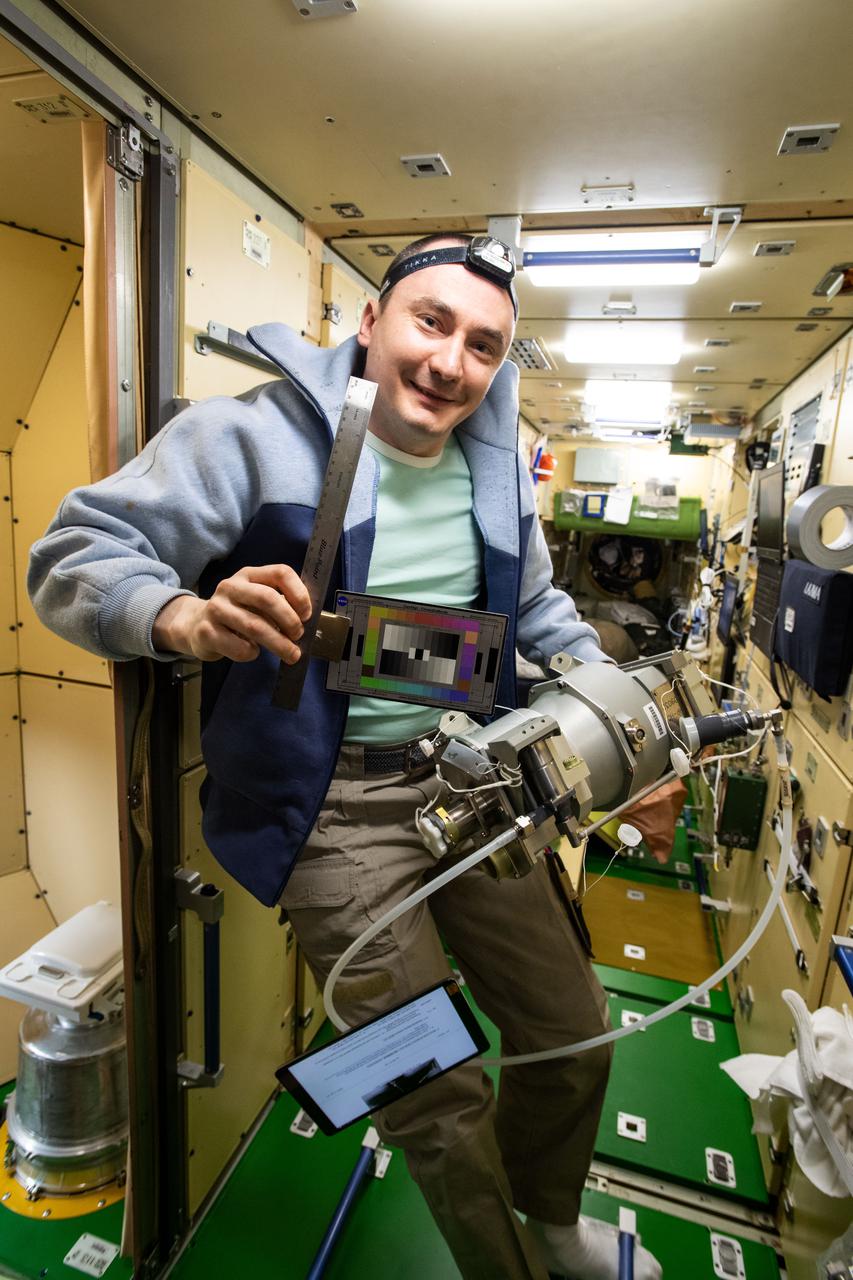
iss066e129780 (Jan. 28, 2022) --- Roscosmos cosmonaut and Expedition 66 Flight Engineer Pyotr Dubrov poses with a ruler and color chart while working inside the Nauka multipurpose laboratory module. The ruler and chart are used for the SQuARES study looking at how crew members use different objects and spaces over time. This investigation may provide information that helps improve the design of future space craft and habitats. At bottom left, is the Nauka module's toilet.

iss066e129773 (Jan. 28, 2022) --- ESA (European Space Agency) astronaut and Expedition 66 Flight Engineer Matthias Maurer poses with a ruler and color chart abaord the International Space Station's Unity module. To his rear, are NASA Flight Engineers Mark Vande Hei and Kayla Barron. The ruler and chart are used for the SQuARES study looking at how crew members use different objects and spaces over time. This investigation may provide information that helps improve the design of future space craft and habitats.

iss066e129776 (Jan. 28, 2022) --- Roscosmos cosmonaut and Expedition 66 Commander Anton Shkaplerov poses with a ruler and color chart aboard the International Space Station's Unity module. The ruler and chart are used for the SQuARES study looking at how crew members use different objects and spaces over time. This investigation may provide information that helps improve the design of future space craft and habitats.
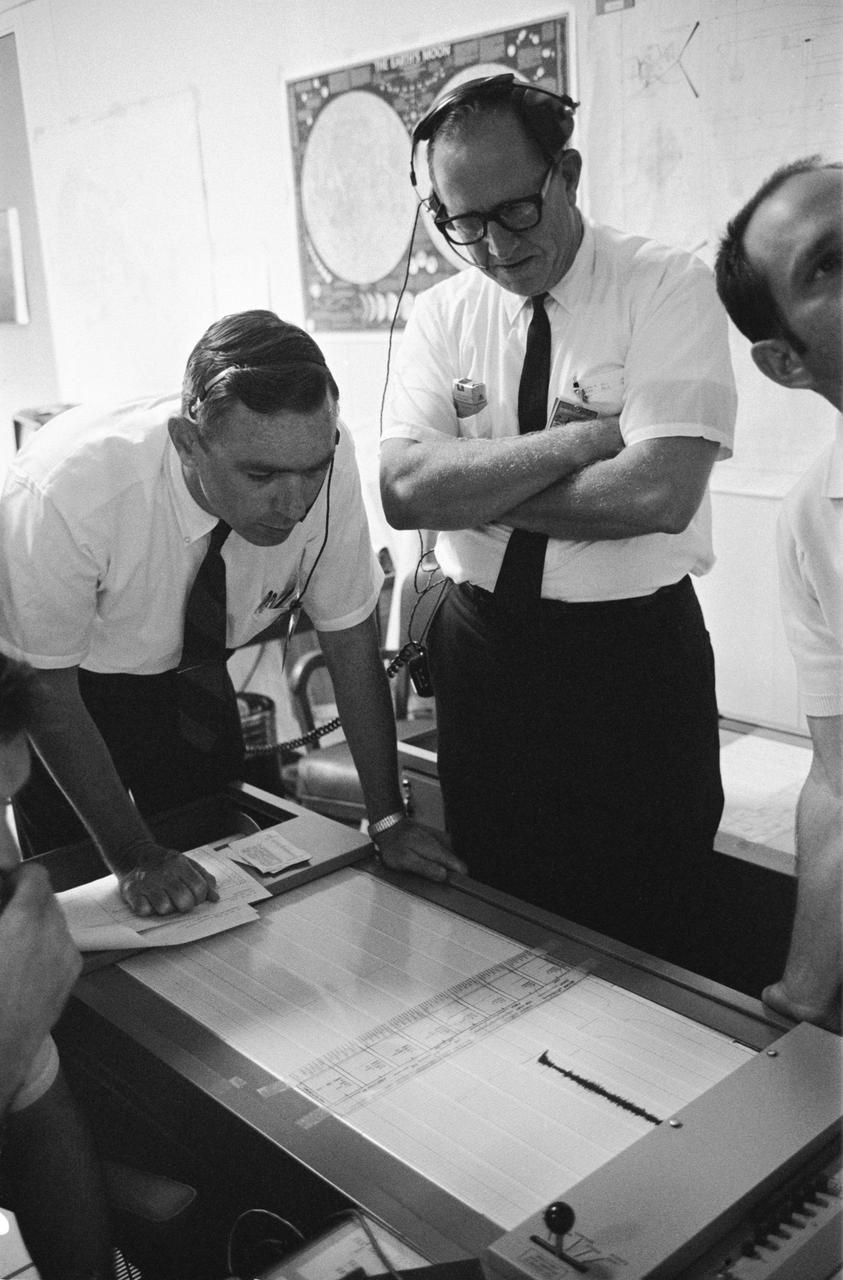
S69-39587 (20 July 1969) --- Dr. Garry Latham (left) with the Lamont Geological Observatory, studies seismometer tracings in the Mission Control Center's (MCC) ALSEP control room. The electronic data was coming from the Passive Seismic Experiments Package (PSEP) which the Apollo 11 astronauts had just deployed on the surface of the moon. Dr. Lamont is the principal investigator for the PSEP, a component of the Early Apollo Scientific Experiments Package (EASEP). PSEP uses three long-period seismometers and one short-period vertical seismometer for measuring meteoroid impacts and moonquakes. Such data will be useful in determining the interior structure of the moon; for example, does the moon have a core and mantle like Earth? Here, the flapping of the PSEP's solar panels is picked up and registered as a tracing. The PSEP was sensitive enough to pick up the footsteps of astronauts Neil A. Armstrong and Edwin E. Aldrin Jr., as they walked on the moon.

Materials with a smaller mean atomic mass, such as lithium (Li) hydride and polyethylene, make the best radiation shields for astronauts. The materials have a higher density of nuclei and are better able to block incoming radiation. Also, they tend to produce fewer and less dangerous secondary particles after impact with incoming radiation.
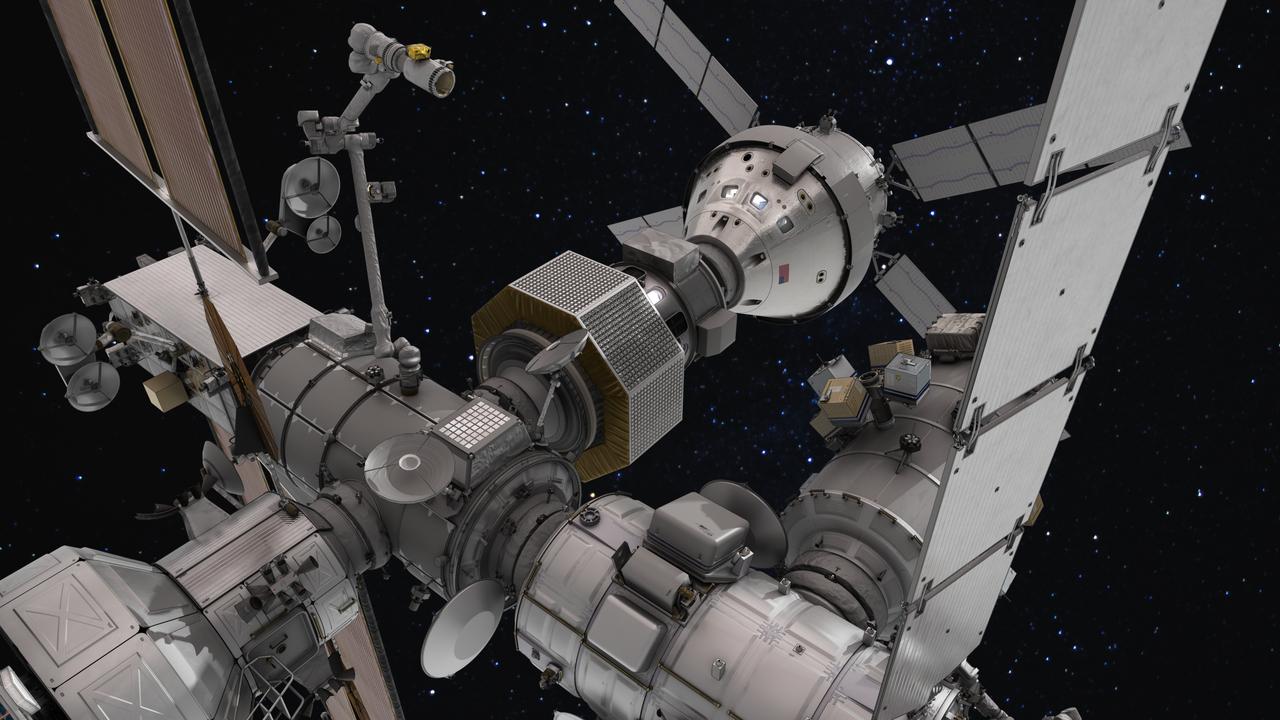
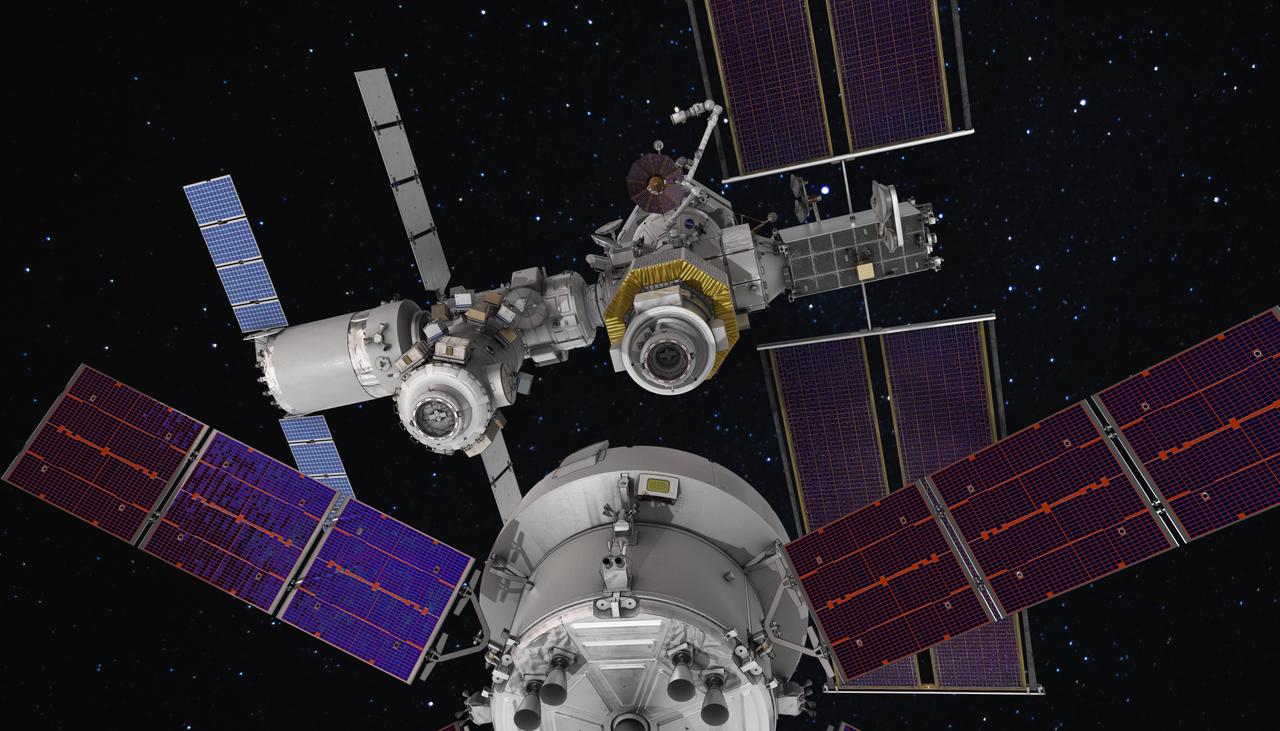
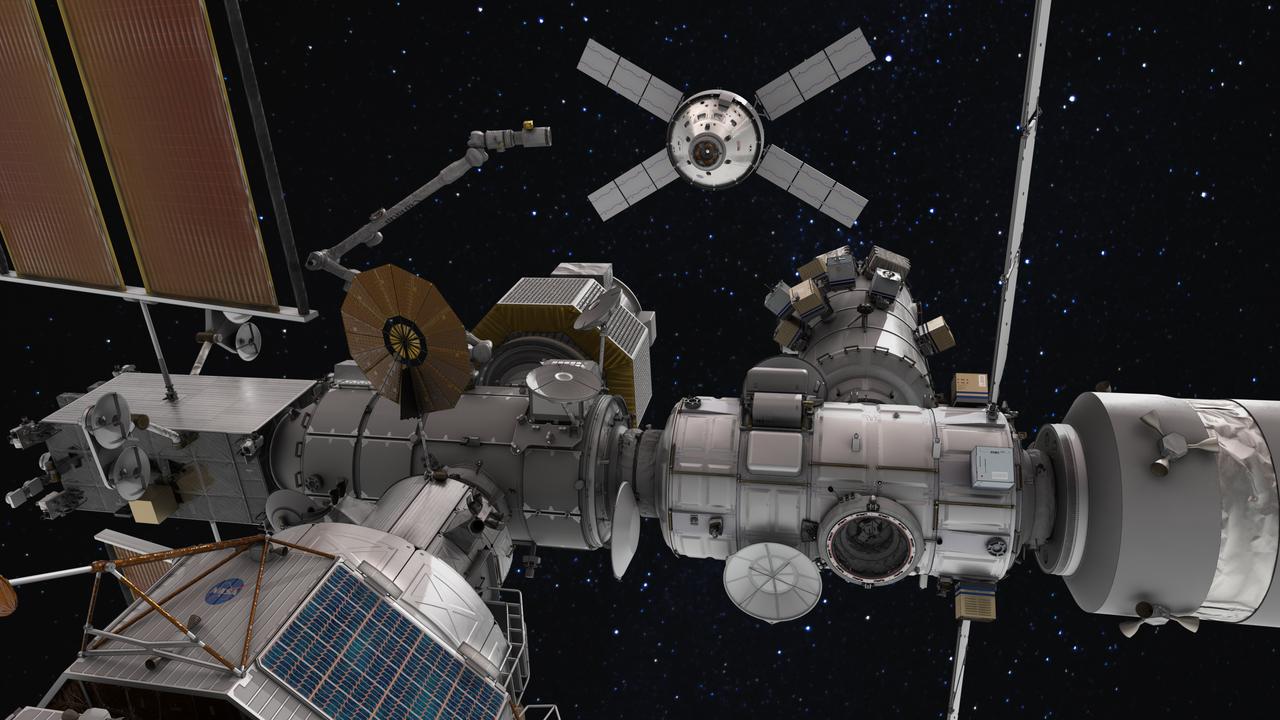
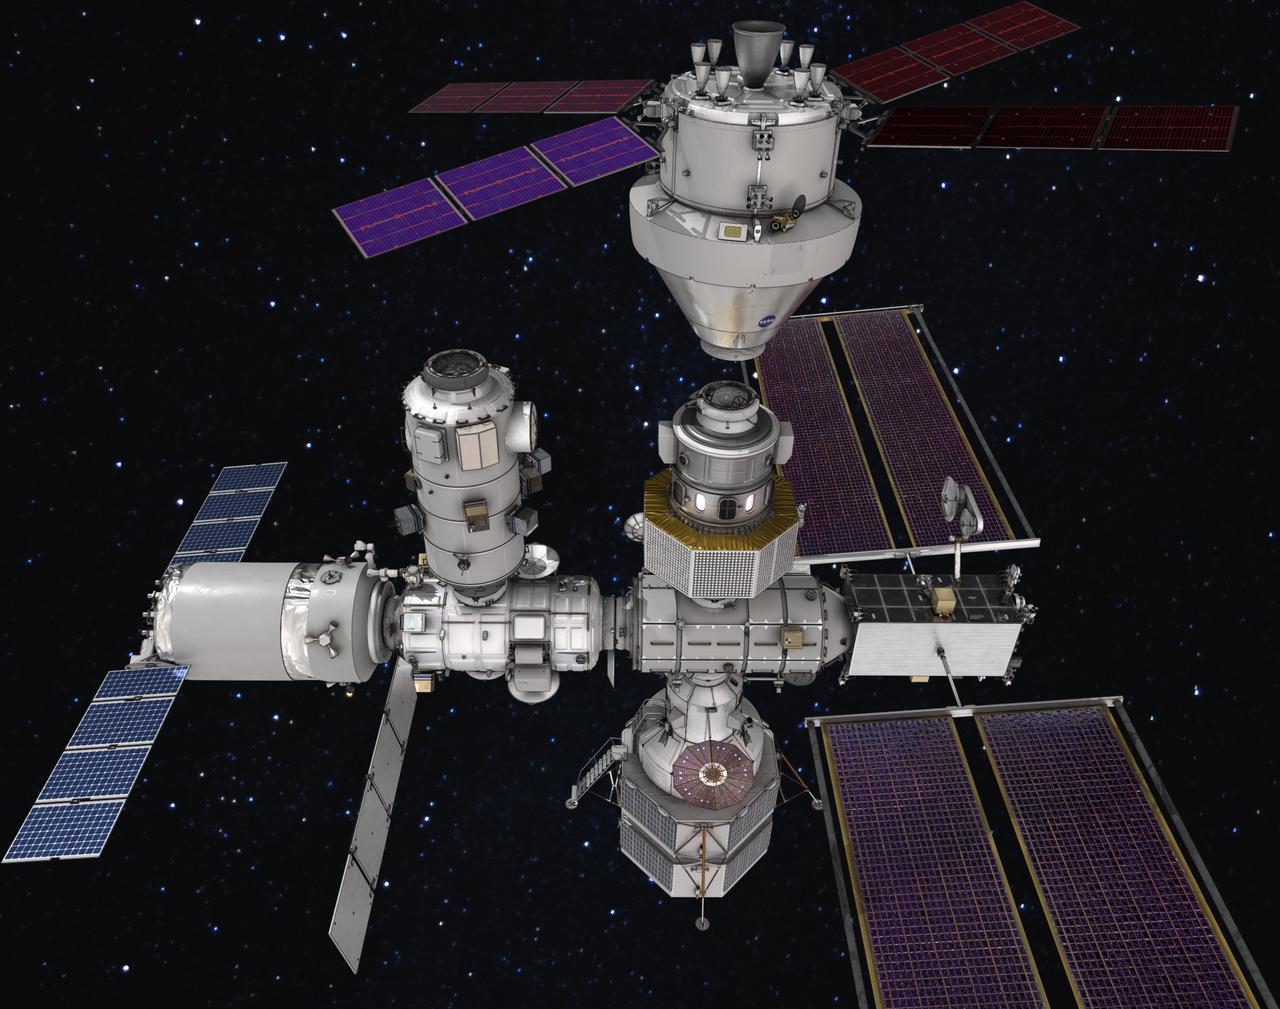
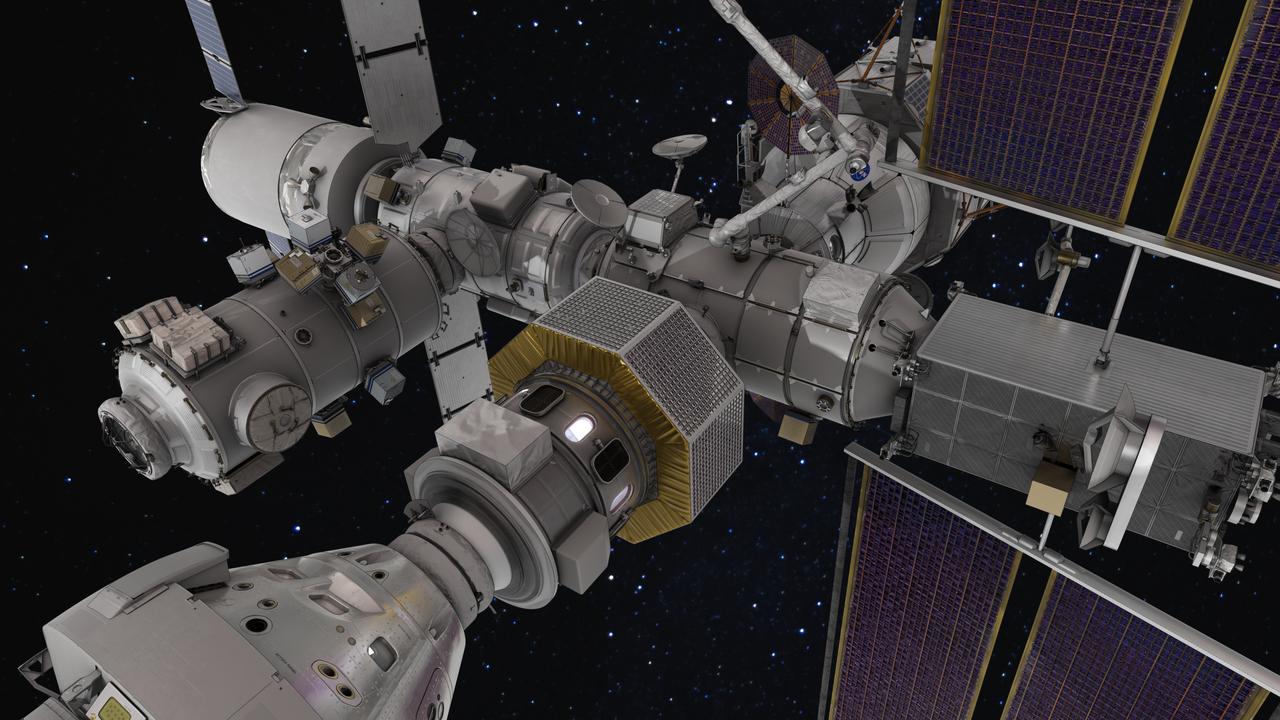
The Gateway space station will be humanity's first space station in lunar orbit as a vital component of the Artemis missions to return humans to the Moon for scientific discovery and chart a path for humans to Mars.
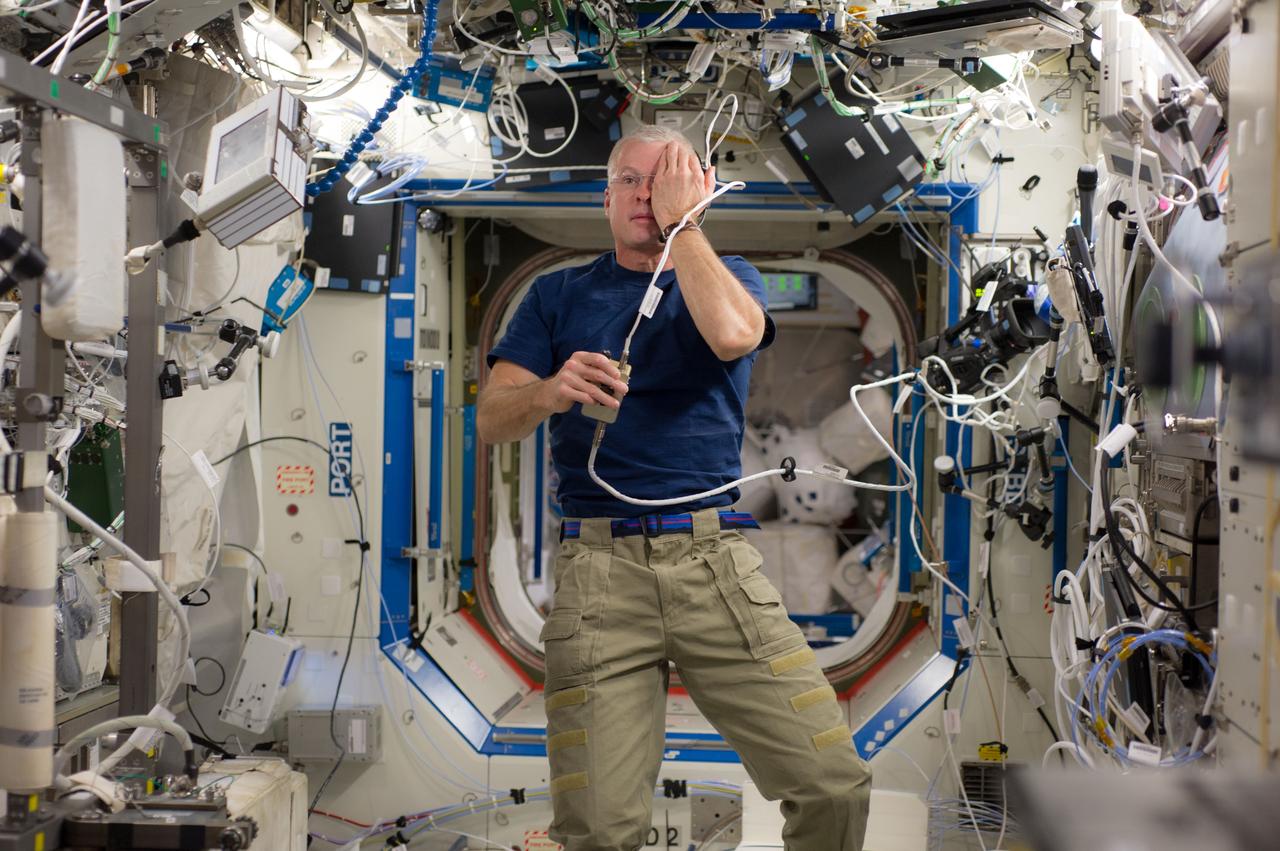
ISS040-E-006106 (2 June 2014) --- NASA astronaut Steve Swanson, Expedition 40 commander, performs a visual exam using an eye chart (out of frame) in the Destiny laboratory of the International Space Station.
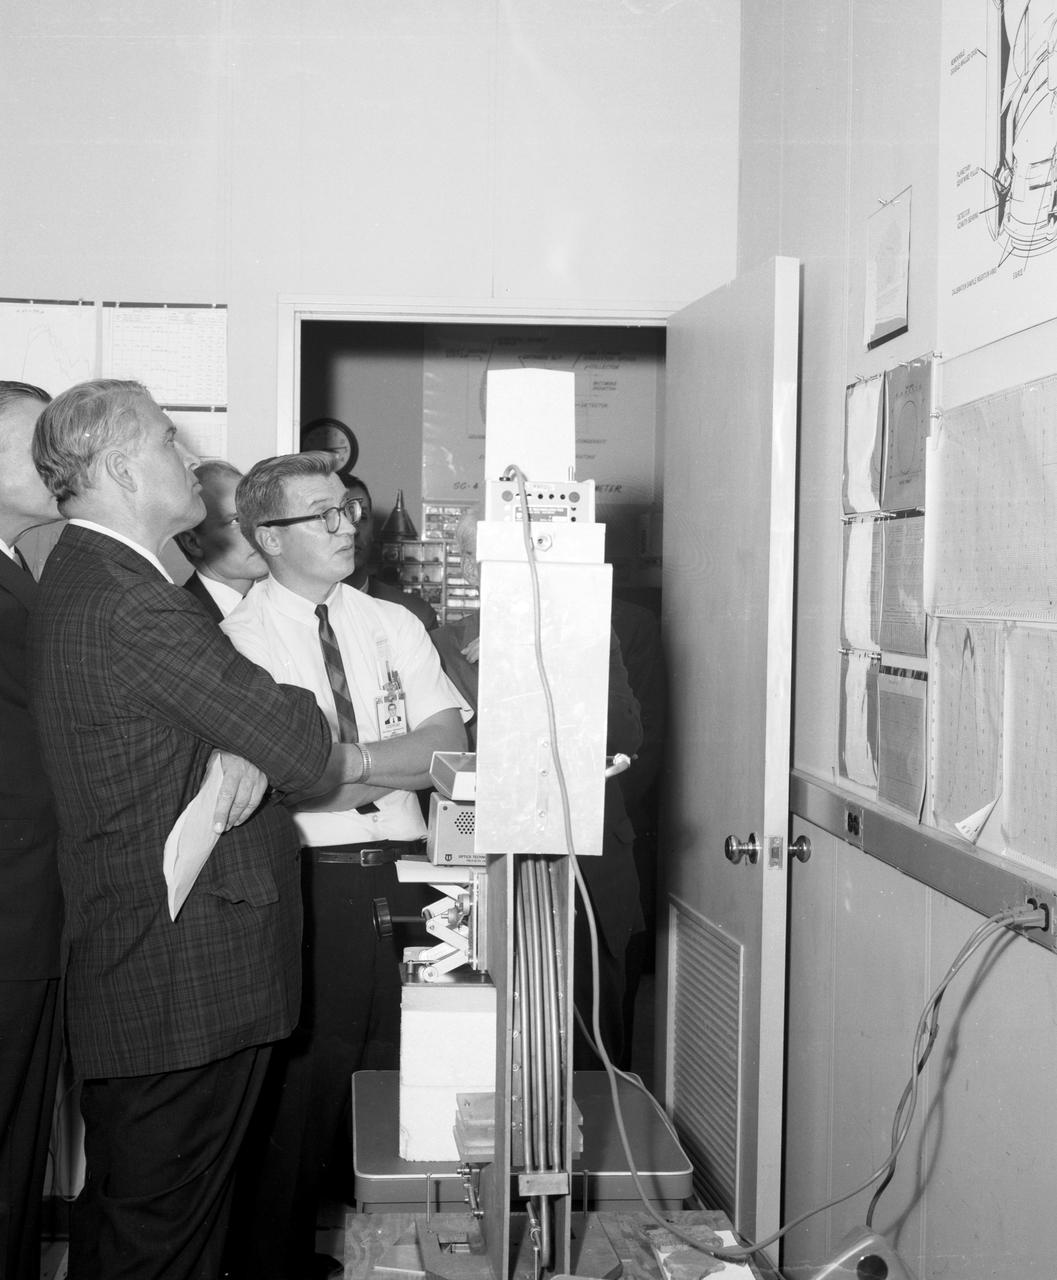
Marshall Space Flight Center’s (MSFC) Director, Dr. Wernher von Braun (left), studies charts depicting the status of an experiment conducted in MSFC’s Space Sciences Laboratory during a tour on August 28, 1967.
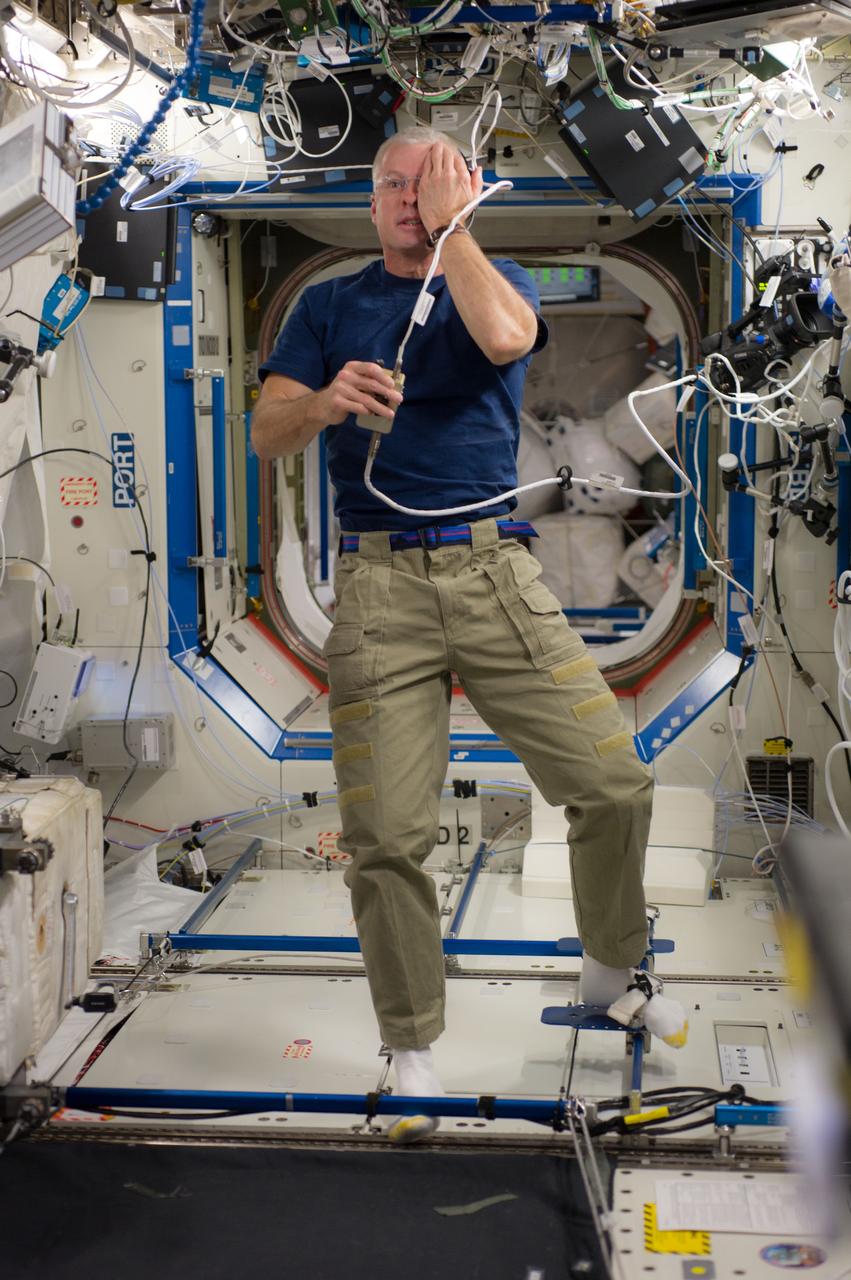
ISS040-E-006107 (2 June 2014) --- NASA astronaut Steve Swanson, Expedition 40 commander, performs a visual exam using an eye chart (out of frame) in the Destiny laboratory of the International Space Station.

ISS028-E-046354 (13 Sept. 2011) --- Japan Aerospace Exploration Agency astronaut Satoshi Furukawa, Expedition 28 flight engineer, holds an eye chart in the Destiny laboratory of the International Space Station.
The Gateway space station will be humanity's first space station in lunar orbit as a vital component of the Artemis missions to return humans to the Moon for scientific discovery and chart a path for humans to Mars.
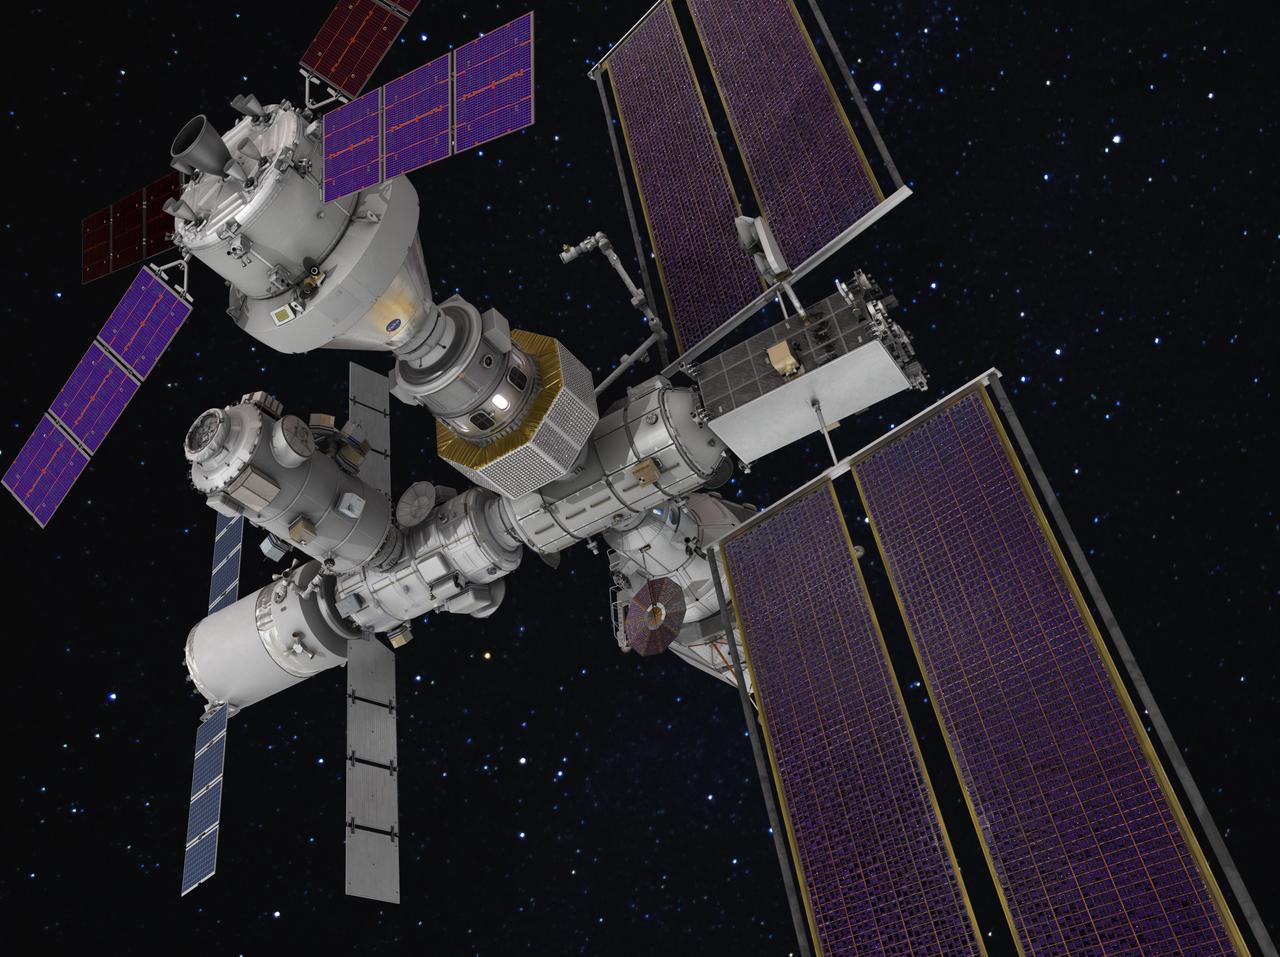
The Gateway space station will be humanity's first space station in lunar orbit as a vital component of the Artemis missions to return humans to the Moon for scientific discovery and chart a path for humans to Mars.
The Gateway space station will be humanity's first space station in lunar orbit as a vital component of the Artemis missions to return humans to the Moon for scientific discovery and chart a path for humans to Mars.
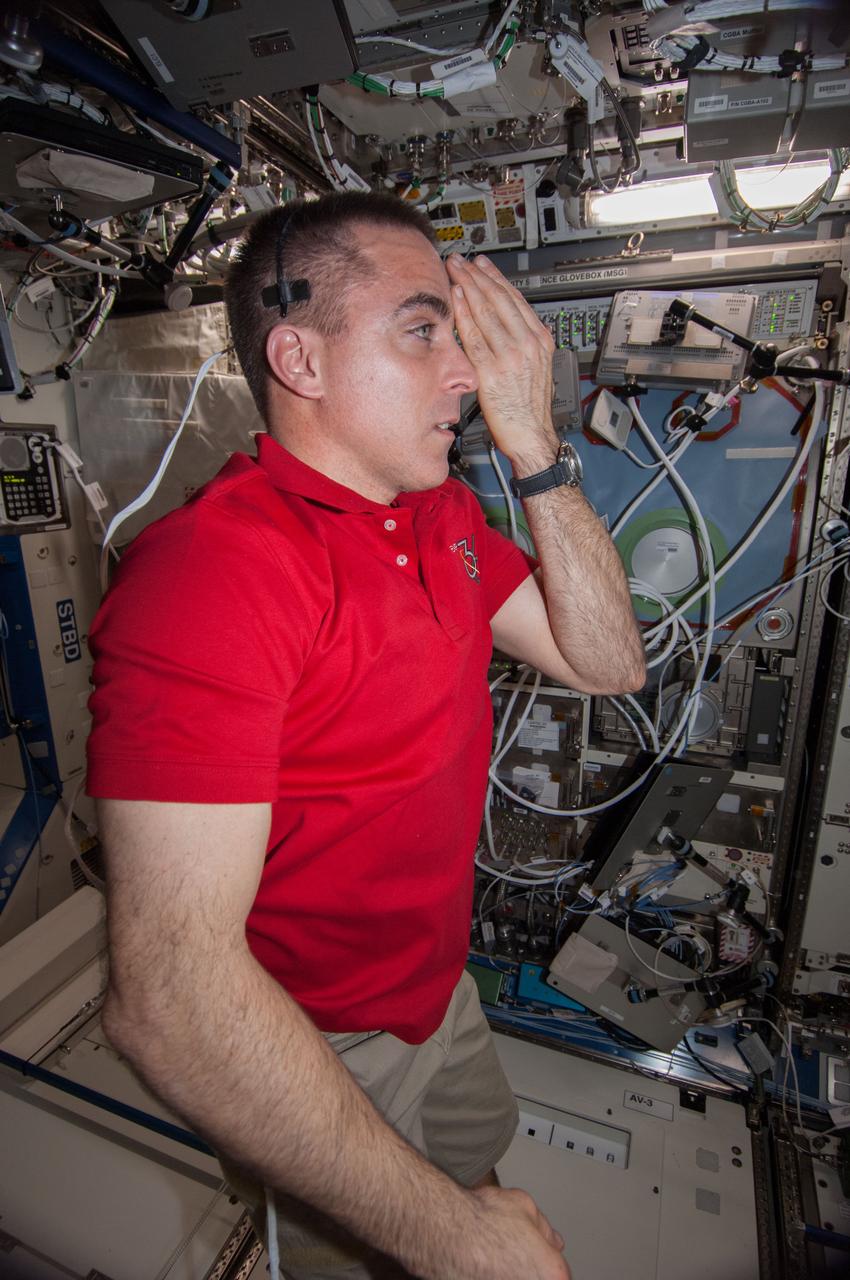
ISS036-E-018265 (11 July 2013) --- NASA astronaut Chris Cassidy, Expedition 36 flight engineer, performs a visual exam using an eye chart (out of frame) in the Destiny laboratory of the International Space Station.

ISS028-E-046356 (13 Sept. 2011) --- Japan Aerospace Exploration Agency astronaut Satoshi Furukawa, Expedition 28 flight engineer, holds an eye chart in the Destiny laboratory of the International Space Station.
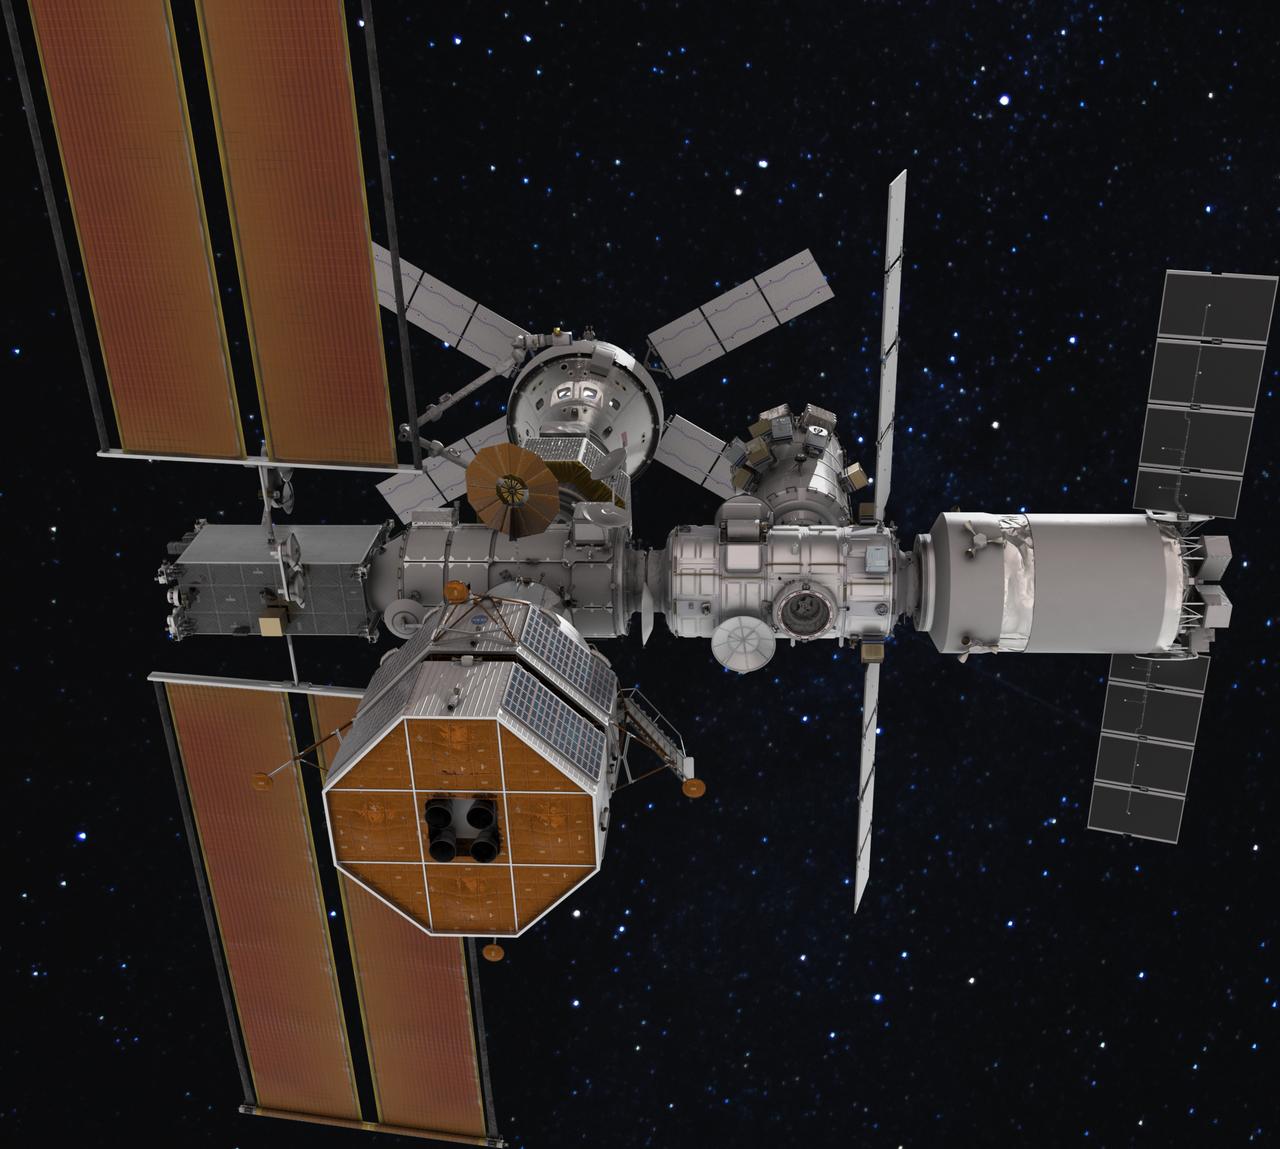
The Gateway space station will be humanity's first space station in lunar orbit as a vital component of the Artemis missions to return humans to the Moon for scientific discovery and chart a path for humans to Mars.

The Gateway space station will be humanity's first space station in lunar orbit as a vital component of the Artemis missions to return humans to the Moon for scientific discovery and chart a path for humans to Mars.
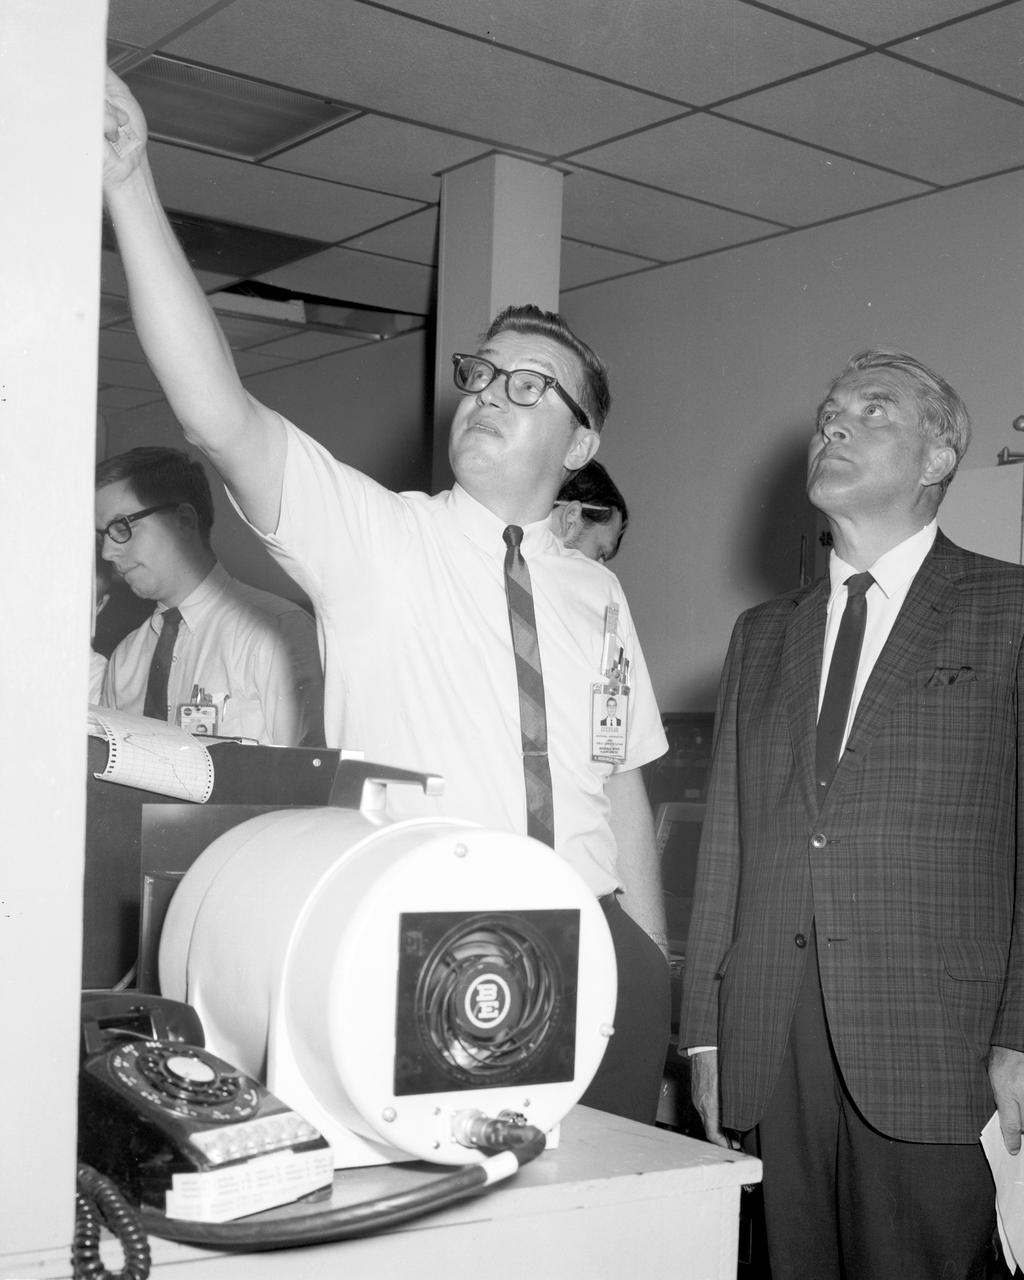
Charles Cochran charts the progress of a test being conducted in Marshall Space Flight Center’s (MSFC) Space Sciences Laboratory for center director, Dr. Wernher von Braun.
The Gateway space station will be humanity's first space station in lunar orbit as a vital component of the Artemis missions to return humans to the Moon for scientific discovery and chart a path for humans to Mars.
The Gateway space station will be humanity's first space station in lunar orbit as a vital component of the Artemis missions to return humans to the Moon for scientific discovery and chart a path for humans to Mars.
The Gateway space station will be humanity's first space station in lunar orbit as a vital component of the Artemis missions to return humans to the Moon for scientific discovery and chart a path for humans to Mars.
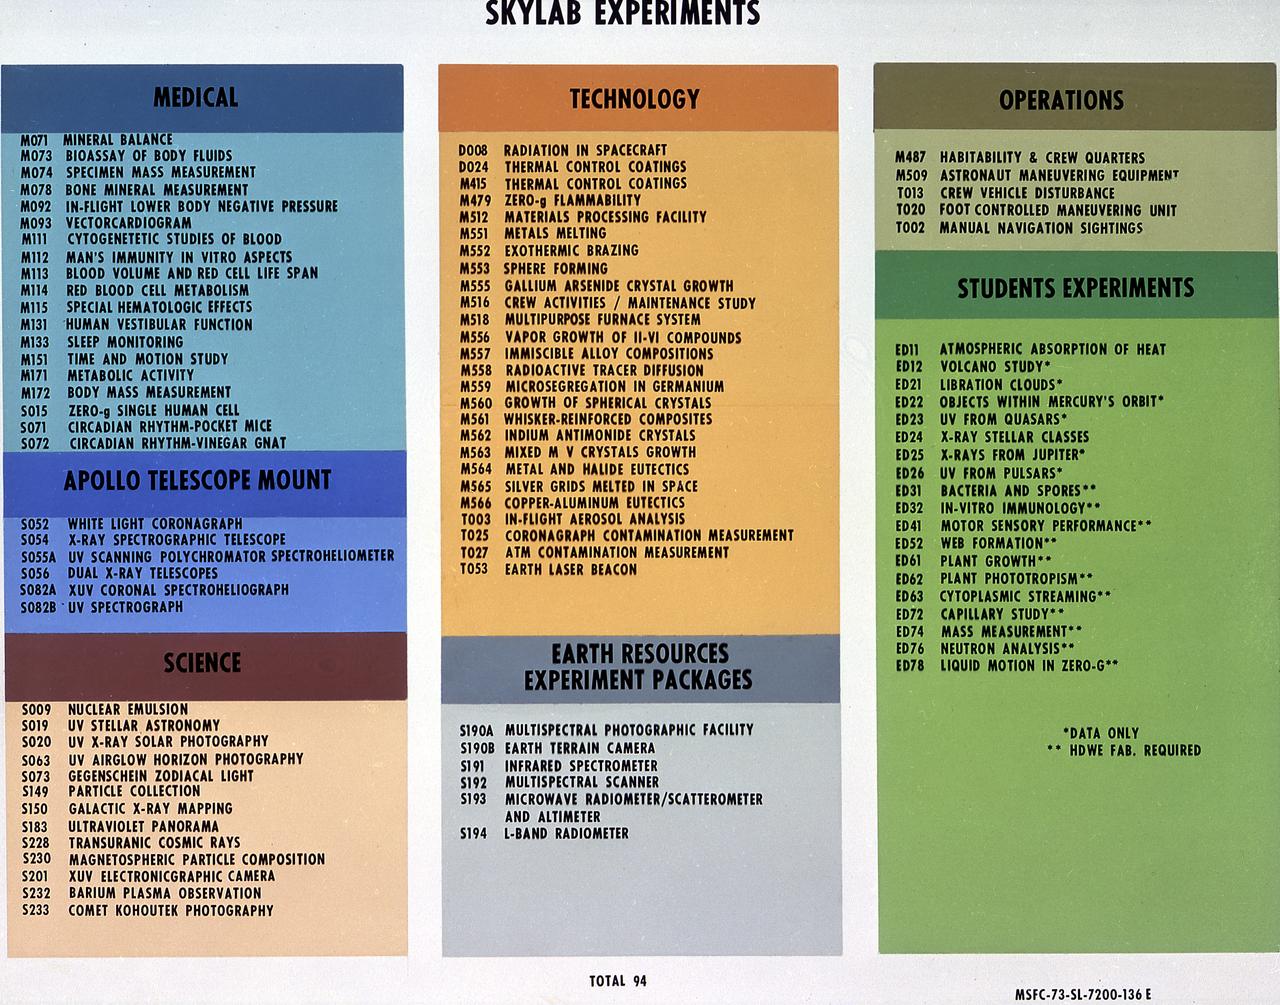
This chart lists the various experiments that flew on Skylab, along with their assigned numerical designations. The Marshall Space Flight Center had program management responsibility for the development of Skylab hardware and experiments.

ISS036-E-018262 (11 July 2013) --- NASA astronaut Chris Cassidy, Expedition 36 flight engineer, performs a visual exam using an eye chart (out of frame) in the Destiny laboratory of the International Space Station.
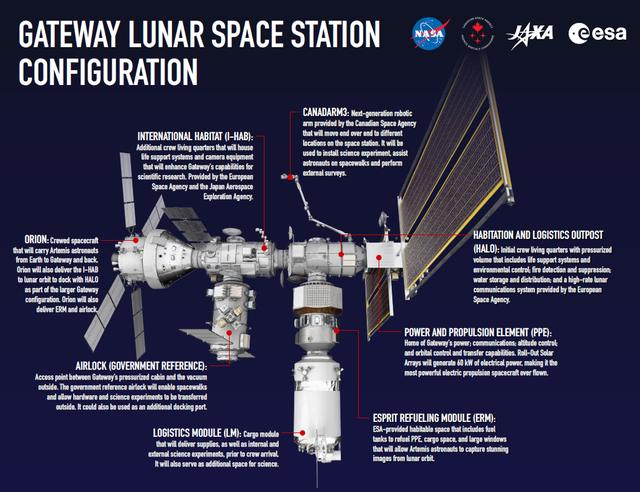
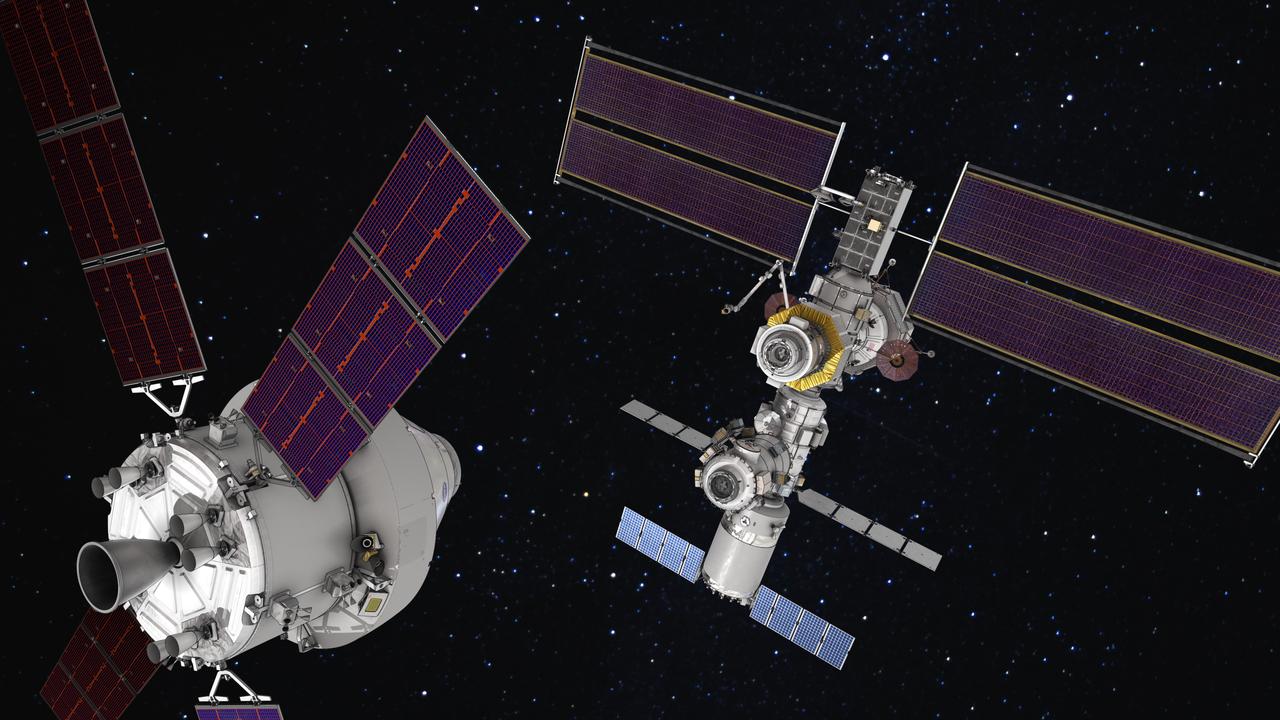
This infographic shows each element of Gateway, humanity's first space station in lunar orbit as a vital component of the Artemis missions to return to the Moon for scientific discovery and chart the path for the first human missions to Mars.
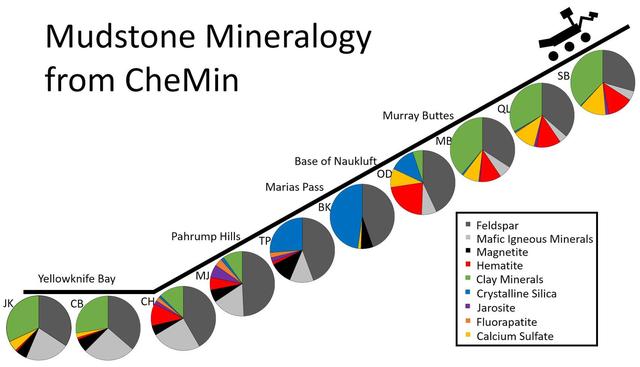
This series of pie charts shows similarities and differences in the mineral compositions of mudstones at 10 sites where NASA's Curiosity Mars rover collected rock-powder samples and analyzed them with the rover's Chemistry and Mineralogy (CheMin) instrument. The charts are arrayed in chronological order, with an indication of relative elevation as the rover first sampled two sites on the floor of Gale Crater in 2013 and later began climbing the crater's central mound, Mount Sharp. The pie chart farthest to the right and uphill shows composition at the "Sebina" target, sampled in October 2016. Five non-mudstone rock targets that the rover drilled and analyzed within this time frame are not included. The mineralogical variations in these mudstones may be due to differences in any or all of these factors: the source materials deposited by water that entered lakes, the processes of sedimentation and rock forming, and how the rocks were later altered. One trend that stands out is that the mineral jarosite -- shown in purple -- was more prominent in the "Pahrump Hills" area of lower Mount Sharp than at sites examined either earlier or later. Jarosite is an indicator of acidic water. Mudstone layers uphill from Pahrump Hills have barely detectable amounts of jarosite, indicating a shift away from acidic conditions in these overlying -- thus younger -- layers. Clay minerals, shown as green, declined in abundance at sites midway through this series, then came back as the rover climbed higher. Each drilled-and-analyzed target is identified with a two-letter abbreviation: JK for "John Klein," CB for "Cumberland." CH for "Confidence Hills," MJ for "Mojave," TP for "Telegraph Peak," BK for "Buckskin," OD for "Oudam," MB for "Marimba," QL for "Quela," and SB for Sebina. http://photojournal.jpl.nasa.gov/catalog/PIA21146
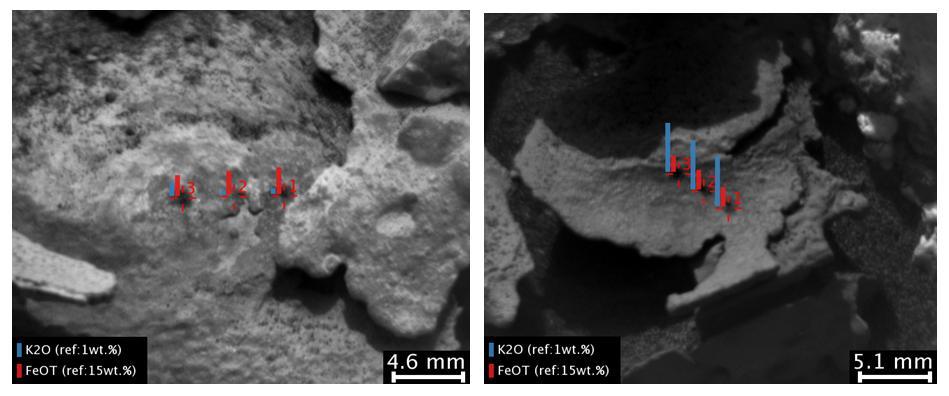
These images and overlay bar charts from the Chemistry and Camera (ChemCam) instrument on NASA's Curiosity Mars rover indicate where some high-potassium material is localized within mineral veins at "Garden City." The two images are from ChemCam's Remote Micro-Imager. Each covers an area just over an inch wide (scale bars are in millimeters) in veins at the Garden City site on lower Mount Sharp. The overlay charts show comparisons of potassium (blue) and iron (red) in the mineral veins' compositions determined by reading the spectra of light induced by zapping points in each area with ChemCam's laser. Mineral veins such as these form where fluids move through fractured rocks, depositing minerals in the fractures and affecting chemistry of the surrounding rock. The thin layer of dark fracture-filling material in the image on the right contains much more potassium than the other local material on the left, indicating either different fluid compositions or local variations in the rock. The image on the left was taken on April 4, 2015, during the 946th Martian day, or sol, of Curiosity's work on Mars. The image on the right was taken on Sol 936, on March 25, 2015. A broader view of the prominent mineral veins at Garden City is at PIA19161. http://photojournal.jpl.nasa.gov/catalog/PIA19923
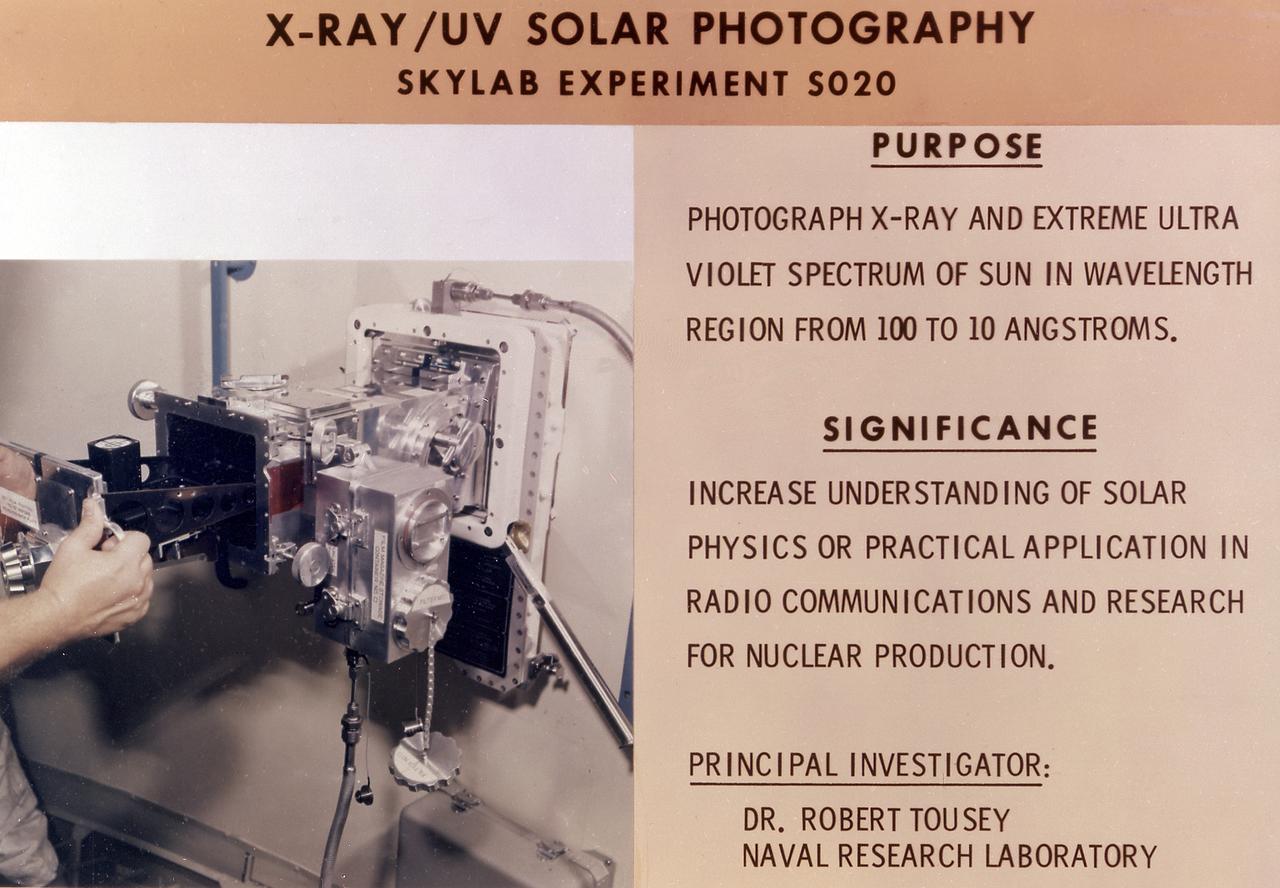
This chart details Skylab's Ultraviolet (UV) X-Ray Solar Photography experiment (S020) in an Apollo Telescope Mount facility. It was designed to photograph normal and explosive areas within the solar atmosphere in the UV and x-ray spectra. The Marshall Space Flight Center had program management responsibility for the development of Skylab hardware and experiments.
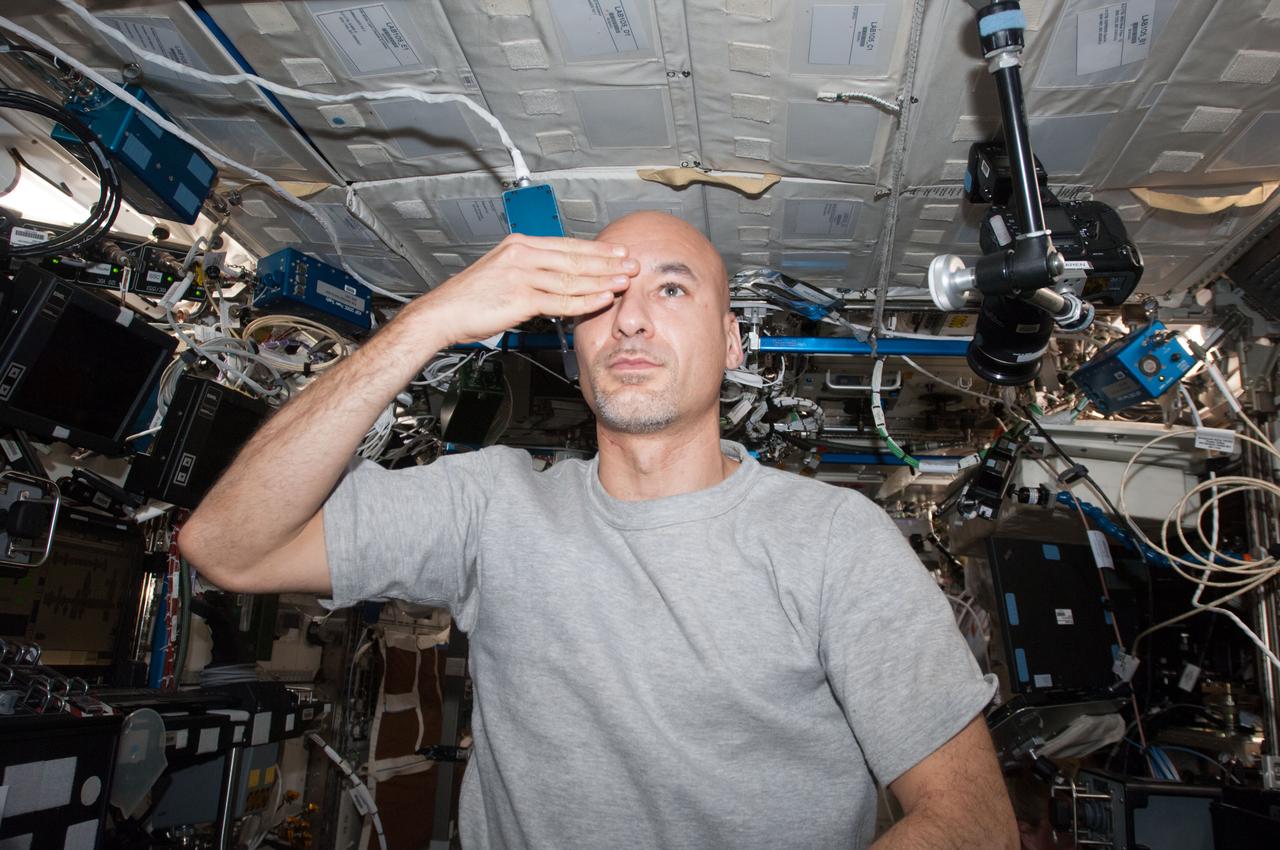
ISS036-E-010398 (24 June 2013) --- European Space Agency astronaut Luca Parmitano, Expedition 36 flight engineer, performs a visual exam using an eye chart (out of frame) in the Destiny laboratory of the International Space Station.
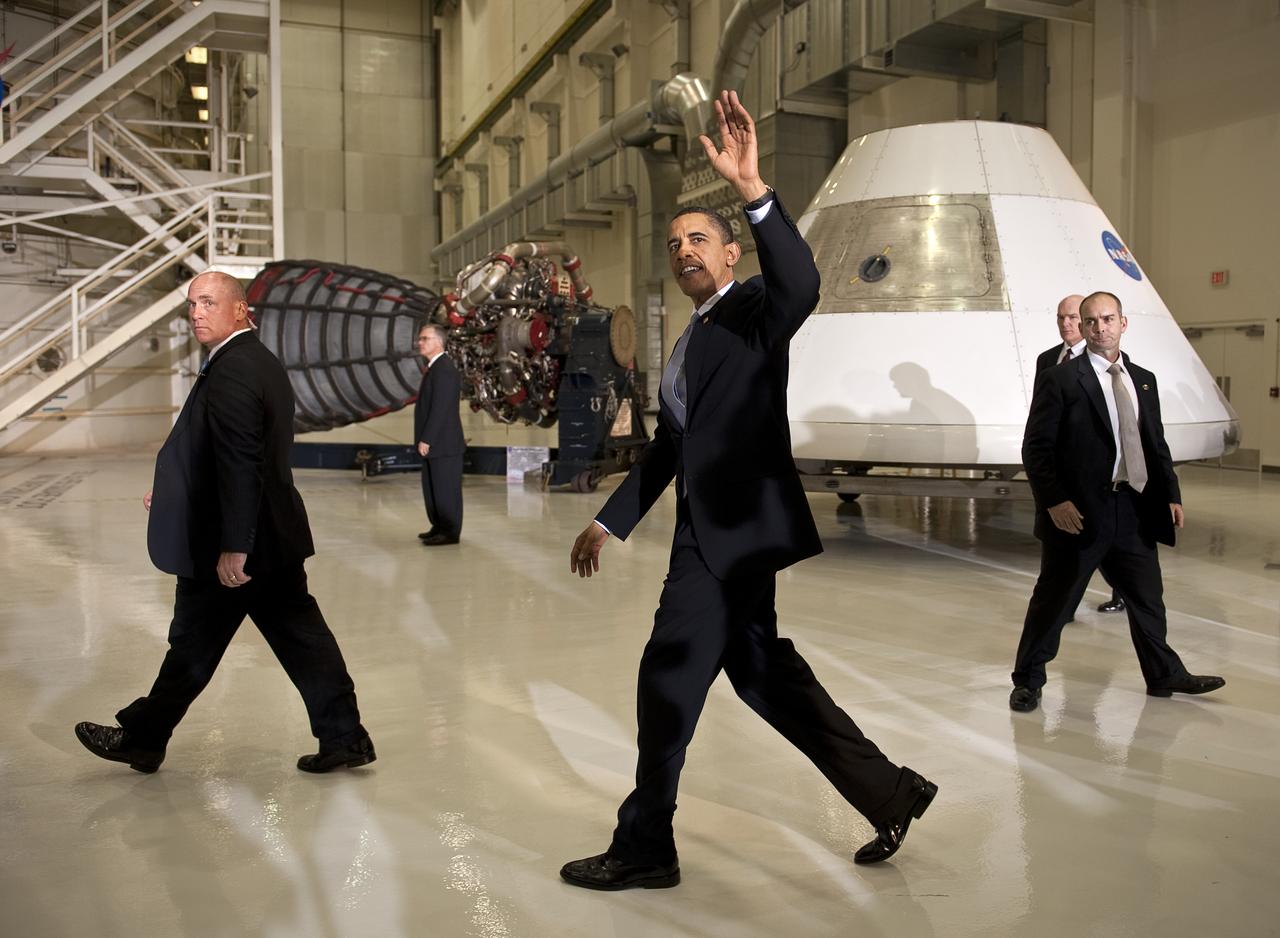
President Barack Obama waves farewell after speaking at the NASA Kennedy Space Center in Cape Canaveral, Fla. on Thursday, April 15, 2010. Obama visited Kennedy to deliver remarks on the bold new course the administration is charting to maintain U.S. leadership in human space flight. Photo Credit: (NASA/Bill Ingalls)
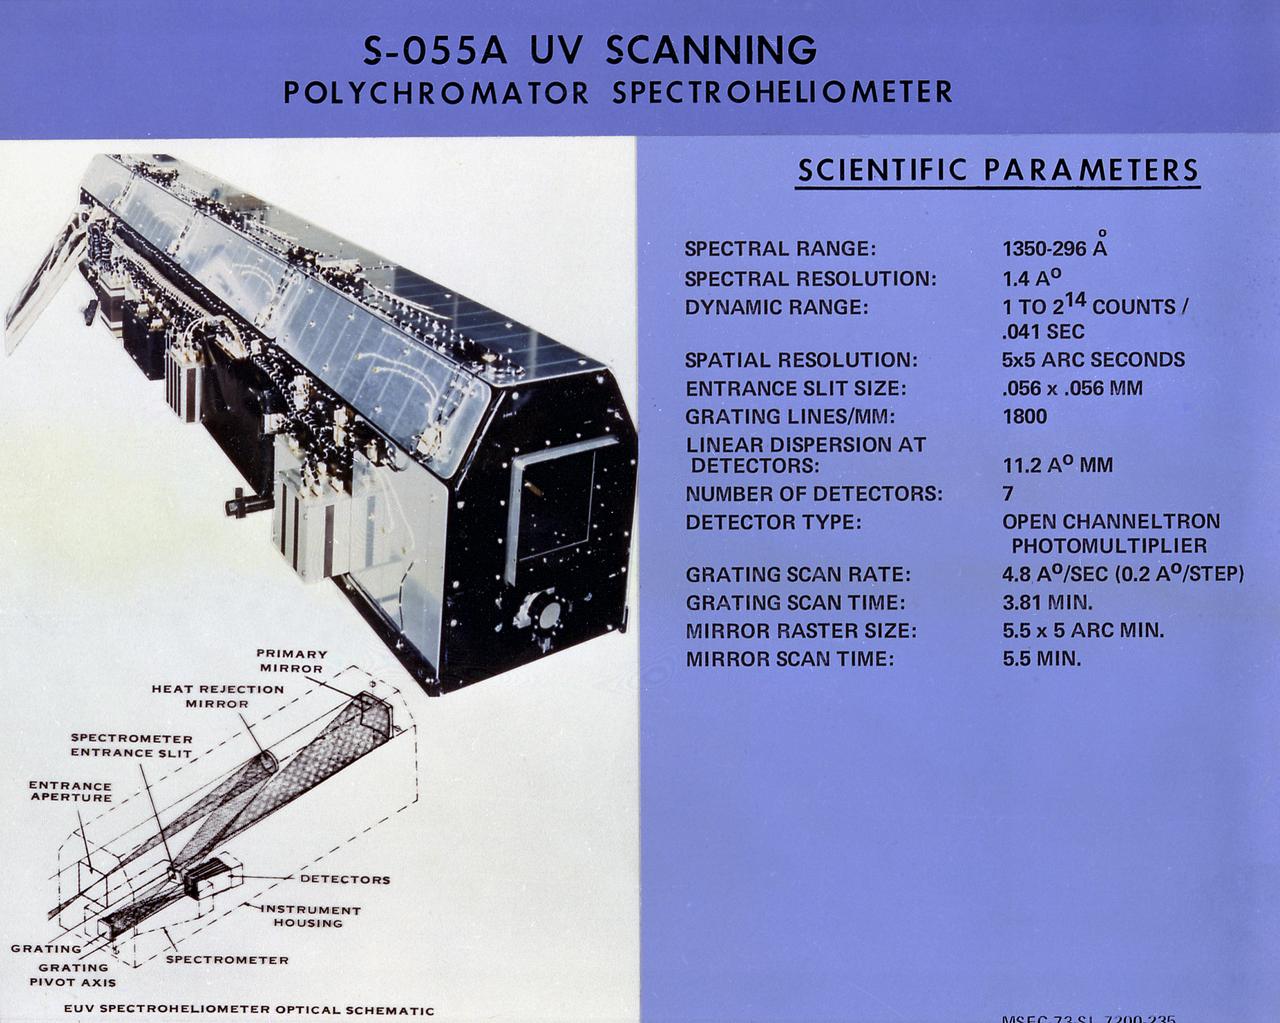
This chart describes scientific parameters of the Skylab Ultraviolet (UV) Scanning Polychromator Spectroheliometer, one the eight Apollo Telescope Mount facilities. It was designed to observe and provide temporal changes in UV radiation emitted by the Sun's chromosphere and lower corona. The Marshall Space Flight Center had program management responsibility for the development of skylab hardware and experiments.

This chart details Skylab's X-Ray Spectrographic Telescope, an Apollo Telescope Mount facility. It was designed to sequentially photograph solar flares and other active regions in the x-ray spectrum. The Marshall Flight Center had program management responsibility for the development of Skylab hardware and experiments.
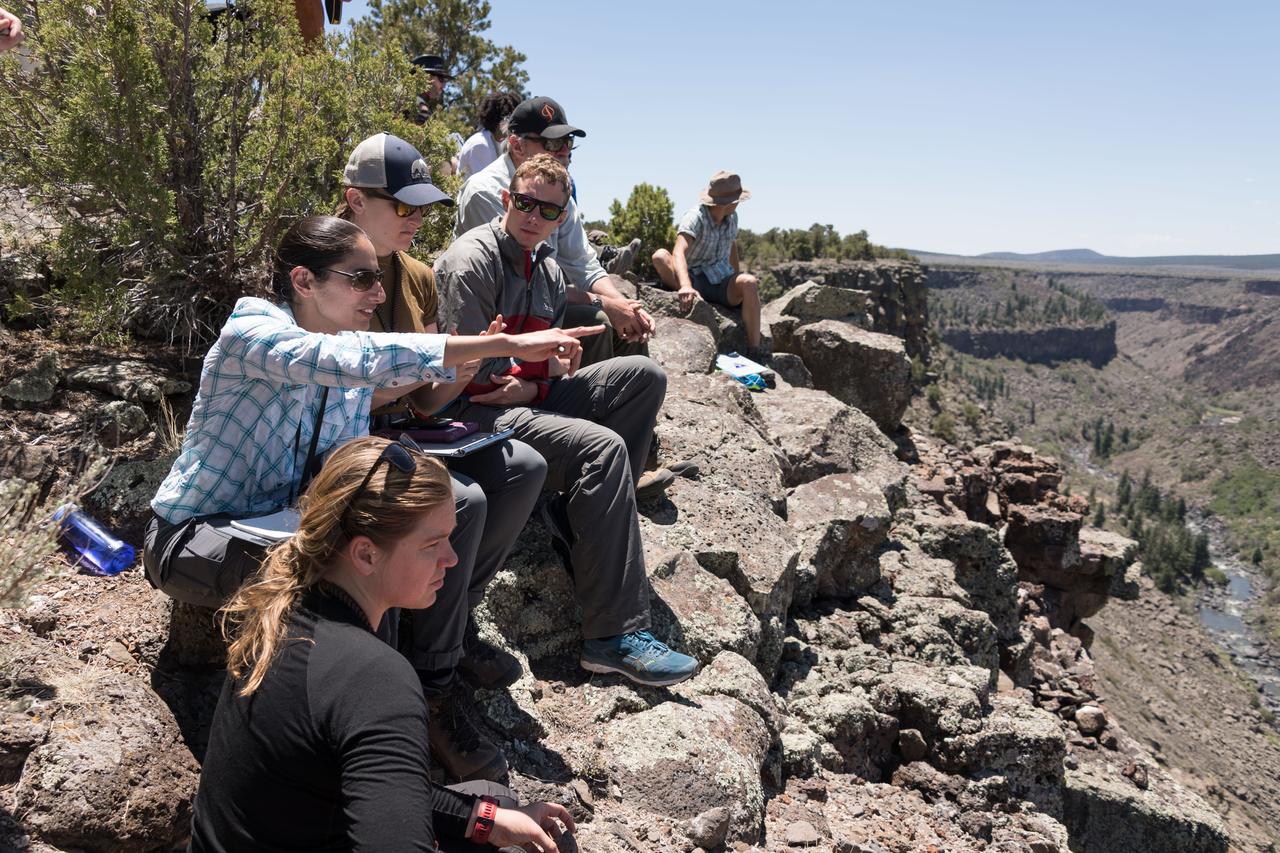
jsc2018e060096 (06/18/2018) --- 2017 NASA astronaut candidates gather together to chart their next location during earth and planetary science training in Rio Grande del Norte National Monument Upper Gorge Area near Questa, N.M. Photo Credit: NASA/Norah Moran
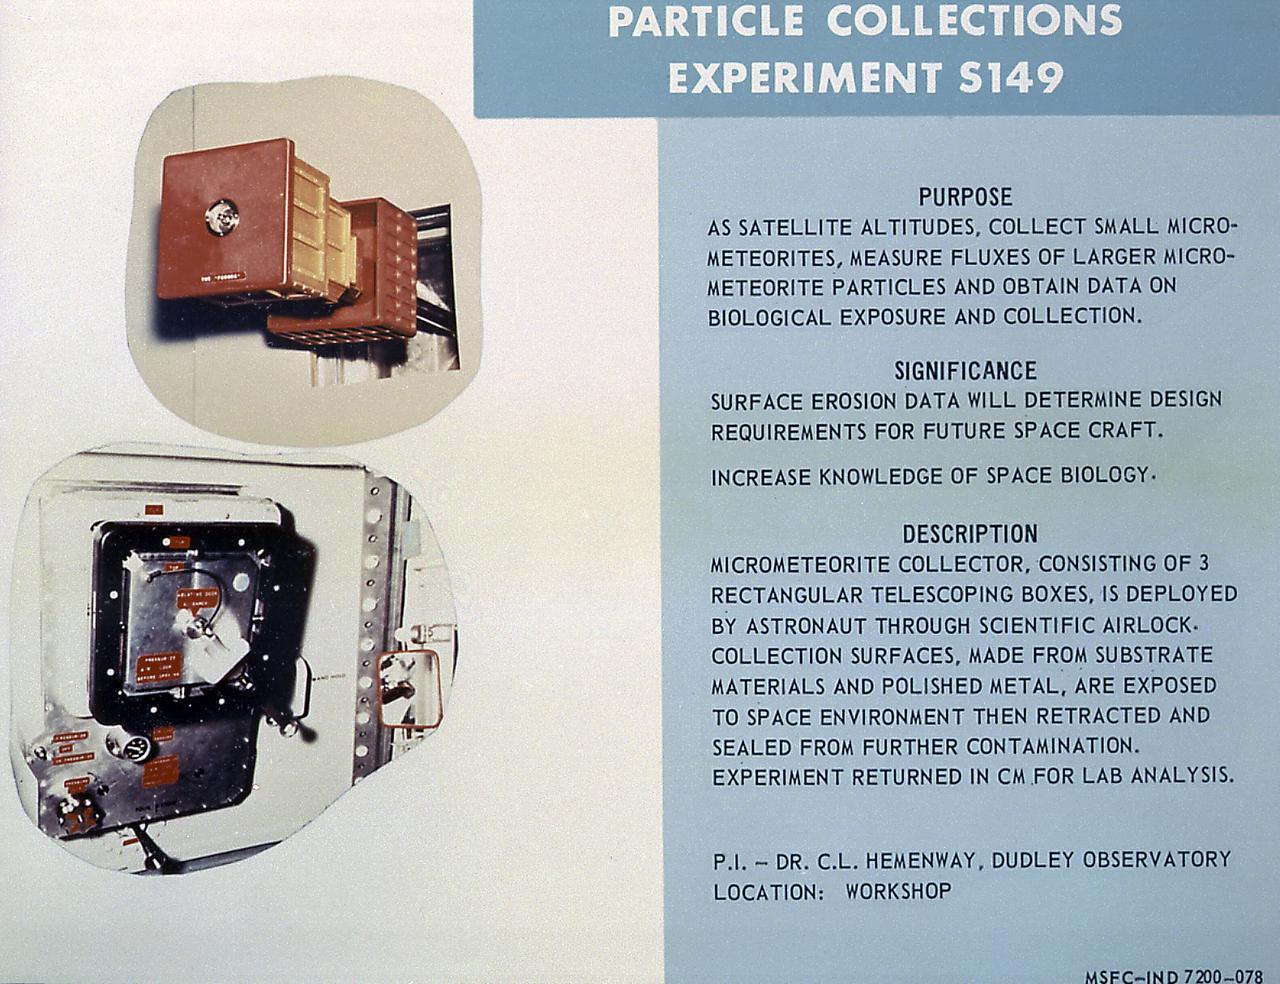
This chart describes Skylab's Particle Collection device, a scientific experiment designed to study micro-meteoroid particles in near-Earth space and determine their abundance, mass distribution, composition, and erosive effects. The Marshall Space Flight Center had program management responsibility for the development of Skylab hardware and experiments.

S96-13559 --- Leopold Eyharts represents France's space agency (CNES) as a member of the Mir-25 crew.
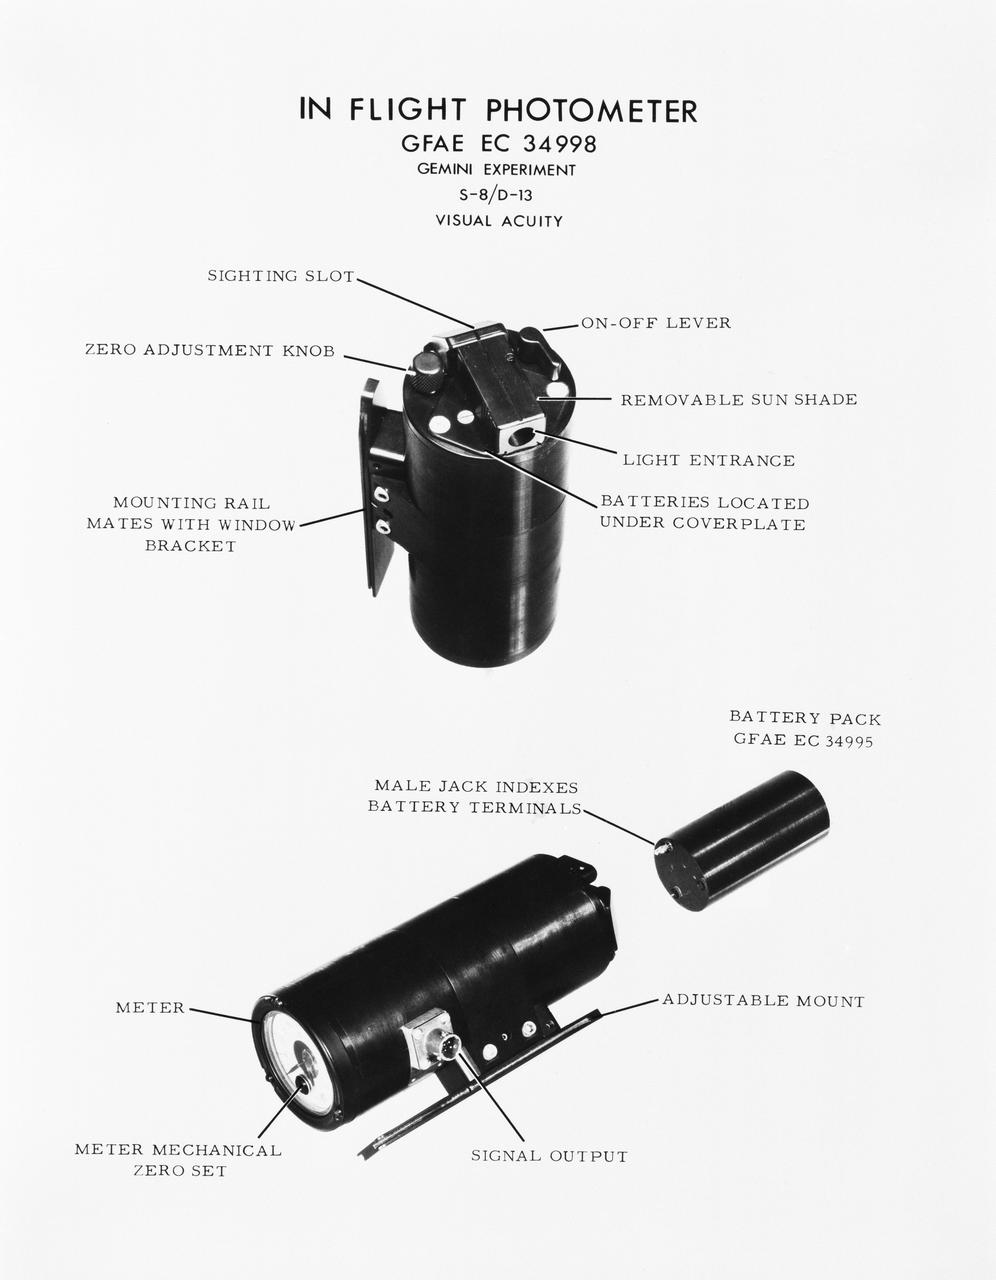
S65-28645 (June 1965) --- Photograph showing the component parts of the Gemini experiment In-flight Photometer.
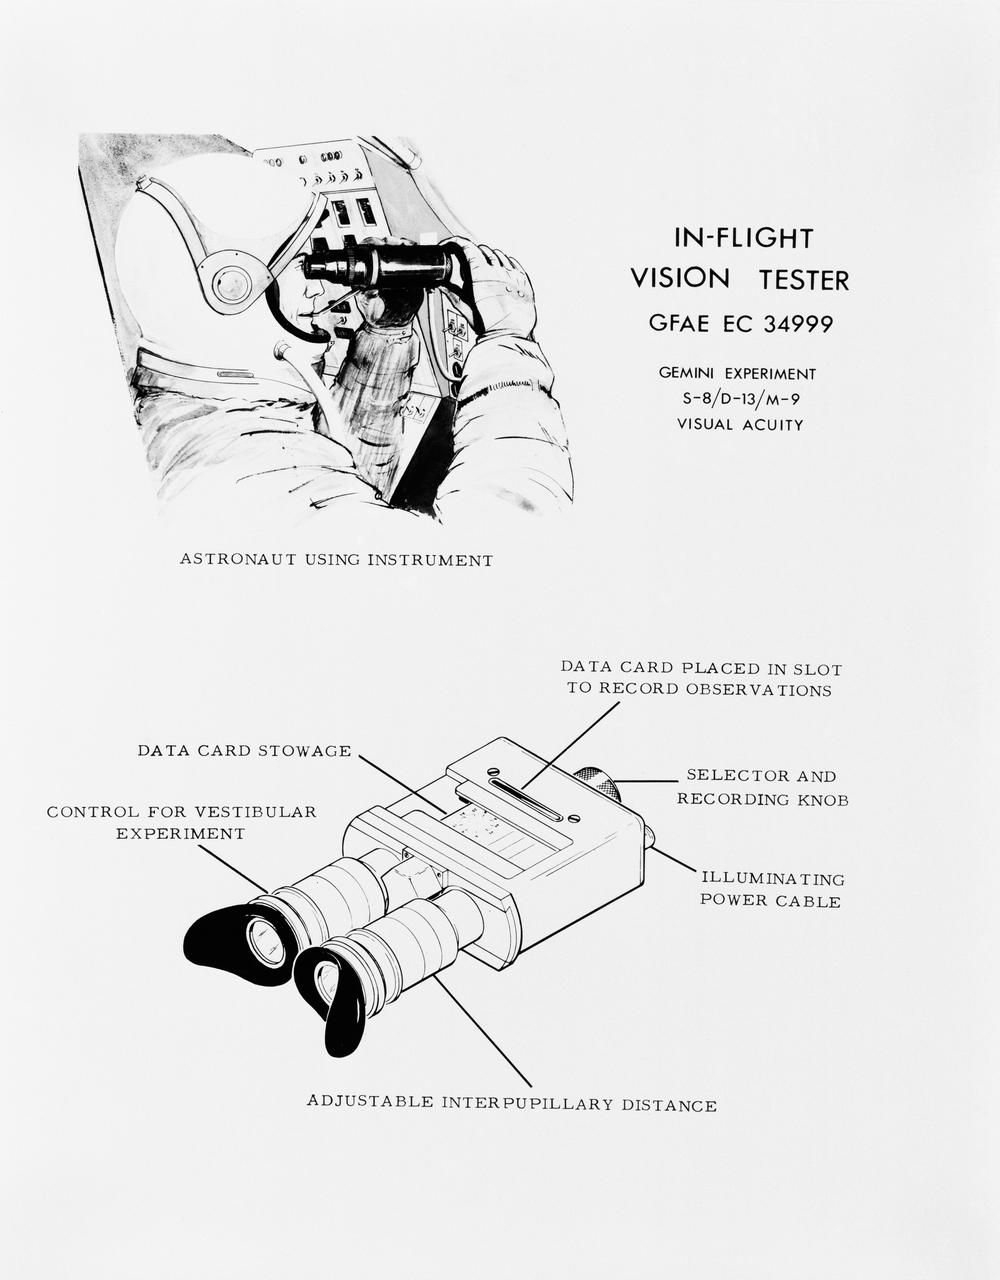
S65-28642 (June 1965) --- Drawing illustrating Gemini experiment In-Flight Vision Tester.