
Women Of Color, Cleveland Magazine, CL Magazine Feature Photo

This image of Neptune south polar region was obtained by NASA Voyager on Aug. 23, 1989. The smallest cloud features are 45 kilometers 28 miles in diameter. The image shows the discovery of shadows in Neptune atmosphere, shadows cast onto a deep cl
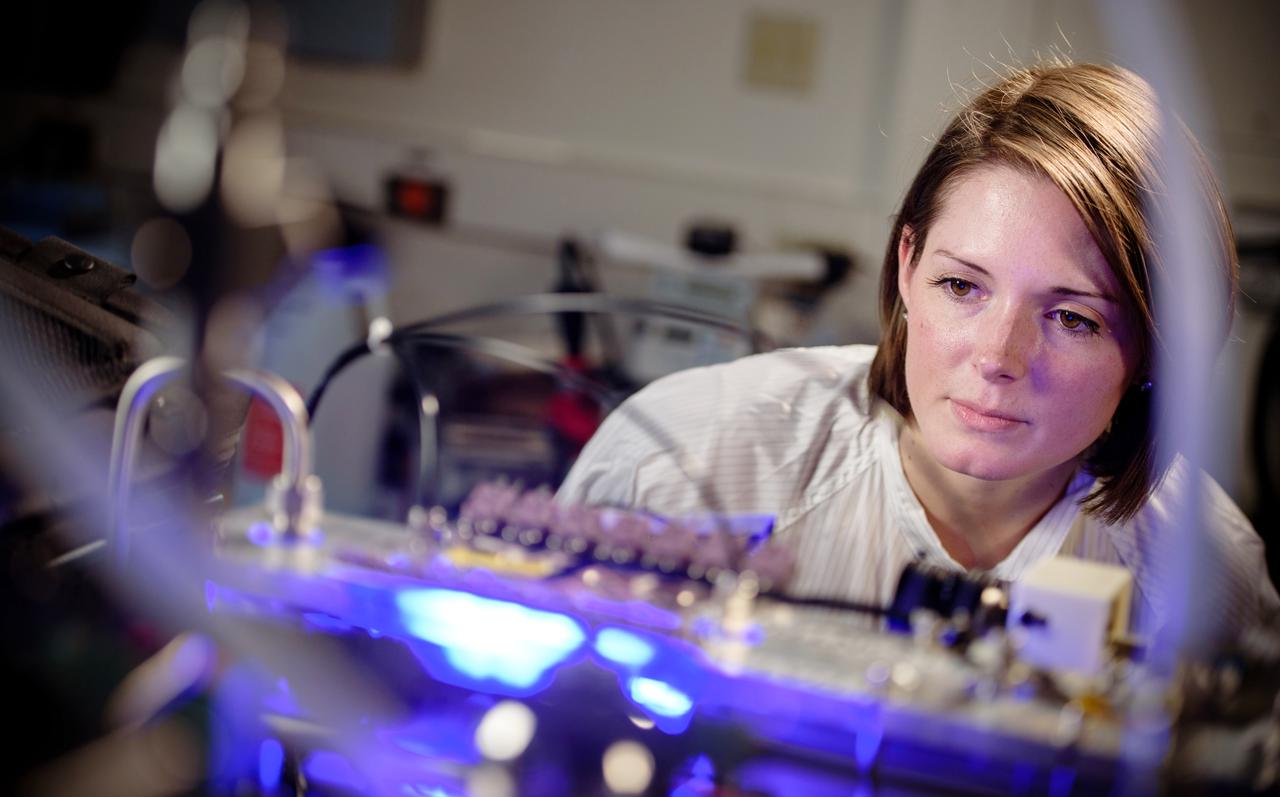
Grace Gaskin, an Aerospace Flight Systems Engineer Trainee, was sworn in as a civil servant in September 2017. After serving for 6 years in the U.S. Army she enrolled at Case Western Reserve University and will graduate in May 2018 with a degree in Chemical Engineering. As a Pathways Intern one of the many projects she has worked on is the Flow Boiling and Condensation Experiments (FBCE). The proposed research aims to develop an integrated two-phase flow boiling/condensation facility for the International Space Station (ISS) to serve as a primary platform for obtaining two-phase flow and heat transfer data in microgravity. By comparing the microgravity data against those obtained in Earth's gravity, it will be possible to ascertain the influence of body force on two-phase transport phenomena in pursuit of mechanistic models as well as correlations, and to help determine the minimum flow criteria to ensure gravity independent flow boiling and condensation.
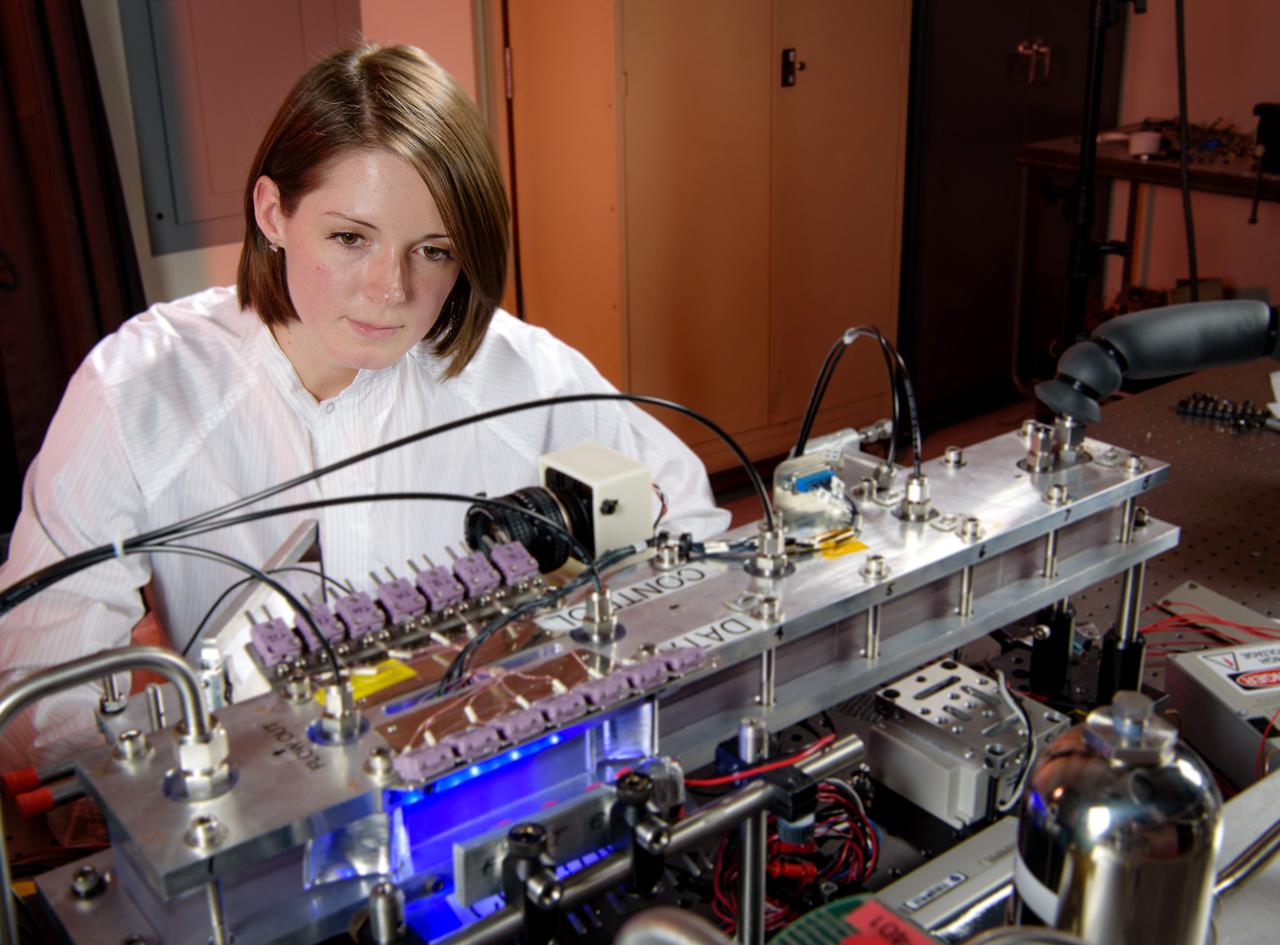
Grace Gaskin, an Aerospace Flight Systems Engineer Trainee, was sworn in as a civil servant in September 2017. After serving for 6 years in the U.S. Army she enrolled at Case Western Reserve University and will graduate in May 2018 with a degree in Chemical Engineering. As a Pathways Intern one of the many projects she has worked on is the Flow Boiling and Condensation Experiments (FBCE). The proposed research aims to develop an integrated two-phase flow boiling/condensation facility for the International Space Station (ISS) to serve as a primary platform for obtaining two-phase flow and heat transfer data in microgravity. By comparing the microgravity data against those obtained in Earth's gravity, it will be possible to ascertain the influence of body force on two-phase transport phenomena in pursuit of mechanistic models as well as correlations, and to help determine the minimum flow criteria to ensure gravity independent flow boiling and condensation.
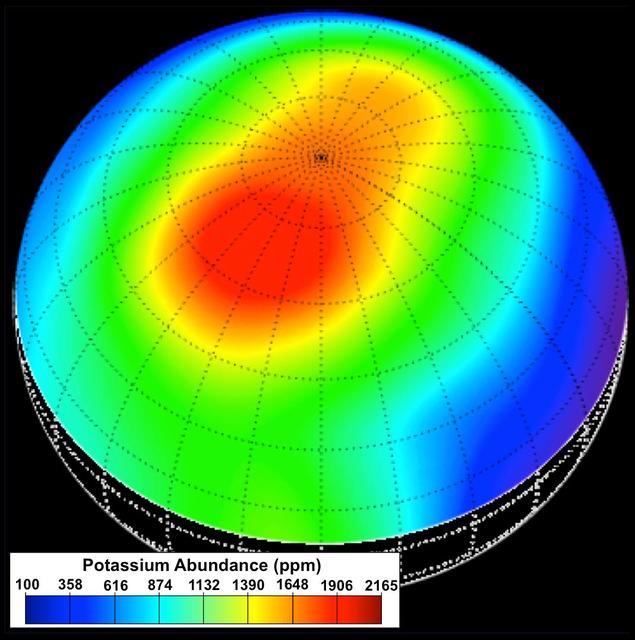
During the first year of NASA MESSENGER orbital mission, the spacecraft GRS instrument measured the elemental composition of Mercury surface materials. mong the most important discoveries from the GRS was the observation of higher abundances of the moderately volatile elements potassium, sodium, and chlorine than expected from previous scientific models and theories. Particularly high concentrations of these elements were observed at high northern latitudes, as illustrated in this potassium abundance map, which provides a view of the surface centered at 60° N latitude and 120° E longitude. This map was the first elemental map ever made of Mercury's surface and is to-date the only map to report absolute elemental concentrations, in comparison to element ratios. Prior to MESSENGER's arrival at Mercury, scientists expected that the planet would be depleted in moderately volatile elements, as is the case for our Moon. The unexpectedly high abundances observed with the GRS have forced a reevaluation of our understanding of the formation and evolution of Mercury. In addition, the K map provided the first evidence for distinct geochemical terranes on Mercury, as the high-potassium region was later found to also be distinct in its low Mg/Si, Ca/Si, S/Si, and high Na/Si and Cl/Si abundances. Instrument: Gamma-Ray Spectrometer (GRS) http://photojournal.jpl.nasa.gov/catalog/PIA19414
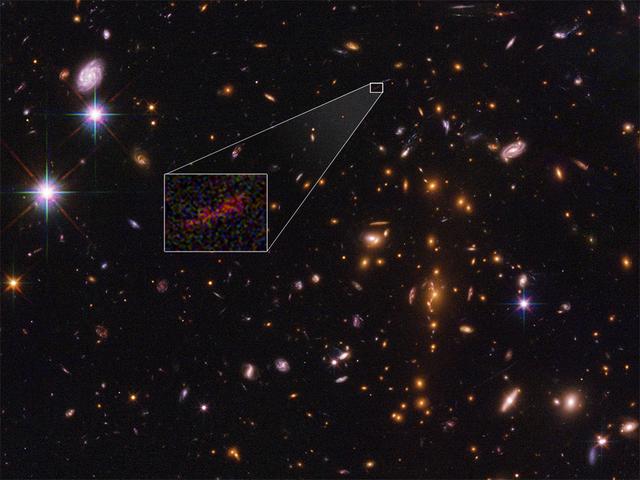
This Hubble Space Telescope image shows the farthest galaxy yet seen in an image that has been stretched and amplified by a phenomenon called gravitational lensing. The embryonic galaxy, named SPT0615-JD, existed when the universe was just 500 million years old. Though a few other primitive galaxies have been seen at this early epoch, they have essentially all looked like red dots, given their small size and tremendous distances. However, in this case, the gravitational field of a massive foreground galaxy cluster, called SPT-CL J0615-5746, not only amplified the light from the background galaxy but also smeared the image of it into an arc (about 2 arcseconds long). Image analysis shows that the galaxy weighs in at no more than 3 billion solar masses (roughly 1/100th the mass of our fully grown Milky Way galaxy). It is less than 2,500 light-years across, half the size of the Small Magellanic Cloud, a satellite galaxy of our Milky Way. The object is considered prototypical of young galaxies that emerged during the epoch shortly after the big bang. https://photojournal.jpl.nasa.gov/catalog/PIA22079
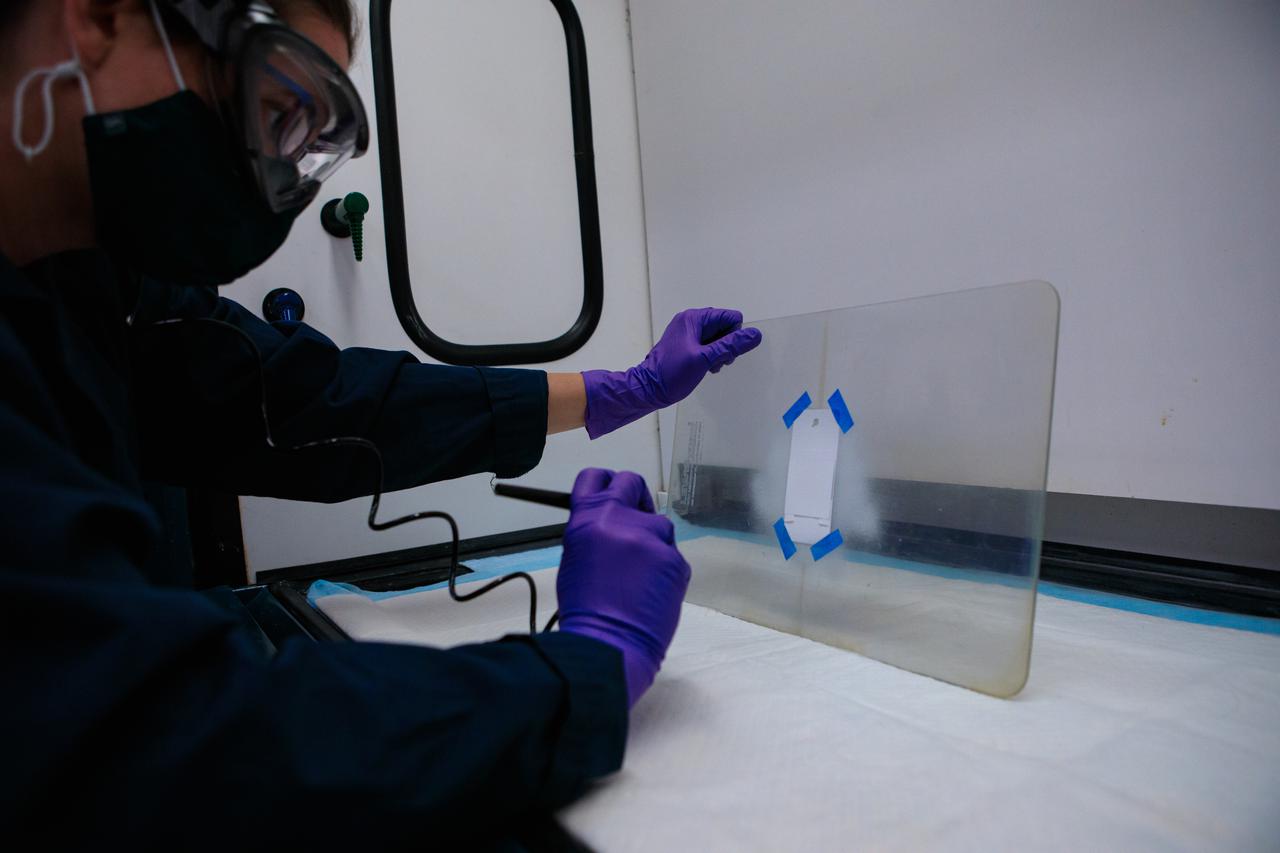
Inside a laboratory at the Neil Armstrong Operations and Checkout Building at NASA’s Kennedy Space Center in Florida, research scientist Sarah Snyder applies a selective surface coating to an Electrodynamic Dust Shield (EDS) on March 31, 2021. This is one of several concurrent activities preparing dust shield samples for testing in space. Dust mitigation technologies could one day be applied to diminish dust hazards on lunar surface systems such as cameras, solar panels, spacesuits, and instrumentation, enabling sustainable exploration of the Moon under the Artemis program.
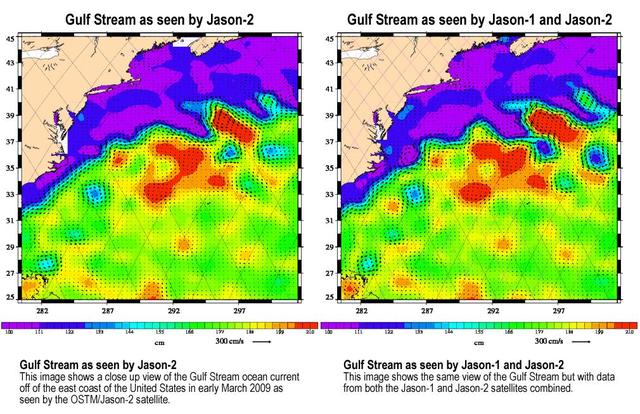
Created with altimeter data from NASA's Ocean Surface Topography Mission (OSTM)/Jason-2 satellite and the Jason-1 satellite, this image shows a portion of the Gulf Stream off the east coast of the United States. It demonstrates how much more detail is visible in the ocean surface when measured by two satellites than by one alone. The image on the left was created with data from OSTM/Jason-2. The image on the right is the same region but made with combined data from OSTM/Jason-2 and Jason-1.It shows the Gulf Stream's eddies and rings much more clearly. This image is a product of the new interleaved tandem mission of the Jason-1 and Ocean Surface Topography Mission (OSTM)/Jason-2 satellites. (The first global map from this tandem mission is available at PIA11859.) In January 2009, Jason-1 was maneuvered into orbit on the opposite side of Earth from its successor, OSTM/Jason-2 satellite. It takes 10 days for the satellites to cover the globe and return to any one place over the ocean. So, in this new tandem configuration, Jason-1 flies over the same region of the ocean that OSTM/Jason-2 flew over five days earlier. Its ground tracks fall mid-way between those of Jason-2, which are about 315 kilometers (195 miles) apart at the equator. Working together, the two spacecraft measure the surface topography of the ocean twice as often as would be possible with one satellite, and over a 10-day period, they return twice the amount of detailed measurements. Combining data from the two satellites makes it possible to map smaller, more rapidly changing features than one satellite could alone. These images show sea-level anomaly data from the first 14 days of the interleaved orbit of Jason-1 and OSTM/Jason-2, the period beginning on Feb. 20, 2009. An anomaly is a departure from a value averaged over a long period of time. Red and yellow are regions where sea levels are higher than normal. Purple and dark blue show where sea levels are lower. A higher-than-normal sea surface is usually a sign of warm waters below, while lower sea levels indicate cooler than normal temperatures. http://photojournal.jpl.nasa.gov/catalog/PIA11997
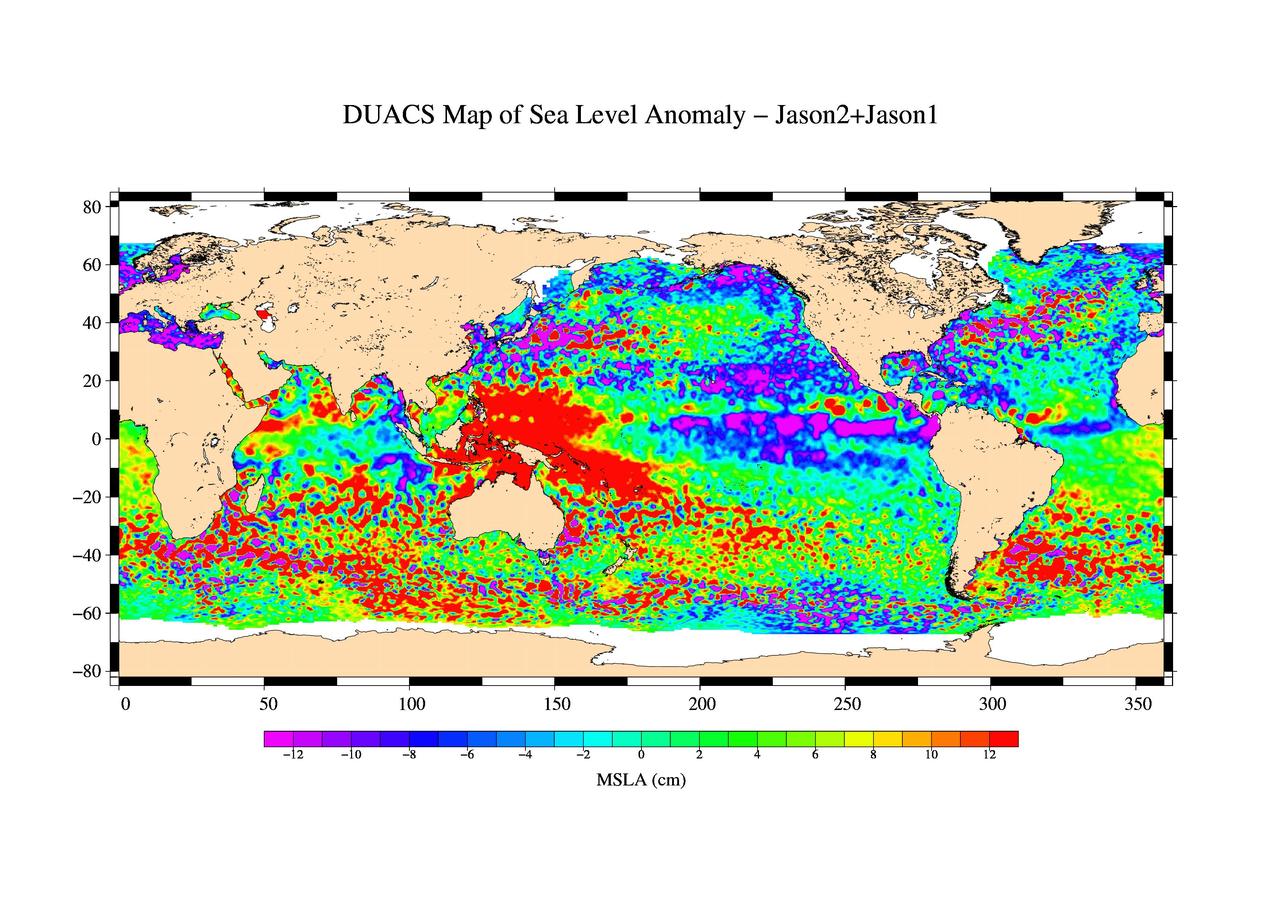
This is the first global map of ocean surface topography produced with data from the new interleaved tandem mission of NASA Jason-1 and Ocean Surface Topography Mission OSTM/Jason-2 satellites.