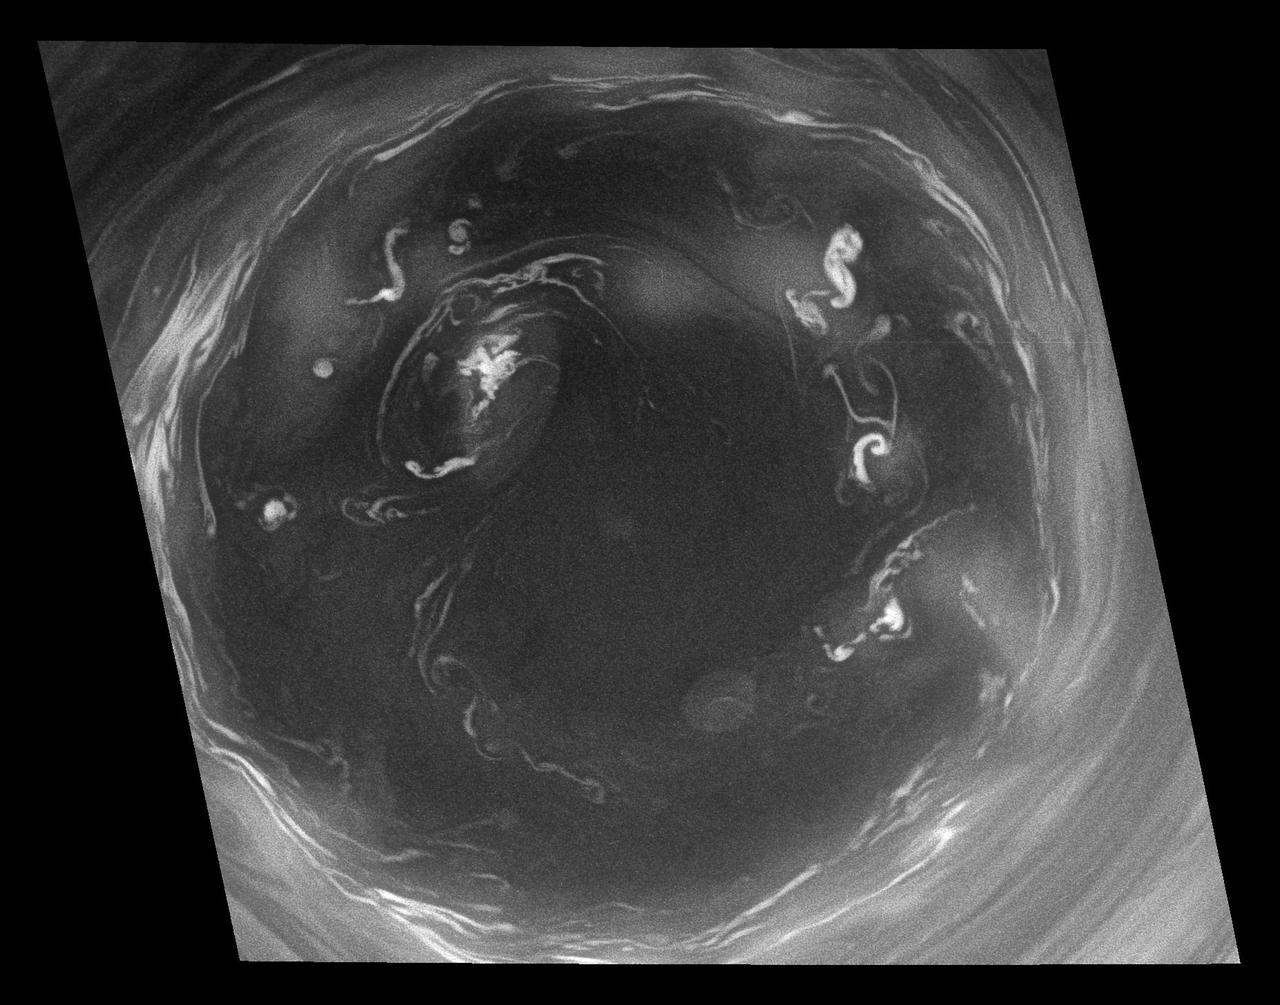
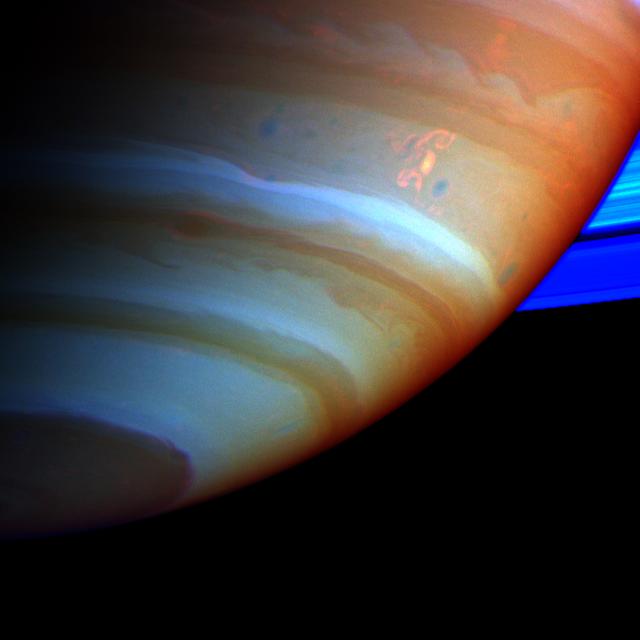
Convection in Saturn Southern Vortex
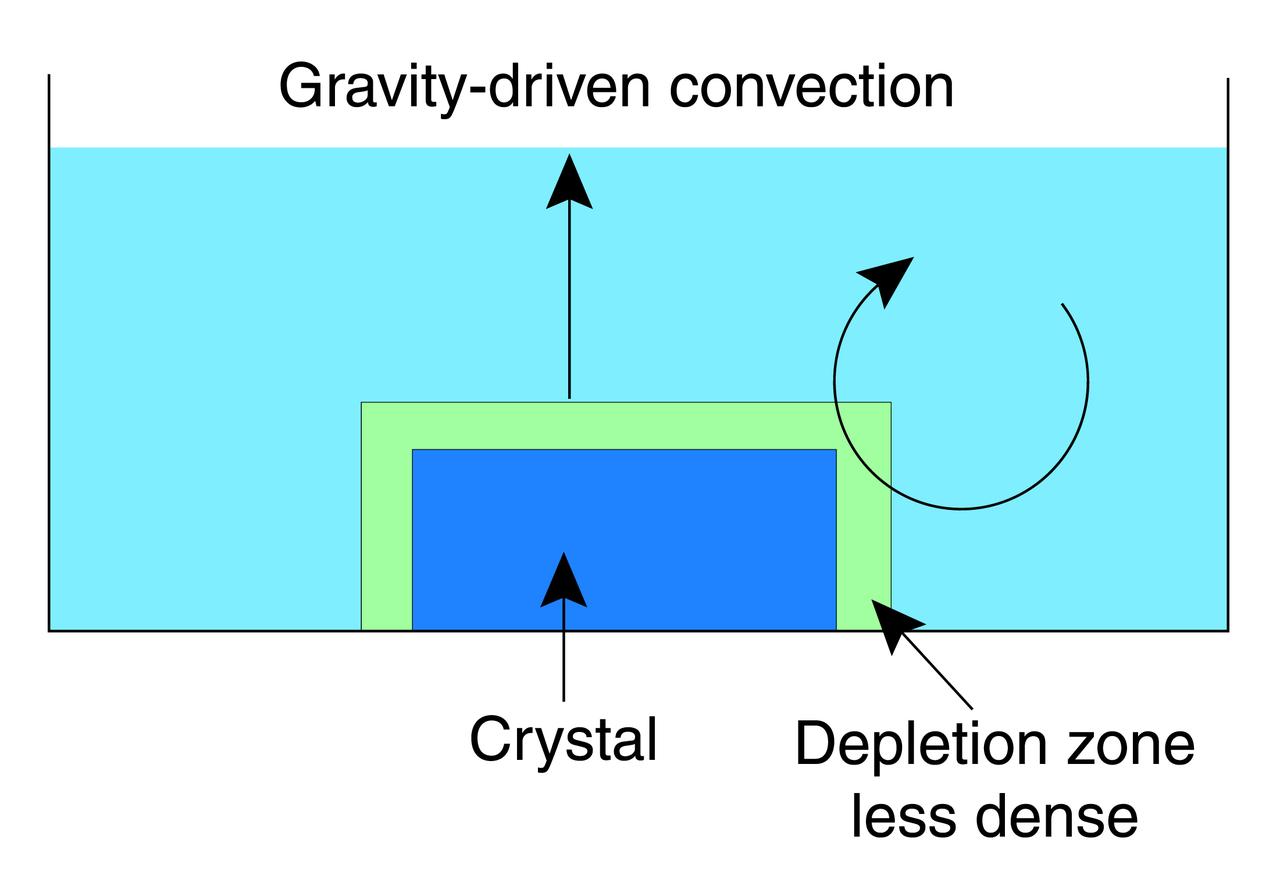
Gravity or density-driven convection occurs as protein molecules incorporate into a crystal lattice from the surrounding solution. The layer bordering the crystal (the depletion zone) then contains a less-dense protein concentration, causing the layer to rise. The remaining, denser solution sinks because of gravity, creating eddies that make it difficult for more protein molecules to attach to the crystal in an ordered way.
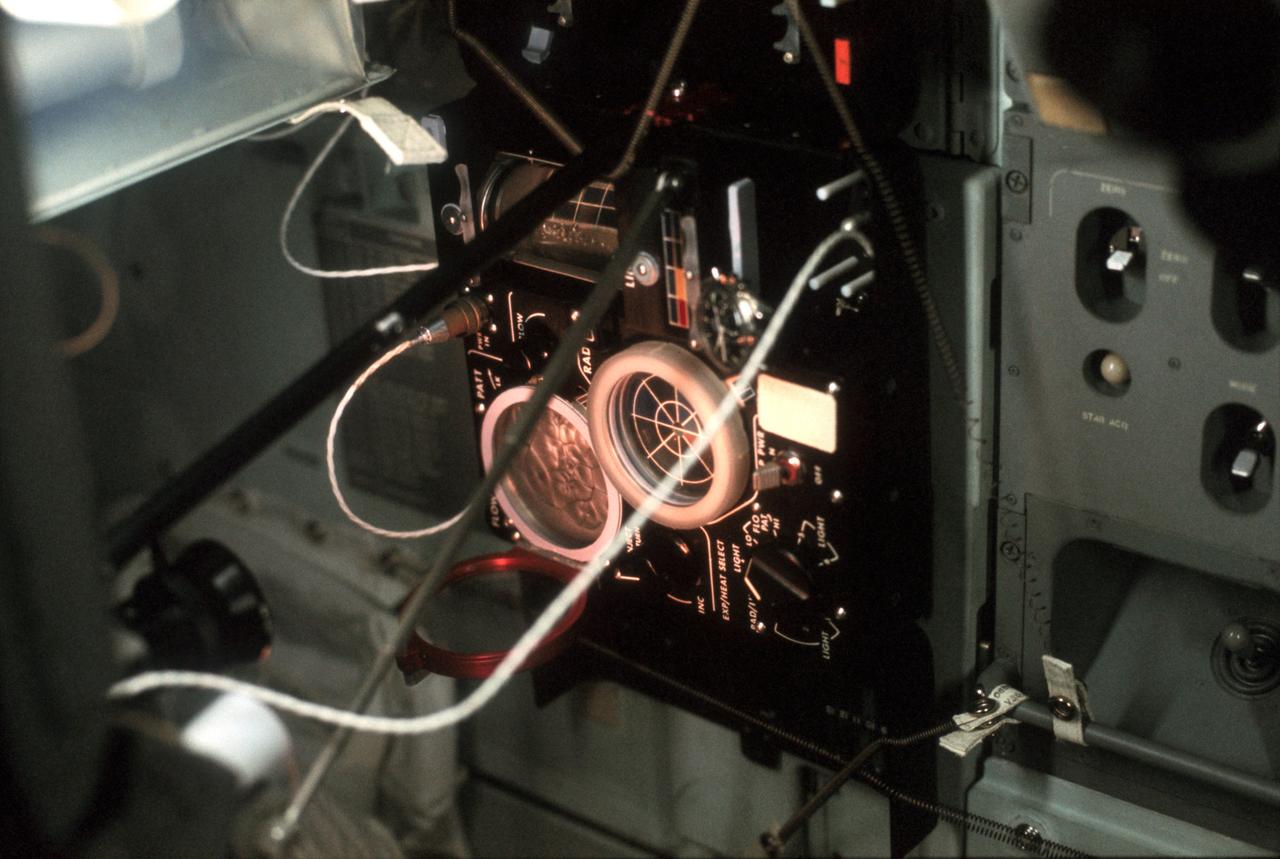
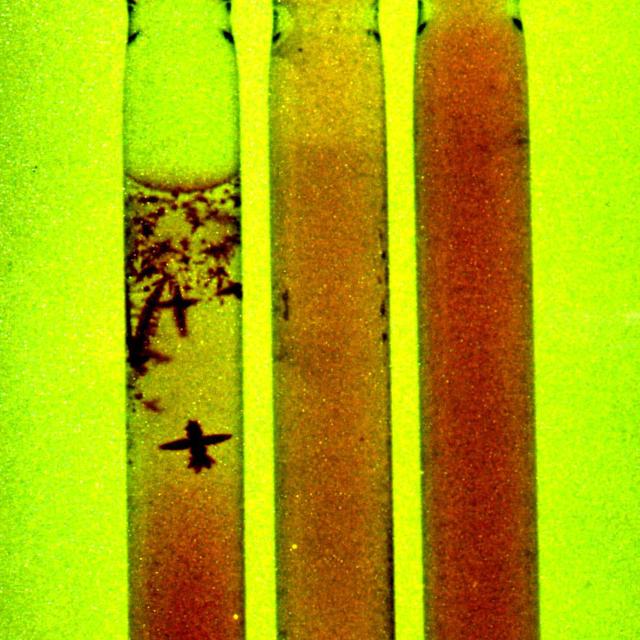
AS17-162-24063 (7-19 Dec. 1972) --- A close-up view of the equipment used for the Heat Flow and Convection Experiment, an engineering and operational test and demonstration carried out aboard the Apollo 17 command module during the final lunar landing mission in NASA's Apollo program. Three test cells were used in the demonstration for measuring and observing fluid flow behavior in the absence of gravity in space flight. Data obtained from such demonstrations will be valuable in the design of future science experiments and for manufacturing processes in space.
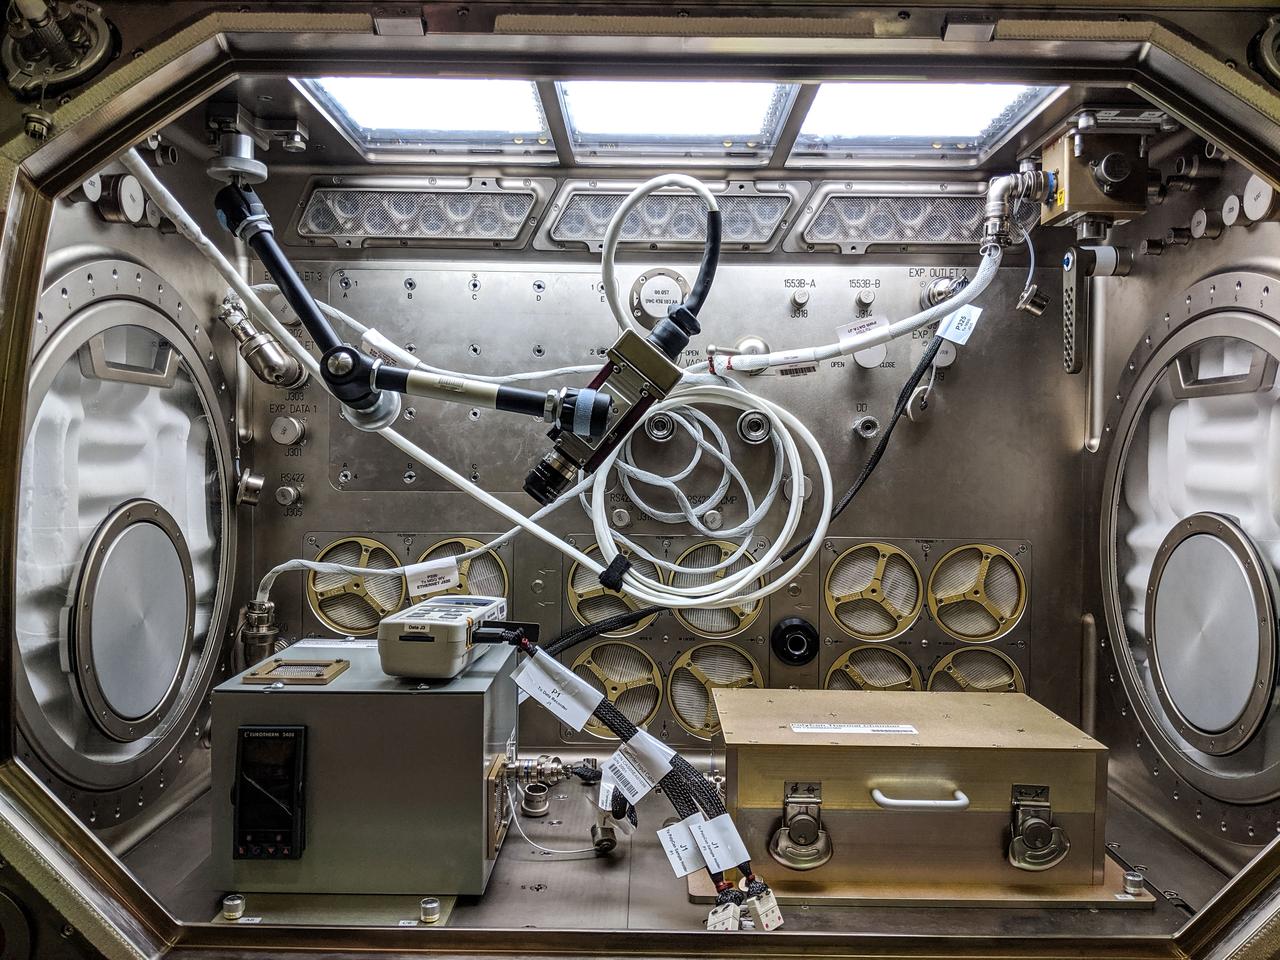
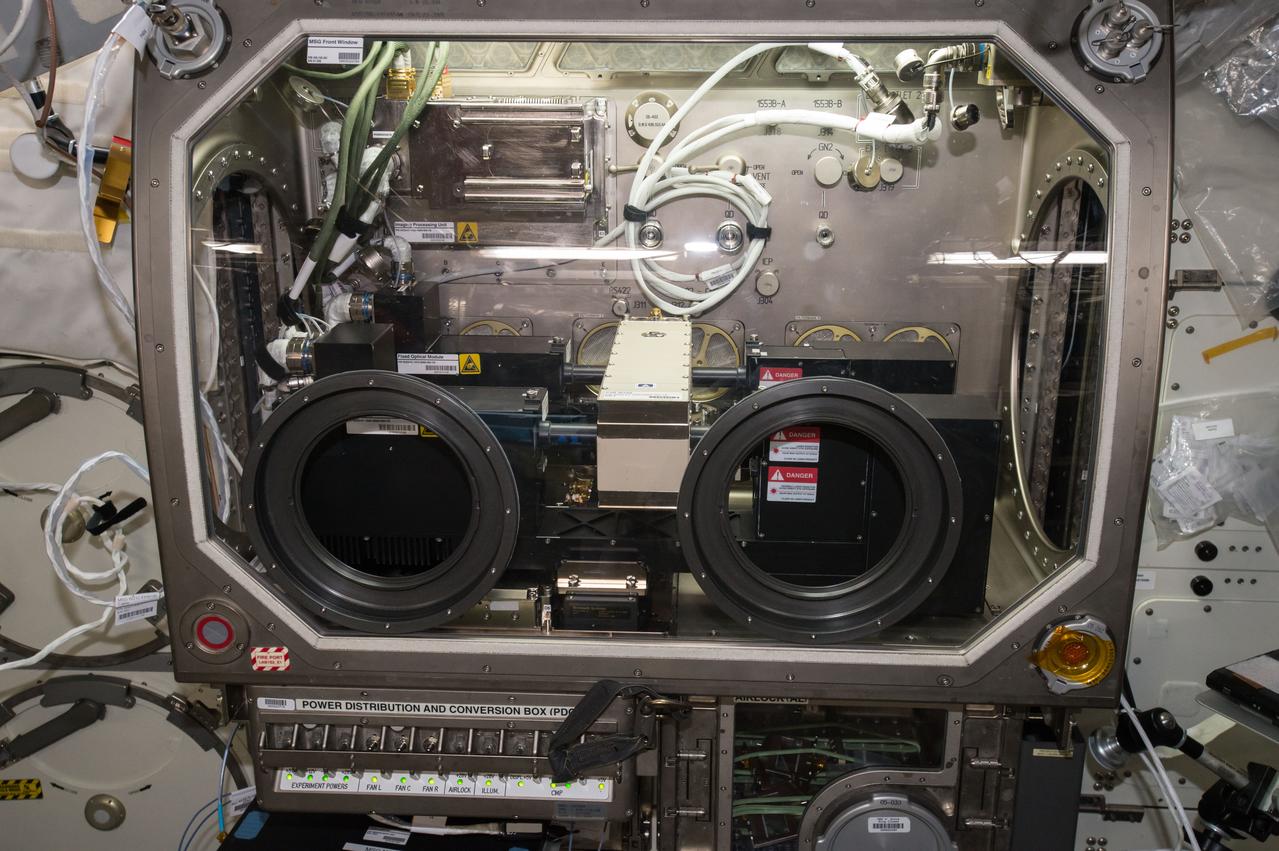
jsc2020e003407 (9/27/2019) --- A preflight image of the Polymer Convection investigation the the Microgravity Science Glovebox (MSG). Polymer Convection examines the effect of gravity on formation and crystallization of Broadband Angular Selective Material (BASM). An optical material with the ability to control the reflection and absorption of light, BASM has applications in polymer packaging, optical films, solar power, and electronic displays. Improved fabrication methods could produce BASM films that are more durable and have better optical and mechanical properties.
STS-42 closeup view shows Student Experiment 81-09 (SE 81-09), Convection in Zero Gravity experiment, with radial pattern caused by convection induced by heating an oil and aluminum powder mixture in the weightlessness of space. While the STS-42 crewmembers activated the Shuttle Student Involvement Program (SSIP) experiment on Discovery's, Orbiter Vehicle (OV) 103's, middeck, Scott Thomas, the student who designed the experiment, was able to observe the procedures via downlinked television (TV) in JSC's Mission Control Center (MCC). Thomas, now a physics doctoral student at the University of Texas, came up with the experiment while he participated in the SSIP as a student at Richland High School in Johnstown, Pennsylvia.
Fuel Boiling Convection Experiment, FBCE Mission Sequence Test
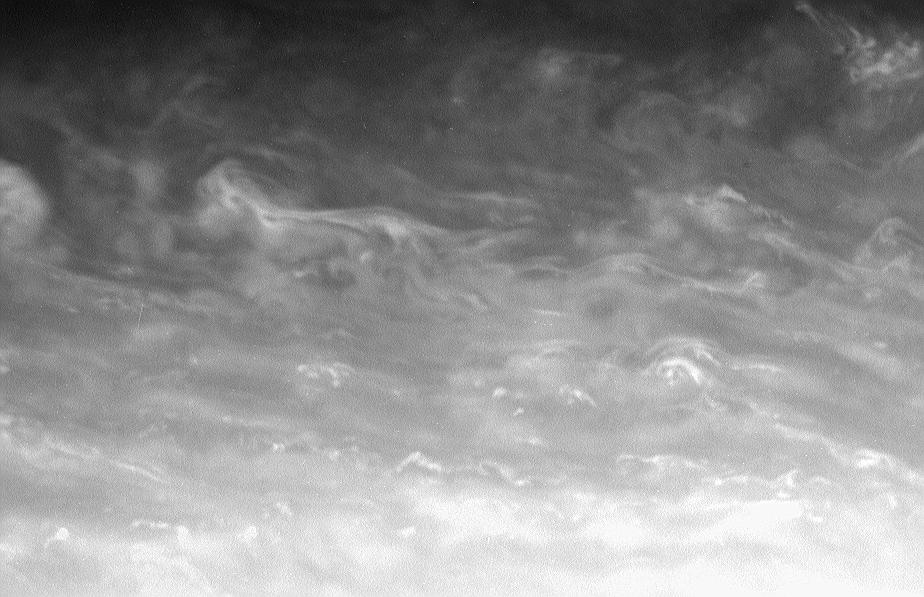
The bright whorls and small-scale specks of convective clouds drift through a region just north of Saturn bright equatorial band. Observers have seen major storms develop in this region in the past 15-20 years
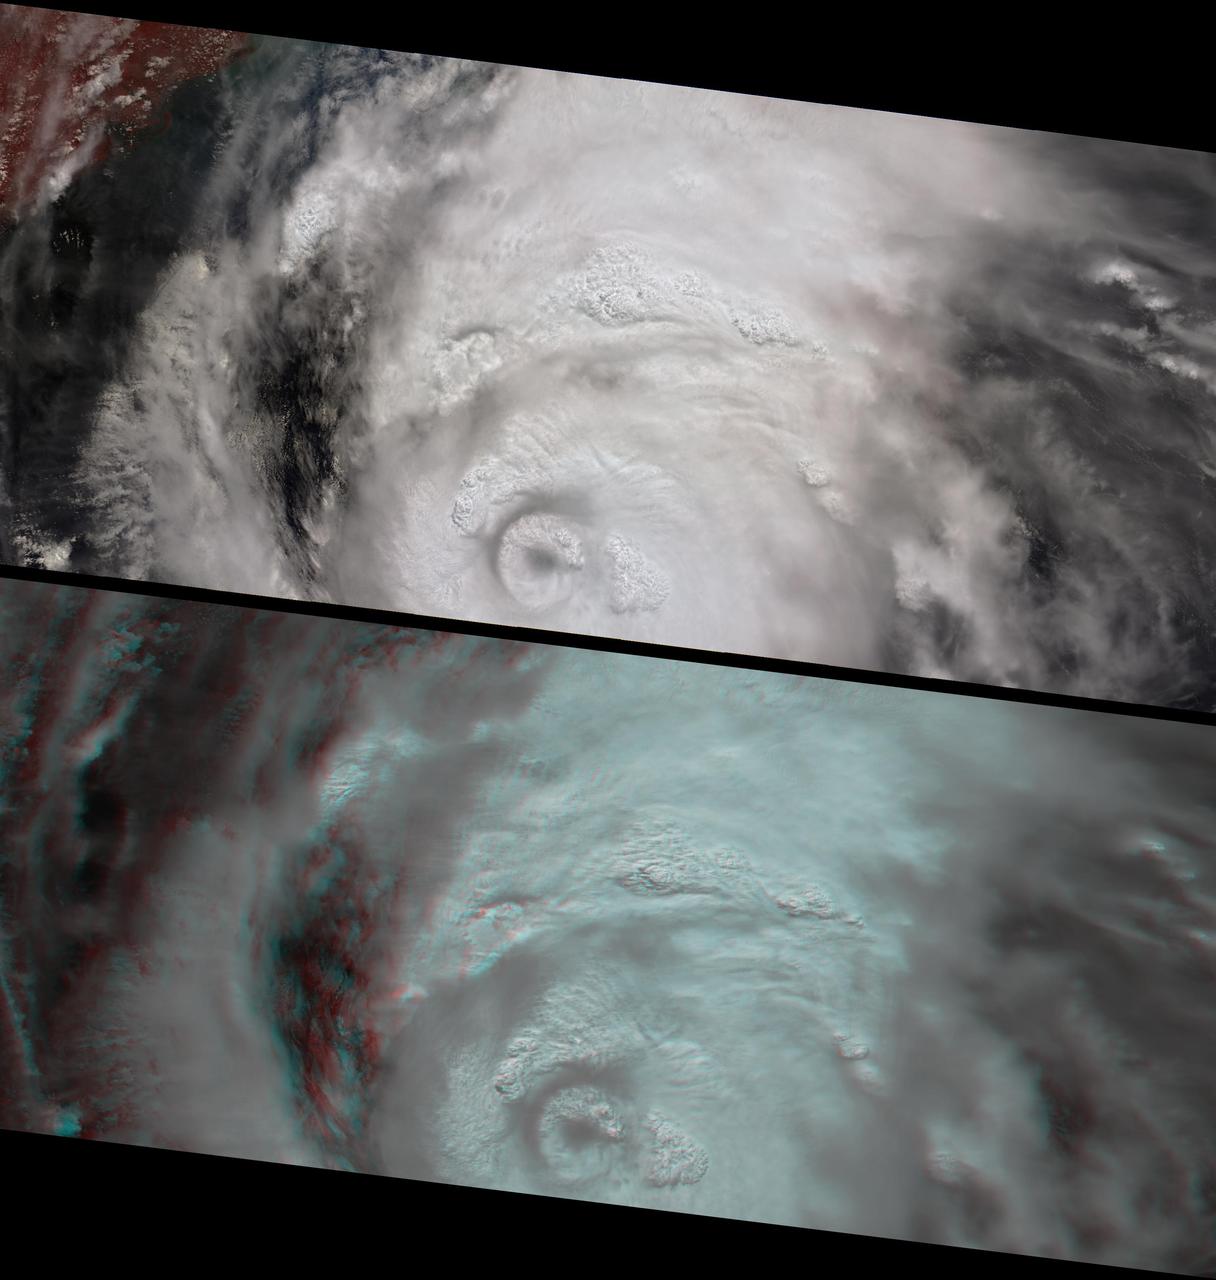
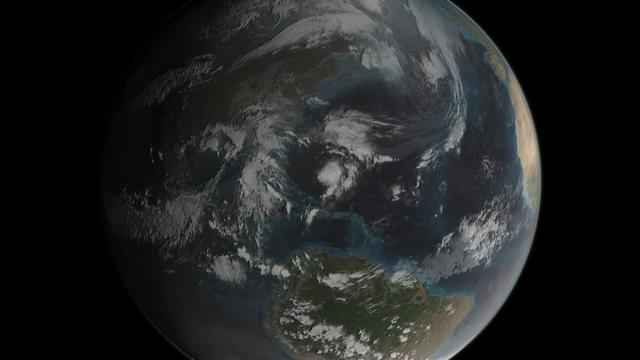
This anaglyph from the MISR instrument aboard NASA Terra spacecraft shows the strong convective development of Hurricane Katrina as it moved west through the Gulf of Mexico. 3D glasses are necessary to view this image.
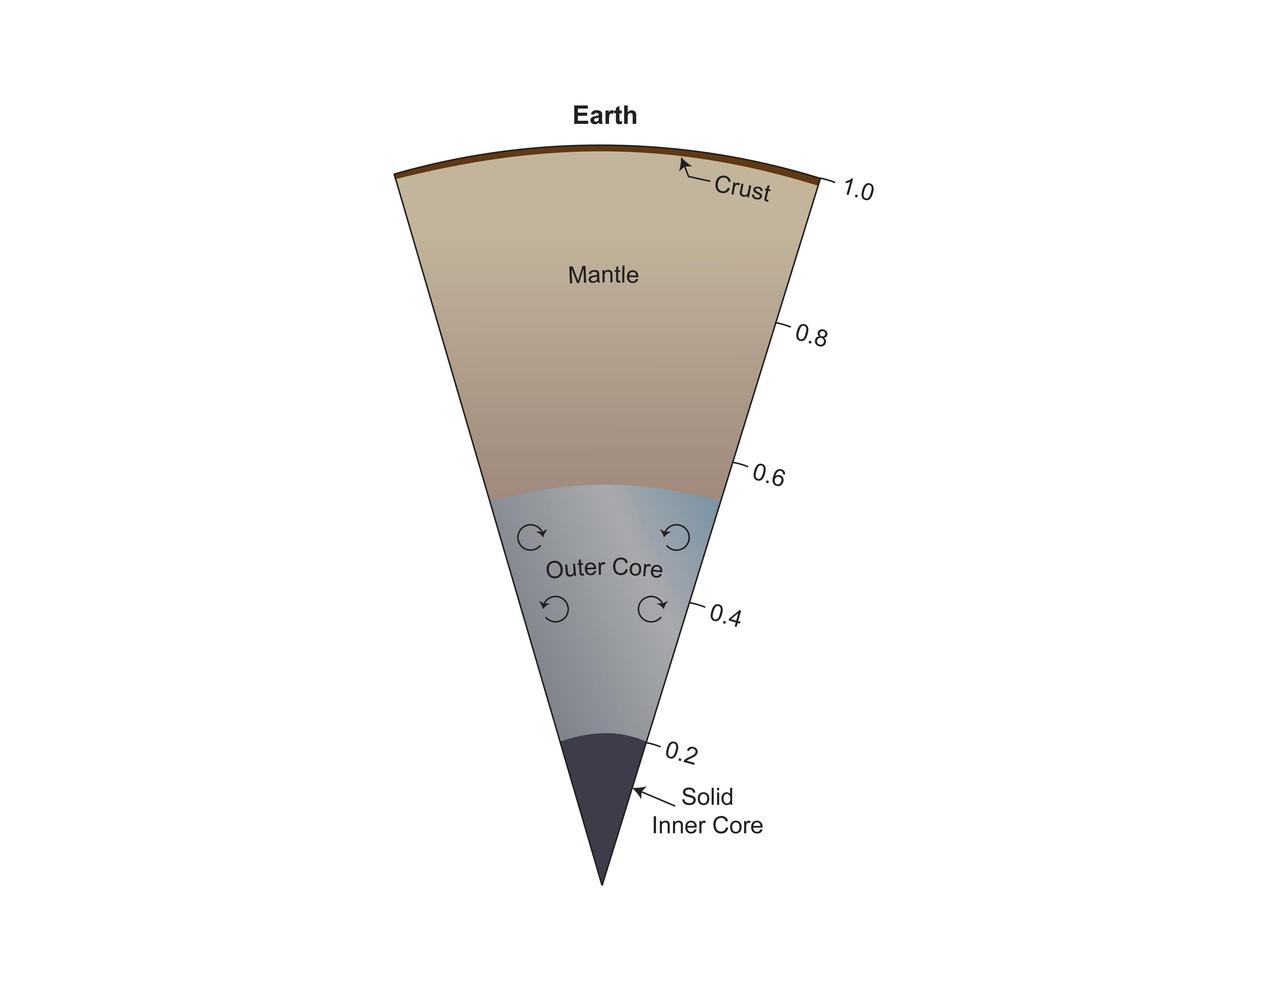
This model of Earth's interior includes a solid, mostly iron inner core beneath a convective liquid iron core that extends to half Earth's radius. Above that is a silicate mantle rich in iron and magnesium and a thin crust of lighter silicates. https://photojournal.jpl.nasa.gov/catalog/PIA25063
Fuel Boiling Convection Experiment, FBCE Mission Sequence Test
Fuel Boiling Convection Experiment, FBCE Mission Sequence Test
Fuel Boiling Convection Experiment, FBCE Mission Sequence Test
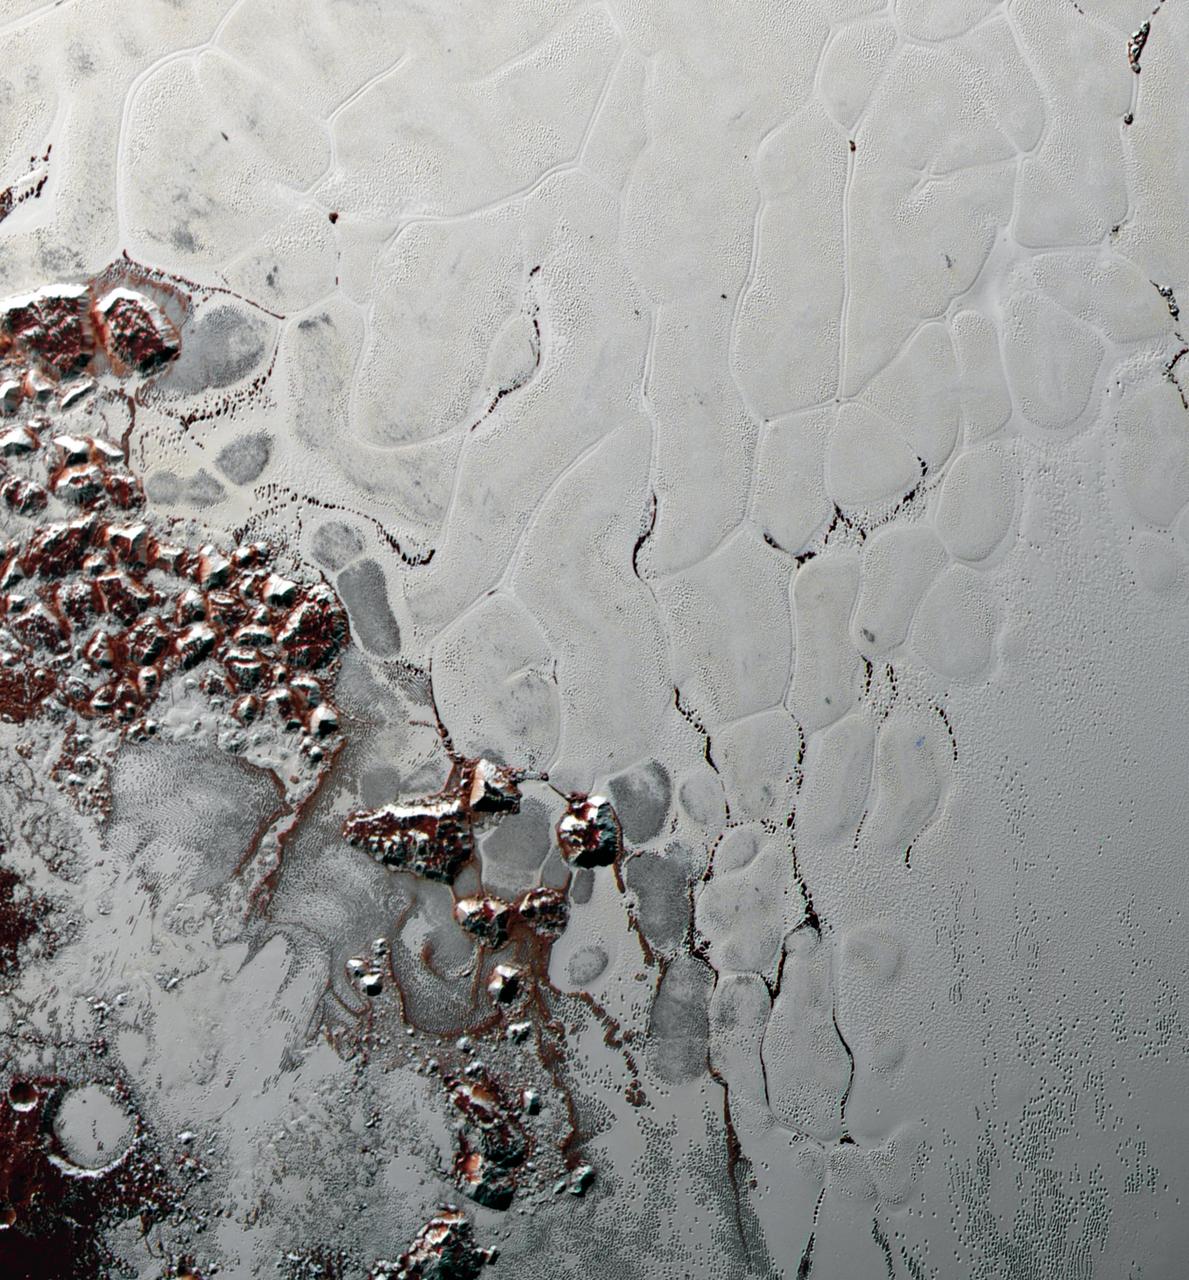
Like a cosmic lava lamp, a large section of Pluto's icy surface is being constantly renewed by a process called convection that replaces older surface ices with fresher material. Scientists from NASA's New Horizons mission used state-of-the-art computer simulations to show that the surface of Pluto's informally named Sputnik Planum is covered with churning ice "cells" that are geologically young and turning over due to a process called convection. The scene above, which is about 250 miles (400 kilometers) across, uses data from the New Horizons Ralph/Multispectral Visible Imaging Camera (MVIC), gathered July 14, 2015. Their findings are published in the June 2, 2016, issue of the journal Nature. http://photojournal.jpl.nasa.gov/catalog/PIA20726
A view of Saturn clouds extending from 40 N latitude shows a ribbon-like wave structure in the south with small convective features marking a westward jet in the north. This image was obtained on November 10, 1980 by NASA Voyager 1.
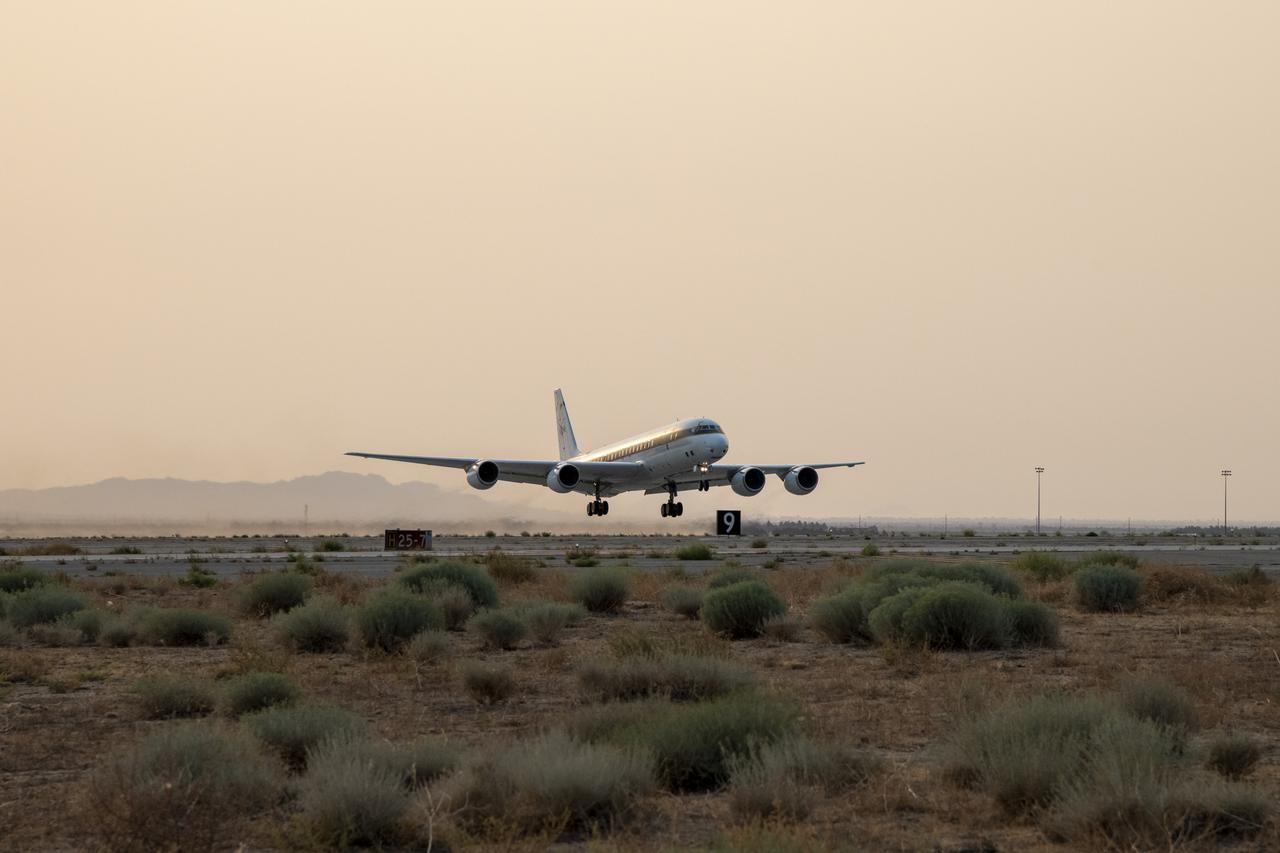
NASA's DC-8 taking off to St. Croix in support of the Convective Processes Experiment - Aerosols and Winds campaign (CPEX-AW) on Aug 17, 2021.
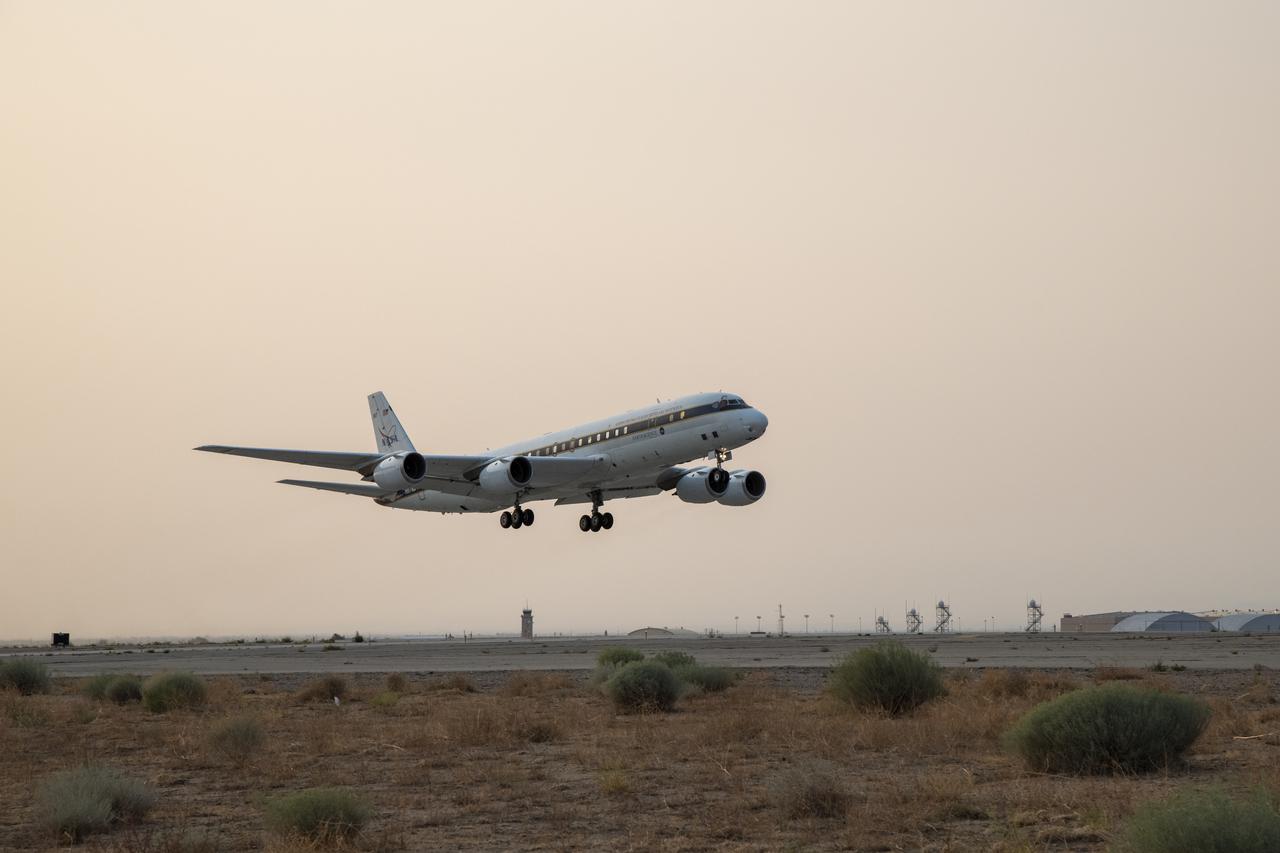
NASA’s DC-8 taking off to St. Croix in support of the Convective Processes Experiment – Aerosols and Winds campaign (CPEX-AW) on Aug 17, 2021.
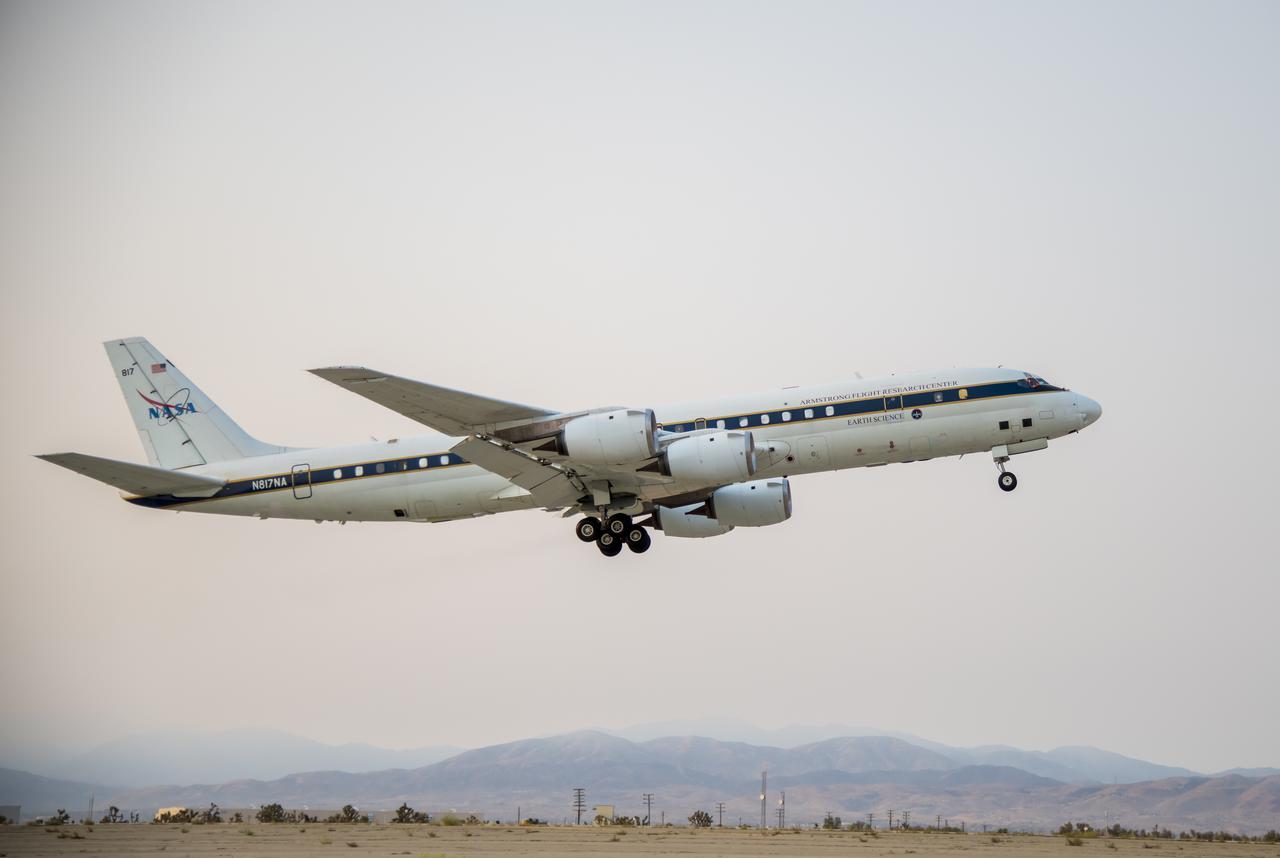
NASA's DC-8 taking off to St. Croix in support of the Convective Processes Experiment - Aerosols and Winds campaign (CPEX-AW) on Aug 17, 2021.
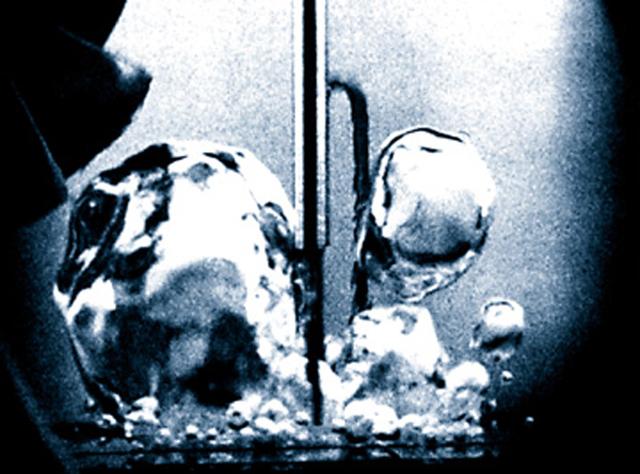
Fluid Physics is study of the motion of fluids and the effects of such motion. When a liquid is heated from the bottom to the boiling point in Earth's microgravity, small bubbles of heated gas form near the bottom of the container and are carried to the top of the liquid by gravity-driven convective flows. In the same setup in microgravity, the lack of convection and buoyancy allows the heated gas bubbles to grow larger and remain attached to the container's bottom for a significantly longer period.
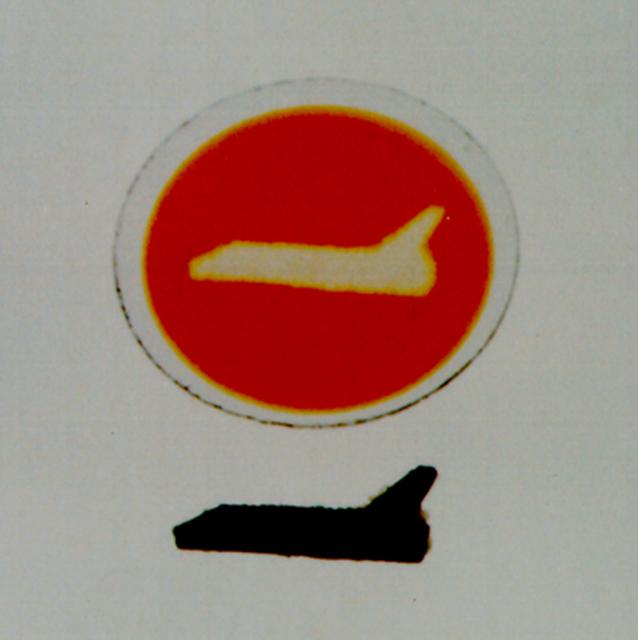
Polydiacetylenes are a unique class of highly conjugated organic polymers that are of interest for both electronic and photonic applications. Photodeposition from solutions is a novel process superior to those grown by conventional techniques. Evidence of this is seen when the films are viewed under a microscope; they exhibit small particles of solid polymer which form in the bulk solution, get transported by convection to the surface of the growing film, and become embedded. Also convection tends to cause the film thickness to be less uniform, and may even affect the molecular orientation of the films. The thrust of the research is to investigate in detail, both in 1-g and low-g, the effects of convection (and lack thereof) on this novel and interesting reaction. In this example, a portion of the substrate was blocked from exposure to the UV light by the mask, which was placed on the opposite side of the glass disk as the film, clearly demonstrating that photodeposition occurs only where the substrate is irradiated directly.
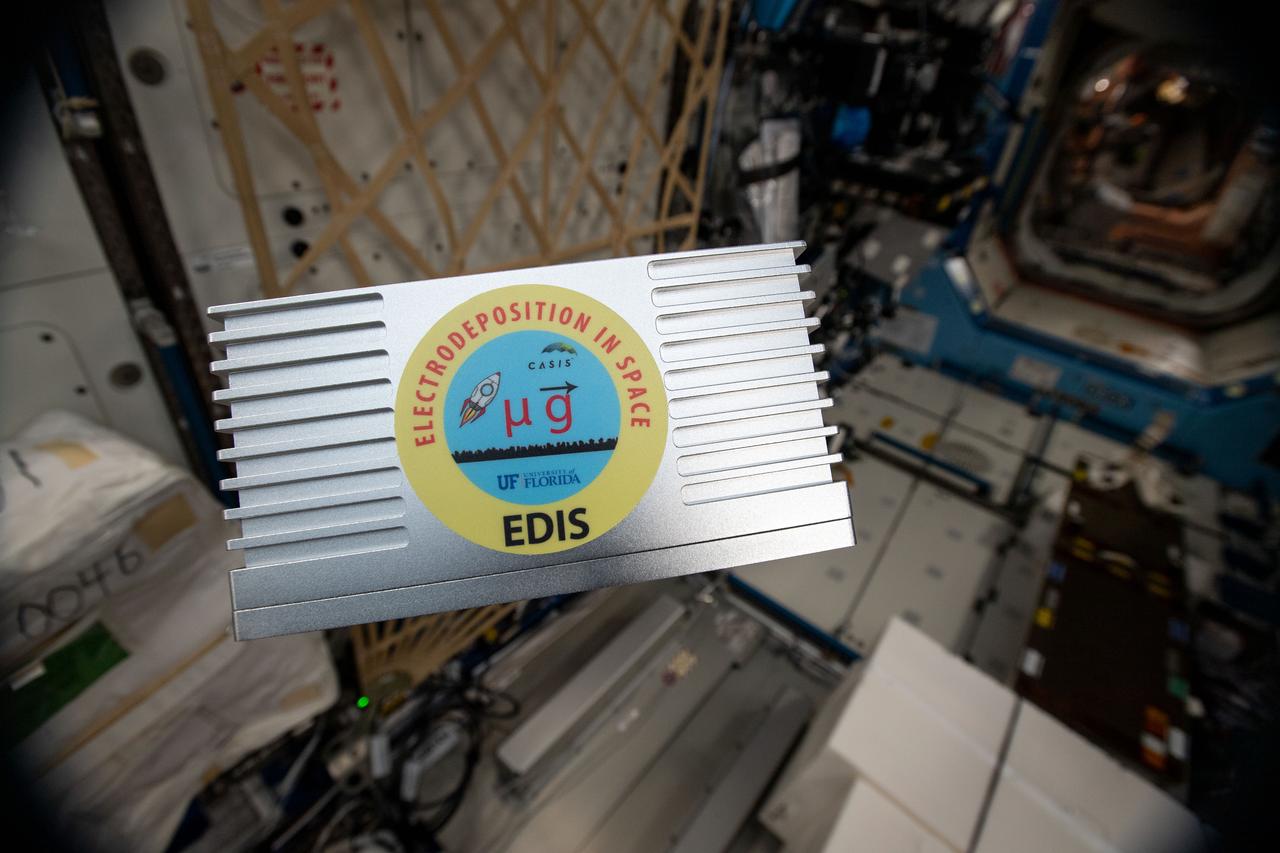
iss059e063749 (5/17/2019) --- Photo documentation of the EDIS investigation onboard the International Space Station (ISS). The payload operates in the TangoLab facility. Electrodeposition Observation in Microgravity examines the role of convection during the electrodeposition process in microgravity.
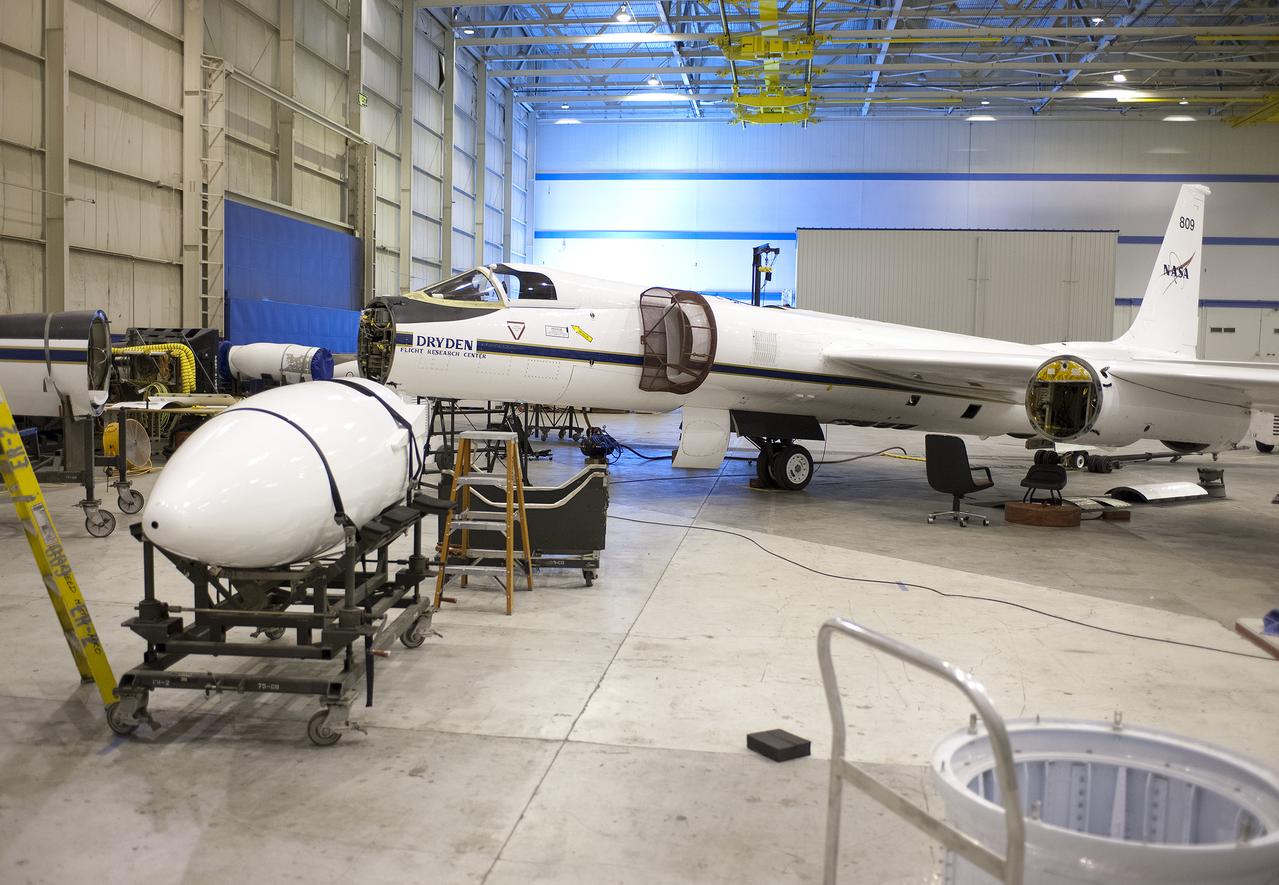
The equipment bays and wing pods of NASA's high-altitude ER-2 will carry 15 specialized instruments to study how the vertical convection of air pollution and natural emissions affect climate change.
NASA's Armstrong Flight Research Center flies the DC-8 airborne science laboratory in support of the Convective Processes Experiment - Aerosols and Winds campaign, CPEX-AW, on Aug 6, 2021.
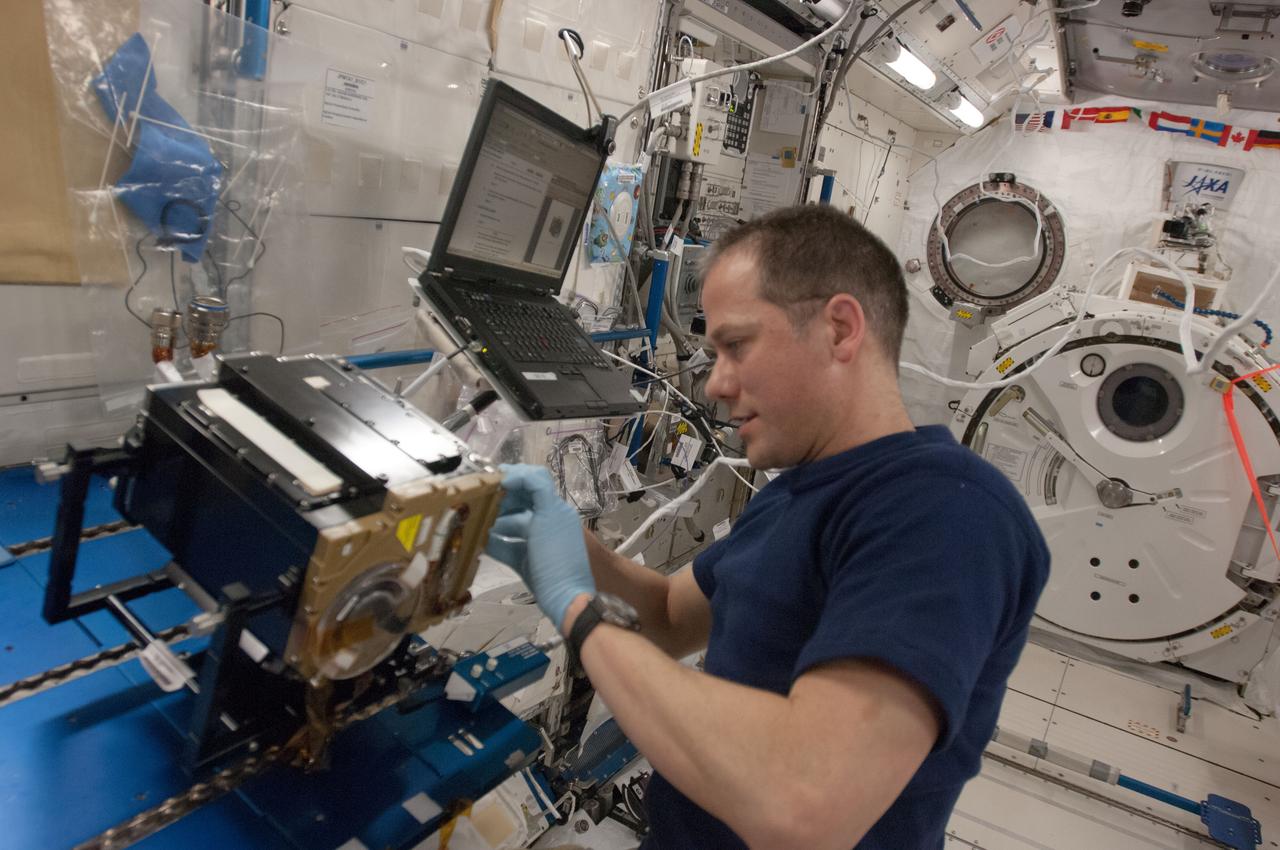
ISS035e006147 (19 March 2013) --- NASA astronaut Tom Marshburn, Expedition 35 flight engineer, works on the Marangoni Inside core cleaning in the Kibo Japanese Experiment Module onboard the Earth-orbiting International Space Station. Marangoni convection is the flow driven by the presence of a surface tension gradient which can be produced by temperature difference at a liquid/gas interface. The convection in liquid bridge of silicone oil is generated by heating the one disc higher than the other. Scientists are observing flow patterns of how fluids move to learn more about how heat is transferred in microgravity.
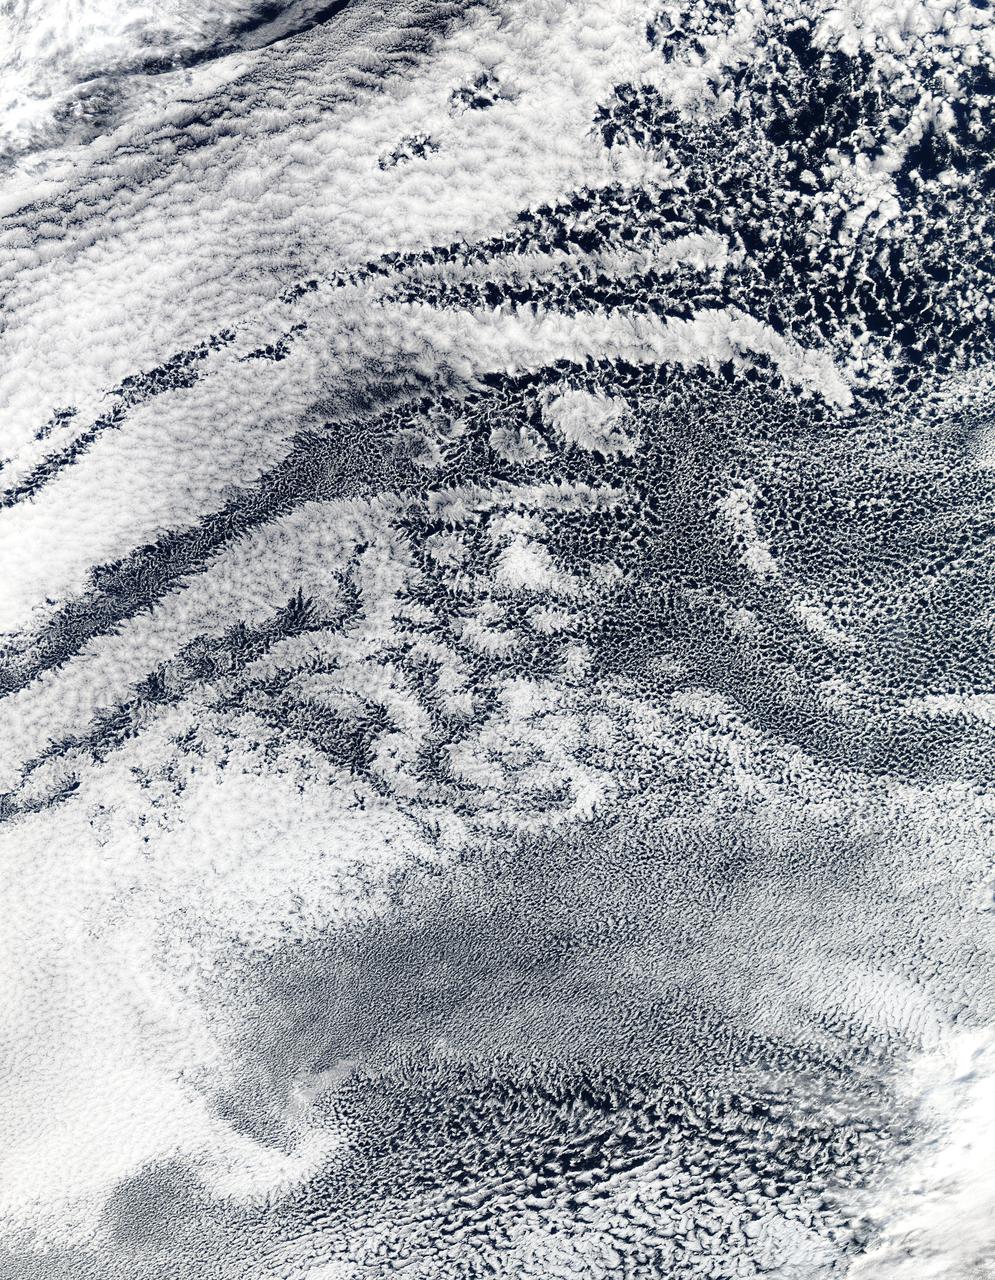
2010/107 - 04/17 at 21 :05 UTC. Open-cell and closed-cell clouds off Peru, Pacific Ocean Resembling a frosted window on a cold winter's day, this lacy pattern of marine clouds was captured off the coast of Peru in the Pacific Ocean by the MODIS on the Aqua satellite on April 19, 2010. The image reveals both open- and closed-cell cumulus cloud patterns. These cells, or parcels of air, often occur in roughly hexagonal arrays in a layer of fluid (the atmosphere often behaves like a fluid) that begins to "boil," or convect, due to heating at the base or cooling at the top of the layer. In "closed" cells warm air is rising in the center, and sinking around the edges, so clouds appear in cell centers, but evaporate around cell edges. This produces cloud formations like those that dominate the lower left. The reverse flow can also occur: air can sink in the center of the cell and rise at the edge. This process is called "open cell" convection, and clouds form at cell edges around open centers, which creates a lacy, hollow-looking pattern like the clouds in the upper right. Closed and open cell convection represent two stable atmospheric configurations — two sides of the convection coin. But what determines which path the "boiling" atmosphere will take? Apparently the process is highly chaotic, and there appears to be no way to predict whether convection will result in open or closed cells. Indeed, the atmosphere may sometimes flip between one mode and another in no predictable pattern. Satellite: Aqua NASA/GSFC/Jeff Schmaltz/MODIS Land Rapid Response Team To learn more about MODIS go to: <a href="http://rapidfire.sci.gsfc.nasa.gov/gallery/?latest" rel="nofollow">rapidfire.sci.gsfc.nasa.gov/gallery/?latest</a> <b><a href="http://www.nasa.gov/centers/goddard/home/index.html" rel="nofollow">NASA Goddard Space Flight Center</a></b> is home to the nation's largest organization of combined scientists, engineers and technologists that build spacecraft, instruments and new technology to study the Earth, the sun, our solar system, and the universe.
Typical picture of a dendrite: Notice how the branch on the left has no arms coming off the top. This is because of the convective forces (hot liquid rises) that the top of the branch is not solidifying (growing arms) like the bottom, cooler area. The is a gravitational effect. This does not happen in space.
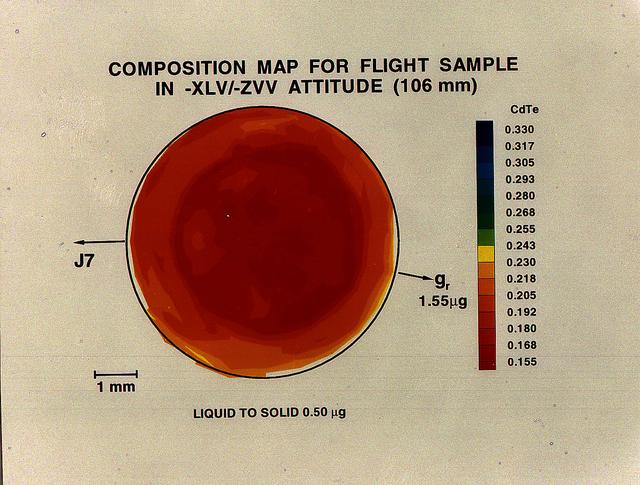
A semiconductor's usefulness is determined by how atoms are ordered within the crystal's underlying three-dimensional structure. While this mercury telluride and cadmium telluride alloy sample mixes completely in Earth -based laboratories, convective flows prevent them from mixing uniformly. In space, the ingredients mix more homogenously, resulting in a superior product.
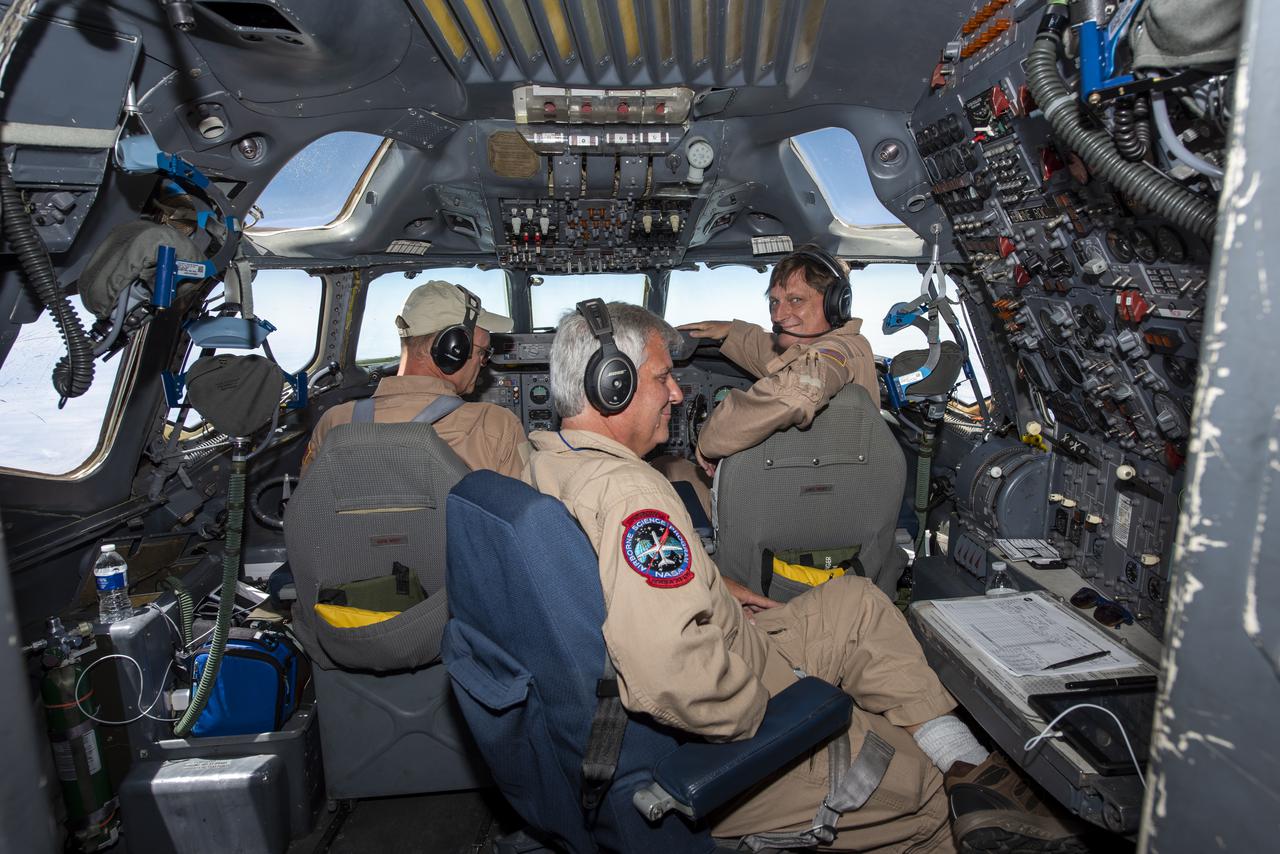
NASA's Armstrong Flight Research Center flies the DC-8 airborne science laboratory in support of the Convective Processes Experiment - Aerosols and Winds campaign, CPEX-AW, on Aug 6, 2021. From left to right: Nils Larson, David Fedors and Mark Crane
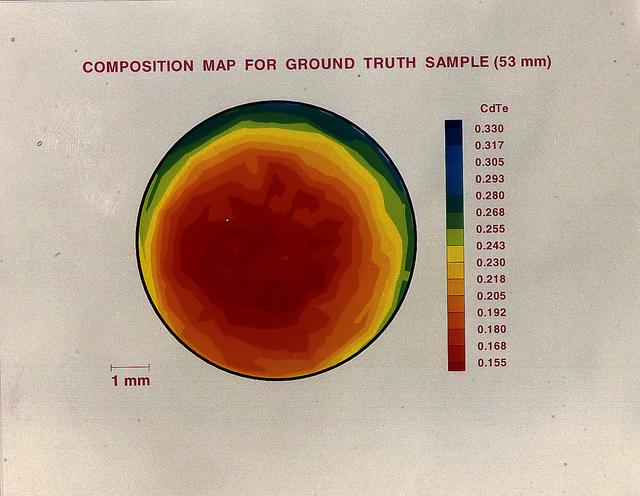
A semiconductor's usefulness is determined by how atoms are ordered within the crystal's underlying three-dimensional structure. While this mercury telluride and cadmium telluride alloy sample mixes completely in Earth -based laboratories, convective flows prevent them from mixing uniformly.
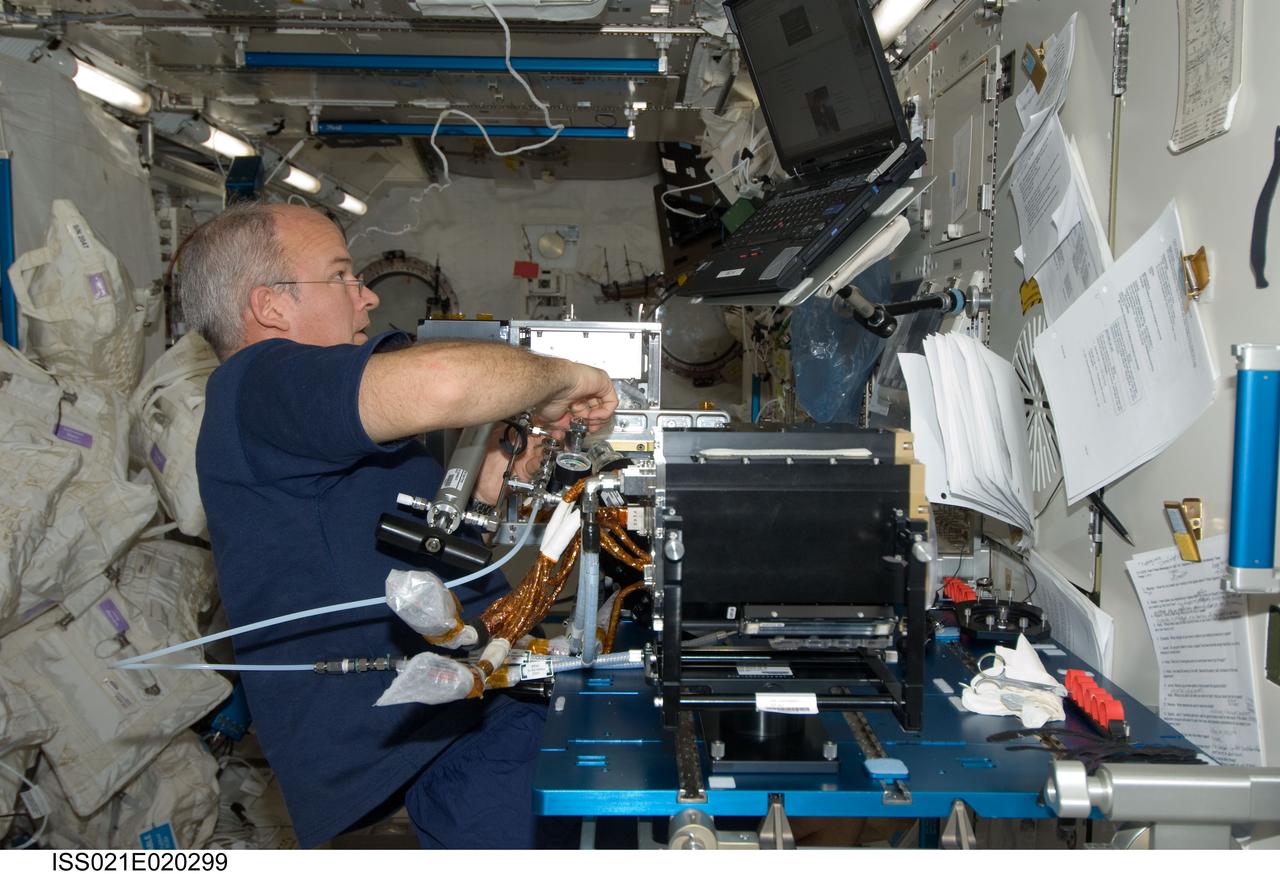
ISS021-E-020299 (5 Nov. 2009) --- NASA astronaut Jeffrey Williams, Expedition 21 flight engineer, works with Fluid Physics Experiment Facility/Marangoni Surface (FPEF MS) Core hardware in the Kibo laboratory of the International Space Station. The Marangoni convection experiment in the FPEF examines fluid tension flow in micro-G.
Researchers have found that as melted metals and alloys (combinations of metals) solidify, they can form with different arrangements of atoms, called microstructures. These microstructures depend on the shape of the interface (boundary) between the melted metal and the solid crystal it is forming. There are generally three shapes that the interface can take: planar, or flat; cellular, which looks like the cells of a beehive; and dendritic, which resembles tiny fir trees. Convection at this interface can affect the interface shape and hide the other phenomena (physical events). To reduce the effects of convection, researchers conduct experiments that examine and control conditions at the interface in microgravity. Microgravity also helps in the study of alloys composed of two metals that do not mix. On Earth, the liquid mixtures of these alloys settle into different layers due to gravity. In microgravity, the liquid metals do not settle, and a solid more uniform mixture of both metals can be formed.
Researchers have found that as melted metals and alloys (combinations of metals) solidify, they can form with different arrangements of atoms, called microstructures. These microstructures depend on the shape of the interface (boundary) between the melted metal and the solid crystal it is forming. There are generally three shapes that the interface can take: planar, or flat; cellular, which looks like the cells of a beehive; and dendritic, which resembles tiny fir trees. Convection at this interface can affect the interface shape and hide the other phenomena (physical events). To reduce the effects of convection, researchers conduct experiments that examine and control conditions at the interface in microgravity. Microgravity also helps in the study of alloys composed of two metals that do not mix. On Earth, the liquid mixtures of these alloys settle into different layers due to gravity. In microgravity, the liquid metals do not settle, and a solid more uniform mixture of both metals can be formed.

ISS016-E-027426 (5 Feb. 2008) --- Cumulonimbus Cloud over Africa is featured in this image photographed by an Expedition 16 crewmember on the International Space Station. Deemed by many meteorologists as one of the most impressive of cloud formations, cumulonimbus (from the Latin for "puffy" and "dark") clouds form due to vigorous convection of warm and moist unstable air. Surface air warmed by the Sun-heated ground surface rises, and if sufficient atmospheric moisture is present, water droplets will condense as the air mass encounters cooler air at higher altitudes. The air mass itself also expands and cools as it rises due to decreasing atmospheric pressure, a process known as adiabatic cooling. This type of convection is common in tropical latitudes year-round and during the summer season at higher latitudes. As water in the rising air mass condenses and changes from a gaseous to a liquid state, it releases energy to its surroundings, further heating the surrounding air and leading to more convection and rising of the cloud mass to higher altitudes. This leads to the characteristic vertical "towers" associated with cumulonimbus clouds, an excellent example of which is visible in this image (right). If enough moisture is present to condense and continue heating the cloud mass through several convective cycles, a tower can rise to altitudes of approximately 10 kilometers at high latitudes to 20 kilometers in the tropics -- before encountering a region of the atmosphere known as the tropopause. The tropopause is characterized by a strong temperature inversion where the atmosphere is dryer and no longer cools with altitude. This halts further vertical motion of the cloud mass, and causes flattening and spreading of the cloud tops into an anvil-shaped cloud as illustrated by this oblique photograph. The view direction is at an angle from the vertical, rather than straight "down" towards the Earth's surface. The image, photographed while the International Space Station was passing over western Africa near the Senegal-Mali border, shows a fully-formed anvil cloud with numerous smaller cumulonimbus towers rising near it. The high energetics of these storm systems typically make them hazardous due to associated heavy precipitation, lightning, high wind speeds and possible tornadoes.
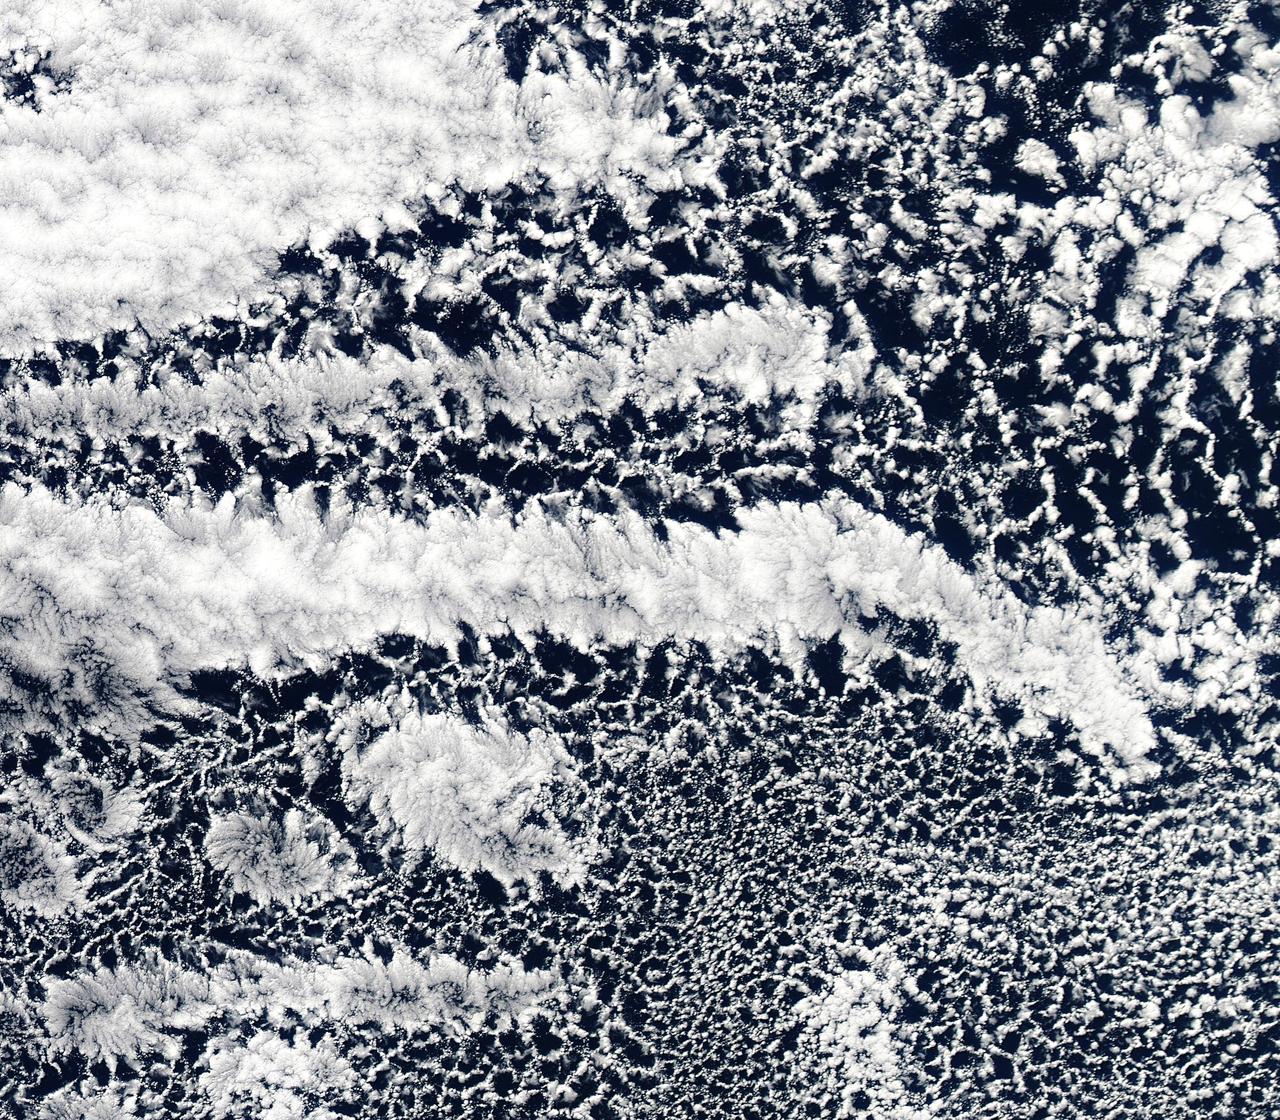
2010/107 - 04/17 at 21 :05 UTC. Open-cell and closed-cell clouds off Peru, Pacific Ocean. To view the full fame of this image to go: <a href="http://www.flickr.com/photos/gsfc/4557497219/">www.flickr.com/photos/gsfc/4557497219/</a> Resembling a frosted window on a cold winter's day, this lacy pattern of marine clouds was captured off the coast of Peru in the Pacific Ocean by the MODIS on the Aqua satellite on April 19, 2010. The image reveals both open- and closed-cell cumulus cloud patterns. These cells, or parcels of air, often occur in roughly hexagonal arrays in a layer of fluid (the atmosphere often behaves like a fluid) that begins to "boil," or convect, due to heating at the base or cooling at the top of the layer. In "closed" cells warm air is rising in the center, and sinking around the edges, so clouds appear in cell centers, but evaporate around cell edges. This produces cloud formations like those that dominate the lower left. The reverse flow can also occur: air can sink in the center of the cell and rise at the edge. This process is called "open cell" convection, and clouds form at cell edges around open centers, which creates a lacy, hollow-looking pattern like the clouds in the upper right. Closed and open cell convection represent two stable atmospheric configurations — two sides of the convection coin. But what determines which path the "boiling" atmosphere will take? Apparently the process is highly chaotic, and there appears to be no way to predict whether convection will result in open or closed cells. Indeed, the atmosphere may sometimes flip between one mode and another in no predictable pattern. Satellite: Aqua NASA/GSFC/Jeff Schmaltz/MODIS Land Rapid Response Team To learn more about MODIS go to: <a href="http://rapidfire.sci.gsfc.nasa.gov/gallery/?latest" rel="nofollow">rapidfire.sci.gsfc.nasa.gov/gallery/?latest</a> <b><a href="http://www.nasa.gov/centers/goddard/home/index.html" rel="nofollow">NASA Goddard Space Flight Center</a></b> is home to the nation's largest organization of combined scientists, engineers and technologists that build spacecraft, instruments and new technology to study the Earth, the sun, our solar system, and the universe.
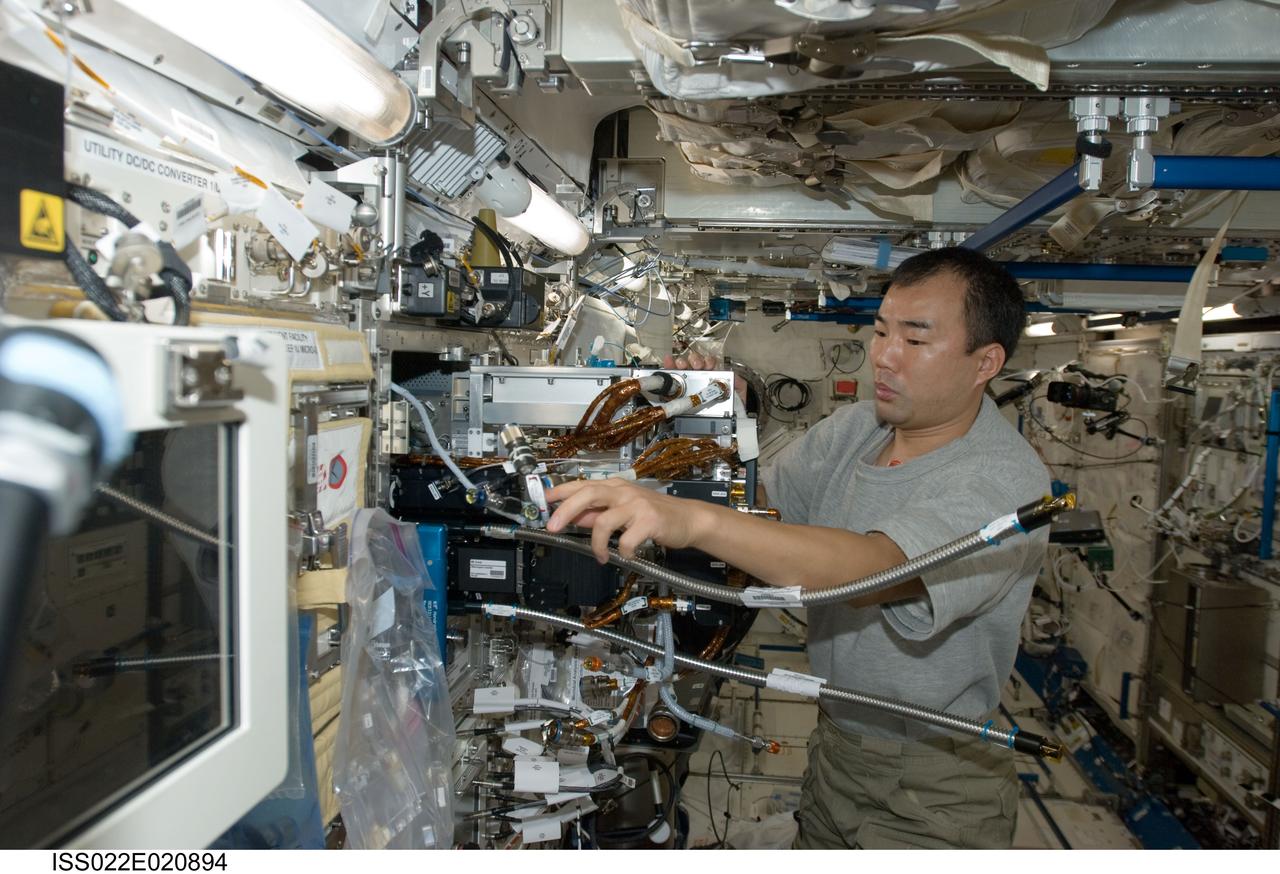
ISS022-E-020894 (11 Jan. 2010) --- Japan Aerospace Exploration Agency (JAXA) astronaut Soichi Noguchi, Expedition 22 flight engineer, works with Fluid Physics Experiment Facility/Marangoni Surface (FPEF MS) Core hardware in the Kibo laboratory of the International Space Station. The Marangoni convection experiment in the FPEF examines fluid tension flow in micro-G.
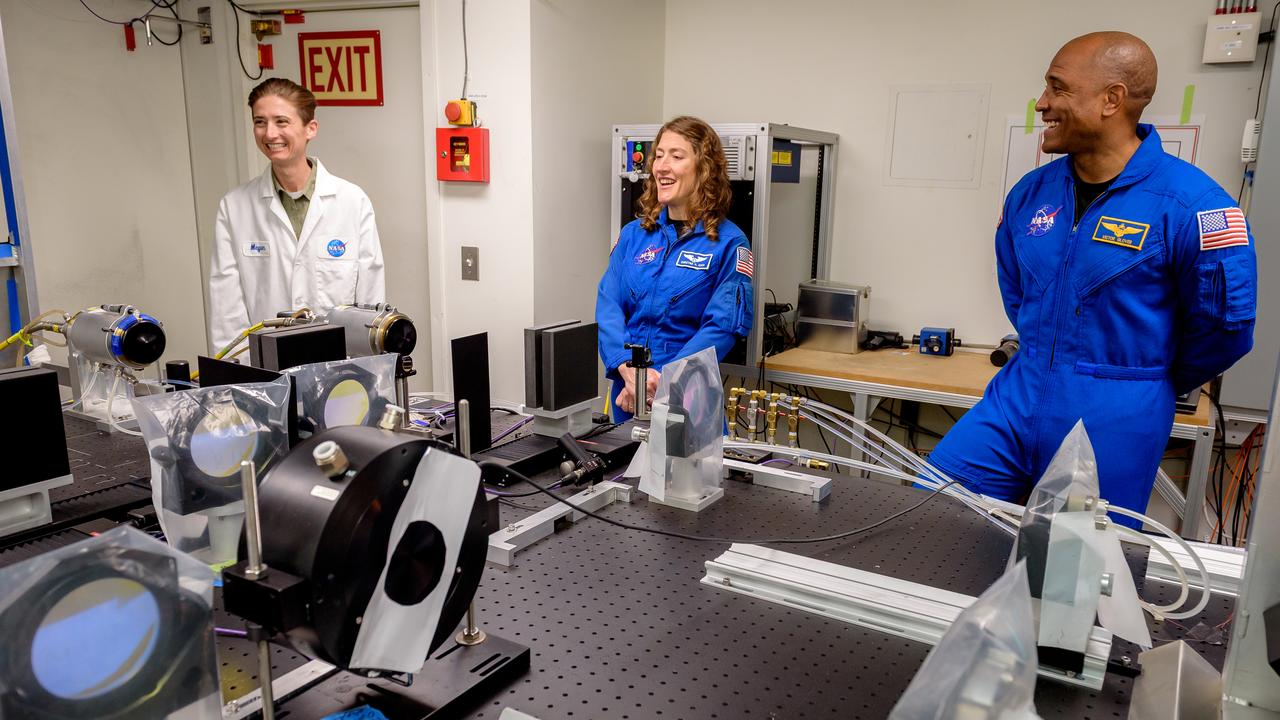
Megan MacDonald, left, leads NASA astronauts Christina Koch and Victor J. Glover, right, on a tour of the Laser Enhanced Arc Jet Facility (LEAF) laboratory, in N238. The LEAF laser augments the hypersonic shock heating experienced by a test sample during an arc jet test and provides improved test simulation quality by supplying an intense source of optical heating while the arc jet flow provides shock-driven convective heating.
STS109-E-6003 (10 March 2002) --- The astronauts on board the Space Shuttle Columbia took this digital picture featuring a well-defined subtropical cyclone. The view looks southwestward over the Tasman Sea (between Australia and New Zealand). According to meteorologists studying the STS-109 photo collection, such circulations are recognized as hybrids, lacking the tight banding and convection of tropical cyclones, and the strong temperature contrast and frontal boundaries of polar storms. The image was recorded with a digital still camera.
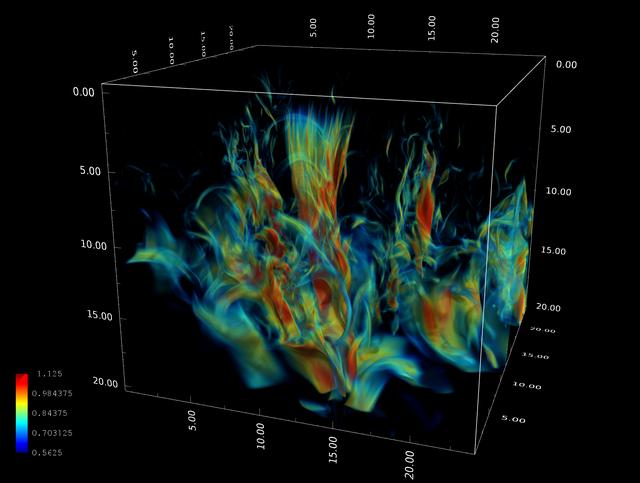
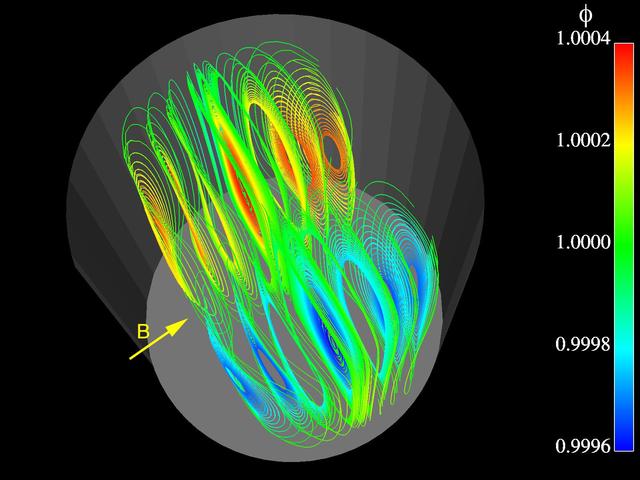
Stein_Sun: Visualization of the complex magnetic field produced as magnetic flux rises toward the Sun¹s surface from the deep convection zone. The image shows a snapshot of how the magnetic field has evolved two days from the time uniform, untwisted, horizontal magnetic field started to be advected by inflows at the bottom (20 megameters deep). Axes are in megameters, and the color scale shows the log of the magnetic field strength. Credit: Robert Stein, Michigan State University; Tim Sandstrom, NASA/Ames
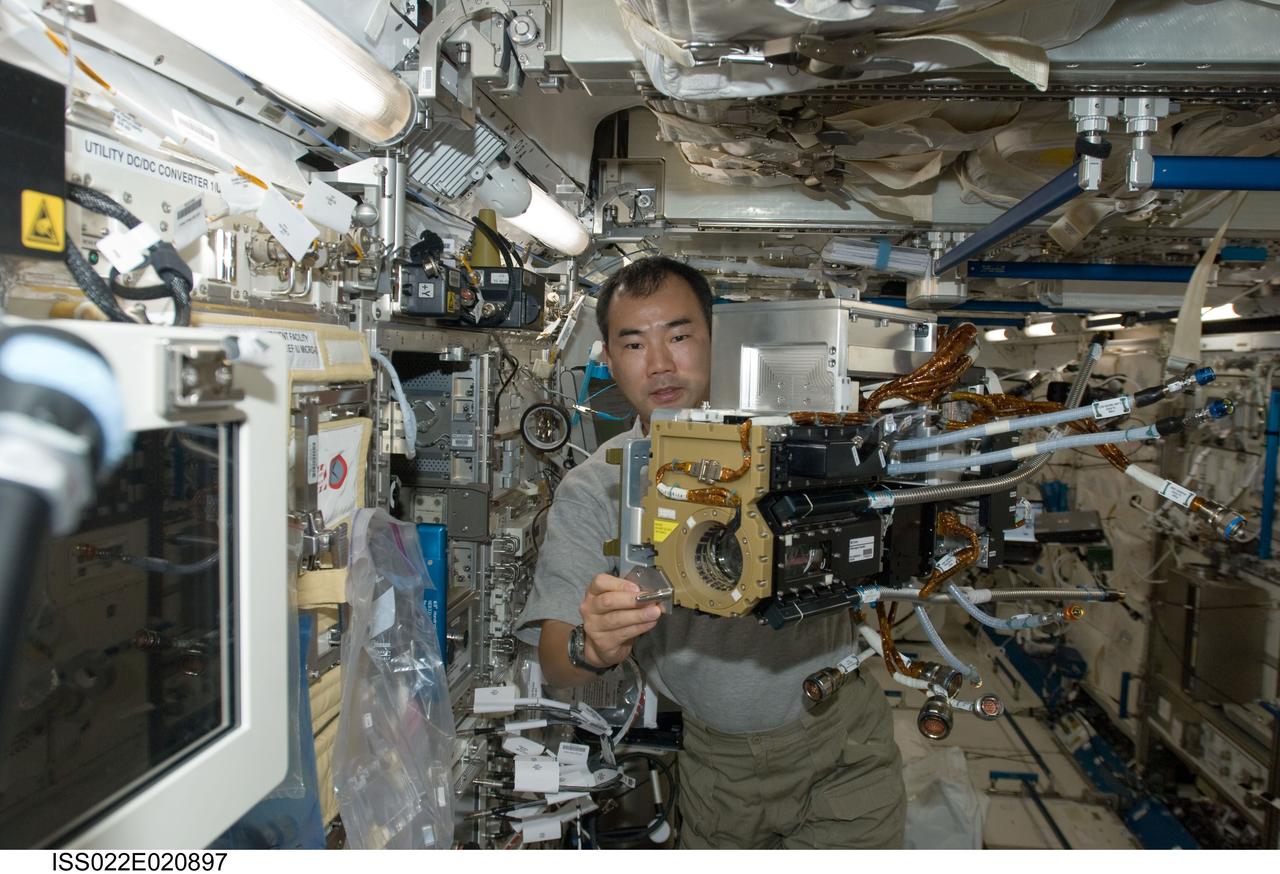
ISS022-E-020897 (11 Jan. 2010) --- Japan Aerospace Exploration Agency (JAXA) astronaut Soichi Noguchi, Expedition 22 flight engineer, works with Fluid Physics Experiment Facility/Marangoni Surface (FPEF MS) Core hardware in the Kibo laboratory of the International Space Station. The Marangoni convection experiment in the FPEF examines fluid tension flow in micro-G.
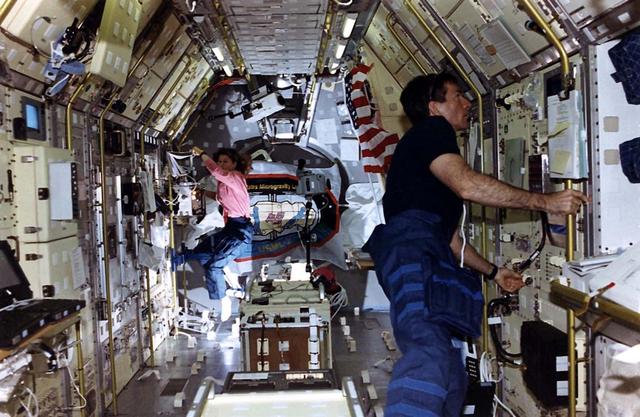
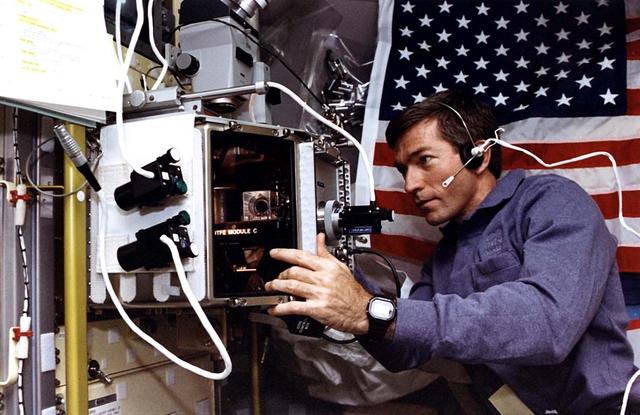
This wide view gives an overall perspective of the working environment of five astronauts and two guest researchers for 16 days in Earth-orbit. At work in support of the U.S. Microgravity Laboratory (USML-2) mission in this particular scene are astronaut Catherine G. Coleman, who busies herself at the glovebox, and payload specialist Fred. W. Leslie, monitoring the Surface-Tension-Driven Convection Experiment (STDCE).
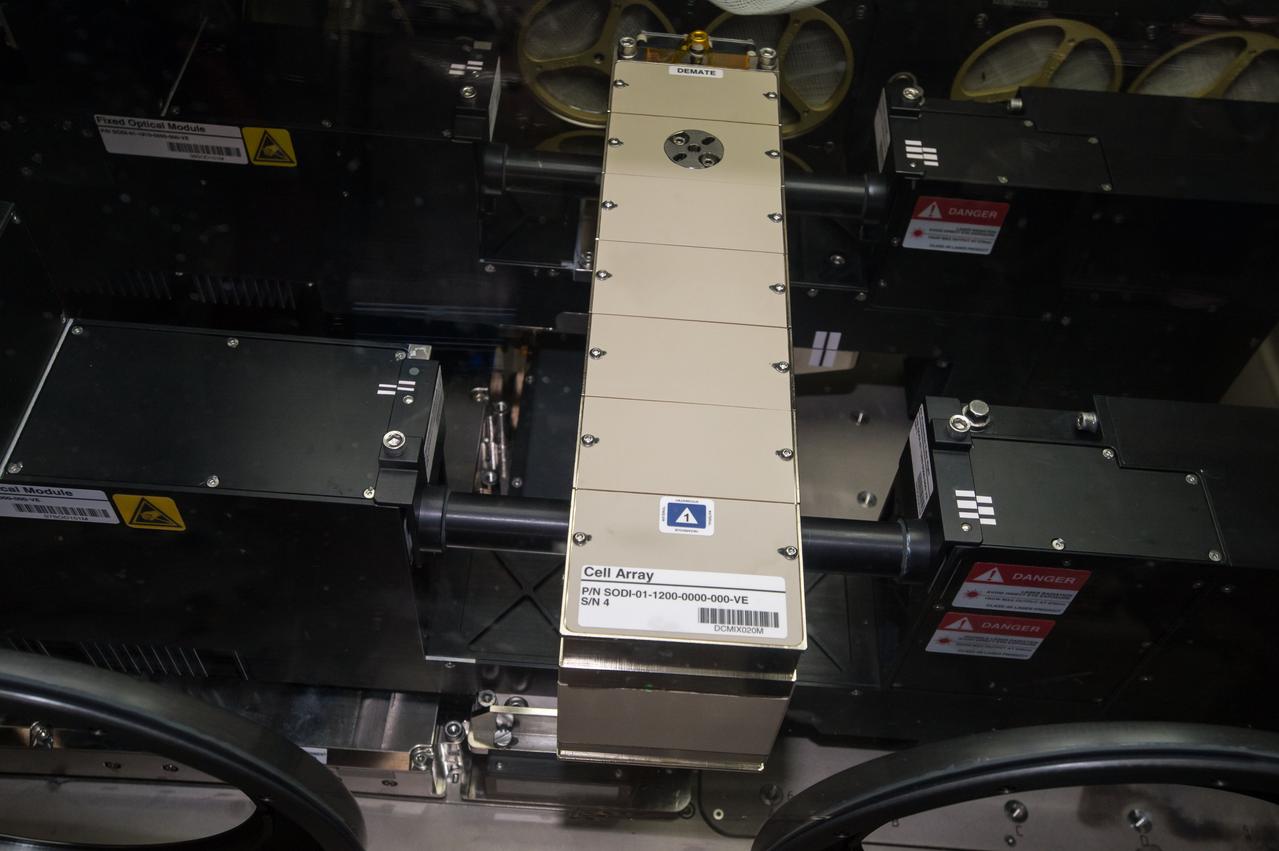
iss049e002308 (9/13/2016) --- A view taken during Selectable Optics Diagnostic Instrument (SODI) DSC Hardware Setup the MSG Work Volume. The Selectable Optical Diagnostics Instrument - Diffusion and Soret Coefficient (SODI-DSC) experiment will study diffusion in six different liquids over time in the absence of convection induced by the gravity field. The SODI-DSC investigation will provide information to scientist which can be used to more efficiently extract oil resources.
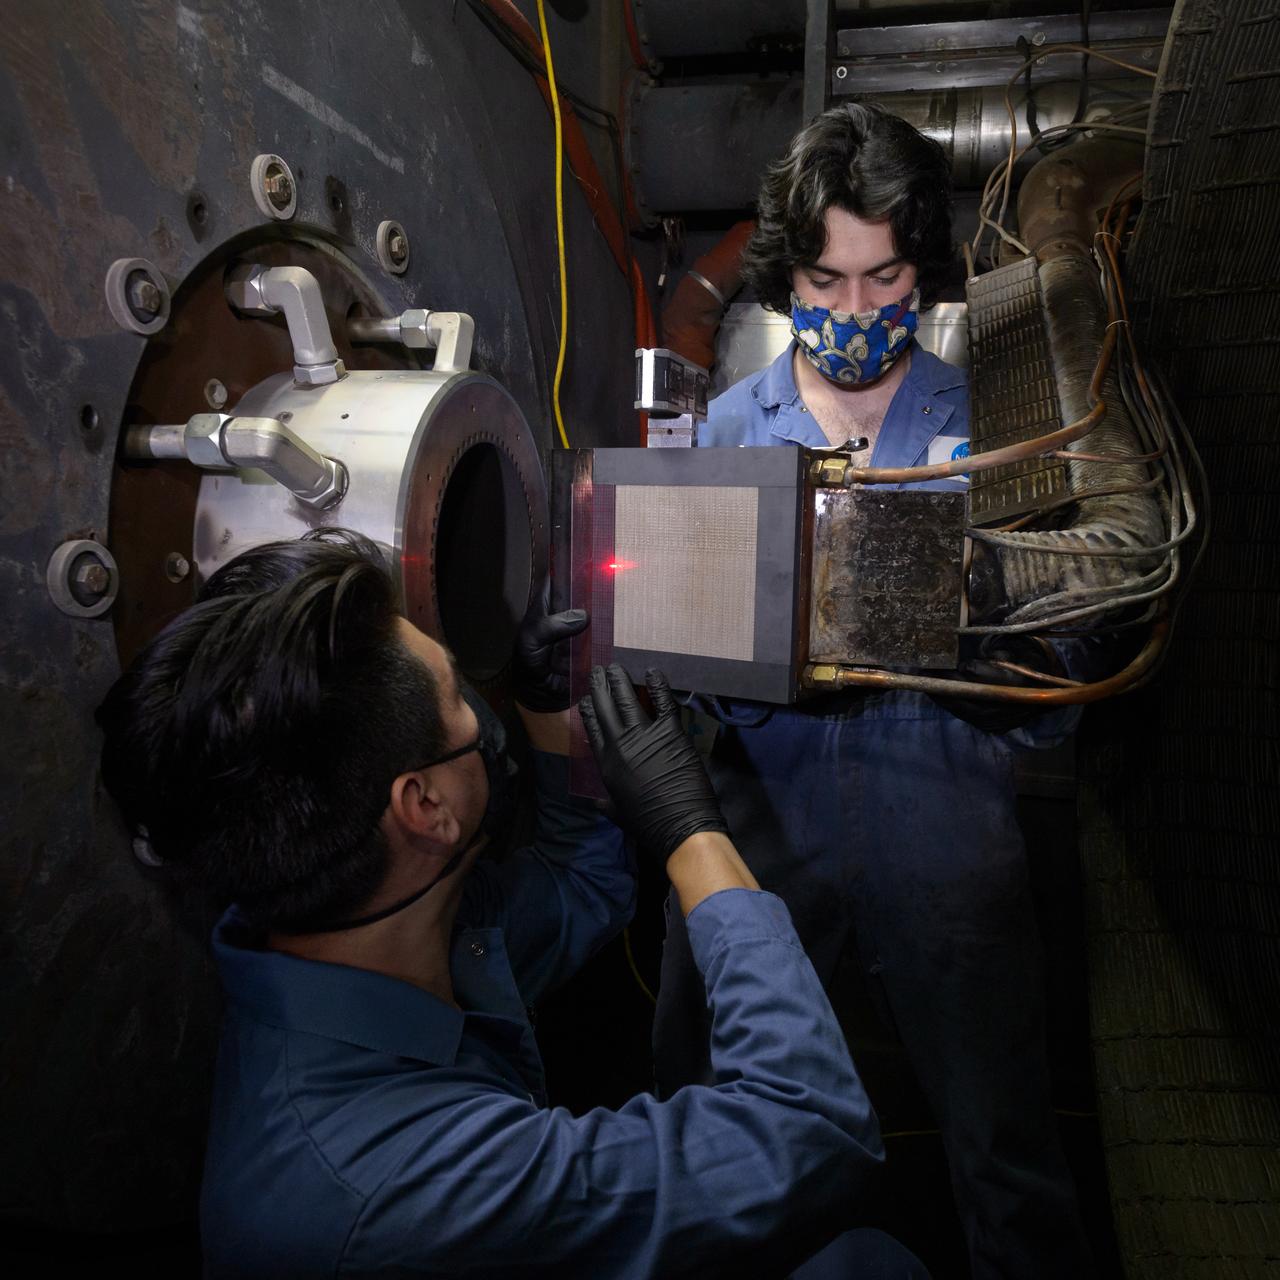
Engineering technicians Pedro Solano, left, and Aaron Poulin, right, verify alignment of an Orion heat shield test article in the Arc Jet Interaction Heating Facility, or IHF, test section. This test of Orion’s heat shield using a combination of the IHF and the Laser Enhanced Arc Jet Facility, or LEAF-Lite, capabilities will certify the heat shield for the Artemis I and Artemis II missions. This is also the first time the heat shield is tested in an environment combining the two forms of heating, radiant and convective, the spacecraft will experience on entering Earth’s atmosphere.
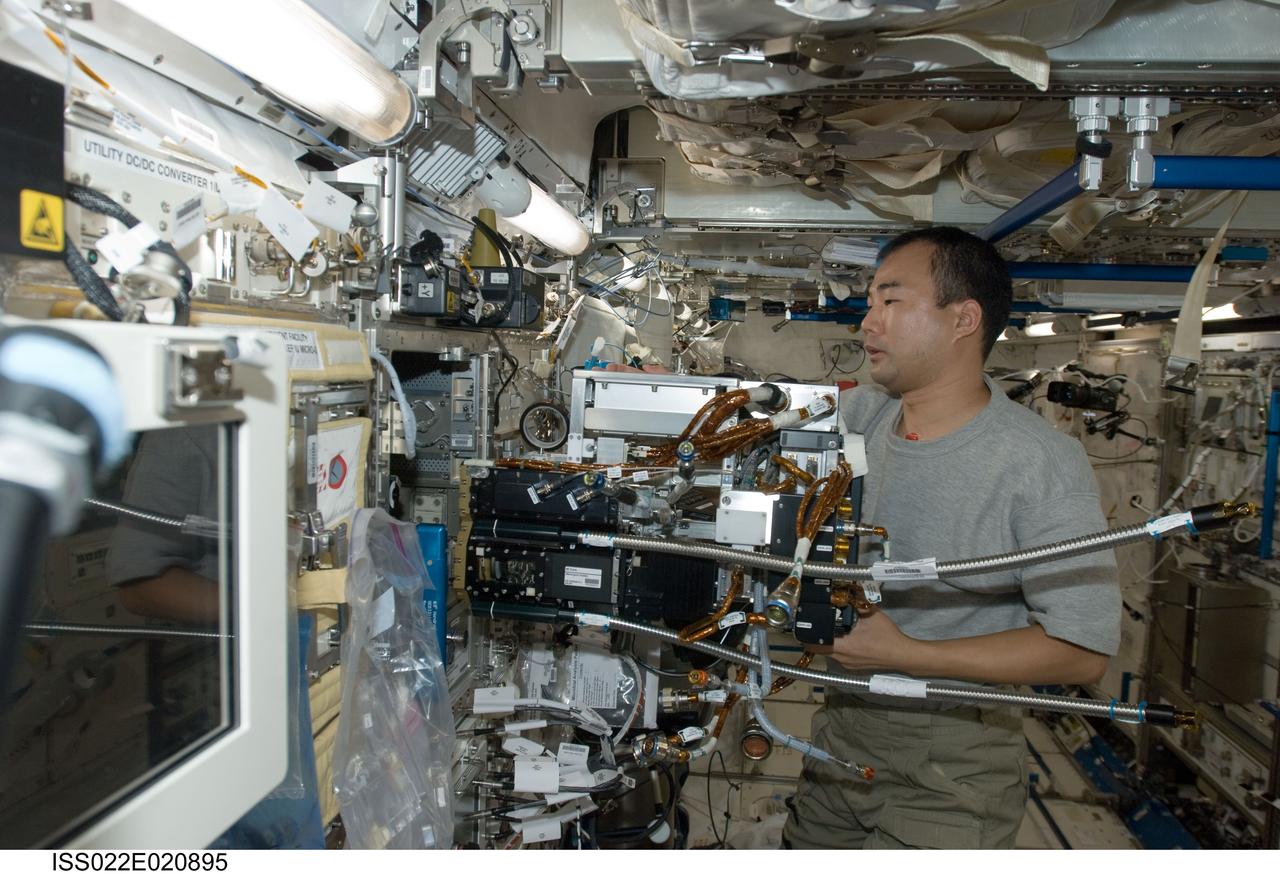
ISS022-E-020895 (11 Jan. 2010) --- Japan Aerospace Exploration Agency (JAXA) astronaut Soichi Noguchi, Expedition 22 flight engineer, works with Fluid Physics Experiment Facility/Marangoni Surface (FPEF MS) Core hardware in the Kibo laboratory of the International Space Station. The Marangoni convection experiment in the FPEF examines fluid tension flow in micro-G.

jsc2020e040948 (7/18/2020 --- A preflight view of BioAsteroid Experiment Unit integrated into the Experiment Container. The Experiment Container provides the necessary interface to the KUBIK. The BioAsteroid investigation studies how gravity affects the interaction between microbes and rock in a liquid medium. It is hoped that BioAsteroid can provide researchers a better understanding of basic physical processes - such as gravity, convection, and mixing - that control the way liquids mix with rocks and microbes. This will inform biomining, use of regolith in life support systems, and other bioprocessing applications involving rocks and regolith.

ISS028-E-048923 (13 Sept. 2011) --- Japan Aerospace Exploration Agency astronaut Satoshi Furukawa, Expedition 28 flight engineer, works with the Fluid Physics Experiment Facility/Marangoni Surface (FPEF MS) Core hardware in the Kibo laboratory of the International Space Station. The Marangoni convection experiment in the FPEF examines fluid tension flow in micro-G.
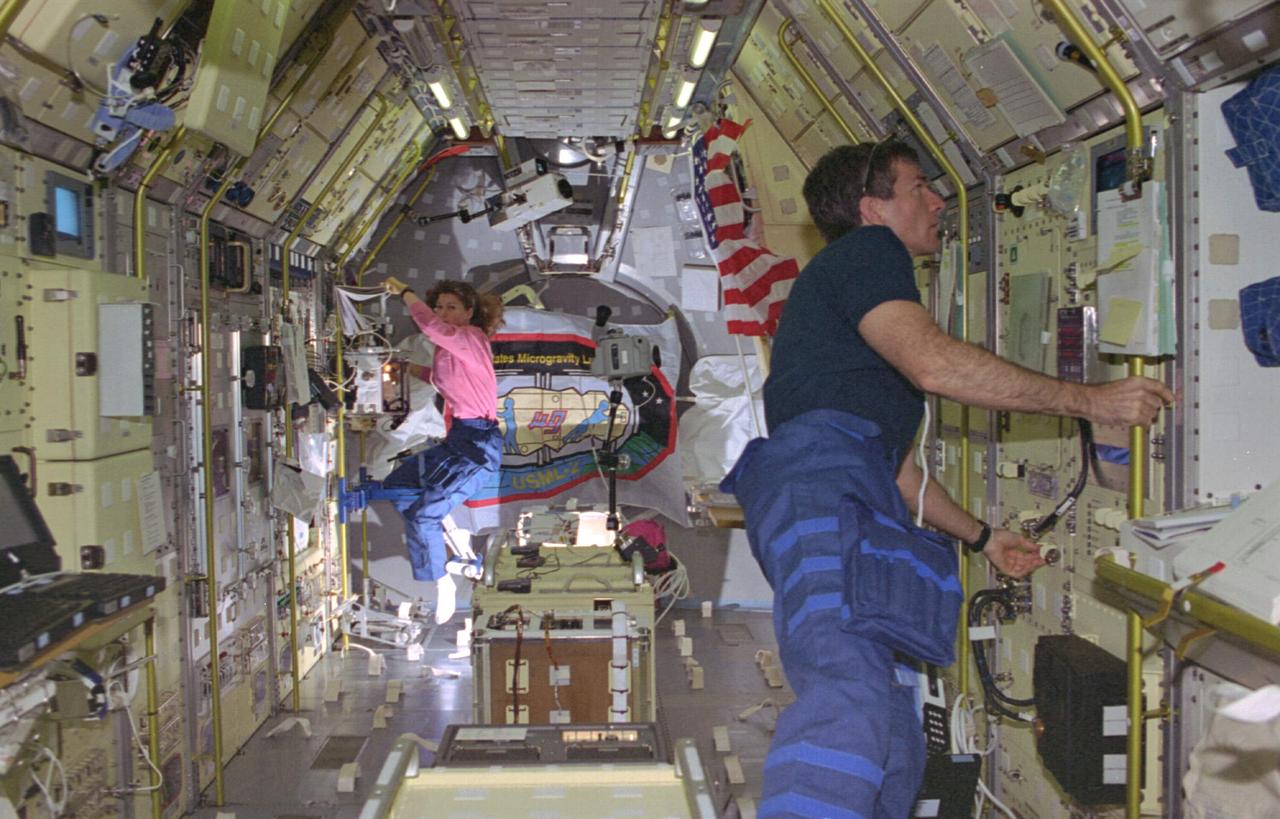
STS073-103-019 (20 October-5 November 1995) --- This wide view gives an overall perspective of the working environment of five astronauts and two guest researchers for 16 days in Earth-orbit. At work in support of the U.S. Microgravity Laboratory (USML-2) mission in this particular scene are astronaut Catherine G. Coleman, who busies herself at the glovebox, and payload specialist Fred W. Leslie, monitoring the Surface-Tension-Driven Convection Experiment (STDCE).
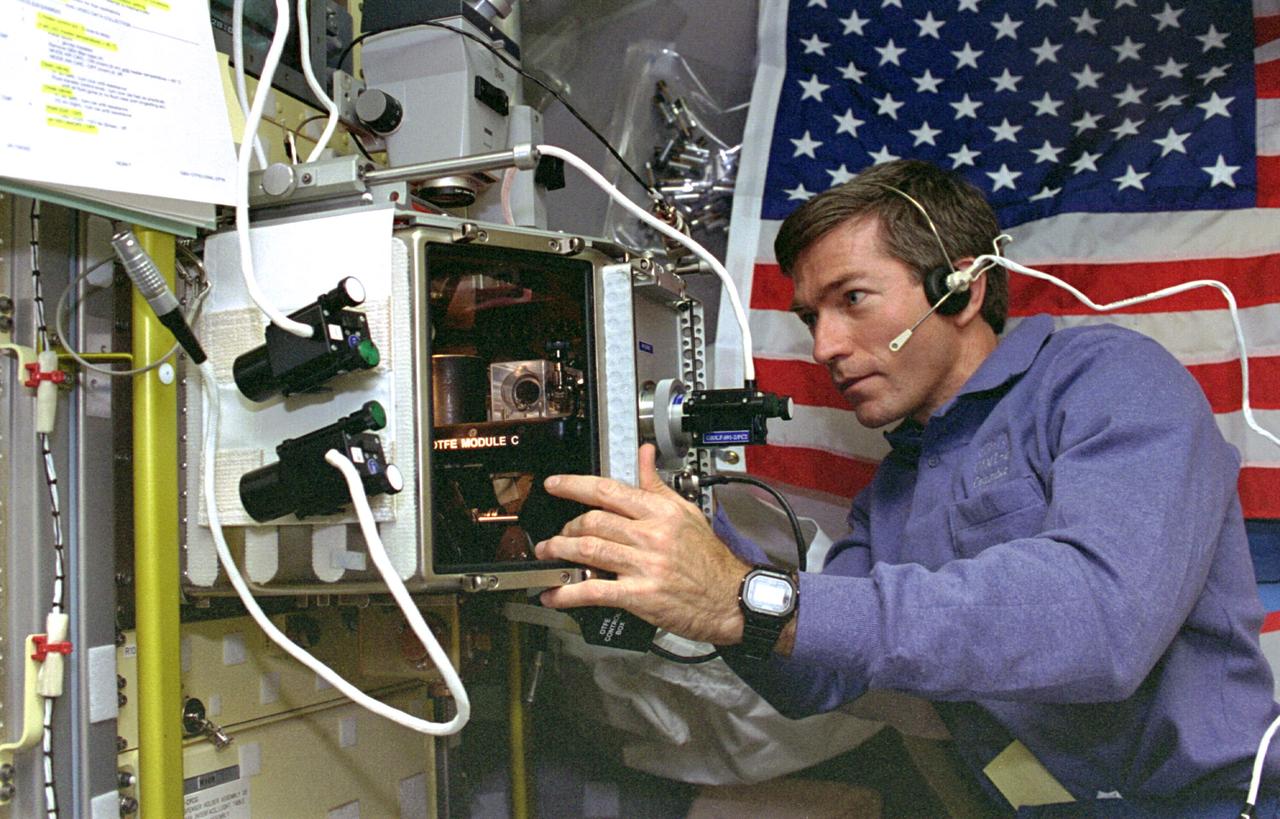
STS073-233-007 (20 October - 5 November 1995) --- Payload specialist Fred W. Leslie makes use of the versatile U.S. Microgravity Laboratory (USML-2) glovebox to conduct an investigation with the Oscillatory Thermocapillary Flow Experiment (OTFE). This complement of the Surface-Tension-Driven Convection Experiment (STDCE) studies the shapes that fluid surfaces in weightless environments assume within specific containers. Leslie was one of two guest researchers who joined five NASA astronauts for 16 days of on Earth-orbit research in support of USML-2.
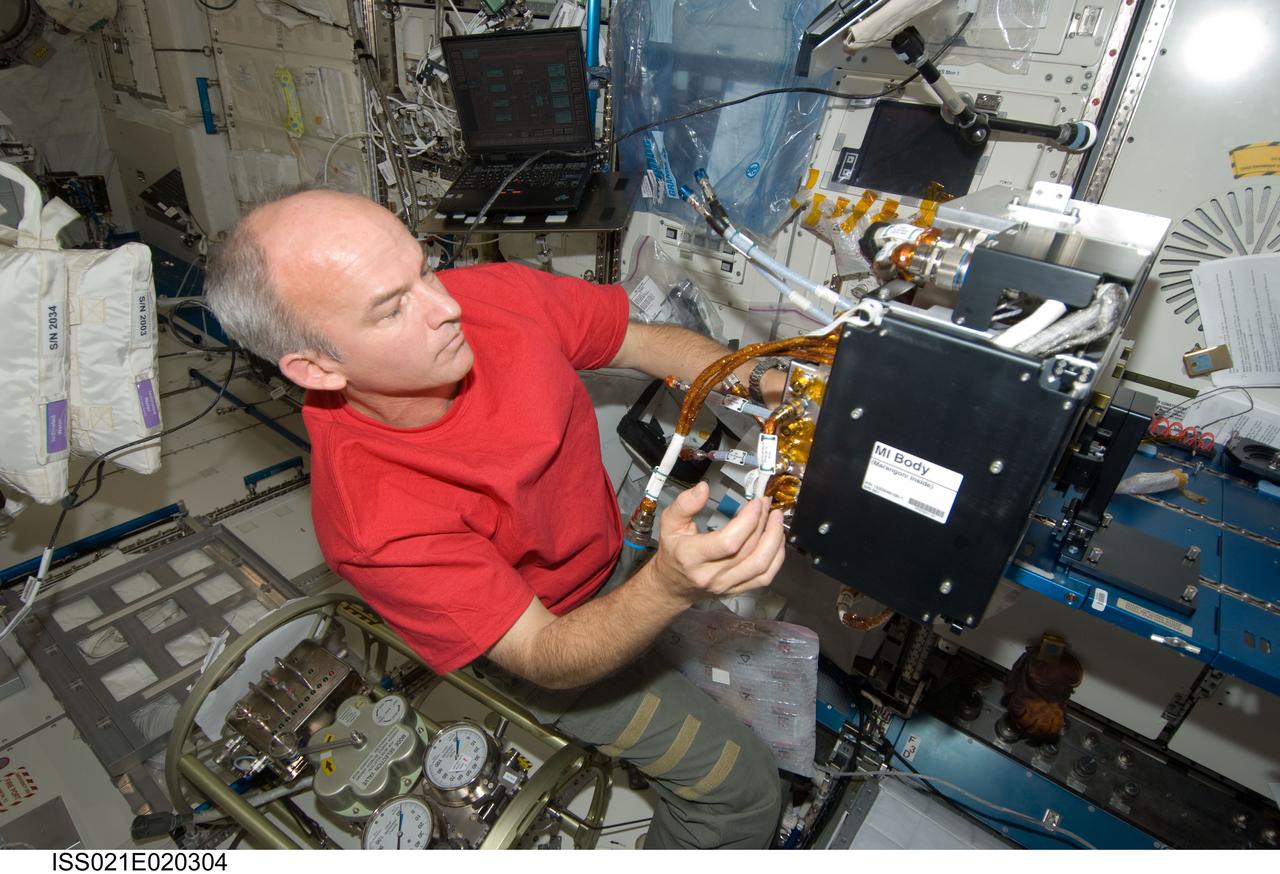
ISS021-E-020304 (5 Nov. 2009) --- NASA astronaut Jeffrey Williams, Expedition 21 flight engineer, works with Fluid Physics Experiment Facility/Marangoni Surface (FPEF MS) Core hardware in the Kibo laboratory of the International Space Station. Williams first inserted the Marangoni Inside (MI) cassette in the MI Core for a leak check, and then installed the MI Core into the FPEF MI Body. The Marangoni convection experiment in the FPEF examines fluid tension flow in micro-G.
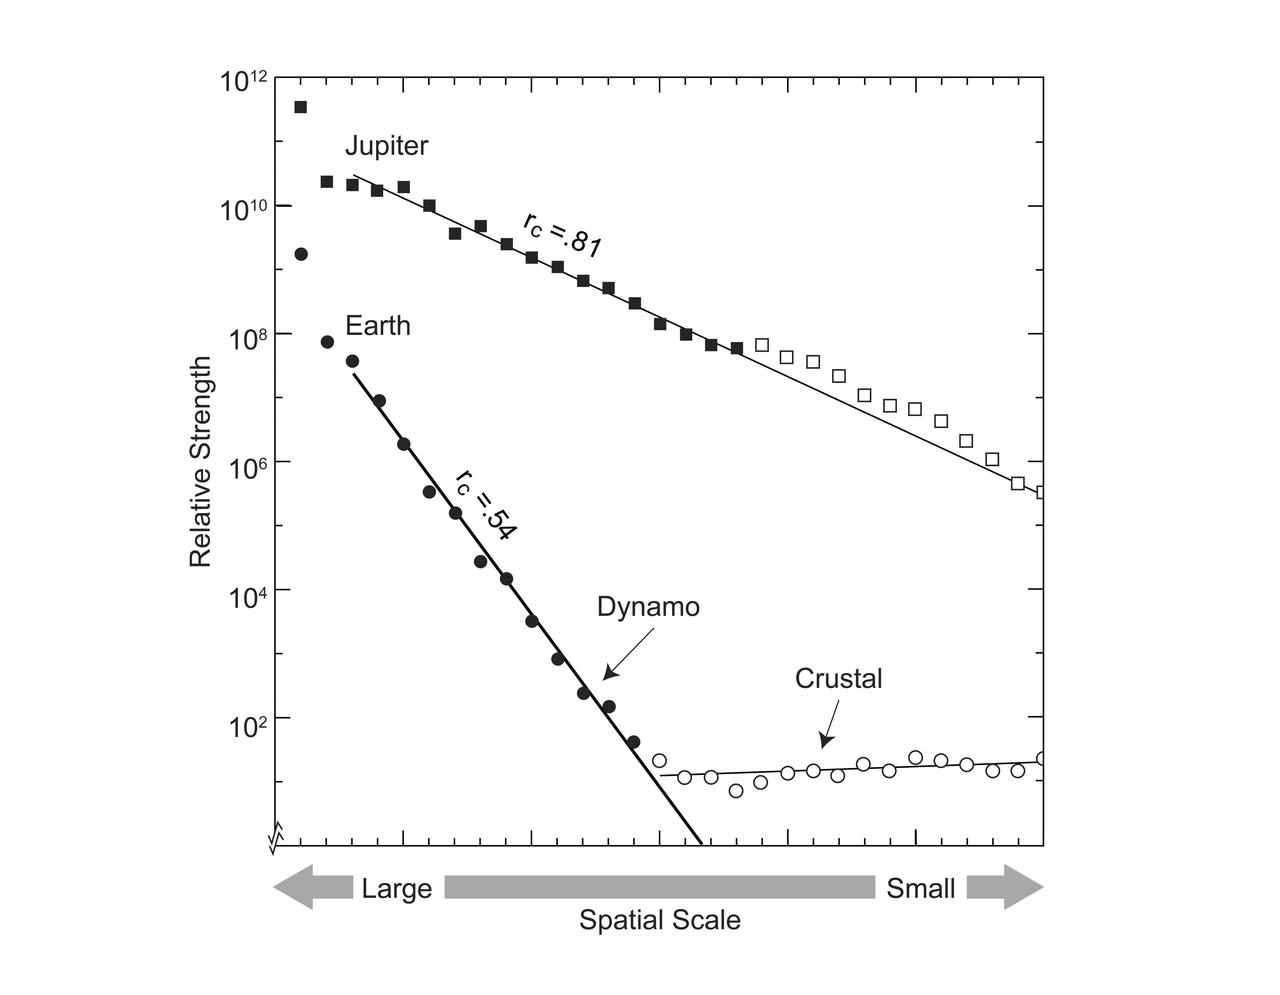
This graphic compares the magnetic fields of Earth and Jupiter, characterizing the field on the surface of each planet in terms of spatial scale, with large scale to the left, and small scale to the right. The linear progression of terms characterizing Earth's field identifies a dynamo core radius at 0.54 planet radius and crustal magnetization at smaller scales. By analogy, the new Jupiter model identifies a dynamo core radius at 0.81 planet radius, in the convective metallic hydrogen just beneath a zone stabilized by helium rain. https://photojournal.jpl.nasa.gov/catalog/PIA25064
Payload specialist Fred Leslie makes use of the versatile U.S. Microgravity Laboratory (USML-2) glovebox to conduct an investigation with the Oscillatory Thermocapillary Flow Experiment (OTFE). This complement of the Surface-Tension-Driven Convection Experiment (STDCE) studies the shapes that fluid surfaces in weightless environments assume within specific containers. Leslie was one of two guest researchers who joined five NASA astronauts for 16 days of on Earth-orbit research in support of USML-2.
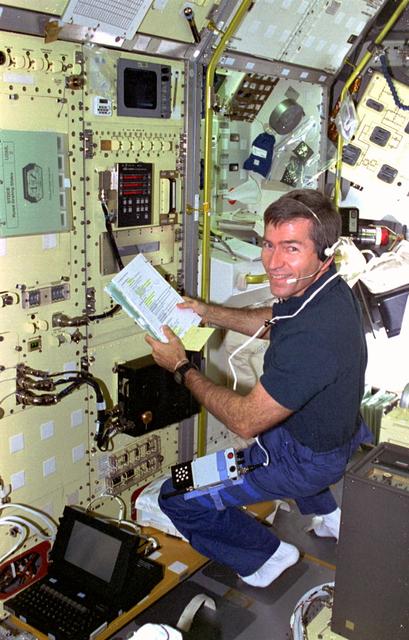
STS073-103-015 (20 October-5 November 1995) --- Payload specialist Fred W. Leslie works with the Surface Tension Driven Convection Experiment (STDCE) aboard the science module in the cargo bay of the Earth-orbiting Space Shuttle Columbia. Leslie joined another guest researcher and five NASA astronauts for 16 full days of in-space research in support of the United States Microgravity Laboratory (USML-2) mission.
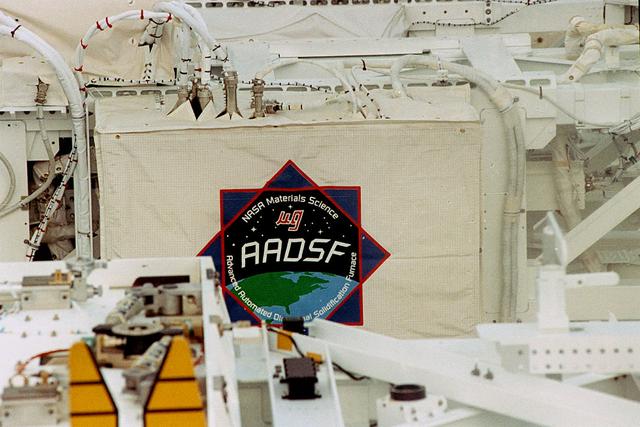
The purpose of the experiments for the Advanced Automated Directional Solidification Furnace (AADSF) is to determine how gravity-driven convection affects the composition and properties of alloys (mixtures of two or more materials, usually metal). During the USMP-4 mission, the AADSF will solidify crystals of lead tin telluride and mercury cadmium telluride, alloys of compound semiconductor materials used to make infrared detectors and lasers, as experiment samples. Although these materials are used for the same type application their properties and compositional uniformity are affected differently during the solidification process.
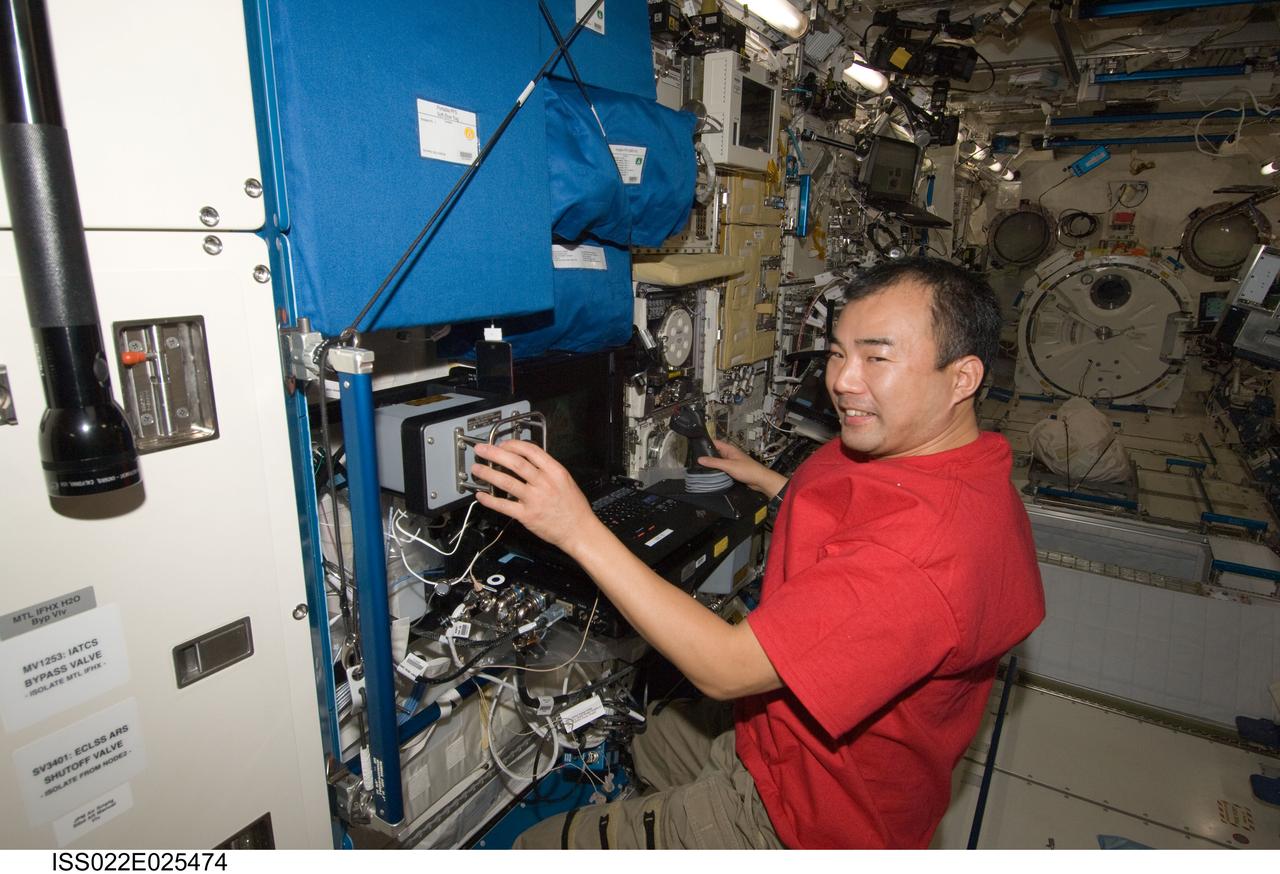
ISS022-E-025474 (14 Jan. 2010) --- Japan Aerospace Exploration Agency (JAXA) astronaut Soichi Noguchi, Expedition 22 flight engineer, services the Fluid Physics Experiment Facility/Marangoni Surface (FPEF MS) Core hardware in the Kibo laboratory of the International Space Station. The Marangoni convection experiment in the FPEF examines fluid tension flow in micro-G.
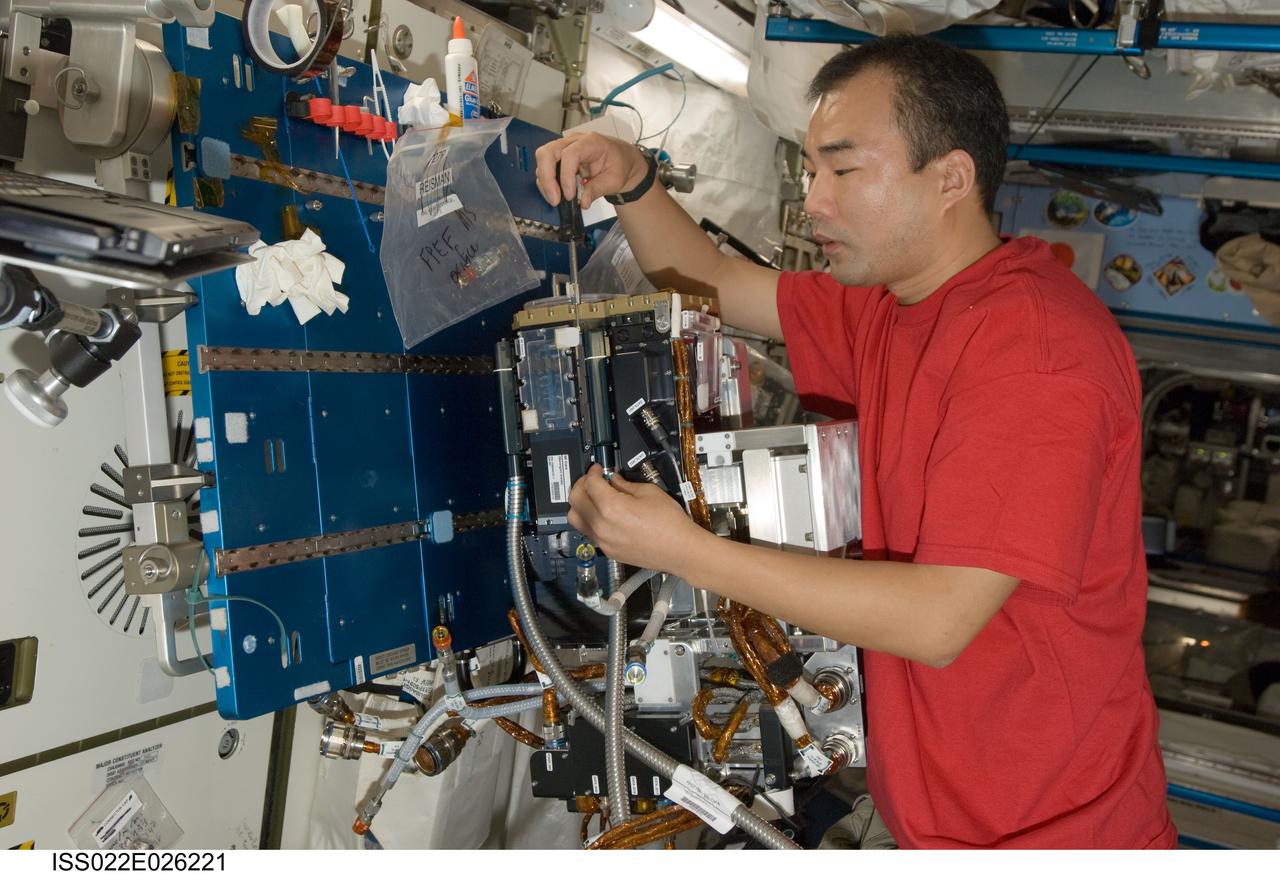
ISS022-E-026221 (15 Jan. 2010) --- Japan Aerospace Exploration Agency (JAXA) astronaut Soichi Noguchi, Expedition 22 flight engineer, services the Fluid Physics Experiment Facility/Marangoni Surface (FPEF MS) Core hardware in the Kibo laboratory of the International Space Station. The Marangoni convection experiment in the FPEF examines fluid tension flow in micro-G.
jsc2020e040947 (7/18/2019) A view of BioAsteroid Experiment Unit where the experiment is performed. Each Experiment Unit has 2 culture chambers. The BioAsteroid investigation studies how gravity affects the interaction between microbes and rock in a liquid medium. It is hoped that BioAsteroid can provide researchers a better understanding of basic physical processes - such as gravity, convection, and mixing - that control the way liquids mix with rocks and microbes. This will inform biomining, use of regolith in life support systems, and other bioprocessing applications involving rocks and regolith.
iss049e002305 (9/13/2016) --- A view taken during Selectable Optics Diagnostic Instrument (SODI) DSC Hardware Setup the MSG Work Volume. The Selectable Optical Diagnostics Instrument - Diffusion and Soret Coefficient (SODI-DSC) experiment will study diffusion in six different liquids over time in the absence of convection induced by the gravity field. The SODI-DSC investigation will provide information to scientist which can be used to more efficiently extract oil resources.
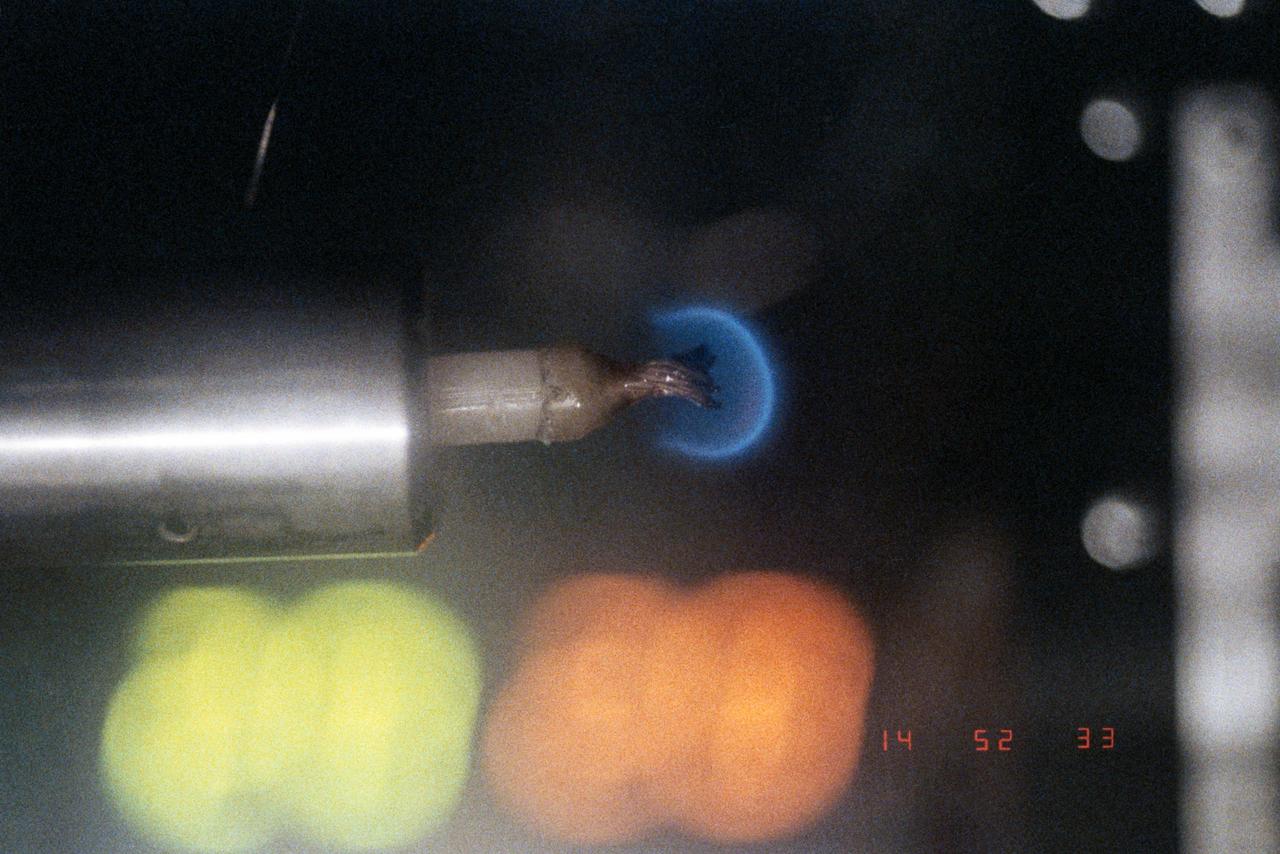
Closeup view inside glovebox showing a candle flame. The Candle Flames in Microgravity experiment is carried onboard Columbia to examine whether candle flames can be sustained in space; to study the interaction and physical properties of diffusion flames. In space, where buoyancy-driven convection is reduced, the role diffusion plays in sustaining candle flames can be isolated. Results have implications for other diffusion flame studies. Diffusion flames are the most common type of flame on Earth.
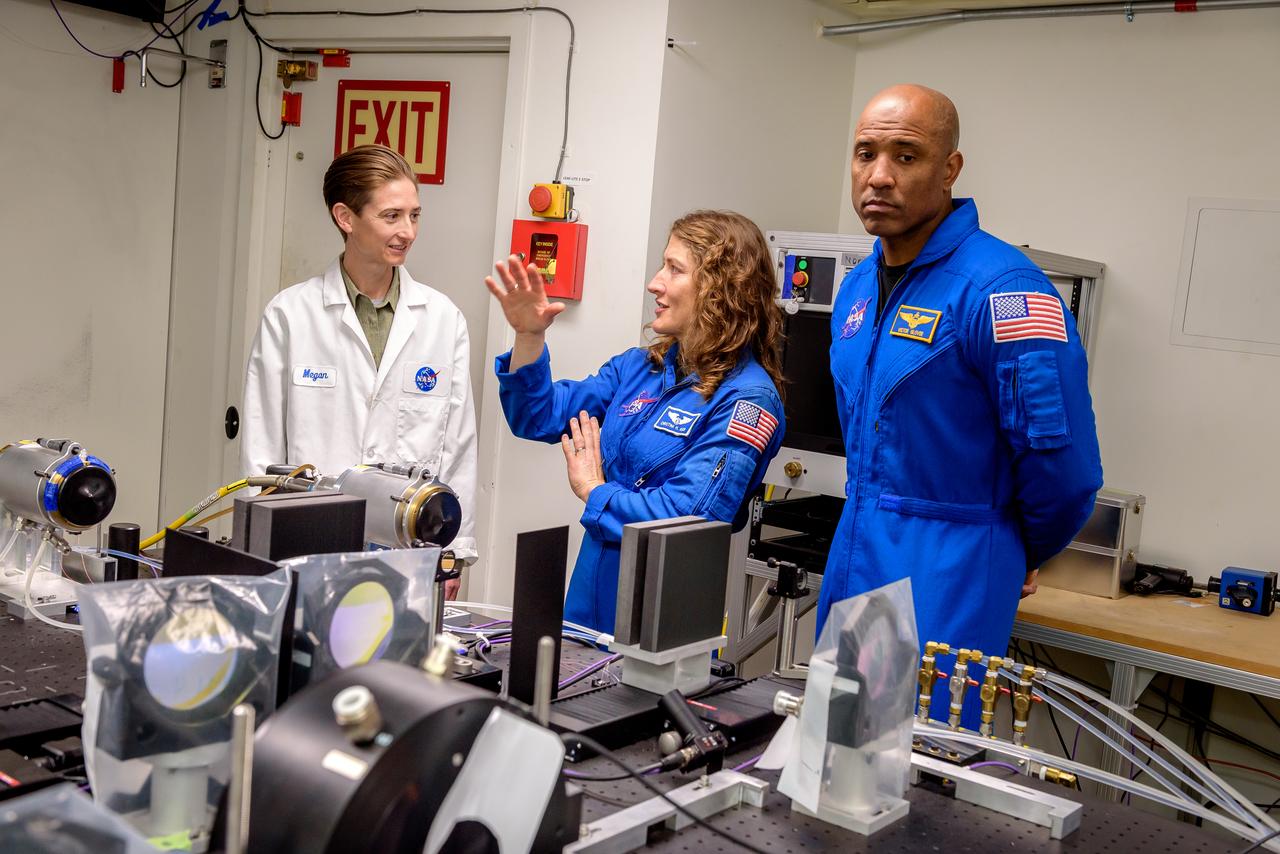
Megan MacDonald, left, leads NASA astronauts Christina Koch and Victor J. Glover, right, on a tour of the Laser Enhanced Arc Jet Facility (LEAF) laboratory, in N238. The LEAF laser augments the hypersonic shock heating experienced by a test sample during an arc jet test and provides improved test simulation quality by supplying an intense source of optical heating while the arc jet flow provides shock-driven convective heating.
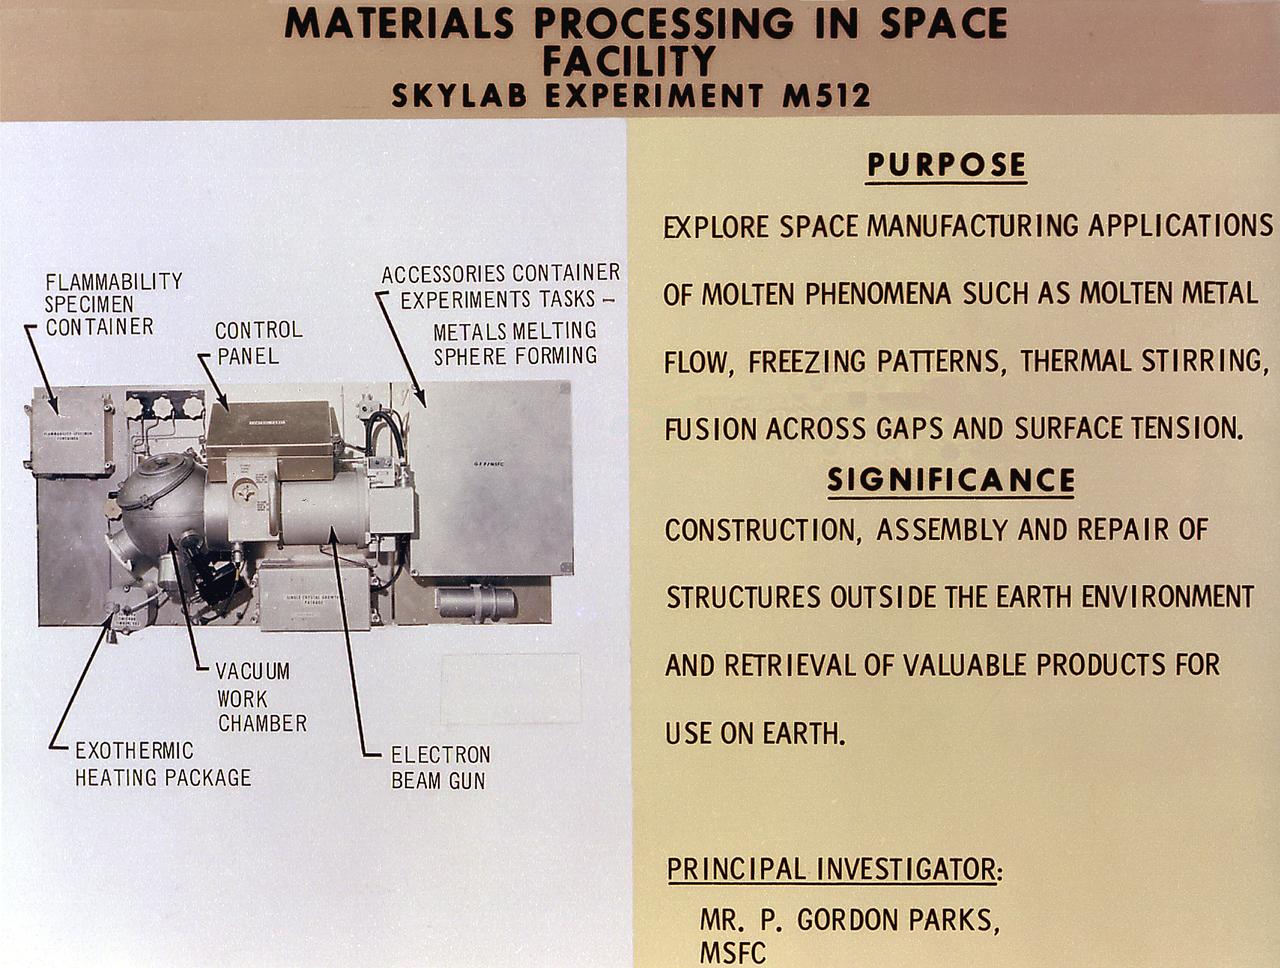
This chart details Skylab's Materials Processing Facility experiment (M512). This facility, located in the Multiple Docking Adapter, was developed for Skylab and accommodated 14 different experiments that were carried out during the three marned missions. The abilities to melt and mix without the contaminating effects of containers, to suppress thermal convection and buoyancy in fluids, and to take advantage of electrostatic and magnetic forces and otherwise masked by gravitation opened the way to new knowledge of material properties and processes. This beginning would ultimately lead to the production of valuable new materials for use on Earth.
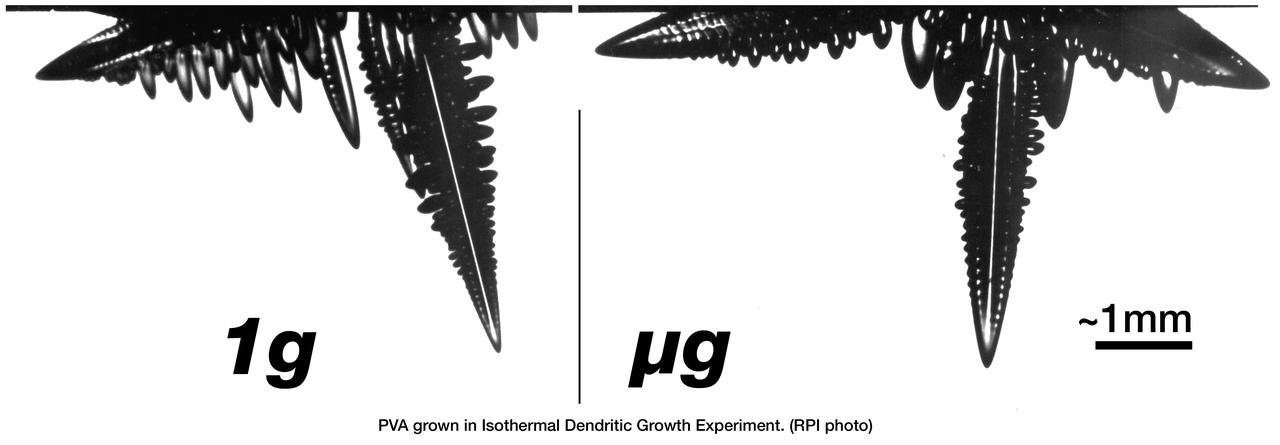
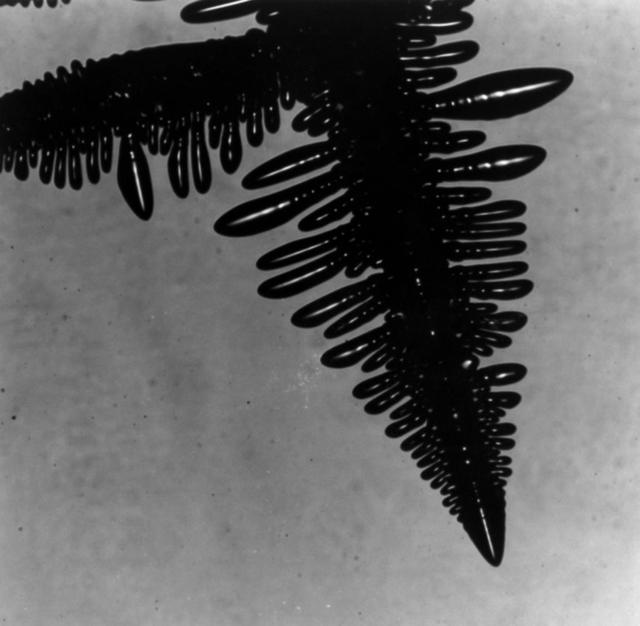
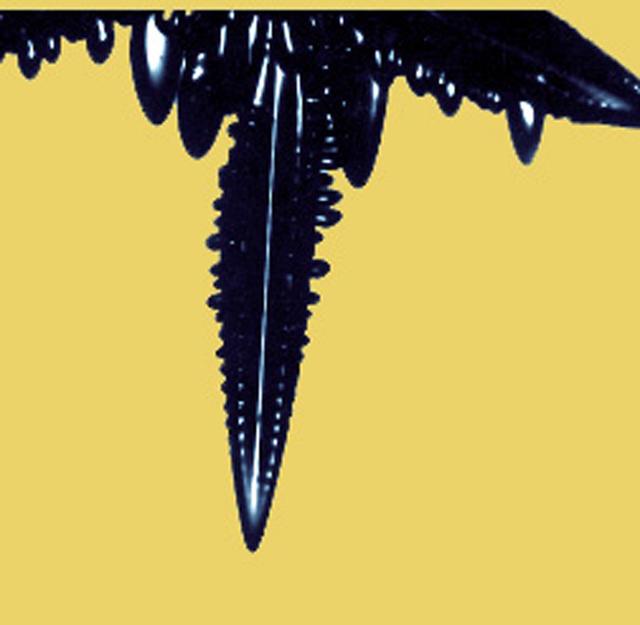
The Isothermal Dendritic Growth Experiment (IDGE), flown on three Space Shuttle missions, is yielding new insights into virtually all industrially relevant metal and alloy forming operations. IDGE used transparent organic liquids that form dendrites (treelike structures) similar to those inside metal alloys. Comparing Earth-based and space-based dendrite growth velocity, tip size and shape provides a better understanding of the fundamentals of dentritic growth, including gravity's effects. Shalowgraphic images of pivalic acid (PVA) dendrites forming from the melt show the subtle but distinct effects of gravity-driven heat convection on dentritic growth. In orbit, the dendrite grows as its latent heat is liberated by heat conduction. This yields a blunt dendrite tip. On Earth, heat is carried away by both conduction and gravity-driven convection. This yields a sharper dendrite tip. In addition, under terrestrial conditions, the sidebranches growing in the direction of gravity are augmented as gravity helps carry heat out of the way of the growing sidebranches as opposed to microgravity conditions where no augmentation takes place. IDGE was developed by Rensselaer Polytechnic Institute and NASA/Glenn Research Center. Advanced follow-on experiments are being developed for flight on the International Space Station. Photo Credit: NASA/Glenn Research Center
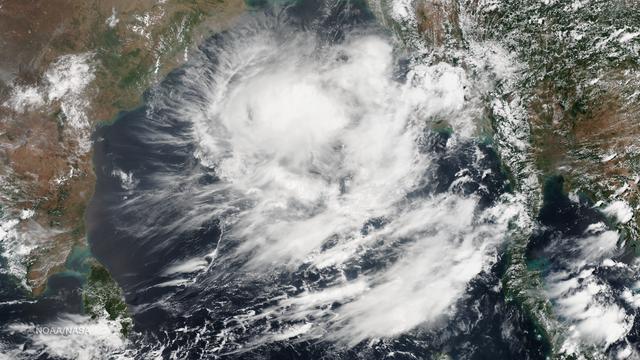
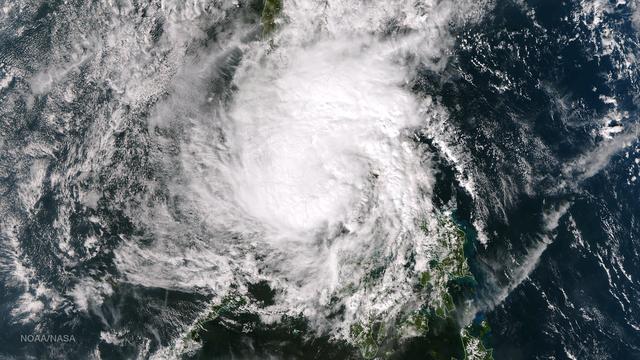
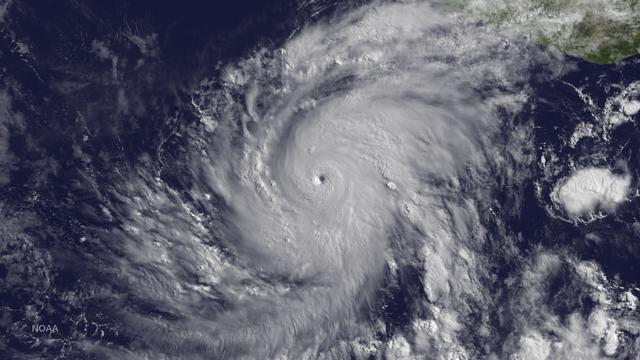
The Joint Typhoon Warning Center states that formation of a significant tropical cyclone is possible in the Bay of Bengal within the next 12 - 24 hours as of 0730Z on May 21, 2014. Along with deep convective banding associated with a consolidating low-level circulation center, warm sea surface temperatures are conducive for further development. This image was taken by the Suomi NPP satellite's VIIRS instrument in two passes, the east pass around 0615Z and the west pass around 0755Z on May 21, 2014. Credit: NASA/NOAA/NPP/VIIRS The Joint Typhoon Warning Center states that formation of a significant tropical cyclone is possible in the Bay of Bengal within the next 12 - 24 hours as of 0730Z on May 21, 2014. Along with deep convective banding associated with a consolidating low-level circulation center, warm sea surface temperatures are conducive for further development. This image was taken by the Suomi NPP satellite's VIIRS instrument in two passes, the east pass around 0615Z and the west pass around 0755Z on May 21, 2014.
Advanced finite element models are used to study three-dimensional, time-dependent flow and segregation in crystal growth systems. In this image of a prototypical model for melt and crystal growth, pathlines at one instant in time are shown for the flow of heated liquid silicon in a cylindrical container. The container is subjected to g-jitter disturbances along the vertical axis. A transverse magnetic field is applied to control them. Such computations are extremely powerful for understanding melt growth in microgravity where g-jitter drives buoyant flows. The simulation is part of the Theoretical Analysis of 3D, Transient Convection and Segregation in Microgravity Bridgman Crystal Growth investigation by Dr. Jeffrey J. Derby of the University of Mirnesota, Minneapolis.
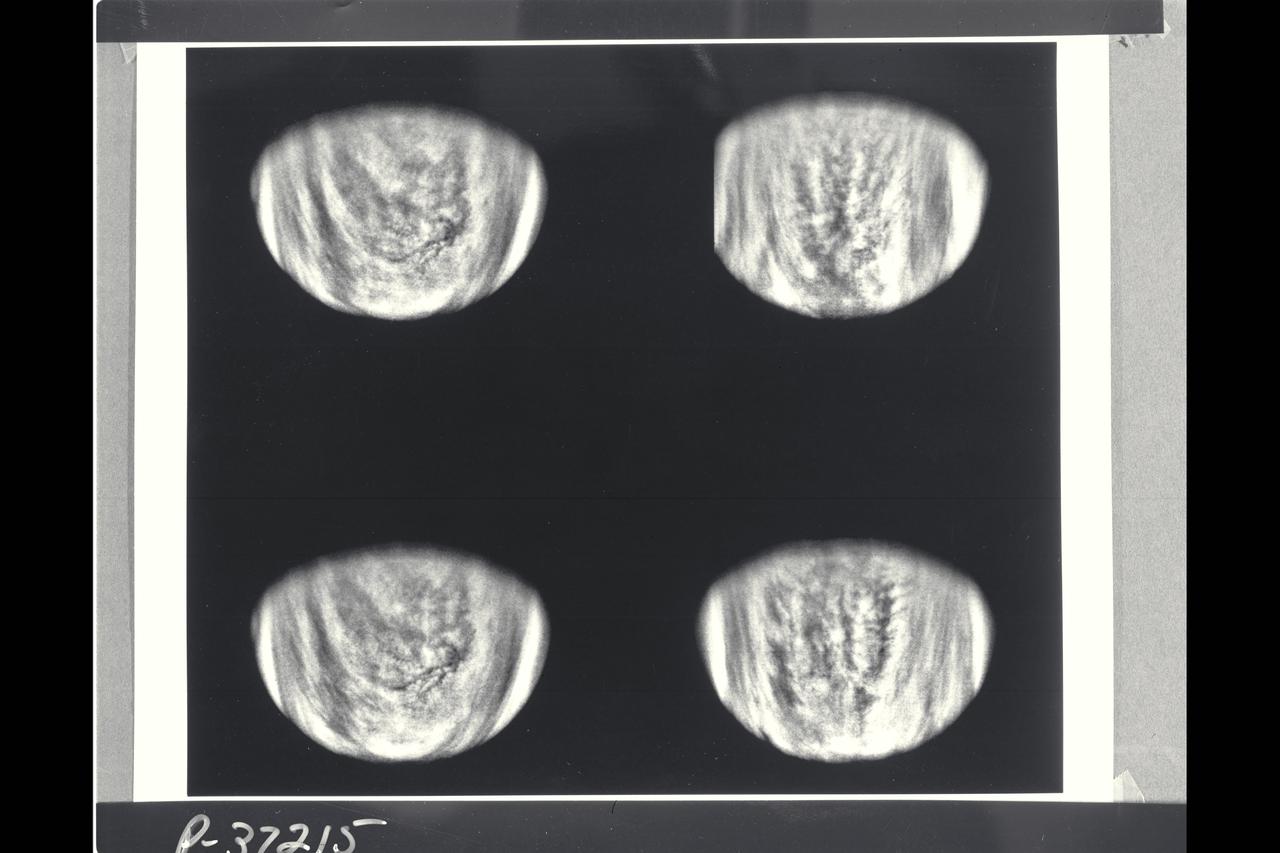
Range : 1.4 to 2 million miles These are enhanced versions of four views of Venus taken by Galileo's Solid State Imaging System. The pictures in the top row were taken about 4 and 5 days after closest approach, and those in the bottom row 6 days after closest approach, 2 hours apart. These show the faint Venusian cloud features vary clearly. A high-pass filter way applied to bring out broader global variations in tone. The bright polar hoods are a well-known feature of Venus. Of particular interest to planetary atmospheric scientists are the complex cloud patterns near the equator, in the vicinity of the bright subsolar point, where convection is most prevalent.
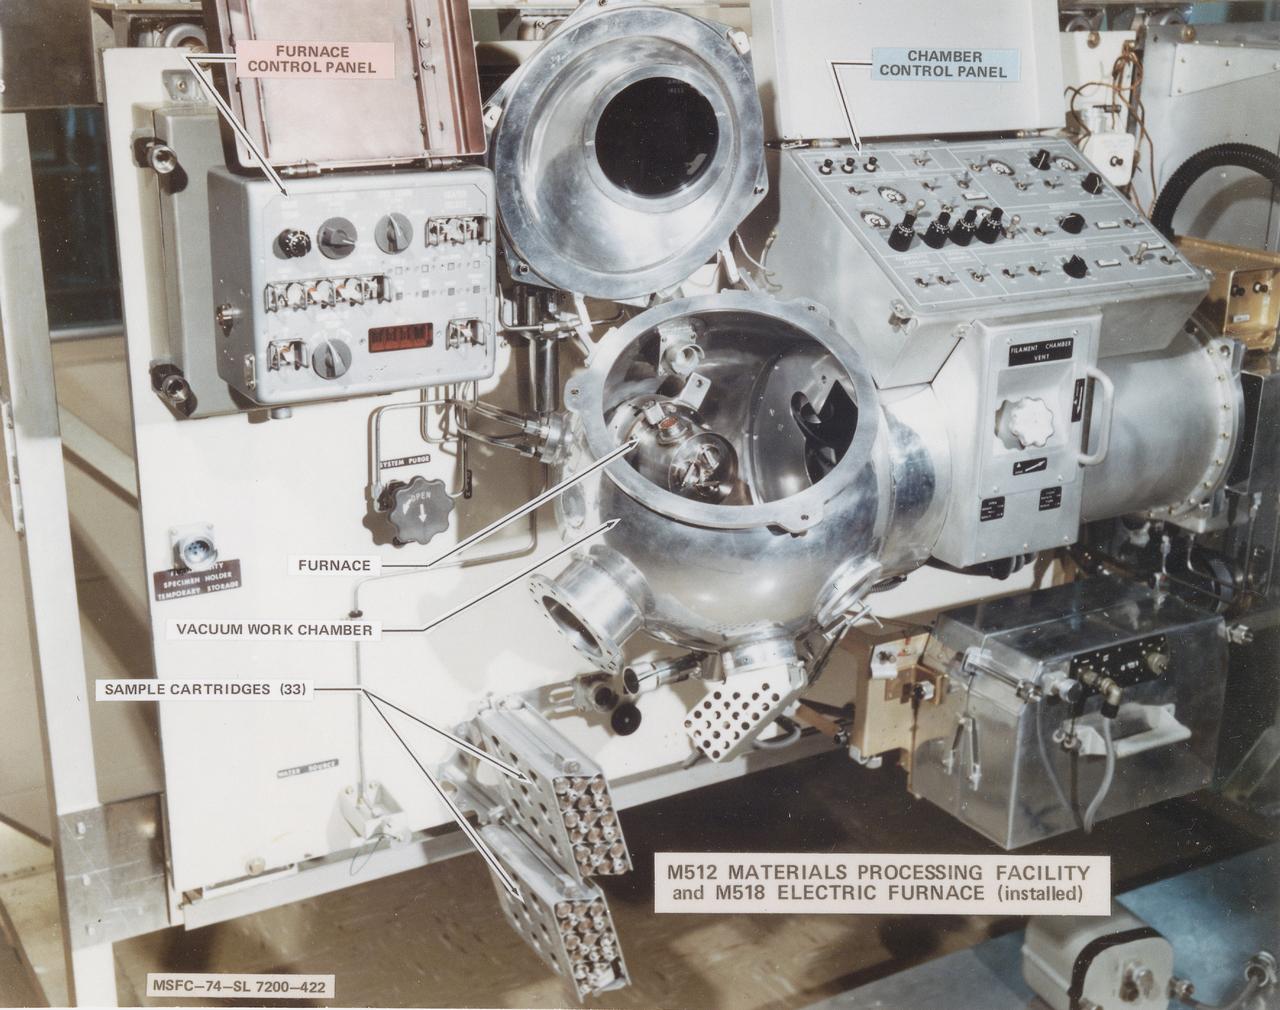
This photograph shows the Skylab Materials Processing Facility (M512) and the Multipurpose Furnace System (M518). This facility, located in the Multiple Docking Adapter, was developed for Skylab,and accommodated 14 different experiments that were carried out during the three marned missions. The abilities to melt and mix without the contaminating effects of containers, to suppress thermal convection and buoyancy in fluids, and to take advantage of electrostatic and magnetic forces and otherwise masked by gravitation opened the way to new knowledge of material properties and processes. This beginning would ultimately lead to the production of valuable new materials for use on Earth.
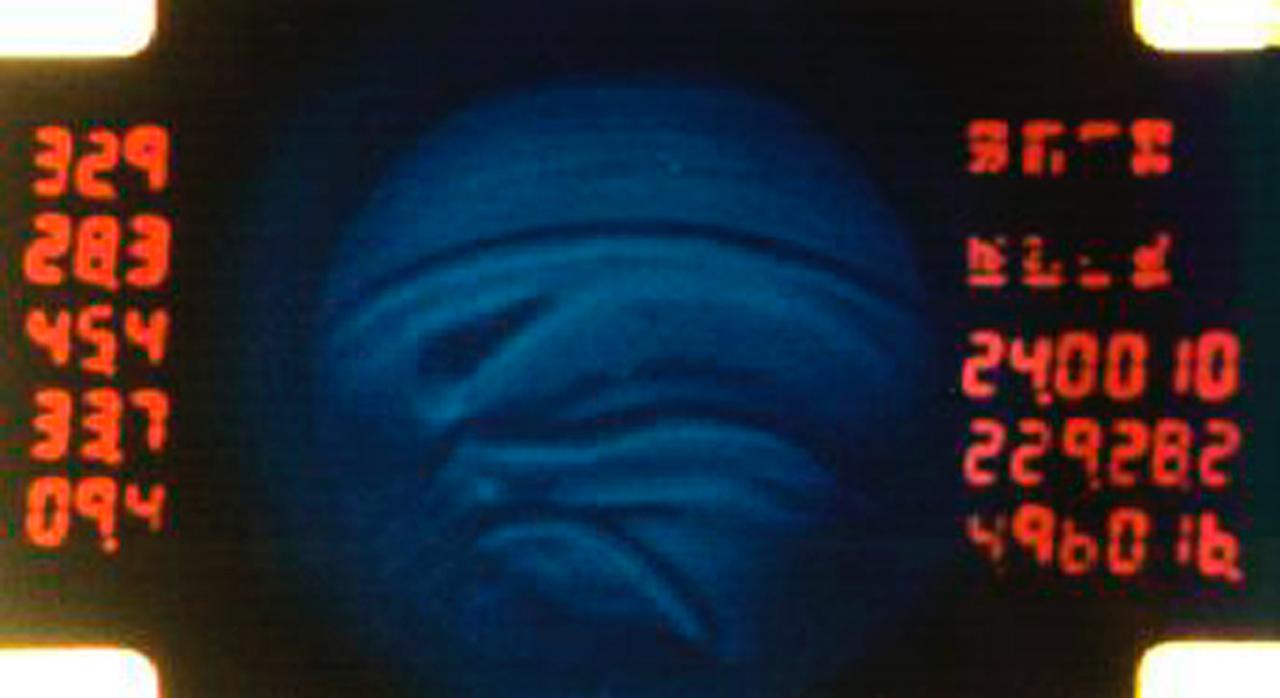
A 16mm film frame shows convective regions inside silicone oil playing the part of a stellar atmosphere in the Geophysical Fluid Flow Cell (GFFC). An electrostatic field pulled the oil inward to mimic gravity's effects during the experiments. The GFFC thus produced flow patterns that simulated conditions inside the atmospheres of Jupiter and the Sun and other stars. Numbers of the frame indicate temperatures and other conditions. This image is from the Spacelab-3 flight in 1985. GFFC was reflown on U.S. Microgravity Laboratory-2 in 1995. The principal investigator was John Hart of the University of Colorado at Boulder. It was managed by NASA's Marshall Space Flight Center. (Credit: NASA/Marshall Space Flight Center)
The lack of normal convection in microgravity is demonstrated by a carbonated soft drink floating in the middeck of the Space Shuttle. While the droplet is oscillating slightly and starting to assume a spherical shape, it is filled with carbon dioxide bubbles in a range of sizes. On Earth, the bubbles would quickly foat up to form a head. In space, they are suspended. They may drift with time and eventually the surface tension between individual bubbles breaks, allowing larger bubbles to form. This image was taken during STS-51F mission (Spacelab 2) which carried test models of dispensers from two pupular soft drink manufacturers. Photo credit: NASA/Johnson Space Center (JSC)
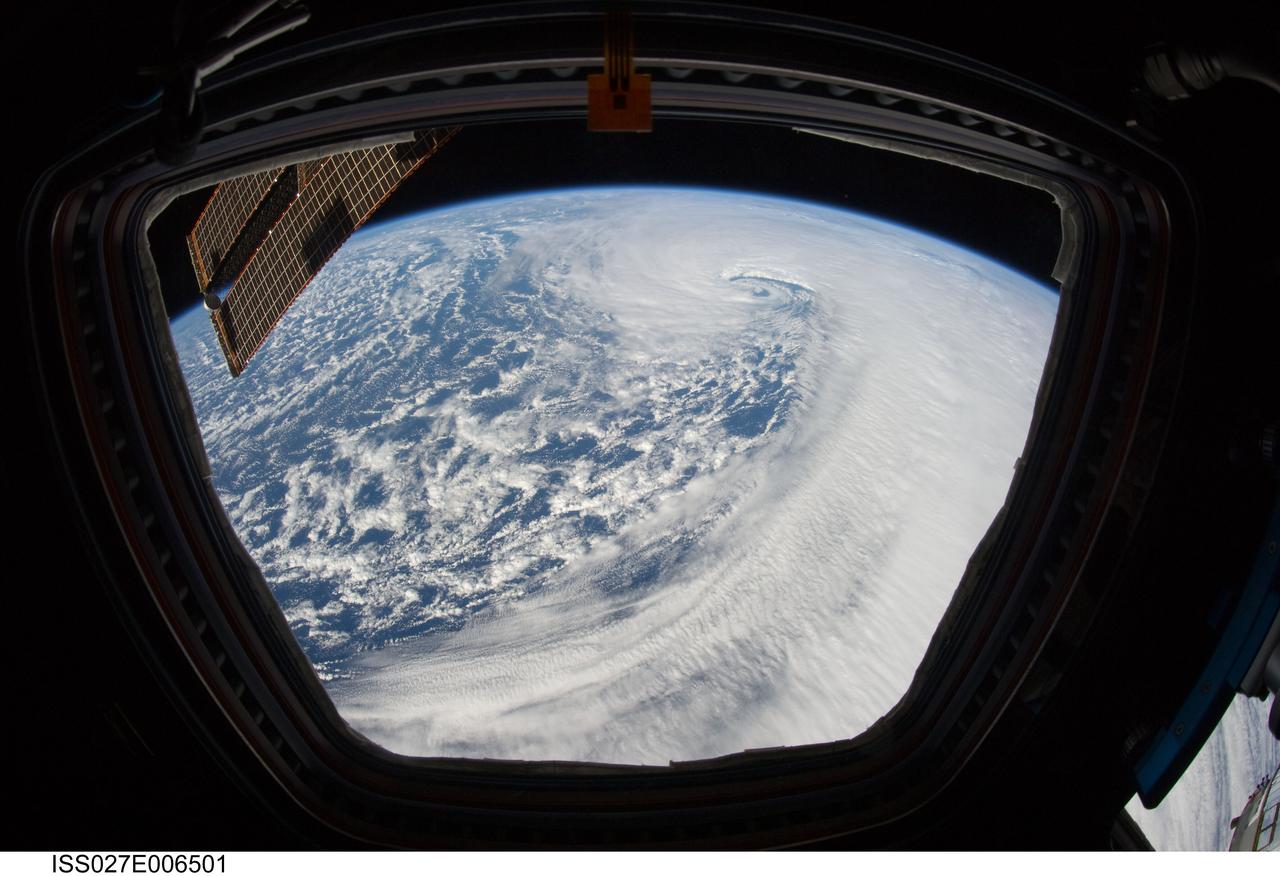
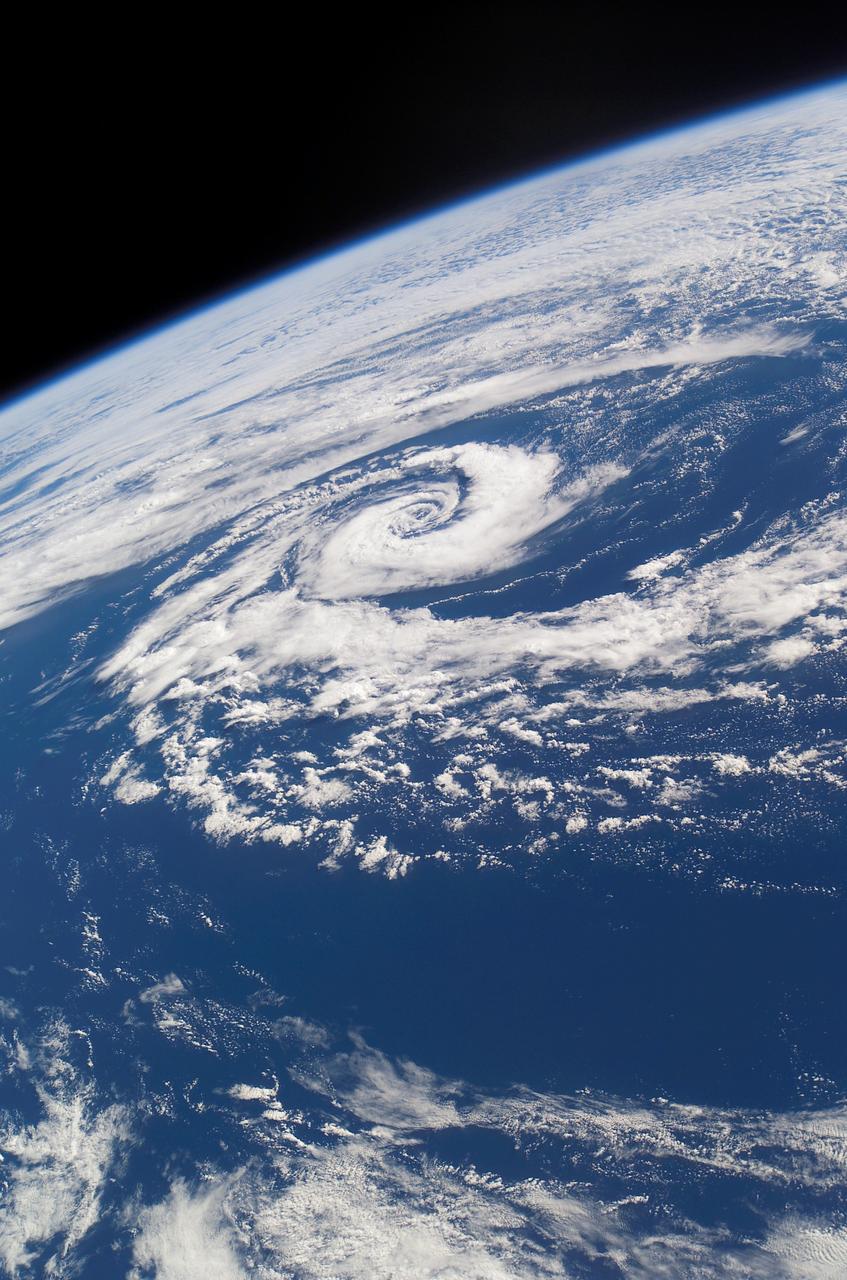
ISS027-E-006501 (20 March 2011) --- A low pressure system in the eastern North Pacific Ocean is featured in this image photographed by an Expedition 27 crew member in the Cupola of the International Space Station. This vigorous low pressure system has started to occlude?a process associated with separation of warm air from the cyclone?s center at the Earth?s surface. This view shows the arc of strong convection beyond the center of the low pressure, formed as the low occludes when the cold front overtakes the warm front. This occurs around more mature low pressure areas, later in the process of the system?s life-cycle.
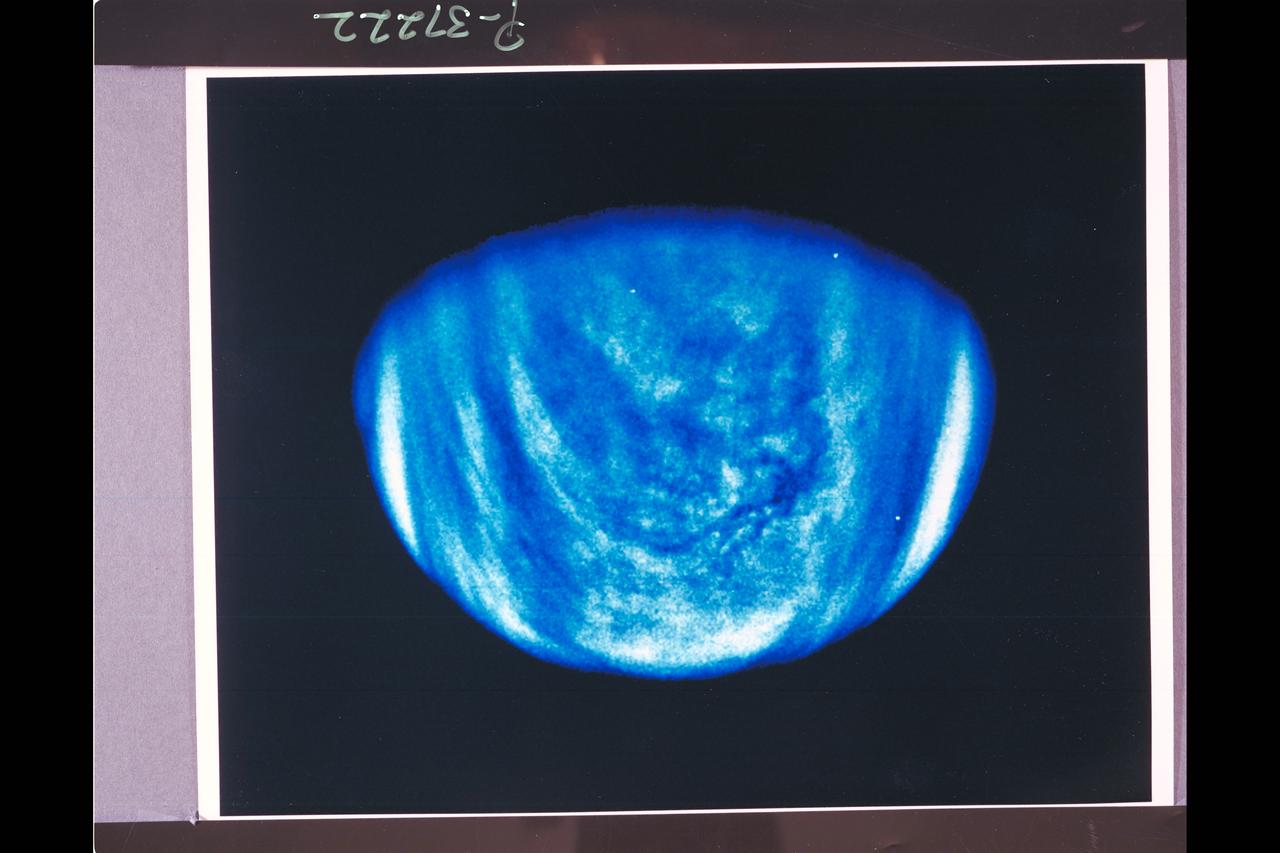
Range : 1.7 million miles This photo of Venus was taken by the Galileo spacecraft's Solid State Imaging System. A high-pass spatial filter has been applied in order to emphasize the smaller-scale cloud features, and the rendition has been colorized to a bluish hue in order to emphasize the subtle contrasts in the cloud markings and to indicate how it was taken through a violet filter. The sulfuric acid clouds indicate considerable convective activity, in the equatorial regions of the planet to the left and downwind of the subsolar point (afternoon on Venus), They are analogous to 'fair weather clouds' on Earth. The filamentary dark features visible in the colorized image are here revealed to be composed of several dark nodules, like strings on a bead, each about 60 miles across.
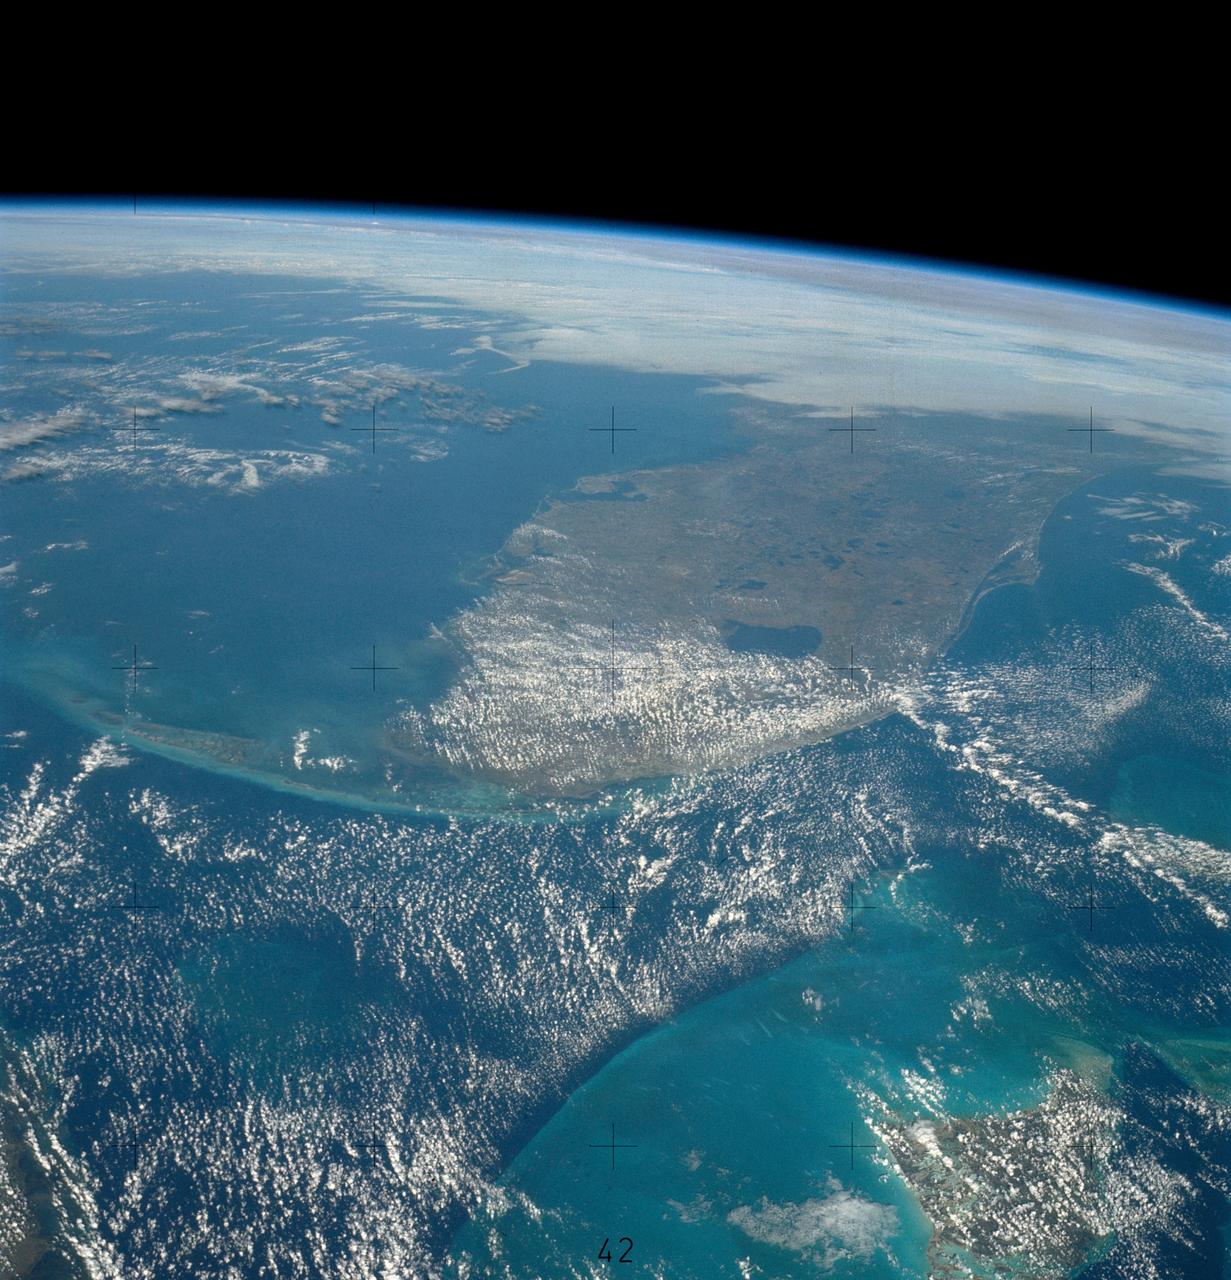
SL4-139-4029 (10 Jan. 1974) --- An oblique view of the State of Florida, looking northward up the peninsula, as photographed from the Skylab space station in Earth orbit by one of the Skylab 4 crewman. The camera used was a hand-held 70mm Hasselblad, with SO-368 medium-speed Ektachrome. This view shows almost the entire state, except the panhandle region. The Bahama Banks area appears in the southeast part of the picture as the light blue water. Andros Island in the Bahamas group is the island in the lower right corner. The Gulfstream flows between Florida and the Bahama Banks. This fast-moving, warm-water current transports energy from the tropics to the northern latitudes. The effect of the warmer Gulfstream waters on the atmosphere is seen as increased convection (caused by the warmer water heating the air from below) resulting in the fair weather cumulus seen confined primarily over the Gulfstream. A portion of Cuba is seen in the lower left corner of the picture. Photo credit: NASA
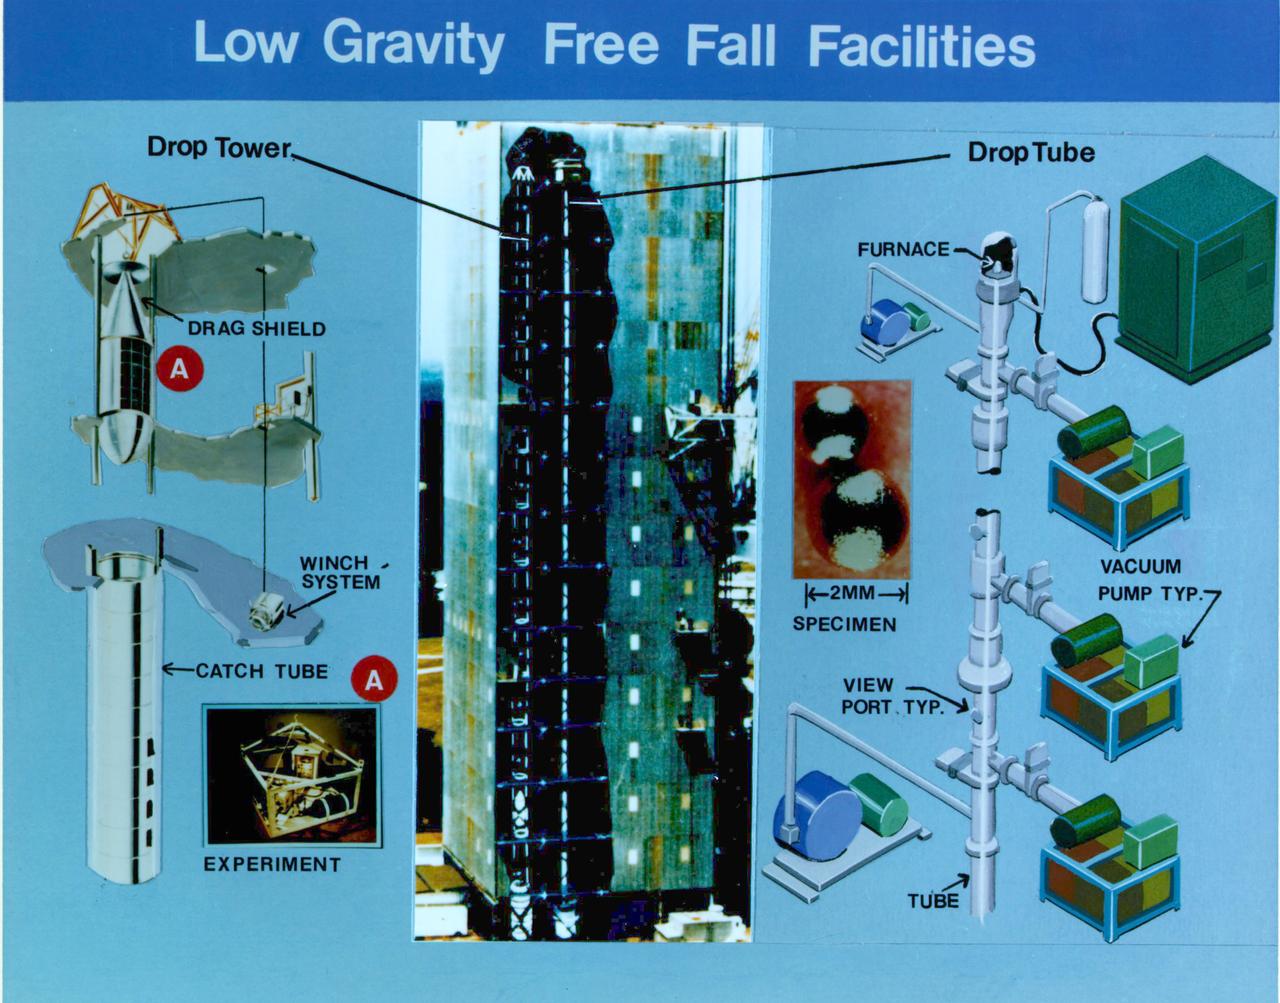
Composite of Marshall Space Flight Center's Low-Gravity Free Fall Facilities.These facilities include a 100-meter drop tower and a 100-meter drop tube. The drop tower simulates in-flight microgravity conditions for up to 4.2 seconds for containerless processing experiments, immiscible fluids and materials research, pre-flight hardware design test and flight experiment simulation. The drop tube simulates in-flight microgravity conditions for up to 4.6 seconds and is used extensively for ground-based microgravity convection research in which extremely small samples are studied. The facility can provide deep undercooling for containerless processing experiments that require materials to remain in a liquid phase when cooled below the normal solidification temperature.
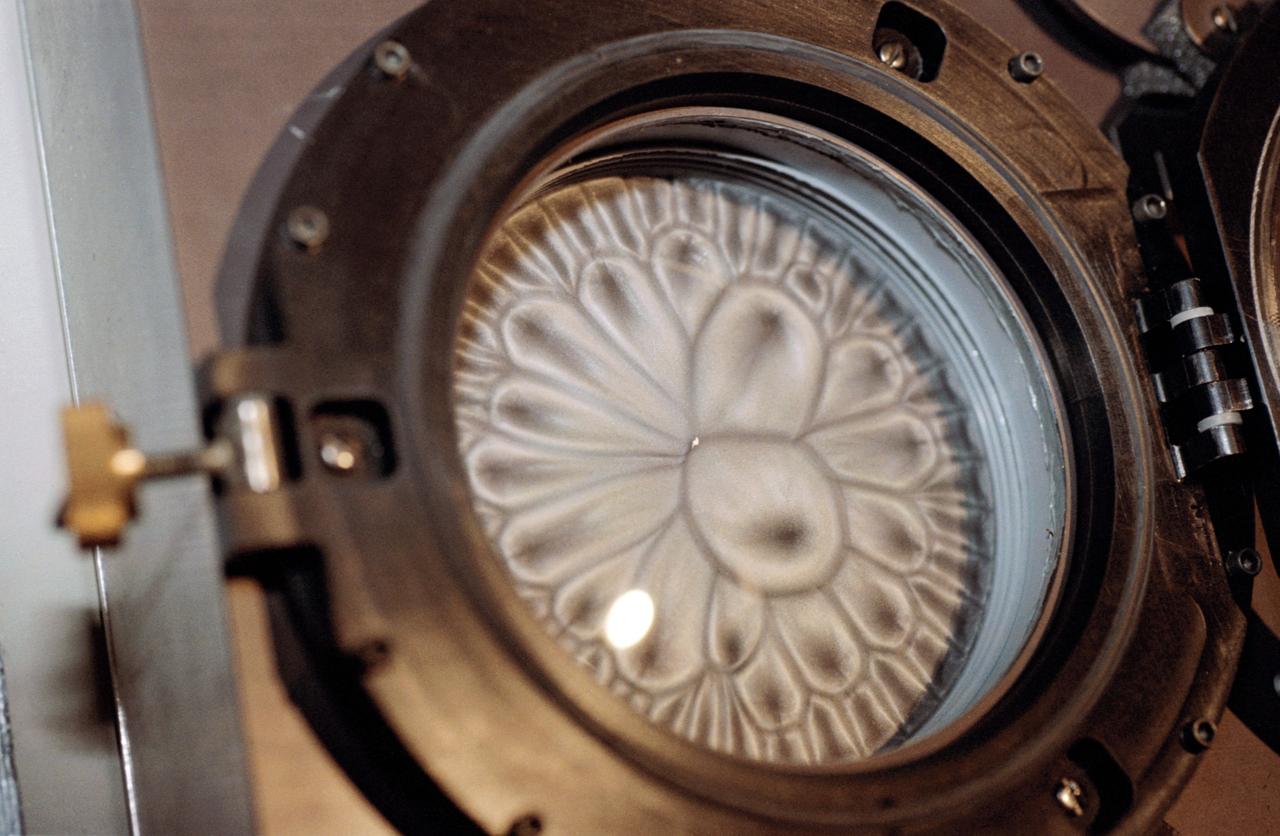
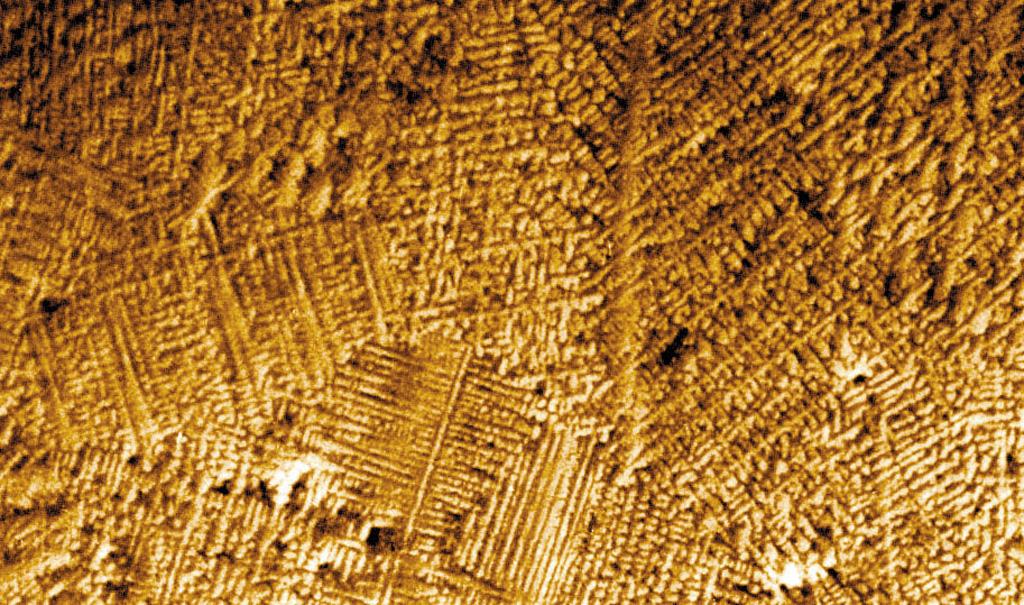
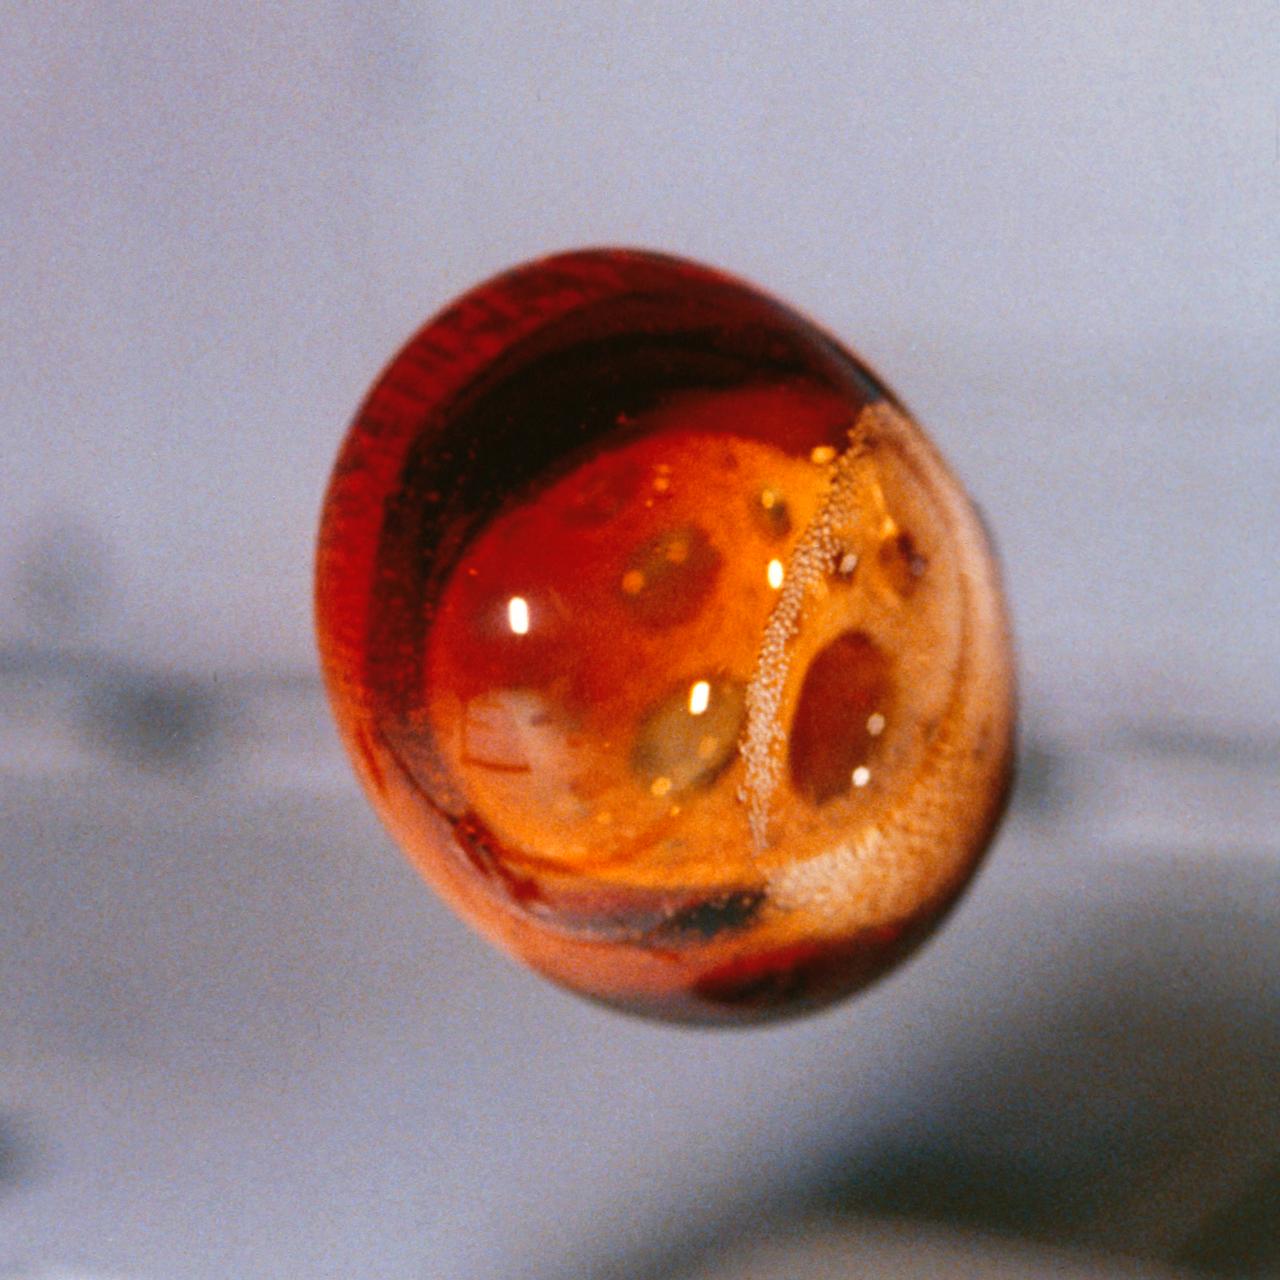
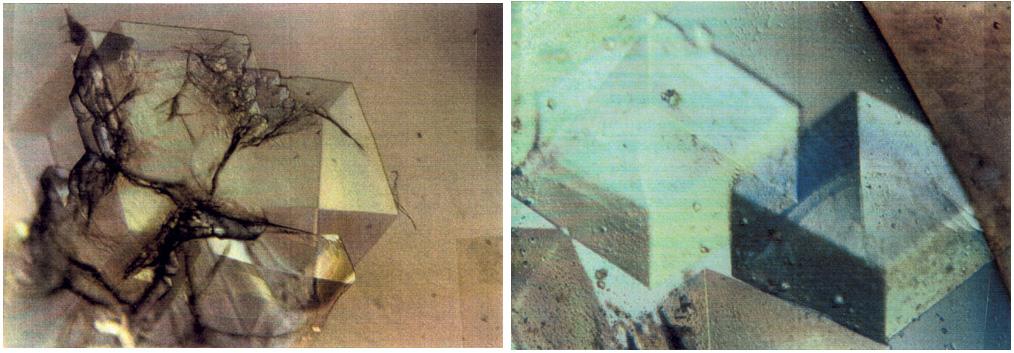
Dr. Alexander Chernov, of the Universities Space Research Association (USRA) and based at Marshall Space Flight Center, is investigating why protein crystals grown in space are, in about 20 percent of cases, better-ordered than those grown on the ground. They are testing the idea that the amount of impurities trapped by space-grown crystals may be different than the amount trapped by crystals grown on Earth because convection is negligible in microgravity. The concentrations or impurities in many space-grown crystals turned out to be several times lower than that in the terrestrial ones, sometimes below the detection limit. The ground-based experiment also showed that the amount of impurities per unit volume of the crystals was usually higher than the amount per unit volume of the solution. This means that a growing crystal actually purifies the solution in its immediate vicinity. Here, an impurity depletion zone is created around apoferritin crystals grown in gel, imitating microgravity conditions.
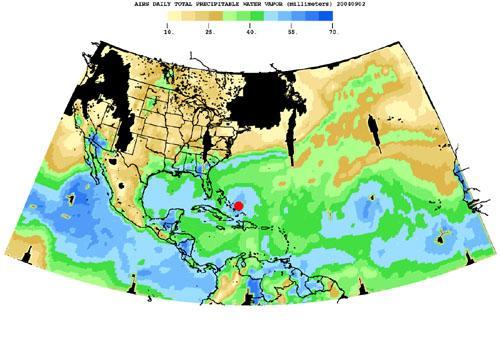
Born in the Atlantic, Hurricane Frances became a category 4 hurricane on August 31, 2004, as seen by the Atmospheric Infrared Sounding System AIRS on NASA Aqua. Expectations are the hurricane will hit the Space Coast of Florida in Brevard County early Sunday morning. This frame from a movie is a time-series of maps that show AIRS observations of the total amount of water vapor present in the atmospheric column above each point of the Earth's surface. If all the water vapor in the column were forced to fall as rain, the depth of the resulting puddle on the surface at that point is equal to the value shown on the map. Fifty millimeters (mm) is about 2 inches. The large band of maximum water vapor in the neighborhood of the equator is the Intertropical Convergence Zone (ITCZ), a region of strong convection and powerful thunderstorms. The movie (see PIA00433) shows the total precipitable water vapor from August 23 through September 2, 2004. You can see Hurricane Frances as it moves through the Caribbean toward Florida, and the changes in intensity are visible. The eye has been marked with a red spot. The water vapor encompassed by the hurricane is also the result of the very strong convection which is an integral part of the formation and intensification of tropical storms. If you look at the last frame of the movie in the lower right corner, you can see the emergence of a new tropical storm. Ivan makes its debut in the Atlantic. http://photojournal.jpl.nasa.gov/catalog/PIA00433
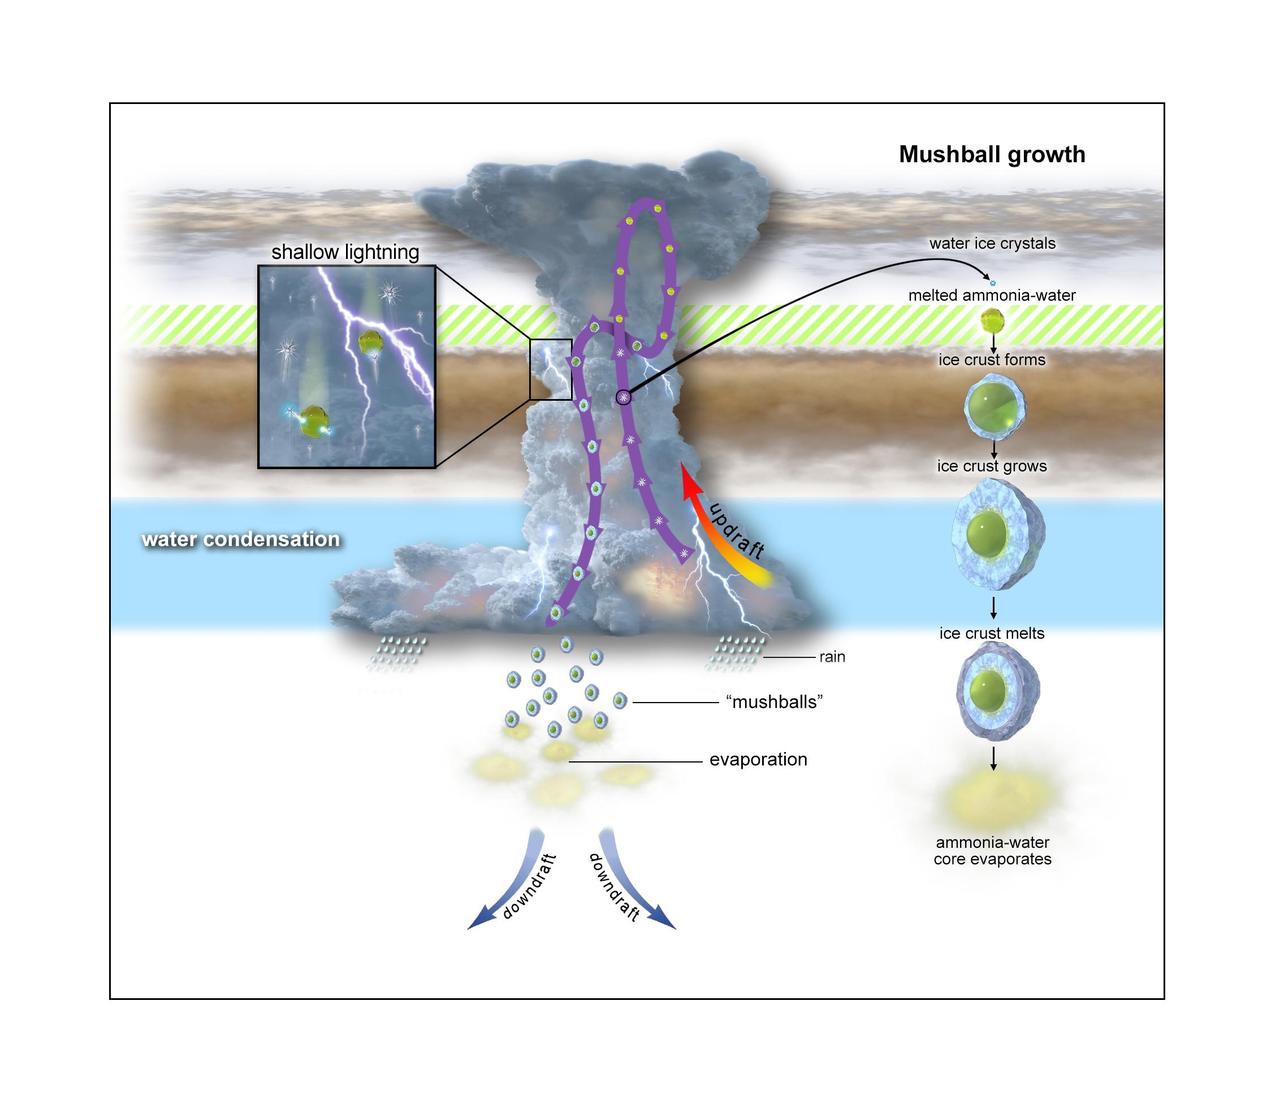
This graphic depicts the evolutionary process of "shallow lightning" and ammonia-water hailstones called "mushballs." An anvil-shaped thunderstorm cloud originates about 40 miles (65 kilometers) below Jupiter's visible cloud deck. Powered by water-based moist convection, the cloud generates strong updrafts that move liquid water and water ice particles upward. About 12 miles (19 kilometers) up, temperatures are so low that all of the water particles turn to ice. Still climbing, the ice particles cross a region located about 14 miles (23 kilometers) below the upper clouds, where temperatures are between minus 121 degrees Fahrenheit (minus 85 degrees Celsius) and minus 150 degrees Fahrenheit (minus 100 degrees Celsius), (depicted as green-hashed layer). At that point, ammonia vapor in the atmosphere acts like an antifreeze, melting the water-ice crystals, transforming them into ammonia-water liquid droplets which then grow and gather a solid icy shell to become mushballs. Once big enough, these slushy hailstones fall down, transporting both ammonia and water into Jupiter's deep atmosphere where the mushballs eventually evaporate. https://photojournal.jpl.nasa.gov/catalog/PIA24042
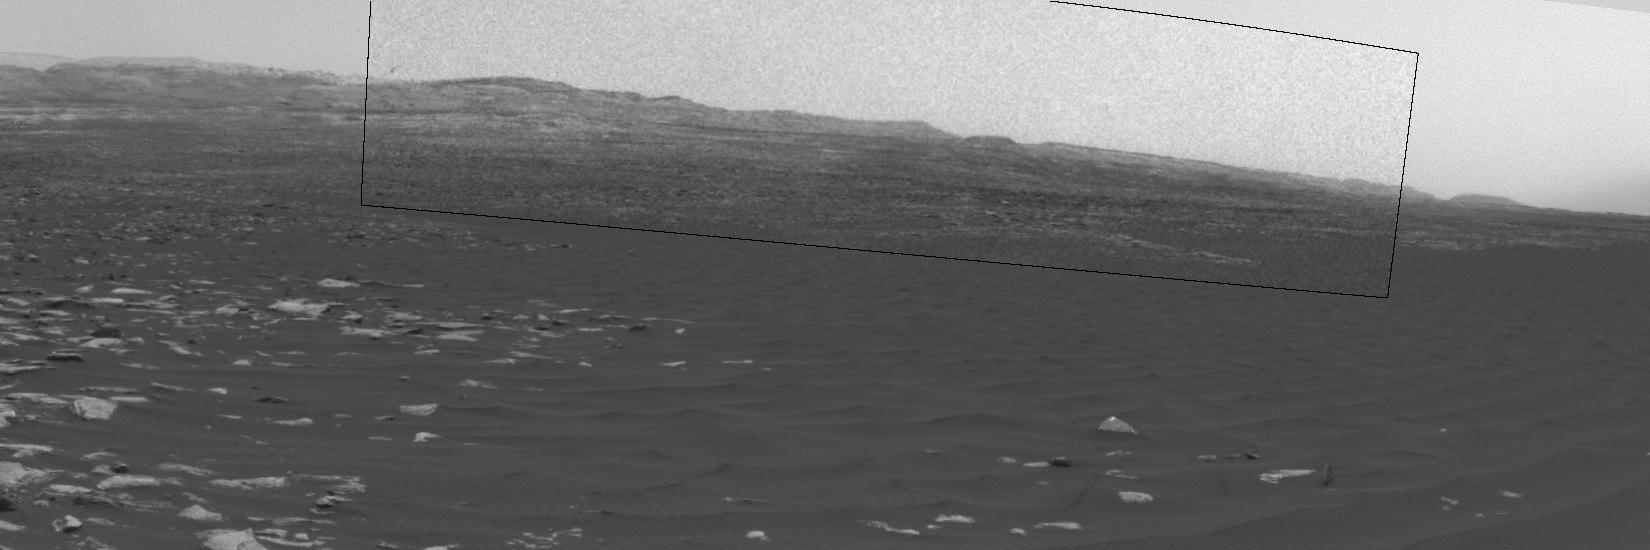
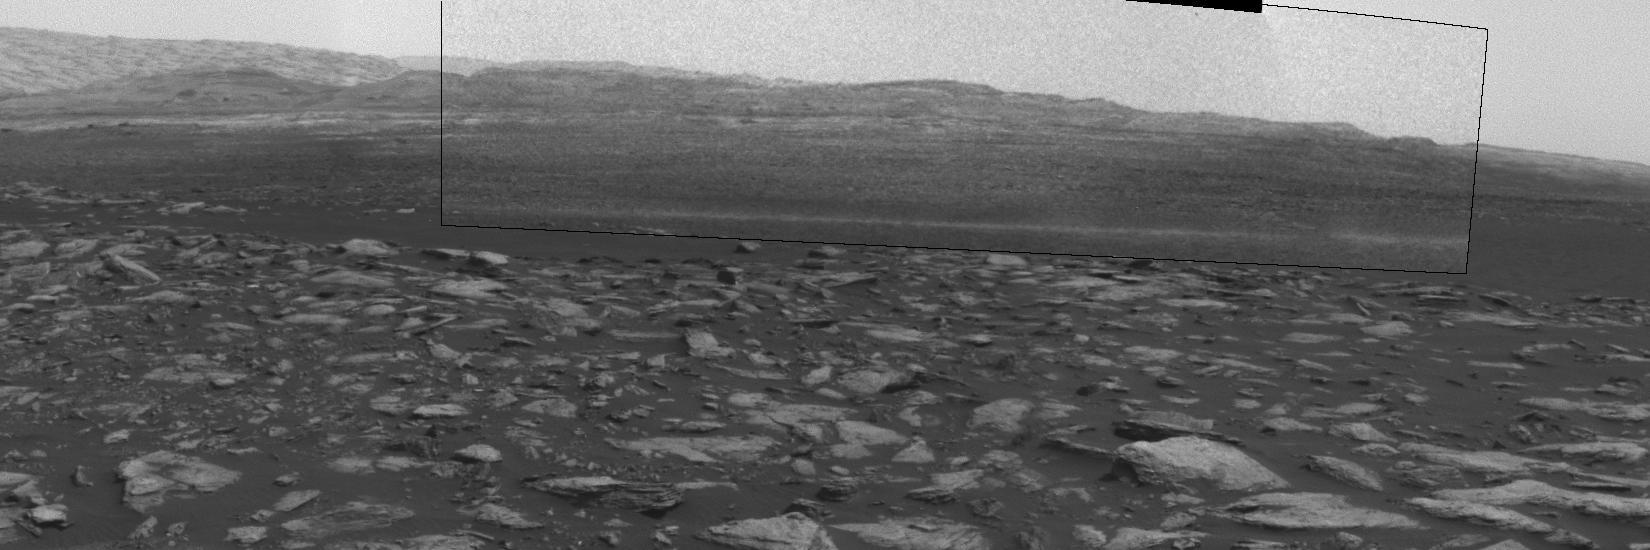
This frame from a sequence of images shows a dust-carrying whirlwind, called a dust devil, on lower Mount Sharp inside Gale Crater, as viewed by NASA's Curiosity Mars Rover during the summer afternoon of the rover's 1,613rd Martian day, or sol (Feb. 18, 2017). Set within a broader southward view from the rover's Navigation Camera, the rectangular area outlined in black was imaged multiple times over a span of several minutes to check for dust devils. Images from the period with most activity are shown in the inset area. The images are in pairs that were taken about 12 seconds apart, with an interval of about 90 seconds between pairs. Timing is accelerated and not fully proportional in this animation. Contrast has been modified to make frame-to-frame changes easier to see. A black frame provides a marker between repeats of the sequence. On Mars as on Earth, dust devils result from sunshine warming the ground, prompting convective rising of air that has gained heat from the ground. Observations of dust devils provide information about wind directions and interaction between the surface and the atmosphere. An animation is available at http://photojournal.jpl.nasa.gov/catalog/PIA21483
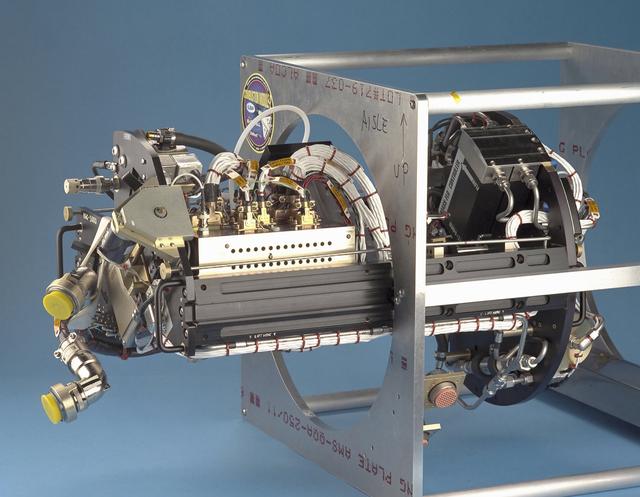
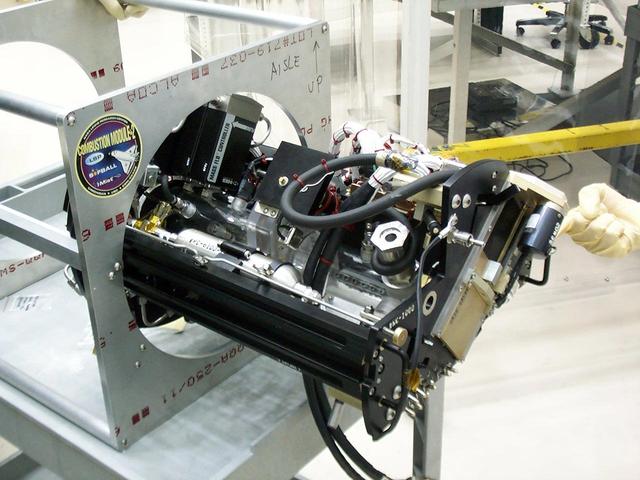
The Water Mist commercial research program is scheduled to fly an investigation on STS-107 in 2002. This investigation will be flown as an Experimental Mounting Structure (EMS) insert into the updated Combustion Module (CM-2), a sophisticated combustion chamber plus diagnostic equipment. (The investigation hardware is shown here mounted in a non-flight frame similar to the EMS.) Water Mist is a commercial research program by the Center for Commercial Applications of Combustion in Space (CCACS), a NASA Commercial Space Center located at the Colorado School of Mines, in Golden, CO and Industry Partner Environmental Engineering Concepts. The program is focused on developing water mist as a replacement for bromine-based chemical fire suppression agents (halons). By conducting the experiments in microgravity, interference from convection currents is minimized and fundamental knowledge can be gained. This knowledge is incorporated into models, which can be used to simulate a variety of physical environments. The immediate objective of the project is to study the effect of a fine water mist on a laminar propagating flame generated in a propane-air mixture at various equivalence ratios. The effects of droplet size and concentration on the speed of the flame front is used as a measure of the effectiveness of fire suppression in this highly controlled experimental environment.
The Water Mist commercial research program is scheduled to fly an investigation on STS-107 in 2002. This investigation will be flown as an Experimental Mounting Structure (EMS) insert into the updated Combustion Module (CM-2), a sophisticated combustion chamber plus diagnostic equipment. (The investigation hardware is shown here mounted in a non-flight frame similar to the EMS.) Water Mist is a commercial research program by the Center for Commercial Applications of Combustion in Space (CCACS), a NASA Commercial Space Center located at the Colorado School of Mines, in Golden, CO and Industry Partner Environmental Engineering Concepts. The program is focused on developing water mist as a replacement for bromine-based chemical fire suppression agents (halons). By conducting the experiments in microgravity, interference from convection currents is minimized and fundamental knowledge can be gained. This knowledge is incorporated into models, which can be used to simulate a variety of physical environments. The immediate objective of the project is to study the effect of a fine water mist on a laminar propagating flame generated in a propane-air mixture at various equivalence ratios. The effects of droplet size and concentration on the speed of the flame front is used as a measure of the effectiveness of fire suppression in this highly controlled experimental environment.
Proteins are the building blocks of our bodies and the living world around us. Within our bodies proteins make it possible for red blood cells to carry oxygen throughout the body. Others help transmit nerve impulses so we can hear, smell and feel the world around us. While others play a crucial role in preventing or causing disease. If the structure of a protein is known, then companies can develop new or improved drugs to fight the disease of which the protein is a part. To determine protein structure, researchers must grow near-perfect crystals of the protein. On Earth convection currents, sedimentation and other gravity-induced phenomena hamper crystal growth efforts. In microgravity researchers can grow near-perfect crystals in an environment free of these effects. Because of the enormous potential for new pharmaceutical products the Center for Macromolecular Crystallography--the NASA Commercial Space Center responsible for commercial protein crystal growth efforts has more than fifty major industry and academic partners. Research on crystals of human insulin could lead to improved treatments for diabetes.
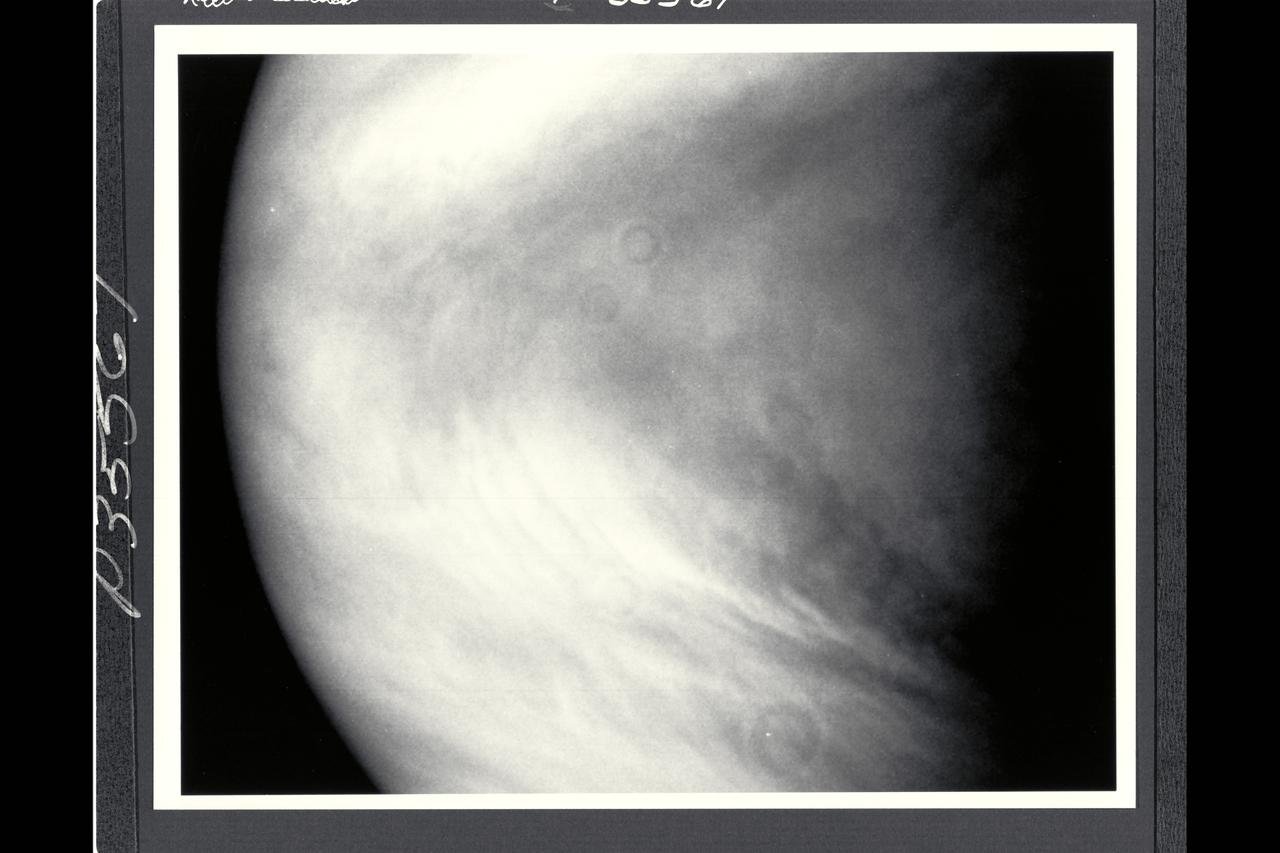
Range : 1 million miles (1.63 million km) This image of the planet Venus was taken by NASA's Galileo spacecraft shortly befor 10pm PST when the space craft was directly above Venus' equator. This is the 66th of more than 80 Venus images Galileo was programmed to take and record during its Venus flyby. In the picture, cloud features as small as 25 miles (40 km) can be seen. Patches of waves and convective clouds are superimpposed on the swirl of the planet's broad weather patterns, marked by the dark chevron at the center. North is at the top. The several ring-shaped shadows are blemishes, not planetary features. The spacecraft imaging system has a 1500-mm, f/8.5 reflecting telescope; the exposure time was 1/40 second. The image was taken through the violet filter (0.41 micron.). It was produced by the imaging system in digital form, as a set of numbers representing the brightness perceived in each of the 640,000 picture elements defined on the solid-state plate, called a charged-coupled-device or CCD, on which the image was focused.
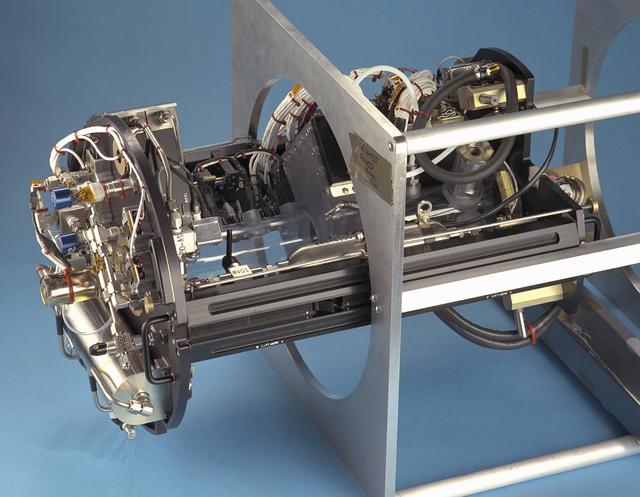
The Water Mist commercial research program is scheduled to fly an investigation on STS-107 in 2002. This investigation will be flown as an Experimental Mounting Structure (EMS) insert into the updated Combustion Module (CM-2), a sophisticated combustion chamber plus diagnostic equipment. (The investigation hardware is shown here mounted in a non-flight frame similar to the EMS.) Water Mist is a commercial research program by the Center for Commercial Applications of Combustion in Space (CCACS), a NASA Commercial Space Center located at the Colorado School of Mines, in Golden, CO and Industry Partner Environmental Engineering Concepts. The program is focused on developing water mist as a replacement for bromine-based chemical fire suppression agents (halons). By conducting the experiments in microgravity, interference from convection currents is minimized and fundamental knowledge can be gained. This knowledge is incorporated into models, which can be used to simulate a variety of physical environments. The immediate objective of the project is to study the effect of a fine water mist on a laminar propagating flame generated in a propane-air mixture at various equivalence ratios. The effects of droplet size and concentration on the speed of the flame front is used as a measure of the effectiveness of fire suppression in this highly controlled experimental environment.

Expedition Five flight engineer Peggy Whitson is shown installing the Solidification Using a Baffle in Sealed Ampoules (SUBSA) experiment in the Microgravity Science Glovebox (MSG) in the Destiny laboratory aboard the International Space Station (ISS). SUBSA examines the solidification of semiconductor crystals from a melted material. Semiconductor crystals are used for many products that touch our everyday lives. They are found in computer chips, integrated circuits, and a multitude of other electronic devices, such as sensors for medical imaging equipment and detectors of nuclear radiation. Materials scientists want to make better semiconductor crystals to be able to further reduce the size of high-tech devices. In the microgravity environment, convection and sedimentation are reduced, so fluids do not remove and deform. Thus, space laboratories provide an ideal environment of studying solidification from the melt. This investigation is expected to determine the mechanism causing fluid motion during production of semiconductors in space. It will provide insight into the role of the melt motion in production of semiconductor crystals, advancing our knowledge of the crystal growth process. This could lead to a reduction of defects in semiconductor crystals produced in space and on Earth.
This frame from a sequence of images shows a dust-carrying whirlwind, called a dust devil, scooting across the ground inside Gale Crater, as observed on the local summer afternoon of NASA's Curiosity Mars Rover's 1,597th Martian day, or sol (Feb. 1, 2017). Set within a broader southward view from the rover's Navigation Camera, the rectangular area outlined in black was imaged multiple times over a span of several minutes to check for dust devils. Images from the period with most activity are shown in the inset area. The images are in pairs that were taken about 12 seconds apart, with an interval of about 90 seconds between pairs. Timing is accelerated and not fully proportional in this animation. A dust devil is most evident in the 10th, 11th and 12th frames. In the first and fifth frames, dust blowing across the ground appears as pale horizontal streak. Contrast has been modified to make frame-to-frame changes easier to see. A black frame is added between repeats of the sequence. On Mars as on Earth, dust devils are whirlwinds that result from sunshine warming the ground, prompting convective rising of air that has gained heat from the ground. Observations of Martian dust devils provide information about wind directions and interaction between the surface and the atmosphere. An animation is available at http://photojournal.jpl.nasa.gov/catalog/PIA21270
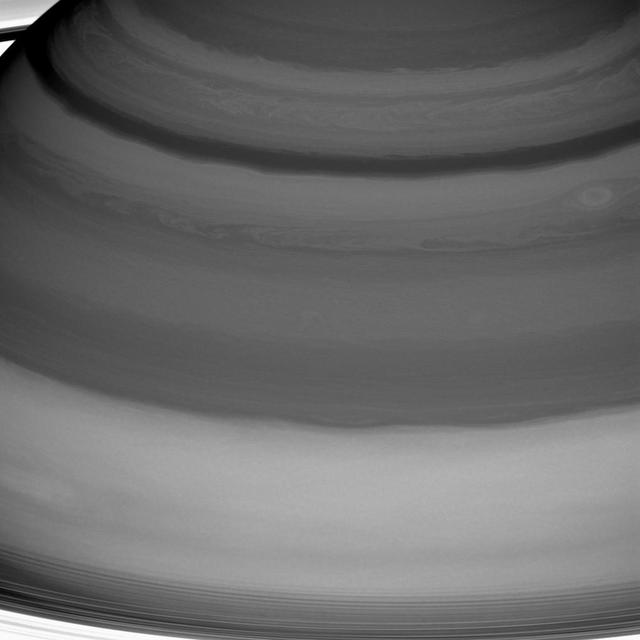
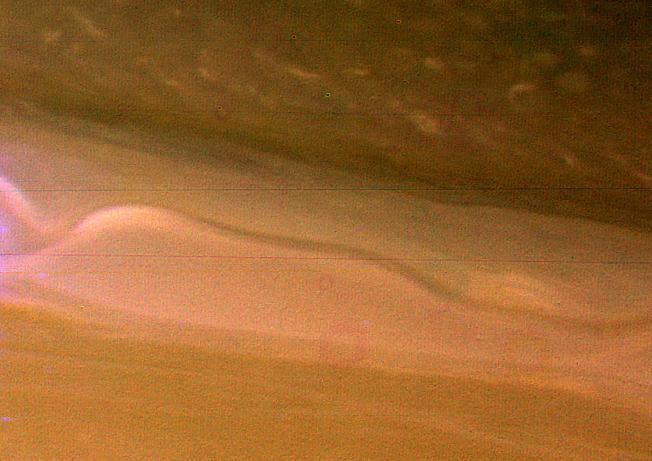
Saturn's clouds are full of raw beauty, but they also represent a playground for a branch of physics called fluid dynamics, which seeks to understand the motion of gases and liquids. Saturn's lack of a solid planetary surface (as on Earth, Mars or Venus) means that its atmosphere is free to flow around the planet essentially without obstruction. This is one factor that generates Saturn's pattern of alternating belts and zones -- one of the main features of its dynamic atmosphere. Winds in the belts blow at speeds different from those in the adjacent zones, leading to the formation of vortices along the boundaries between the two. And vigorous convection occasionally leads to storms and waves. Saturn's innermost rings are just visible at the bottom and in the upper left corner. This view is centered on clouds at 25 degrees north latitude on Saturn. The image was taken with the Cassini spacecraft wide-angle camera on July 20, 2016 using a spectral filter which preferentially admits wavelengths of near-infrared light centered at 728 nanometers. The view was obtained at a distance of approximately 752,000 miles (1.21 million kilometers) from Saturn and at a Sun-Saturn-spacecraft, or phase, angle of 6 degrees. Image scale is 45 miles (72 kilometers) per pixel. http://photojournal.jpl.nasa.gov/catalog/PIA20503
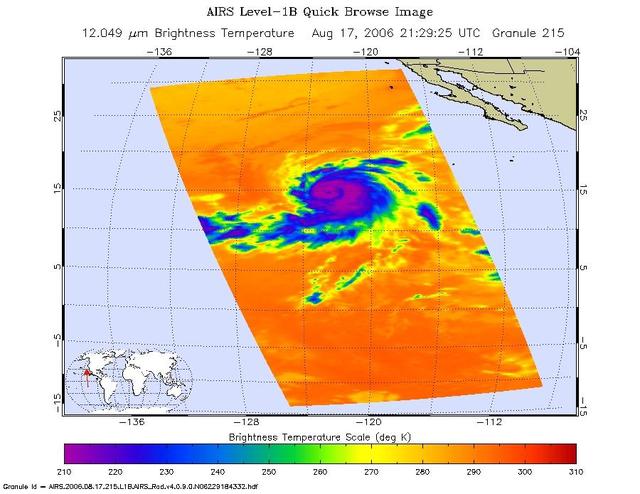
Infrared, microwave, and visible/near-infrared images of Hurricane Hector in the eastern Pacific were created with data from the Atmospheric Infrared Sounder (AIRS) on NASA's Aqua satellite on August 17, 2006. The infrared AIRS image shows the temperature of the cloud tops or the surface of the Earth in cloud-free regions. The lowest temperatures (in purple) are associated with high, cold cloud tops that make up the top of the hurricane. The infrared signal does not penetrate through clouds. Where there are no clouds the AIRS instrument reads the infrared signal from the surface of the Earth, revealing warmer temperatures (red). At the time the data were taken from which these images were made, Hector is a well organized storm, with the strongest convection in the SE quadrant. The increasing vertical wind shear in the NW quadrant is appearing to have an effect. Maximum sustained winds are at 85 kt, gusts to 105 kt. Estimated minimum central pressure is 975 mbar. The microwave image is created from microwave radiation emitted by Earth's atmosphere and received by the instrument. It shows where the heaviest rainfall is taking place (in blue) in the storm. Blue areas outside of the storm where there are either some clouds or no clouds, indicate where the sea surface shines through. The "visible" image is created from data acquired by the visible light/near-infrared sensor on the AIRS instrument. http://photojournal.jpl.nasa.gov/catalog/PIA00507

This not-to-scale artist's concept depicts a cutaway view of Mars' interior, revealing the crust, mantle, and core. Debris from ancient impacts lies scattered in the mantle in the form of lumps that are as large as 2.5 miles (4 kilometers) across, data from NASA's InSight Mars lander shows. On the Martian surface at left, a meteoroid impact sends seismic signals (shown as curving concentric lines) through the planet; InSight is depicted at right. InSight placed the first seismometer on Mars' surface in 2018. The extremely sensitive instrument recorded 1,319 marsquakes before the lander ran out of power in 2022, the result of dust caked on its solar panels. Quakes produce seismic waves that change as they pass through different kinds of material, providing scientists with a way to study the interior of a planetary body. To date, the InSight team has measured the size, depth, and composition of Mars' crust, mantle, and core. The impact debris in the Martian mantle offers a geologic record that could be preserved only on worlds like Mars, whose lack of tectonic plates has kept its interior from being churned up the way Earth's is through a process known as convection. https://photojournal.jpl.nasa.gov/catalog/PIA26636
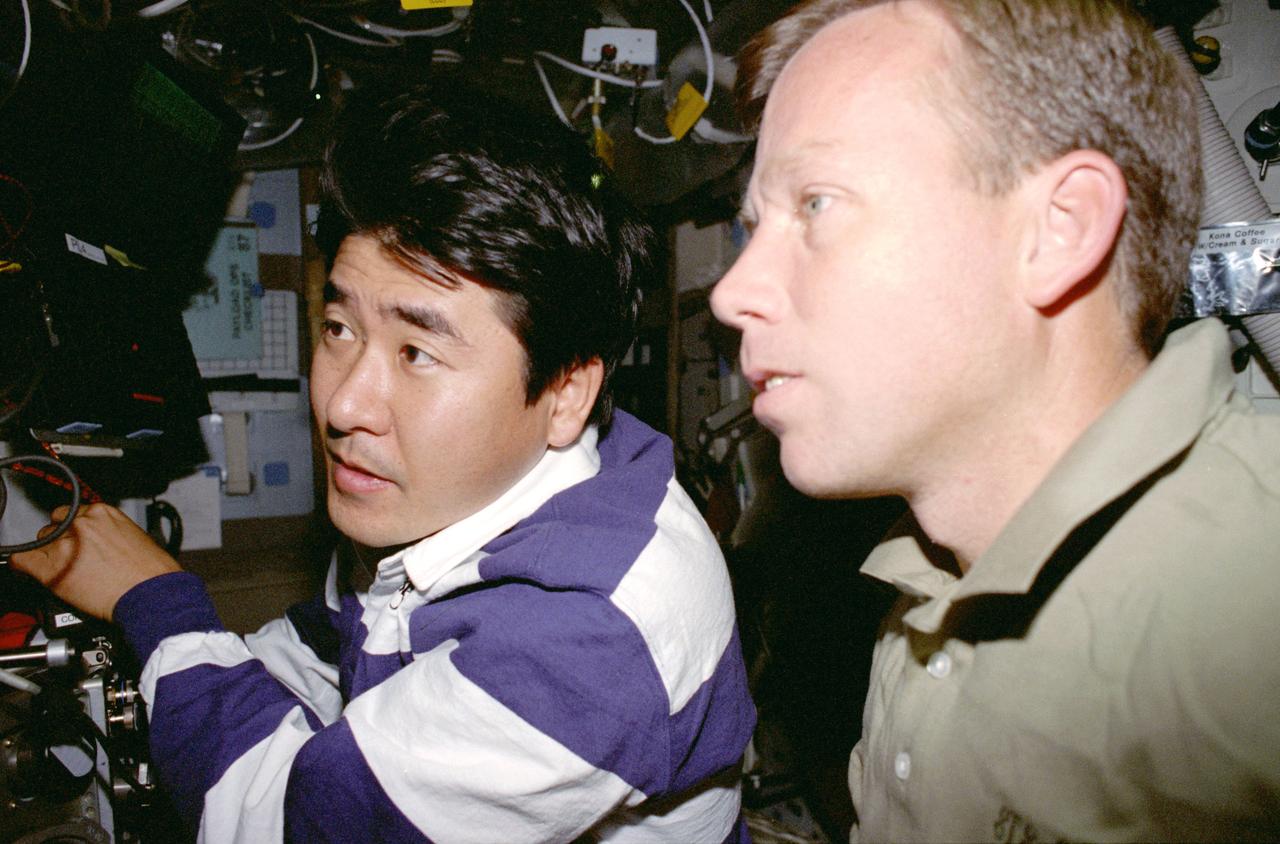
STS087-330-009 (19 November – 5 December 1997) --- Astronauts Takao Doi (left) and Steven W. Lindsey check out the Enclosed Laminar Flames (ELF) experiment on the mid-deck of the Earth-orbiting Space Shuttle Columbia. ELF has been designed to examine the effect of different air flow velocities on the stability of laminar (non-turbulent) flames. Enclosed laminar flames are commonly found in combustion systems such as power plant and gas turbine combustors, and jet engine afterburners. It is hoped that results of this investigation may help to optimize the performance of industrial combustors, including pollutant emissions and heat transfer. The microgravity environment of space makes a perfect setting for a laboratory involving combustion, an activity that creates convection in normal gravity. In microgravity, scientists can study subtle processes ordinarily masked by the effects of gravity. Doi is an international mission specialist representing Japan's National Space Development Agency (NASDA) and Lindsey is the pilot. Both are alumni of NASA's 1995 class of Astronaut Candidates (ASCAN).
Tropical Storm Hagupit's low level circulation center is being obscured by its deep central convection and intensities are hard to pinpoint as the storm interacts with land. Once clear over the waters of the South China Sea Hagupit is forecast to continue weakening as it approaches the southern coast of Vietnam. This image was taken by the Suomi NPP satellite's VIIRS instrument around 0510Z on December 8, 2014. NASA/NOAA/NPP Credit: NASA/NOAA via <b><a href="www.nnvl.noaa.gov/" rel="nofollow"> NOAA Environmental Visualization Laboratory</a></b> <b><a href="http://www.nasa.gov/audience/formedia/features/MP_Photo_Guidelines.html" rel="nofollow">NASA image use policy.</a></b> <b><a href="http://www.nasa.gov/centers/goddard/home/index.html" rel="nofollow">NASA Goddard Space Flight Center</a></b> enables NASA’s mission through four scientific endeavors: Earth Science, Heliophysics, Solar System Exploration, and Astrophysics. Goddard plays a leading role in NASA’s accomplishments by contributing compelling scientific knowledge to advance the Agency’s mission. <b>Follow us on <a href="http://twitter.com/NASAGoddardPix" rel="nofollow">Twitter</a></b> <b>Like us on <a href="http://www.facebook.com/pages/Greenbelt-MD/NASA-Goddard/395013845897?ref=tsd" rel="nofollow">Facebook</a></b> <b>Find us on <a href="http://instagram.com/nasagoddard?vm=grid" rel="nofollow">Instagram</a></b>
-- Joaquin became a tropical storm Monday evening (EDT) midway between the Bahamas and Bermuda and has now formed into a hurricane, the 3rd of the season--the difference is Joaquin could impact the US East Coast. GPM captured Joaquin Tuesday, September 29th at 21:39 UTC (5:39 pm EDT) as the hurricane moved slowly towards the west-southwest about 400 miles east of the northwestern Bahamas. At the time, Joaquin had been battling northerly wind shear, which was impeding the storm's ability to strengthen. However, compared to earlier in the day, the system was beginning to gain the upper hand as the shear began to relax its grip. At the time of this data visualization, Joaquin's low-level center of circulation was located further within the cloud shield, and the rain area was beginning to wrap farther around the center on the eastern side of the storm while showing signs of increased banding and curvature, a sure sign that Joaquin's circulation was intensifying. GPM shows a large area of very intense rain with rain rates ranging from around 50 to 132 mm/hr (~2 to 5 inches, shown in red and magenta) just to the right of the center. This is a strong indication that large amounts of heat are being released into the storm's center, fueling its circulation and providing the means for its intensification. Associated with the area of intense rain is an area of tall convective towers, known as a convective burst, with tops reaching up to 16.3 km (shown in orange). These towers when located near the storm's core are a strong indication that the storm is poised to strengthen as they too reveal the release of heat into the storm. At the time this data was taken, the National Hurricane Center reported that Joaquin's maximum sustained winds had increased to 65 mph from 40 mph earlier in the day, making Joaquin a strong tropical storm but poised to become a hurricane, which occurred this morning at 8:00 am EDT. With the inhibiting wind shear expected to continue to diminish and the system moving over warm waters, the National Hurricane Center is forecasting Joaquin to intensify further, possibly into a major hurricane within the next few days. Credit: NASA's Scientific Visualization Studio Data provided by the joint NASA/JAXA GPM mission <b><a href="http://www.nasa.gov/audience/formedia/features/MP_Photo_Guidelines.html" rel="nofollow">NASA image use policy.</a></b> <b><a href="http://www.nasa.gov/centers/goddard/home/index.html" rel="nofollow">NASA Goddard Space Flight Center</a></b> enables NASA’s mission through four scientific endeavors: Earth Science, Heliophysics, Solar System Exploration, and Astrophysics. Goddard plays a leading role in NASA’s accomplishments by contributing compelling scientific knowledge to advance the Agency’s mission. <b>Follow us on <a href="http://twitter.com/NASAGoddardPix" rel="nofollow">Twitter</a></b> <b>Like us on <a href="http://www.facebook.com/pages/Greenbelt-MD/NASA-Goddard/395013845897?ref=tsd" rel="nofollow">Facebook</a></b> <b>Find us on <a href="http://instagrid.me/nasagoddard/?vm=grid" rel="nofollow">Instagram</a></b>
A large, bright and complex convective storm that appeared in Saturn's southern hemisphere in mid-September 2004 was the key in solving a long-standing mystery about the ringed planet. Saturn's atmosphere and its rings are shown here in a false color composite made from Cassini images taken in near infrared light through filters that sense different amounts of methane gas. Portions of the atmosphere with a large abundance of methane above the clouds are red, indicating clouds that are deep in the atmosphere. Grey indicates high clouds, and brown indicates clouds at intermediate altitudes. The rings are bright blue because there is no methane gas between the ring particles and the camera. The complex feature with arms and secondary extensions just above and to the right of center is called the Dragon Storm. It lies in a region of the southern hemisphere referred to as "storm alley" by imaging scientists because of the high level of storm activity observed there by Cassini in the last year. The Dragon Storm was a powerful source of radio emissions during July and September of 2004. The radio waves from the storm resemble the short bursts of static generated by lightning on Earth. Cassini detected the bursts only when the storm was rising over the horizon on the night side of the planet as seen from the spacecraft; the bursts stopped when the storm moved into sunlight. This on/off pattern repeated for many Saturn rotations over a period of several weeks, and it was the clock-like repeatability that indicated the storm and the radio bursts are related. Scientists have concluded that the Dragon Storm is a giant thunderstorm whose precipitation generates electricity as it does on Earth. The storm may be deriving its energy from Saturn's deep atmosphere. One mystery is why the radio bursts start while the Dragon Storm is below the horizon on the night side and end when the storm is on the day side, still in full view of the Cassini spacecraft. A possible explanation is that the lightning source lies to the east of the visible cloud, perhaps because it is deeper where the currents are eastward relative to those at cloud top levels. If this were the case, the lightning source would come up over the night side horizon and would sink down below the day side horizon before the visible cloud. This would explain the timing of the visible storm relative to the radio bursts. The Dragon Storm is of great interest for another reason. In examining images taken of Saturn's atmosphere over many months, imaging scientists found that the Dragon Storm arose in the same part of Saturn's atmosphere that had earlier produced large bright convective storms. In other words, the Dragon Storm appears to be a long-lived storm deep in the atmosphere that periodically flares up to produce dramatic bright white plumes which subside over time. One earlier sighting, in July 2004, was also associated with strong radio bursts. And another, observed in March 2004 and captured in a movie created from images of the atmosphere (PIA06082 and PIA06083) spawned three little dark oval storms that broke off from the arms of the main storm. Two of these subsequently merged with each other; the current to the north carried the third one off to the west, and Cassini lost track of it. Small dark storms like these generally get stretched out until they merge with the opposing currents to the north and south. These little storms are the food that sustains the larger atmospheric features, including the larger ovals and the eastward and westward currents. If the little storms come from the giant thunderstorms, then together they form a food chain that harvests the energy of the deep atmosphere and helps maintain the powerful currents. Cassini has many more chances to observe future flare-ups of the Dragon Storm, and others like it over the course of the mission. It is likely that scientists will come to solve the mystery of the radio bursts and observe storm creation and merging in the next 2 or 3 years. http://photojournal.jpl.nasa.gov/catalog/PIA06197
On an early fall afternoon in Ganges Chasma Valles Marineris, NASA Mars Reconnaissance Orbiter spacecraft managed to capture a cluster of eight dust devils, five of them in the enhanced color strip. They're together on a dark sandy surface that tilts slightly to the north, towards the Sun. Both of these factors help warm the surface and generate convection in the air above. The surface is streaked with the faint tracks of earlier dust devils. A pair of dust devils appears together at top right, spaced only 250 meters apart. These two have quite different morphologies. The bigger one (on the right) is about 100 meters in diameter and is shaped like a doughnut with a hole in the middle. Its smaller companion is more compact and plume-like, but it too has a small hole in the center, where the air pressure is lowest. It may be that the smaller dust devil is younger than the larger one. A row of four dust devils are in the middle of the color strip, separated by about 900 meters from one another. This image might answer some interesting questions about the behavior of dust devils. Dust devils are theoretically expected to migrate uphill on a sloping surface, or migrate downwind when there is a breeze. Where they are found close together in pairs, they are expected to rotate in opposite directions. HiRISE color observations can be used to determine the direction of rotation and-for fast moving dust devils-the direction of their travel. This is because the different color observations (infrared, red, and blue) are taken at slightly different times. The differences between the earliest color observation and the last tell us about the changes that took place during that time interval. All this requires careful analysis, but if these dust devils are moving fast enough, and spaced closely enough, these here might display some interesting "social dynamics," possibly marching together and rotating in alternating directions. http://photojournal.jpl.nasa.gov/catalog/PIA20045
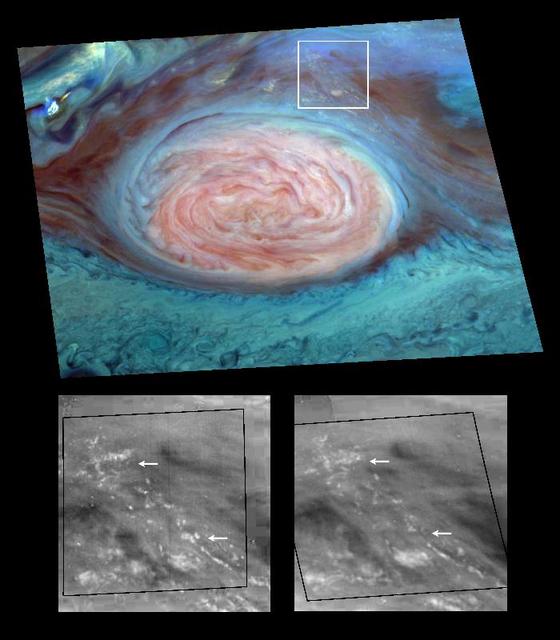
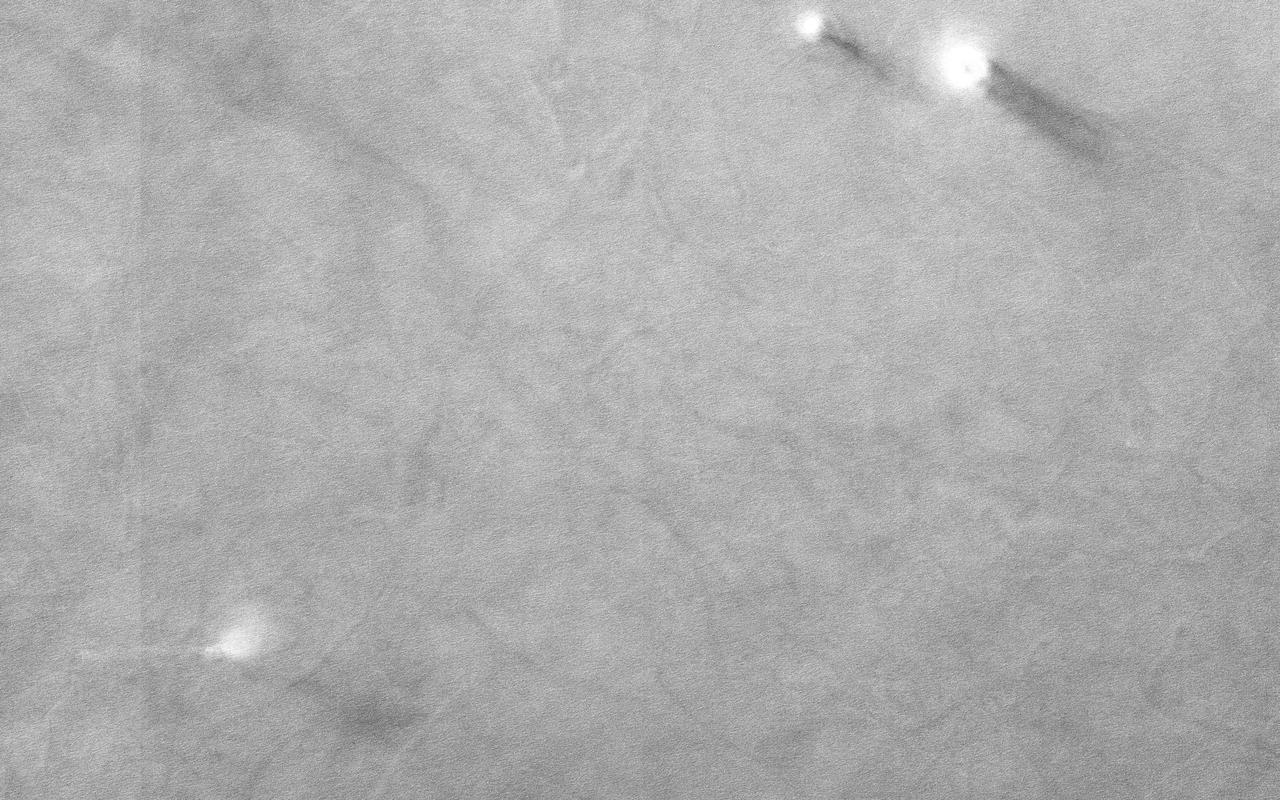
Scientists have spotted what appear to be thunderheads on Jupiter bright white cumulus clouds similar to those that bring thunderstorms on Earth - at the outer edges of Jupiter's Great Red Spot. Images from NASA's Galileo spacecraft now in orbit around Jupiter are providing new evidence that thunderstorms may be an important source of energy for Jupiter's winds that blow at more than 500 kilometers per hour (about 300 miles per hour). The photos were taken by Galileo's solid state imager camera on June 26, 1996 at a range of about 1.4 million kilometers (about 860,000 miles). The image at top is a mosaic of multiple images taken through near-infrared filters. False coloring in the image reveals cloud-top heights. High, thick clouds are white and high, thin clouds are pink. Low-altitude clouds are blue. The two black-and-white images at bottom are enlargements of the boxed area; the one on the right was taken 70 minutes after the image on the left. The arrows show where clouds have formed or dissipated in the short time between the images. The smallest clouds are tens of kilometers across. On Earth, moist convection in thunderstorms is a pathway through which solar energy, deposited at the surface, is transported and delivered to the atmosphere. Scientists at the California Institute of Technology analyzing data from Galileo believe that water, the most likely candidate for what composes these clouds on Jupiter, may be more abundant at the site seen here than at the Galileo Probe entry site, which was found to be unexpectedly dry. http://photojournal.jpl.nasa.gov/catalog/PIA00506
Blanca has rapidly intensified with an increase in wind speed of 60 knots since 1200Z on June 2. The hurricane has developed a distinct pinhole eye in visible images surrounded by very deep convection. There is an opportunity for Blanca to intensify further since the hurricane is located within an ideal environment of low shear and high ocean heat content. Beyond 48 hours, the hurricane will encounter lower SSTs and a gradual weakening should begin. During the next 24 hours, the hurricane should begin a northwestward track with some increase in forward speed becoming a potential threat to Baja California in a few days. This image was taken by GOES East at 1445Z on June 3, 2015. Credit: <a href="http://svs.gsfc.nasa.gov/index.html" rel="nofollow">NASA/Goddard Space Flight Center Scientific Visualization Studio</a> <b><a href="http://www.nasa.gov/audience/formedia/features/MP_Photo_Guidelines.html" rel="nofollow">NASA image use policy.</a></b> <b><a href="http://www.nasa.gov/centers/goddard/home/index.html" rel="nofollow">NASA Goddard Space Flight Center</a></b> enables NASA’s mission through four scientific endeavors: Earth Science, Heliophysics, Solar System Exploration, and Astrophysics. Goddard plays a leading role in NASA’s accomplishments by contributing compelling scientific knowledge to advance the Agency’s mission. <b>Follow us on <a href="http://twitter.com/NASAGoddardPix" rel="nofollow">Twitter</a></b> <b>Like us on <a href="http://www.facebook.com/pages/Greenbelt-MD/NASA-Goddard/395013845897?ref=tsd" rel="nofollow">Facebook</a></b> <b>Find us on <a href="http://instagrid.me/nasagoddard/?vm=grid" rel="nofollow">Instagram</a></b>
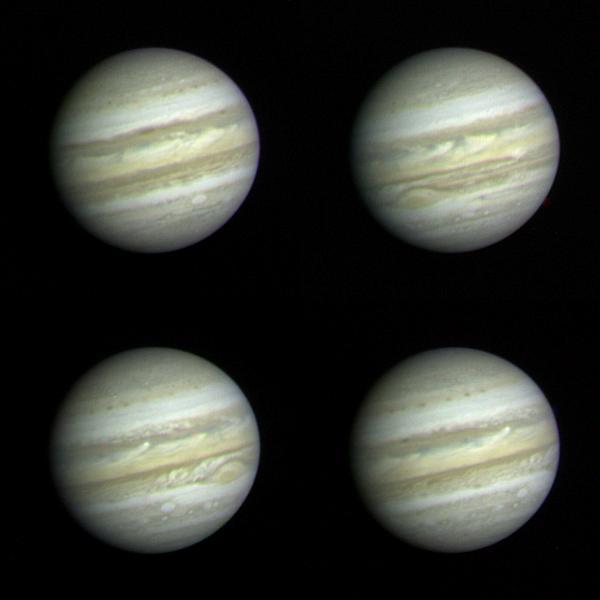
These Jupiter photographs are part of a set taken by NASA Voyager 1 on December 10 and 11, 1978 from a distance of 83 million km 52 million miles or more than half the distance from the Earth to the sun. At this range, Voyager 1 is able to record more detail on the giant planet than the very best ground-based telescopes. The highest resolution ever obtained on the Jovian disk was recorded by Pioneer 11 four years ago. Voyager, however, has longer focal-length optics than Pioneer, and while nearly three months from encounter (~ March 1979) was able to achieve higher resolution than that obtained by Pioneer only 24 hours from its encounter on 3 December 1974. Jupiter's colorful and turbulent atmosphere is evident in these photographs. The entire visible surface of the planet is made up of multiple layers of clouds, composed primarily of ammonia ice crystals colored by small amounts of materials of unknown composition. The Great Red Spot, seen to the lower left of 2 and lower right of 3, is now recovering from a period of relative inconspicuousness. An atmospheric system larger than the Earth and more than 100 years old, the Great Red Spot remains a mystery and a challenge to Voyager instruments. A bright convective cloud (center of and right of center in 4) displays a plume which has been swept westward (to the left) by local currents in the planet's equatorial wind system. Below and to the left and right of the Great Red Spot are a pair of white oval clouds; a third can be seen in 1. All three were formed almost 40 years ago and are the second oldest class of discrete features identified in the Jovian atmosphere. Each of the pictures was produced from blue, green, and orange originals in JPL's Image Processing Laboratory. http://photojournal.jpl.nasa.gov/catalog/PIA00454
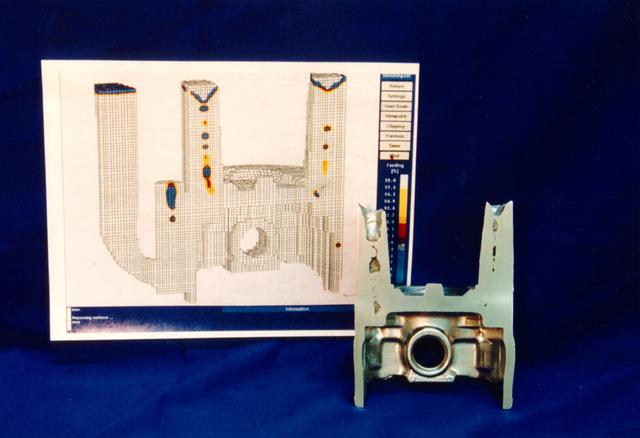
This is a computer generated model of a ground based casting. The objective of the therophysical properties program is to measure thermal physical properties of commercial casting alloys for use in computer programs that predict soldification behavior. This could reduce trial and error in casting design and promote less scrap, sounder castings, and less weight. In order for the computer models to reliably simulate the details of industrial alloy solidification, the input thermophysical property data must be absolutely reliable. Recently Auburn University and TPRL Inc. formed a teaming relationship to establish reliable measurement techniques for the most critical properties of commercially important alloys: transformation temperatures, thermal conductivity, electrical conductivity, specific heat, latent heat, density, solid fraction evolution, surface tension, and viscosity. A new initiative with the American Foundrymens Society has been started to measure the thermophysical properties of commercial ferrous and non-ferrous casting alloys and make the thermophysical property data widely available. Development of casting processes for the new gamma titanium aluminide alloys as well as existing titanium alloys will remain a trial-and-error procedure until accurate thermophysical properties can be obtained. These molten alloys react with their containers on earth and change their composition - invalidating the measurements even while the data are being acquired in terrestrial laboratories. However, measurements on the molten alloys can be accomplished in space using freely floating droplets which are completely untouched by any container. These data are expected to be exceptionally precise because of the absence of impurity contamination and buoyancy convection effects. Although long duration orbital experiments will be required for the large scale industrial alloy measurement program that results from this research, short duration experiments on NASA's KC-135 low-g aircraft are already providing preliminary data and experience.
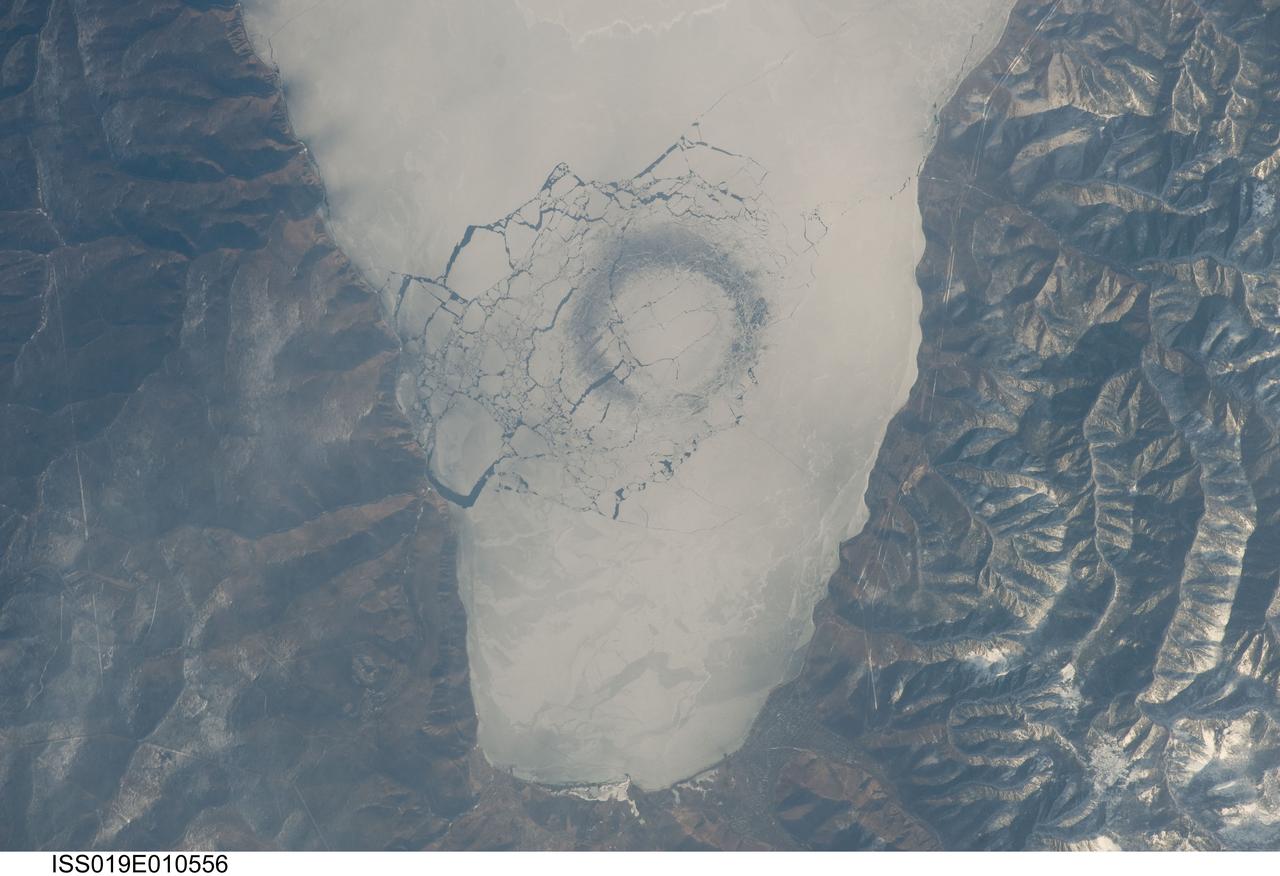
ISS019-E-010556 (23 April 2009) --- A circle in thin ice in Lake Baikal, Russia is featured in this image photographed by an Expedition 19 crewmember on the International Space Station. Late in April 2009, astronauts aboard the station observed a strange circular area of thinned ice (dark in color, with a diameter of about 4.4 kilometers) in the southern end of Lake Baikal in southern Siberia. Lake Baikal is unique in many regards. It is the largest (by volume) and deepest (1,637 meters at the deepest point) fresh water lake on Earth and, as a World Heritage Site, is considered one of Russia?s environmental jewels. The lake?s long, thin and deep profile results from its location in the Baikal Rift valley in Siberia. According to scientists, it is also one of the world?s oldest lakes (25-30 million years old); it contains up to 7 kilometers of sediment deposited on the bottom, and is home to an amazing array of plants and animals, many being found only in Lake Baikal. The lake?s biodiversity includes fresh water seals and several species of fish that are not found elsewhere on Earth. Siberia is remote and cold; ice cover can persist into June. This detailed image shows a circle of thin ice, which is the focal point for ice break up in the very southern end of the lake. While the origin of the circles is unknown, the peculiar pattern suggests convection in the lake?s water column. Ice cover changes rapidly at this time of year. Within a day, the ice can melt almost completely, and then freeze again overnight. Throughout April, the circles are persistent ? they appear when ice cover forms, and then disappear as ice melts. The pattern and appearance suggests that the ice is quite thin.
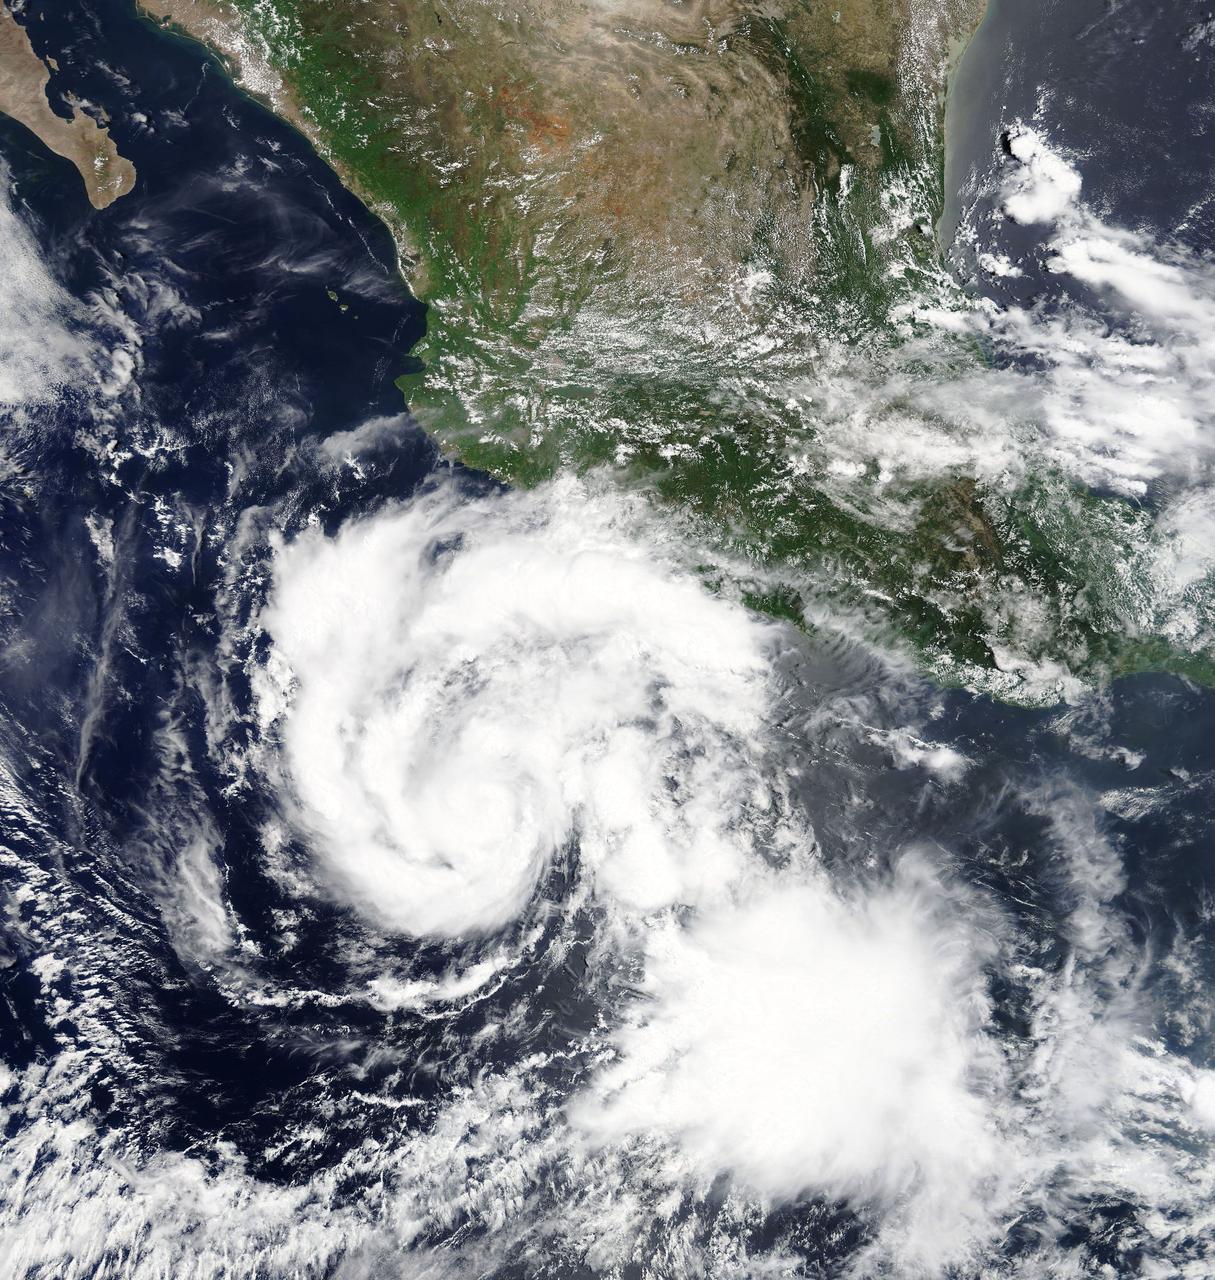
Hilary is a small but strengthening hurricane, with hurricane-force winds extending outward up to 10 miles (20 km) from the center. Tropical-storm-force winds extending outward up to 60 miles (95 km). Hilary began when Tropical Depression 9E formed on July 21. By July 22 at 11 p.m. EDT, the depression strengthened into a tropical storm and was re-named Hilary. At 5 a.m. EDT on Monday, July 24, 2017, Hilary rapidly intensified into a hurricane. NASA's Moderate Resolution Imaging Spectroradiometer, or MODIS, instrument aboard NASA’s Terra satellite captured a true color image of Hurricane Hilary on July 24 at 11 a.m. EDT. The image revealed a better organized tropical cyclone. The National Hurricane Center (NHC) noted "Satellite images indicate that Hilary has a small central core of convection, with both the visible and infrared channels suggesting that an eye is trying to form. Microwave data also show an incomplete eyewall." At 11 a.m. EDT (1500 UTC), the center of Hurricane Hilary was located near 14.1 degrees north latitude and 104.2 degrees west longitude. That's about 340 miles (545 km) south of Manzanillo, Mexico. Hilary is moving toward the west-northwest near 8 mph (13 kph), and the National Hurricane Center said this general motion with some increase in forward speed is expected over the next 48 hours. Maximum sustained winds have increased to near 80 mph (130 kph) with higher gusts. The estimated minimum central pressure is 989 millibars. The National Hurricane Center expects Hilary to become a major hurricane on Tuesday, July 25. For updated forecasts, visit: <a href="http://www.nhc.noaa.gov" rel="nofollow">www.nhc.noaa.gov</a>.
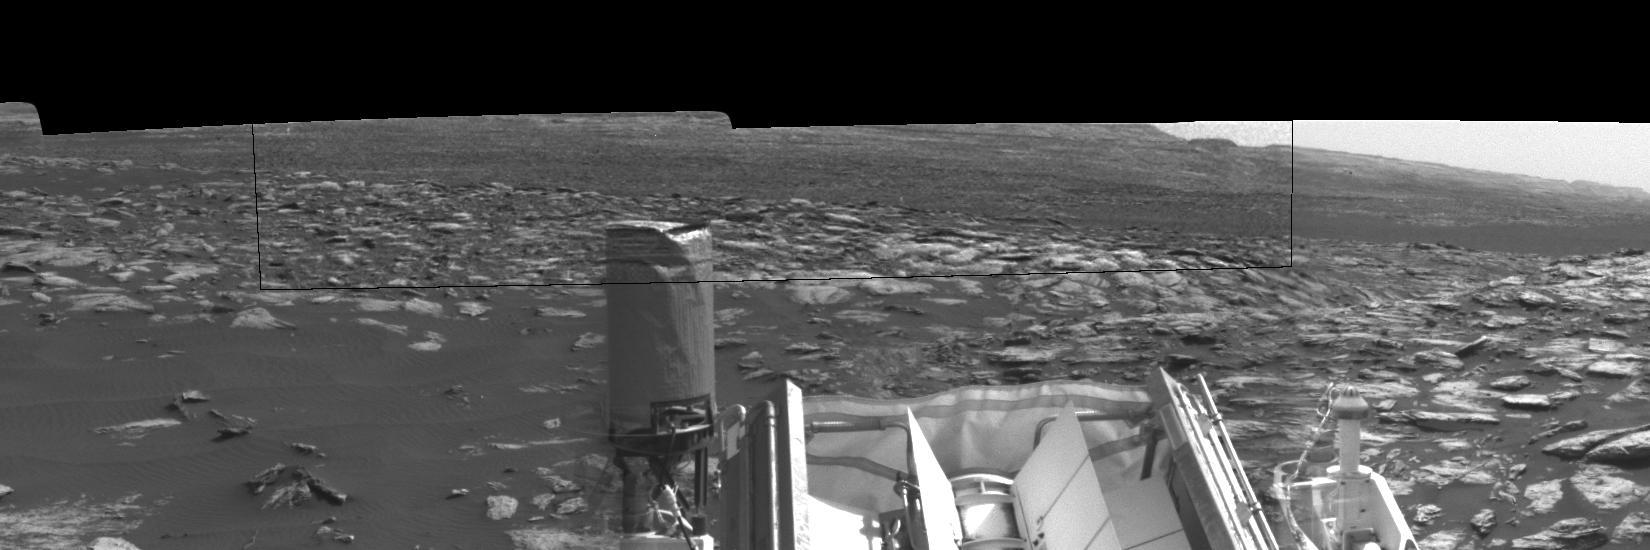
Dust devils dance in the distance in this frame from a sequence of images taken by the Navigation Camera on NASA's Curiosity Mars rover on Feb. 12, 2017, during the summer afternoon of the rover's 1,607th Martian day, or sol. Within a broader context view, the rectangular area outlined in black was imaged multiple times over a span of several minutes to check for dust devils. Images from the period with most activity are shown in the inset area. The images are in pairs that were taken about 12 seconds apart, with an interval of about 90 seconds between pairs. Timing is accelerated and not fully proportional in this animation. One dust devil appears at the right edge of the inset -- toward the south from the rover -- in the first few frames. Another appears on the left -- toward south-southeast -- later in the sequence. Contrast has been modified to make frame-to-frame changes easier to see. A black frame is added between repeats of the sequence. Portions of Curiosity are visible in the foreground. The cylindrical UHF (ultra-high frequency) antenna on the left is used for sending data to Mars orbiters, which relay the data to Earth. The angled planes to the right of this antenna are fins of the rover's radioisotope thermoelectric generator, which provides the vehicle's power. The post with a knob on top at right is a low-gain, non-directional antenna that can be used for receiving transmissions from Earth, as backup to the main high-gain antenna (not shown here) used for that purpose. On Mars as on Earth, dust devils are whirlwinds that result from sunshine warming the ground, prompting convective rising of air that has gained heat from the ground. Observations of Martian dust devils provide information about wind directions and interaction between the surface and the atmosphere. An animation is available at http://photojournal.jpl.nasa.gov/catalog/PIA21482
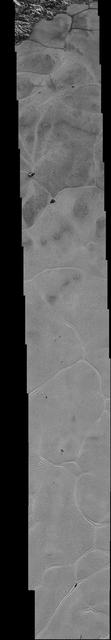
NASA's New Horizons spacecraft continues to transmit the sharpest views of Pluto that it obtained (and recorded) during its flyby of the distant planet on July 14, 2015. The newest image, returned on Dec. 24, 2015, extends New Horizons' highest-resolution swath of Pluto to the very center of the informally named Sputnik Planum, and nearly completes the set of highest-resolution images taken by New Horizons last July. The pictures are part of a sequence taken near New Horizons' closest approach to Pluto, with resolutions of about 250-280 feet (77-85 meters) per pixel -- revealing features smaller than half a city block on Pluto's surface. The images shown here form a strip 50 miles (80 kilometers) wide and more than 400 miles (700 kilometers) long, trending from the northwestern shoreline of Sputnik Planum and out across its icy plains. The images illustrate the polygonal or cellular pattern of the plains, which are thought to result from the convective churning of a deep layer solid, but mobile, nitrogen ice. The surface of Sputnik Planum appears darker toward the shore (at top), possibly implying a change in composition or surface texture. The occasional raised, darker blocks at the cell edges are probably dirty water "icebergs" floating in denser solid nitrogen. The pictures were taken with the telescopic Long Range Reconnaissance Imager (LORRI) aboard New Horizons, from a range of approximately 10,000 miles (17,000 kilometers) over a timespan of about a minute centered on 11:36 UT on July 14 -- just about 15 minutes before New Horizons' closest approach to Pluto. http://photojournal.jpl.nasa.gov/catalog/PIA20336

Radar and satellite imagery indicate that the convective organization of the cyclone has improved, and the cyclone is being upgraded based on a sustained wind report of 33 kt from Settlement Point, Grand Bahama Island earlier this morning. Low shear conditions and warm sea-surface temperatures should allow for at least steady strengthening, and the cyclone is expected to become a hurricane by 72 hours. This image was taken by GOES East at 1445Z on July 1, 2014. <b><a href="http://goes.gsfc.nasa.gov/" rel="nofollow">Credit: NOAA/NASA GOES Project</a></b> Caption: NOAA <b><a href="http://www.nasa.gov/audience/formedia/features/MP_Photo_Guidelines.html" rel="nofollow">NASA image use policy.</a></b> <b><a href="http://www.nasa.gov/centers/goddard/home/index.html" rel="nofollow">NASA Goddard Space Flight Center</a></b> enables NASA’s mission through four scientific endeavors: Earth Science, Heliophysics, Solar System Exploration, and Astrophysics. Goddard plays a leading role in NASA’s accomplishments by contributing compelling scientific knowledge to advance the Agency’s mission. <b>Follow us on <a href="http://twitter.com/NASAGoddardPix" rel="nofollow">Twitter</a></b> <b>Like us on <a href="http://www.facebook.com/pages/Greenbelt-MD/NASA-Goddard/395013845897?ref=tsd" rel="nofollow">Facebook</a></b> <b>Find us on <a href="http://instagram.com/nasagoddard?vm=grid" rel="nofollow">Instagram</a></b>
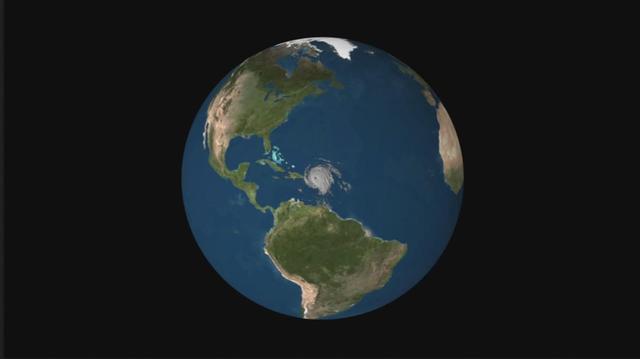
NASA's CloudSat satellite flew over Hurricane Irma on Sept. 6, 2017 at 1:45 p.m. EDT (17:45 UTC) as the storm was approaching Puerto Rico in the Atlantic Ocean. Hurricane Irma contained estimated maximum sustained winds of 185 miles per hour (160 knots) with a minimum pressure of 918 millibars. CloudSat transected the eastern edge of Hurricane Irma's eyewall, revealing details of the storm's cloud structure beneath its thick canopy of cirrus clouds. The CloudSat Cloud Profiling Radar excels in detecting the organization and placement of cloud layers beneath a storm's cirrus canopy, which are not readily detected by other satellite sensors. The CloudSat overpass reveals the inner details beneath the cloud tops of this large system; intense areas of convection with moderate to heavy rainfall (deep red and pink colors), cloud-free areas (moats) in between the inner and outer cloud bands of Hurricane Irma and cloud top heights averaging around 9 to 10 miles (15 to 16 kilometers). Lower values of reflectivity (areas of green and blue) denote smaller-sized ice and water particle sizes typically located at the top of a storm system (in the anvil area). The Cloud Profiling Radar loses signal at around 3 miles (5 kilometers) in height (in the melting layer) due to water (ice) particles larger than 0.12 inches (3 millimeters) in diameter. Moderate to heavy rainfall occurs in these areas where signal weakening is detectable. Smaller cumulus and cumulonimbus cloud types are evident as CloudSat moves farther south, beneath the thick cirrus canopy. An animation is available at https://photojournal.jpl.nasa.gov/catalog/PIA21947
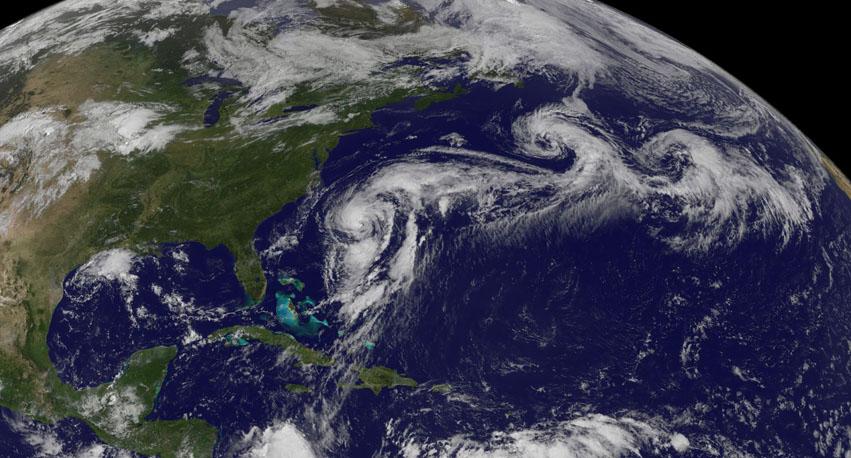
Hurricane Cristobal is located west of Bermuda still holding to hurricane strength with a small window of opportunity for strengthening further before it moves to higher latitudes and over cooler waters in a couple of days. Currently, the satellite presentation resembles a subtropical cyclone with weak convection which is not concentrated near the center. Cristobal slowed down earlier this morning, but it has resumed a northward motion at 10 knots. This image was taken by GOES East at 1145Z on August 27, 2014. Caption Credit: NASA/NOAA via <b><a href="www.nnvl.noaa.gov/" rel="nofollow"> NOAA Environmental Visualization Laboratory</a></b> <b><a href="http://goes.gsfc.nasa.gov/" rel="nofollow">Credit: NOAA/NASA GOES Project</a></b> <b><a href="http://www.nasa.gov/audience/formedia/features/MP_Photo_Guidelines.html" rel="nofollow">NASA image use policy.</a></b> <b><a href="http://www.nasa.gov/centers/goddard/home/index.html" rel="nofollow">NASA Goddard Space Flight Center</a></b> enables NASA’s mission through four scientific endeavors: Earth Science, Heliophysics, Solar System Exploration, and Astrophysics. Goddard plays a leading role in NASA’s accomplishments by contributing compelling scientific knowledge to advance the Agency’s mission. <b>Follow us on <a href="http://twitter.com/NASAGoddardPix" rel="nofollow">Twitter</a></b> <b>Like us on <a href="http://www.facebook.com/pages/Greenbelt-MD/NASA-Goddard/395013845897?ref=tsd" rel="nofollow">Facebook</a></b> <b>Find us on <a href="http://instagram.com/nasagoddard?vm=grid" rel="nofollow">Instagram</a></b>
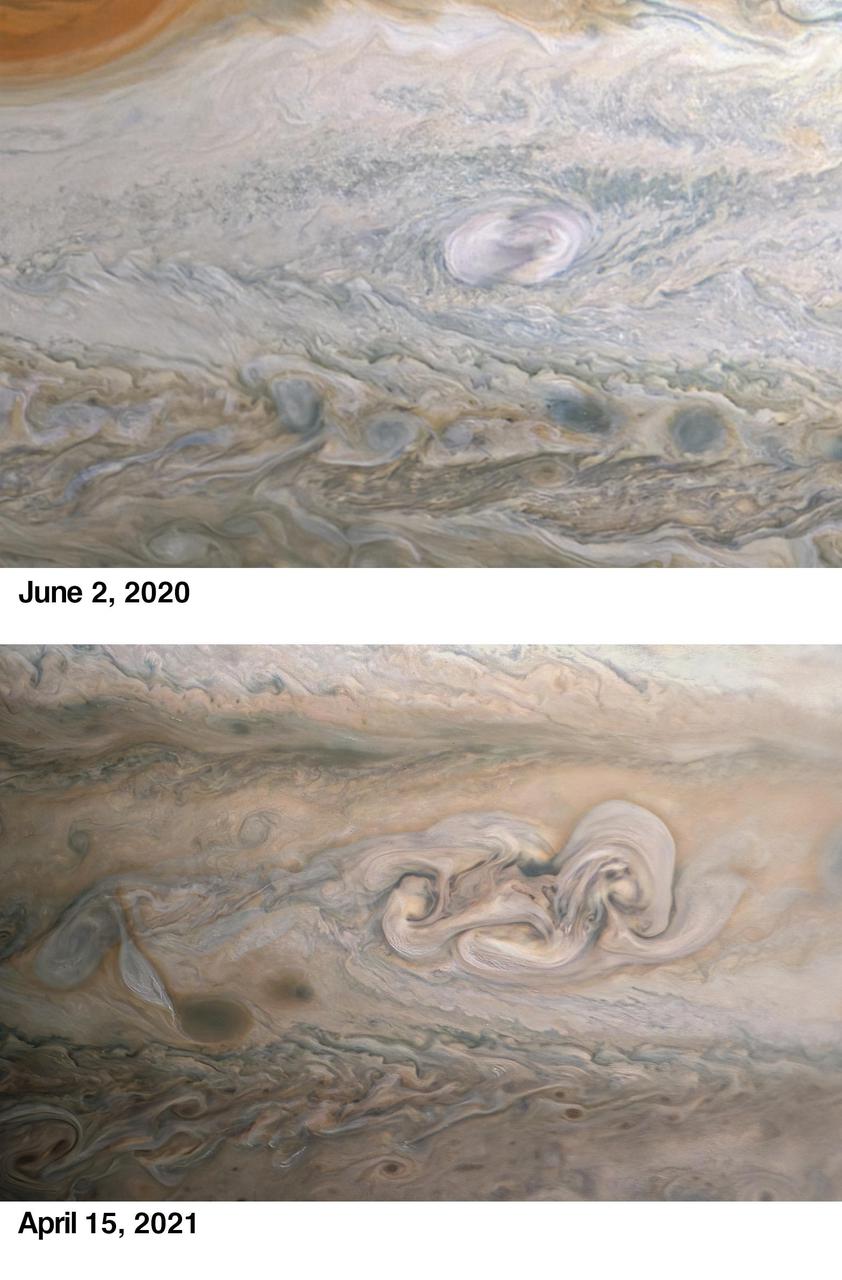
During its 33rd low pass over the cloud tops of Jupiter on April 15, 2021, NASA's Juno spacecraft captured the intriguing evolution of a feature in the giant planet's atmosphere known as "Clyde's Spot." The feature is informally named for amateur astronomer Clyde Foster of Centurion, South Africa, who discovered it in 2020 using his own 14-inch telescope. On June 2, 2020, just two days after Foster's initial discovery, Juno provided detailed observations of Clyde's Spot (upper image), which scientists determined was a plume of cloud material erupting above the top layers of the Jovian atmosphere just southeast of Jupiter's Great Red Spot, which is currently about 1.3 times as wide as Earth. These powerful convective outbreaks occasionally occur in this latitude band, known as the South Temperate Belt. The initial plume subsided quickly, and within a few weeks it was seen as a dark spot. Many features in Jupiter's highly dynamic atmosphere are short lived, but the April 2021 observation from the JunoCam instrument (lower image) revealed that nearly one year after its discovery, the remnant of Clyde's Spot had not only drifted away from the Great Red Spot but had also developed into a complex structure that scientists call a folded filamentary region. This region is twice as big in latitude and three times as big in longitude as the original spot, and has the potential to persist for an extended period of time. The upper image was taken on June 2, 2020, around 3:56 a.m. when the spacecraft was about 28,000 miles (45,000 kilometers) from Jupiter's cloud tops. The lower image was taken on April 15, 2021, at 4:58 p.m. PDT (7:58 p.m. EDT). At the time, the spacecraft was about 16,800 miles (27,000 kilometers) from Jupiter's cloud tops, at a latitude of about 30 degrees South. Another citizen scientist, Kevin M. Gill, processed both images from raw JunoCam data. https://photojournal.jpl.nasa.gov/catalog/PIA23609