The COWVR development team and instrument in a clean room at JPL. https://photojournal.jpl.nasa.gov/catalog/PIA24982
The COWVR instrument (center, wrapped in gold foil) in JPL's Environmental Test Laboratory during vibration testing. https://photojournal.jpl.nasa.gov/catalog/PIA24981
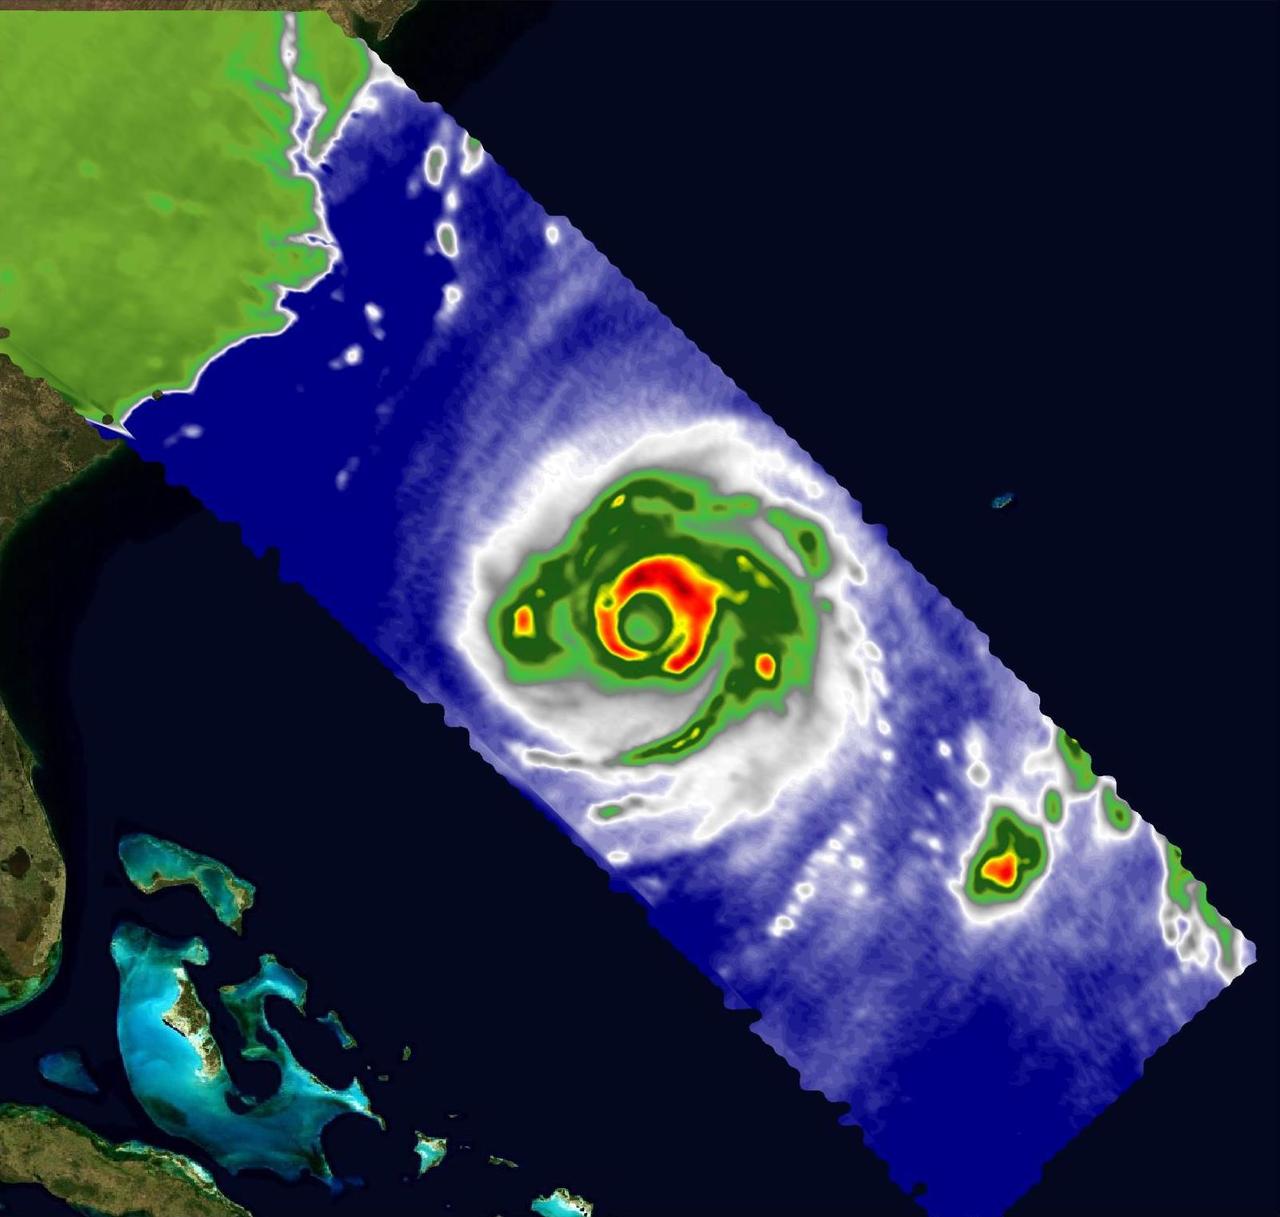
Two recently launched instruments that were designed and built at NASA's Jet Propulsion Laboratory in Southern California to provide forecasters data on weather over the open ocean captured images of Hurricane Ian on Sept. 27, 2022, as the storm approached Cuba on its way north toward the U.S. mainland. The instruments, Compact Ocean Wind Vector Radiometer (COWVR) and Temporal Experiment for Storms and Tropical Systems (TEMPEST), observe the planet's atmosphere and surface from aboard the International Space Station, which passed in low-Earth orbit over the Caribbean Sea at about 12:30 a.m. EDT. Ian made landfall in Cuba's Pinar del Rio province at 4:30 a.m. EDT, according to the National Hurricane Center. At that time, it was a Category 3 hurricane, with estimated wind speeds of 125 mph (205 kph). The image above combines microwave emissions measurements from both COWVR and TEMPEST. White sections indicate the presence of clouds. Green portions indicate rain. Yellow, red, and black indicate where air and water vapor were moving most swiftly. Ian's center is seen just off of Cuba's southern coast, and the storm is shown covering the island with rain and wind. COWVR and TEMPEST sent the data for this image back to Earth in a direct stream via NASA's tracking and data relay satellite (TDRS) constellation. The data were processed at JPL and made available to forecasters less than two hours after collection. About the size of a minifridge, COWVR measures natural microwave emissions over the ocean. The magnitude of the emissions increases with the amount of rain in the atmosphere, and the strongest rain produces the strongest microwave emissions. TEMPEST – comparable in size to a cereal box – tracks microwaves at a much shorter wavelength, allowing it to see ice particles within the hurricane's cloudy regions that are thrust into the upper atmosphere by the storm. Both microwave radiometers were conceived to demonstrate that smaller, more energy-efficient, more simply designed sensors can perform most of the same measurements as current space-based weather instruments that are heavier, consume more power, and cost much more to construct. COWVR's development was funded by the U.S. Space Force, and TEMPEST was developed with NASA funding. The U.S. Space Test Program-Houston 8 (STP-H8) is responsible for hosting the instruments on the space station under Space Force funding in partnership with NASA. Data from the instruments are being used by government and university weather forecasters and scientists. The mission will inform development of future space-based weather sensors, and scientists are working on mission concepts that would take advantage of the low-cost microwave sensor technologies to study long-standing questions, such as how heat from the ocean fuels global weather patterns. https://photojournal.jpl.nasa.gov/catalog/PIA25425
This map, made using the Compact Ocean Wind Vector Radiometer (COWVR) instrument's observations from Jan. 16 to 23, 2022, shows Earth's microwave emissions at a frequency of 34 gigahertz. This frequency provides information on the strength of winds at the ocean surface, the amount of water in clouds, and the amount of water vapor in the atmosphere. Green and white indicate higher water vapor and clouds, while dark blue over the ocean indicates drier air and clear sky. Typical weather patterns for January, such as tropical moisture and rain (the green band stretching across the center of the map), are visible. https://photojournal.jpl.nasa.gov/catalog/PIA24985
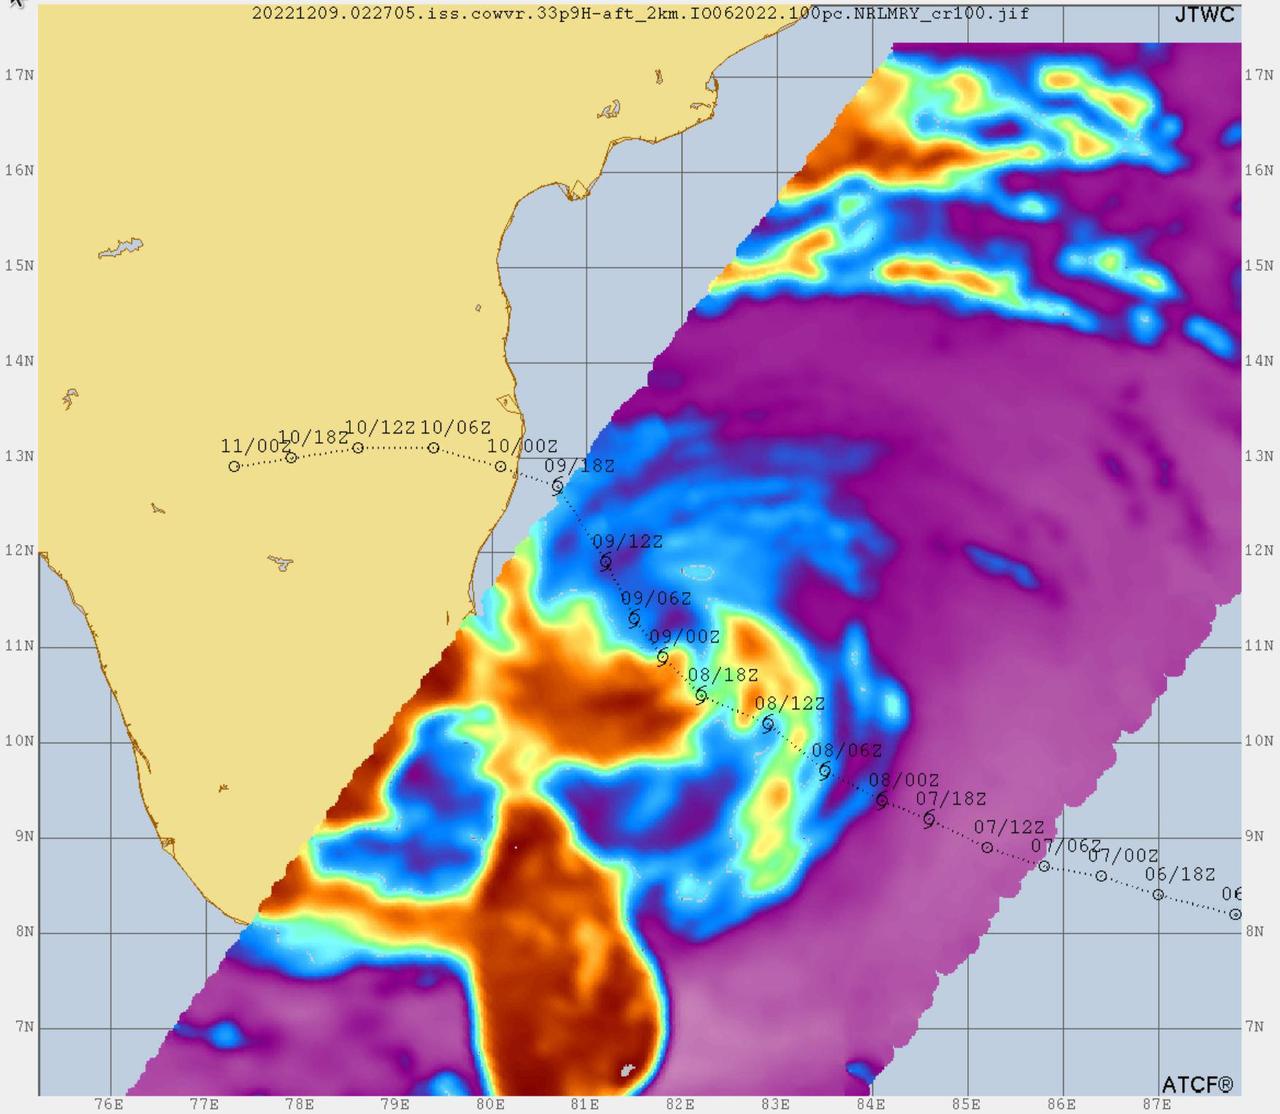
Data from two weather instruments developed at NASA's Jet Propulsion Laboratory in Southern California to provide forecasters data on weather over the open ocean were used to create this image of Tropical Cyclone Mandous on Dec. 9, 2022, as the storm approached the southeastern coast of India. Forecasters at the U.S. Joint Typhoon Warning Center in Pearl Harbor, Hawaii, used the image and others like it to understand the storm's intensity and track its path. The instruments, Compact Ocean Wind Vector Radiometer (COWVR) and Temporal Experiment for Storms and Tropical Systems (TEMPEST), observe the planet's atmosphere and surface from aboard the International Space Station. The image above uses 33.9 gigahertz microwave emissions measured from COWVR to detect structural features of Mandous, including its center, which is about 160 miles (250 kilometers) northeast of the northern tip of Sri Lanka. The colored portions over water indicate the presence of precipitation, with yellow and orange indicating where the storm is strongest, while blue shows where it's weakest. COWVR and TEMPEST sent the data for this image back to Earth in a direct stream via NASA's tracking and data relay satellite (TDRS) constellation. The data was processed at JPL, and meteorologists at the U.S. Naval Research Laboratory in Monterey, California, created the image, which they shared with the Joint Typhoon Warning Center. About the size of a minifridge, COWVR measures natural microwave emissions over the ocean. The magnitude of the emissions increases with the amount of rain in the atmosphere. TEMPEST – comparable in size to a cereal box – tracks microwaves at a much shorter wavelength, allowing it to detect atmospheric water vapor. Both microwave radiometers were conceived to demonstrate that smaller, more energy-efficient, more simply designed sensors can perform most of the same measurements as current space-based weather instruments that are heavier, consume more power, and cost much more to construct. COWVR's development was funded by the U.S. Space Force, and TEMPEST was developed with NASA funding. The U.S. Space Test Program-Houston 8 (STP-H8) is responsible for hosting the instruments on the space station under Space Force funding in partnership with NASA. Data from the instruments is being used by government and university weather forecasters and scientists. The mission will inform development of future space-based weather sensors, and scientists are working on mission concepts that would take advantage of the low-cost microwave sensor technologies to study long-standing questions, such as how heat from the ocean fuels global weather patterns. https://photojournal.jpl.nasa.gov/catalog/PIA25565
A pair of weather instruments built at NASA's Jet Propulsion Laboratory in Southern California captured images of Hurricane Franklin as the Category 4 storm moved off the East Coast of the United States on Aug. 29, 2023. COWVR (short for Compact Ocean Wind Vector Radiometer) and TEMPEST (Temporal Experiment for Storms and Tropical Systems) observe the planet's atmosphere and surface from aboard the International Space Station, which passed in low Earth orbit over the storm at about 9:58 a.m. EDT. This image combines microwave emissions measurements from both COWVR and TEMPEST. White sections indicate the presence of clouds. Green portions indicate rain. Yellow, red, and black indicate where air and water vapor were moving most vigorously. Franklin's center is seen about 700 miles (1,127 kilometers) east of Jacksonville, Florida, over the Atlantic Ocean. https://photojournal.jpl.nasa.gov/catalog/PIA25870
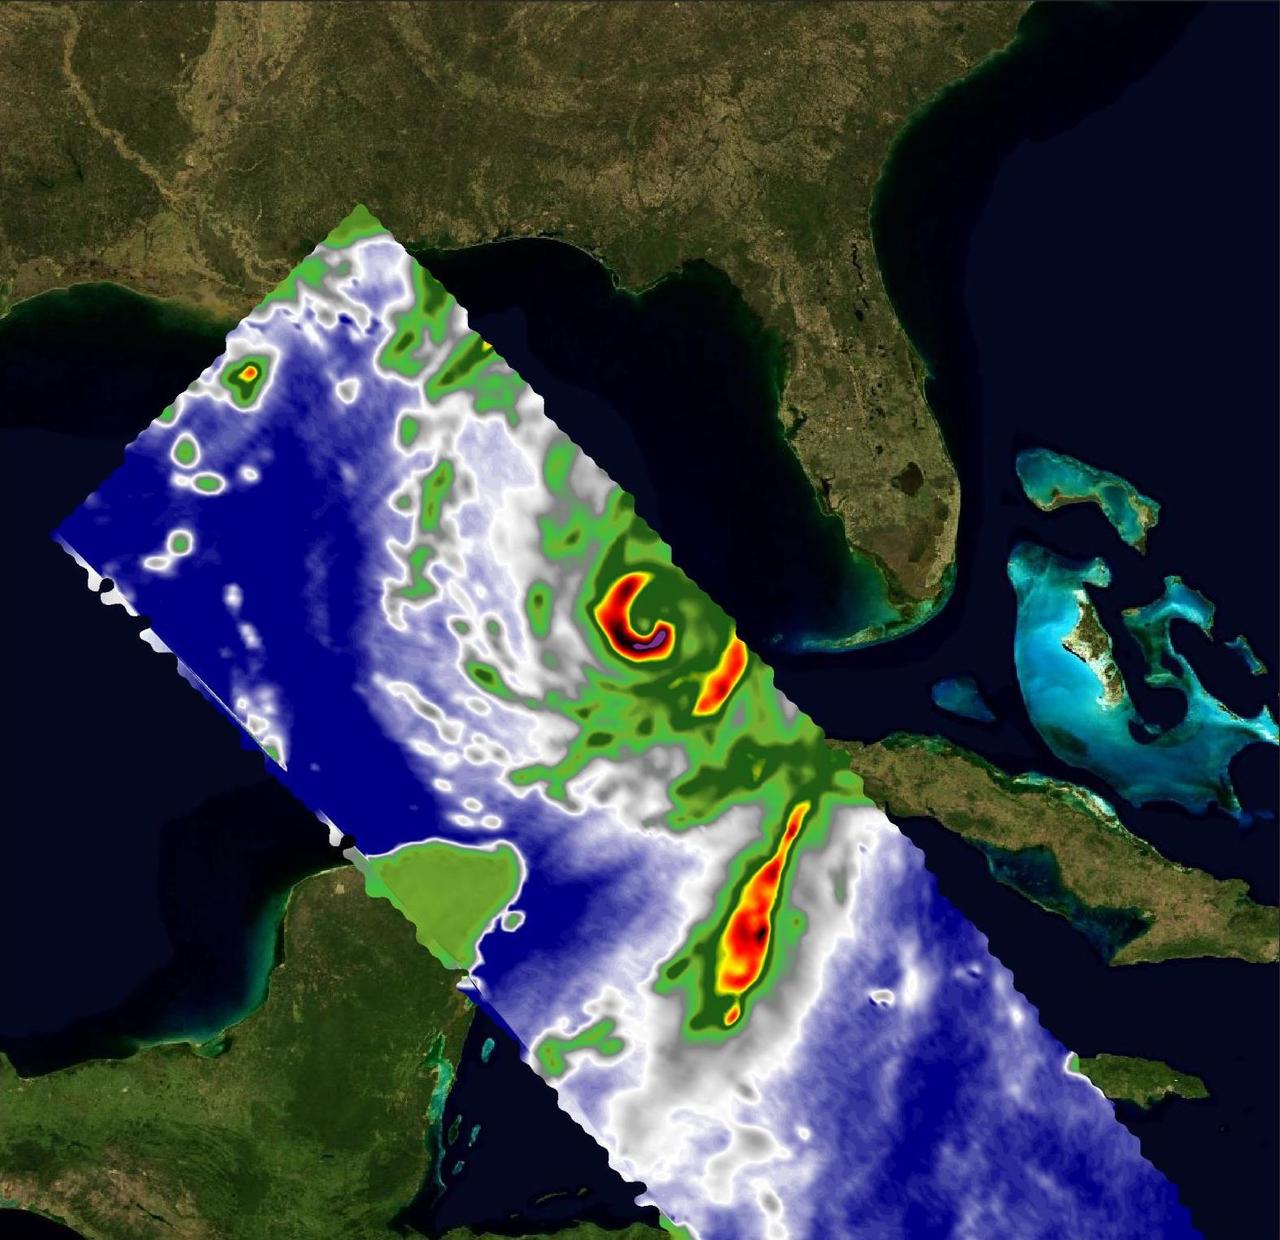
A pair of weather instruments built at NASA's Jet Propulsion Laboratory in Southern California captured images of Hurricane Idalia as the storm approached the Gulf Coast of Florida on Aug. 29, 2023. COWVR (short for Compact Ocean Wind Vector Radiometer) and TEMPEST (Temporal Experiment for Storms and Tropical Systems) observe the planet's atmosphere and surface from aboard the International Space Station, which passed in low Earth orbit over this area at about 11:34 a.m. EDT. Idalia was forecast to make landfall in Florida on Aug. 30. This image combines microwave emissions measurements from both COWVR and TEMPEST. White sections indicate the presence of clouds. Green portions indicate rain. Yellow, red, and black indicate where air and water vapor were moving most vigorously. Idalia's center is seen about 200 miles (322 kilometers) west of the Florida Keys, and rainfall is indicated on the western end of Cuba. https://photojournal.jpl.nasa.gov/catalog/PIA25569
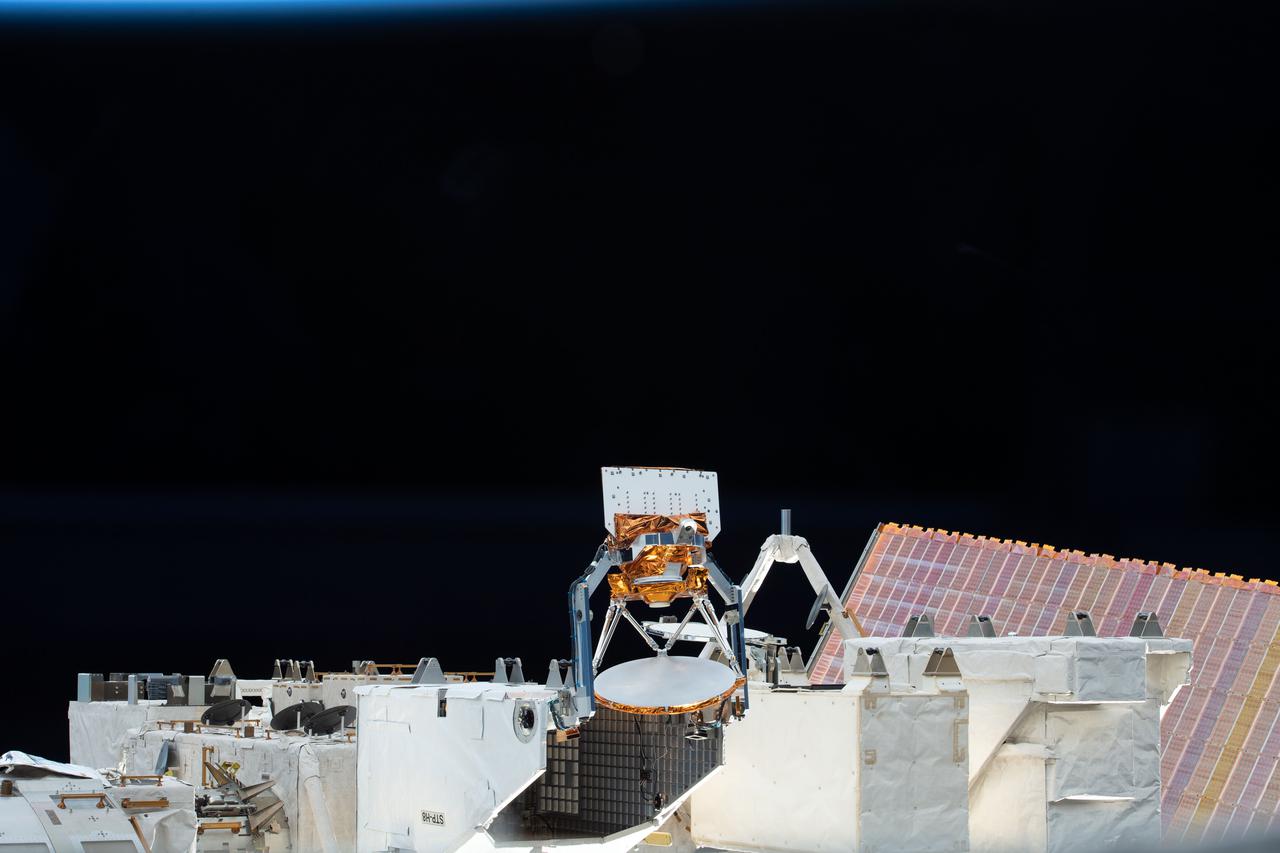
iss066e113950 (1/15/2022) --- A view of the STP-H8-COWVR aboard the International Space Station (ISS). The Space Test Program-Houston 8-Compact Ocean Wind Vector Radiometer (STP-H8-COWVR) demonstrates on-orbit use of a new terrestrial microwave meterological sensor designed to deliver accurate sea surface wind direction and speed data .
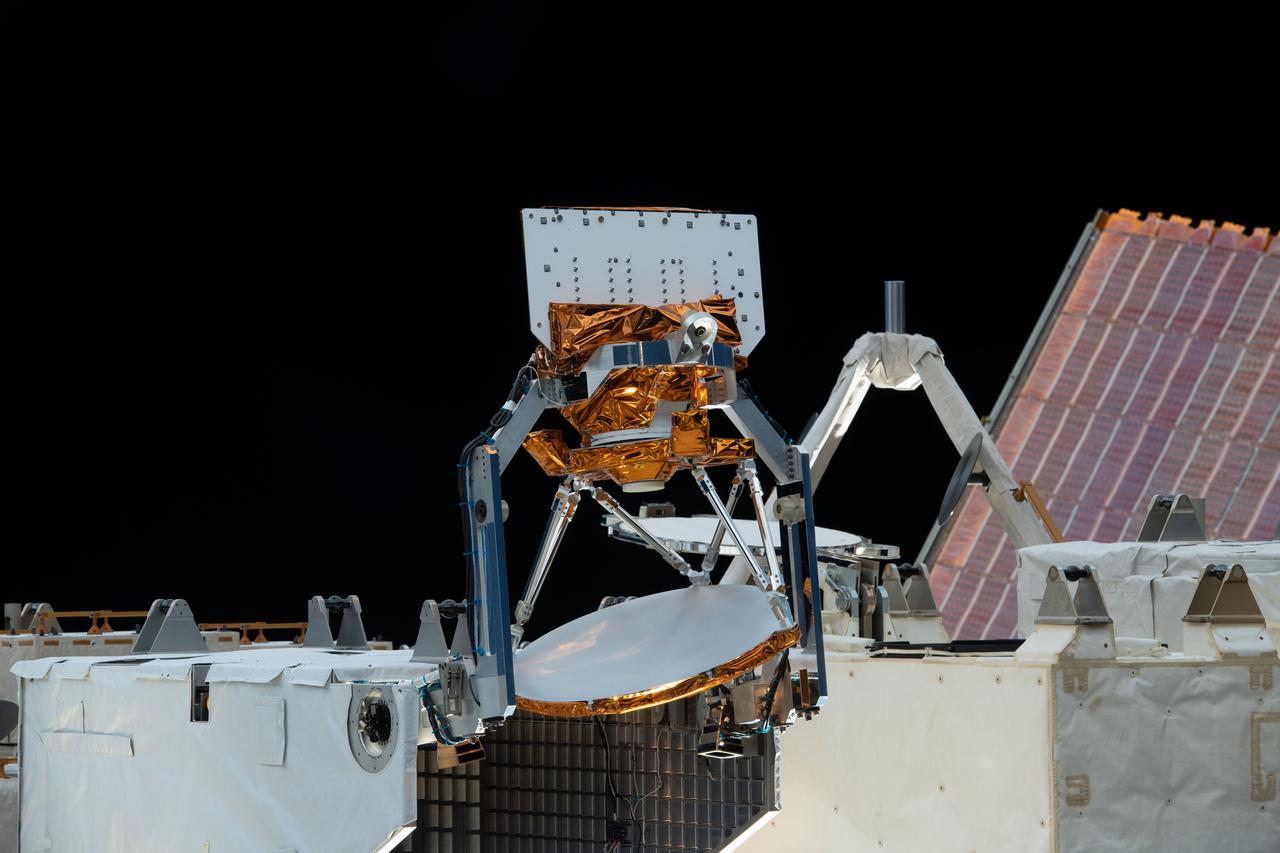
iss066e113944 (1/15/2022) --- A view of the STP-H8-COWVR aboard the International Space Station (ISS). The Space Test Program-Houston 8-Compact Ocean Wind Vector Radiometer (STP-H8-COWVR) demonstrates on-orbit use of a new terrestrial microwave meterological sensor designed to deliver accurate sea surface wind direction and speed data .
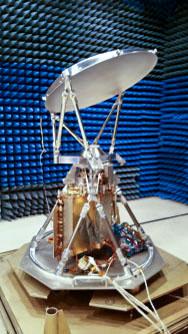
jsc2021e048037 (10/22/2021) --- A preflight view of COWVR during Antenna Range Testing. Space Test Program-Houston 8-Compact Ocean Wind Vector Radiometer (STP-H8-COWVR) demonstrates on-orbit use of a new terrestrial microwave meteorological sensor. It is designed to deliver accurate sea surface wind direction and speed data that are critical to naval surface operations and forecasting and tracking hurricanes and typhoons. Image courtesy of JPL.
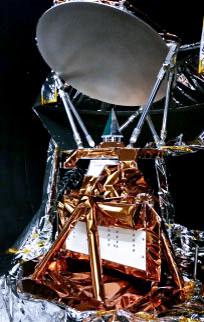
jsc2021e0480388 (10/22/2021) --- A preflight view of COWVR during TVAC Testing. Space Test Program-Houston 8-Compact Ocean Wind Vector Radiometer (STP-H8-COWVR) demonstrates on-orbit use of a new terrestrial microwave meteorological sensor. It is designed to deliver accurate sea surface wind direction and speed data that are critical to naval surface operations and forecasting and tracking hurricanes and typhoons. Image courtesy of JPL.
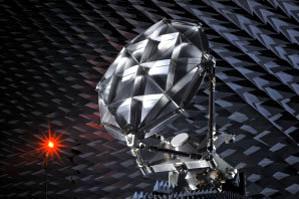
jsc2021e048036 (10/22/2021) --- A preflight view of COWVR during EMC Testing. Space Test Program-Houston 8-Compact Ocean Wind Vector Radiometer (STP-H8-COWVR) demonstrates on-orbit use of a new terrestrial microwave meteorological sensor. It is designed to deliver accurate sea surface wind direction and speed data that are critical to naval surface operations and forecasting and tracking hurricanes and typhoons. Image courtesy of JPL.