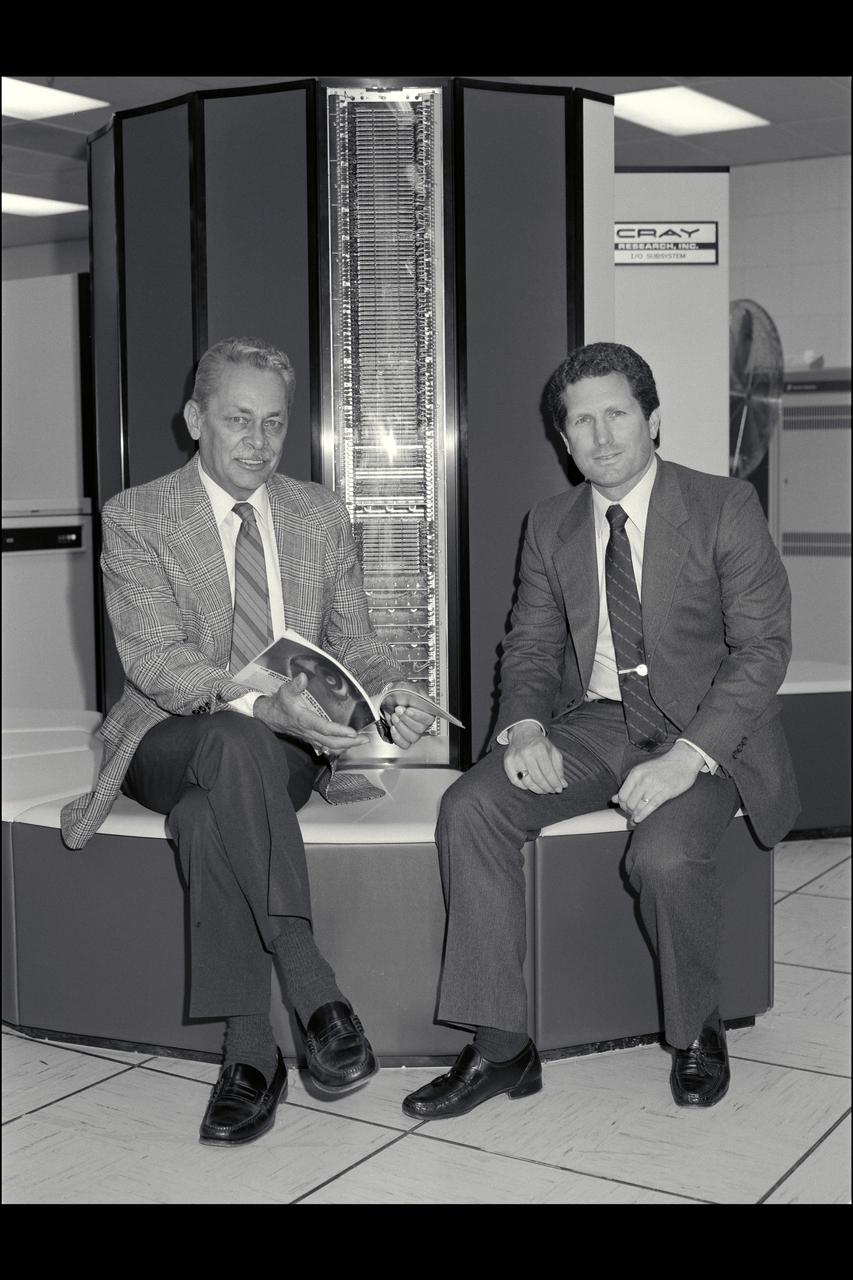
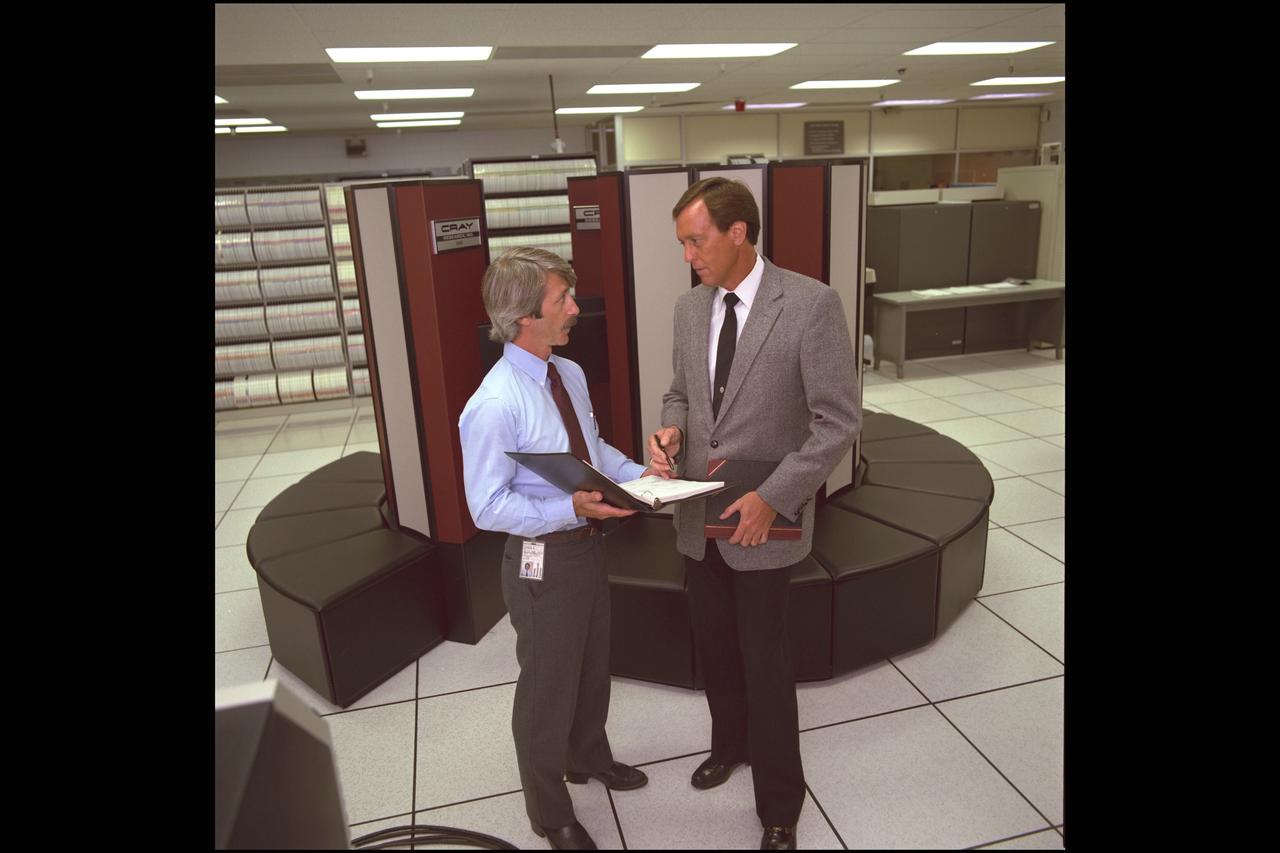
N-233 Cray Computer Ames Director Bill Ballhaus seated with Stan Miller in front of the Cray Computer in N-233
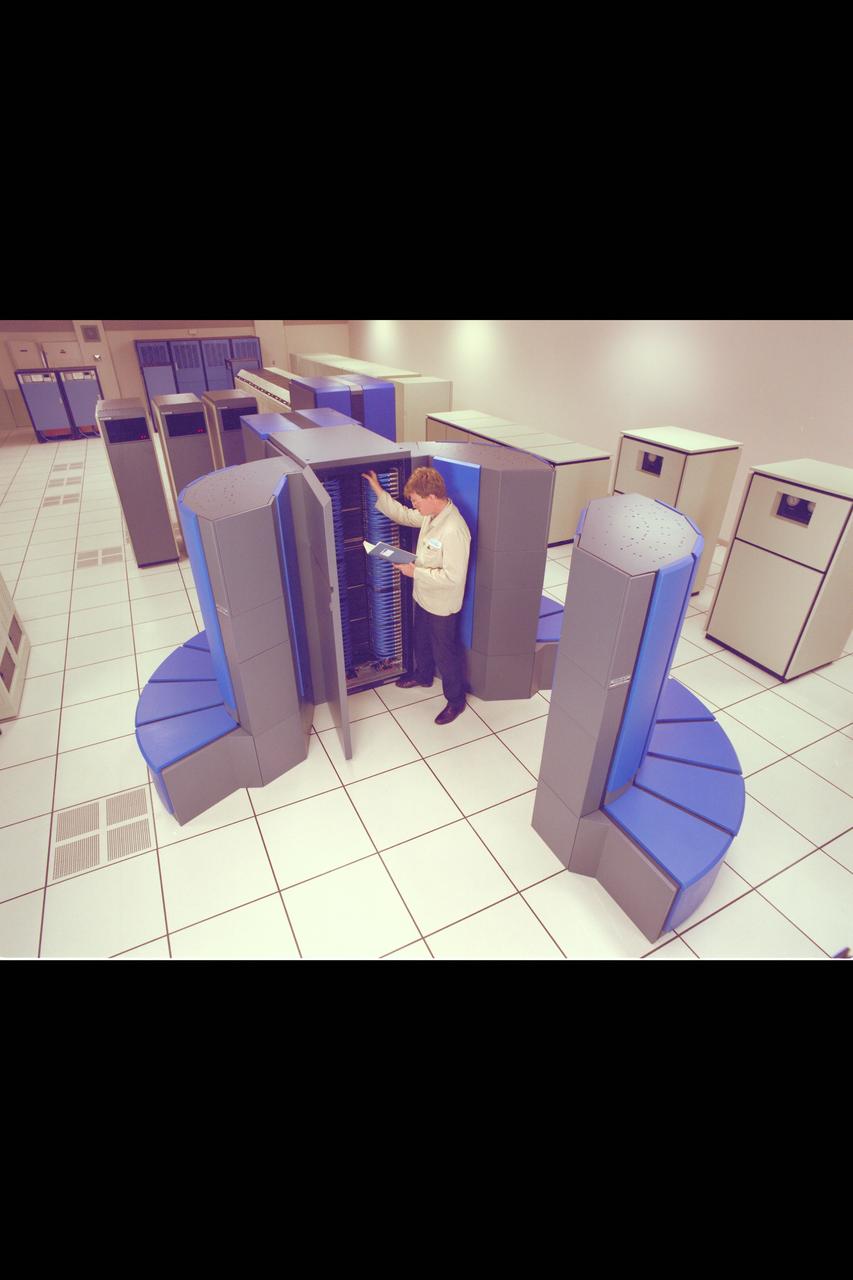
Cray YMP supercomputer Nas N-258 facility
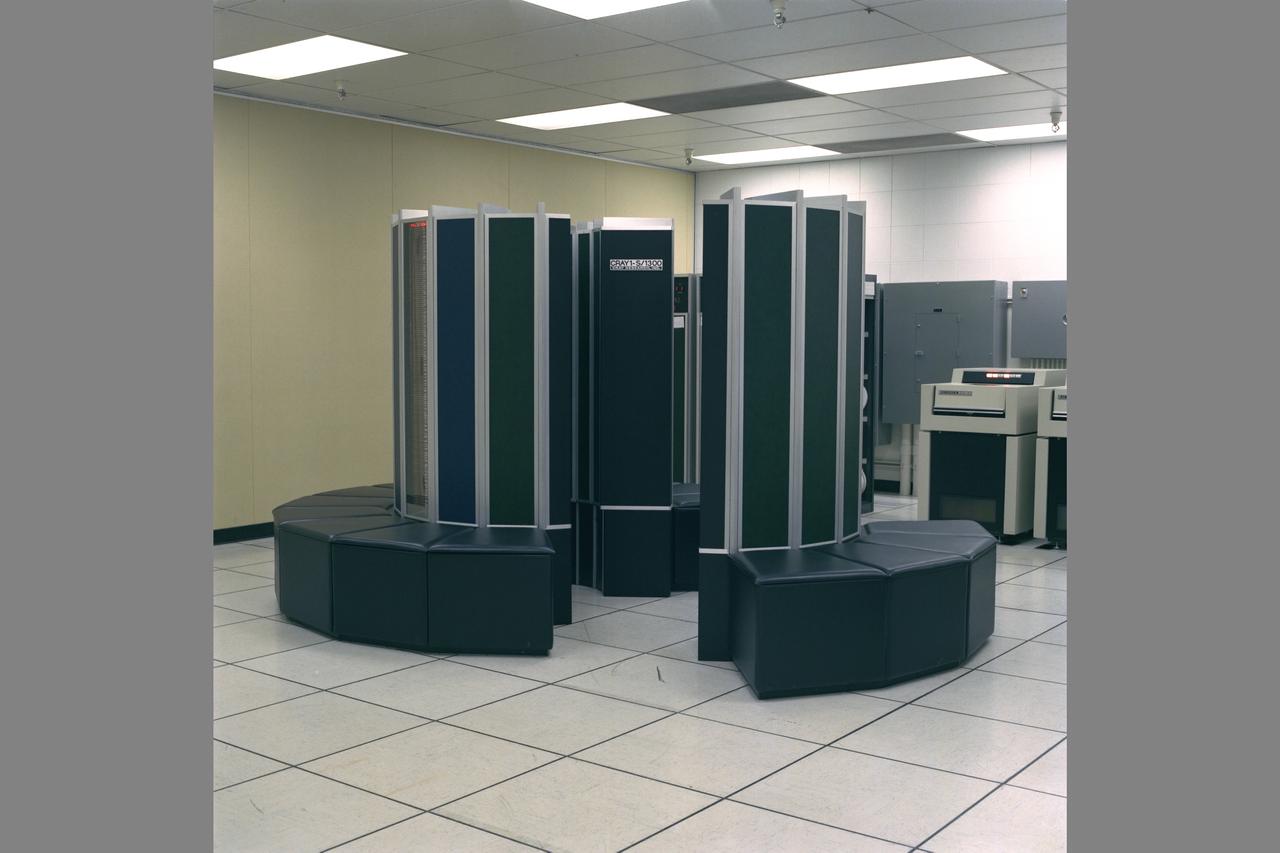
Cray 1S computer N-233A rm-190
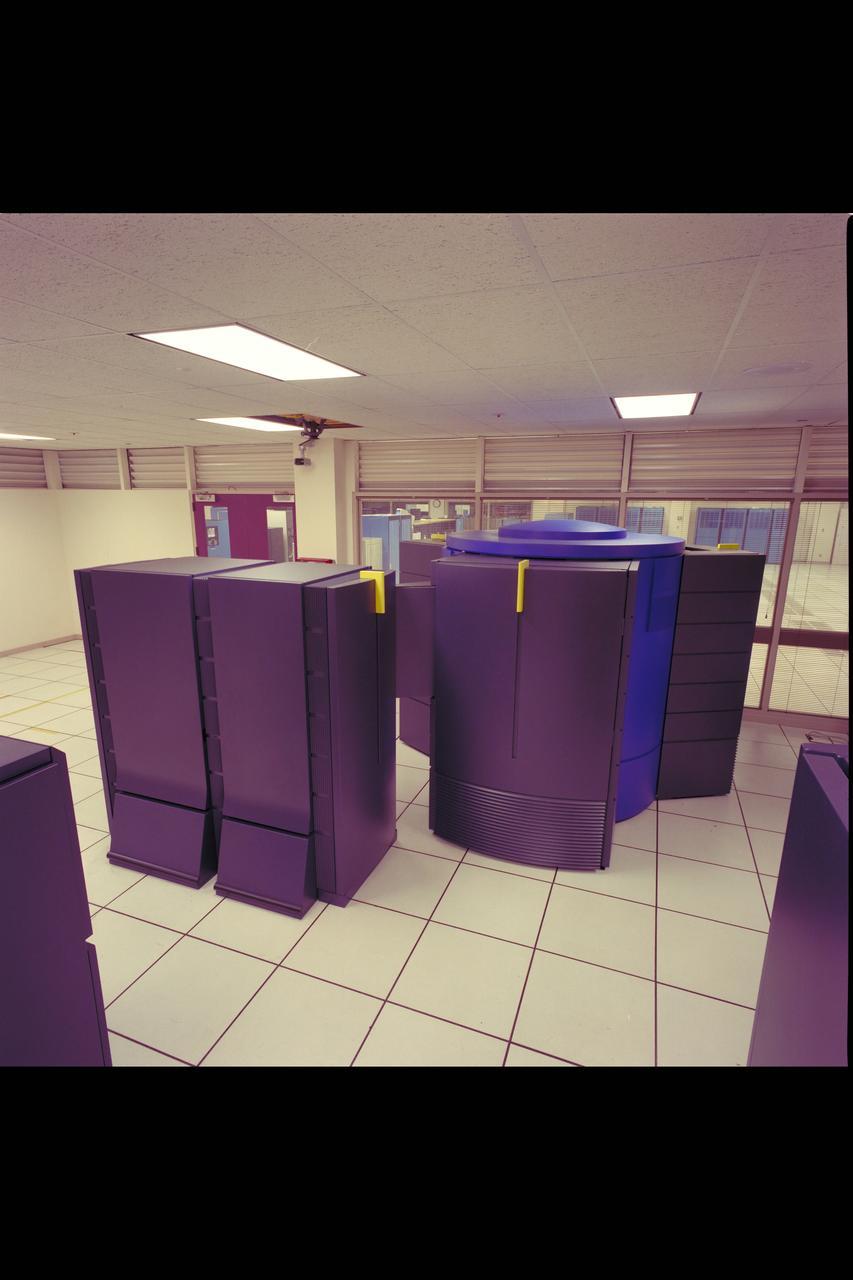
N-258 NAS PARRALLEL PROCESSORS, CRAY C-90
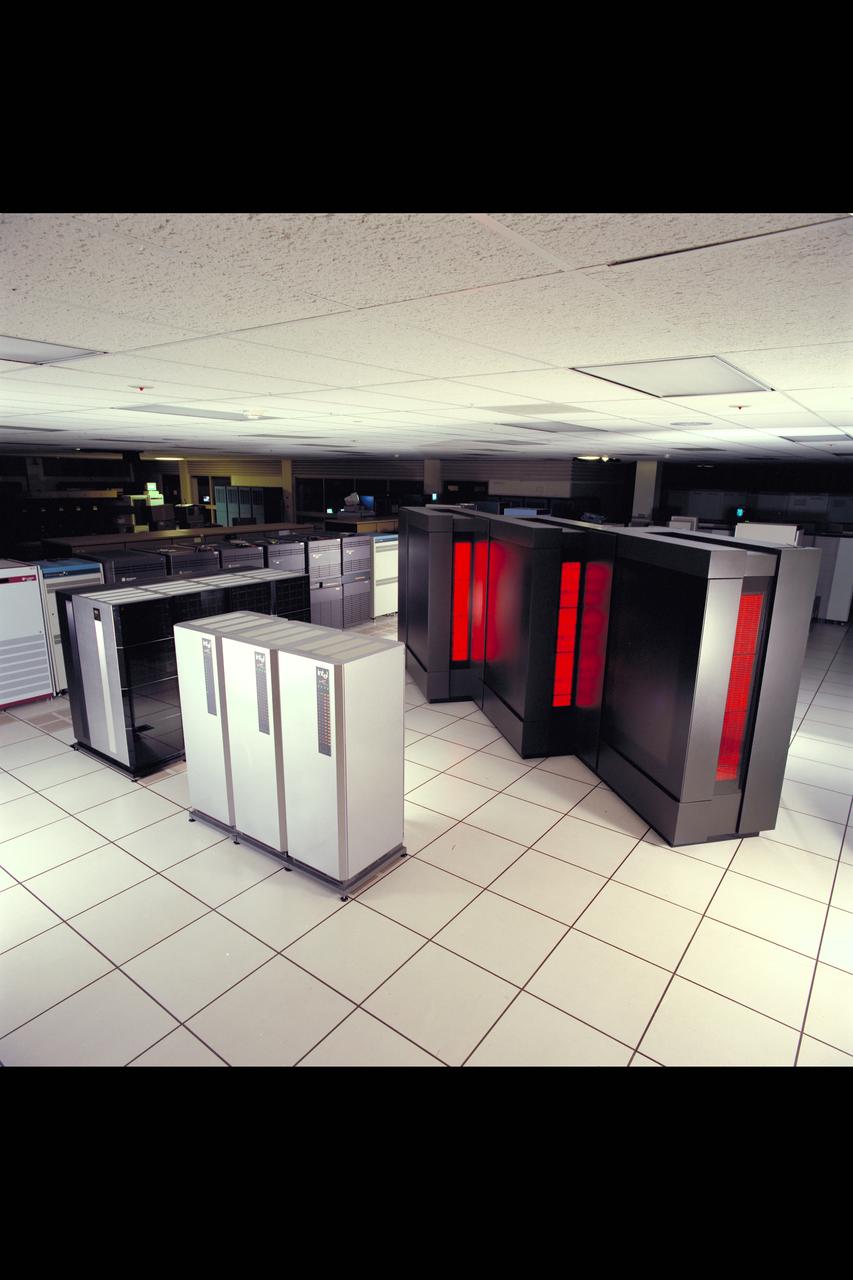
N-258 NAS COMPUTER ROOM SHOWING PARRALLEL PROCESSORS, INTEL PARGON, THINKING MACHINE (CM-5), & CRAY C-90
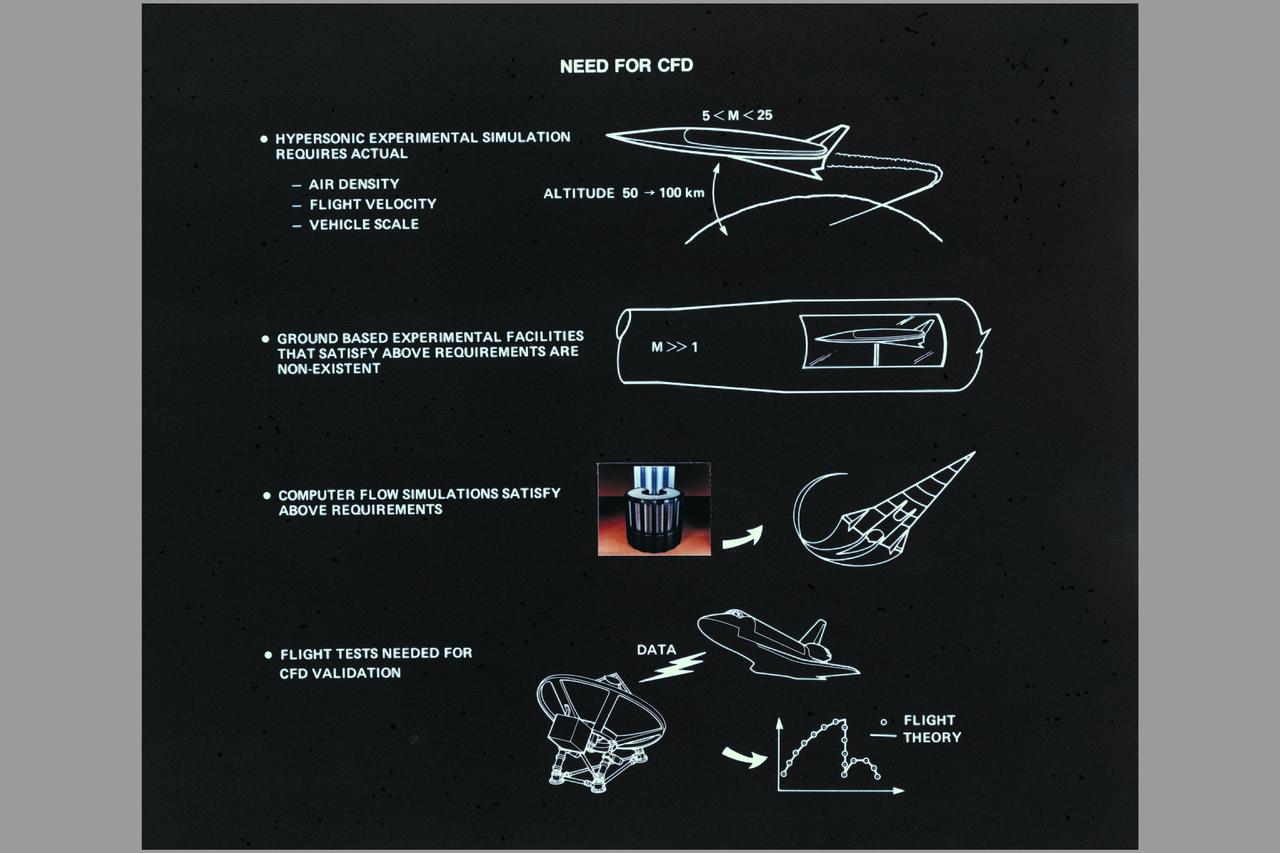
CFD Composite: Aerospace Plane, Cray-2, Space Shuttle (Ref: AC85-0002-6.1)
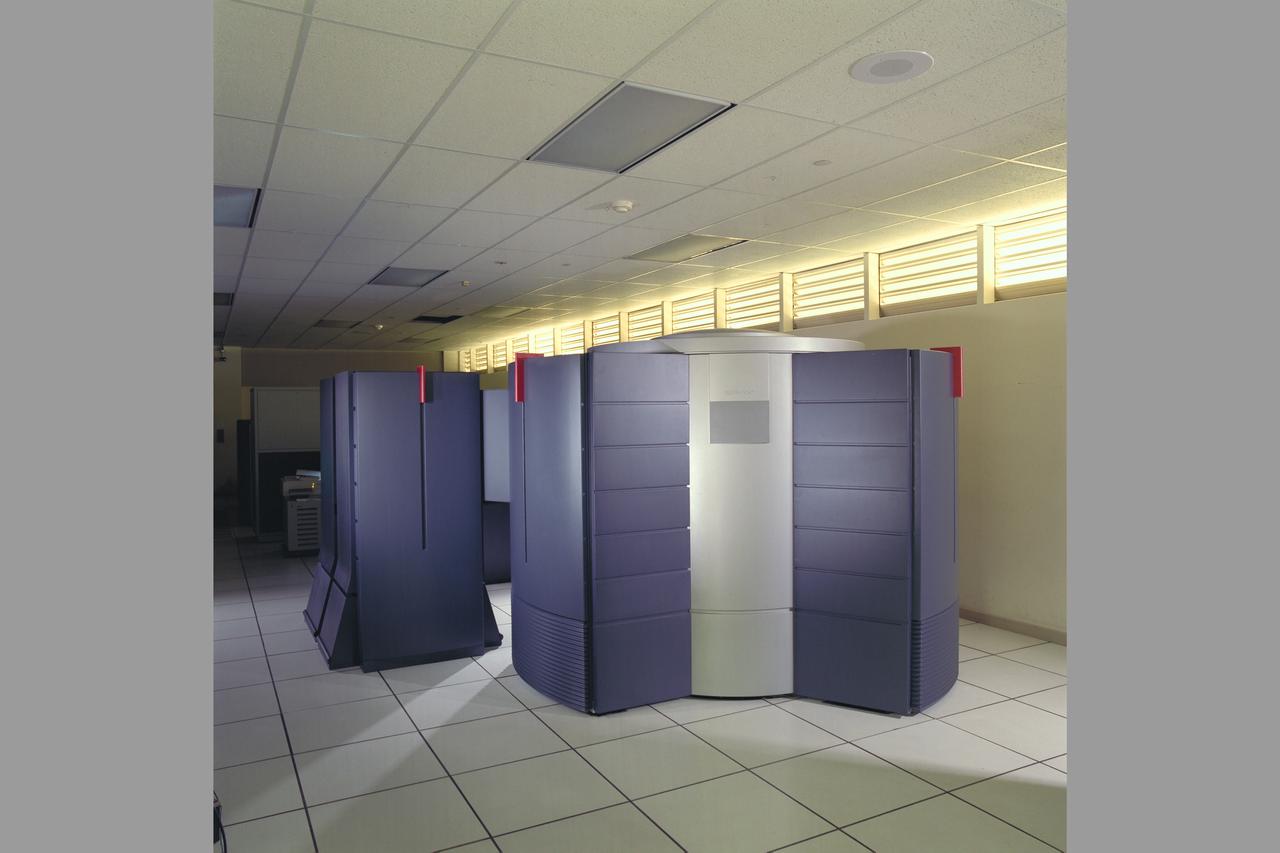
N-258 NAS (Numerical Aerodynamic Simulation) Computers - Cray C-90
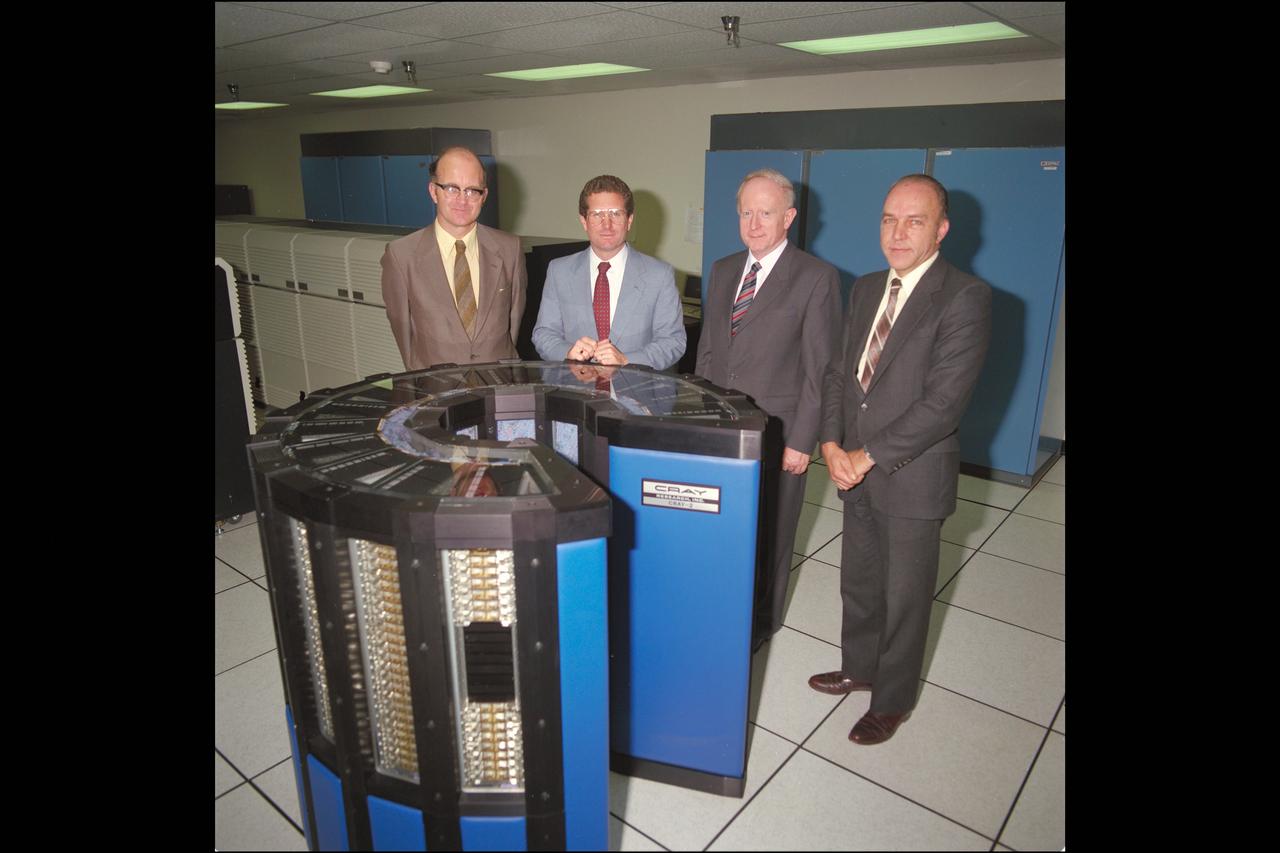
Ames Director William 'Bill' Ballhaus (center left) joins visitor Sir Jeffrey Pope from Royla Aircraft Industry, England (center right) at the NAS Facility Cray 2 computer with Ron Deiss, NAS Deputy Manager (L) and Vic Peterson, Ames Deputy Director (R).
Cray 550 Computer installed in N-233 with B Rosen and Dr. Paul Kutler. Dr. Kutler (right) guided much of Ames' work in computaitonal fluid dynamics used in Ames 60 yr. History NASA SP-2000-4314
CRAY AND SP-2 COMPUTERS
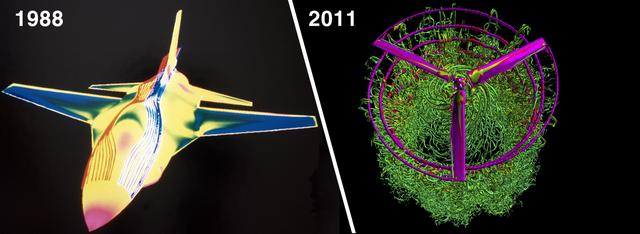
Then and Now: These images illustrate the dramatic improvement in NASA computing power over the last 23 years, and its effect on the number of grid points used for flow simulations. At left, an image from the first full-body Navier-Stokes simulation (1988) of an F-16 fighter jet showing pressure on the aircraft body, and fore-body streamlines at Mach 0.90. This steady-state solution took 25 hours using a single Cray X-MP processor to solve the 500,000 grid-point problem. Investigator: Neal Chaderjian, NASA Ames Research Center At right, a 2011 snapshot from a Navier-Stokes simulation of a V-22 Osprey rotorcraft in hover. The blade vortices interact with the smaller turbulent structures. This very detailed simulation used 660 million grid points, and ran on 1536 processors on the Pleiades supercomputer for 180 hours. Investigator: Neal Chaderjian, NASA Ames Research Center; Image: Tim Sandstrom, NASA Ames Research Center
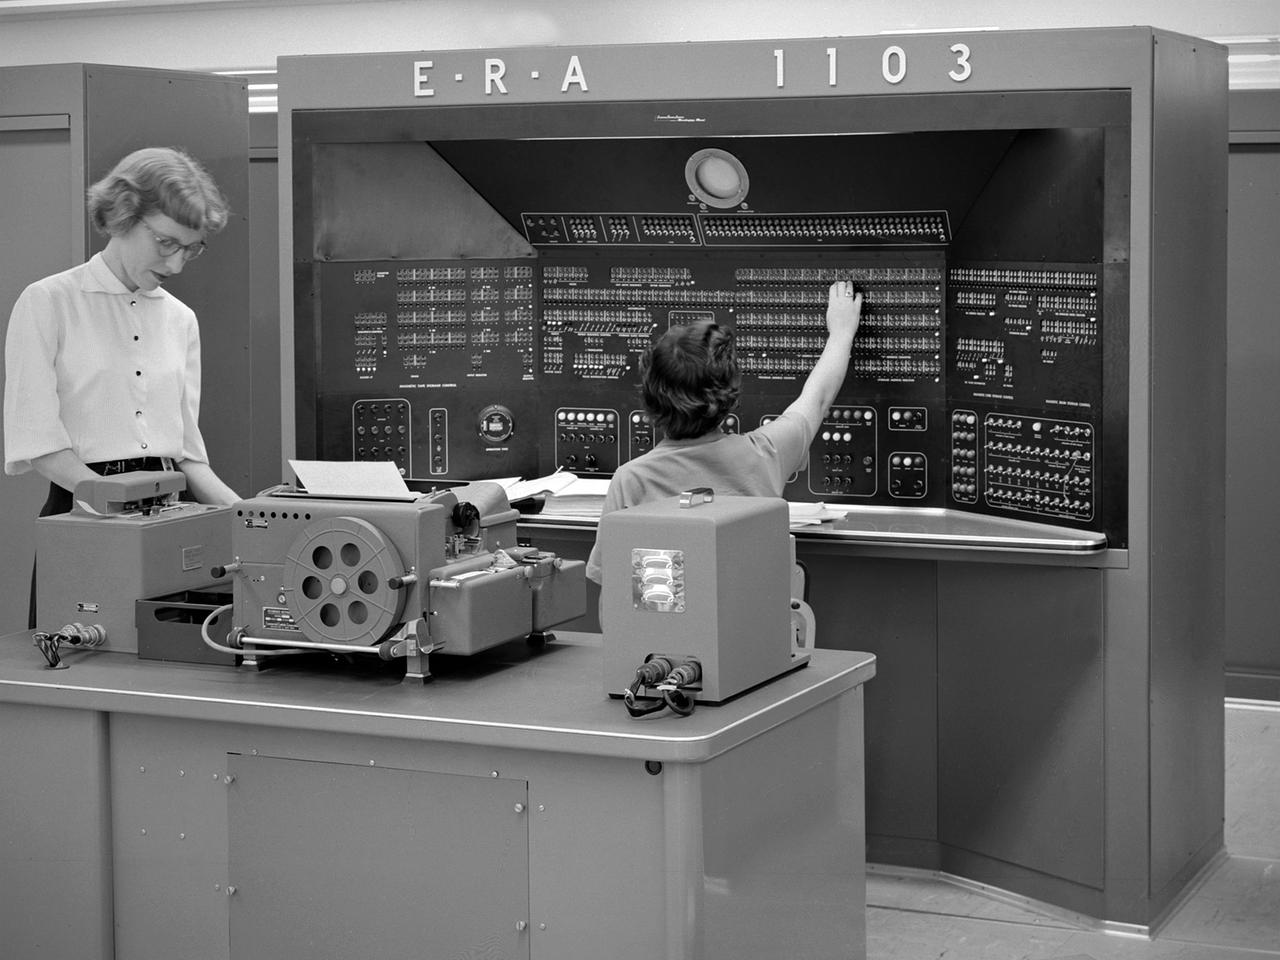
The new 10-by 10-Foot Supersonic Wind Tunnel at the Lewis Flight Propulsion Laboratory included high tech data acquisition and analysis systems. The reliable gathering of pressure, speed, temperature, and other data from test runs in the facilities was critical to the research process. Throughout the 1940s and early 1950s female employees, known as computers, recorded all test data and performed initial calculations by hand. The introduction of punch card computers in the late 1940s gradually reduced the number of hands-on calculations. In the mid-1950s new computational machines were installed in the office building of the 10-by 10-Foot tunnel. The new systems included this UNIVAC 1103 vacuum tube computer—the lab’s first centralized computer system. The programming was done on paper tape and fed into the machine. The 10-by 10 computer center also included the Lewis-designed Computer Automated Digital Encoder (CADDE) and Digital Automated Multiple Pressure Recorder (DAMPR) systems which converted test data to binary-coded decimal numbers and recorded test pressures automatically, respectively. The systems primarily served the 10-by 10, but were also applied to the other large facilities. Engineering Research Associates (ERA) developed the initial UNIVAC computer for the Navy in the late 1940s. In 1952 the company designed a commercial version, the UNIVAC 1103. The 1103 was the first computer designed by Seymour Cray and the first commercially successful computer.
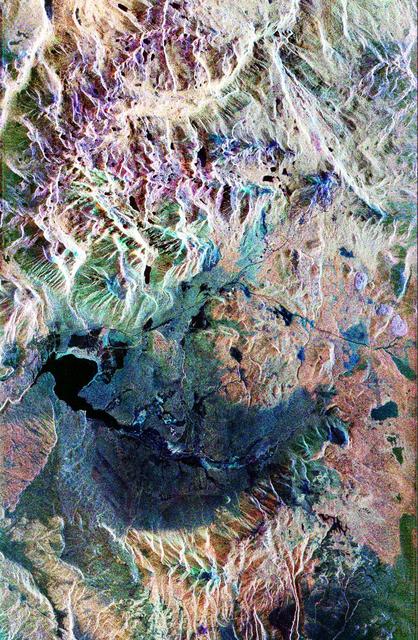
This false-color composite radar image of the Mammoth Mountain area in the Sierra Nevada Mountains, California, was acquired by the Spaceborne Imaging Radar-C and X-band Synthetic Aperture Radar aboard the space shuttle Endeavour on its 67th orbit on October 3, 1994. The image is centered at 37.6 degrees north latitude and 119.0 degrees west longitude. The area is about 39 kilometers by 51 kilometers (24 miles by 31 miles). North is toward the bottom, about 45 degrees to the right. In this image, red was created using L-band (horizontally transmitted/vertically received) polarization data; green was created using C-band (horizontally transmitted/vertically received) polarization data; and blue was created using C-band (horizontally transmitted and received) polarization data. Crawley Lake appears dark at the center left of the image, just above or south of Long Valley. The Mammoth Mountain ski area is visible at the top right of the scene. The red areas correspond to forests, the dark blue areas are bare surfaces and the green areas are short vegetation, mainly brush. The purple areas at the higher elevations in the upper part of the scene are discontinuous patches of snow cover from a September 28 storm. New, very thin snow was falling before and during the second space shuttle pass. In parallel with the operational SIR-C data processing, an experimental effort is being conducted to test SAR data processing using the Jet Propulsion Laboratory's massively parallel supercomputing facility, centered around the Cray Research T3D. These experiments will assess the abilities of large supercomputers to produce high throughput Synthetic Aperture Radar processing in preparation for upcoming data-intensive SAR missions. The image released here was produced as part of this experimental effort. http://photojournal.jpl.nasa.gov/catalog/PIA01746
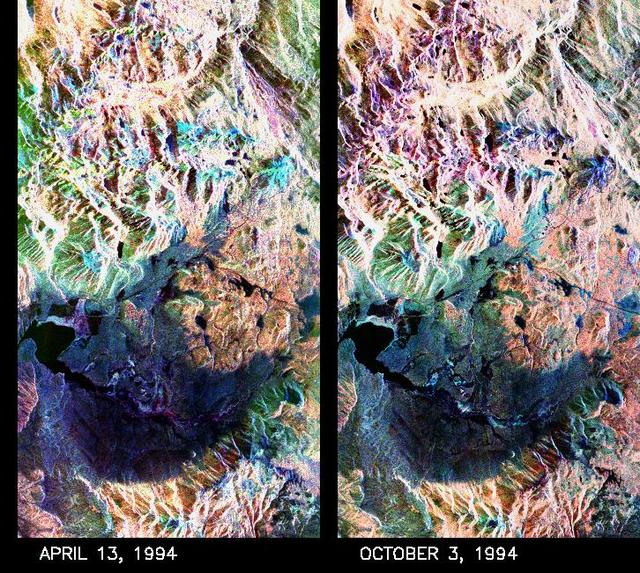
These two false-color composite images of the Mammoth Mountain area in the Sierra Nevada Mountains, Calif., show significant seasonal changes in snow cover. The image at left was acquired by the Spaceborne Imaging Radar-C and X-band Synthetic Aperture Radar aboard the space shuttle Endeavour on its 67th orbit on April 13, 1994. The image is centered at 37.6 degrees north latitude and 119 degrees west longitude. The area is about 36 kilometers by 48 kilometers (22 miles by 29 miles). In this image, red is L-band (horizontally transmitted and vertically received) polarization data; green is C-band (horizontally transmitted and vertically received) polarization data; and blue is C-band (horizontally transmitted and received) polarization data. The image at right was acquired on October 3, 1994, on the space shuttle Endeavour's 67th orbit of the second radar mission. Crowley Lake appears dark at the center left of the image, just above or south of Long Valley. The Mammoth Mountain ski area is visible at the top right of the scene. The red areas correspond to forests, the dark blue areas are bare surfaces and the green areas are short vegetation, mainly brush. The changes in color tone at the higher elevations (e.g. the Mammoth Mountain ski area) from green-blue in April to purple in September reflect changes in snow cover between the two missions. The April mission occurred immediately following a moderate snow storm. During the mission the snow evolved from a dry, fine-grained snowpack with few distinct layers to a wet, coarse-grained pack with multiple ice inclusions. Since that mission, all snow in the area has melted except for small glaciers and permanent snowfields on the Silver Divide and near the headwaters of Rock Creek. On October 3, 1994, only discontinuous patches of snow cover were present at very high elevations following the first snow storm of the season on September 28, 1994. For investigations in hydrology and land-surface climatology, seasonal snow cover and alpine glaciers are critical to the radiation and water balances. SIR-C/X-SAR is a powerful tool because it is sensitive to most snowpack conditions and is less influenced by weather conditions than other remote sensing instruments, such as Landsat. In parallel with the operational SIR-C data processing, an experimental effort is being conducted to test SAR data processing using the Jet Propulsion Laboratory's massively parallel supercomputing facility, centered around the Cray Research T3D. These experiments will assess the abilities of large supercomputers to produce high throughput SAR processing in preparation for upcoming data-intensive SAR missions. The images released here were produced as part of this experimental effort. http://photojournal.jpl.nasa.gov/catalog/PIA01753