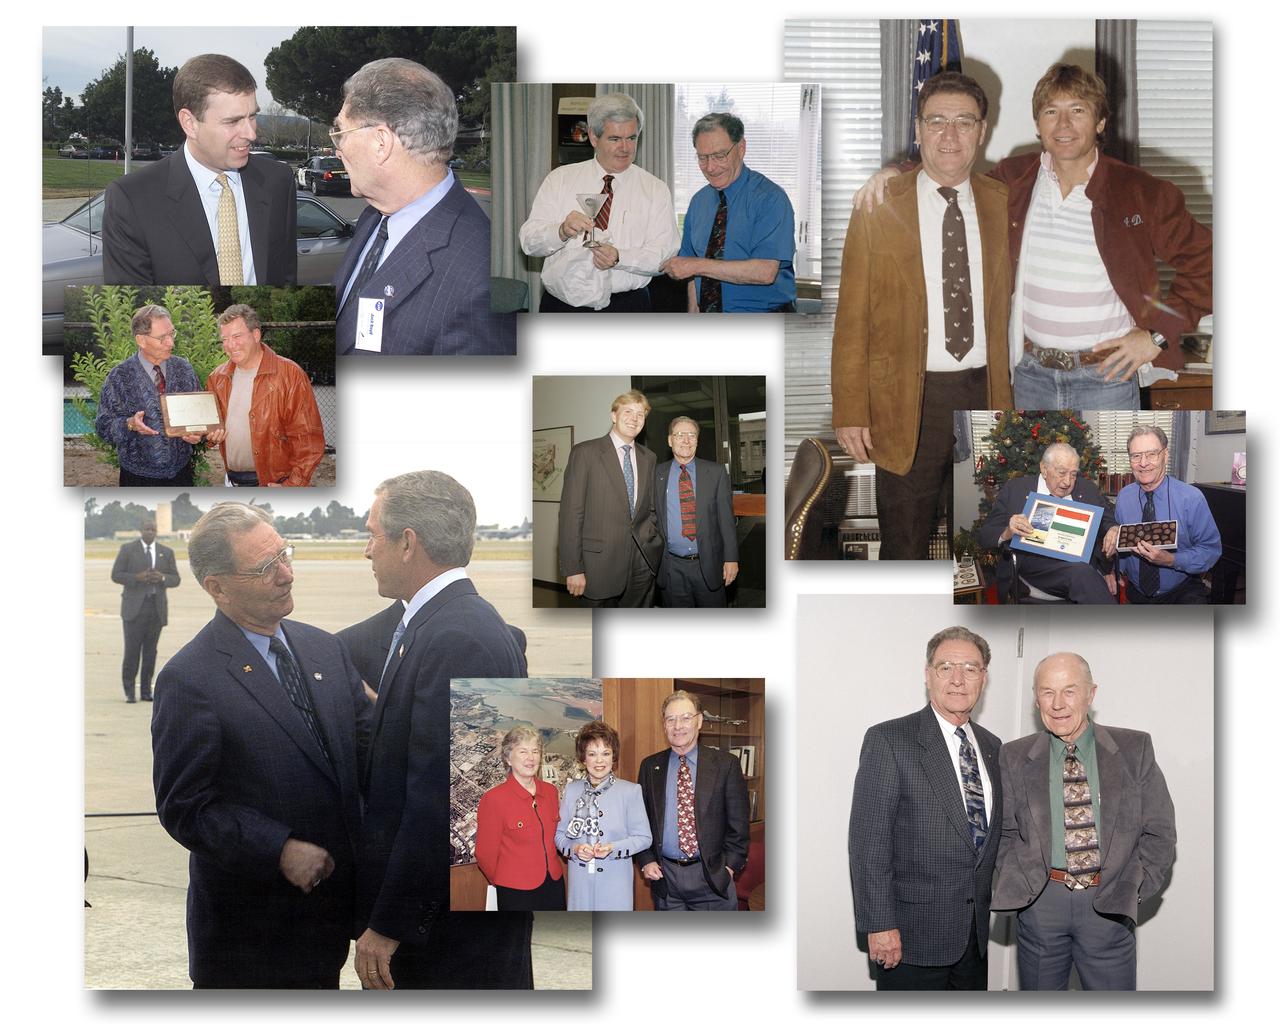
Jack Boyd greeting VIP visitors to NASA Ames Research Center Top left to right; His Royal Highness (HRH) Prince Andrew, Duke of York (AC02-0028 series) Senator Newt Gingrich (AC00-0032 series) Singer John Denver (AC85-0686 series) Middle; Prince Willem Alexander, Crown Prince of the Netherlands (AC99-0013 series) Bottom left to right; United States President George G.W. Bush (ACD02-0082 series), Actor and Diplomat Shirley Temple Black (AC99-0071 series). Air Force Test Pilot Charles 'Chuck' Yeager AC98-0204 series).
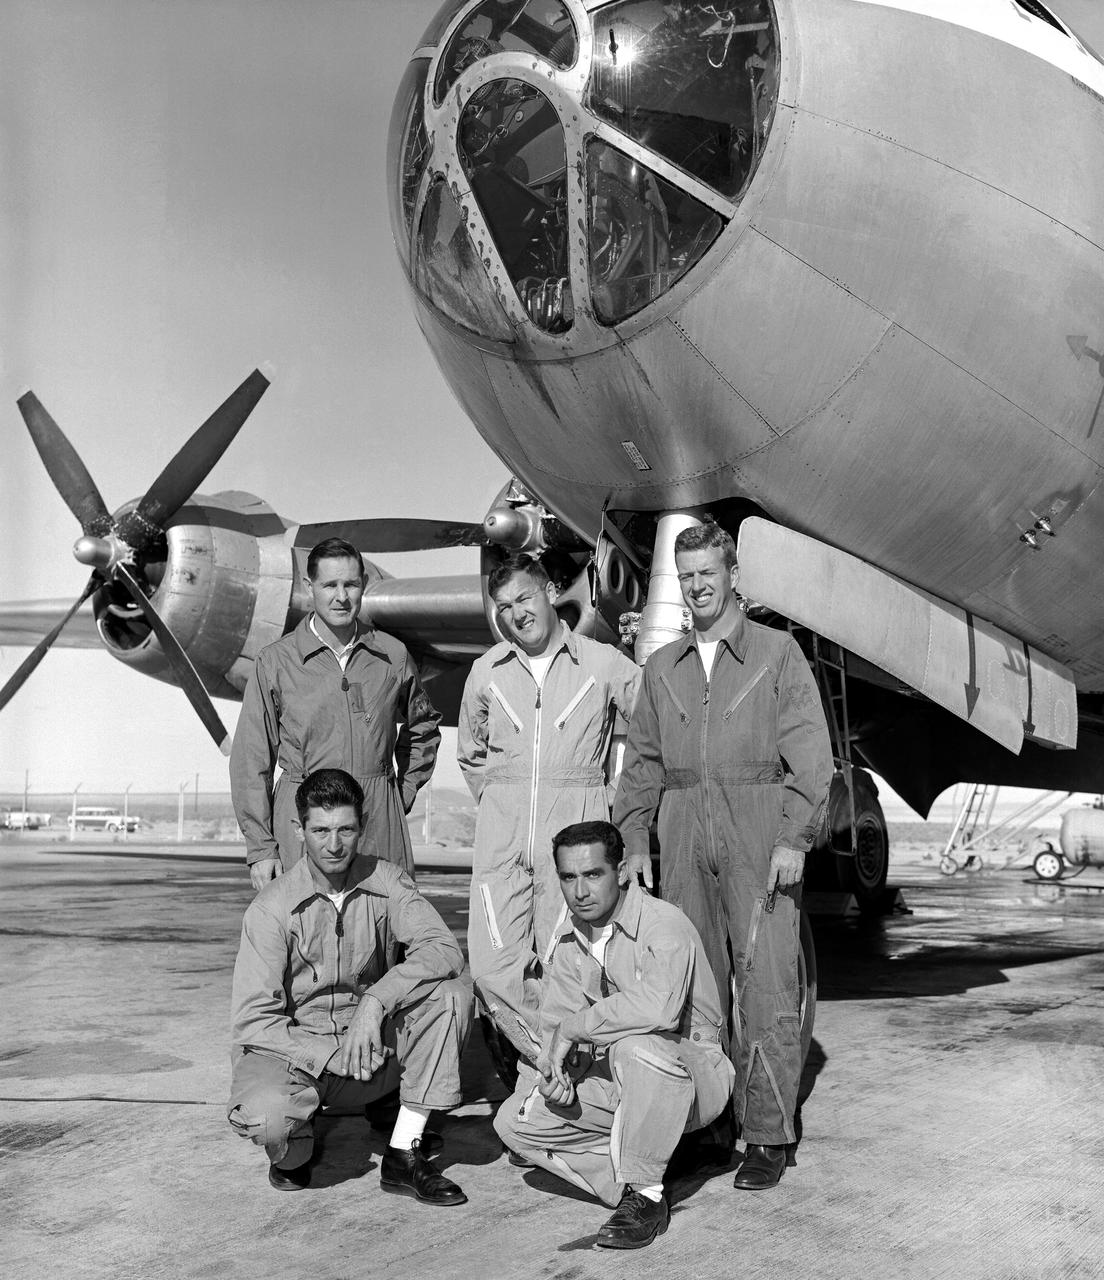
B-29 mothership with pilots - Dick Payne, Stan Butchart, Joe Walker, Charles Littleton, and John Moise
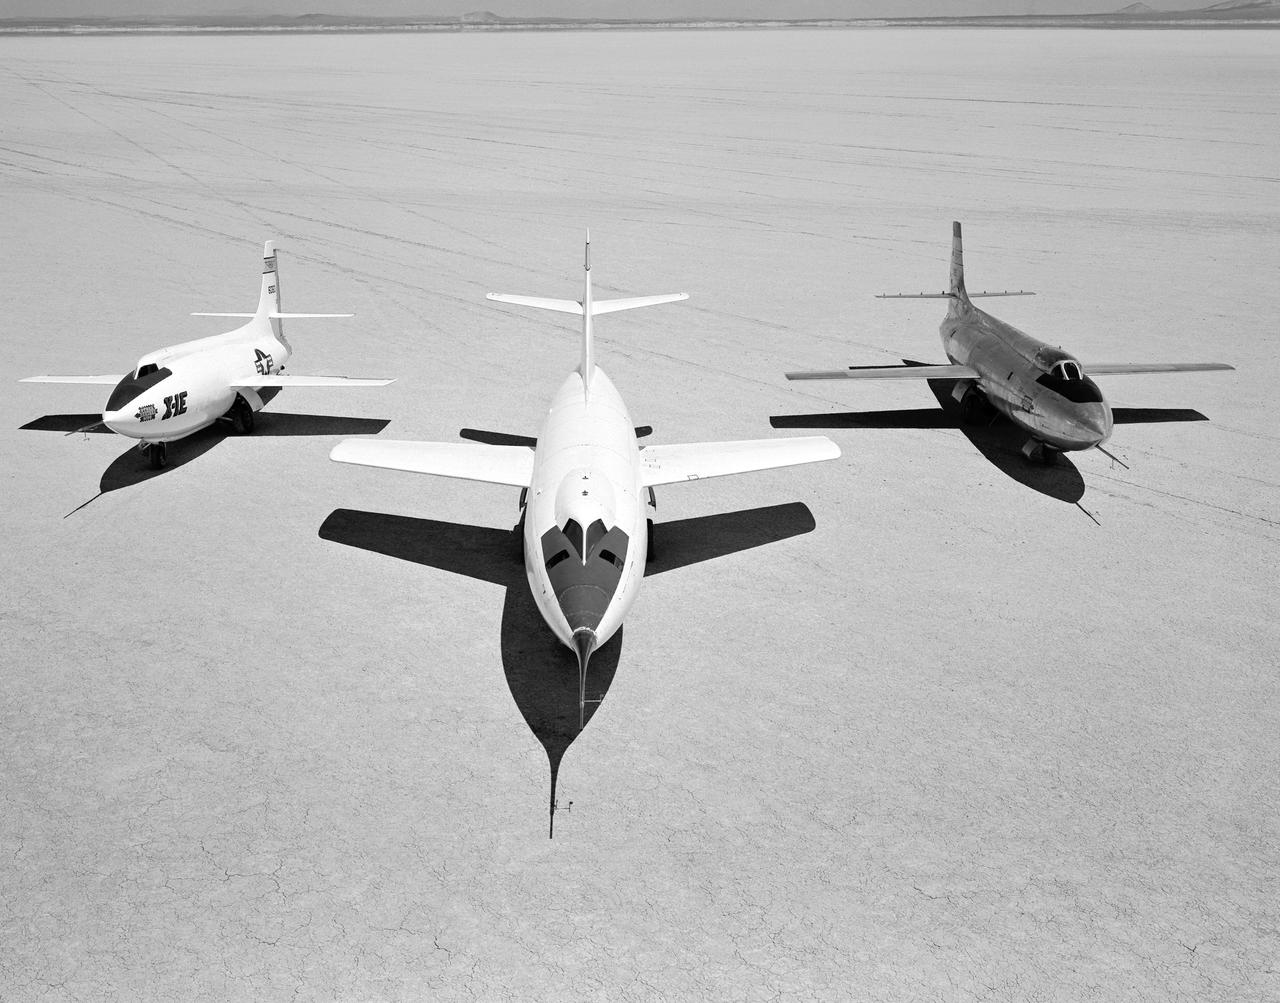
Early NACA research aircraft on the lakebed at the High Speed Research Station in 1955: Left to right: X-1E, D-558-II, X-1B

The Bell Aircraft Corporation X-1-2 aircraft on the ramp at NACA High Speed Flight Research Station located on the South Base of Muroc Army Air Field in 1947. The X-1-2 flew until October 23, 1951, completing 74 glide and powered flights with nine different pilots. The aircraft has white paint and the NACA tail band. The black Xs are reference markings for tracking purposes. They were widely used on NACA aircraft in the early 1950s.
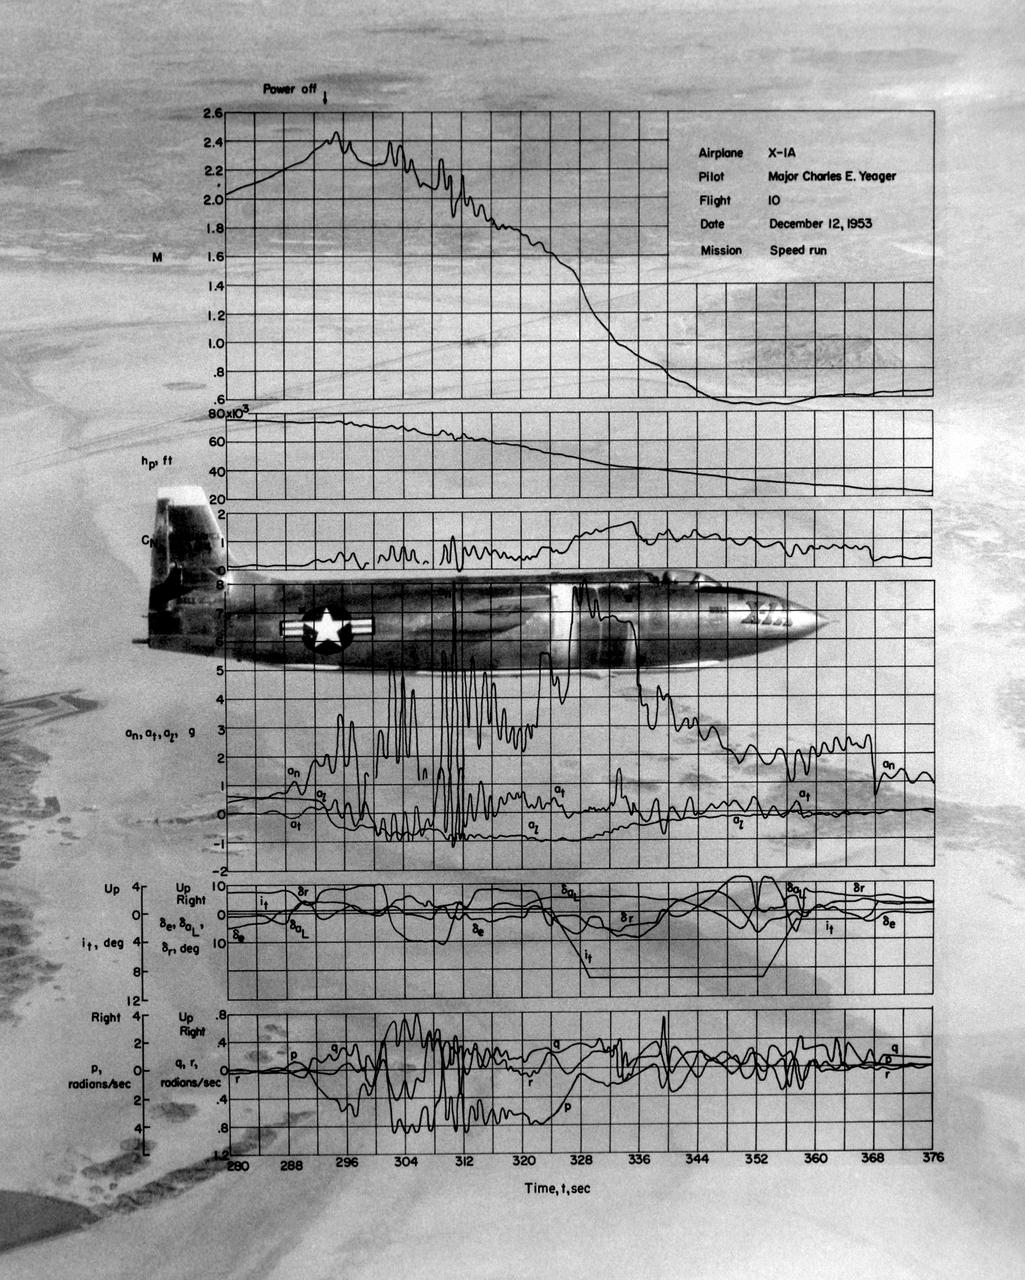
This photo of the X-1A includes graphs of the flight data from Maj. Charles E. Yeager's Mach 2.44 flight on December 12, 1953. (This was only a few days short of the 50th anniversary of the Wright brothers' first powered flight.) After reaching Mach 2.44, then the highest speed ever reached by a piloted aircraft, the X-1A tumbled completely out of control. The motions were so violent that Yeager cracked the plastic canopy with his helmet. He finally recovered from a inverted spin and landed on Rogers Dry Lakebed. Among the data shown are Mach number and altitude (the two top graphs). The speed and altitude changes due to the tumble are visible as jagged lines. The third graph from the bottom shows the G-forces on the airplane. During the tumble, these twice reached 8 Gs or 8 times the normal pull of gravity at sea level. (At these G forces, a 200-pound human would, in effect, weigh 1,600 pounds if a scale were placed under him in the direction of the force vector.) Producing these graphs was a slow, difficult process. The raw data from on-board instrumentation recorded on oscillograph film. Human computers then reduced the data and recorded it on data sheets, correcting for such factors as temperature and instrument errors. They used adding machines or slide rules for their calculations, pocket calculators being 20 years in the future.