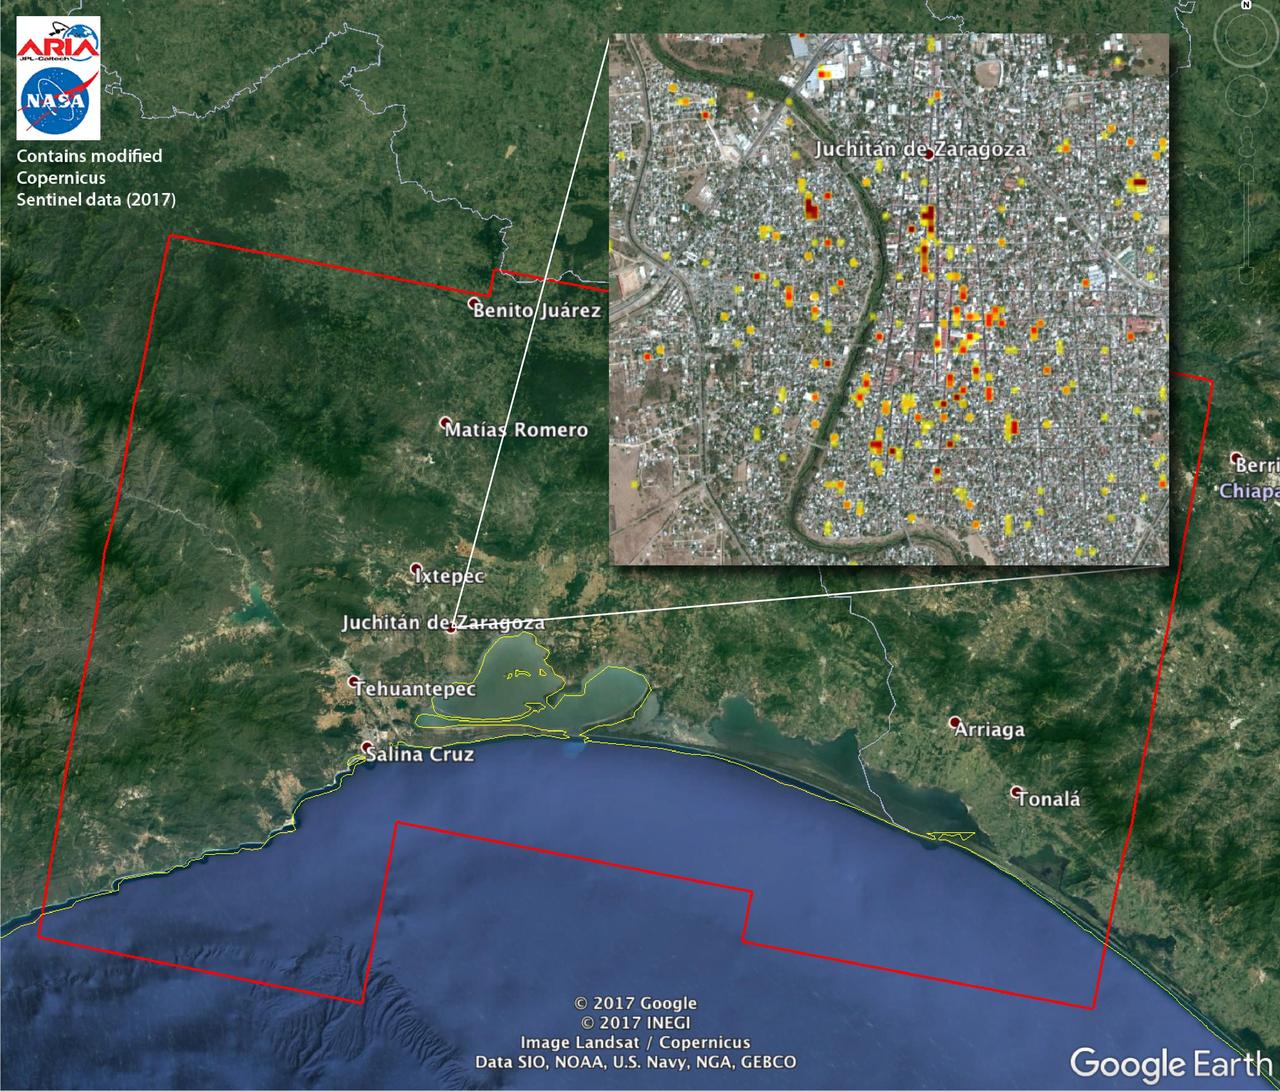
The Advanced Rapid Imaging and Analysis (ARIA) team at NASA's Jet Propulsion Laboratory in Pasadena, California, and Caltech, also in Pasadena, created this Damage Proxy Map (DPM) depicting areas of Southern Mexico that are likely damaged (shown by red and yellow pixels) from the magnitude 8.1 Chiapas earthquake of Sept. 7, 2017 (near midnight local time, early morning on Sept. 8 UTC). The map is derived from synthetic aperture radar (SAR) images from the Copernicus Sentinel-1A and Sentinel-1B satellites, operated by the European Space Agency (ESA). The images were taken before (Sept. 7, 2017 UTC) and after (Sept. 13, 2017 UTC) the earthquake. The map covers an area of 155 by 106 miles (250 by 170 kilometers). Each pixel measures about 33 yards (30 meters) across. The color variation from yellow to red indicates increasingly more significant ground surface change. Preliminary validation was done by comparing the SAR images to optical satellite imagery from DigitalGlobe. This damage proxy map should be used as guidance to identify damaged areas, and may be less reliable over vegetated areas. Sentinel-1 data were accessed through the Copernicus Open Access Hub. The image contains modified Copernicus Sentinel data (2017), processed by ESA and analyzed by the NASA-JPL/Caltech ARIA team. This research was carried out at JPL under a contract with NASA. https://photojournal.jpl.nasa.gov/catalog/PIA21956
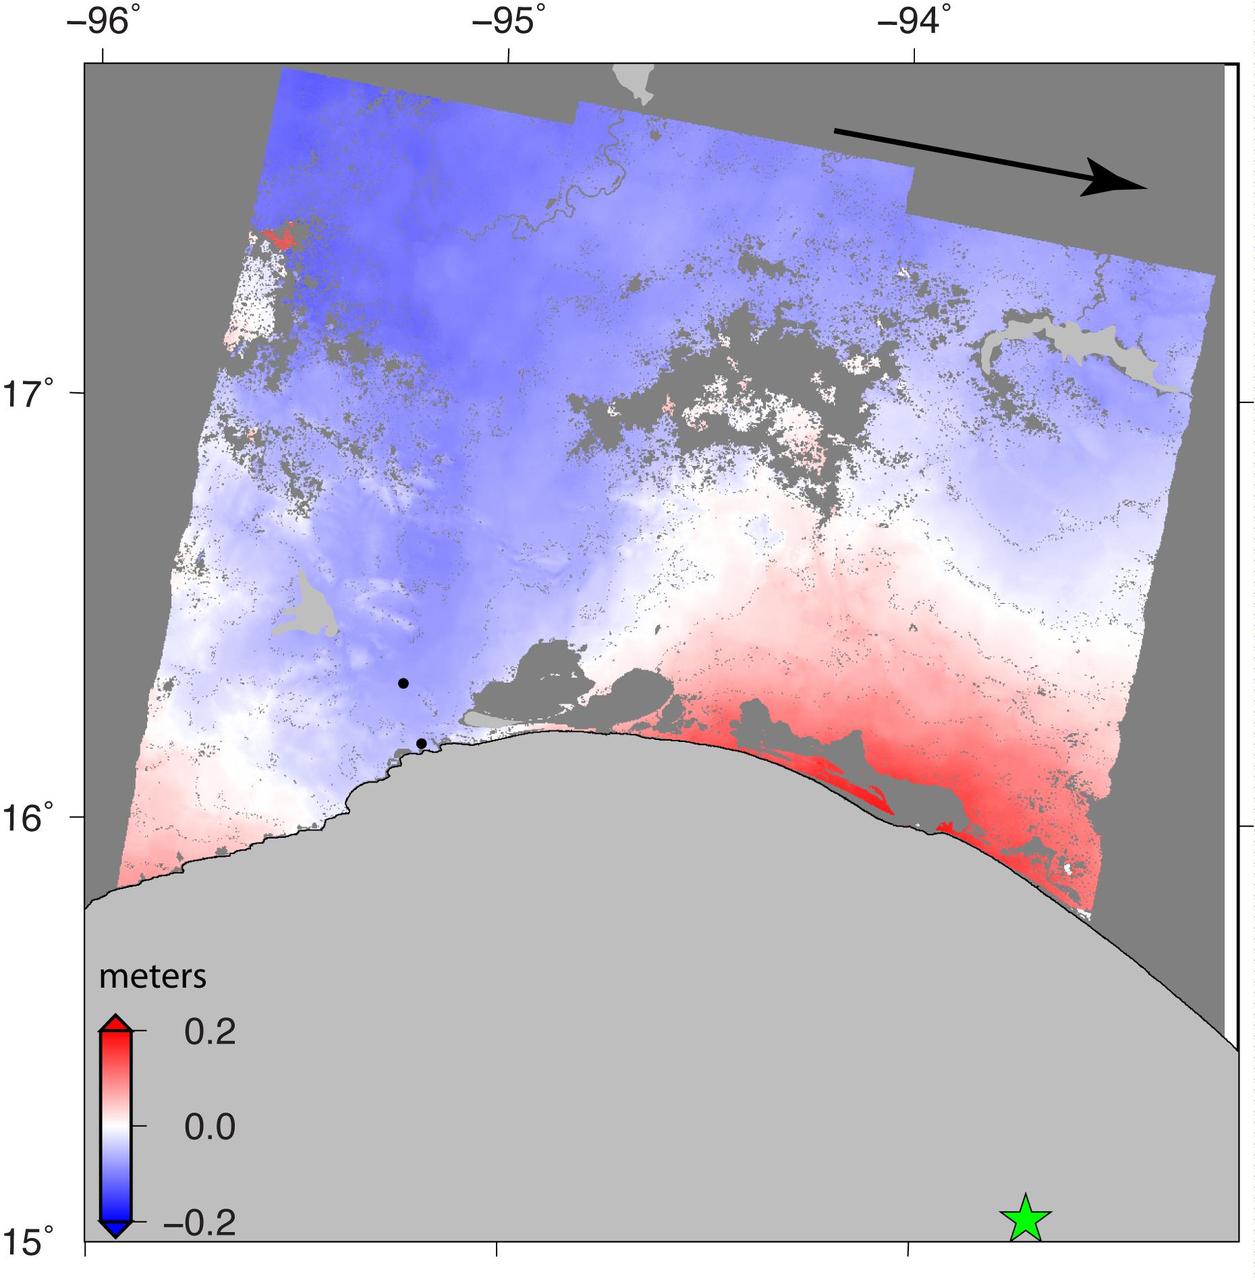
NASA and its partners are contributing important observations and expertise to the ongoing response to the Sept. 7, 2017 (local time), magnitude 8.1 Oaxaca-Chiapas earthquake in Mexico. This earthquake was the strongest in more than a century in Mexico. It has caused a significant humanitarian crisis, with widespread building damage and triggered landslides throughout the region. Scientists with the Advanced Rapid Imaging and Analysis project (ARIA), a collaboration between NASA's Jet Propulsion Laboratory in Pasadena, California; and Caltech, also in Pasadena, analyzed interferometric synthetic aperture radar images from the radar instrument on the Copernicus Sentinel-1A and Sentinel-1B satellites operated by the European Space Agency (ESA) to calculate a map of the deformation of Earth's surface caused by the quake. This false-color map shows the amount of permanent surface movement caused almost entirely by the earthquake, as viewed by the satellite, during a six-day interval between radar images acquired by the two Sentinel-1 satellites on Sept. 7 and Sept. 13, 2017. In this map, the colors of the surface displacements are proportional to the surface motion. The red tones show the areas along the coast of Chiapas and Oaxaca have moved toward the satellite by as much as 9 inches (22 centimeters) in a combination of up and eastward motion. The area in between and farther north with various shades of blue moved away from the satellite, mostly downward or westward, by as much as 6 inches (15 centimeters). Areas without color are open water or heavy vegetation, which prevent the radar from measuring change between the satellite images. Scientists use these maps to build detailed models of the fault slip at depth and associated land movements to better understand the impact on future earthquake activity. The green star shows the location of the earthquake epicenter estimated by the United States Geological Survey (USGS) National Earthquake Information Center. Map contains modified Copernicus Sentinel data 2017, processed by ESA and analyzed by the NASA-JPL/Caltech ARIA team. This research was carried out at JPL under a contract with NASA. Sentinel-1 data were accessed through the Copernicus Open Access Hub. An annotated figures is available at https://photojournal.jpl.nasa.gov/catalog/PIA21962