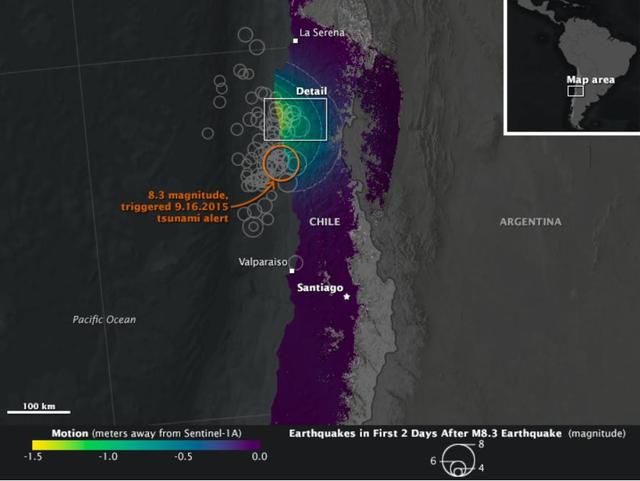
On Sept. 16, 2015, a magnitude 8.3 earthquake struck near the coast of central Chile along the boundary of the Nazca and South American tectonic plates. Dubbed the Illapel earthquake, the shaking lasted at least three minutes and propelled a 15-foot (4.5-meter) tsunami that washed into Coquimbo and other coastal areas. Smaller tsunami waves raced across the Pacific and showed up on the shores of Hawaii and other islands. The earthquake and tsunami caused substantial damage in several Chilean coastal towns, and at least 13 deaths have been reported. Demanding building codes and extensive disaster preparedness helped to limit the loss of life and property. The maps above, known as interferograms, show how the quake moved the ground, as observed by the Copernicus Sentinel-1A satellite (operated by the European Space Agency) and reported by ground stations to the U.S. Geological Survey. Sentinel-1A carries a synthetic aperture radar (SAR) instrument, which beams radio signals toward the ground and measures the reflections to determine the distance between the ground and the satellite. By comparing measurements made on Aug. 24 and Sept. 17, Cunren Liang, Eric Fielding, and other researchers from NASA's Jet Propulsion Laboratory were able to determine how the land surface shifted during and after the earthquake. Interferograms can be used to estimate where the fault moved deep in Earth and which areas have increased stress and higher likelihood of future earthquakes. The details can also provide important information to better understand the earthquake process. On both the close-up and the broad-view maps, the amount of land motion is represented in shades from yellow to purple. Areas where the ground shifted the most (vertically, horizontally, or both) are represented in yellow, while areas with little change are represented in purple. Circles show the location of earthquakes and aftershocks in the two days after the initial 8.3 earthquake, as reported by the USGS National Earthquake Information Center. Larger quakes are represented by larger circles. The base map layer uses a digital elevation model and a bathymetry map to show the contours of the land surface and seafloor. The interferograms above show that land moved as much as 1.4 meters toward to satellite (generally in the vertical direction) near the coast, and early estimates of the horizontal motion suggest it was as much as 2 meters. While SAR can see through clouds and the dark of night, it cannot see much through water. It is likely that much of the ground deformation from the earthquake occurred underwater, which explains the formation of the tsunami and the location of many aftershocks. http://photojournal.jpl.nasa.gov/catalog/PIA20002
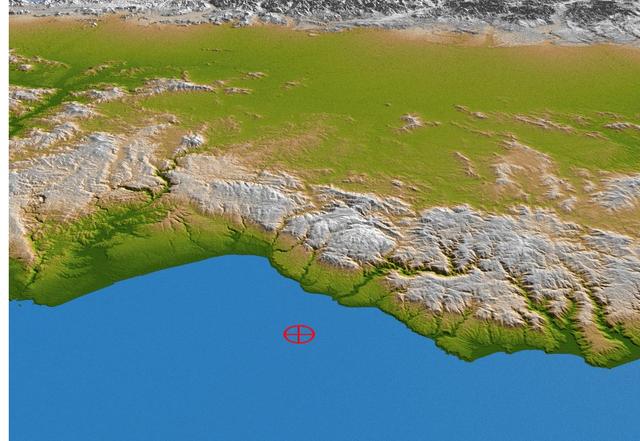
This perspective view from NASA Shuttle Radar Topography Mission of coastal Chile indicates the epicenter red marker of the 8.8 earthquake on Feb. 27, 2010, just offshore of the Maule region in the Bahia de Chanco.
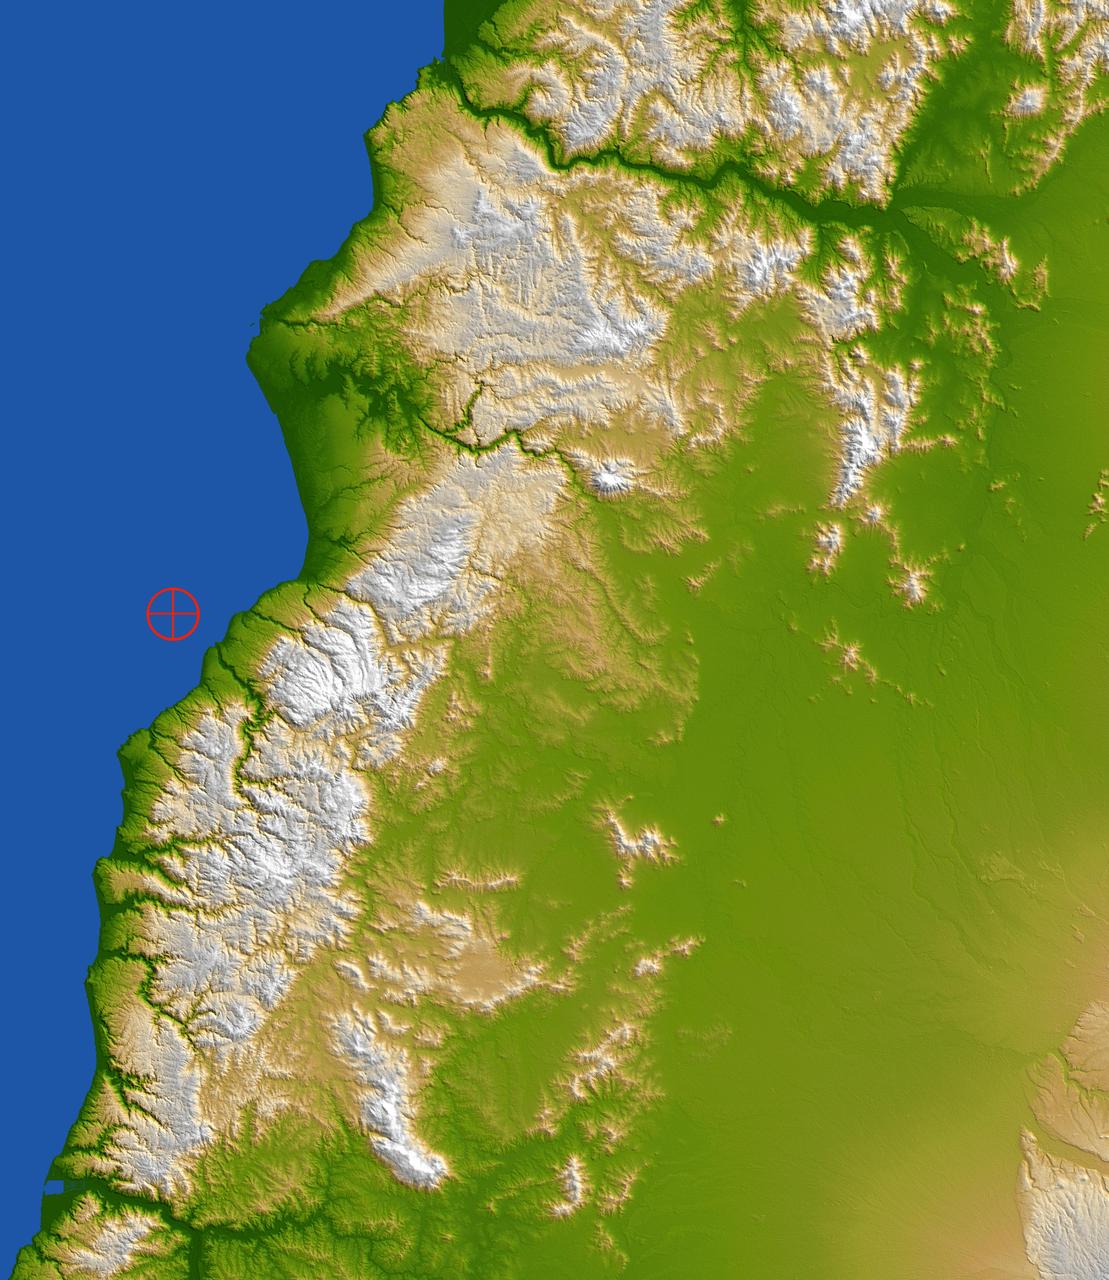
This color-coded shaded relief view from NASA Shuttle Radar Topography Mission of coastal Chile indicates the epicenter red marker of the 8.8 earthquake on Feb. 27, 2010, just offshore of the Maule region in the Bahia de Chanco.
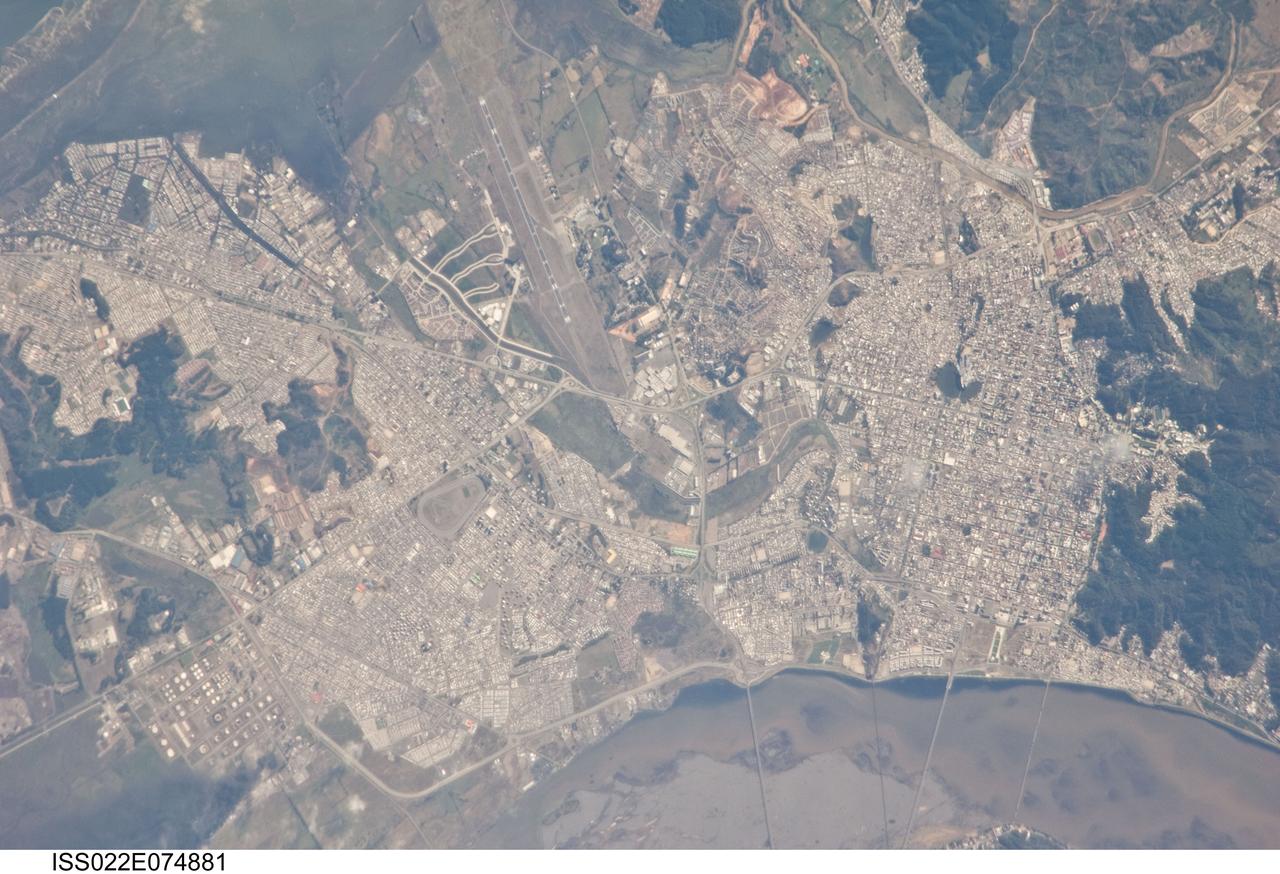
ISS022-E-074881 (27 Feb. 2010) --- Earthquake damage in Concepcion, Chile is featured in this image photographed by an Expedition 22 crew member on the International Space Station. This detailed view of the Chilean cities of Concepcion and Hualpen was acquired from the space station approximately seven hours after a magnitude 8.8 earthquake occurred offshore 115 kilometers to the north-northeast. Much of the Chilean coastline is located above the boundary between the converging Nazca and South American tectonic plates. This type of plate boundary is known as a subduction zone; such zones frequently experience moderate to strong earthquakes as one tectonic plate overrides the other. The largest earthquake worldwide during the past 200 years (magnitude 9.5 in May 1960) had a source region approximately 230 kilometers north of the Feb. 27 quake. While the image is not detailed enough to see damage to individual buildings or roadways some indicators of earthquake damage are visible. A dark smoke plume is visible at lower left near an oil refinery in Hualpen. At lower right, parts of the road bed of a single-lane bridge over the Bio-Bio River appear to have collapsed. A smaller, white smoke plume is visible at right near the Universidad de Concepcion. Smoke and haze possibly related to the earthquake was noted over Santiago, Chile in data acquired by the MODIS sensor less than one hour after this photograph was taken.