
NASA image acquired April 18 - October 23, 2012 This image of the United States of America at night is a composite assembled from data acquired by the Suomi NPP satellite in April and October 2012. The image was made possible by the new satellite’s “day-night band” of the Visible Infrared Imaging Radiometer Suite (VIIRS), which detects light in a range of wavelengths from green to near-infrared and uses filtering techniques to observe dim signals such as city lights, gas flares, auroras, wildfires, and reflected moonlight. “Nighttime light is the most interesting data that I’ve had a chance to work with,” says Chris Elvidge, who leads the Earth Observation Group at NOAA’s National Geophysical Data Center. “I’m always amazed at what city light images show us about human activity.” His research group has been approached by scientists seeking to model the distribution of carbon dioxide emissions from fossil fuels and to monitor the activity of commercial fishing fleets. Biologists have examined how urban growth has fragmented animal habitat. Elvidge even learned once of a study of dictatorships in various parts of the world and how nighttime lights had a tendency to expand in the dictator’s hometown or province. Named for satellite meteorology pioneer Verner Suomi, NPP flies over any given point on Earth's surface twice each day at roughly 1:30 a.m. and p.m. The polar-orbiting satellite flies 824 kilometers (512 miles) above the surface, sending its data once per orbit to a ground station in Svalbard, Norway, and continuously to local direct broadcast users distributed around the world. Suomi NPP is managed by NASA with operational support from NOAA and its Joint Polar Satellite System, which manages the satellite's ground system. NASA Earth Observatory image by Robert Simmon, using Suomi NPP VIIRS data provided courtesy of Chris Elvidge (NOAA National Geophysical Data Center). Suomi NPP is the result of a partnership between NASA, NOAA, and the Department of Defense. Caption by Mike Carlowicz. Instrument: Suomi NPP - VIIRS Credit: <b><a href="http://www.earthobservatory.nasa.gov/" rel="nofollow"> NASA Earth Observatory</a></b> <b>Click here to view all of the <a href="http://earthobservatory.nasa.gov/Features/NightLights/" rel="nofollow"> Earth at Night 2012 images </a></b> <b>Click here to <a href="http://earthobservatory.nasa.gov/NaturalHazards/view.php?id=79800" rel="nofollow"> read more </a> about this image </b> <b><a href="http://www.nasa.gov/audience/formedia/features/MP_Photo_Guidelines.html" rel="nofollow">NASA image use policy.</a></b> <b><a href="http://www.nasa.gov/centers/goddard/home/index.html" rel="nofollow">NASA Goddard Space Flight Center</a></b> enables NASA’s mission through four scientific endeavors: Earth Science, Heliophysics, Solar System Exploration, and Astrophysics. Goddard plays a leading role in NASA’s accomplishments by contributing compelling scientific knowledge to advance the Agency’s mission. <b>Follow us on <a href="http://twitter.com/NASA_GoddardPix" rel="nofollow">Twitter</a></b> <b>Like us on <a href="http://www.facebook.com/pages/Greenbelt-MD/NASA-Goddard/395013845897?ref=tsd" rel="nofollow">Facebook</a></b> <b>Find us on <a href="http://instagram.com/nasagoddard?vm=grid" rel="nofollow">Instagram</a></b>
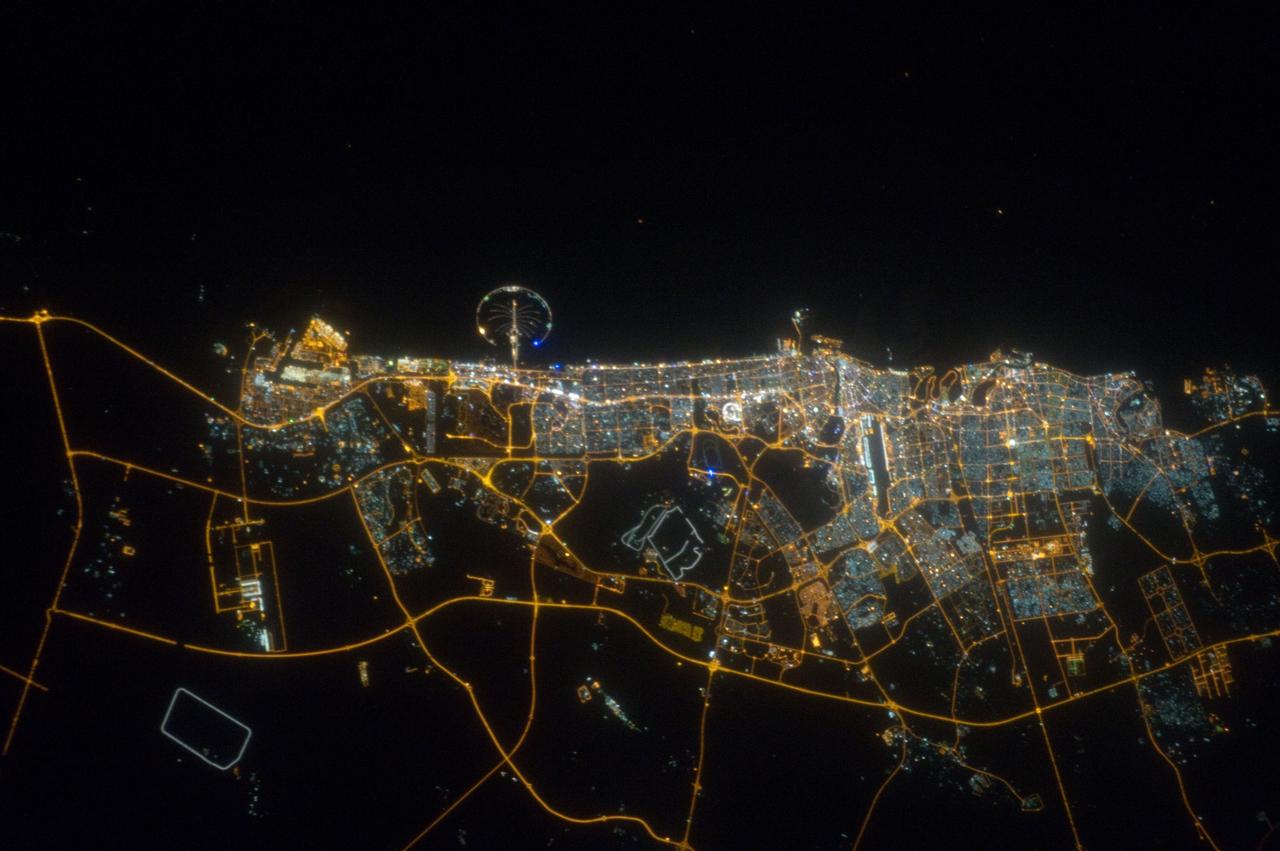
ISS032-E-023718 (11 Aug. 2012) --- The city of Dubai, United Arab Emirates, is featured in this night view photographed by an Expedition 32 crew member on the International Space Station. The city of Dubai is the largest metropolitan area in the emirate of Dubai, one of the member states of the United Arab Emirates. Dubai is located along the southern Persian Gulf on the Arabian Peninsula, and its signature city is known for high profile architectural and development projects. Among the most notable is the Palm Island Resort, a manmade peninsula and surrounding islands built from over 50 million cubic meters of sand. Two other island projects (out of frame), one similar to the Palm Island Resort and another crafted to look like a map of the world, are also visible in other space station imagery along the Dubai coastline. Orange sodium vapor lights trace out the major highways and surface street grid in and around the metropolitan area, while grey-white mercury vapor lamps fill in the commercial and residential areas. The lighted islands and peninsula of the Palm Island Resort are clearly visible along the coastline. An interesting spiral pattern of lights on the southeastern fringe of the urban area is a camel racetrack. Night time images like this are useful to climate modelers, urban planners, and geographers as they allow for simple definition of urban (densely lit) and rural (sparsely lit) areas.

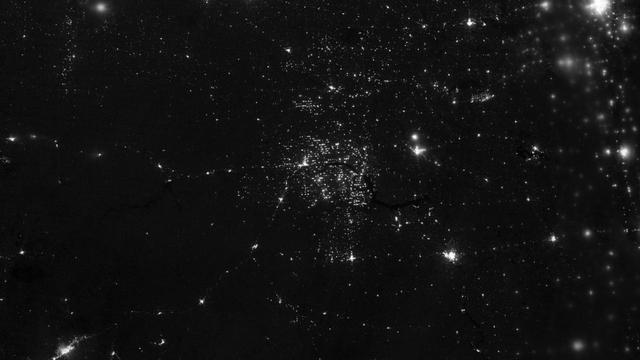
ISS033-E-014186 (16 Oct. 2012) --- A nighttime view of Baltimore, Maryland is featured in this image photographed by an Expedition 33 crew member in the International Space Station. Baltimore is located on the U.S. mid-Atlantic coastline along the terminus of the Patapsco River into Chesapeake Bay, and is the largest seaport along this part of the coast. Like many large U.S. metropolitan areas, the most brightly lit area corresponds to the highest density of buildings and typically indicates the urban core -- in this case, downtown Baltimore at center. Highways and large arterial streets appear as bright yellow-orange lines extending outwards from the downtown area into the surrounding suburban regions (light violet and reddish brown regions of diffuse lighting). Dark areas beyond the suburban zone are rural - or to the southeast, indicate the waters of Chesapeake Bay. Small dark patches within the metropolitan area are open space including parks, cemeteries, and the Baltimore Zoo (top left). Two large, brightly-lit areas along Chesapeake Bay are commercial/industrial regions, and include the major port facilities for Baltimore. The City of Baltimore was incorporated in 1796, after serving as the de facto capital of the nascent United States of America during the Second Continental Congress (from Dec. 20, 1776 to March 4, 1777). Today, the Baltimore metropolitan area (as defined by the Baltimore Metropolitan Council) includes over 2.5 million people and includes six Maryland counties (Anne Arundel, Baltimore, Carroll, Harford, and Howard) in addition to the City of Baltimore. The region is also a focus of urban ecological research through the Baltimore Ecosystem Study.
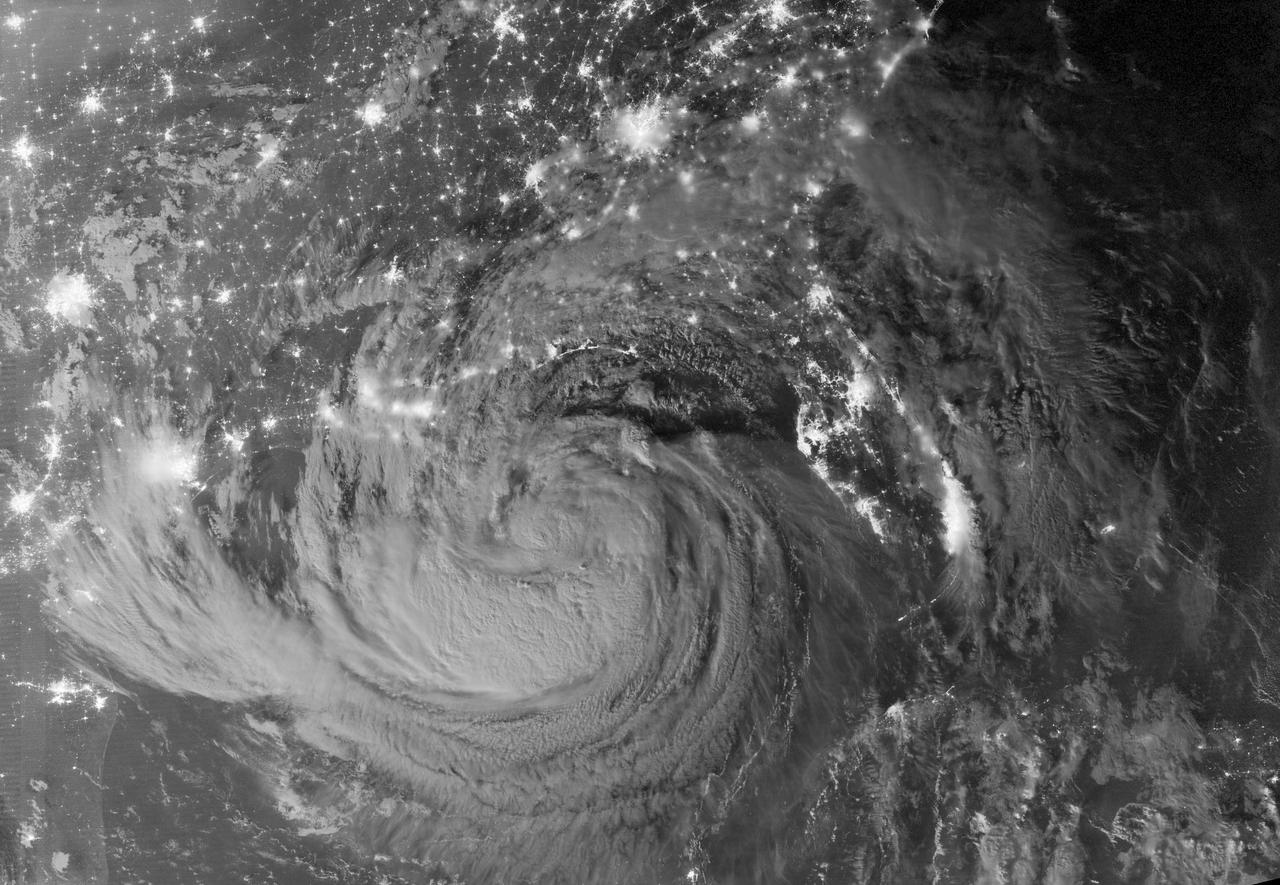
NASA image acquired August 28, 2012 Early on August 28, 2012, the Visible Infrared Imaging Radiometer Suite (VIIRS) on the Suomi-NPP satellite captured this nighttime view of Tropical Storm Isaac and the cities near the Gulf Coast of the United States. The image was acquired just after local midnight by the VIIRS “day-night band,” which detects light in a range of wavelengths from green to near-infrared and uses light intensification to enable the detection of dim signals. In this case, the clouds of Isaac were lit by moonlight. Credit: <b><a href="http://www.earthobservatory.nasa.gov/" rel="nofollow"> NASA Earth Observatory</a></b> NASA Earth Observatory image by Jesse Allen and Robert Simmon, using VIIRS Day Night Band data. <b><a href="http://www.nasa.gov/audience/formedia/features/MP_Photo_Guidelines.html" rel="nofollow">NASA image use policy.</a></b> <b><a href="http://www.nasa.gov/centers/goddard/home/index.html" rel="nofollow">NASA Goddard Space Flight Center</a></b> enables NASA’s mission through four scientific endeavors: Earth Science, Heliophysics, Solar System Exploration, and Astrophysics. Goddard plays a leading role in NASA’s accomplishments by contributing compelling scientific knowledge to advance the Agency’s mission. <b>Follow us on <a href="http://twitter.com/NASA_GoddardPix" rel="nofollow">Twitter</a></b> <b>Like us on <a href="http://www.facebook.com/pages/Greenbelt-MD/NASA-Goddard/395013845897?ref=tsd" rel="nofollow">Facebook</a></b> <b>Find us on <a href="http://instagrid.me/nasagoddard/?vm=grid" rel="nofollow">Instagram</a></b>
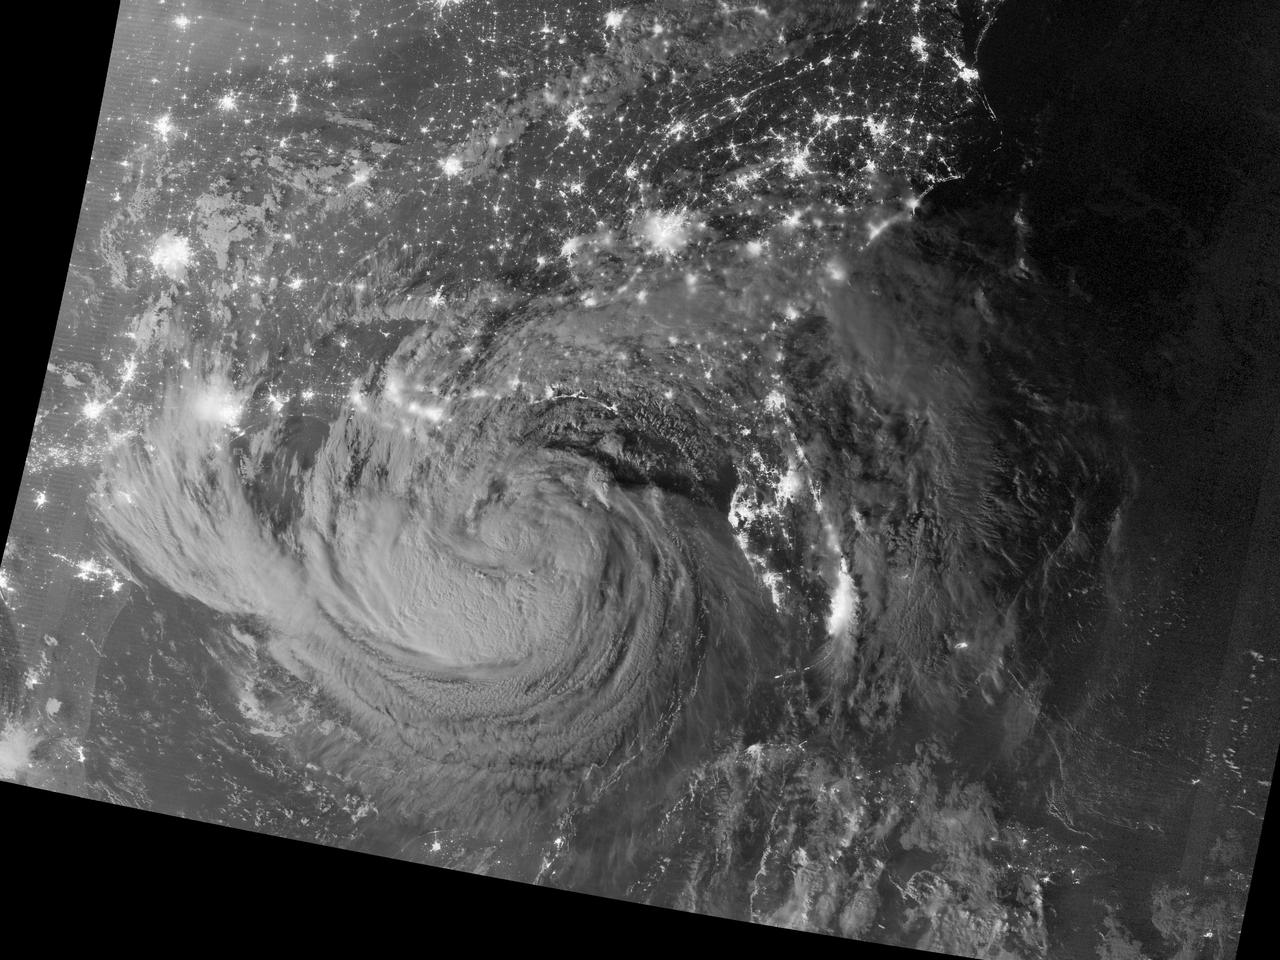
NASA image acquired August 28, 2012 Early on August 28, 2012, the Visible Infrared Imaging Radiometer Suite (VIIRS) on the Suomi-NPP satellite captured this nighttime view of Tropical Storm Isaac and the cities near the Gulf Coast of the United States. The image was acquired just after local midnight by the VIIRS “day-night band,” which detects light in a range of wavelengths from green to near-infrared and uses light intensification to enable the detection of dim signals. In this case, the clouds of Isaac were lit by moonlight. Credit: <b><a href="http://www.earthobservatory.nasa.gov/" rel="nofollow"> NASA Earth Observatory</a></b> NASA Earth Observatory image by Jesse Allen and Robert Simmon, using VIIRS Day Night Band data. Caption by Mike Carlowicz. <b><a href="http://www.nasa.gov/audience/formedia/features/MP_Photo_Guidelines.html" rel="nofollow">NASA image use policy.</a></b> <b><a href="http://www.nasa.gov/centers/goddard/home/index.html" rel="nofollow">NASA Goddard Space Flight Center</a></b> enables NASA’s mission through four scientific endeavors: Earth Science, Heliophysics, Solar System Exploration, and Astrophysics. Goddard plays a leading role in NASA’s accomplishments by contributing compelling scientific knowledge to advance the Agency’s mission. <b>Follow us on <a href="http://twitter.com/NASA_GoddardPix" rel="nofollow">Twitter</a></b> <b>Like us on <a href="http://www.facebook.com/pages/Greenbelt-MD/NASA-Goddard/395013845897?ref=tsd" rel="nofollow">Facebook</a></b> <b>Find us on <a href="http://instagrid.me/nasagoddard/?vm=grid" rel="nofollow">Instagram</a></b>
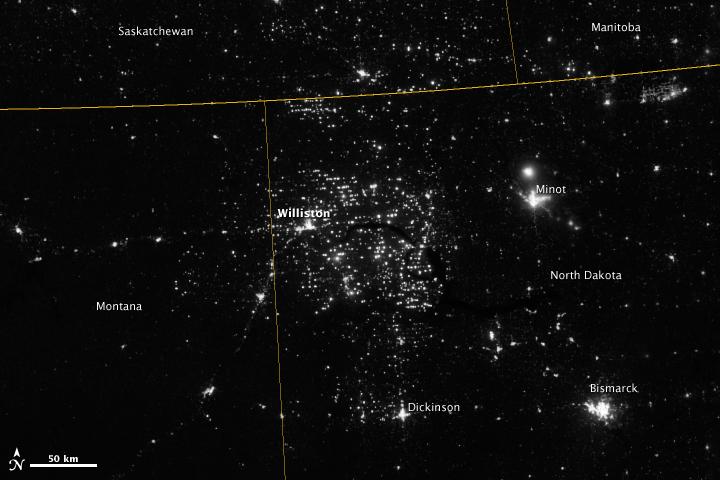
Northwestern North Dakota is one of the least-densely populated parts of the United States. Cities and people are scarce, but satellite imagery shows the area has been aglow at night in recent years. The reason: the area is home to the Bakken shale formation, a site where oil production is booming. Companies hoping to extract oil from the Bakken formation have drilled hundreds of new wells in the last few years; natural gas often bubbles up to the surface as part of the process. Lacking the infrastructure to pipe the gas away, many drillers simply burn it in a practice known as flaring. On November 12, 2012, the Visible Infrared Imaging Radiometer Suite (VIIRS) on the Suomi NPP satellite captured this nighttime view of widespread gas flaring throughout the area. Many of the specks of light are evidence of gas flaring, though others may be the lights around drilling equipment. Some of the brighter areas correspond to towns and cities including Williston, Minot, and Dickinson. The image was captured by the VIIRS “day-night band,” which detects light in a range of wavelengths from green to near-infrared and uses filtering techniques to observe signals such as gas flares, auroras, wildfires, city lights, and reflected moonlight. When VIIRS acquired the image, the moon was in its waning crescent phase, meaning it was reflecting only a small amount of light. According to the U.S. Energy Information Administration, natural gas production from the Bakken shale has increased more than 20-fold between 2007 and 2010. Gas production averaged over 485 million cubic feet per day in September 2011, compared to the 2005 average of about 160 million cubic feet per day. Due to the lack of gas pipeline and processing facilities in the region, about 29 percent of that gas is flared. NASA Earth Observatory image by Jesse Allen and Robert Simmon, using VIIRS Day-Night Band data from the Suomi National Polar-orbiting Partnership. Suomi NPP is the result of a partnership between NASA, the National Oceanic and Atmospheric Administration, and the Department of Defense. Caption by Adam Voiland. Instrument: Suomi NPP - VIIRS Credit: <b><a href="http://www.earthobservatory.nasa.gov/" rel="nofollow"> NASA Earth Observatory</a></b> <b>Click here to view all of the <a href="http://earthobservatory.nasa.gov/Features/NightLights/" rel="nofollow"> Earth at Night 2012 images </a></b> <b>Click here to <a href="http://earthobservatory.nasa.gov/NaturalHazards/view.php?id=79810" rel="nofollow"> read more </a> about this image </b> <b><a href="http://www.nasa.gov/audience/formedia/features/MP_Photo_Guidelines.html" rel="nofollow">NASA image use policy.</a></b> <b><a href="http://www.nasa.gov/centers/goddard/home/index.html" rel="nofollow">NASA Goddard Space Flight Center</a></b> enables NASA’s mission through four scientific endeavors: Earth Science, Heliophysics, Solar System Exploration, and Astrophysics. Goddard plays a leading role in NASA’s accomplishments by contributing compelling scientific knowledge to advance the Agency’s mission. <b>Follow us on <a href="http://twitter.com/NASA_GoddardPix" rel="nofollow">Twitter</a></b> <b>Like us on <a href="http://www.facebook.com/pages/Greenbelt-MD/NASA-Goddard/395013845897?ref=tsd" rel="nofollow">Facebook</a></b> <b>Find us on <a href="http://instagram.com/nasagoddard?vm=grid" rel="nofollow">Instagram</a></b>
Northwestern North Dakota is one of the least-densely populated parts of the United States. Cities and people are scarce, but satellite imagery shows the area has been aglow at night in recent years. The reason: the area is home to the Bakken shale formation, a site where gas and oil production are booming. On November 12, 2012, the Visible Infrared Imaging Radiometer Suite (VIIRS) on the Suomi NPP satellite captured this nighttime view of widespread drilling throughout the area. Most of the bright specks are lights associated with drilling equipment and temporary housing near drilling sites, though a few are evidence of gas flaring. Some of the brighter areas correspond to towns and cities including Williston, Minot, and Dickinson. The image was captured by the VIIRS “day-night band,” which detects light in a range of wavelengths from green to near-infrared and uses “smart” light sensors to observe dim signals such as gas flares, auroras, wildfires, city lights, and reflected moonlight. When VIIRS acquired the image, the Moon was in its waning crescent phase, so the landscape was reflecting only a small amount of light. According to the U.S. Energy Information Administration, natural gas production from the Bakken shale has increased more than 20-fold between 2007 and 2010. Gas production averaged over 485 million cubic feet per day in September 2011, compared to the 2005 average of about 160 million cubic feet per day. Due to the lack of a gas pipeline and processing facilities in the region, about 29 percent of that gas is flared. NASA Earth Observatory image by Jesse Allen and Robert Simmon, using VIIRS Day-Night Band data from the Suomi National Polar-orbiting Partnership. Suomi NPP is the result of a partnership between NASA, the National Oceanic and Atmospheric Administration, and the Department of Defense. Caption by Adam Voiland. Instrument: Suomi NPP - VIIRS Credit: <b><a href="http://www.earthobservatory.nasa.gov/" rel="nofollow"> NASA Earth Observatory</a></b> <b>Click here to view all of the <a href="http://earthobservatory.nasa.gov/Features/NightLights/" rel="nofollow"> Earth at Night 2012 images </a></b> <b>Click here to <a href="http://earthobservatory.nasa.gov/NaturalHazards/view.php?id=79810" rel="nofollow"> read more </a> about this image </b> <b><a href="http://www.nasa.gov/audience/formedia/features/MP_Photo_Guidelines.html" rel="nofollow">NASA image use policy.</a></b> <b><a href="http://www.nasa.gov/centers/goddard/home/index.html" rel="nofollow">NASA Goddard Space Flight Center</a></b> enables NASA’s mission through four scientific endeavors: Earth Science, Heliophysics, Solar System Exploration, and Astrophysics. Goddard plays a leading role in NASA’s accomplishments by contributing compelling scientific knowledge to advance the Agency’s mission. <b>Follow us on <a href="http://twitter.com/NASA_GoddardPix" rel="nofollow">Twitter</a></b> <b>Like us on <a href="http://www.facebook.com/pages/Greenbelt-MD/NASA-Goddard/395013845897?ref=tsd" rel="nofollow">Facebook</a></b> <b>Find us on <a href="http://instagram.com/nasagoddard?vm=grid" rel="nofollow">Instagram</a></b>
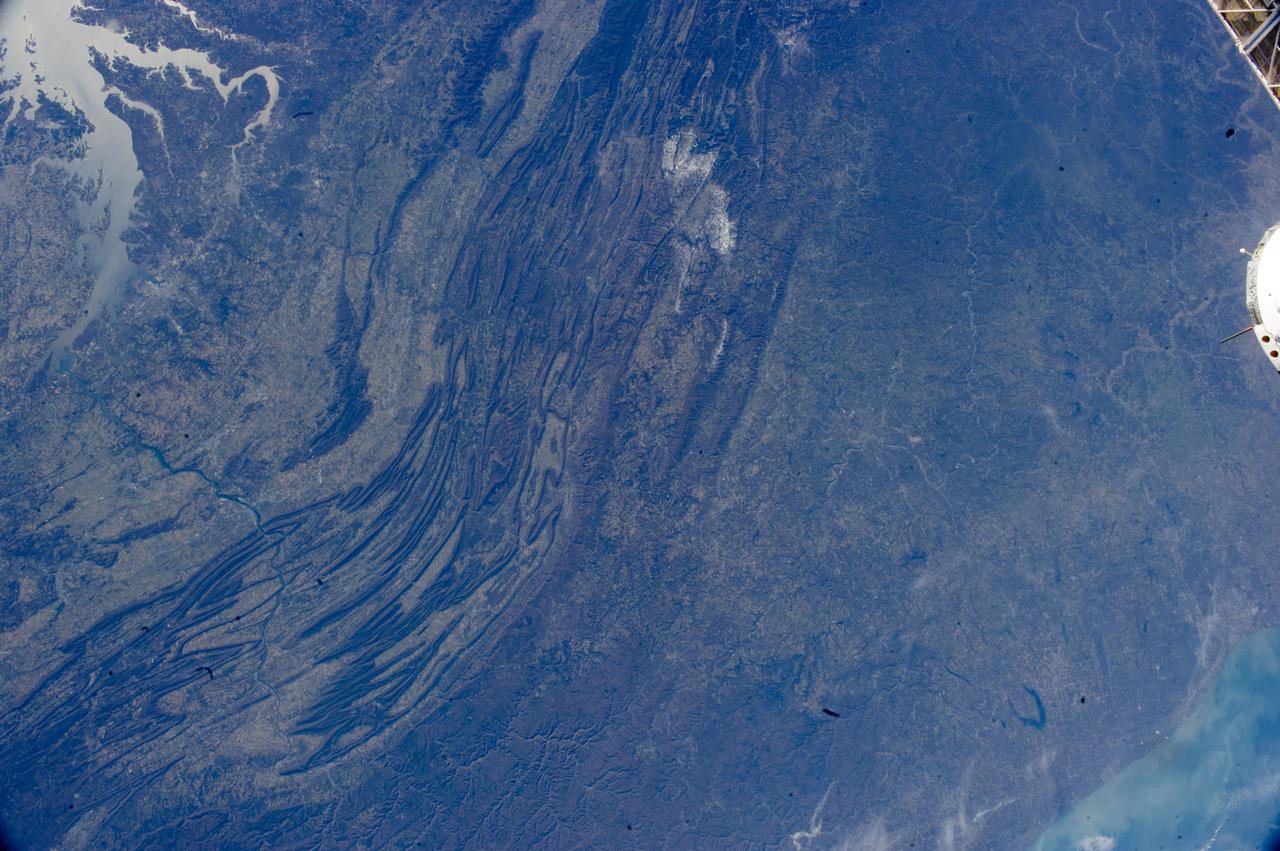
ISS033-E-022378 (17 Nov. 2012) --- The Appalachian Mountains in the eastern Unites States are featured in this image photographed by an Expedition 33 crew member on the International Space Station. This regional view shows the striking visual effect of the valley-and-ridge topography of the Appalachian Mountains as viewed from orbit. The view shows more than 300 miles (500 kilometers) of this low mountain chain, from northeast Pennsylvania (lower left) to southern West Virginia, where a dusting of snow can be seen (top center). Sunglint reflections reveal detail of Chesapeake Bay and the great bend of the Potomac River. Cities are difficult to detect from space during daylight hours, so the sickle-shaped bend of the river is a good visual guide for station crew members trying to photograph the nation?s capital, Washington D.C. (upper left). The farm-dominated Piedmont Plateau is the light-toned area between the mountains and the bay. The Appalachian Mountains appear striped because the ridges are forested; providing a dense and dark canopy cover, while the valleys are farmed with crops that generally appear as lighter-toned areas. Geologically the valleys are the softer, more erodible rock layers, much the preferred places for human settlement. Not only do the larger rivers occupy the valley floors, but all the larger rivers flow in them, soils are thicker, slopes are gentle, and valleys are better protected from winter winds. According to scientists, rocks that form the valley-and-ridge province, as it is known, are relatively old (540-300 million years old), and were laid down in horizontal layers when North America was attached to Europe as the ancient supercontinent of Laurasia. During this time Gondwanaland ? an ancient supercontinent that included present-day Africa, India, South America, Australia and Antarctica - was approaching Laurasia under the influence of plate tectonics. The northwest coastline of modern Africa was the section of Gondwanaland that ?bumped up? against modern North America over a long period (320 ? 260 million years ago), according to scientists. The net result of the tectonic collision was the building of a major mountain chain, much higher than the present Appalachian range?in the process of which the flat-lying rock layers were crumpled up into a series of tight folds, at right angles to the advance of Gondwanaland. The collision also formed the singular supercontinent of Pangaea. The scientists say that, over the following 200 million years, Pangaea broke apart; the modern Atlantic Ocean formed; and erosion wore down the high mountains. What is left to see are the coastline of North America, and the eroded stumps of the mountain chain as the relatively low, but visually striking present-day Appalachian Mountains.