
Low-lying clouds over sea ice on the Bellingshausen Sea. Credit: NASA / Maria-Jose Vinas NASA's Operation IceBridge is an airborne science mission to study Earth's polar ice. For more information about IceBridge, visit: <a href="http://www.nasa.gov/icebridge" rel="nofollow">www.nasa.gov/icebridge</a> <b><a href="http://www.nasa.gov/audience/formedia/features/MP_Photo_Guidelines.html" rel="nofollow">NASA image use policy.</a></b> <b><a href="http://www.nasa.gov/centers/goddard/home/index.html" rel="nofollow">NASA Goddard Space Flight Center</a></b> enables NASA’s mission through four scientific endeavors: Earth Science, Heliophysics, Solar System Exploration, and Astrophysics. Goddard plays a leading role in NASA’s accomplishments by contributing compelling scientific knowledge to advance the Agency’s mission. <b>Follow us on <a href="http://twitter.com/NASA_GoddardPix" rel="nofollow">Twitter</a></b> <b>Like us on <a href="http://www.facebook.com/pages/Greenbelt-MD/NASA-Goddard/395013845897?ref=tsd" rel="nofollow">Facebook</a></b> <b>Find us on <a href="http://instagrid.me/nasagoddard/?vm=grid" rel="nofollow">Instagram</a></b>

A small hole in the clouds revealed newly formed sea ice in the Bellingshausen Sea next to an ice berg on Nov. 5, 2014 flight. Image Credit: NASA/Digital Mapping System NASA’s Operation IceBridge collected some rare images on a flight out of Punta Arenas, Chile on Nov. 5, 2014, on a science flight over western Antarctica dubbed Ferrigno-Alison-Abbott 01. The crew snapped a few shots of a calving front of the Antarctic ice sheet. This particular flight plan was designed to collect data on changes in ice elevation along the coast near the Ferrigno and Alison ice streams, on the Abbot Ice Shelf, and grounded ice along the Eights Coast.
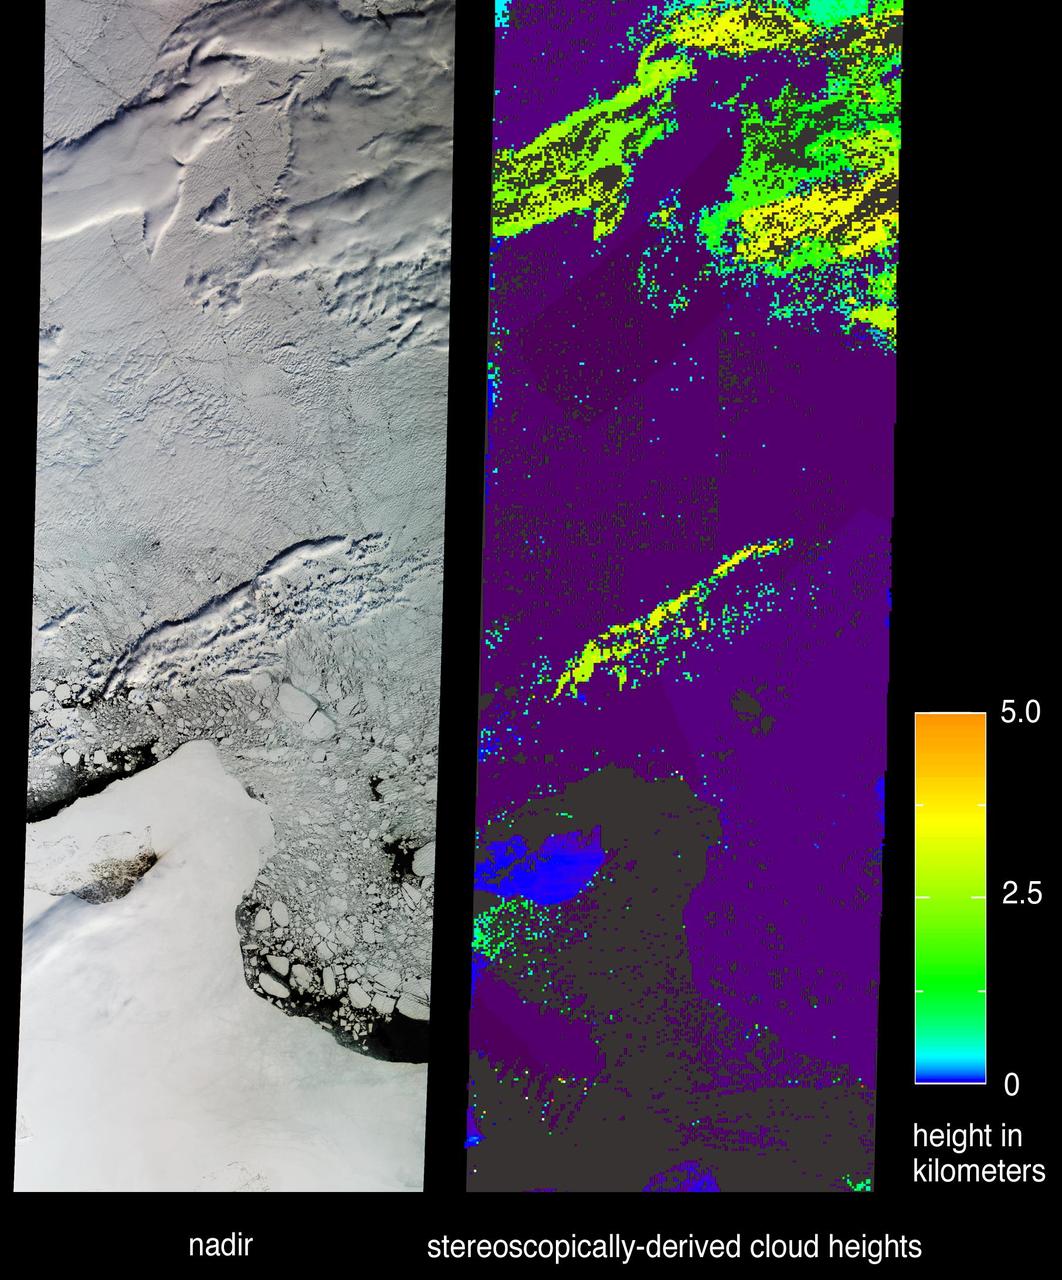
The central portion of Russia East Siberian Sea, including one of the New Siberian Islands, Novaya Sibir, are portrayed in these views from data acquired on May 28, 2002 by NASA Terra satellite.
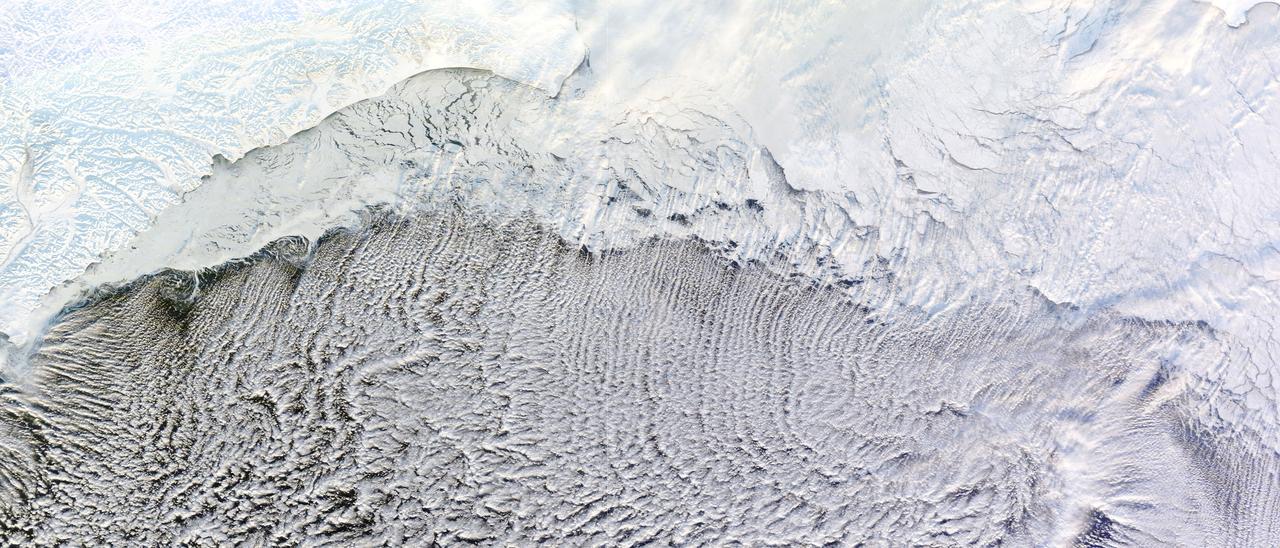
NASA image captured January 4, 2012 Most of us prefer our winter roads free of ice, but one kind of road depends on it: a cloud street. Such streets formed over the Bering Sea in early January 2012, thanks to snow and ice blanketing the nearby land, and sea ice clinging to the shore. The Moderate Resolution Imaging Spectroradiometer (MODIS) on NASA’s Terra satellite captured this natural-color image of the cloud streets on January 4, 2012. Air blowing over frigid ice then warmer ocean water can lead to the development of parallel cylinders of spinning air. Above the upward cycle of these cylinders (rising air), small clouds form. Along the downward cycle (descending air), skies are clear. The resulting cloud formations resemble streets. This image shows that some of the cloud streets begin over the sea ice, but most of the clouds hover over the open ocean water. These streets are not perfectly straight, but curve to the east and west after passing over the sea ice. By lining up along the prevailing wind direction, the tiny clouds comprising the streets indicate the wind patterns around the time of their formation. NASA images courtesy LANCE/EOSDIS MODIS Rapid Response Team at NASA GSFC. Caption by Michon Scott. Instrument: Terra - MODIS Credit: <b><a href="http://www.earthobservatory.nasa.gov/" rel="nofollow"> NASA Earth Observatory</a></b> <b><a href="http://www.nasa.gov/audience/formedia/features/MP_Photo_Guidelines.html" rel="nofollow">NASA image use policy.</a></b> <b><a href="http://www.nasa.gov/centers/goddard/home/index.html" rel="nofollow">NASA Goddard Space Flight Center</a></b> enables NASA’s mission through four scientific endeavors: Earth Science, Heliophysics, Solar System Exploration, and Astrophysics. Goddard plays a leading role in NASA’s accomplishments by contributing compelling scientific knowledge to advance the Agency’s mission. <b>Follow us on <a href="http://twitter.com/NASA_GoddardPix" rel="nofollow">Twitter</a></b> <b>Like us on <a href="http://www.facebook.com/pages/Greenbelt-MD/NASA-Goddard/395013845897?ref=tsd" rel="nofollow">Facebook</a></b> <b>Find us on <a href="http://instagrid.me/nasagoddard/?vm=grid" rel="nofollow">Instagram</a></b>
On March 31, the P-3 departed Thule, Greenland. IceBridge teams flew a science transit flight to Kangerlussaq, Greenland, where missions will be based for the next several weeks before returning to Thule. Along the route, instruments surveyed several targets of opportunity including two ground tracks of the Ice, Cloud and land Elevation Satellite (ICESat) and several glaciers (Rink, Kangerdlugssuaq, Jakobshavn and Russell), turning up great data and spectacular views. March 29 was another perfect day for a land ice flight. The P-3 flew between deep canyons and over glaciers along the northwest coast of Greenland. But before the start of land ice flights, IceBridge reached a key milestone over sea ice. On March 28, IceBridge flew its eighth sea ice flight marking the completion of all high- and medium-priority sea ice missions planned from Thule. Among the sea ice missions was a science transit back from Fairbanks to Thule on March 25, during which the P-3 surveyed in complete darkness. Researchers watched the scanning pattern of the green lasers on the sea ice below and the beautiful Aurora Borealis above. To learn more about Ice Bridge go to: <a href="http://www.nasa.gov/mission_pages/icebridge/news/spr11/index.html" rel="nofollow">www.nasa.gov/mission_pages/icebridge/news/spr11/index.html</a> <b><a href="http://www.nasa.gov/centers/goddard/home/index.html" rel="nofollow">NASA Goddard Space Flight Center</a></b> enables NASA’s mission through four scientific endeavors: Earth Science, Heliophysics, Solar System Exploration, and Astrophysics. Goddard plays a leading role in NASA’s accomplishments by contributing compelling scientific knowledge to advance the Agency’s mission. <b>Follow us on <a href="http://twitter.com/NASA_GoddardPix" rel="nofollow">Twitter</a></b> <b>Join us on <a href="http://www.facebook.com/pages/Greenbelt-MD/NASA-Goddard/395013845897?ref=tsd" rel="nofollow">Facebook</a></b>
![NASA researchers have new [sic] insights into the mysteries of Arctic sea ice, thanks to the unique abilities of Canada's Radarsat satellite. The Arctic is the smallest of the world's four oceans, but it may play a large role in helping scientists monitor Earth's climate shifts. Using Radarsat's special sensors to take images at night and to peer through clouds, NASA researchers can now see the complete ice cover of the Arctic. This allows tracking of any shifts and changes, in unprecedented detail, over the course of an entire winter. The radar-generated, high-resolution images are up to 100 times better than those taken by previous satellites. http://photojournal.jpl.nasa.gov/catalog/PIA02970](https://images-assets.nasa.gov/image/PIA02970/PIA02970~thumb.jpg)
NASA researchers have new [sic] insights into the mysteries of Arctic sea ice, thanks to the unique abilities of Canada's Radarsat satellite. The Arctic is the smallest of the world's four oceans, but it may play a large role in helping scientists monitor Earth's climate shifts. Using Radarsat's special sensors to take images at night and to peer through clouds, NASA researchers can now see the complete ice cover of the Arctic. This allows tracking of any shifts and changes, in unprecedented detail, over the course of an entire winter. The radar-generated, high-resolution images are up to 100 times better than those taken by previous satellites. http://photojournal.jpl.nasa.gov/catalog/PIA02970

In May 2014, two new studies concluded that a section of the land-based West Antarctic ice sheet had reached a point of inevitable collapse. Meanwhile, fresh observations from September 2014 showed sea ice around Antarctica had reached its greatest extent since the late 1970s. To better understand such dynamic and dramatic differences in the region's land and sea ice, researchers are travelling south to Antarctica this month for the sixth campaign of NASA’s Operation IceBridge. The airborne campaign, which also flies each year over Greenland, makes annual surveys of the ice with instrumented research aircraft. Instruments range from lasers that map the elevation of the ice surface, radars that "see" below it, and downward looking cameras to provide a natural-color perspective. The Digital Mapping System (DMS) camera acquired the above photo during the mission’s first science flight on October 16, 2009. At the time of the image, the DC-8 aircraft was flying at an altitude of 515 meters (1,700 feet) over heavily compacted first-year sea ice along the edge of the Amundsen Sea. Since that first flight, much has been gleaned from IceBridge data. For example, images from an IceBridge flight in October 2011 revealed a massive crack running about 29 kilometers (18 miles) across the floating tongue of Antarctica's Pine Island Glacier. The crack ultimately led to a 725-square-kilometer (280-square-mile) iceberg. In 2012, IceBridge data was a key part of a new map of Antarctica called Bedmap2. By combining surface elevation, ice thickness, and bedrock topography, Bedmap2 gives a clearer picture of Antarctica from the ice surface down to the land surface. Discoveries have been made in Greenland, too, including the identification of a 740-kilometer-long (460-mile-long) mega canyon below the ice sheet. Repeated measurements of land and sea ice from aircraft extend the record of observations once made by NASA’s Ice, Cloud, and Land Elevation Satellite, or ICESat, which stopped functioning in 2009. In addition to extending the ICESat record, IceBridge also sets the stage for ICESat-2, which is scheduled for launch in 2017. Credit: IceBridge DMS L0 Raw Imagery courtesy of the Digital Mapping System (DMS) team/NASA DAAC at the National Snow and Ice Data Center More info: <a href="http://earthobservatory.nasa.gov/IOTD/view.php?id=84549" rel="nofollow">earthobservatory.nasa.gov/IOTD/view.php?id=84549</a> <a href="http://earthobservatory.nasa.gov/IOTD/view.php?id=84549" rel="nofollow">earthobservatory.nasa.gov/IOTD/view.php?id=84549</a>
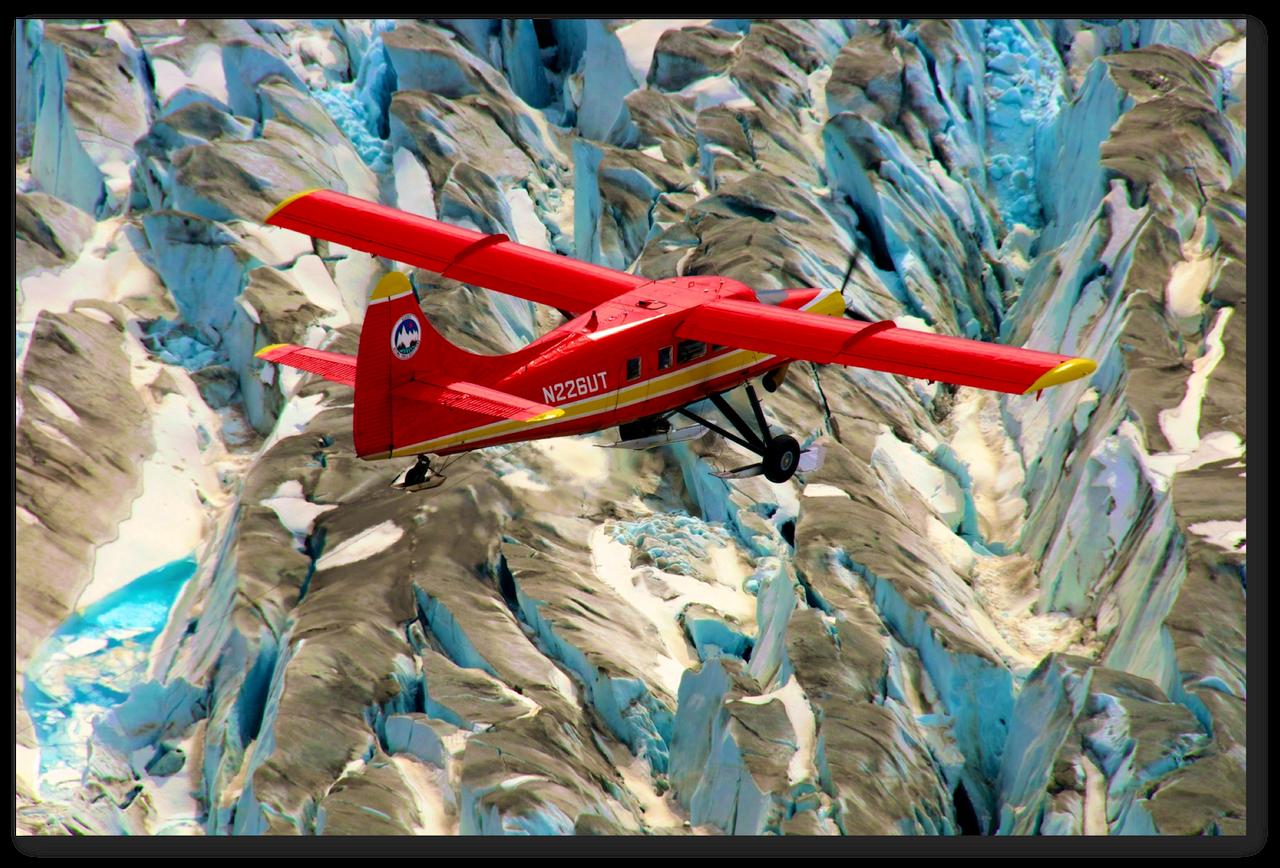
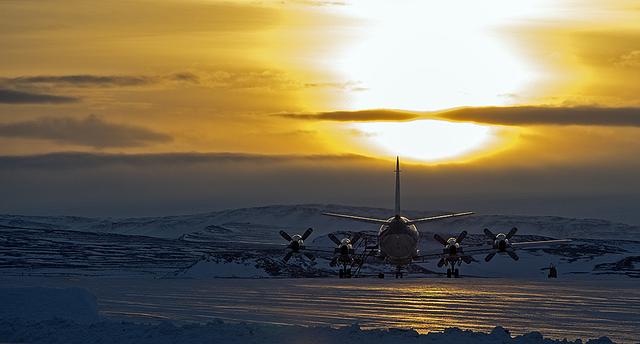
This red plane is a DHC-3 Otter, the plane flown in NASA's Operation IceBridge-Alaska surveys of mountain glaciers in Alaska. Credit: Chris Larsen, University of Alaska-Fairbanks Over the past few decades, average global temperatures have been on the rise, and this warming is happening two to three times faster in the Arctic. As the region’s summer comes to a close, NASA is hard at work studying how rising temperatures are affecting the Arctic. NASA researchers this summer and fall are carrying out three Alaska-based airborne research campaigns aimed at measuring greenhouse gas concentrations near Earth’s surface, monitoring Alaskan glaciers, and collecting data on Arctic sea ice and clouds. Observations from these NASA campaigns will give researchers a better understanding of how the Arctic is responding to rising temperatures. The Arctic Radiation – IceBridge Sea and Ice Experiment, or ARISE, is a new NASA airborne campaign to collect data on thinning sea ice and measure cloud and atmospheric properties in the Arctic. The campaign was designed to address questions about the relationship between retreating sea ice and the Arctic climate. Arctic sea ice reflects sunlight away from Earth, moderating warming in the region. Loss of sea ice means more heat from the sun is absorbed by the ocean surface, adding to Arctic warming. In addition, the larger amount of open water leads to more moisture in the air, which affects the formation of clouds that have their own effect on warming, either enhancing or reducing it. Read more: <a href="http://www.nasa.gov/earthrightnow" rel="nofollow">www.nasa.gov/earthrightnow</a> <b><a href="http://www.nasa.gov/audience/formedia/features/MP_Photo_Guidelines.html" rel="nofollow">NASA image use policy.</a></b> <b><a href="http://www.nasa.gov/centers/goddard/home/index.html" rel="nofollow">NASA Goddard Space Flight Center</a></b> enables NASA’s mission through four scientific endeavors: Earth Science, Heliophysics, Solar System Exploration, and Astrophysics. Goddard plays a leading role in NASA’s accomplishments by contributing compelling scientific knowledge to advance the Agency’s mission. <b>Follow us on <a href="http://twitter.com/NASAGoddardPix" rel="nofollow">Twitter</a></b> <b>Like us on <a href="http://www.facebook.com/pages/Greenbelt-MD/NASA-Goddard/395013845897?ref=tsd" rel="nofollow">Facebook</a></b> <b>Find us on <a href="http://instagram.com/nasagoddard?vm=grid" rel="nofollow">Instagram</a></b>

Scientists and crew with NASA’s Operation IceBridge, which makes annual aerial surveys of polar ice, are wrapping up their seventh campaign over the Arctic. In spring 2015, the team began using a different research aircraft—an adapted C-130 Hercules. They also added four new high-priority targets in the rapidly changing region of northeast Greenland. Many of the flights, however, were routine. And that’s exactly the point; making measurements over the same path each year provides continuity between NASA’s Ice, Cloud, and Land Elevation Satellite (ICESat) missions—the first of which ended in 2009 and the second of which is scheduled for launch in 2017. Repeat measurements show how a landscape changes over time. One area that has been surveyed repeatedly is northern Greenland’s Ryder Glacier. This photograph, taken during the IceBridge flight on May 6, 2015, shows a large moulin—dozens of meters across—atop this glacier. Moulins are holes in the ice sheet that drain melt water from the ice sheet’s surface to the bottom or out to the sea. Scientists are working to figure out what happens to melt water once it enters a moulin.

The late winter sun shone brightly on a stunning scene of clouds and ice in the Davis Strait in late February, 2013. The Moderate Resolution Imaging Spectroradiometer aboard NASA’s Aqua satellite captured this true-color image on February 22 at 1625 UTC. The Davis Strait connects the Labrador Sea (part of the Atlantic Ocean) in the south with Baffin Bay to the north, and separates Canada, to the west, from Greenland to the east. Strong, steady winds frequently blow southward from the colder Baffin Bay to the warmer waters of the Labrador Sea. Over ice, the air is dry and no clouds form. However, as the Arctic air moves over the warmer, open water the rising moist air and the temperature differential gives rise to lines of clouds. In this image, the clouds are aligned in a beautiful, parallel pattern. Known as “cloud streets”, this pattern is formed in a low-level wind, with the clouds aligning in the direction of the wind. Credit: NASA/GSFC/Jeff Schmaltz/MODIS Land Rapid Response Team <b><a href="http://www.nasa.gov/audience/formedia/features/MP_Photo_Guidelines.html" rel="nofollow">NASA image use policy.</a></b> <b><a href="http://www.nasa.gov/centers/goddard/home/index.html" rel="nofollow">NASA Goddard Space Flight Center</a></b> enables NASA’s mission through four scientific endeavors: Earth Science, Heliophysics, Solar System Exploration, and Astrophysics. Goddard plays a leading role in NASA’s accomplishments by contributing compelling scientific knowledge to advance the Agency’s mission. <b>Follow us on <a href="http://twitter.com/NASA_GoddardPix" rel="nofollow">Twitter</a></b> <b>Like us on <a href="http://www.facebook.com/pages/Greenbelt-MD/NASA-Goddard/395013845897?ref=tsd" rel="nofollow">Facebook</a></b> <b>Find us on <a href="http://instagram.com/nasagoddard?vm=grid" rel="nofollow">Instagram</a></b>

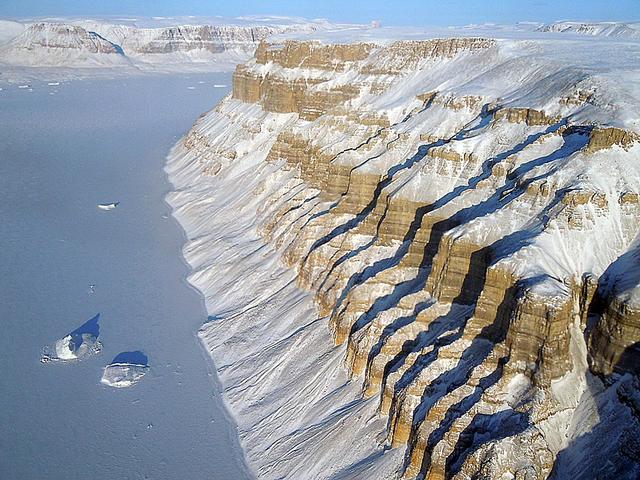
ISS017-E-012583 (4 Aug. 2008) --- Cape Farewell, Greenland is featured in this image photographed by an Expedition 17 crewmember on the International Space Station (ISS). This view illustrates the southernmost tip of Greenland, known as Kap Farvel in Danish and Nunap Isua in Inuit. The viewing direction is towards the northeast; the image was taken when the space station was located near its most northerly orbital latitude of 52 degrees, off the northern coast of the Island of Newfoundland approximately 1160 kilometers to the southwest. Greenland is the world's largest island with an area of over 2 million square kilometers; however much of the island is covered by an ice cap that can reach thicknesses of 3 kilometers. The image is highly oblique -- taken from an angle looking outwards from the ISS, rather than straight down towards the Earth -- and this provides a sense of topography along the southern edge of Greenland. The exposed dark grey bedrock along the southwestern coastline has been carved by glaciers into numerous fjords -- steep-sided valleys that drain directly into the ocean; the white cloud cover surrounding the island doubtless contains some sea ice and icebergs calved from glaciers. A band of high-altitude cirrus clouds (light grey) cast shadows on the lower stratus cloud deck in the lower third of the image. The thin blue layer of Earth's atmosphere is visible.

Wonders in the Antarctic Sea and Sky NASA aircraft and scientists have returned to the United States after a short ice-surveying mission to #Antarctica. Despite having only a week of flying time, the team returned with crucial scientific data and a trove of spectacular aerial photographs. The flights over Antarctica were part of Operation #IceBridge, a multi-year mission to monitor conditions in Antarctica and the Arctic until a new ice-monitoring satellite, ICESat-2, launches in 2016. ICESat-1 was decommissioned in 2009, and IceBridge aircraft have been flying ever since. Laser altimeter and radar data are the primary products of the mission, but IceBridge project scientist Michael Studinger almost always has his digital camera ready as well. On November 24, 2013, he took this photograph of a multi-layered lenticular cloud hovering near Mount Discovery, a volcano about 70 kilometers (44 miles) southwest of McMurdo. Lenticular #clouds are a type of wave cloud. They usually form when a layer of air near the surface encounters a topographic barrier, gets pushed upward, and flows over it as a series of atmospheric gravity waves. Lenticular clouds form at the crest of the waves, where the air is coolest and water vapor is most likely to condense into cloud droplets. The bulging sea ice in the foreground is a pressure ridge, which formed when separate ice floes collided and piled up on each other. Read more: <a href="http://1.usa.gov/18lXIQS" rel="nofollow">1.usa.gov/18lXIQS</a> Photograph courtesy of Michael Studinger. Caption by Adam Voiland of NASA's Earth Observatory. <b><a href="http://www.nasa.gov/audience/formedia/features/MP_Photo_Guidelines.html" rel="nofollow">NASA image use policy.</a></b> <b><a href="http://www.nasa.gov/centers/goddard/home/index.html" rel="nofollow">NASA Goddard Space Flight Center</a></b> enables NASA’s mission through four scientific endeavors: Earth Science, Heliophysics, Solar System Exploration, and Astrophysics. Goddard plays a leading role in NASA’s accomplishments by contributing compelling scientific knowledge to advance the Agency’s mission. <b>Follow us on <a href="http://twitter.com/NASA_GoddardPix" rel="nofollow">Twitter</a></b> <b>Like us on <a href="http://www.facebook.com/pages/Greenbelt-MD/NASA-Goddard/395013845897?ref=tsd" rel="nofollow">Facebook</a></b> <b>Find us on <a href="http://instagram.com/nasagoddard?vm=grid" rel="nofollow">Instagram</a></b>
The P-3B is waiting outside the hangar at Thule Air Base with the Greenland Ice sheet in the background. Today, NASA's IceBridge, Arctic 2013 mission will collect data across the Arctic Ocean between Greenland and Alaska. -- IceBridge, a six-year NASA mission, is the largest airborne survey of Earth's polar ice ever flown. It will yield an unprecedented three-dimensional view of Arctic and Antarctic ice sheets, ice shelves and sea ice. These flights will provide a yearly, multi-instrument look at the behavior of the rapidly changing features of the Greenland and Antarctic ice. Data collected during IceBridge will help scientists bridge the gap in polar observations between NASA's Ice, Cloud and Land Elevation Satellite (ICESat) -- in orbit since 2003 -- and ICESat-2, planned for early 2016. ICESat stopped collecting science data in 2009, making IceBridge critical for ensuring a continuous series of observations. IceBridge will use airborne instruments to map Arctic and Antarctic areas once a year. IceBridge flights are conducted in March-May over Greenland and in October-November over Antarctica. Other smaller airborne surveys around the world are also part of the IceBridge campaign. Credit: NASA/Goddard/Michael Studinger <b><a href="http://www.nasa.gov/audience/formedia/features/MP_Photo_Guidelines.html" rel="nofollow">NASA image use policy.</a></b> <b><a href="http://www.nasa.gov/centers/goddard/home/index.html" rel="nofollow">NASA Goddard Space Flight Center</a></b> enables NASA’s mission through four scientific endeavors: Earth Science, Heliophysics, Solar System Exploration, and Astrophysics. Goddard plays a leading role in NASA’s accomplishments by contributing compelling scientific knowledge to advance the Agency’s mission. <b>Follow us on <a href="http://twitter.com/NASA_GoddardPix" rel="nofollow">Twitter</a></b> <b>Like us on <a href="http://www.facebook.com/pages/Greenbelt-MD/NASA-Goddard/395013845897?ref=tsd" rel="nofollow">Facebook</a></b> <b>Find us on <a href="http://instagram.com/nasagoddard?vm=grid" rel="nofollow">Instagram</a></b>
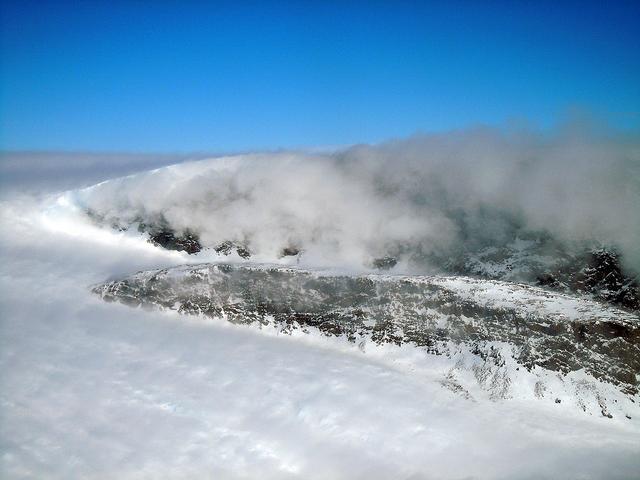
On April 11, 2011, IceBridge finally got the clear weather necessary to fly over glaciers in southeast Greenland, but with clear skies came winds of up to 70 knots. What looks like clouds is actually wind-blown snow. The data could help scientists to evaluate the impact of wind-blown snow on satellite-based laser altimetry measurements. Operation IceBridge, now in its third year, makes annual campaigns in the Arctic and Antarctic where science flights monitor glaciers, ice sheets and sea ice. Credit: NASA/GSFC/Michael Studinger To learn more about Ice Bridge go to: <a href="http://www.nasa.gov/mission_pages/icebridge/news/spr11/index.html" rel="nofollow">www.nasa.gov/mission_pages/icebridge/news/spr11/index.html</a> <b><a href="http://www.nasa.gov/centers/goddard/home/index.html" rel="nofollow">NASA Goddard Space Flight Center</a></b> enables NASA’s mission through four scientific endeavors: Earth Science, Heliophysics, Solar System Exploration, and Astrophysics. Goddard plays a leading role in NASA’s accomplishments by contributing compelling scientific knowledge to advance the Agency’s mission. <b>Follow us on <a href="http://twitter.com/NASA_GoddardPix" rel="nofollow">Twitter</a></b> <b>Join us on <a href="http://www.facebook.com/pages/Greenbelt-MD/NASA-Goddard/395013845897?ref=tsd" rel="nofollow">Facebook</a></b>
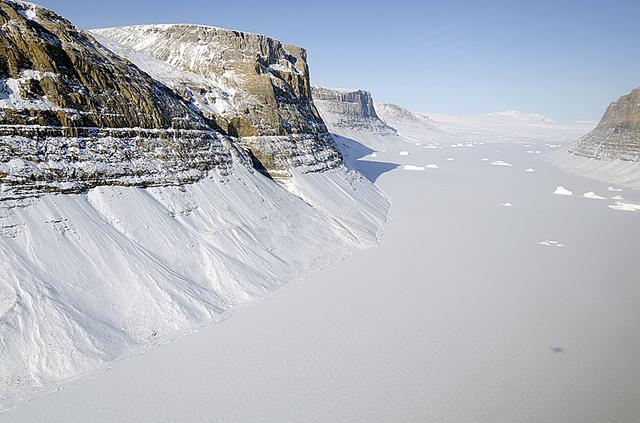
A northern Greenland glacier as seen by NASA's P-3B aircraft on May 3, 2012. Credit: Michael Studinger/NASA =========== IceBridge, a six-year NASA mission, is the largest airborne survey of Earth's polar ice ever flown. It will yield an unprecedented three-dimensional view of Arctic and Antarctic ice sheets, ice shelves and sea ice. These flights will provide a yearly, multi-instrument look at the behavior of the rapidly changing features of the Greenland and Antarctic ice. Data collected during IceBridge will help scientists bridge the gap in polar observations between NASA's Ice, Cloud and Land Elevation Satellite (ICESat) -- in orbit since 2003 -- and ICESat-2, planned for early 2016. ICESat stopped collecting science data in 2009, making IceBridge critical for ensuring a continuous series of observations. IceBridge will use airborne instruments to map Arctic and Antarctic areas once a year. IceBridge flights are conducted in March-May over Greenland and in October-November over Antarctica. Other smaller airborne surveys around the world are also part of the IceBridge campaign. To read more about IceBridge - Arctic 2012 go to: <a href="http://www.nasa.gov/mission_pages/icebridge/index.html" rel="nofollow">www.nasa.gov/mission_pages/icebridge/index.html</a> <b><a href="http://www.nasa.gov/audience/formedia/features/MP_Photo_Guidelines.html" rel="nofollow">NASA image use policy.</a></b> <b><a href="http://www.nasa.gov/centers/goddard/home/index.html" rel="nofollow">NASA Goddard Space Flight Center</a></b> enables NASA’s mission through four scientific endeavors: Earth Science, Heliophysics, Solar System Exploration, and Astrophysics. Goddard plays a leading role in NASA’s accomplishments by contributing compelling scientific knowledge to advance the Agency’s mission. <b>Follow us on <a href="http://twitter.com/NASA_GoddardPix" rel="nofollow">Twitter</a></b> <b>Like us on <a href="http://www.facebook.com/pages/Greenbelt-MD/NASA-Goddard/395013845897?ref=tsd" rel="nofollow">Facebook</a></b> <b>Find us on <a href="http://instagrid.me/nasagoddard/?vm=grid" rel="nofollow">Instagram</a></b>
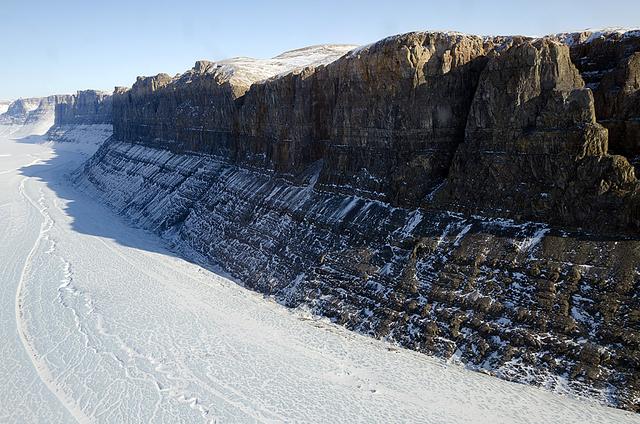
A glacial canyon in northern Greenland as seen by NASA's P-3B aircraft on May 3, 2012. Credit: Michael Studinger/NASA =========== IceBridge, a six-year NASA mission, is the largest airborne survey of Earth's polar ice ever flown. It will yield an unprecedented three-dimensional view of Arctic and Antarctic ice sheets, ice shelves and sea ice. These flights will provide a yearly, multi-instrument look at the behavior of the rapidly changing features of the Greenland and Antarctic ice. Data collected during IceBridge will help scientists bridge the gap in polar observations between NASA's Ice, Cloud and Land Elevation Satellite (ICESat) -- in orbit since 2003 -- and ICESat-2, planned for early 2016. ICESat stopped collecting science data in 2009, making IceBridge critical for ensuring a continuous series of observations. IceBridge will use airborne instruments to map Arctic and Antarctic areas once a year. IceBridge flights are conducted in March-May over Greenland and in October-November over Antarctica. Other smaller airborne surveys around the world are also part of the IceBridge campaign. To read more about IceBridge - Arctic 2012 go to: <a href="http://www.nasa.gov/mission_pages/icebridge/index.html" rel="nofollow">www.nasa.gov/mission_pages/icebridge/index.html</a> <b><a href="http://www.nasa.gov/audience/formedia/features/MP_Photo_Guidelines.html" rel="nofollow">NASA image use policy.</a></b> <b><a href="http://www.nasa.gov/centers/goddard/home/index.html" rel="nofollow">NASA Goddard Space Flight Center</a></b> enables NASA’s mission through four scientific endeavors: Earth Science, Heliophysics, Solar System Exploration, and Astrophysics. Goddard plays a leading role in NASA’s accomplishments by contributing compelling scientific knowledge to advance the Agency’s mission. <b>Follow us on <a href="http://twitter.com/NASA_GoddardPix" rel="nofollow">Twitter</a></b> <b>Like us on <a href="http://www.facebook.com/pages/Greenbelt-MD/NASA-Goddard/395013845897?ref=tsd" rel="nofollow">Facebook</a></b> <b>Find us on <a href="http://instagrid.me/nasagoddard/?vm=grid" rel="nofollow">Instagram</a></b>
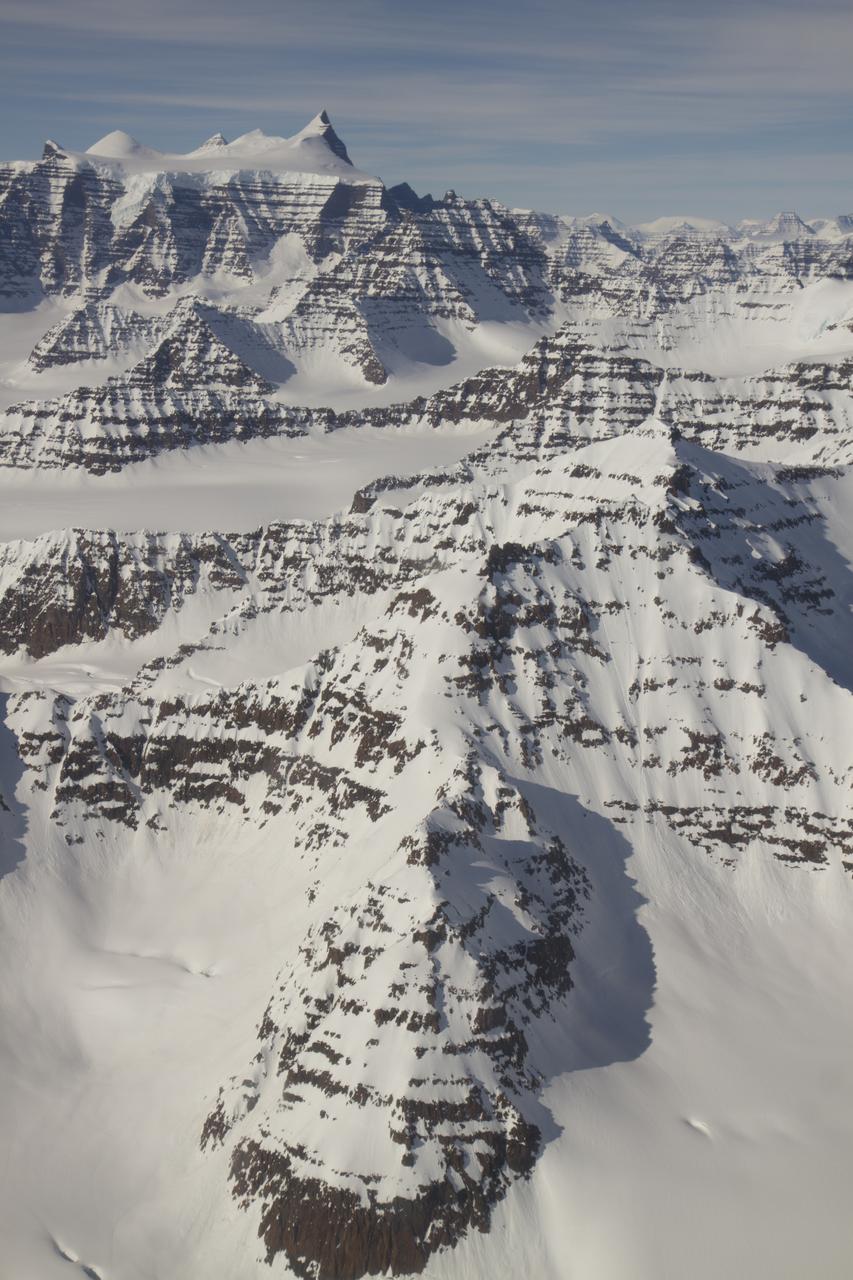
A wider view of mountains showing the distinctive geology of the Geikie Plateau region in eastern Greenland, as seen from NASA's P-3B aircraft on April 16, 2012. Credit: NASA/GSFC/Jefferson Beck =========== IceBridge, a six-year NASA mission, is the largest airborne survey of Earth's polar ice ever flown. It will yield an unprecedented three-dimensional view of Arctic and Antarctic ice sheets, ice shelves and sea ice. These flights will provide a yearly, multi-instrument look at the behavior of the rapidly changing features of the Greenland and Antarctic ice. Data collected during IceBridge will help scientists bridge the gap in polar observations between NASA's Ice, Cloud and Land Elevation Satellite (ICESat) -- in orbit since 2003 -- and ICESat-2, planned for early 2016. ICESat stopped collecting science data in 2009, making IceBridge critical for ensuring a continuous series of observations. IceBridge will use airborne instruments to map Arctic and Antarctic areas once a year. IceBridge flights are conducted in March-May over Greenland and in October-November over Antarctica. Other smaller airborne surveys around the world are also part of the IceBridge campaign. To read more about IceBridge - Arctic 2012 go to: <a href="http://www.nasa.gov/mission_pages/icebridge/index.html" rel="nofollow">www.nasa.gov/mission_pages/icebridge/index.html</a> <b><a href="http://www.nasa.gov/audience/formedia/features/MP_Photo_Guidelines.html" rel="nofollow">NASA image use policy.</a></b> <b><a href="http://www.nasa.gov/centers/goddard/home/index.html" rel="nofollow">NASA Goddard Space Flight Center</a></b> enables NASA’s mission through four scientific endeavors: Earth Science, Heliophysics, Solar System Exploration, and Astrophysics. Goddard plays a leading role in NASA’s accomplishments by contributing compelling scientific knowledge to advance the Agency’s mission. <b>Follow us on <a href="http://twitter.com/NASA_GoddardPix" rel="nofollow">Twitter</a></b> <b>Like us on <a href="http://www.facebook.com/pages/Greenbelt-MD/NASA-Goddard/395013845897?ref=tsd" rel="nofollow">Facebook</a></b> <b>Find us on <a href="http://instagrid.me/nasagoddard/?vm=grid" rel="nofollow">Instagram</a></b>
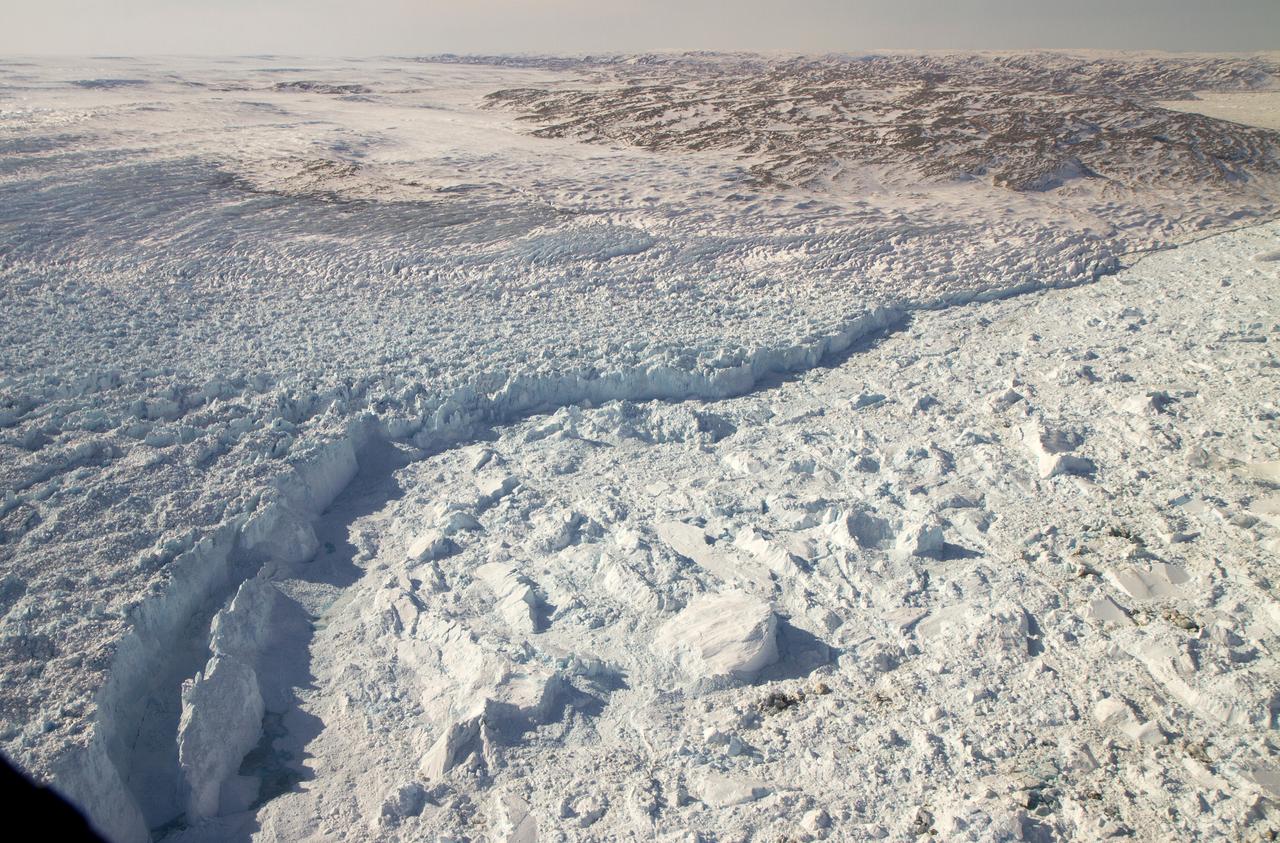
The calving front of the Jakobshavn Glacier in western Greenland, as seen from NASA's P-3B aircraft on April 21, 2012. Credit: NASA/GSFC/Jefferson Beck =========== IceBridge, a six-year NASA mission, is the largest airborne survey of Earth's polar ice ever flown. It will yield an unprecedented three-dimensional view of Arctic and Antarctic ice sheets, ice shelves and sea ice. These flights will provide a yearly, multi-instrument look at the behavior of the rapidly changing features of the Greenland and Antarctic ice. Data collected during IceBridge will help scientists bridge the gap in polar observations between NASA's Ice, Cloud and Land Elevation Satellite (ICESat) -- in orbit since 2003 -- and ICESat-2, planned for early 2016. ICESat stopped collecting science data in 2009, making IceBridge critical for ensuring a continuous series of observations. IceBridge will use airborne instruments to map Arctic and Antarctic areas once a year. IceBridge flights are conducted in March-May over Greenland and in October-November over Antarctica. Other smaller airborne surveys around the world are also part of the IceBridge campaign. To read more about IceBridge - Arctic 2012 go to: <a href="http://www.nasa.gov/mission_pages/icebridge/index.html" rel="nofollow">www.nasa.gov/mission_pages/icebridge/index.html</a> <b><a href="http://www.nasa.gov/audience/formedia/features/MP_Photo_Guidelines.html" rel="nofollow">NASA image use policy.</a></b> <b><a href="http://www.nasa.gov/centers/goddard/home/index.html" rel="nofollow">NASA Goddard Space Flight Center</a></b> enables NASA’s mission through four scientific endeavors: Earth Science, Heliophysics, Solar System Exploration, and Astrophysics. Goddard plays a leading role in NASA’s accomplishments by contributing compelling scientific knowledge to advance the Agency’s mission. <b>Follow us on <a href="http://twitter.com/NASA_GoddardPix" rel="nofollow">Twitter</a></b> <b>Like us on <a href="http://www.facebook.com/pages/Greenbelt-MD/NASA-Goddard/395013845897?ref=tsd" rel="nofollow">Facebook</a></b> <b>Find us on <a href="http://instagrid.me/nasagoddard/?vm=grid" rel="nofollow">Instagram</a></b>
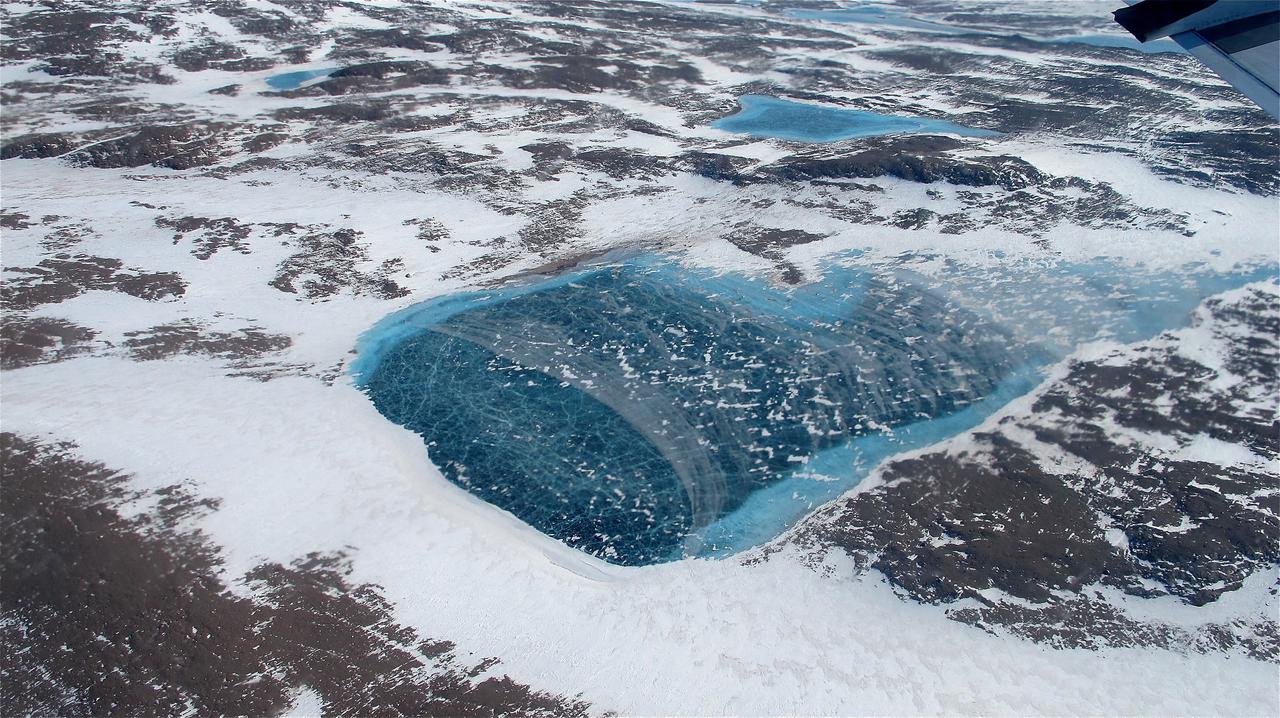
Frozen meltwater lake along the northeast Greenland coast, as seen from NASA's P-3B aircraft on May 7, 2012. Credit: NASA/Jim Yungel =========== IceBridge, a six-year NASA mission, is the largest airborne survey of Earth's polar ice ever flown. It will yield an unprecedented three-dimensional view of Arctic and Antarctic ice sheets, ice shelves and sea ice. These flights will provide a yearly, multi-instrument look at the behavior of the rapidly changing features of the Greenland and Antarctic ice. Data collected during IceBridge will help scientists bridge the gap in polar observations between NASA's Ice, Cloud and Land Elevation Satellite (ICESat) -- in orbit since 2003 -- and ICESat-2, planned for early 2016. ICESat stopped collecting science data in 2009, making IceBridge critical for ensuring a continuous series of observations. IceBridge will use airborne instruments to map Arctic and Antarctic areas once a year. IceBridge flights are conducted in March-May over Greenland and in October-November over Antarctica. Other smaller airborne surveys around the world are also part of the IceBridge campaign. To read more about IceBridge - Arctic 2012 go to: <a href="http://www.nasa.gov/mission_pages/icebridge/index.html" rel="nofollow">www.nasa.gov/mission_pages/icebridge/index.html</a> <b><a href="http://www.nasa.gov/audience/formedia/features/MP_Photo_Guidelines.html" rel="nofollow">NASA image use policy.</a></b> <b><a href="http://www.nasa.gov/centers/goddard/home/index.html" rel="nofollow">NASA Goddard Space Flight Center</a></b> enables NASA’s mission through four scientific endeavors: Earth Science, Heliophysics, Solar System Exploration, and Astrophysics. Goddard plays a leading role in NASA’s accomplishments by contributing compelling scientific knowledge to advance the Agency’s mission. <b>Follow us on <a href="http://twitter.com/NASA_GoddardPix" rel="nofollow">Twitter</a></b> <b>Like us on <a href="http://www.facebook.com/pages/Greenbelt-MD/NASA-Goddard/395013845897?ref=tsd" rel="nofollow">Facebook</a></b> <b>Find us on <a href="http://instagrid.me/nasagoddard/?vm=grid" rel="nofollow">Instagram</a></b>
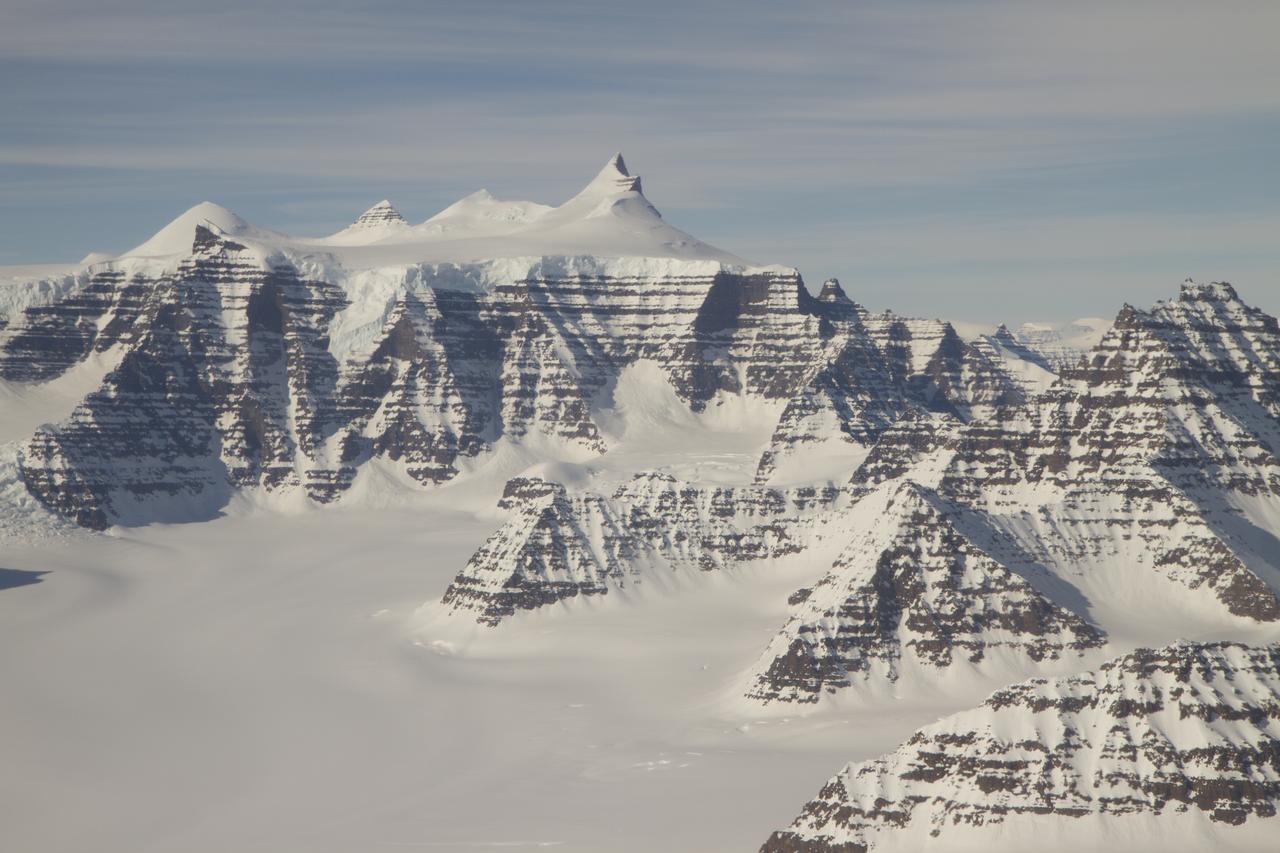
Mountain ridges showing the distinctive geology of the Geikie Plateau region in eastern Greenland, as seen from NASA's P-3B aircraft on April 16, 2012. Credit: NASA/GSFC/Jefferson Beck =========== IceBridge, a six-year NASA mission, is the largest airborne survey of Earth's polar ice ever flown. It will yield an unprecedented three-dimensional view of Arctic and Antarctic ice sheets, ice shelves and sea ice. These flights will provide a yearly, multi-instrument look at the behavior of the rapidly changing features of the Greenland and Antarctic ice. Data collected during IceBridge will help scientists bridge the gap in polar observations between NASA's Ice, Cloud and Land Elevation Satellite (ICESat) -- in orbit since 2003 -- and ICESat-2, planned for early 2016. ICESat stopped collecting science data in 2009, making IceBridge critical for ensuring a continuous series of observations. IceBridge will use airborne instruments to map Arctic and Antarctic areas once a year. IceBridge flights are conducted in March-May over Greenland and in October-November over Antarctica. Other smaller airborne surveys around the world are also part of the IceBridge campaign. To read more about IceBridge - Arctic 2012 go to: <a href="http://www.nasa.gov/mission_pages/icebridge/index.html" rel="nofollow">www.nasa.gov/mission_pages/icebridge/index.html</a> <b><a href="http://www.nasa.gov/audience/formedia/features/MP_Photo_Guidelines.html" rel="nofollow">NASA image use policy.</a></b> <b><a href="http://www.nasa.gov/centers/goddard/home/index.html" rel="nofollow">NASA Goddard Space Flight Center</a></b> enables NASA’s mission through four scientific endeavors: Earth Science, Heliophysics, Solar System Exploration, and Astrophysics. Goddard plays a leading role in NASA’s accomplishments by contributing compelling scientific knowledge to advance the Agency’s mission. <b>Follow us on <a href="http://twitter.com/NASA_GoddardPix" rel="nofollow">Twitter</a></b> <b>Like us on <a href="http://www.facebook.com/pages/Greenbelt-MD/NASA-Goddard/395013845897?ref=tsd" rel="nofollow">Facebook</a></b> <b>Find us on <a href="http://instagrid.me/nasagoddard/?vm=grid" rel="nofollow">Instagram</a></b>
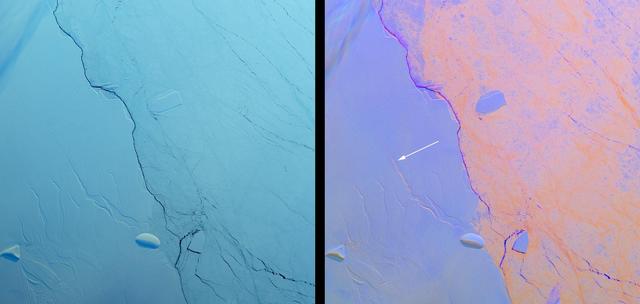
Project MIDAS, a United Kingdom-based group that studies the Larsen Ice Shelf in Antarctica, reported Aug. 18, 2016, that a large crack in the Larsen C shelf has grown by another 13 miles (22 kilometers) in the past six months. The crack is now more than 80 miles (130 kilometers) long. Larsen C is the fourth largest ice shelf in Antarctica, with an area of about 19,300 square miles (50,000 square kilometers), greater than the size of Maryland. Computer modeling by Project MIDAS predicts that the crack will continue to grow and eventually cause between nine and twelve percent of the ice shelf to collapse, resulting in the loss of 2,300 square miles (6,000 square kilometers) of ice -- more than the area of Delaware. This follows the collapse of the Larsen B shelf in 2002 and the Larsen A shelf in 1995, which removed about 1,255 square miles (3,250 square kilometers) and 580 square miles (1,500 square kilometers) of ice, respectively. The Multiangle Imaging SpectroRadiometer (MISR) instrument aboard NASA's Terra satellite flew over Larsen C on Aug. 22, 2016. The MISR instrument views Earth with nine cameras pointed at different angles, which provides information about the texture of the surface. On the left is a natural-color image of the shelf from MISR's vertical-viewing camera. Antarctica is slowly emerging from its polar night, and the low light gives the scene a bluish tint. The Larsen C shelf is on the left, while thinner sea ice is present on the right. A variety of cracks are visible in the Larsen C shelf, all appearing roughly the same. The image is about 130 by 135 miles (210 by 220 kilometers) in size. On the right is a composite image made by combining data from MISR's 46-degree backward-pointing camera (plotted as blue), the vertical-pointing camera (plotted as green), and the 46-degree forward-pointing camera (plotted as red). This has the effect of highlighting surface roughness; smooth surfaces appear as blue-purple, while rough surfaces appear as orange. Clouds near the upper left appear multi-hued because their elevation above the surface causes the different angular views to be slightly displaced. In this composite, the difference between the rough sea ice and the smoother ice shelf is immediately apparent. An examination of the cracks in the ice shelf shows that the large crack Project MIDAS is tracking (indicated by an arrow) is orange in color, demonstrating that it is actively growing. These data were acquired during Terra orbit 88717 http://photojournal.jpl.nasa.gov/catalog/PIA20894

The Visible Infrared Imaging Radiometer Suite (VIIRS) on the Suomi NPP satellite captured this view of extensive sea-ice fracturing off the northern coast of Alaska. The event began in late-January and spread west toward Banks Island throughout February and March 2013. Visualizations of the Arctic often give the impression that the ice cap is a continuous sheet of stationary, floating ice. In fact, it is a collection of smaller pieces that constantly shift, crack, and grind against one another as they are jostled by winds and ocean currents. Especially during the summer—but even during the height of winter—cracks—or leads—open up between pieces of ice. That was what was happening on the left side of the animation (seen here: <a href="http://bit.ly/10kE7sh" rel="nofollow">bit.ly/10kE7sh</a>) in late January. A high-pressure weather system was parked over the region, producing warmer temperatures and winds that flowed in a southwesterly direction. That fueled the Beaufort Gyre, a wind-driven ocean current that flows clockwise. The gyre was the key force pulling pieces of ice west past Point Barrow, the northern nub of Alaska that protrudes into the Beaufort Sea. “A fracturing event in this area is not unusual because the Beaufort Gyre tends to push ice away from Banks Island and the Canadian Archipelago,” explained Walt Meier of the National Snow & Ice Data Center (NSIDC). “Point Barrow can act like a ‘pin point’ where the ice catches and fractures to the north and east.” In February, however, a series of storms passing over central Alaska exacerbated the fracturing. Strong westerly winds prompted several large pieces of ice to break away in an arc-shaped wave that moved progressively east. By the end of February, large pieces of ice had fractured all the way to the western coast of Banks Island, a distance of about 1,000 kilometers (600 miles). The data used to create the animation came from the longwave infrared (thermal) portion of the electromagnetic spectrum, so the animation illustrates how much heat the surface was emitting as VIIRS surveyed the area. Cooler areas (sea ice) appear white, while warmer areas (open water) are dark. The light gray plume near the cracks is warmer, moister air escaping from the ocean and blowing downwind. Clouds do not show up well in the VIIRS thermal band, so the storms that fueled the fracturing are not readily visible. While fracturing events are common, few events sprawl across such a large area or produce cracks as long and wide as those seen here. The age of the sea ice in this area was one of the key reasons this event became so widespread. “The region is covered almost completely by seasonal or first-year ice—ice that has formed since last September,” said Meier. “This ice is thinner and weaker than the older, multi-year ice, so it responds more readily to winds and is more easily broken up.” NASA Earth Observatory images by Jesse Allen using VIIRS day-night band data from the Suomi National Polar-orbiting Partnership. Suomi NPP is the result of a partnership between NASA, the National Oceanic and Atmospheric Administration, and the Department of Defense. Caption by Adam Voiland. Instrument: Suomi NPP - VIIRS For more info go to: <a href="http://earthobservatory.nasa.gov/IOTD/view.php?id=80752" rel="nofollow">earthobservatory.nasa.gov/IOTD/view.php?id=80752</a> Credit: <b><a href="http://www.earthobservatory.nasa.gov/" rel="nofollow"> NASA Earth Observatory</a></b> <b><a href="http://www.nasa.gov/audience/formedia/features/MP_Photo_Guidelines.html" rel="nofollow">NASA image use policy.</a></b> <b><a href="http://www.nasa.gov/centers/goddard/home/index.html" rel="nofollow">NASA Goddard Space Flight Center</a></b> enables NASA’s mission through four scientific endeavors: Earth Science, Heliophysics, Solar System Exploration, and Astrophysics. Goddard plays a leading role in NASA’s accomplishments by contributing compelling scientific knowledge to advance the Agency’s mission. <b>Follow us on <a href="http://twitter.com/NASA_GoddardPix" rel="nofollow">Twitter</a></b> <b>Like us on <a href="http://www.facebook.com/pages/Greenbelt-MD/NASA-Goddard/395013845897?ref=tsd" rel="nofollow">Facebook</a></b> <b>Find us on <a href="http://instagram.com/nasagoddard?vm=grid" rel="nofollow">Instagram</a></b>

The Visible Infrared Imaging Radiometer Suite (VIIRS) on the Suomi NPP satellite captured this view of extensive sea-ice fracturing off the northern coast of Alaska. The event began in late-January and spread west toward Banks Island throughout February and March 2013. Visualizations of the Arctic often give the impression that the ice cap is a continuous sheet of stationary, floating ice. In fact, it is a collection of smaller pieces that constantly shift, crack, and grind against one another as they are jostled by winds and ocean currents. Especially during the summer—but even during the height of winter—cracks—or leads—open up between pieces of ice. That was what was happening on the left side of the animation (seen here: <a href="http://bit.ly/10kE7sh" rel="nofollow">bit.ly/10kE7sh</a>) in late January. A high-pressure weather system was parked over the region, producing warmer temperatures and winds that flowed in a southwesterly direction. That fueled the Beaufort Gyre, a wind-driven ocean current that flows clockwise. The gyre was the key force pulling pieces of ice west past Point Barrow, the northern nub of Alaska that protrudes into the Beaufort Sea. “A fracturing event in this area is not unusual because the Beaufort Gyre tends to push ice away from Banks Island and the Canadian Archipelago,” explained Walt Meier of the National Snow & Ice Data Center (NSIDC). “Point Barrow can act like a ‘pin point’ where the ice catches and fractures to the north and east.” In February, however, a series of storms passing over central Alaska exacerbated the fracturing. Strong westerly winds prompted several large pieces of ice to break away in an arc-shaped wave that moved progressively east. By the end of February, large pieces of ice had fractured all the way to the western coast of Banks Island, a distance of about 1,000 kilometers (600 miles). The data used to create the animation came from the longwave infrared (thermal) portion of the electromagnetic spectrum, so the animation illustrates how much heat the surface was emitting as VIIRS surveyed the area. Cooler areas (sea ice) appear white, while warmer areas (open water) are dark. The light gray plume near the cracks is warmer, moister air escaping from the ocean and blowing downwind. Clouds do not show up well in the VIIRS thermal band, so the storms that fueled the fracturing are not readily visible. While fracturing events are common, few events sprawl across such a large area or produce cracks as long and wide as those seen here. The age of the sea ice in this area was one of the key reasons this event became so widespread. “The region is covered almost completely by seasonal or first-year ice—ice that has formed since last September,” said Meier. “This ice is thinner and weaker than the older, multi-year ice, so it responds more readily to winds and is more easily broken up.” NASA Earth Observatory images by Jesse Allen using VIIRS day-night band data from the Suomi National Polar-orbiting Partnership. Suomi NPP is the result of a partnership between NASA, the National Oceanic and Atmospheric Administration, and the Department of Defense. Caption by Adam Voiland. Instrument: Suomi NPP - VIIRS For more info go to: <a href="http://earthobservatory.nasa.gov/IOTD/view.php?id=80752" rel="nofollow">earthobservatory.nasa.gov/IOTD/view.php?id=80752</a> Credit: <b><a href="http://www.earthobservatory.nasa.gov/" rel="nofollow"> NASA Earth Observatory</a></b> <b><a href="http://www.nasa.gov/audience/formedia/features/MP_Photo_Guidelines.html" rel="nofollow">NASA image use policy.</a></b> <b><a href="http://www.nasa.gov/centers/goddard/home/index.html" rel="nofollow">NASA Goddard Space Flight Center</a></b> enables NASA’s mission through four scientific endeavors: Earth Science, Heliophysics, Solar System Exploration, and Astrophysics. Goddard plays a leading role in NASA’s accomplishments by contributing compelling scientific knowledge to advance the Agency’s mission. <b>Follow us on <a href="http://twitter.com/NASA_GoddardPix" rel="nofollow">Twitter</a></b> <b>Like us on <a href="http://www.facebook.com/pages/Greenbelt-MD/NASA-Goddard/395013845897?ref=tsd" rel="nofollow">Facebook</a></b> <b>Find us on <a href="http://instagram.com/nasagoddard?vm=grid" rel="nofollow">Instagram</a></b>

The Visible Infrared Imaging Radiometer Suite (VIIRS) on the Suomi NPP satellite captured this view of extensive sea-ice fracturing off the northern coast of Alaska. The event began in late-January and spread west toward Banks Island throughout February and March 2013. Visualizations of the Arctic often give the impression that the ice cap is a continuous sheet of stationary, floating ice. In fact, it is a collection of smaller pieces that constantly shift, crack, and grind against one another as they are jostled by winds and ocean currents. Especially during the summer—but even during the height of winter—cracks—or leads—open up between pieces of ice. That was what was happening on the left side of the animation (seen here: <a href="http://bit.ly/10kE7sh" rel="nofollow">bit.ly/10kE7sh</a>) in late January. A high-pressure weather system was parked over the region, producing warmer temperatures and winds that flowed in a southwesterly direction. That fueled the Beaufort Gyre, a wind-driven ocean current that flows clockwise. The gyre was the key force pulling pieces of ice west past Point Barrow, the northern nub of Alaska that protrudes into the Beaufort Sea. “A fracturing event in this area is not unusual because the Beaufort Gyre tends to push ice away from Banks Island and the Canadian Archipelago,” explained Walt Meier of the National Snow & Ice Data Center (NSIDC). “Point Barrow can act like a ‘pin point’ where the ice catches and fractures to the north and east.” In February, however, a series of storms passing over central Alaska exacerbated the fracturing. Strong westerly winds prompted several large pieces of ice to break away in an arc-shaped wave that moved progressively east. By the end of February, large pieces of ice had fractured all the way to the western coast of Banks Island, a distance of about 1,000 kilometers (600 miles). The data used to create the animation came from the longwave infrared (thermal) portion of the electromagnetic spectrum, so the animation illustrates how much heat the surface was emitting as VIIRS surveyed the area. Cooler areas (sea ice) appear white, while warmer areas (open water) are dark. The light gray plume near the cracks is warmer, moister air escaping from the ocean and blowing downwind. Clouds do not show up well in the VIIRS thermal band, so the storms that fueled the fracturing are not readily visible. While fracturing events are common, few events sprawl across such a large area or produce cracks as long and wide as those seen here. The age of the sea ice in this area was one of the key reasons this event became so widespread. “The region is covered almost completely by seasonal or first-year ice—ice that has formed since last September,” said Meier. “This ice is thinner and weaker than the older, multi-year ice, so it responds more readily to winds and is more easily broken up.” NASA Earth Observatory images by Jesse Allen using VIIRS day-night band data from the Suomi National Polar-orbiting Partnership. Suomi NPP is the result of a partnership between NASA, the National Oceanic and Atmospheric Administration, and the Department of Defense. Caption by Adam Voiland. Instrument: Suomi NPP - VIIRS For more info go to: <a href="http://earthobservatory.nasa.gov/IOTD/view.php?id=80752" rel="nofollow">earthobservatory.nasa.gov/IOTD/view.php?id=80752</a> Credit: <b><a href="http://www.earthobservatory.nasa.gov/" rel="nofollow"> NASA Earth Observatory</a></b> <b><a href="http://www.nasa.gov/audience/formedia/features/MP_Photo_Guidelines.html" rel="nofollow">NASA image use policy.</a></b> <b><a href="http://www.nasa.gov/centers/goddard/home/index.html" rel="nofollow">NASA Goddard Space Flight Center</a></b> enables NASA’s mission through four scientific endeavors: Earth Science, Heliophysics, Solar System Exploration, and Astrophysics. Goddard plays a leading role in NASA’s accomplishments by contributing compelling scientific knowledge to advance the Agency’s mission. <b>Follow us on <a href="http://twitter.com/NASA_GoddardPix" rel="nofollow">Twitter</a></b> <b>Like us on <a href="http://www.facebook.com/pages/Greenbelt-MD/NASA-Goddard/395013845897?ref=tsd" rel="nofollow">Facebook</a></b> <b>Find us on <a href="http://instagram.com/nasagoddard?vm=grid" rel="nofollow">Instagram</a></b>

All was well at the North Pole this summer, when Santa and his elves were busily making toys and taking orders for this Christmas. NASA's Terra satellite was able to piece together a number of images it took to give us a complete look at the North Pole, which is usually very difficult to see by satellites, so Santa can keep his exact location secret. On June 30, 2011 the Moderate Resolution Imaging Spectroradiometer (MODIS) aboard NASA’s Terra satellite made multiple passes over the Arctic from its orbit in space, capturing a true-color image of the summer lands and sea-ice near the North Pole on each pass. Individual images were then pieced together to create a large mosaic of the area, which gives a broader view that would not be possible with individual images. In this mosaic of the Arctic, the polar ice cap appears blue-white, while the ice covering land appears bright white. The ice of Greenland, in the lower left (southwest), is especially bright. Clouds also appear bright white, and can be difficult to separate from ice in true-color images. Most of the clouds in this image appear in billowing swirls, while ice tends to be smoother. This can only be confirmed in the false-color images that were also generated by MODIS that same day. The North Pole is found northeast off the coast of Greenland, in the middle of the ice-covered Arctic Ocean and roughly near the center of this image. This is the northernmost point on Earth. From the North Pole, all directions are south. Santa will be leaving from here on the night of the 24th and circling the globe. Credit: NASA/GSFC/Jeff Schmaltz/MODIS Land Rapid Response Team <b><a href="http://www.nasa.gov/centers/goddard/home/index.html" rel="nofollow">NASA Goddard Space Flight Center</a></b> enables NASA’s mission through four scientific endeavors: Earth Science, Heliophysics, Solar System Exploration, and Astrophysics. Goddard plays a leading role in NASA’s accomplishments by contributing compelling scientific knowledge to advance the Agency’s mission. <b>Follow us on <a href="http://twitter.com/NASA_GoddardPix" rel="nofollow">Twitter</a></b> <b>Like us on <a href="http://www.facebook.com/pages/Greenbelt-MD/NASA-Goddard/395013845897?ref=tsd" rel="nofollow">Facebook</a></b> <b>Find us on <a href="http://web.stagram.com/n/nasagoddard/?vm=grid" rel="nofollow">Instagram</a></b>
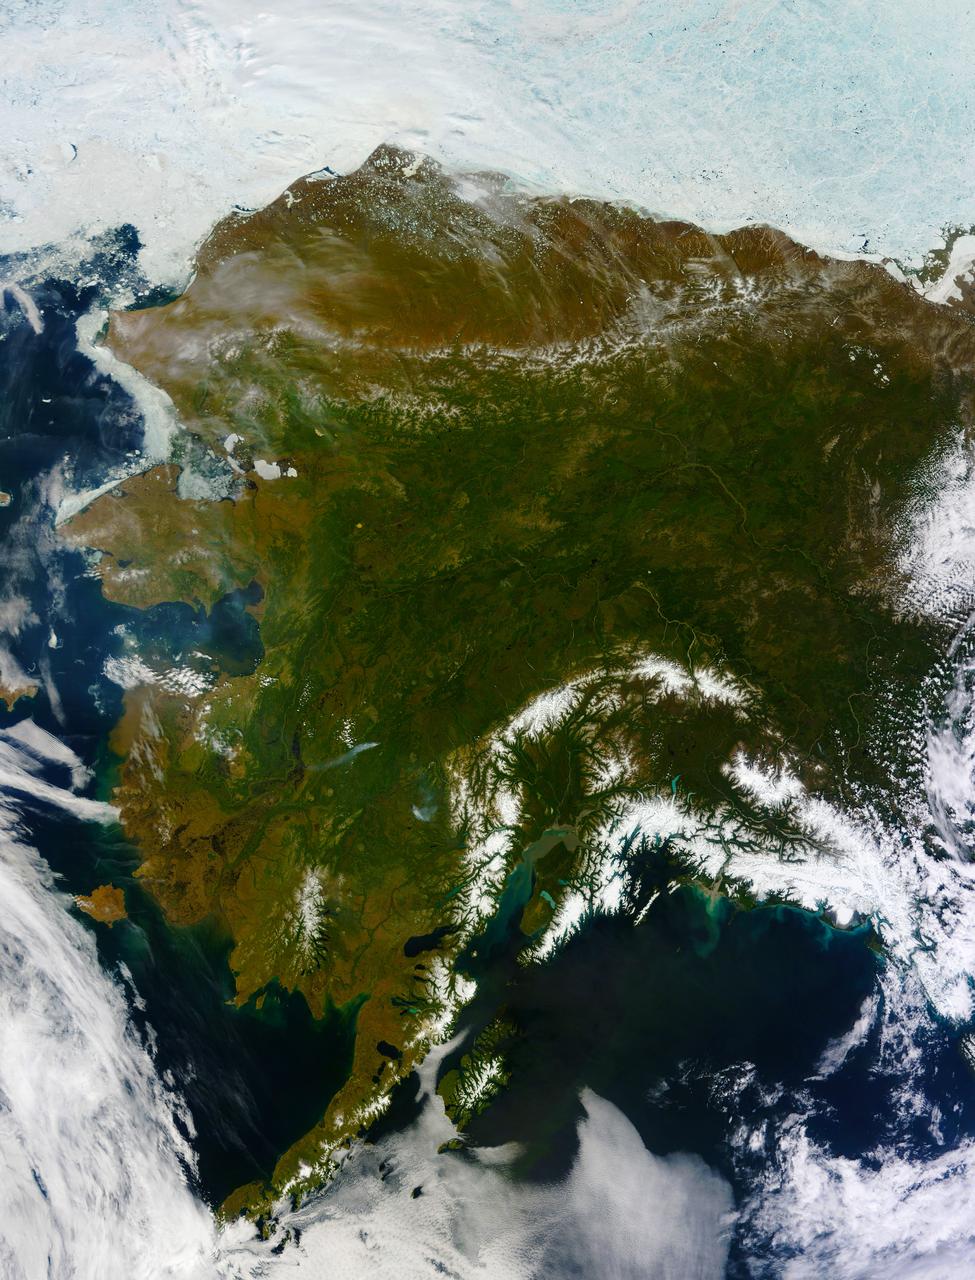
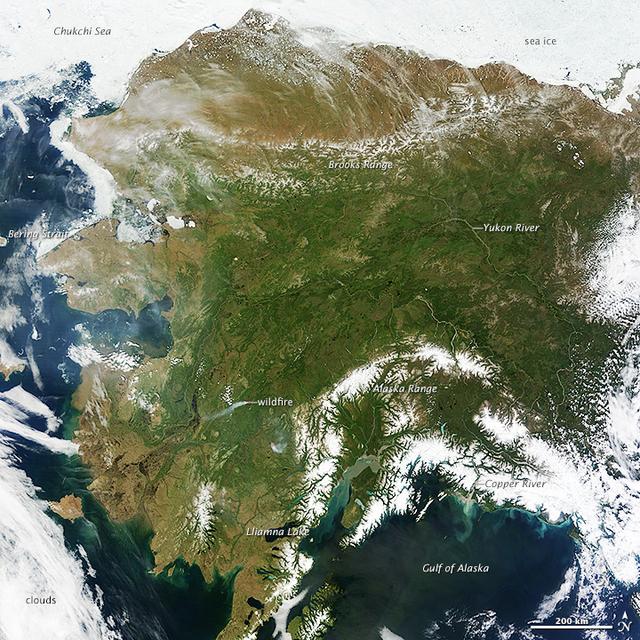
On most days, relentless rivers of clouds wash over Alaska, obscuring most of the state’s 6,640 miles (10,690 kilometers) of coastline and 586,000 square miles (1,518,000 square kilometers) of land. The south coast of Alaska even has the dubious distinction of being the cloudiest region of the United States, with some locations averaging more than 340 cloudy days per year. That was certainly not the case on June 17, 2013, the date that the Moderate Resolution Imaging Spectroradiometer (MODIS) on NASA’s Terra satellite acquired this rare, nearly cloud-free view of the state. The absence of clouds exposed a striking tapestry of water, ice, land, forests, and even wildfires. Snow-covered mountains such as the Alaska Range and Chugach Mountains were visible in southern Alaska, while the arc of mountains that make up the Brooks Range dominated the northern part of the state. The Yukon River—the longest in Alaska and the third longest in the United States—wound its way through the green boreal forests that inhabit the interior of the state. Plumes of sediment and glacial dust poured into the Gulf of Alaska from the Copper River. And Iliamna Lake, the largest in Alaska, was ice free. The same ridge of high pressure that cleared Alaska’s skies also brought stifling temperatures to many areas accustomed to chilly June days. Talkeetna, a town about 100 miles north of Anchorage, saw temperatures reach 96°F (36°C) on June 17. Other towns in southern Alaska set all-time record highs, including Cordova, Valez, and Seward. The high temperatures also helped fuel wildfires and hastened the breakup of sea ice in the Chukchi Sea. NASA image courtesy Jeff Schmaltz, LANCE MODIS Rapid Response Team at NASA GSFC. Caption by Adam Voiland. Instrument: Terra - MODIS More info: <a href="http://1.usa.gov/102MAEj" rel="nofollow">1.usa.gov/102MAEj</a> Credit: <b><a href="http://www.earthobservatory.nasa.gov/" rel="nofollow"> NASA Earth Observatory</a></b> <b><a href="http://www.nasa.gov/audience/formedia/features/MP_Photo_Guidelines.html" rel="nofollow">NASA image use policy.</a></b> <b><a href="http://www.nasa.gov/centers/goddard/home/index.html" rel="nofollow">NASA Goddard Space Flight Center</a></b> enables NASA’s mission through four scientific endeavors: Earth Science, Heliophysics, Solar System Exploration, and Astrophysics. Goddard plays a leading role in NASA’s accomplishments by contributing compelling scientific knowledge to advance the Agency’s mission. <b>Follow us on <a href="http://twitter.com/NASA_GoddardPix" rel="nofollow">Twitter</a></b> <b>Like us on <a href="http://www.facebook.com/pages/Greenbelt-MD/NASA-Goddard/395013845897?ref=tsd" rel="nofollow">Facebook</a></b> <b>Find us on <a href="http://instagram.com/nasagoddard?vm=grid" rel="nofollow">Instagram</a></b>
On most days, relentless rivers of clouds wash over Alaska, obscuring most of the state’s 6,640 miles (10,690 kilometers) of coastline and 586,000 square miles (1,518,000 square kilometers) of land. The south coast of Alaska even has the dubious distinction of being the cloudiest region of the United States, with some locations averaging more than 340 cloudy days per year. That was certainly not the case on June 17, 2013, the date that the Moderate Resolution Imaging Spectroradiometer (MODIS) on NASA’s Terra satellite acquired this rare, nearly cloud-free view of the state. The absence of clouds exposed a striking tapestry of water, ice, land, forests, and even wildfires. Snow-covered mountains such as the Alaska Range and Chugach Mountains were visible in southern Alaska, while the arc of mountains that make up the Brooks Range dominated the northern part of the state. The Yukon River—the longest in Alaska and the third longest in the United States—wound its way through the green boreal forests that inhabit the interior of the state. Plumes of sediment and glacial dust poured into the Gulf of Alaska from the Copper River. And Iliamna Lake, the largest in Alaska, was ice free. The same ridge of high pressure that cleared Alaska’s skies also brought stifling temperatures to many areas accustomed to chilly June days. Talkeetna, a town about 100 miles north of Anchorage, saw temperatures reach 96°F (36°C) on June 17. Other towns in southern Alaska set all-time record highs, including Cordova, Valez, and Seward. The high temperatures also helped fuel wildfires and hastened the breakup of sea ice in the Chukchi Sea. NASA image courtesy Jeff Schmaltz, LANCE MODIS Rapid Response Team at NASA GSFC. Caption by Adam Voiland. Instrument: Terra - MODIS More info: <a href="http://1.usa.gov/102MAEj" rel="nofollow">1.usa.gov/102MAEj</a> Credit: <b><a href="http://www.earthobservatory.nasa.gov/" rel="nofollow"> NASA Earth Observatory</a></b> <b><a href="http://www.nasa.gov/audience/formedia/features/MP_Photo_Guidelines.html" rel="nofollow">NASA image use policy.</a></b> <b><a href="http://www.nasa.gov/centers/goddard/home/index.html" rel="nofollow">NASA Goddard Space Flight Center</a></b> enables NASA’s mission through four scientific endeavors: Earth Science, Heliophysics, Solar System Exploration, and Astrophysics. Goddard plays a leading role in NASA’s accomplishments by contributing compelling scientific knowledge to advance the Agency’s mission. <b>Follow us on <a href="http://twitter.com/NASA_GoddardPix" rel="nofollow">Twitter</a></b> <b>Like us on <a href="http://www.facebook.com/pages/Greenbelt-MD/NASA-Goddard/395013845897?ref=tsd" rel="nofollow">Facebook</a></b> <b>Find us on <a href="http://instagram.com/nasagoddard?vm=grid" rel="nofollow">Instagram</a></b>
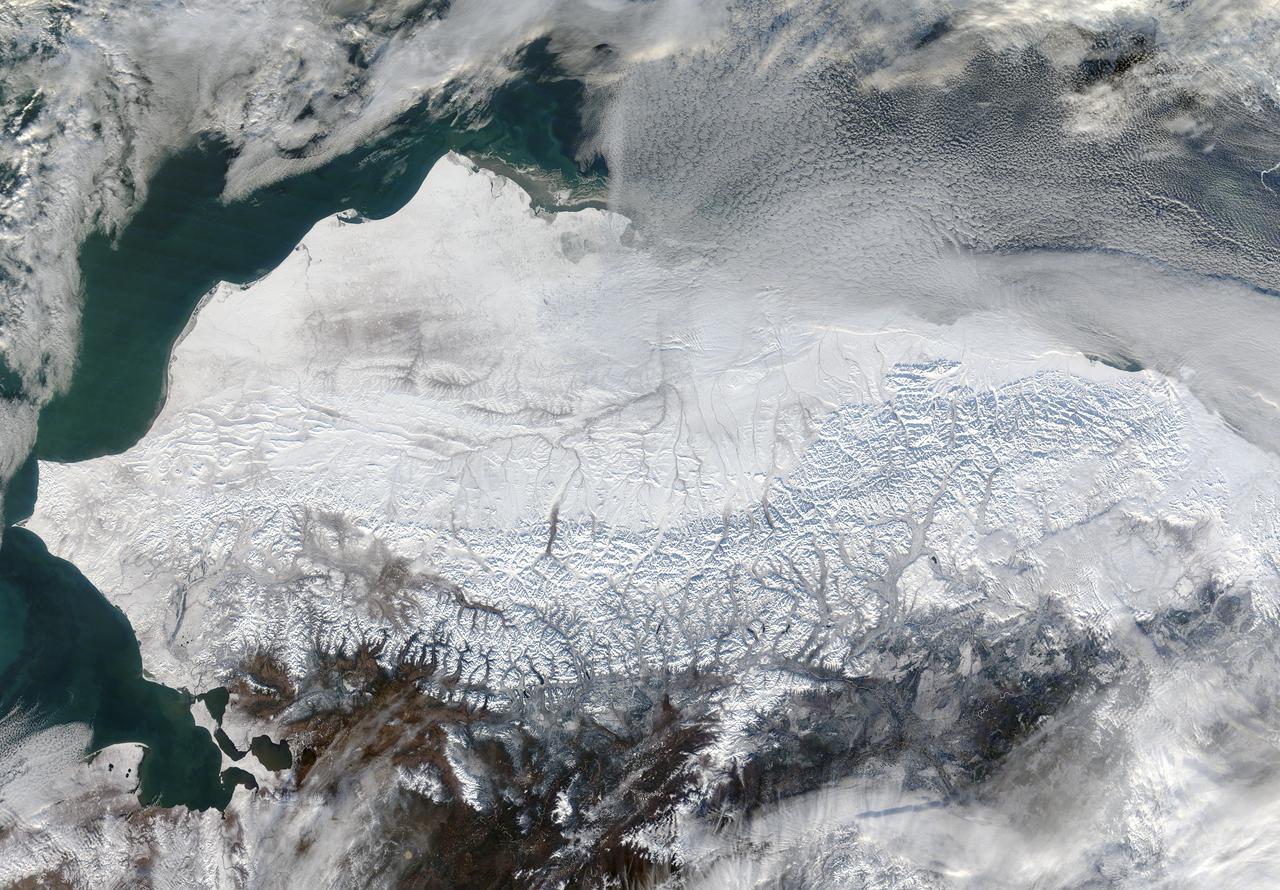
As autumn colors moved across much of the lower forty-eight states in mid-October 2015, winter weather had already arrived in Alaska. The Moderate Resolution Imaging Spectroradiometer (MODIS) aboard NASA’s Terra satellite captured this true-color image of the icy scene on October 16 as it passed over the region. Point Barrow, the northern-most location in the United States sits between the Chukchi Sea (west) and the Beaufort Sea on the east. The rugged peaks of the Brooks Range can be seen along the southern section of the image. North of the Brooks Range the land is almost entirely covered with snow; to the south the tan and browns visible between snow marks uncovered land. Sea ice lies over the waters near the coasts of much of Alaska’s North Slope, especially east of Point Barrow. White cloud banks are notable in the northeast and southeast sections of the image. Credit: NASA/GSFC/Jeff Schmaltz/MODIS Land Rapid Response Team <b><a href="http://www.nasa.gov/audience/formedia/features/MP_Photo_Guidelines.html" rel="nofollow">NASA image use policy.</a></b> <b><a href="http://www.nasa.gov/centers/goddard/home/index.html" rel="nofollow">NASA Goddard Space Flight Center</a></b> enables NASA’s mission through four scientific endeavors: Earth Science, Heliophysics, Solar System Exploration, and Astrophysics. Goddard plays a leading role in NASA’s accomplishments by contributing compelling scientific knowledge to advance the Agency’s mission. <b>Follow us on <a href="http://twitter.com/NASAGoddardPix" rel="nofollow">Twitter</a></b> <b>Like us on <a href="http://www.facebook.com/pages/Greenbelt-MD/NASA-Goddard/395013845897?ref=tsd" rel="nofollow">Facebook</a></b> <b>Find us on <a href="http://instagrid.me/nasagoddard/?vm=grid" rel="nofollow">Instagram</a></b>
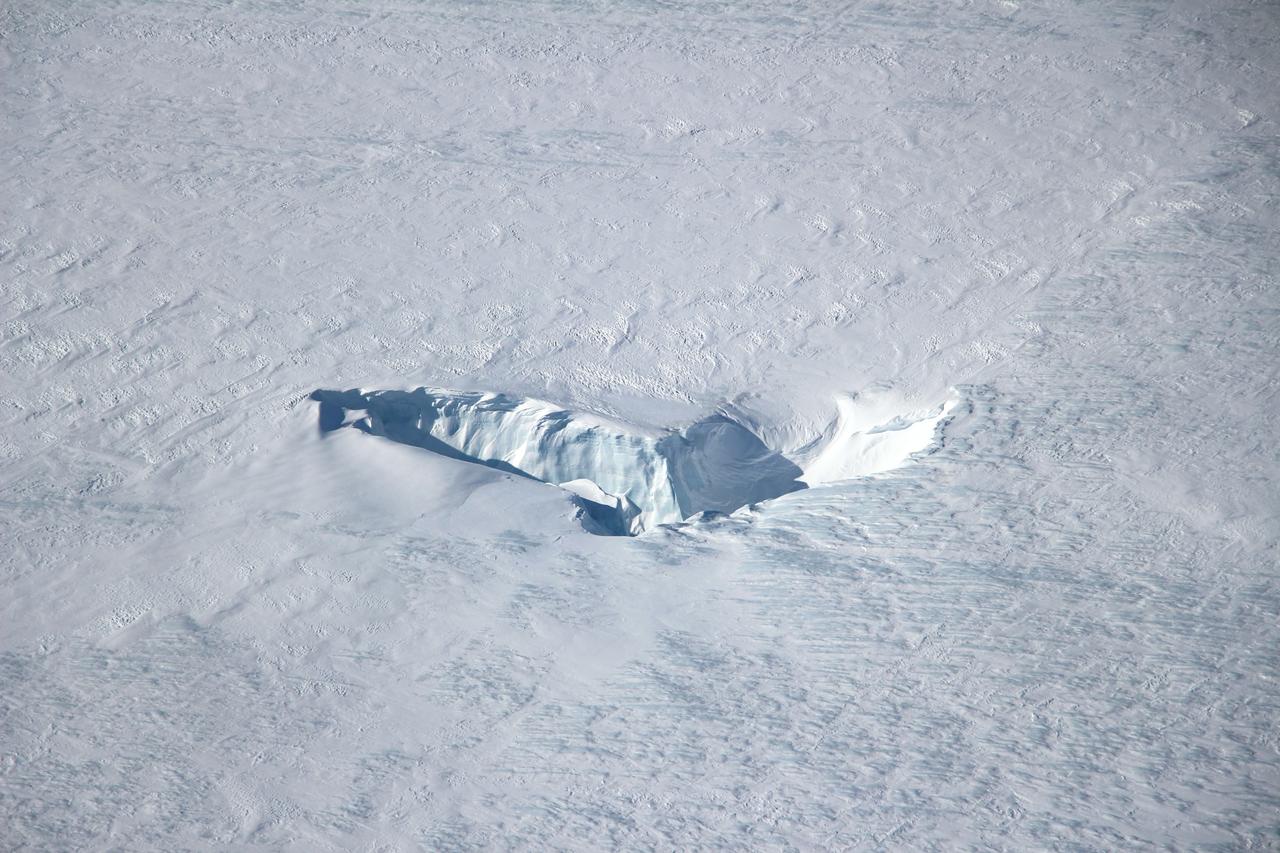
Scientists and crew with NASA’s Operation IceBridge, which makes annual aerial surveys of polar ice, are wrapping up their seventh campaign over the Arctic. In spring 2015, the team began using a different research aircraft—an adapted C-130 Hercules. They also added four new high-priority targets in the rapidly changing region of northeast Greenland. Many of the flights, however, were routine. And that’s exactly the point; making measurements over the same path each year provides continuity between NASA’s Ice, Cloud, and Land Elevation Satellite (ICESat) missions—the first of which ended in 2009 and the second of which is scheduled for launch in 2017. Repeat measurements show how a landscape changes over time. One area that has been surveyed repeatedly is northern Greenland’s Ryder Glacier. This photograph, taken during the IceBridge flight on May 6, 2015, shows a large moulin—dozens of meters across—atop this glacier. Moulins are holes in the ice sheet that drain melt water from the ice sheet’s surface to the bottom or out to the sea. Scientists are working to figure out what happens to melt water once it enters a moulin. Read more: <a href="http://earthobservatory.nasa.gov/IOTD/view.php?id=85858&eocn=home&eoci=iotd_title" rel="nofollow">earthobservatory.nasa.gov/IOTD/view.php?id=85858&eocn...</a> Credit: <b><a href="http://www.earthobservatory.nasa.gov/" rel="nofollow"> NASA Earth Observatory</a></b> <b><a href="http://www.nasa.gov/audience/formedia/features/MP_Photo_Guidelines.html" rel="nofollow">NASA image use policy.</a></b> <b><a href="http://www.nasa.gov/centers/goddard/home/index.html" rel="nofollow">NASA Goddard Space Flight Center</a></b> enables NASA’s mission through four scientific endeavors: Earth Science, Heliophysics, Solar System Exploration, and Astrophysics. Goddard plays a leading role in NASA’s accomplishments by contributing compelling scientific knowledge to advance the Agency’s mission. <b>Follow us on <a href="http://twitter.com/NASAGoddardPix" rel="nofollow">Twitter</a></b> <b>Like us on <a href="http://www.facebook.com/pages/Greenbelt-MD/NASA-Goddard/395013845897?ref=tsd" rel="nofollow">Facebook</a></b> <b>Find us on <a href="http://instagrid.me/nasagoddard/?vm=grid" rel="nofollow">Instagram</a></b>
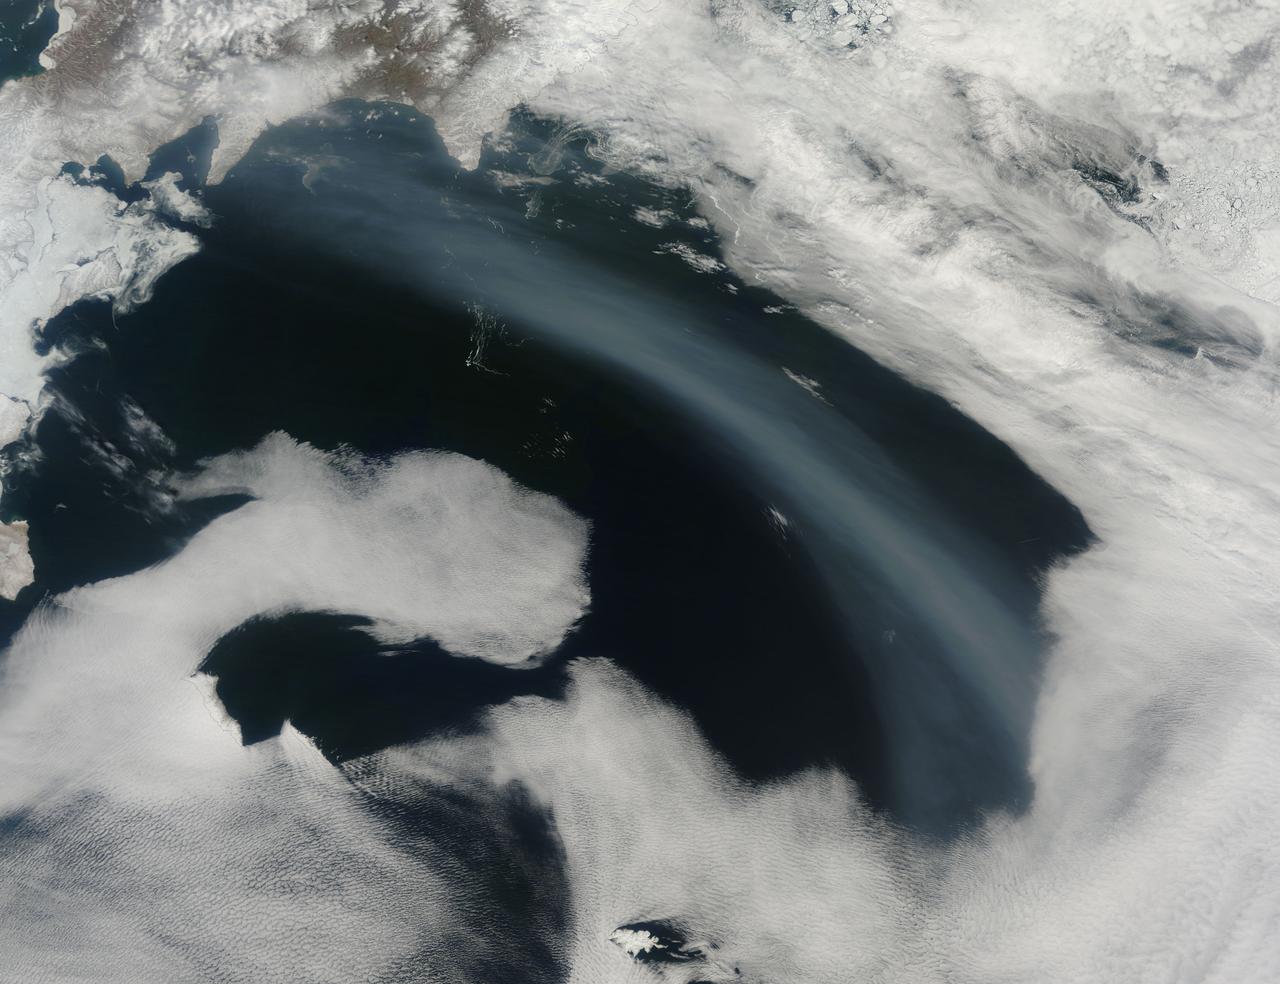
Smoke from Far Eastern Russia’s spring wildfires reached the Bering Sea by May 11, 2012. The Moderate Resolution Imaging Spectroradiometer aboard NASA’s Terra satellite passed over the region at 23:30 UTC on that same day and acquired this true-color image of a broad band of smoke stretching across the blue waters. In this image, the plume of smoke appears light gray while banks of cloud are bright white. Snow covers much of Kamchatka the land mass in the west. Karaginsky Island, just off Kamchatka’s eastern shore, is surrounded by sea ice. Clouds stream off the southwest shores of Beringa and Medny Islands. To the east, Attu Station, Alaska, is surrounded by cloud. In early May, numerous wildfires burned near Lake Baikal, in Siberia. These fires billowed heavy smoke across eastern Mongolia, China and Russia’s Far East. An image of the smoke and fires was captured on May 8 and appeared as the MODIS image of the day on May 11. That image can be viewed here: <a href="http://modis.gsfc.nasa.gov/gallery/individual.php?db_date=2012-05-11" rel="nofollow">modis.gsfc.nasa.gov/gallery/individual.php?db_date=2012-0...</a>. According to a model by the National Oceanic and Atmospheric Administration (NOAA), it is possible that smoke from the Lake Baikal region could take just a few days to reach the Bering Sea. Credit: NASA/GSFC/Jeff Schmaltz/MODIS Land Rapid Response Team <b><a href="http://www.nasa.gov/audience/formedia/features/MP_Photo_Guidelines.html" rel="nofollow">NASA image use policy.</a></b> <b><a href="http://www.nasa.gov/centers/goddard/home/index.html" rel="nofollow">NASA Goddard Space Flight Center</a></b> enables NASA’s mission through four scientific endeavors: Earth Science, Heliophysics, Solar System Exploration, and Astrophysics. Goddard plays a leading role in NASA’s accomplishments by contributing compelling scientific knowledge to advance the Agency’s mission. <b>Follow us on <a href="http://twitter.com/NASA_GoddardPix" rel="nofollow">Twitter</a></b> <b>Like us on <a href="http://www.facebook.com/pages/Greenbelt-MD/NASA-Goddard/395013845897?ref=tsd" rel="nofollow">Facebook</a></b> <b>Find us on <a href="http://instagrid.me/nasagoddard/?vm=grid" rel="nofollow">Instagram</a></b>
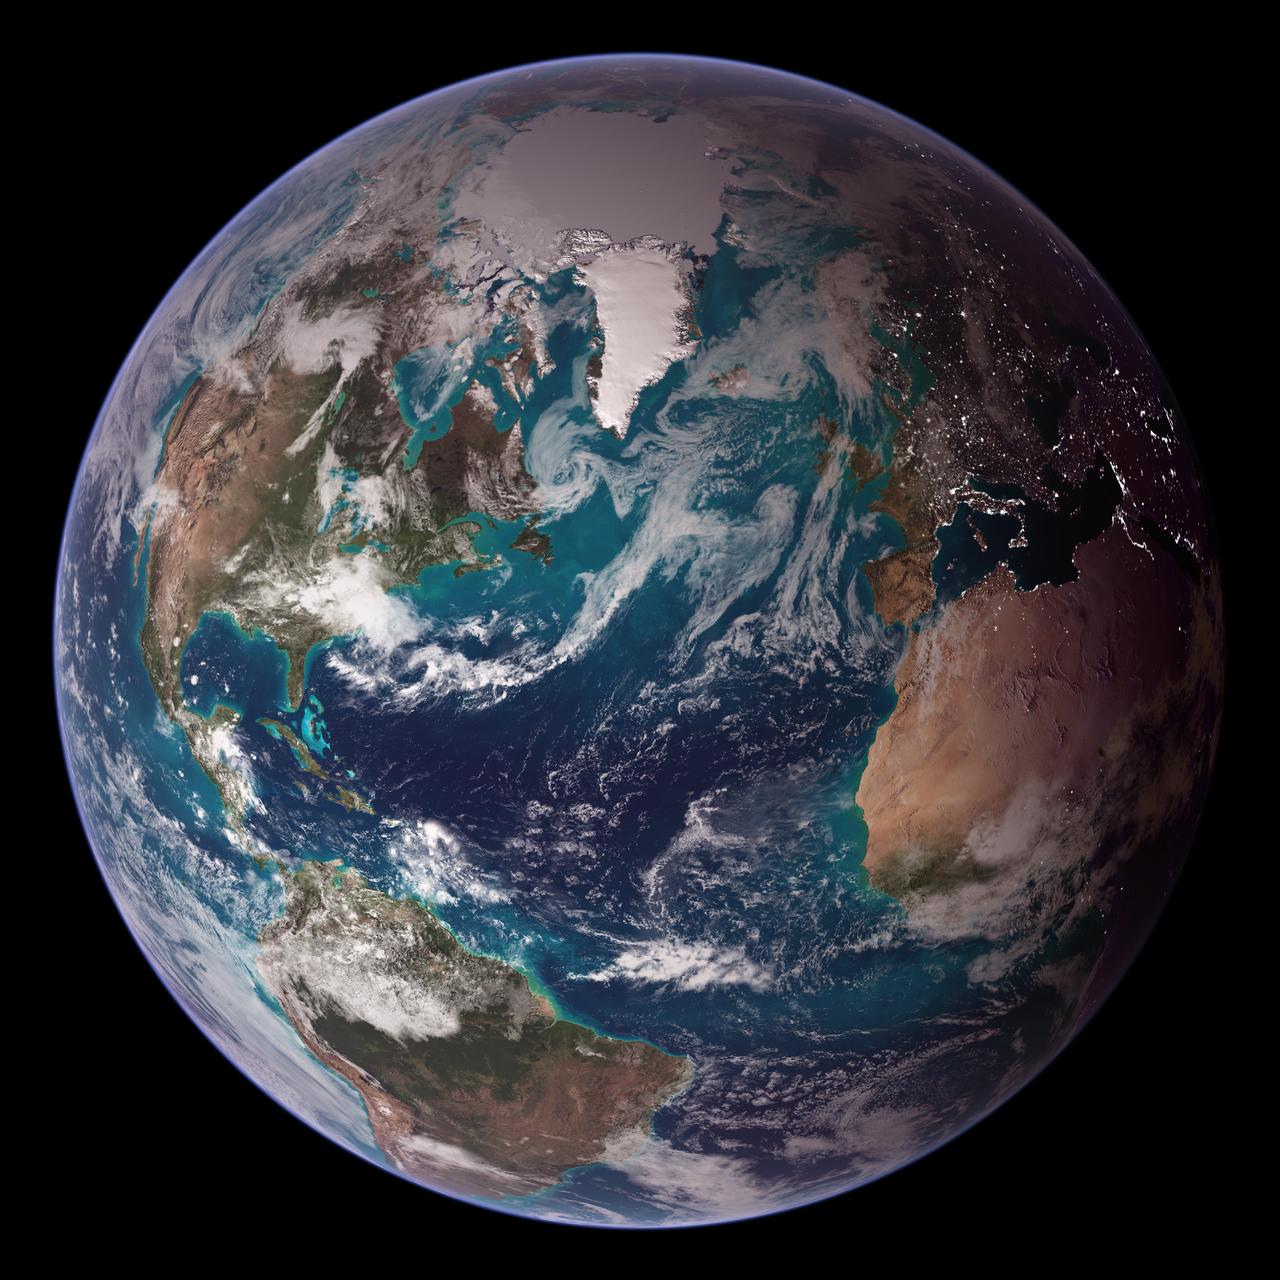
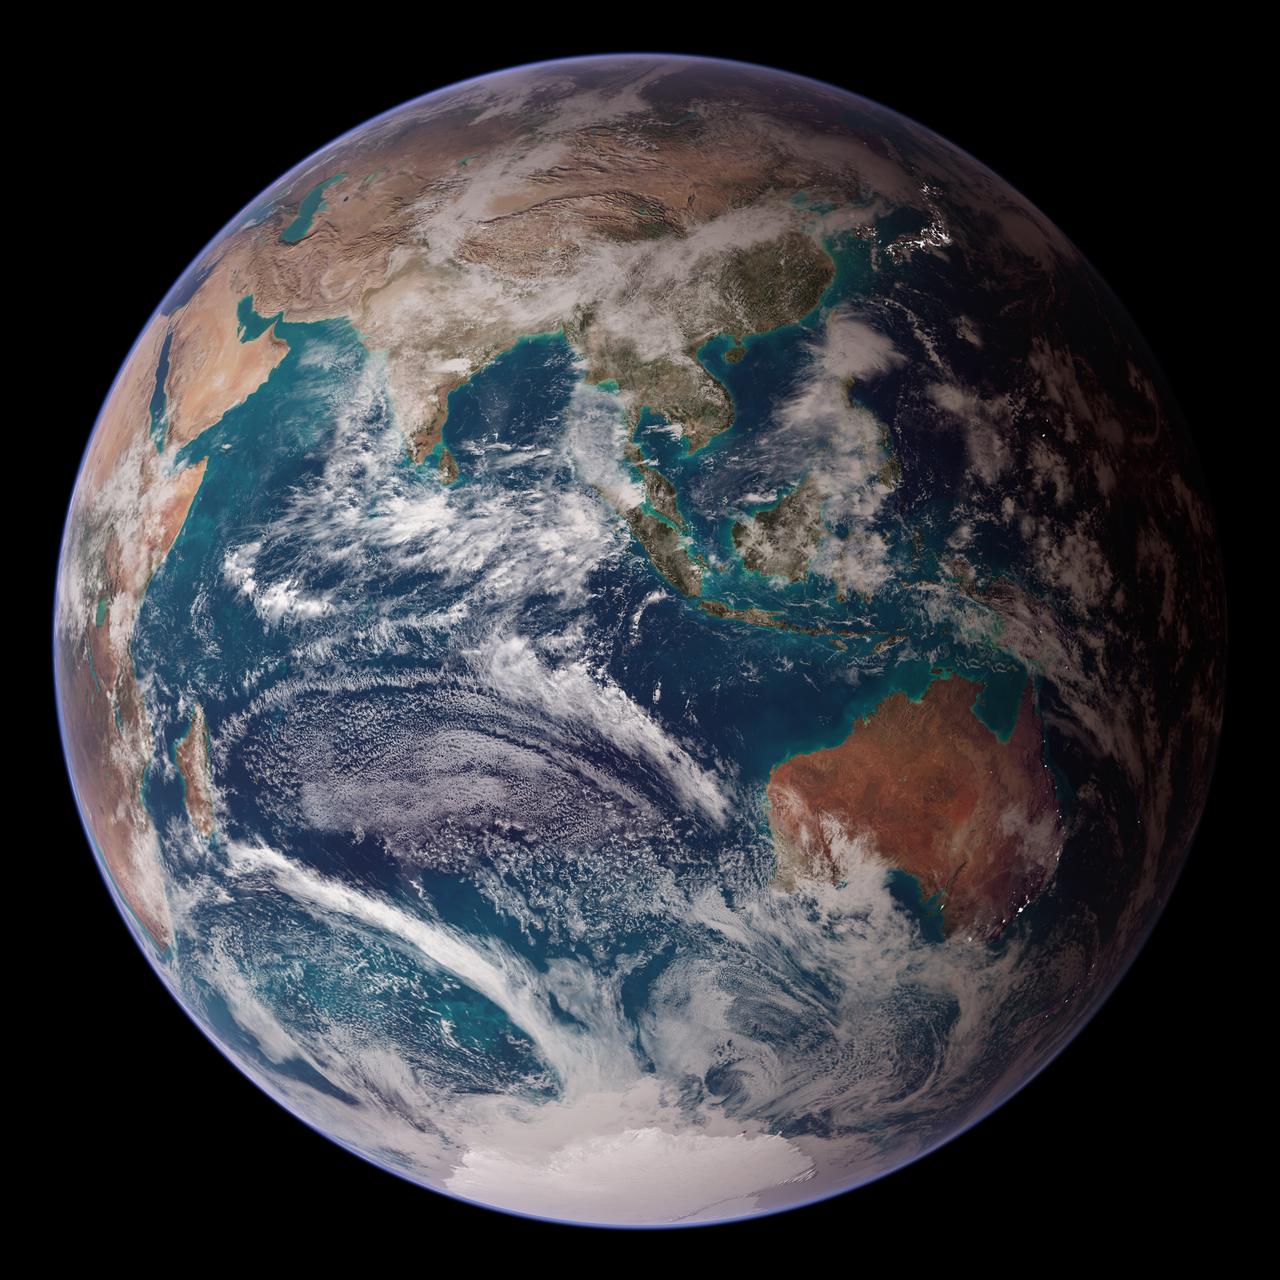
<b>RELEASE DATE: OCTOBER 9, 2007</b> <b>Credit: NASA/Goddard Space Flight Center/Reto Stöckli</b> A day’s clouds. The shape and texture of the land. The living ocean. City lights as a beacon of human presence across the globe. This amazingly beautiful view of Earth from space is a fusion of science and art, a showcase for the remote-sensing technology that makes such views possible, and a testament to the passion and creativity of the scientists who devote their careers to understanding how land, ocean, and atmosphere—even life itself—interact to generate Earth’s unique (as far as we know!) life-sustaining environment. Drawing on data from multiple satellite missions (not all collected at the same time), a team of NASA scientists and graphic artists created layers of global data for everything from the land surface, to polar sea ice, to the light reflected by the chlorophyll in the billions of microscopic plants that grow in the ocean. They wrapped these layers around a globe, set it against a black background, and simulated the hazy edge of the Earth’s atmosphere (the limb) that appears in astronaut photography of the Earth. The land surface layer is based on photo-like surface reflectance observations (reflected sunlight) measured by the Moderate Resolution Imaging Spectroradiometer (MODIS) on NASA’s Terra satellite in July 2004. The sea ice layer near the poles comes from Terra MODIS observations of daytime sea ice observed between August 28 and September 6, 2001. The ocean layer is a composite. In shallow water areas, the layer shows surface reflectances observed by Terra MODIS in July 2004. In the open ocean, the photo-like layer is overlaid with observations of the average ocean chlorophyll content for 2004. NASA’s Aqua MODIS collected the chlorophyll data. The cloud layer shows a single-day snapshot of clouds observed by Terra MODIS across the planet on July 29, 2001. City lights on Earth’s night side are visualized from data collected by the Defense Meteorological Satellite Program mission between 1994–1995. The topography layer is based on radar data collected by the Space Shuttle Endeavour during an 11-day mission in February of 2000. Topography over Antarctica comes from the Radarsat Antarctic Mapping Project, version 2. Most of the data layers in this visualization are available as monthly composites as part of NASA’s Blue Marble Next Generation image collection. The images in the collection appear in cylindrical projection (rectangular maps), and they are available at 500-meter resolution. The large images provided above are the full-size versions of these globes. In their hope that these images will inspire people to appreciate the beauty of our home planet and to learn about the Earth system, the developers of these images encourage readers to re-use and re-publish the images freely. NASA images by Reto Stöckli, based on data from NASA and NOAA. To learn the history of the Blue Marble go here: <a href="http://earthobservatory.nasa.gov/Features/BlueMarble/BlueMarble_history.php" rel="nofollow">earthobservatory.nasa.gov/Features/BlueMarble/BlueMarble_...</a> To learn more about the Blue Marble go here: <a href="http://earthobservatory.nasa.gov/IOTD/view.php?id=8108" rel="nofollow">earthobservatory.nasa.gov/IOTD/view.php?id=8108</a> <b><a href="http://www.nasa.gov/centers/goddard/home/index.html" rel="nofollow">NASA Goddard Space Flight Center</a></b> is home to the nation's largest organization of combined scientists, engineers and technologists that build spacecraft, instruments and new technology to study the Earth, the sun, our solar system, and the universe. <b>Follow us on <a href="http://twitter.com/NASA_GoddardPix" rel="nofollow">Twitter</a></b> <b>Join us on <a href="http://www.facebook.com/pages/Greenbelt-MD/NASA-Goddard/395013845897?ref=tsd" rel="nofollow">Facebook</a><b> </b></b>
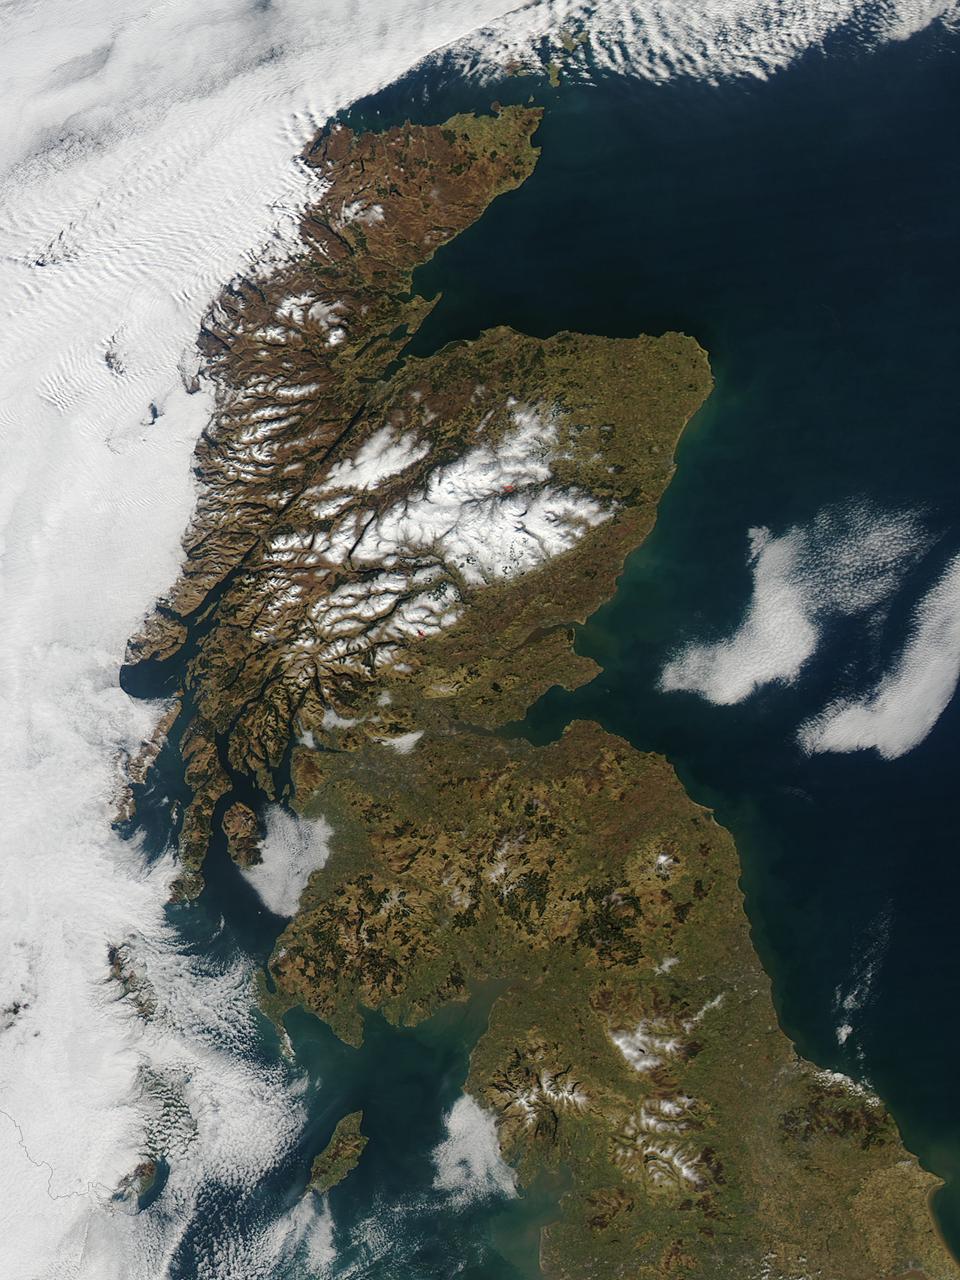
In late February, 2013 the Aqua satellite passed over Scotland as the clouds parted, allowing the Moderate Resolution Imaging Spectroradiometer (MODIS) flying aboard to capture a clear image of the late winter landscape. This image was captured at 1320 UTC (1:20 in the afternoon local time) on February 27. England makes up about the southern third of the image. The border between England and Scotland runs from the River Tweed on the east coast and the Solway Firth along the Cheviot Hills of the west coast. The Solway Firth is an estuary of the Irish Sea, and was filled with tan-colored sediment at the time of this image. Further north on the west coast of Scotland, the Firth of Clyde is hidden under a bank of low clouds (fog). Scotland’s Southern Uplands lie just north of the border and the Central Lowlands just north of that. The Grampian Mountains are found in the center of the country, and the high peaks wear a covering of snow and ice year-round. Finally the Northern Highlands can be seen peeking out from under a large bank of clouds. The Northern Highlands and the Grampian Mountains are separated by a striking feature - the Great Glen Fault. This is a 100 km-long strike-slip fault which runs from Moray Firth in the east to Fort William at the head of Loch Linnhe in the west. The Great Glen contains the United Kingdom’s deepest freshwater loch, the famous Loch Ness. Credit: NASA/GSFC/Jeff Schmaltz/MODIS Land Rapid Response Team <b><a href="http://www.nasa.gov/audience/formedia/features/MP_Photo_Guidelines.html" rel="nofollow">NASA image use policy.</a></b> <b><a href="http://www.nasa.gov/centers/goddard/home/index.html" rel="nofollow">NASA Goddard Space Flight Center</a></b> enables NASA’s mission through four scientific endeavors: Earth Science, Heliophysics, Solar System Exploration, and Astrophysics. Goddard plays a leading role in NASA’s accomplishments by contributing compelling scientific knowledge to advance the Agency’s mission. <b>Follow us on <a href="http://twitter.com/NASA_GoddardPix" rel="nofollow">Twitter</a></b> <b>Like us on <a href="http://www.facebook.com/pages/Greenbelt-MD/NASA-Goddard/395013845897?ref=tsd" rel="nofollow">Facebook</a></b> <b>Find us on <a href="http://instagram.com/nasagoddard?vm=grid" rel="nofollow">Instagram</a></b>
<b>RELEASE DATE: OCTOBER 9, 2007</b> <b>Credit: NASA/Goddard Space Flight Center/Reto Stöckli</b> A day’s clouds. The shape and texture of the land. The living ocean. City lights as a beacon of human presence across the globe. This amazingly beautiful view of Earth from space is a fusion of science and art, a showcase for the remote-sensing technology that makes such views possible, and a testament to the passion and creativity of the scientists who devote their careers to understanding how land, ocean, and atmosphere—even life itself—interact to generate Earth’s unique (as far as we know!) life-sustaining environment. Drawing on data from multiple satellite missions (not all collected at the same time), a team of NASA scientists and graphic artists created layers of global data for everything from the land surface, to polar sea ice, to the light reflected by the chlorophyll in the billions of microscopic plants that grow in the ocean. They wrapped these layers around a globe, set it against a black background, and simulated the hazy edge of the Earth’s atmosphere (the limb) that appears in astronaut photography of the Earth. The land surface layer is based on photo-like surface reflectance observations (reflected sunlight) measured by the Moderate Resolution Imaging Spectroradiometer (MODIS) on NASA’s Terra satellite in July 2004. The sea ice layer near the poles comes from Terra MODIS observations of daytime sea ice observed between August 28 and September 6, 2001. The ocean layer is a composite. In shallow water areas, the layer shows surface reflectances observed by Terra MODIS in July 2004. In the open ocean, the photo-like layer is overlaid with observations of the average ocean chlorophyll content for 2004. NASA’s Aqua MODIS collected the chlorophyll data. The cloud layer shows a single-day snapshot of clouds observed by Terra MODIS across the planet on July 29, 2001. City lights on Earth’s night side are visualized from data collected by the Defense Meteorological Satellite Program mission between 1994–1995. The topography layer is based on radar data collected by the Space Shuttle Endeavour during an 11-day mission in February of 2000. Topography over Antarctica comes from the Radarsat Antarctic Mapping Project, version 2. Most of the data layers in this visualization are available as monthly composites as part of NASA’s Blue Marble Next Generation image collection. The images in the collection appear in cylindrical projection (rectangular maps), and they are available at 500-meter resolution. The large images provided above are the full-size versions of these globes. In their hope that these images will inspire people to appreciate the beauty of our home planet and to learn about the Earth system, the developers of these images encourage readers to re-use and re-publish the images freely. NASA images by Reto Stöckli, based on data from NASA and NOAA. To learn the history of the Blue Marble go here: <a href="http://earthobservatory.nasa.gov/Features/BlueMarble/BlueMarble_history.php" rel="nofollow">earthobservatory.nasa.gov/Features/BlueMarble/BlueMarble_...</a> To learn more about the Blue Marble go here: <a href="http://earthobservatory.nasa.gov/IOTD/view.php?id=8108" rel="nofollow">earthobservatory.nasa.gov/IOTD/view.php?id=8108</a> To learn more about NASA's Goddard Space Flight Center go here: <a href="http://www.nasa.gov/centers/goddard/home/index.html" rel="nofollow">www.nasa.gov/centers/goddard/home/index.html</a> <b><a href="http://www.nasa.gov/centers/goddard/home/index.html" rel="nofollow">NASA Goddard Space Flight Center</a></b> is home to the nation's largest organization of combined scientists, engineers and technologists that build spacecraft, instruments and new technology to study the Earth, the sun, our solar system, and the universe. <b><a href="http://www.nasa.gov/centers/goddard/home/index.html" rel="nofollow">NASA Goddard Space Flight Center</a></b> is home to the nation's largest organization of combined scientists, engineers and technologists that build spacecraft, instruments and new technology to study the Earth, the sun, our solar system, and the universe. <b>Follow us on <a href="http://twitter.com/NASA_GoddardPix" rel="nofollow">Twitter</a></b> <b>Join us on <a href="http://www.facebook.com/pages/Greenbelt-MD/NASA-Goddard/395013845897?ref=tsd" rel="nofollow">Facebook</a><b> </b></b>
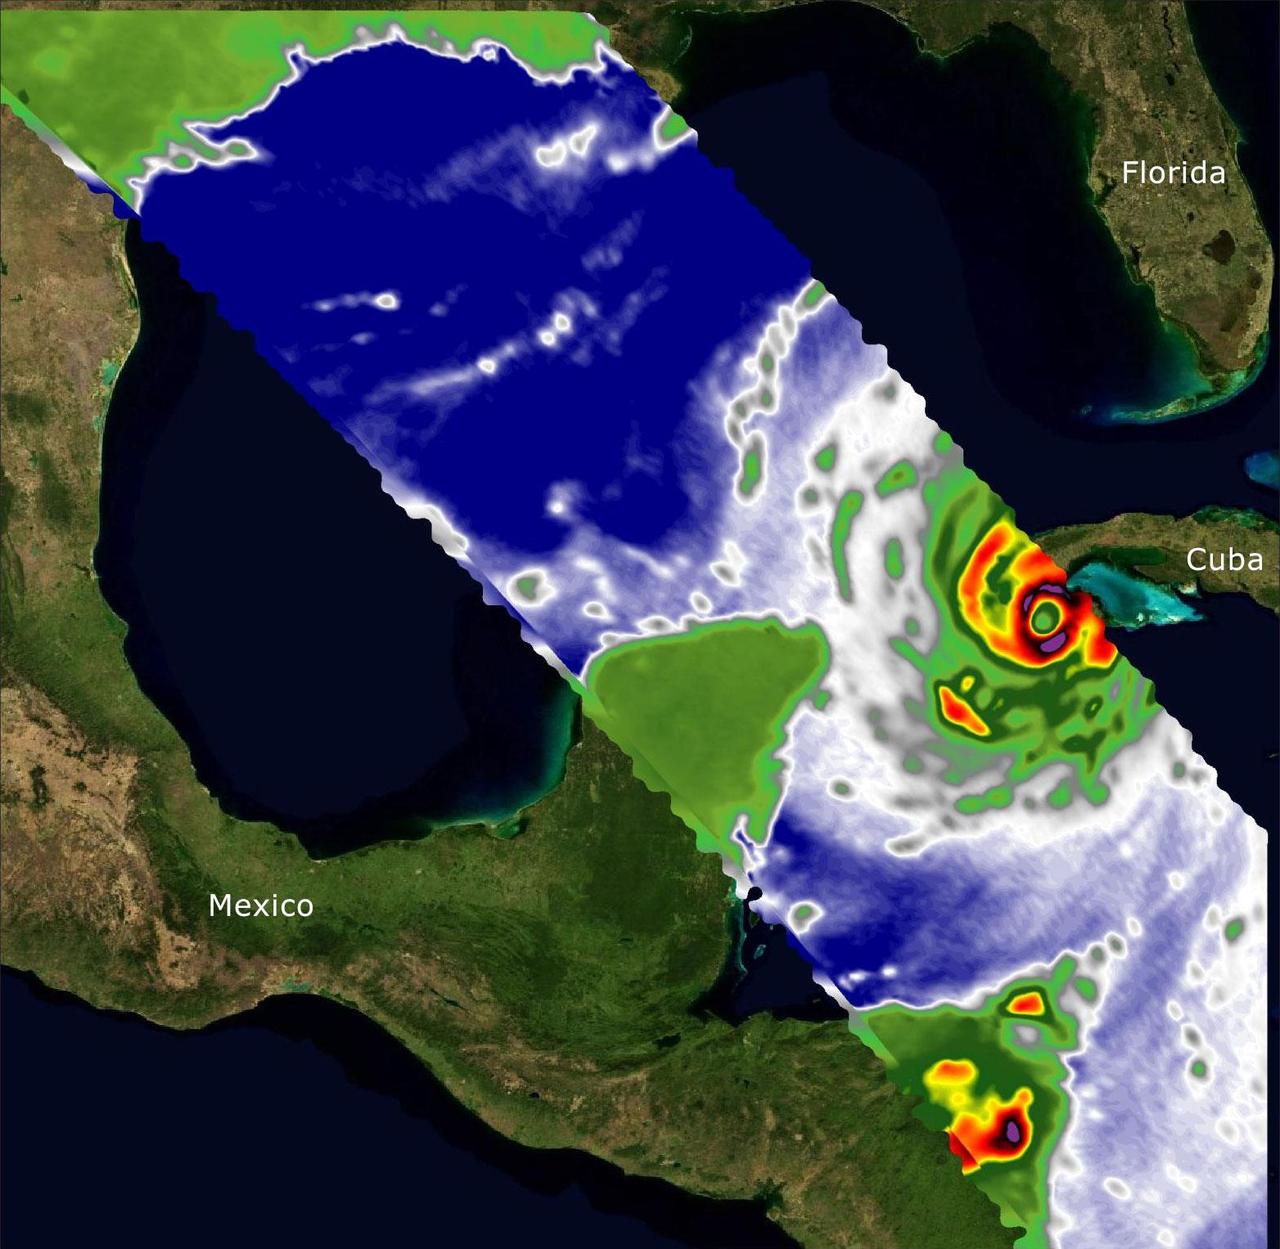
Two recently launched instruments that were designed and built at NASA's Jet Propulsion Laboratory in Southern California to provide forecasters data on weather over the open ocean captured images of Hurricane Ian on Sept. 27, 2022, as the storm approached Cuba on its way north toward the U.S. mainland. The instruments, Compact Ocean Wind Vector Radiometer (COWVR) and Temporal Experiment for Storms and Tropical Systems (TEMPEST), observe the planet's atmosphere and surface from aboard the International Space Station, which passed in low-Earth orbit over the Caribbean Sea at about 12:30 a.m. EDT. Ian made landfall in Cuba's Pinar del Rio province at 4:30 a.m. EDT, according to the National Hurricane Center. At that time, it was a Category 3 hurricane, with estimated wind speeds of 125 mph (205 kph). The image above combines microwave emissions measurements from both COWVR and TEMPEST. White sections indicate the presence of clouds. Green portions indicate rain. Yellow, red, and black indicate where air and water vapor were moving most swiftly. Ian's center is seen just off of Cuba's southern coast, and the storm is shown covering the island with rain and wind. COWVR and TEMPEST sent the data for this image back to Earth in a direct stream via NASA's tracking and data relay satellite (TDRS) constellation. The data were processed at JPL and made available to forecasters less than two hours after collection. About the size of a minifridge, COWVR measures natural microwave emissions over the ocean. The magnitude of the emissions increases with the amount of rain in the atmosphere, and the strongest rain produces the strongest microwave emissions. TEMPEST – comparable in size to a cereal box – tracks microwaves at a much shorter wavelength, allowing it to see ice particles within the hurricane's cloudy regions that are thrust into the upper atmosphere by the storm. Both microwave radiometers were conceived to demonstrate that smaller, more energy-efficient, more simply designed sensors can perform most of the same measurements as current space-based weather instruments that are heavier, consume more power, and cost much more to construct. COWVR's development was funded by the U.S. Space Force, and TEMPEST was developed with NASA funding. The U.S. Space Test Program-Houston 8 (STP-H8) is responsible for hosting the instruments on the space station under Space Force funding in partnership with NASA. Data from the instruments are being used by government and university weather forecasters and scientists. The mission will inform development of future space-based weather sensors, and scientists are working on mission concepts that would take advantage of the low-cost microwave sensor technologies to study long-standing questions, such as how heat from the ocean fuels global weather patterns. https://photojournal.jpl.nasa.gov/catalog/PIA25425
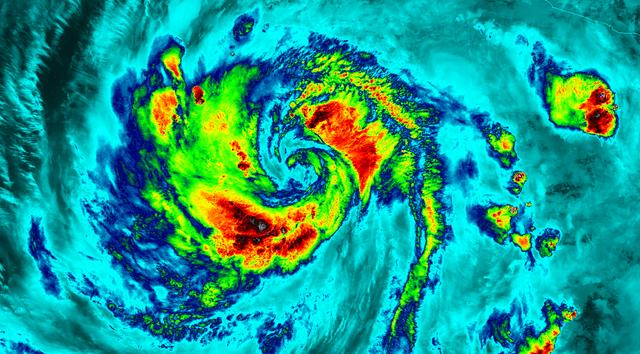
NASA-NOAA's Suomi NPP satellite flew over Hurricane Blanca in the Eastern Pacific Ocean and gathered infrared data on the storm that was false-colored to show locations of the strongest thunderstorms within the storm. The Visible Infrared Imaging Radiometer Suite or VIIRS instrument aboard the satellite gathered infrared data of the storm that was made into an image at the University of Wisconsin-Madison. The image was false-colored to show temperature. Coldest cloud top temperatures indicate higher, stronger, thunderstorms within a tropical cyclone. Those are typically the strongest storms with potential for heavy rainfall. VIIRS is a scanning radiometer that collects visible and infrared imagery and "radiometric" measurements. Basically it means that VIIRS data is used to measure cloud and aerosol properties, ocean color, sea and land surface temperature, ice motion and temperature, fires, and Earth's albedo (reflected light). The VIIRS image from June 5 at 8:11 UTC (4:11 a.m. EDT) showed two areas of coldest cloud top temperatures and strongest storms were west-southwest and east-northeast of the center of Blanca's circulation center. On June 5 at 5 a.m. EDT (0900 UTC) Blanca's maximum sustained winds were near 105 mph (165 kph) with higher gusts. The National Hurricane Center (NHC) forecast expects some strengthening during the next day or so. Weakening is forecast to begin by late Saturday. At that time, NHC placed the center of Hurricane Blanca near latitude 14.3 North, longitude 106.2 West. That puts the center about 350 miles (560 km) south-southwest of Manzanillo, Mexico and about 640 miles (1,030 km) south-southeast of Cabo San Lucas, Mexico. The estimated minimum central pressure is 968 millibars (28.59 inches). Blanca is moving toward the northwest near 10 mph (17 kph). A northwestward to north-northwestward motion at a similar forward speed is expected to continue through Saturday night. Blanca has been stirring up surf along the coast of southwestern Mexico and will reach the Pacific coast of the Baja California peninsula and the southern Gulf of California later today, June 5. These swells are likely to cause life-threatening surf and rip current conditions. On the forecast track, the center of Blanca will approach the southern Baja California peninsula on Sunday. NHC cautions that "Interests in the southern Baja California peninsula should monitor the progress of Blanca. A tropical storm or hurricane watch will likely be required for a portion of Baja California Sur later today." The NHC forecast track shows Blanca making landfall in the southeastern tip of Baja California on Sunday, June 7 and tracking north-northeast along the Baja California peninsula, for several days following. Image credit: Credits: NASA/NOAA/UW-CIMSS <b><a href="http://www.nasa.gov/audience/formedia/features/MP_Photo_Guidelines.html" rel="nofollow">NASA image use policy.</a></b> <b><a href="http://www.nasa.gov/centers/goddard/home/index.html" rel="nofollow">NASA Goddard Space Flight Center</a></b> enables NASA’s mission through four scientific endeavors: Earth Science, Heliophysics, Solar System Exploration, and Astrophysics. Goddard plays a leading role in NASA’s accomplishments by contributing compelling scientific knowledge to advance the Agency’s mission. <b>Follow us on <a href="http://twitter.com/NASAGoddardPix" rel="nofollow">Twitter</a></b> <b>Like us on <a href="http://www.facebook.com/pages/Greenbelt-MD/NASA-Goddard/395013845897?ref=tsd" rel="nofollow">Facebook</a></b> <b>Find us on <a href="http://instagrid.me/nasagoddard/?vm=grid" rel="nofollow">Instagram</a></b>