
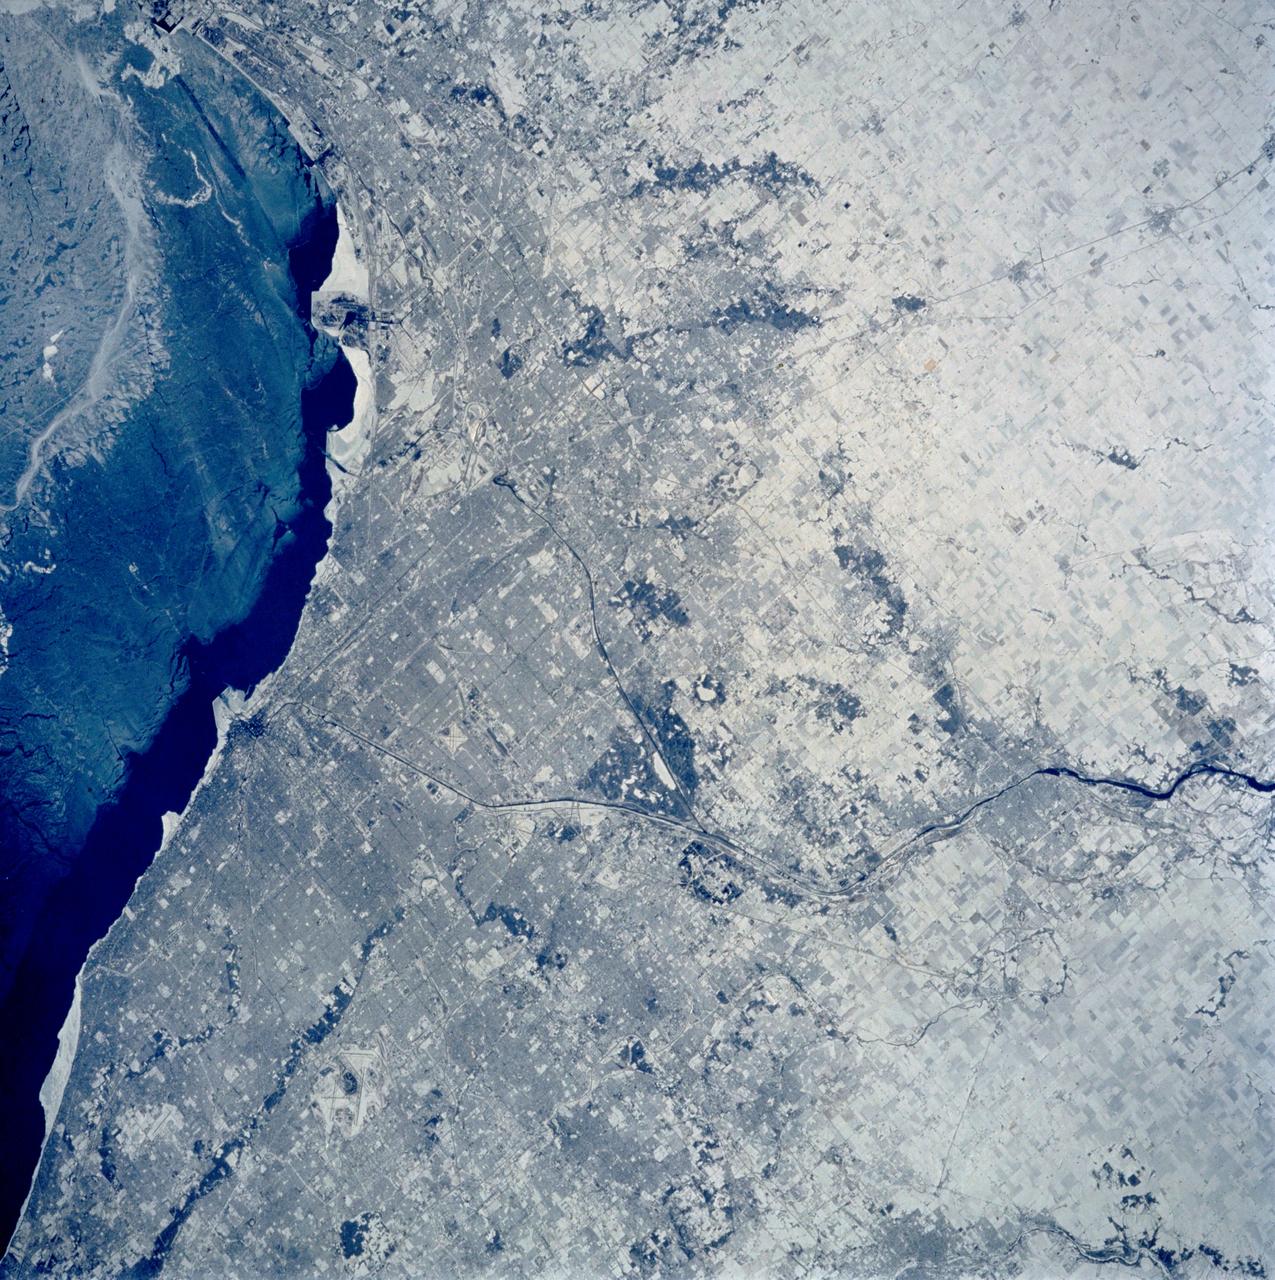
STS040-77-045 (6 June 1991) --- This image, photographed on June 6, 1991, is an oblique view looking north-northeast and shows most of the Great Lakes region. Part of Columbia's cargo bay and the Spacelab Life Sciences (SLS-1) module are in the foreground. In the center of the image is Lake Michigan with Chicago clearly visible along the southwest shore. According to NASA photo experts studying the STS-40 imagery, this image shows several interesting meteorological phenomena. The difference in temperature between the warming land and the cold lake waters is illustrated by the low level clouds. The warming land surface results in rising air and the formation of clouds, while the lake waters are cold and result in the lakes remaining cloud free. Also visible is evidence of lake breezes developing around several of the lakes. This phenomena is also driven by the difference in temperature between the land and the water. Winds blowing off the lakes must travel 25 - 30 miles inland before it warms sufficiently to create clouds.

Though North America is a full month into astronomical spring, the Great Lakes have been slow to give up on winter. As of April 22, 2014, the Great Lakes were 33.9 percent ice covered. The lake they call Superior dominated the pack. In the early afternoon on April 20, 2014, the Moderate Resolution Imaging Spectroradiometer (MODIS) on NASA’s Aqua satellite captured this natural-color image of Lake Superior, which straddles the United States–Canada border. At the time Aqua passed over, the lake was 63.5 percent ice covered, according to the NOAA Great Lakes Environmental Research Lab (GLERL). Averaged across Lake Superior, ice was 22.6 centimeters (8.9 inches) thick; it was as much as twice that thickness in some locations. GLERL researcher George Leshkevich affirmed that ice cover this spring is significantly above normal. For comparison, Lake Superior had 3.6 percent ice cover on April 20, 2013; in 2012, ice was completely gone by April 12. In the last winter that ice cover grew so thick on Lake Superior (2009), it reached 93.7 percent on March 2 but was down to 6.7 percent by April 21. Average water temperatures on all of the Great Lakes have been rising over the past 30 to 40 years and ice cover has generally been shrinking. (Lake Superior ice was down about 79 percent since the 1970s.) But chilled by persistent polar air masses throughout the 2013-14 winter, ice cover reached 88.4 percent on February 13 and 92.2 percent on March 6, 2014, the second highest level in four decades of record-keeping. Air temperatures in the Great Lakes region were well below normal for March, and the cool pattern is being reinforced along the coasts because the water is absorbing less sunlight and warming less than in typical spring conditions. The graph below, based on data from Environment Canada, shows the 2014 conditions for all of the Great Lakes in mid-April compared to the past 33 years. Lake Superior ice cover got as high as 95.3 percent on March 19. By April 22, it was reported at 59.9 percent; Lake Huron was nearly 30.4 percent. News outlets noted that as many as 70 ships have been backed up in Lakes Michigan, Huron, and Erie, waiting for passage into ports on Lake Superior. The U.S. Coast Guard has been grouping ships together into small convoys after they pass through locks at Sault Ste. Marie, in order to maximize ice-breaking efficiency and to protect ships from damage. Superior is the world’s largest freshwater lake by area (82,100 square kilometers or 31,700 square miles) and the third largest by volume. The waters average 147 meters (483 feet) in depth, and the basin is believed to hold about 10 percent of the world’s liquid fresh water. NASA image courtesy Jeff Schmaltz LANCE/EOSDIS MODIS Rapid Response Team, GSFC. Caption by Mike Carlowicz. Read more: <a href="http://earthobservatory.nasa.gov/IOTD/view.php?id=83541&eocn=home&eoci=iotd_title" rel="nofollow">earthobservatory.nasa.gov/IOTD/view.php?id=83541&eocn...</a> Credit: <b><a href="http://www.earthobservatory.nasa.gov/" rel="nofollow"> NASA Earth Observatory</a></b> <b><a href="http://www.nasa.gov/audience/formedia/features/MP_Photo_Guidelines.html" rel="nofollow">NASA image use policy.</a></b> <b><a href="http://www.nasa.gov/centers/goddard/home/index.html" rel="nofollow">NASA Goddard Space Flight Center</a></b> enables NASA’s mission through four scientific endeavors: Earth Science, Heliophysics, Solar System Exploration, and Astrophysics. Goddard plays a leading role in NASA’s accomplishments by contributing compelling scientific knowledge to advance the Agency’s mission. <b>Follow us on <a href="http://twitter.com/NASAGoddardPix" rel="nofollow">Twitter</a></b> <b>Like us on <a href="http://www.facebook.com/pages/Greenbelt-MD/NASA-Goddard/395013845897?ref=tsd" rel="nofollow">Facebook</a></b> <b>Find us on <a href="http://instagram.com/nasagoddard?vm=grid" rel="nofollow">Instagram</a></b>
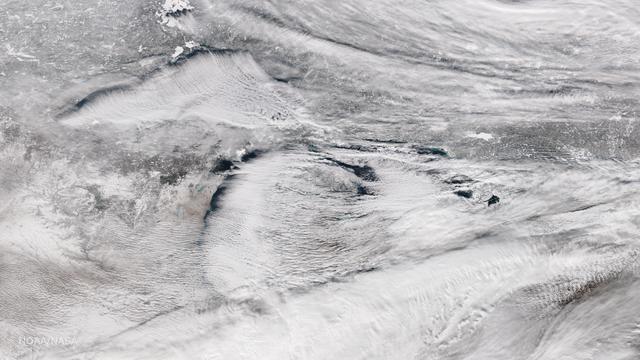
Bands of lake effect snow drift eastward from the western Great Lakes in this true-color image captured by the NOAA/NASA Suomi NPP satellite's Visible Infrared Imaging Radiometer Suite (VIIRS) instrument on January 5, 2017. National Weather Service forecasters expect light to moderate lake effect snow showers to continue throughout the day today and into Saturday (1/7). Lake-effect snow forms when cold air passes over the warmer waters of a lake. This causes some lake water to evaporate into the air and warm it. This warmer, wetter air rises and cools as it moves away from the lake. When it cools, it releases that moisture and, if it’s cold enough, that moisture turns into snow. Although true-color images like this may appear to be photographs of Earth, they aren't. They are created by combining data from the three color channels on the VIIRS instrument sensitive to the red, green and blue (or RGB) wavelengths of light into one composite image. In addition, data from several other channels are often also included to cancel out or correct atmospheric interference that may blur parts of the image. Credit: NOAA/NASA/Suomi NPP via NOAA's Environmental Visualization Laboratory
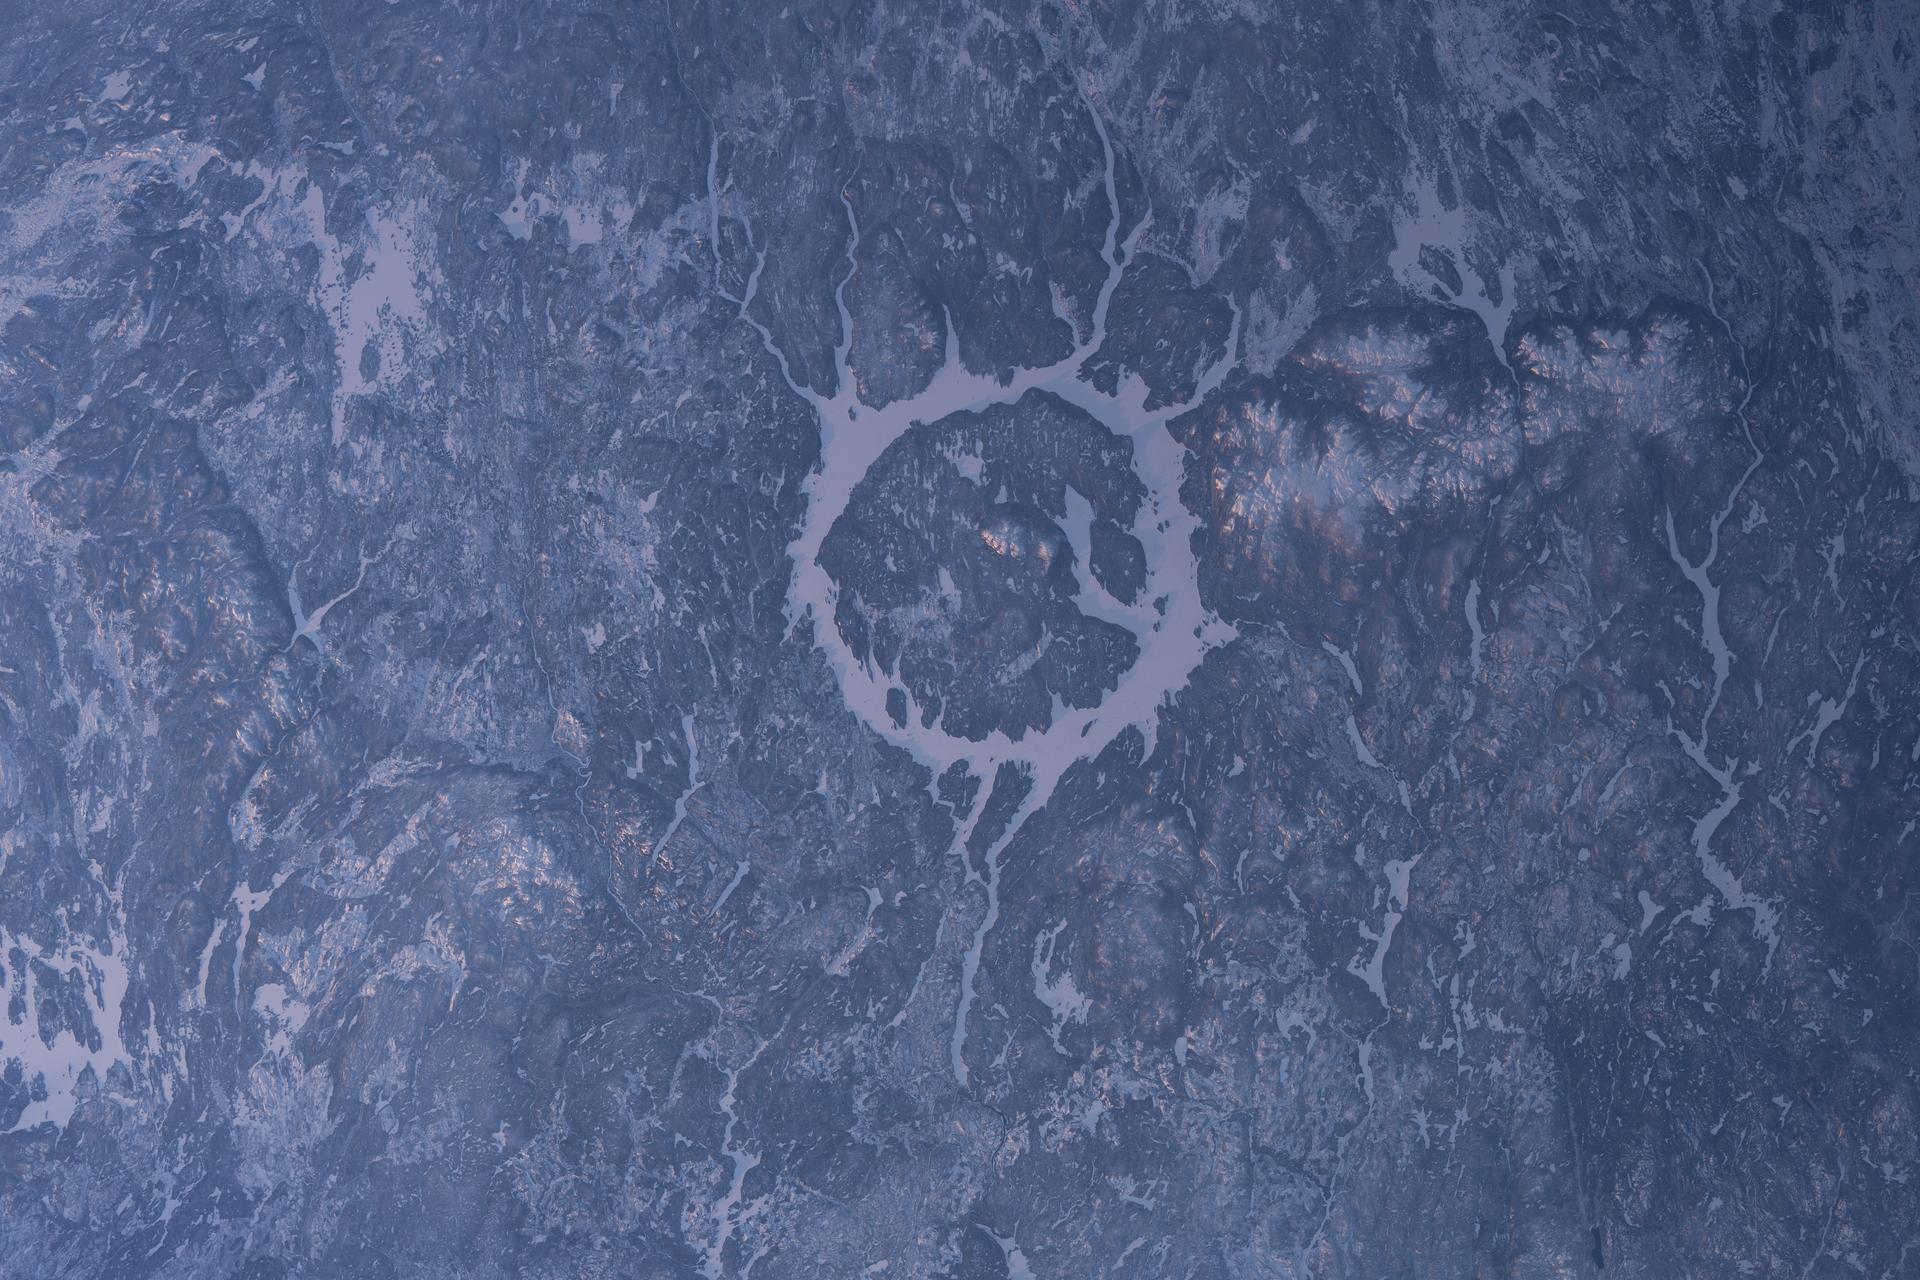
iss074e0153228 (Jan. 25, 2026) --- The Manicouagan Crater in Quebec, formed about 214 million years ago by a massive meteorite impact, is one of the largest craters on Earth. It is surrounded by a ring-shaped lake called the Manicouagan Reservoir and is part of a major hydroelectric system that contributes significantly to Quebec’s energy supply. The International Space Station was orbiting 263 miles above Canada's cold, dry wintry landscape at the time of this photograph. Credit: NASA/Chris Williams
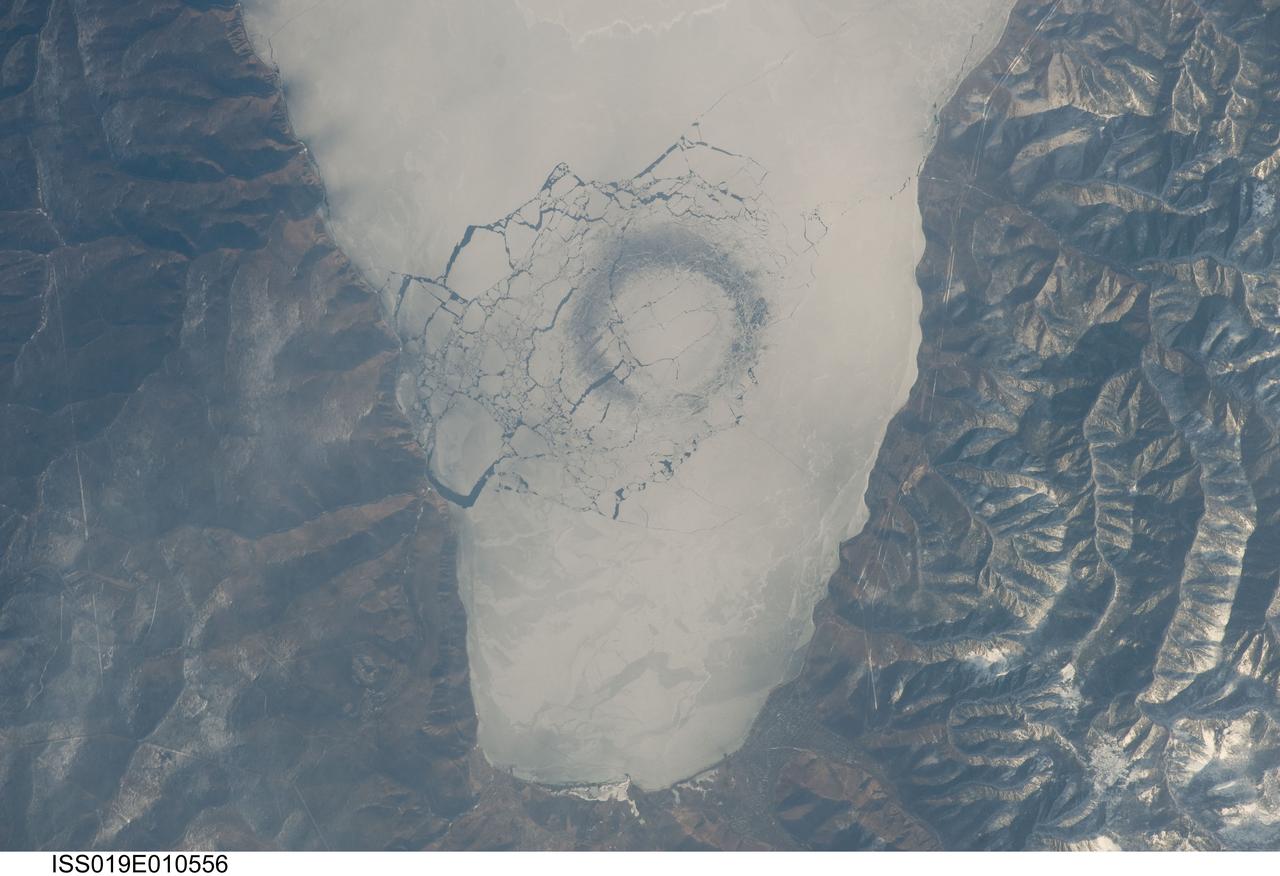
ISS019-E-010556 (23 April 2009) --- A circle in thin ice in Lake Baikal, Russia is featured in this image photographed by an Expedition 19 crewmember on the International Space Station. Late in April 2009, astronauts aboard the station observed a strange circular area of thinned ice (dark in color, with a diameter of about 4.4 kilometers) in the southern end of Lake Baikal in southern Siberia. Lake Baikal is unique in many regards. It is the largest (by volume) and deepest (1,637 meters at the deepest point) fresh water lake on Earth and, as a World Heritage Site, is considered one of Russia?s environmental jewels. The lake?s long, thin and deep profile results from its location in the Baikal Rift valley in Siberia. According to scientists, it is also one of the world?s oldest lakes (25-30 million years old); it contains up to 7 kilometers of sediment deposited on the bottom, and is home to an amazing array of plants and animals, many being found only in Lake Baikal. The lake?s biodiversity includes fresh water seals and several species of fish that are not found elsewhere on Earth. Siberia is remote and cold; ice cover can persist into June. This detailed image shows a circle of thin ice, which is the focal point for ice break up in the very southern end of the lake. While the origin of the circles is unknown, the peculiar pattern suggests convection in the lake?s water column. Ice cover changes rapidly at this time of year. Within a day, the ice can melt almost completely, and then freeze again overnight. Throughout April, the circles are persistent ? they appear when ice cover forms, and then disappear as ice melts. The pattern and appearance suggests that the ice is quite thin.
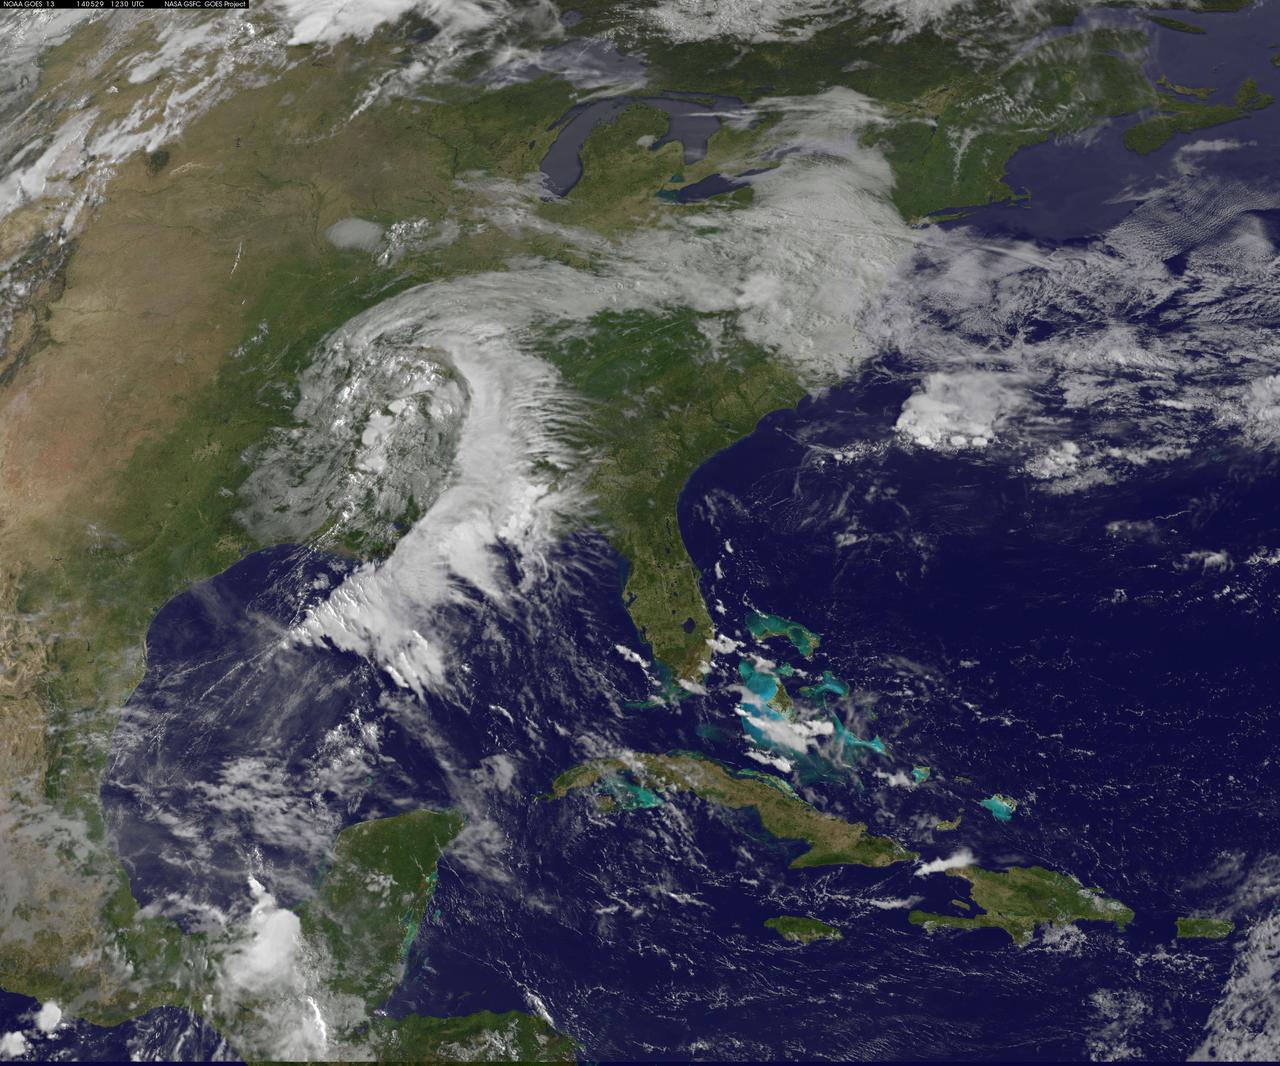
A "backdoor cold front" is bringing April temperatures to the U.S. northeast and Mid-Atlantic today, May 29. The backdoor cold front brings relief to the Mid-Atlantic after temperatures in Washington, D.C. hit 92F on Tuesday, May 27 and 88F on Wednesday, May 28 at Reagan National Airport, according to the National Weather Service (NWS). NWS forecasters expect the high temperature for May 29 to only reach 60F in the District of Columbia. NOAA's GOES-East satellite captured a view of the clouds associated with the backdoor cold front that stretch from southern Illinois to North Carolina. The National Weather Service forecast expects the backdoor cold front to bring showers to the Midwest, Northeast, and Mid-Atlantic today, May 29. According to the National Oceanic and Atmospheric Administration, a backdoor cold front is a cold front moving south or southwest along the Atlantic seaboard and Great Lakes; these are especially common during the spring months. This visible image was taken by NOAA's GOES-East satellite on May 29 at 12:30 UTC (8:30 a.m. EDT). The image was created at NASA/NOAA's GOES Project at NASA's Goddard Space Flight Center in Greenbelt, Maryland. In addition to the backdoor cold front clouds, the GOES-East image shows clouds circling around a low pressure area located in eastern Texas. That low pressure area is expected to bring rain from Texas eastward over the southeastern U.S. According to NOAA's National Weather Service, the slow-moving low pressure area in the Deep South "will bring heavy showers and thunderstorms from Louisiana to Alabama through Thursday. This area is already saturated from previous rainfall, so flash flooding will be possible." Image: NASA/NOAA GOES Project Caption: NASA Goddard/Rob Gutro
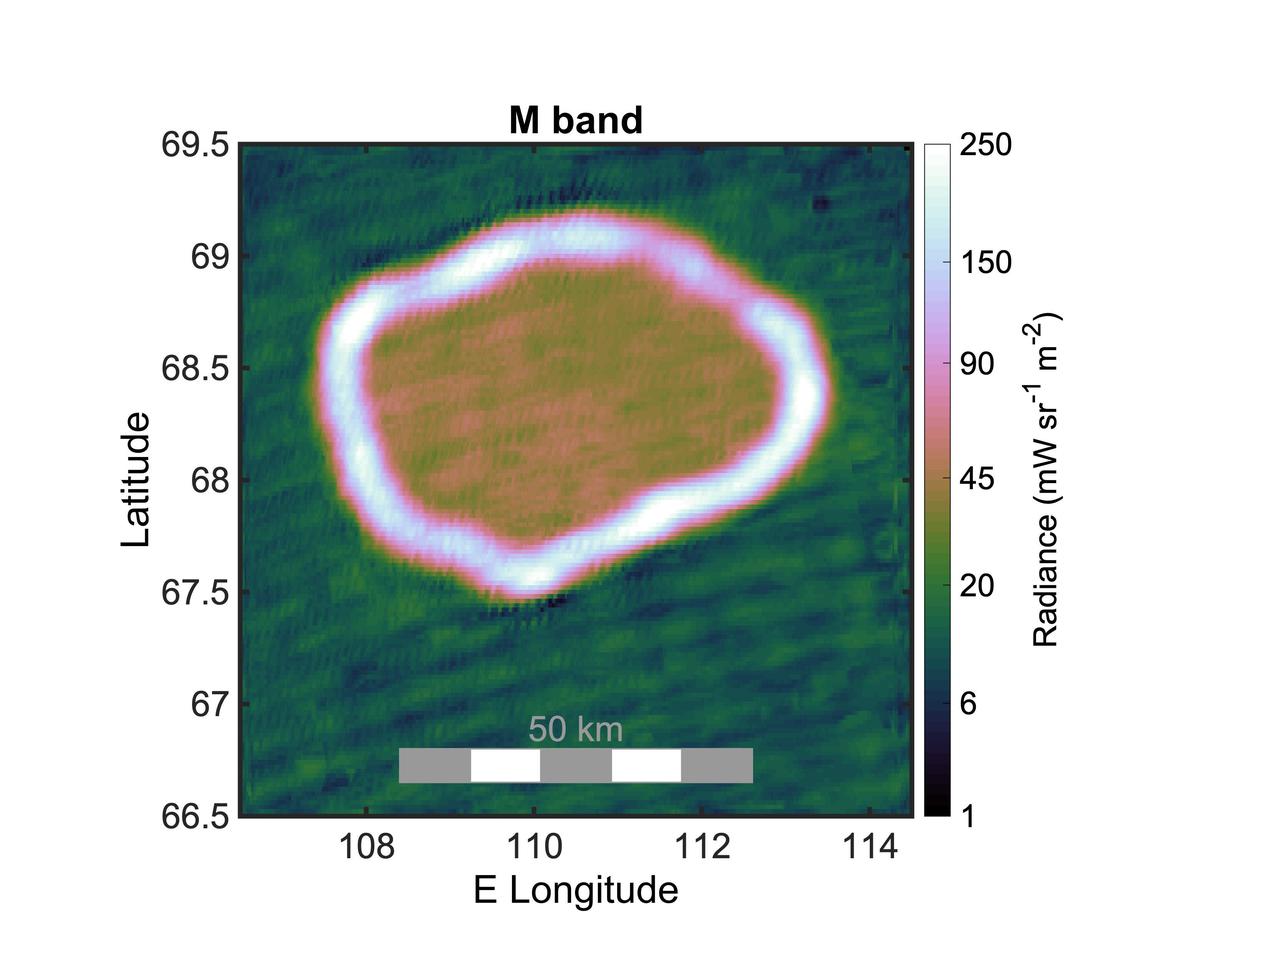
This graphic shows the infrared radiance of Chors Patera, a lava lake on Jupiter's moon Io. It was created using infrared data collected by the JIRAM (Jovian Infrared Auroral Mapper) instrument aboard NASA's Juno spacecraft during a flyby of the moon on Oct. 15, 2023. The lake is about 31 miles (50 kilometers) wide. Juno scientists believe the majority of the lake is covered with a thick crust of molten material (appearing red/green in graphic, inside the white ring) that is approximately minus 45 degrees Fahrenheit (minus 43 degrees Celsius) at its surface. The white ring indicates where lava from Io's interior is directly exposed to space, providing the geologic feature's hottest thermal signature: between 450 and 1,350 F (232 and 732 C). The area in green, outside the lava lake, is very cold: about minus 225 F (minus 143 C). JIRAM "sees" infrared light not visible to the human eye. In this composite image, the measurements of thermal emissions radiated from the planet were in the infrared wavelength between 4.5 and 5 microns. https://photojournal.jpl.nasa.gov/catalog/PIA26371
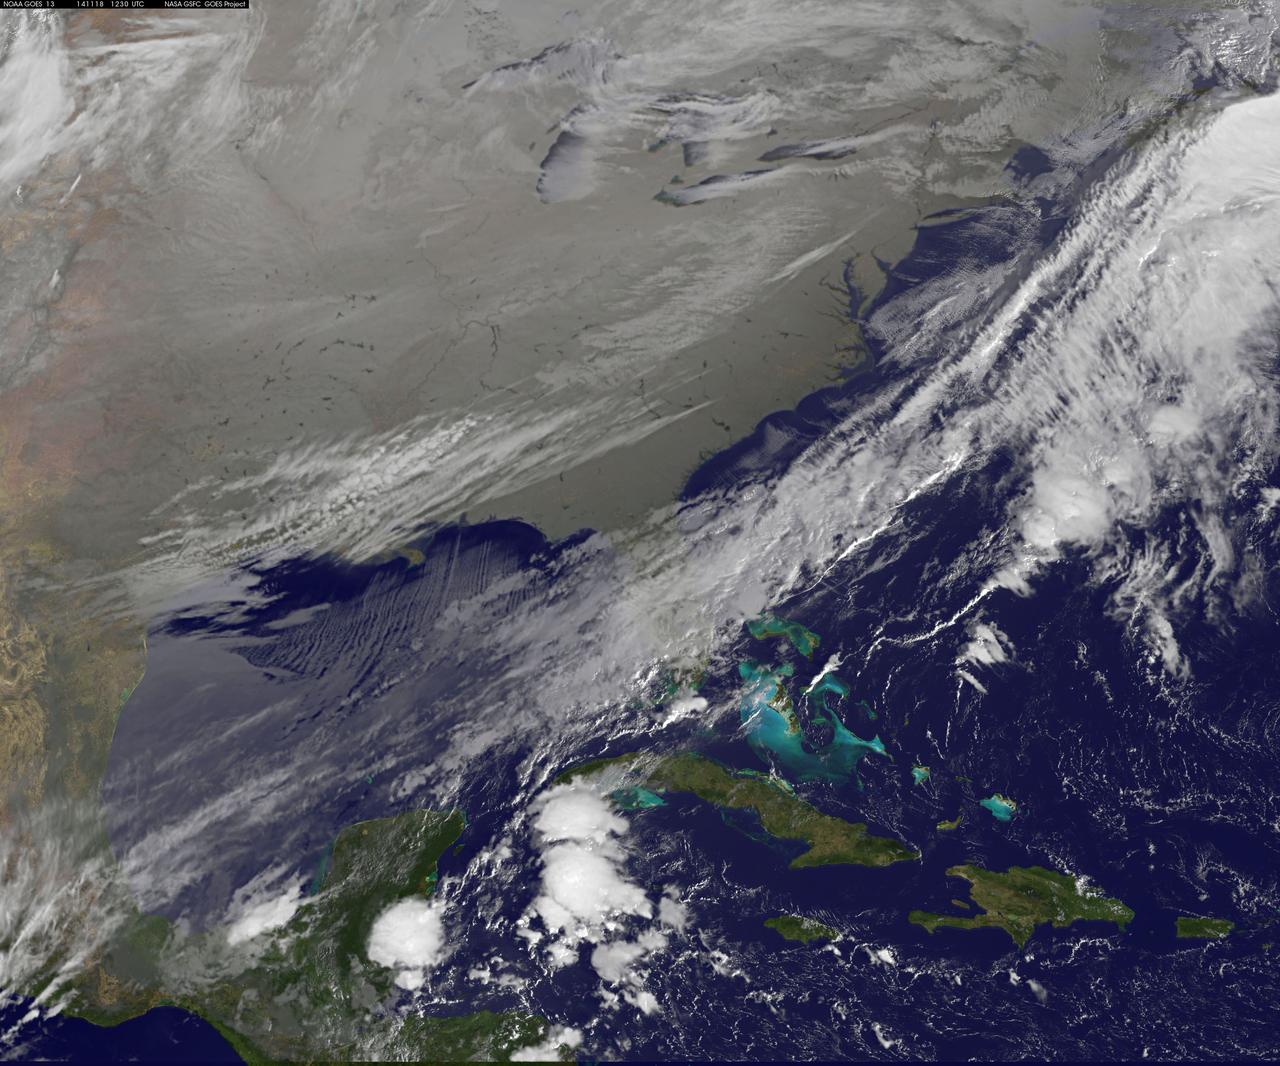
As icy cold Canadian air settled over the eastern two-thirds of the U.S. bringing snow and bitter cold, NOAA's GOES-East satellite captured this infrared view of what looks like a frozen blanket over the region. NOAA's GOES-East satellite provides visible and infrared images over the eastern U.S. and the Atlantic Ocean from its fixed orbit in space. In an infrared image taken on Nov. 18 at 12:30 UTC (7:30 a.m. EST), the cold air over the eastern and central U.S. appears to look like a blanket of white, but it's not all snow. Infrared data shows temperature, so although the eastern two-thirds of the U.S. appears to appear is if snow covers the ground, the blanket is in fact cold clouds. However, snow does lie under that blanket in the Upper Midwest, Ohio Valley, and Canada, where it will continue in those areas through Thursday, Nov. 20. "Dozens of lakes behind dams in the Southeast USA stand out as dark spots in a grey landscape," said Dennis Chesters of NASA/NOAA's GOES Project at NASA's Goddard Space Flight Center in Greenbelt, Md. "That is because we invert the display of infrared emission to make cold cloud tops appear white, frozen land grey, and warm water dark." NOAA's National Weather Service Weather Prediction Center said that the deep low pressure system pushing that polar air over the Eastern U.S. is centered over southeastern Canada. On Tuesday, Nov. 18, freeze and frost warnings stretch from the upper Great Lakes to Florida. Some areas in the Upper Great Lakes are forecast to receive over two feet of snow. Well below average temperatures are forecast to reach the Gulf Coast, with most of the Mid-Atlantic States barely getting above freezing Tuesday and Wednesday. In the Midwest, periods of lake effect snow are forecast to continue south and east of the Great Lakes through Wednesday. Read more: <a href="http://www.nasa.gov/content/goddard/satellite-view-of-the-us-wrapped-in-a-frozen-blanket/index.html#.VGuxFd6FzeN" rel="nofollow">www.nasa.gov/content/goddard/satellite-view-of-the-us-wra...</a> <b><a href="http://goes.gsfc.nasa.gov/" rel="nofollow">Credit: NOAA/NASA GOES Project</a></b> <b><a href="http://www.nasa.gov/audience/formedia/features/MP_Photo_Guidelines.html" rel="nofollow">NASA image use policy.</a></b> <b><a href="http://www.nasa.gov/centers/goddard/home/index.html" rel="nofollow">NASA Goddard Space Flight Center</a></b> enables NASA’s mission through four scientific endeavors: Earth Science, Heliophysics, Solar System Exploration, and Astrophysics. Goddard plays a leading role in NASA’s accomplishments by contributing compelling scientific knowledge to advance the Agency’s mission. <b>Follow us on <a href="http://twitter.com/NASAGoddardPix" rel="nofollow">Twitter</a></b> <b>Like us on <a href="http://www.facebook.com/pages/Greenbelt-MD/NASA-Goddard/395013845897?ref=tsd" rel="nofollow">Facebook</a></b> <b>Find us on <a href="http://instagram.com/nasagoddard?vm=grid" rel="nofollow">Instagram</a></b>

This artist's concept of a lake at the north pole of Saturn's moon Titan illustrates raised rims and rampartlike features such as those seen by NASA's Cassini spacecraft around the moon's Winnipeg Lacus. New research using Cassini radar data and modeling proposes that lake basins like these are likely explosion craters, which could have formed when liquid molecular nitrogen deposits within the crust warmed and quickly turned to vapor, blowing holes in the moon's crust. This would have happened during a warming event (or events) that occurred in a colder, nitrogen-dominated period in Titan's past. The new research may provide evidence of these cold periods in Titan's past, followed by a relative warming to conditions like those of today. Although Titan is frigid compared to Earth, methane in the atmosphere provides a greenhouse effect that warms the moon's surface. https://photojournal.jpl.nasa.gov/catalog/PIA23172
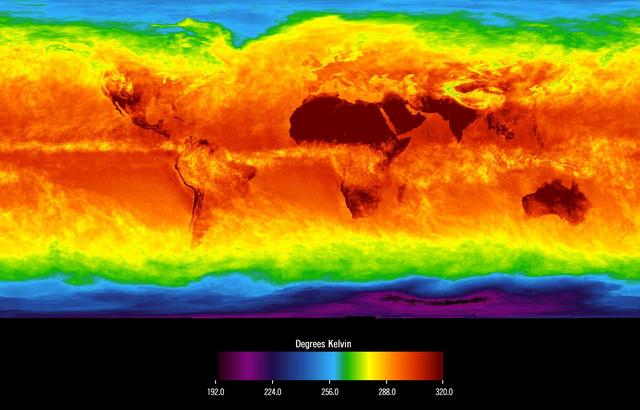
This image shows average temperatures in April, 2003, observed by AIRS at an infrared wavelength that senses either the Earth's surface or any intervening cloud. Similar to a photograph of the planet taken with the camera shutter held open for a month, stationary features are captured while those obscured by moving clouds are blurred. Many continental features stand out boldly, such as our planet's vast deserts, and India, now at the end of its long, clear dry season. Also obvious are the high, cold Tibetan plateau to the north of India, and the mountains of North America. The band of yellow encircling the planet's equator is the Intertropical Convergence Zone (ITCZ), a region of persistent thunderstorms and associated high, cold clouds. The ITCZ merges with the monsoon systems of Africa and South America. Higher latitudes are increasingly obscured by clouds, though some features like the Great Lakes, the British Isles and Korea are apparent. The highest latitudes of Europe and Eurasia are completely obscured by clouds, while Antarctica stands out cold and clear at the bottom of the image. http://photojournal.jpl.nasa.gov/catalog/PIA00427

NOAA's GOES-East satellite provided a look at the frigid eastern two-thirds of the U.S. on Jan. 7, 2015, that shows a blanket of northern snow, lake-effect snow from the Great Lakes and clouds behind the Arctic cold front. A visible picture captured at 1600 UTC (11 a.m. EST) showed the effects of the latest Arctic outbreak. The cold front that brought the Arctic air has moved as far south as Florida, and stretches back over the Gulf of Mexico and just west of Texas today. The image shows clouds behind the frontal boundary stretching from the Carolinas west over the Heartland. Farther north, a wide band of fallen snow covers the ground from New England west to Montana, with rivers appearing like veins. The GOES-East satellite image also shows wind-whipped lake-effect snows off the Great Lakes, blowing to the southeast. Meanwhile, Florida, the nation's warm spot appeared almost cloud-free. To create the image, NASA/NOAA's GOES Project used cloud data from NOAA's GOES-East satellite and overlaid it on a true-color image of land and ocean created by data from the Moderate Resolution Imaging Spectroradiometer, or MODIS, instrument that flies aboard NASA's Aqua and Terra satellites. Together, those data created the entire picture of the Arctic outbreak. The forecast from NOAA's National Weather Service Weather Prediction Center (WPC) calls for more snow along the Appalachian Mountains from Tennessee north to upstate New York. Snow is also expected to fall from New England west to Montana, and in eastern New Mexico and the Colorado Rockies. The WPC summary for Jan. 7 noted: Bitter cold will be felt from the western High Plains to the Mid-Atlantic and Northeast U.S. for the next few days. Widespread subzero overnight lows are forecast for the Dakotas, Upper Midwest, Great Lakes, and interior New England. Wind Chill Advisories and Warnings are in effect for many of these areas. GOES-East provides visible and infrared images over the eastern U.S. and the Atlantic Ocean from its fixed orbit in space. NOAA's GOES satellites provide the kind of continuous monitoring necessary for intensive data analysis. Geostationary describes an orbit in which a satellite is always in the same position with respect to the rotating Earth. This allows GOES to hover continuously over one position on Earth's surface, appearing stationary. As a result, GOES provide a constant vigil for the atmospheric triggers for severe weather conditions such as tornadoes, flash floods, hail storms and hurricanes. For updated information about the storm system, visit NOAA's NWS website: <a href="http://www.weather.gov" rel="nofollow">www.weather.gov</a> For more information about GOES satellites, visit: <a href="http://www.goes.noaa.gov/" rel="nofollow">www.goes.noaa.gov/</a> or goes.gsfc.nasa.gov/ Rob Gutro NASA's Goddard Space Flight Center, Greenbelt, Md. <b><a href="http://www.nasa.gov/audience/formedia/features/MP_Photo_Guidelines.html" rel="nofollow">NASA image use policy.</a></b> <b><a href="http://www.nasa.gov/centers/goddard/home/index.html" rel="nofollow">NASA Goddard Space Flight Center</a></b> enables NASA’s mission through four scientific endeavors: Earth Science, Heliophysics, Solar System Exploration, and Astrophysics. Goddard plays a leading role in NASA’s accomplishments by contributing compelling scientific knowledge to advance the Agency’s mission. <b>Follow us on <a href="http://twitter.com/NASAGoddardPix" rel="nofollow">Twitter</a></b> <b>Like us on <a href="http://www.facebook.com/pages/Greenbelt-MD/NASA-Goddard/395013845897?ref=tsd" rel="nofollow">Facebook</a></b> <b>Find us on <a href="http://instagram.com/nasagoddard?vm=grid" rel="nofollow">Instagram</a></b>
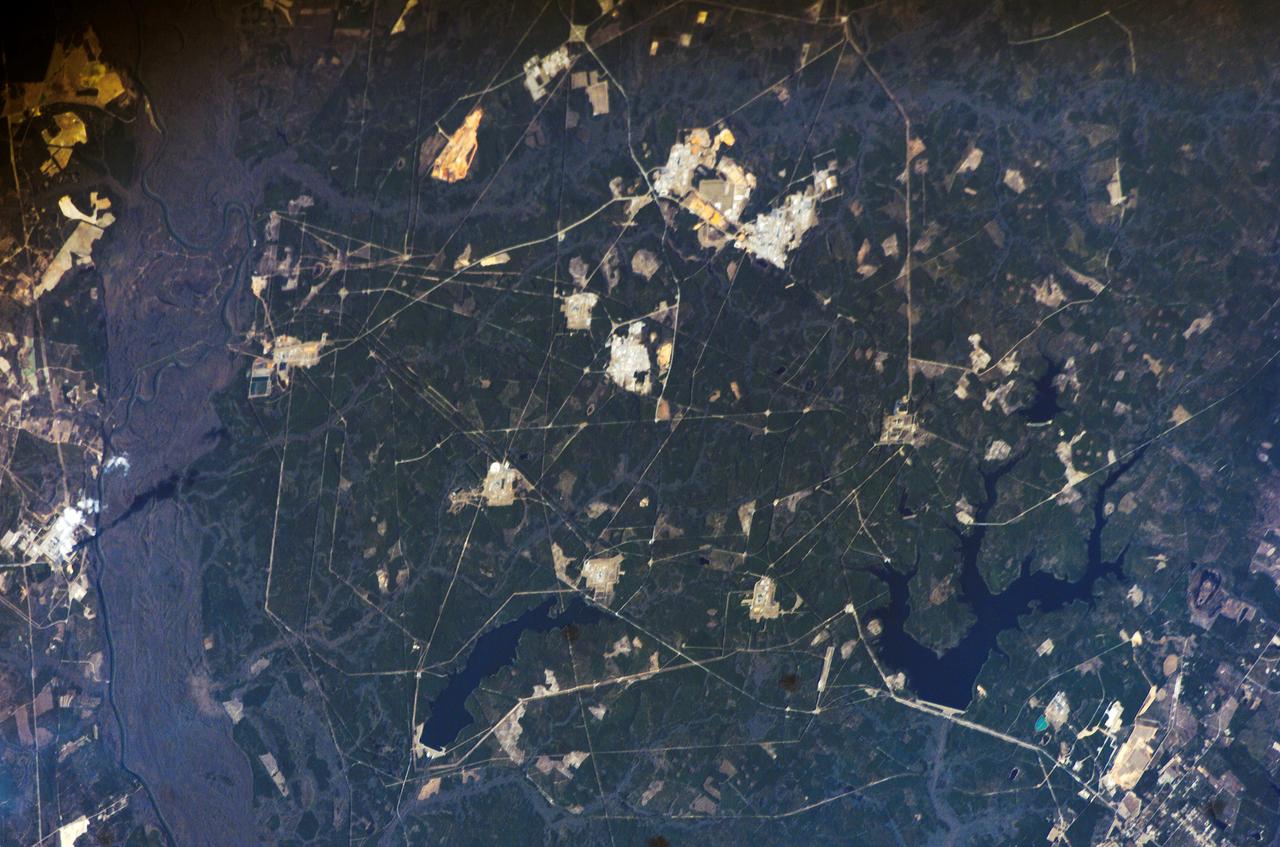
ISS012-E-16633 (28 Jan. 2006) --- Savannah River Site, South Carolina is featured in this image photographed by an Expedition 12 crew member on the International Space Station. Situated between the South Carolina piedmont and the Atlantic Ocean, the Savannah River Site is an important part of the US Department of Energy’s nuclear program. Construction of the site – originally called the Savannah River Plant – began in 1951 for the purpose of generating radioactive materials, primarily the hydrogen isotope tritium and plutonium-239, necessary for nuclear weapons production during the Cold War. A total of five nuclear reactors occupy the central portion of the site and operated throughout 1953-1992. Following the end of the Cold War in 1991 activities at the Savannah River Site are now focused on disposal of nuclear wastes, environmental cleanup of the site itself, and development of advanced remediation technologies. The Savannah River Site is located in the Sand Hills region of South Carolina and includes an area of 800 square kilometers (300 square miles). The southern half of the Site (building clusters with reflective white rooftops) is shown. The nearby Savannah River and its tributary creeks provided a ready source of water for the nuclear reactors; to this end, two artificial lakes (“L” Lake and Par Pond) were constructed. The meandering channel of the River and its floodplain, characterized by grey-brown sediments, extends from northwest to southeast across the left portion of the image. The proximity of the River, and the permeable nature of the geological materials under laying the site (sand, clay, gravel, and carbonate rocks), necessitate extensive and ongoing environmental monitoring and cleanup efforts to reduce potential contamination of local water sources. According to NASA scientists, final remediation of wastes posing threats to surface and groundwater is scheduled to occur by 2025.
STS060-103-089 (3-11 Feb. 1994) --- The Chicago, Illinois area is in this northeast looking low oblique view obtained in February, 1994. Lake Michigan, a good portion covered with ice due to the very cold winter weather that has plagued this region since early December, 1993, can be seen to the east of the city. The Des Plaines river is visible traversing northeast to southwest through the center of the city. O'Hare International Airport and the Glenview Naval Air Station can be seen to the north of the Des Plaines River. Midway Airport is visible just to the south of the river. Chicago is a port of entry; a major Great Lakes port located at the junction of the St. Lawrence Seaway with the Mississippi River system; the busiest air center in the United States; and an important rail and highway transportation hub. Chicago is known for large grain mills and elevators, iron and steel works, steel fabrication plants, stockyards, meat-packing establishments, and printing and publishing houses. In the early days of settlement, the narrow watershed between Lake Michigan and the Des Plaines River (draining the Mississippi River through the Illinois River), offered an easy portage that led explorers like Father Marquette and Louis Joliet and others to the Great Central Plains. Fort Dearborn, a military post was established in 1803. By 1860, the railroad connected Chicago to the rest of the country and the city became a great mid-continent shipping and receiving center. In 1871, the city built of wood, was almost entirely destroyed by a great fire. After the fire, Chicago was built as a city of steel and stone. During the World's Colombian Exposition held in Chicago in 1893, the city became a leading architectural center. It was here during the Exposition that the skyscraper came into being. Chicago continues to lead the way in this type of architectural structure as is evidenced with the completion of the Sears Tower in 1974.
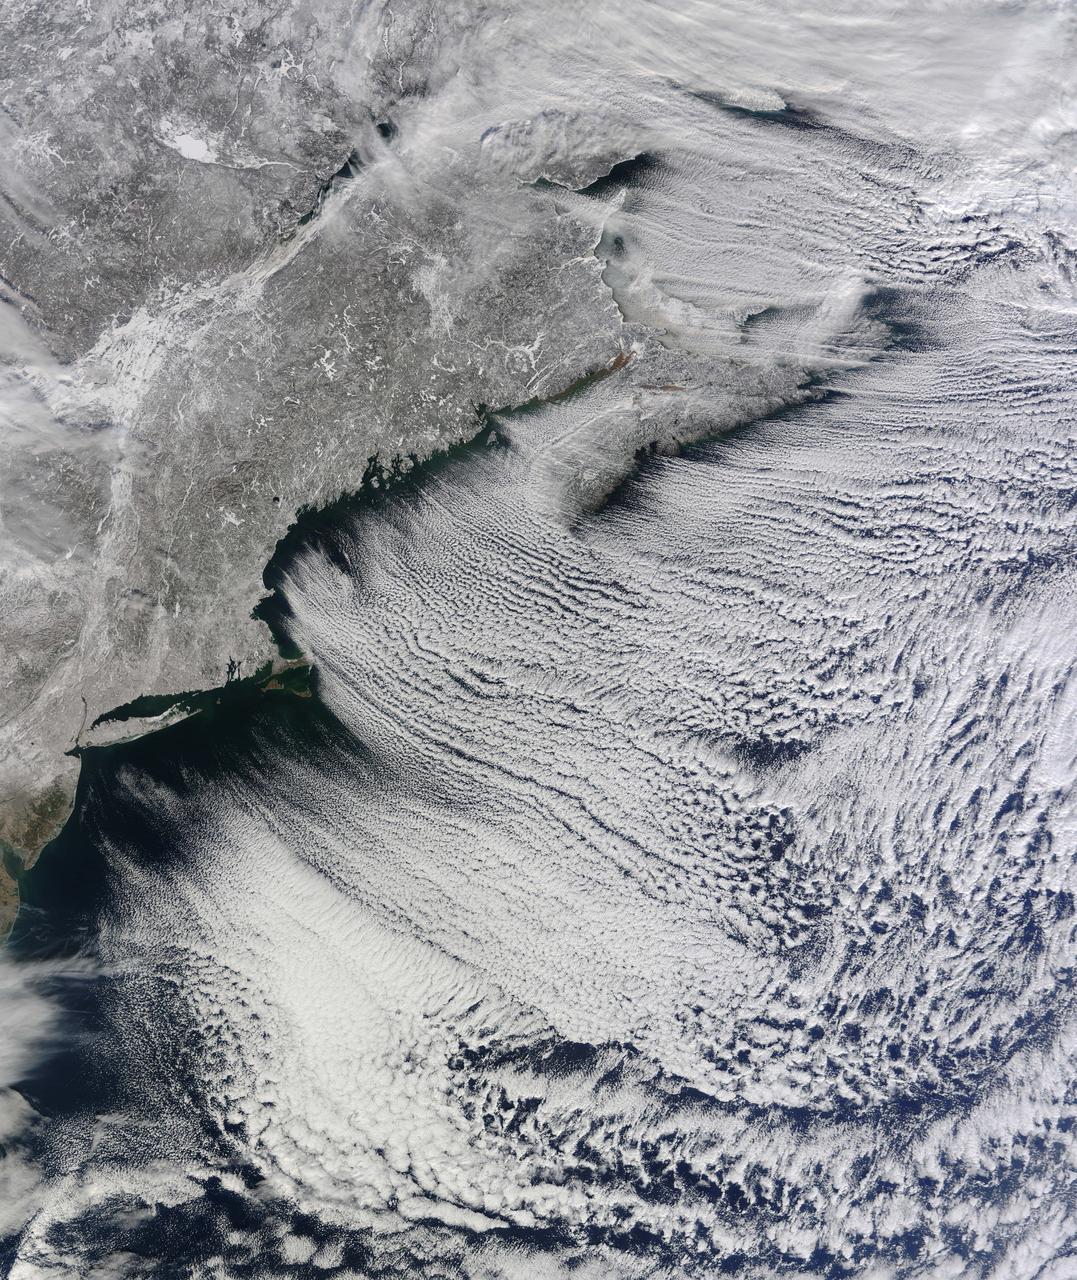
NASA image acquired January 24, 2011 What do you get when you mix below-freezing air temperatures, frigid northwest winds from Canada, and ocean temperatures hovering around 39 to 40 degrees Fahrenheit (4 to 5 degrees Celsius)? Paved highways of clouds across the skies of the North Atlantic. The Moderate Resolution Imaging Spectroradiometer (MODIS) on NASA’s Terra satellite collected this natural-color view of New England, the Canadian Maritimes, and coastal waters at 10:25 a.m. U.S. Eastern Standard Time on January 24, 2011. Lines of clouds stretch from northwest to southeast over the North Atlantic, while the relatively cloudless skies over land afford a peek at the snow that blanketed the Northeast just a few days earlier. Cloud streets form when cold air blows over warmer waters, while a warmer air layer—or temperature inversion—rests over top of both. The comparatively warm water of the ocean gives up heat and moisture to the cold air mass above, and columns of heated air—thermals—naturally rise through the atmosphere. As they hit the temperature inversion like a lid, the air rolls over like the circulation in a pot of boiling water. The water in the warm air cools and condenses into flat-bottomed, fluffy-topped cumulus clouds that line up parallel to the wind. Though they are easy to explain in a broad sense, cloud streets have a lot of mysteries on the micro scale. A NASA-funded researcher from the University of Wisconsin recently observed an unusual pattern in cloud streets over the Great Lakes. Cloud droplets that should have picked up moisture from the atmosphere and grown in size were instead shrinking as they moved over Lake Superior. Read more in an interview at What on Earth? NASA image by Jeff Schmaltz, MODIS Rapid Response Team, Goddard Space Flight Center. Caption by Michael Carlowicz. Instrument: Terra - MODIS Credit: <b><a href="http://www.earthobservatory.nasa.gov/" rel="nofollow"> NASA Earth Observatory</a></b> <b><a href="http://www.nasa.gov/centers/goddard/home/index.html" rel="nofollow">NASA Goddard Space Flight Center</a></b> enables NASA’s mission through four scientific endeavors: Earth Science, Heliophysics, Solar System Exploration, and Astrophysics. Goddard plays a leading role in NASA’s accomplishments by contributing compelling scientific knowledge to advance the Agency’s mission. <b>Follow us on <a href="http://twitter.com/NASA_GoddardPix" rel="nofollow">Twitter</a></b> <b>Join us on <a href="http://www.facebook.com/pages/Greenbelt-MD/NASA-Goddard/395013845897?ref=tsd" rel="nofollow">Facebook</a></b>
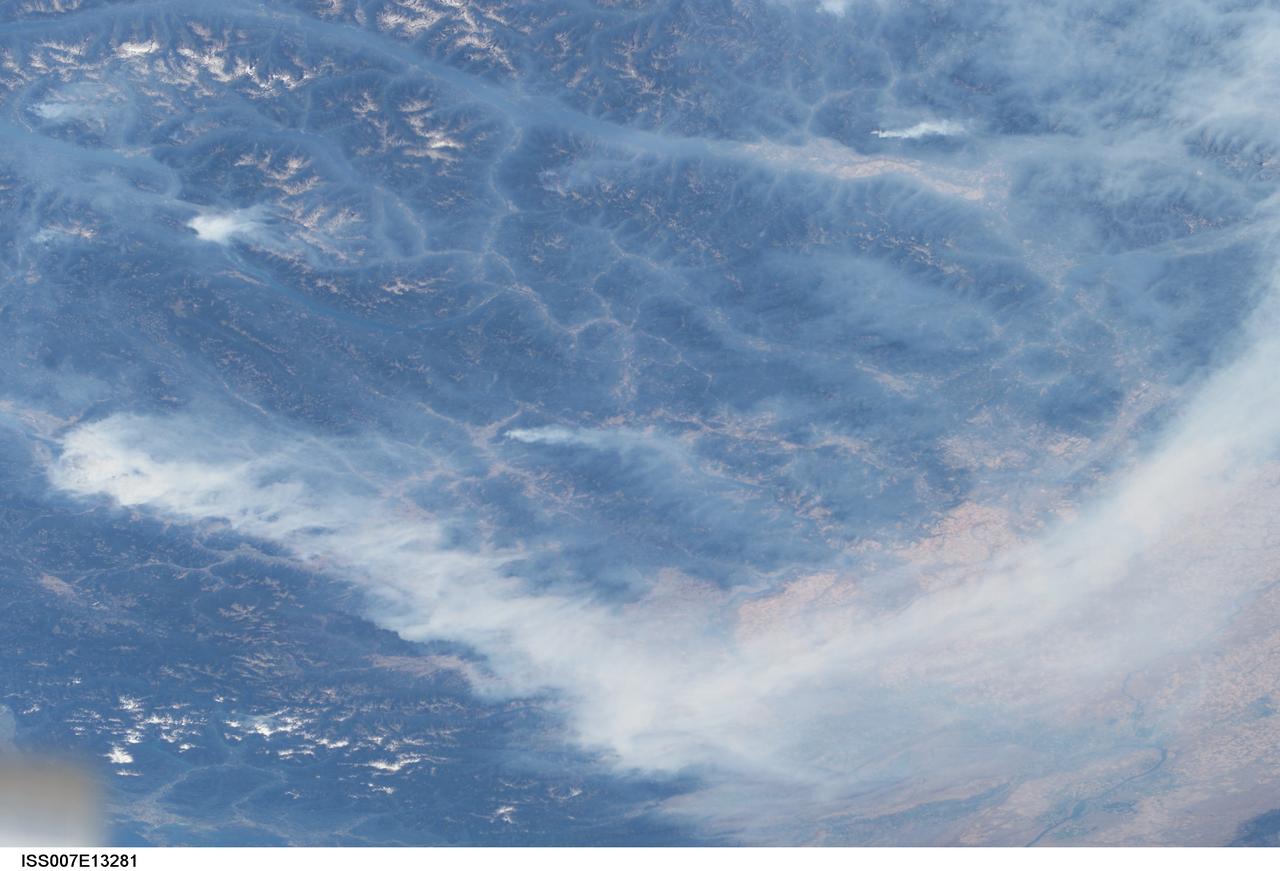
ISS007-E-13281 (20 August 2003) --- This view features forest fires in the Canadian province of British Columbia where some 620,000 acres of forest were consumed in almost 2,500 fires. Here the Rocky Mountains have both lofty, snow-capped peaks and long, narrow valleys that create special conditions and problems with air quality from these smoky fires. This image taken by one of the Expedition 7 crewmembers onboard the International Space Station (ISS) illustrates how smoke has become trapped in valleys where light winds and cold air drainage from the higher elevations have created temperature inversions. Note how the snowy peaks of the mountains are relatively smoke-free while the long, north-south valleys of Kootenay Lake and Columbia River are filled with trapped aerosols from the plumes of the large fires situated in the southwest. Meanwhile shifting winds have now swept the bulk of the plumes southeastward over the Columbia River Basin of Washington.
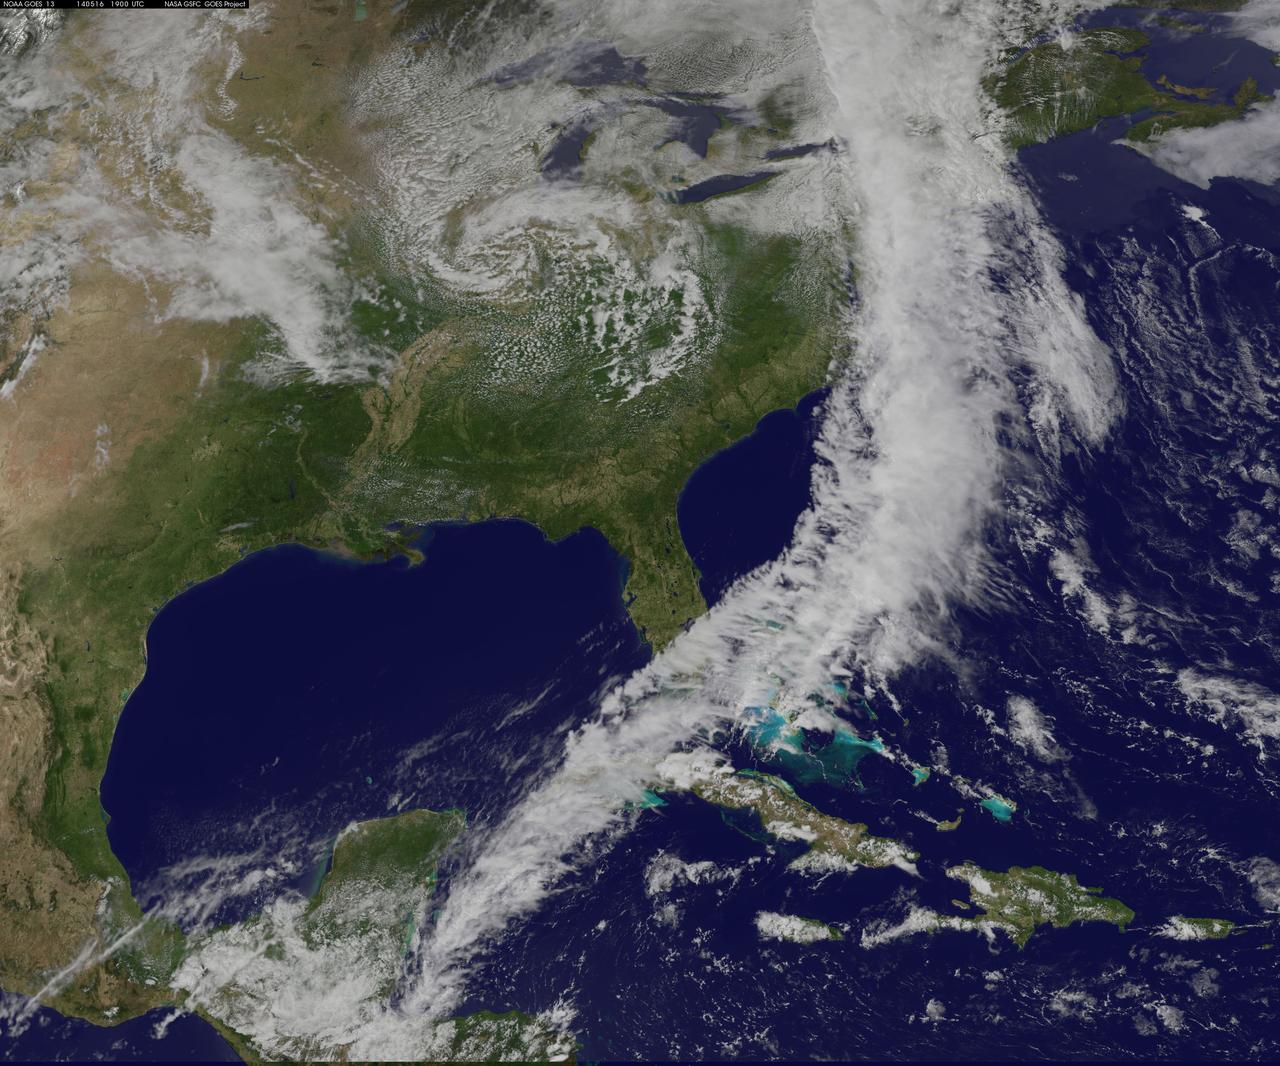
NOAA's GOES-East satellite captured an image of a powerful cold front that triggered flash flood watches and warnings along the U.S. East Coast on May 16. NOAA's National Weather Service noted flash flooding was possible from New England into eastern North Carolina today, May 16. The clouds associated with the long cold front was captured using visible data from NOAA's GOES-East or GOES-13 satellite on at 1900 UTC (3:00 p.m. EDT) and was made into an image by NASA/NOAA's GOES Project at NASA's Goddard Space Flight Center in Greenbelt, Md. The clouds stretched from Maine south through the Mid-Atlantic down to southern Florida with a tail of clouds extending into the western Caribbean Sea. South of Lake Michigan the rounded swirl of clouds indicates another low pressure system. GOES satellites provide the kind of continuous monitoring necessary for intensive data analysis. Geostationary describes an orbit in which a satellite is always in the same position with respect to the rotating Earth. This allows GOES to hover continuously over one position on Earth's surface, appearing stationary. As a result, GOES provide a constant vigil for the atmospheric "triggers" for severe weather conditions such as tornadoes, flash floods, hail storms and hurricanes. For updated information about the storm system, visit NOAA's National Weather Service website: <a href="http://www.weather.gov" rel="nofollow">www.weather.gov</a> For more information about GOES satellites, visit: <a href="http://www.goes.noaa.gov/" rel="nofollow">www.goes.noaa.gov/</a> or <a href="http://goes.gsfc.nasa.gov/" rel="nofollow">goes.gsfc.nasa.gov/</a> Rob Gutro NASA's Goddard Space Flight Center <b><a href="http://www.nasa.gov/audience/formedia/features/MP_Photo_Guidelines.html" rel="nofollow">NASA image use policy.</a></b> <b><a href="http://www.nasa.gov/centers/goddard/home/index.html" rel="nofollow">NASA Goddard Space Flight Center</a></b> enables NASA’s mission through four scientific endeavors: Earth Science, Heliophysics, Solar System Exploration, and Astrophysics. Goddard plays a leading role in NASA’s accomplishments by contributing compelling scientific knowledge to advance the Agency’s mission. <b>Follow us on <a href="http://twitter.com/NASAGoddardPix" rel="nofollow">Twitter</a></b> <b>Like us on <a href="http://www.facebook.com/pages/Greenbelt-MD/NASA-Goddard/395013845897?ref=tsd" rel="nofollow">Facebook</a></b> <b>Find us on <a href="http://instagram.com/nasagoddard?vm=grid" rel="nofollow">Instagram</a></b>
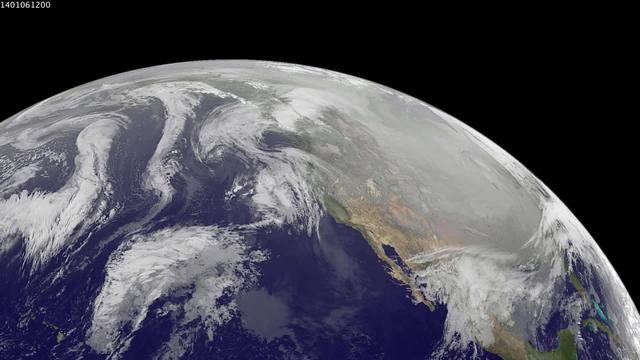
1-9 January 2014. The full-disk images every 3 hours from GOES-WEST capture the sweep of a polar vortex that emerged from the arctic at the beginning of the new year, pushing a blizzard into the northeastern USA on January 3, followed by extensive bitter cold (-20 F, windchill -50 F) around the Great Lakes, and single digit temperatures as far south as Atlanta, Georgia. This western viewpoint displays the persistent flow of arctic air from northern Alaska and Yukon into North America. <b><a href="http://goes.gsfc.nasa.gov/" rel="nofollow">Credit: NOAA/NASA GOES Project</a></b> <b><a href="http://www.nasa.gov/audience/formedia/features/MP_Photo_Guidelines.html" rel="nofollow">NASA image use policy.</a></b> <b><a href="http://www.nasa.gov/centers/goddard/home/index.html" rel="nofollow">NASA Goddard Space Flight Center</a></b> enables NASA’s mission through four scientific endeavors: Earth Science, Heliophysics, Solar System Exploration, and Astrophysics. Goddard plays a leading role in NASA’s accomplishments by contributing compelling scientific knowledge to advance the Agency’s mission. <b>Follow us on <a href="http://twitter.com/NASA_GoddardPix" rel="nofollow">Twitter</a></b> <b>Like us on <a href="http://www.facebook.com/pages/Greenbelt-MD/NASA-Goddard/395013845897?ref=tsd" rel="nofollow">Facebook</a></b> <b>Find us on <a href="http://instagram.com/nasagoddard?vm=grid" rel="nofollow">Instagram</a></b>

The GOES-East satellite captured a Midwestern wintertime "White Out" at 2015 UTC/3:15 p.m. EST on January 6, 2014. Blowing snow and intensely cold air created dangerous white-out conditions over the Midwest, particularly around the Great Lakes, where daytime temperatures averaged -20F with a wind chill near -50F. The GOES-East satellite is managed by NOAA. The image was created at NASA's GOES Project at NASA's Goddard Space Flight Center, Greenbelt, Md. Credit: NASA NOAA GOES Project, Dennis Chesters <b><a href="http://www.nasa.gov/audience/formedia/features/MP_Photo_Guidelines.html" rel="nofollow">NASA image use policy.</a></b> <b><a href="http://www.nasa.gov/centers/goddard/home/index.html" rel="nofollow">NASA Goddard Space Flight Center</a></b> enables NASA’s mission through four scientific endeavors: Earth Science, Heliophysics, Solar System Exploration, and Astrophysics. Goddard plays a leading role in NASA’s accomplishments by contributing compelling scientific knowledge to advance the Agency’s mission. <b>Follow us on <a href="http://twitter.com/NASA_GoddardPix" rel="nofollow">Twitter</a></b> <b>Like us on <a href="http://www.facebook.com/pages/Greenbelt-MD/NASA-Goddard/395013845897?ref=tsd" rel="nofollow">Facebook</a></b> <b>Find us on <a href="http://instagram.com/nasagoddard?vm=grid" rel="nofollow">Instagram</a></b>

Craig R. Bomben became a pilot in the Flight Crew Branch of NASA's Dryden Flight Research Center, Edwards, Calif., in June 2001. His flying duties include a variety of research and support activities while piloting the F/A-18, DC-8, T-34C and King Air aircraft. He has more than 17 years and 3,800 hours of military and civilian flight experience in over 50 different aircraft types. Bomben came to NASA Dryden from a U.S. Navy assignment to the Personnel Exchange Program, Canada. He served as a test pilot in the Canadian Armed Forces located in Cold Lake, Alberta. He participated in numerous developmental programs to include CT-133 airborne ejection seat testing, F/A-18 weapons flutter testing and F/A-18 night vision goggles integration. Bomben performed U.S. Navy fleet service in 1995 as a strike-fighter department head. He completed two overseas deployments onboard the USS George Washington and USS Stennis. As a combat strike leader, he headed numerous multi-national missions over Iraq in support of Operation Southern Watch. Bomben graduated from the U.S. Naval Test Pilot School in 1992 and was subsequently assigned to the Naval Weapons Test Squadron at Pt. Mugu, Calif. During this tour he developed the F-14D bombsight and worked on various other F-14D and F/A-18 weapon systems developmental programs. Bomben is a 1985 graduate of Washington State University with a bachelor of science degree in electrical engineering. He graduated from naval flight training in 1987 and was recognized as a Commodore List graduate. His first assignment was to Naval Air Station Pensacola, Fla., where he was an instructor in the T-2B Buckeye. When selected to fly the F/A-18 in 1989, he joined a fleet squadron and deployed aboard the USS Forrestal. Bomben is married to the former Aissa Asuncion. They live in Lancaster, Calif., with their 3 children.

NOAA's GOES-14 satellite captured a visible image of a low pressure area that will affect the Mid-Atlantic, Ohio Valley and northeast over the next couple of days. The low pressure area, the rounded area of clouds near southern Louisiana, is now moving in a northerly direction from the Gulf coast, and will track northward to the Great Lakes, passing west of the Mid-Atlantic region and bringing clouds and showers. It's associated warm front will also move up the U.S. East coast bringing a surge of warmth before a cold front sweeps in from the west. The clouds draped across the Mid-Atlantic today, Oct. 1, are from an area of low pressure and trailing frontal boundary located over the Atlantic Ocean just off the North Carolina coast and stretching back to the Gulf low. The image was created at NASA's Goddard Space Flight Center in Greenbelt, Md. by the NASA GOES Project. Credit: NASA GOES Project <b><a href="http://www.nasa.gov/audience/formedia/features/MP_Photo_Guidelines.html" rel="nofollow">NASA image use policy.</a></b> <b><a href="http://www.nasa.gov/centers/goddard/home/index.html" rel="nofollow">NASA Goddard Space Flight Center</a></b> enables NASA’s mission through four scientific endeavors: Earth Science, Heliophysics, Solar System Exploration, and Astrophysics. Goddard plays a leading role in NASA’s accomplishments by contributing compelling scientific knowledge to advance the Agency’s mission. <b>Follow us on <a href="http://twitter.com/NASA_GoddardPix" rel="nofollow">Twitter</a></b> <b>Like us on <a href="http://www.facebook.com/pages/Greenbelt-MD/NASA-Goddard/395013845897?ref=tsd" rel="nofollow">Facebook</a></b> <b>Find us on <a href="http://instagrid.me/nasagoddard/?vm=grid" rel="nofollow">Instagram</a></b>
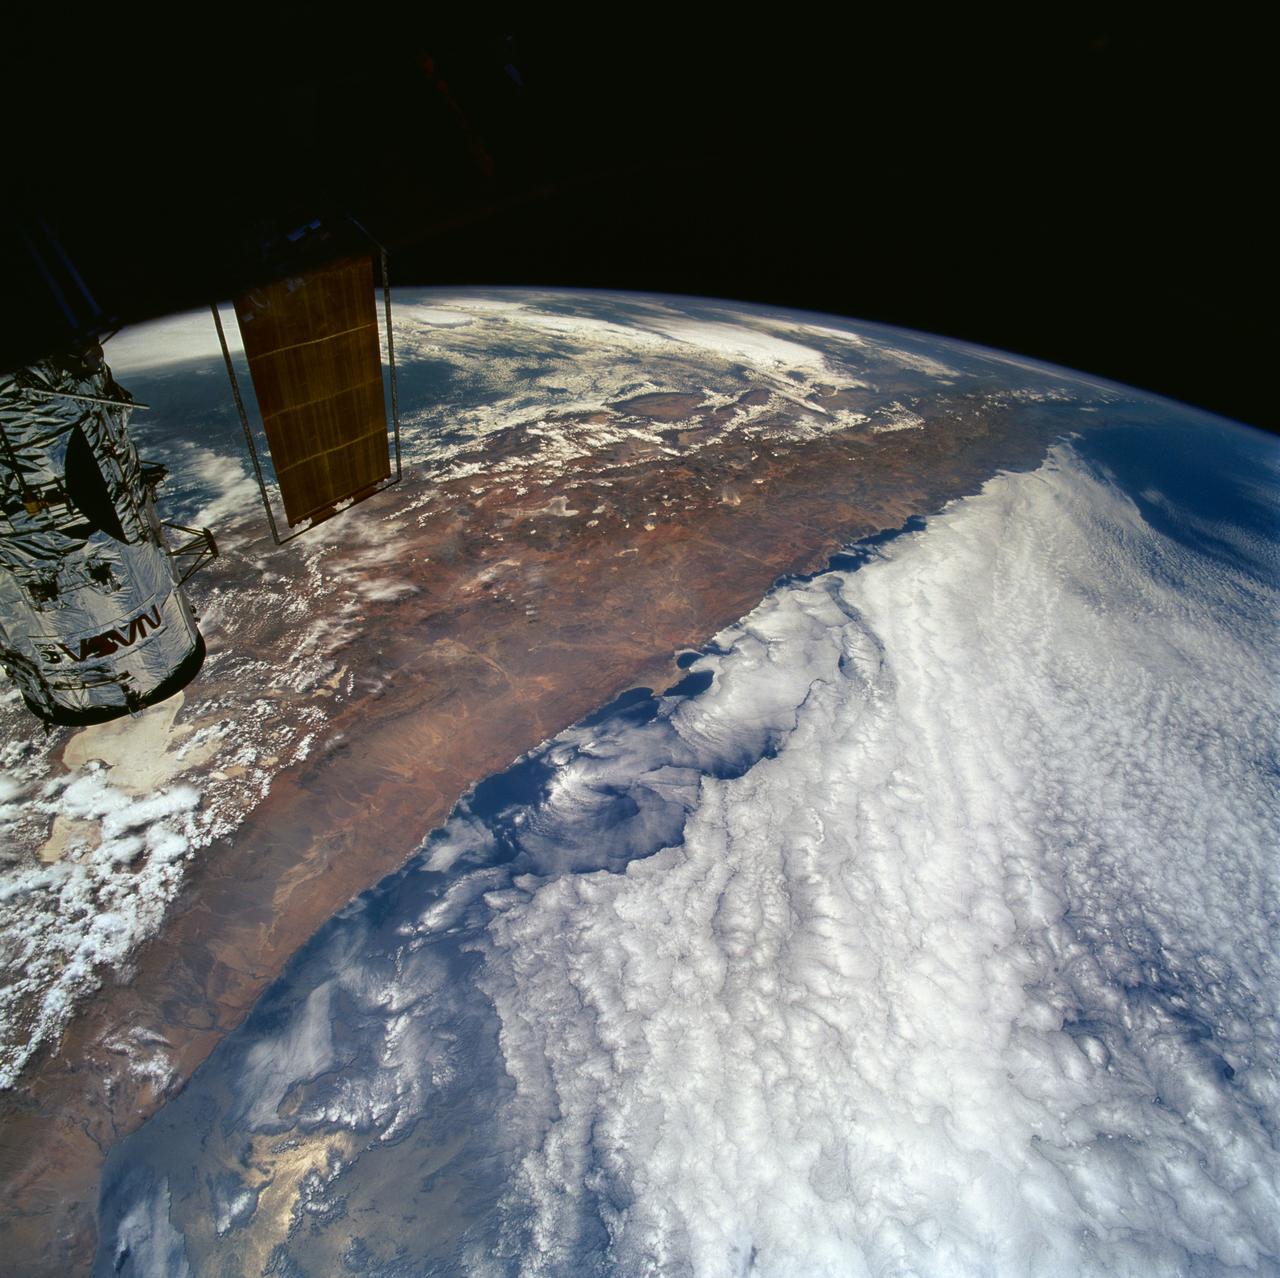
STS061-101-023 (8 Dec 1993) --- This color photograph is a spectacular, panoramic (southeastern view) shot that features the northern half of the country of Chile and the Andes Mountains of South America. The Atacama Desert, one of the driest regions on earth, is clearly visible along the northern Chilean coast. This desert extends from roughly Arica in the north to the city of Caldera in the south, a distance of six hundred miles. Some parts of this very arid region go for more than twenty years without measurable precipitation. It is an area of dramatic and abrupt elevation changes. For example, from the waters edge there is an escarpment of the coastal plateau that rises like an unbroken wall two or three thousand feet above the Pacific Ocean. From the coastal plateau, there is an even more dramatic increase in elevation -- from two thousand feet above sea level to an average elevation of thirteen thousand feet above sea level in the Bolivian Altiplano. This elevation change occurs within a one hundred to two hundred mile distance from the Pacific Ocean. The north-south trending spine of the Andes Mountains can be seen on this photograph. Several of the volcanic peaks in this mountain chain exceed 20,000 feet above sea level. Interspersed with these volcanic peaks, numerous dry lake beds (salars) can be seen as highly reflective surfaces. The largest of these salars (Salar de Uyuni) is visible at the edge of the Hubble Space Telescope (HST). Offshore, the cold Peruvian current produces low stratus clouds that can be found along this coastline at certain times of the year. This is the same type of meteorological phenomena that is found along the southern California coast and the Skeleton coast of southwestern Africa.
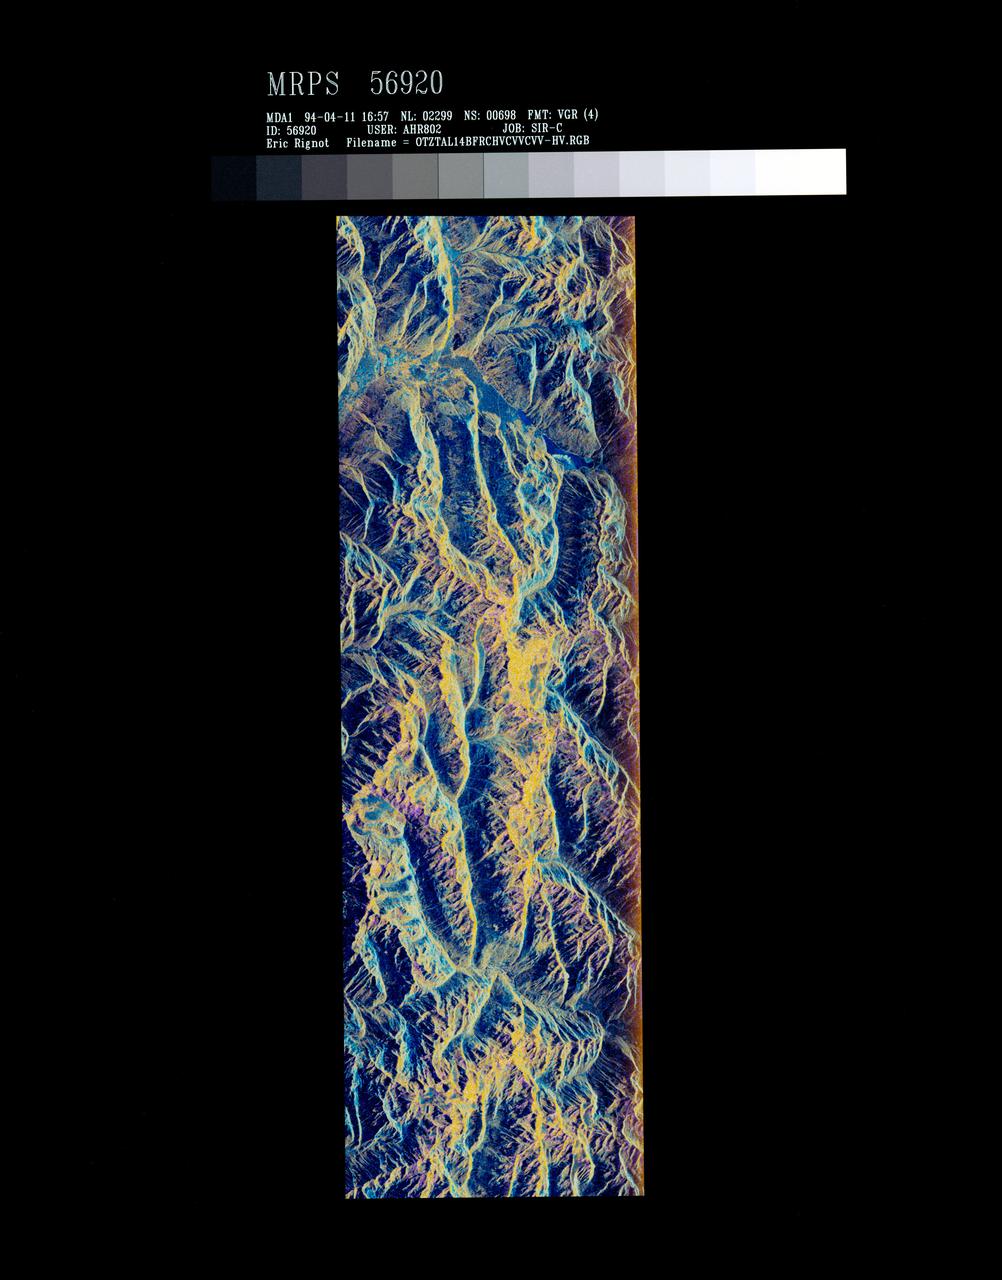
STS059-S-072 (13 April 1994) --- This image is a false-color composite of Oetztal, Austria located in the Central Alps, centered at 46.8 degrees north latitude, and 10.70 degrees east longitude, at the border between Switzerland (top), Italy (left) and Austria (right and bottom). The area shown is 50 kilometers (30 miles) south of Innsbruck, Austria. This image was acquired by the Spaceborne Imaging Radar-C and X-Band Synthetic Aperture Radar (SIR-C/X-SAR) aboard the Space Shuttle Endeavour on its 14th orbit. Oetztal is a SIR-C/X-SAR hydrology supersite. Approximately one quarter of this image is covered by glaciers, the largest of which, Gepatschferner, is visible as a triangular yellow patch in the center of the scene. The summits of the main peaks reach elevations between 3,500 and 3,768 meters (11,500 and 12,362 feet) above sea level. The tongues of the glaciers are descending from elevated plateaus down into narrow valleys which were formed during the last ice age. This color image was produced in C-Band using multi-polarization information (Red=CHV, Green=CVV, Blue=CVV/CHV). The blue areas are lakes (Gepatsch Dam at center right; Lake Muta at top right) and glacier ice. The yellow areas are slopes facing the radar and areas of dry snow. Purple corresponds to slopes facing away from the radar. Yellow in the valley bottom corresponds to tree covered areas. There is 30 to 50 centimeters (12 to 20 inches) of dry, fresh snow on the glaciers, and about 10 centimeters (4 inches) in the valley at the city of Vent, Austria (center). At these data were taken, the weather was cold, with snow and thick fog. The entire area would appear white to an optical sensor because it is all covered under a winter snowpack. Researchers are interested in Oetztal because knowing how glaciers shrink and grow over time is an important indication of climatic change. SIR-C/X-SAR is part of NASA's Mission to Planet Earth (MTPE). SIR-C/X-SAR radars illuminate Earth with microwaves allowing detailed observations at any time, regardless of weather or sunlight conditions. SIR-C/X-SAR uses three microwave wavelengths: L-Band (24 cm), C-Band (6 cm), and X-Band (3 cm). The multi-frequency data will be used by the international scientific community to better understand the global environment and how it is changing. The SIR-C/X-SAR data, complemented by aircraft and ground studies, will give scientists clearer insights into those environmental changes which are caused by nature and those changes which are induced by human activity. SIR-C was developed by NASA's Jet Propulsion Laboratory (JPL). X-SAR was developed by the Dornire and Alenia Spazio Companies for the German Space Agency, Deutsche Agentur fuer Raumfahrtangelegenheiten (DARA), and the Italian Space Agency, Agenzia Spaziale Italiana (ASI). JPL Photo ID: P-43890
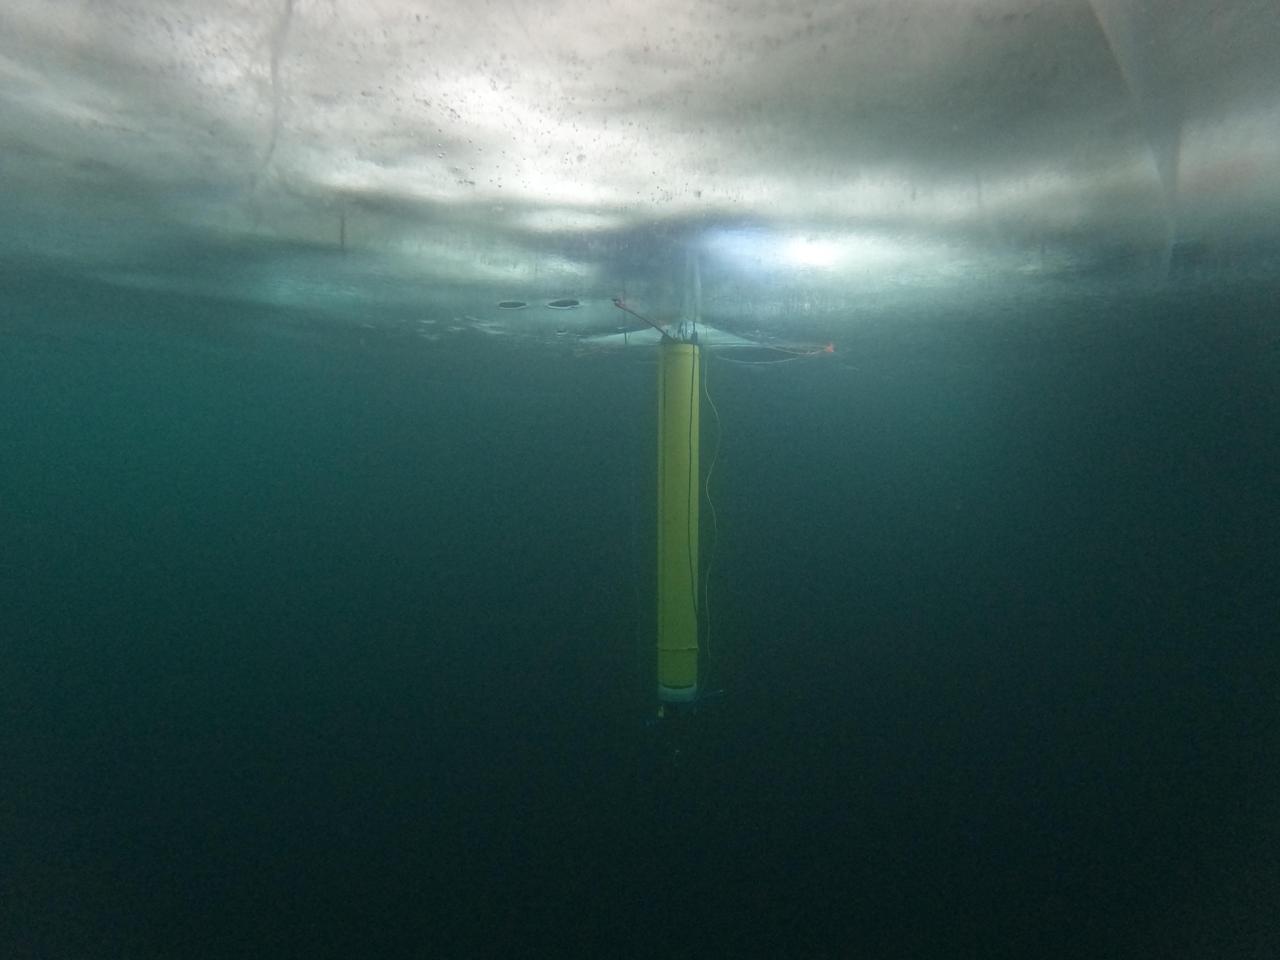
A prototype of an autonomous robot, part of a project called IceNode being developed at NASA's Jet Propulsion Laboratory, is seen from beneath the frozen surface of Lake Superior, off Michigan's Upper Peninsula. The three thin legs of the robot's "landing gear" affix it to the icy ceiling. A remote camera captured the image during a field test in 2022. The IceNode project envisions a fleet of such robots to venture beneath Antarctic ice shelves and gather data that would help scientists calculate how rapidly the ice shelves there are melting – and how fast that melting could cause global sea levels to rise. Each about 8 feet (2.4 meters) long and 10 inches (25 centimeters) in diameter, the robots use three-legged "landing gear" that springs out from one end to attach the robot to the underside of the ice. Rather than using propulsion, the robots would autonomously position themselves with the help of novel algorithms based on models of ocean currents. Released from a borehole or a vessel in the open ocean, the robots would ride those currents on a long journey beneath an ice shelf. They would target the underwater area known as the "grounding zone," where floating ice shelves, ocean, and land meet, deep inside unmapped cavities where the ice may be melting the fastest. Each robot would detach a ballast and rise up to affix itself to the underside of the ice, where their suite of sensors would measure how fast warm, salty ocean water is circulating up to melt the ice, and how quickly cold meltwater is sinking. As conceived, the IceNode fleet would operate for up to a year, continuously capturing data, including seasonal fluctuations. Then the robots would detach themselves from the ice, drift back out to open ocean, and transmit their data via satellite. This test was conducted through the U.S. Navy Arctic Submarine Laboratory's biennial Ice Camp, a three-week operation that provides researchers a temporary base camp from which to conduct field work in the harsh Arctic environment. IceNode has been funded through JPL's internal research and technology development program and its Earth Science and Technology Directorate. JPL is managed for NASA by Caltech in Pasadena, California. https://photojournal.jpl.nasa.gov/catalog/PIA26421
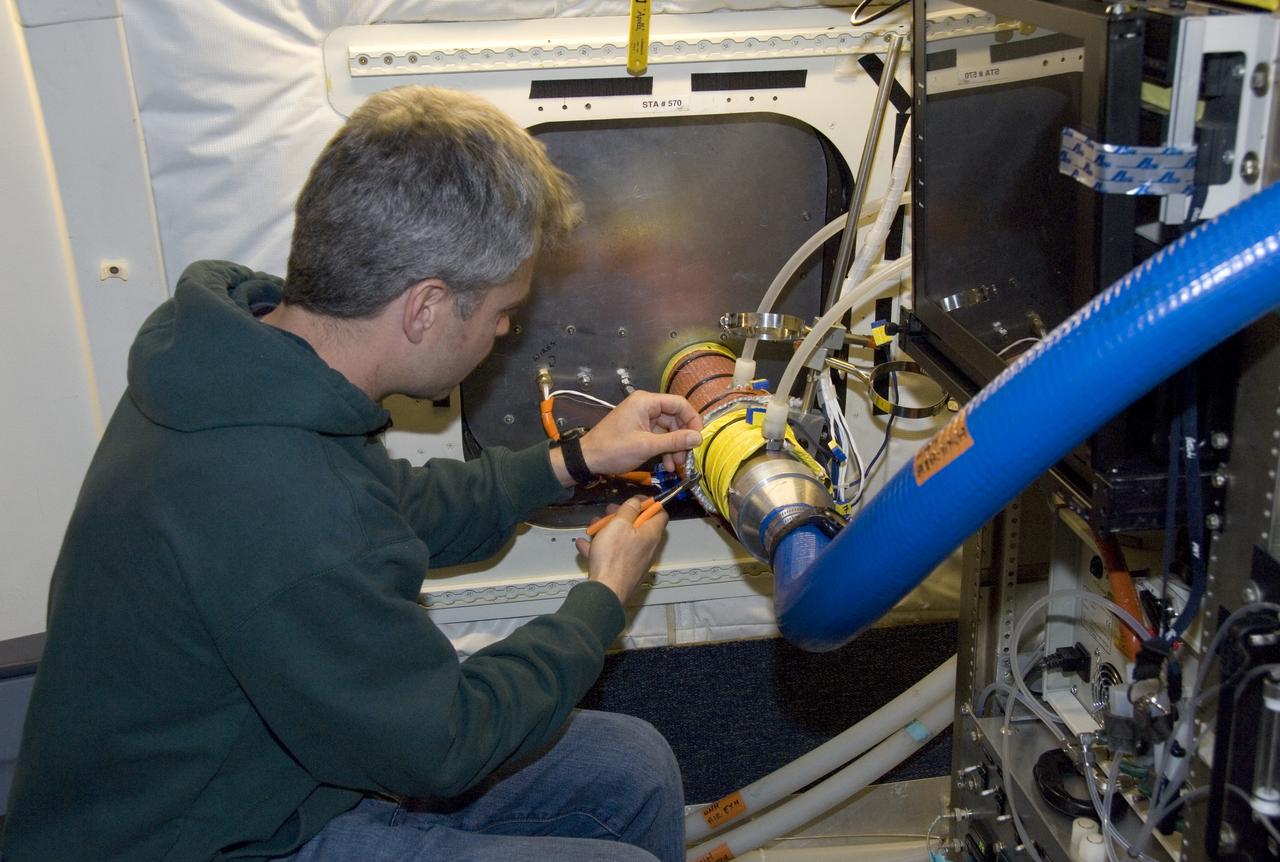
Climate researchers from the National Center for Atmospheric Research (NCAR) and several universities install and perform functional checkouts of a variety of sensitive atmospheric instruments on NASA's DC-8 airborne laboratory prior to beginning the ARCTAS mission.

Climate researchers from the National Center for Atmospheric Research (NCAR) and several universities install and perform functional checkouts of a variety of sensitive atmospheric instruments on NASA's DC-8 airborne laboratory prior to beginning the ARCTAS mission.
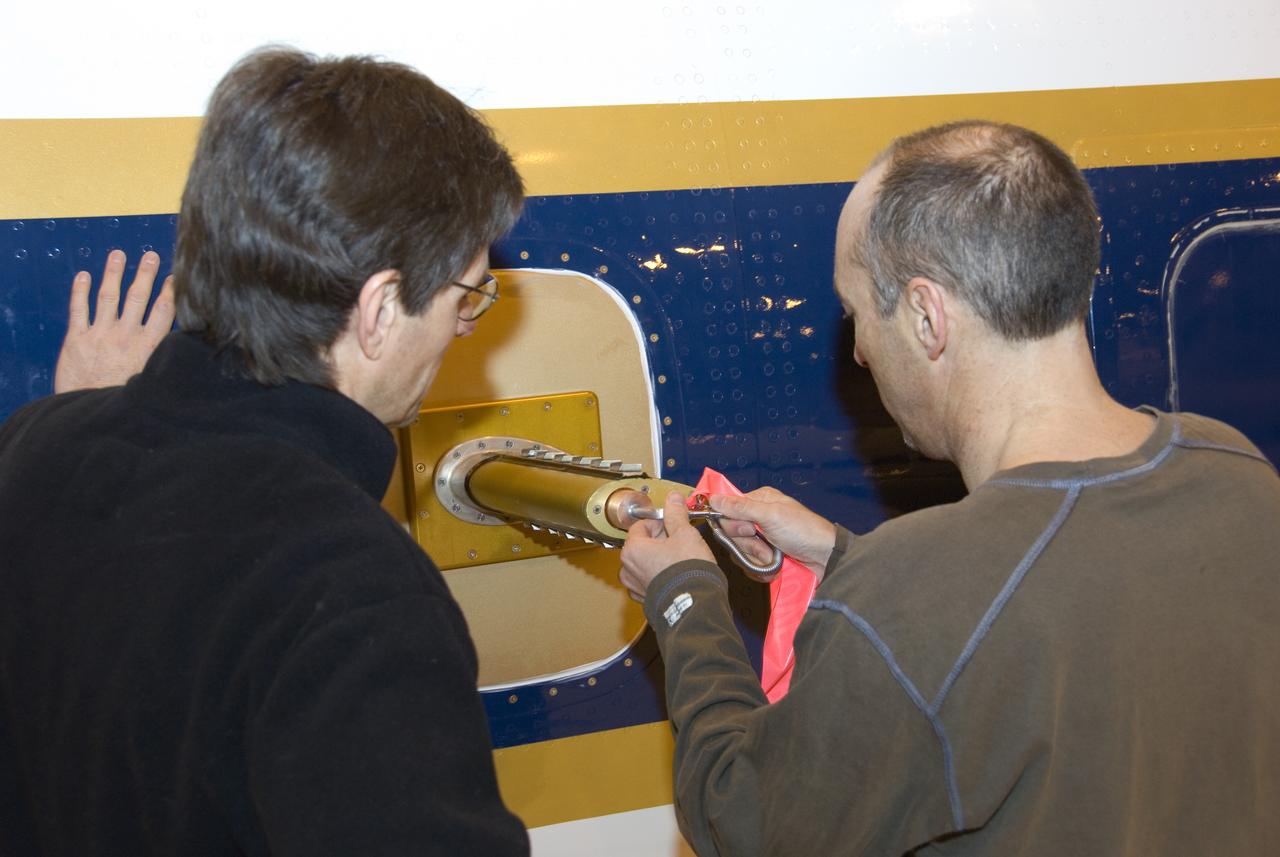
Climate researchers from the National Center for Atmospheric Research (NCAR) and several universities install and perform functional checkouts of a variety of sensitive atmospheric instruments on NASA's DC-8 airborne laboratory prior to beginning the ARCTAS mission.
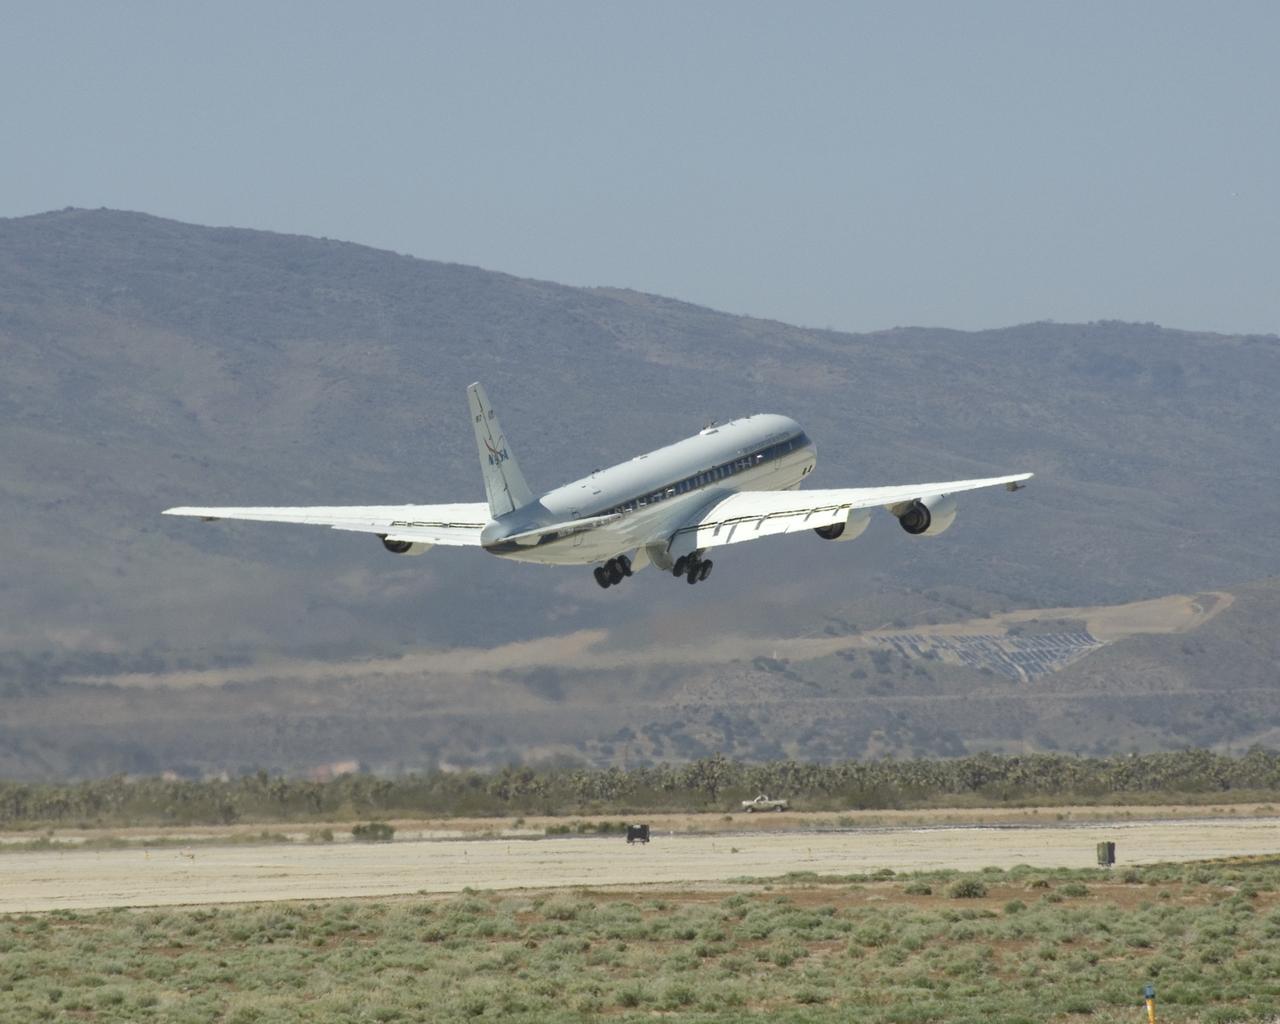
NASA's DC-8 flying laboratory lifts off the runway at Air Force Plant 42 in Palmdale, Calif., on its first flight in the ARCTAS atmospheric science mission.

Climate researchers from the National Center for Atmospheric Research (NCAR) and several universities install and perform functional checkouts of a variety of sensitive atmospheric instruments on NASA's DC-8 airborne laboratory prior to beginning the ARCTAS mission.

Climate researchers from the National Center for Atmospheric Research (NCAR) and several universities install and perform functional checkouts of a variety of sensitive atmospheric instruments on NASA's DC-8 airborne laboratory prior to beginning the ARCTAS mission.
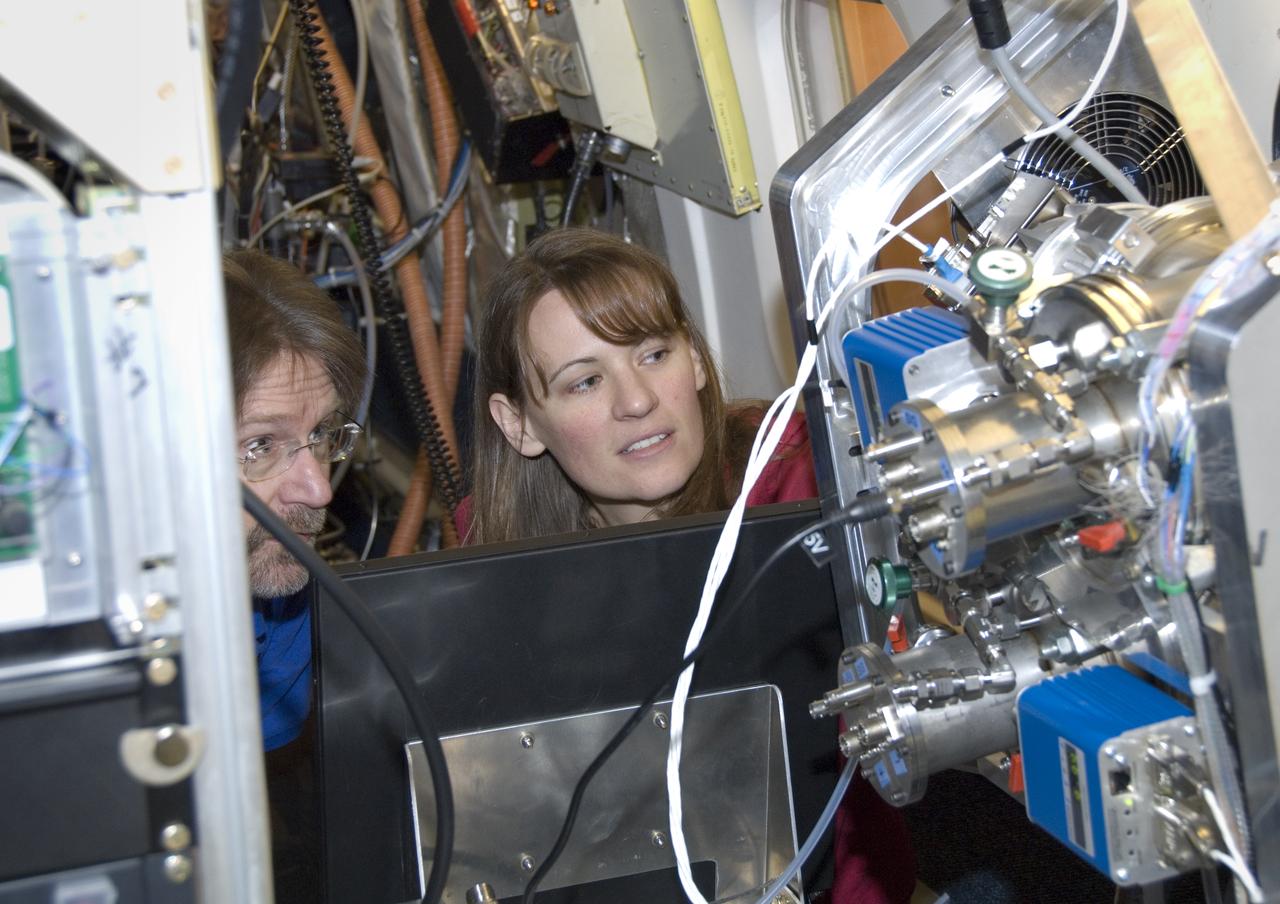
Climate researchers from the National Center for Atmospheric Research (NCAR) and several universities install and perform functional checkouts of a variety of sensitive atmospheric instruments on NASA's DC-8 airborne laboratory prior to beginning the ARCTAS mission.