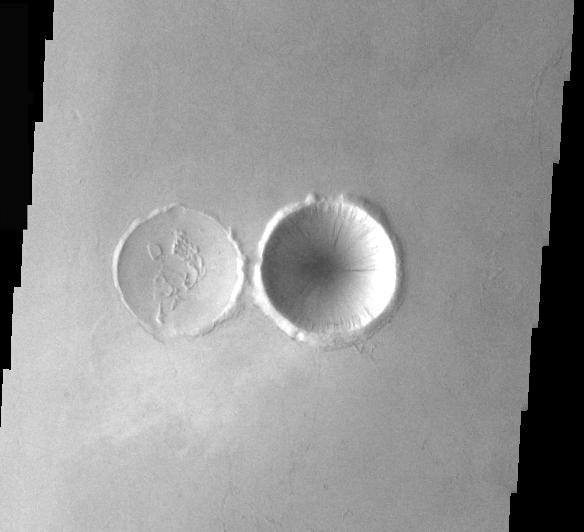
Crater Comparison

Crater Comparison
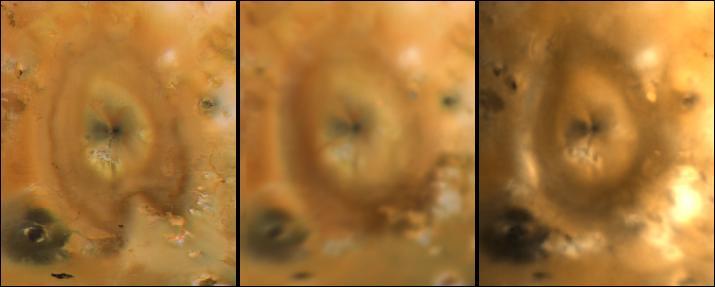
Pele Comparisons Since 1979
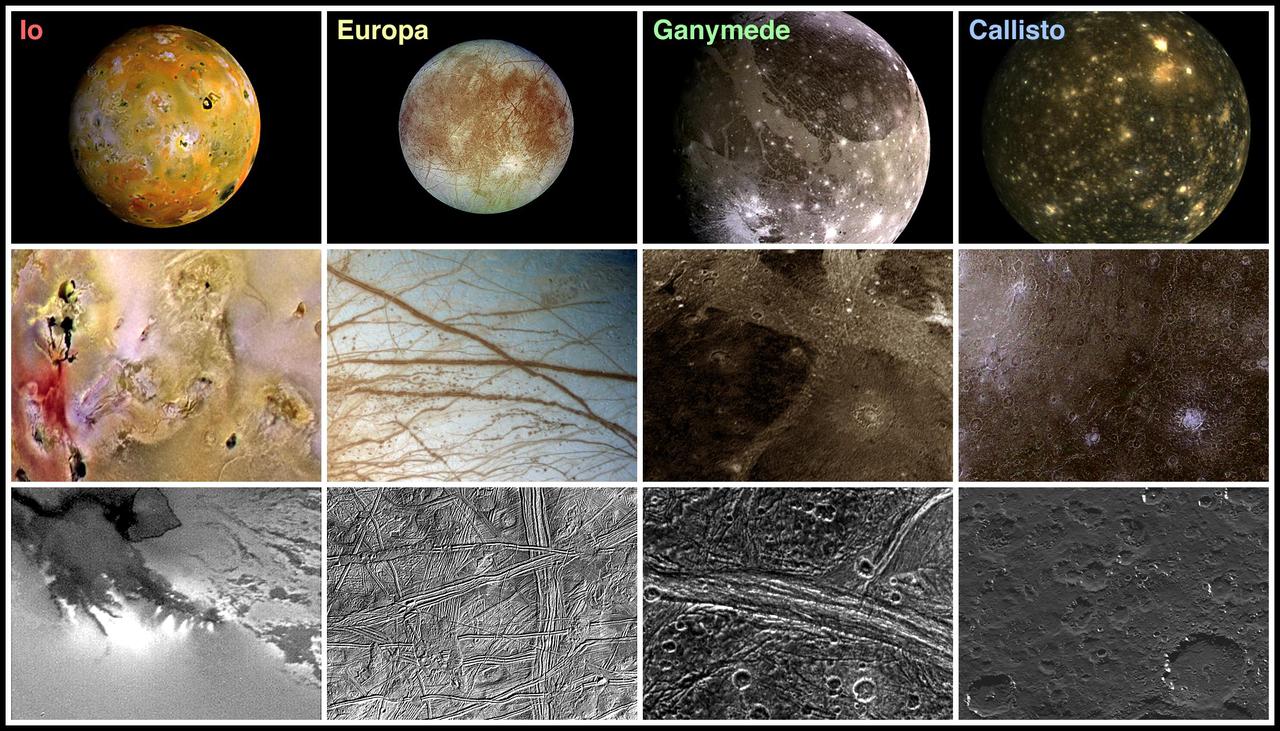
Landscape Comparisons - Galilean Satellites
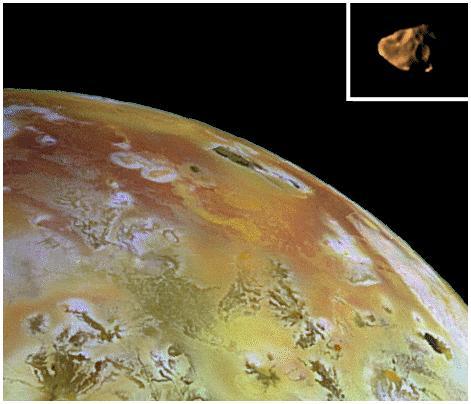
Comparison of Amalthea to Io
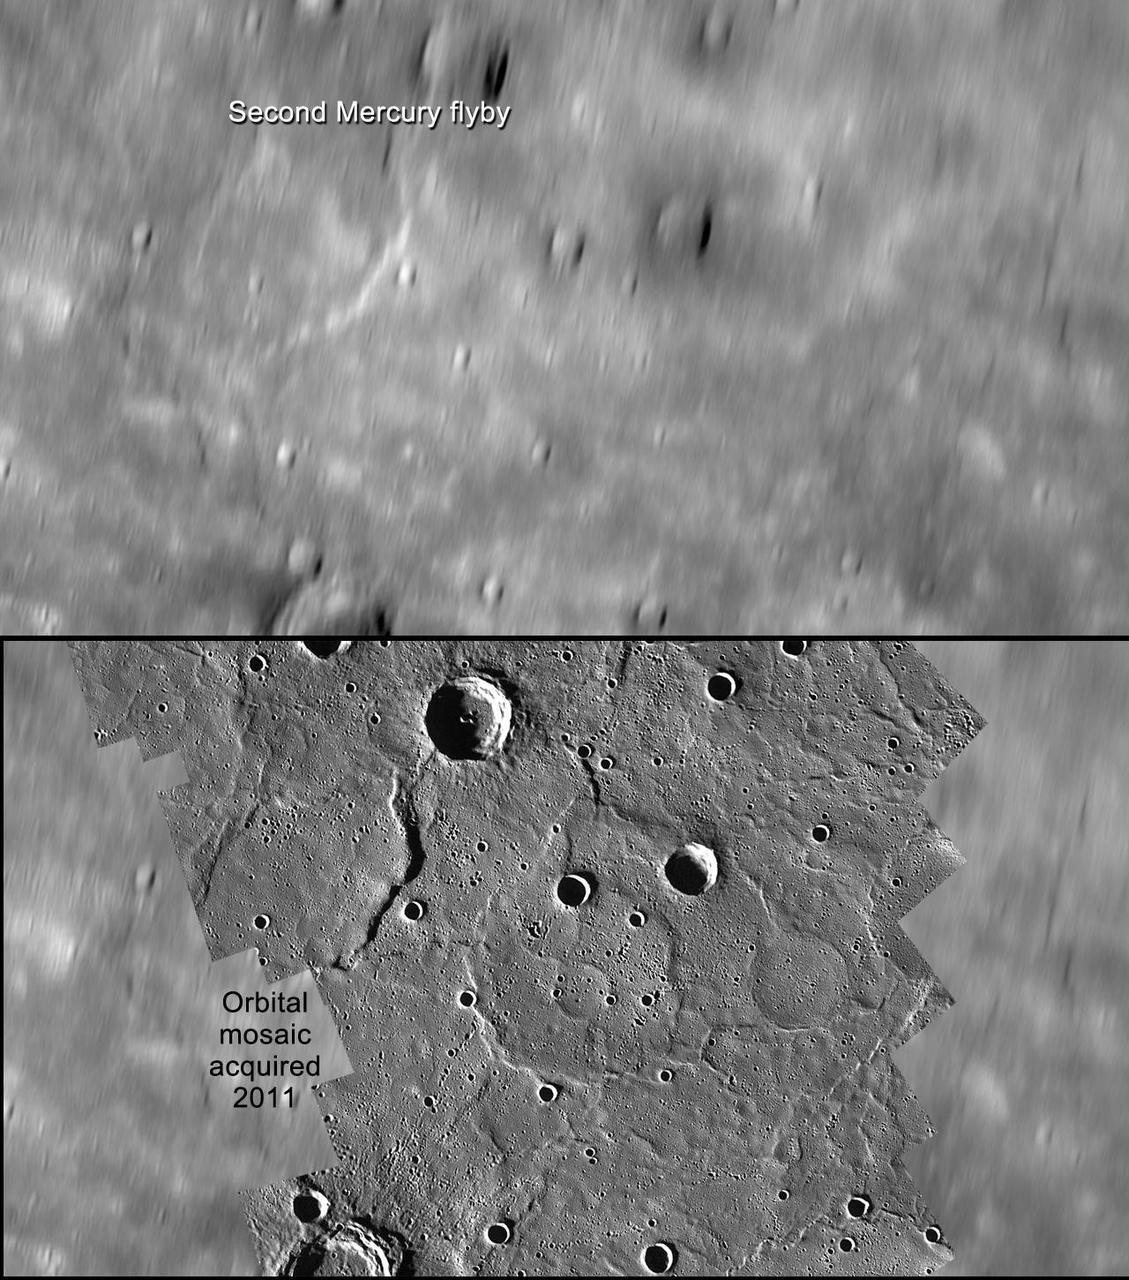
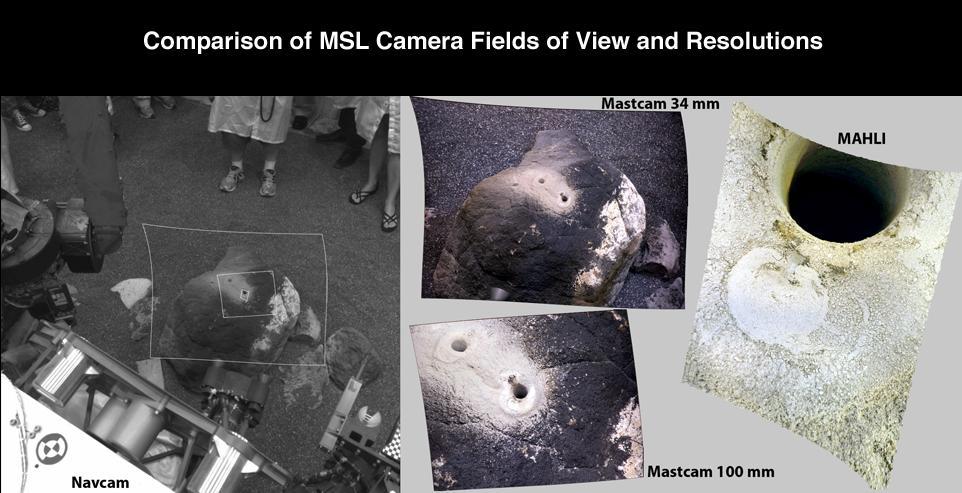
A Comparison of Flyby and Orbital Imaging
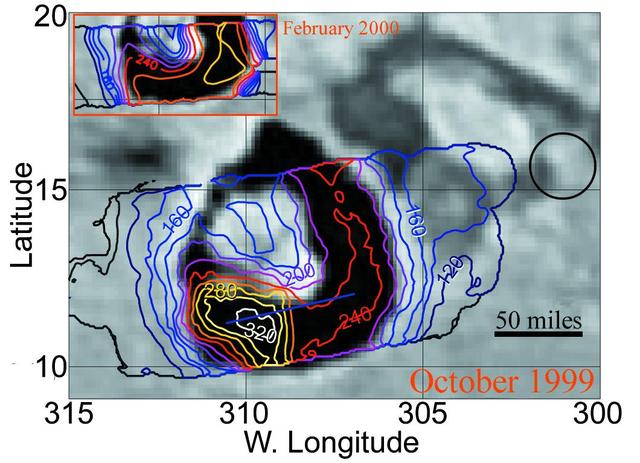
Temperature Comparison at Loki
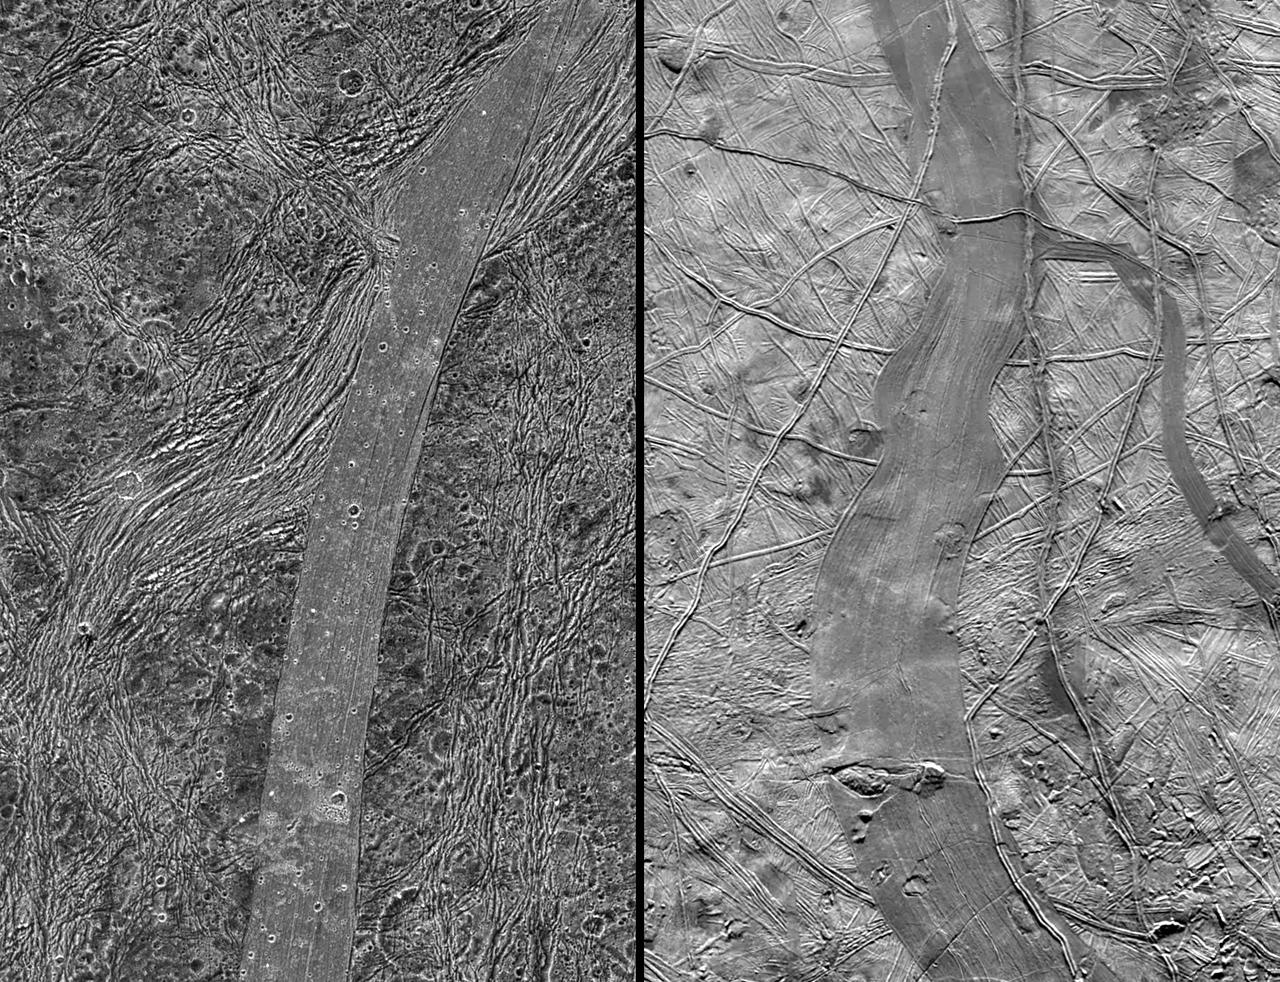
Comparison of Ganymede and Europa features
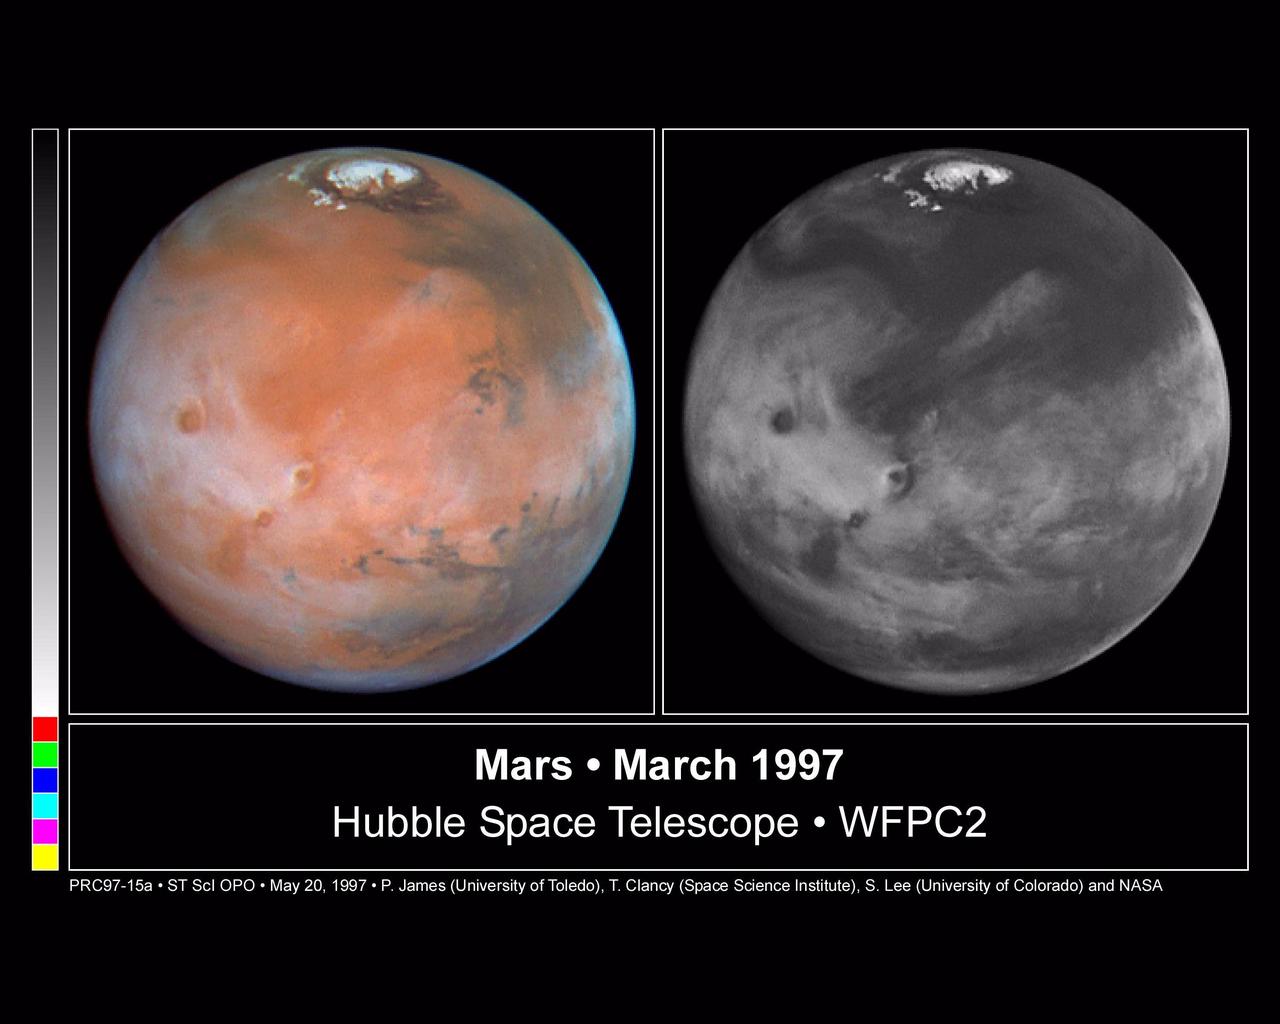
Comparison View of Mars Cloud Cover
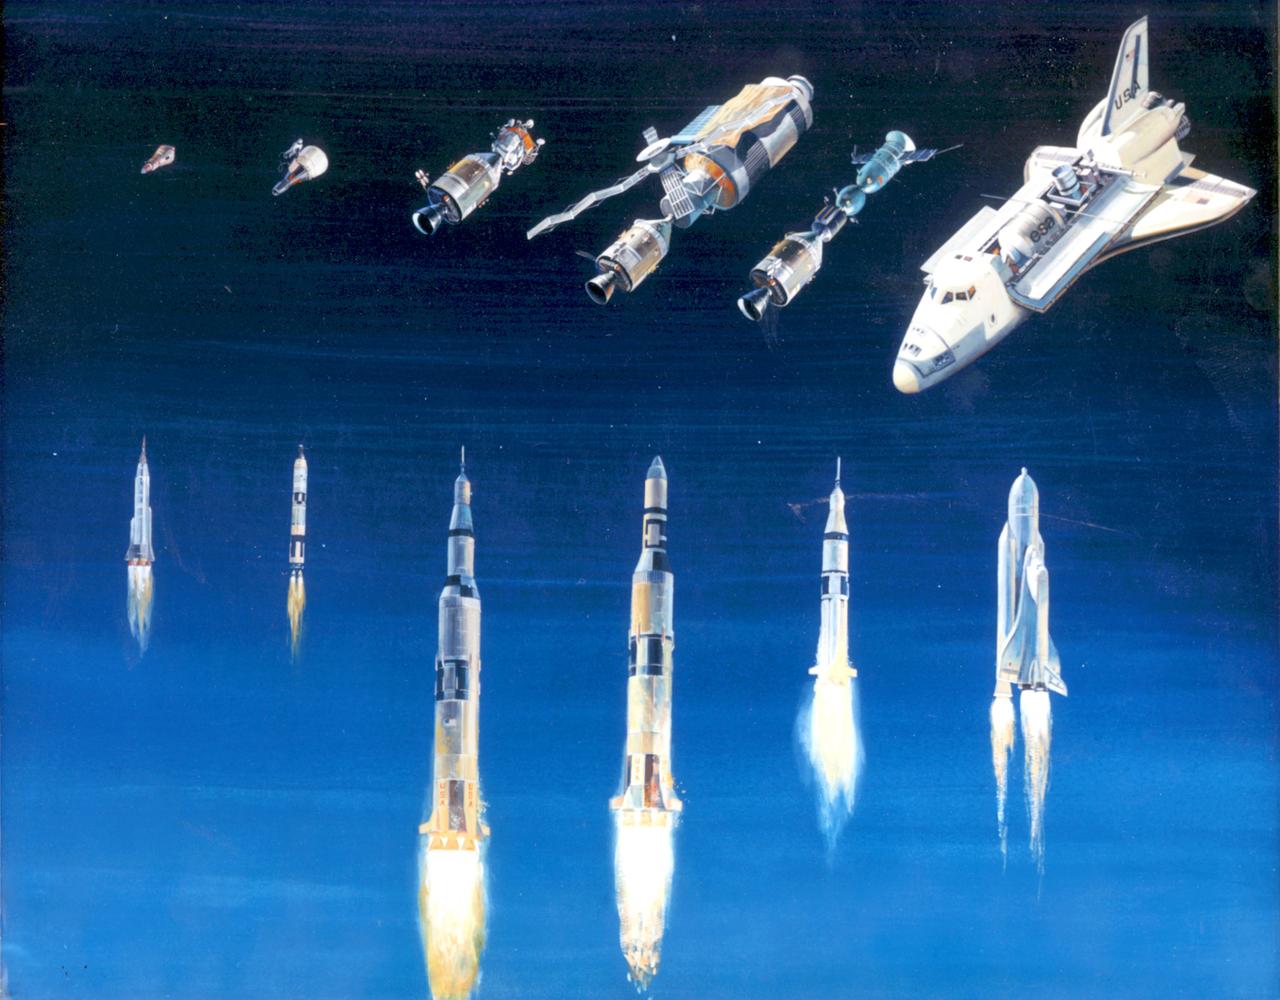
U.S. Marned Spacecraft Launch Vehicle Size Comparison
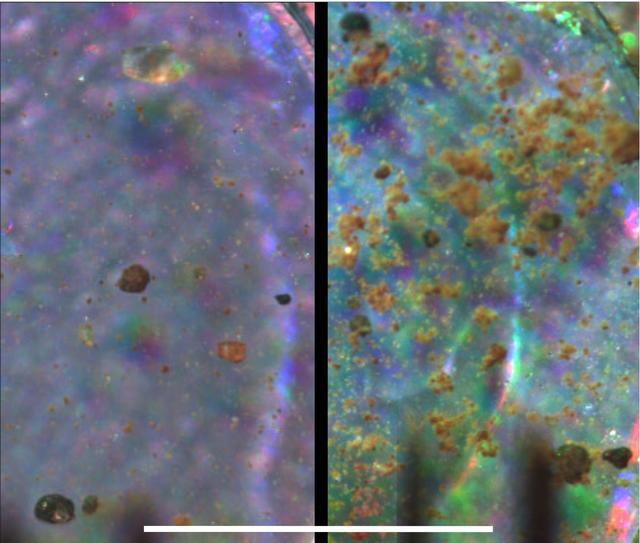
Microscopic Comparison of Airfall Dust to Martian Soil
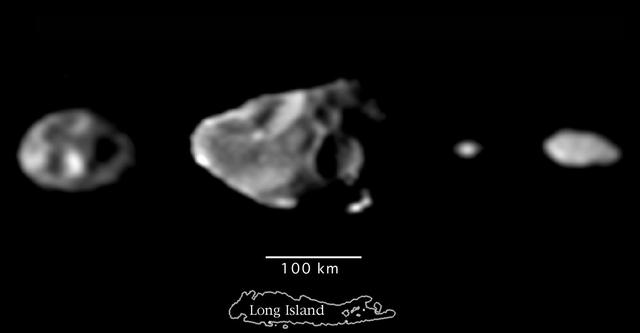
Scale Comparison of the Inner Small Satellites of Jupiter
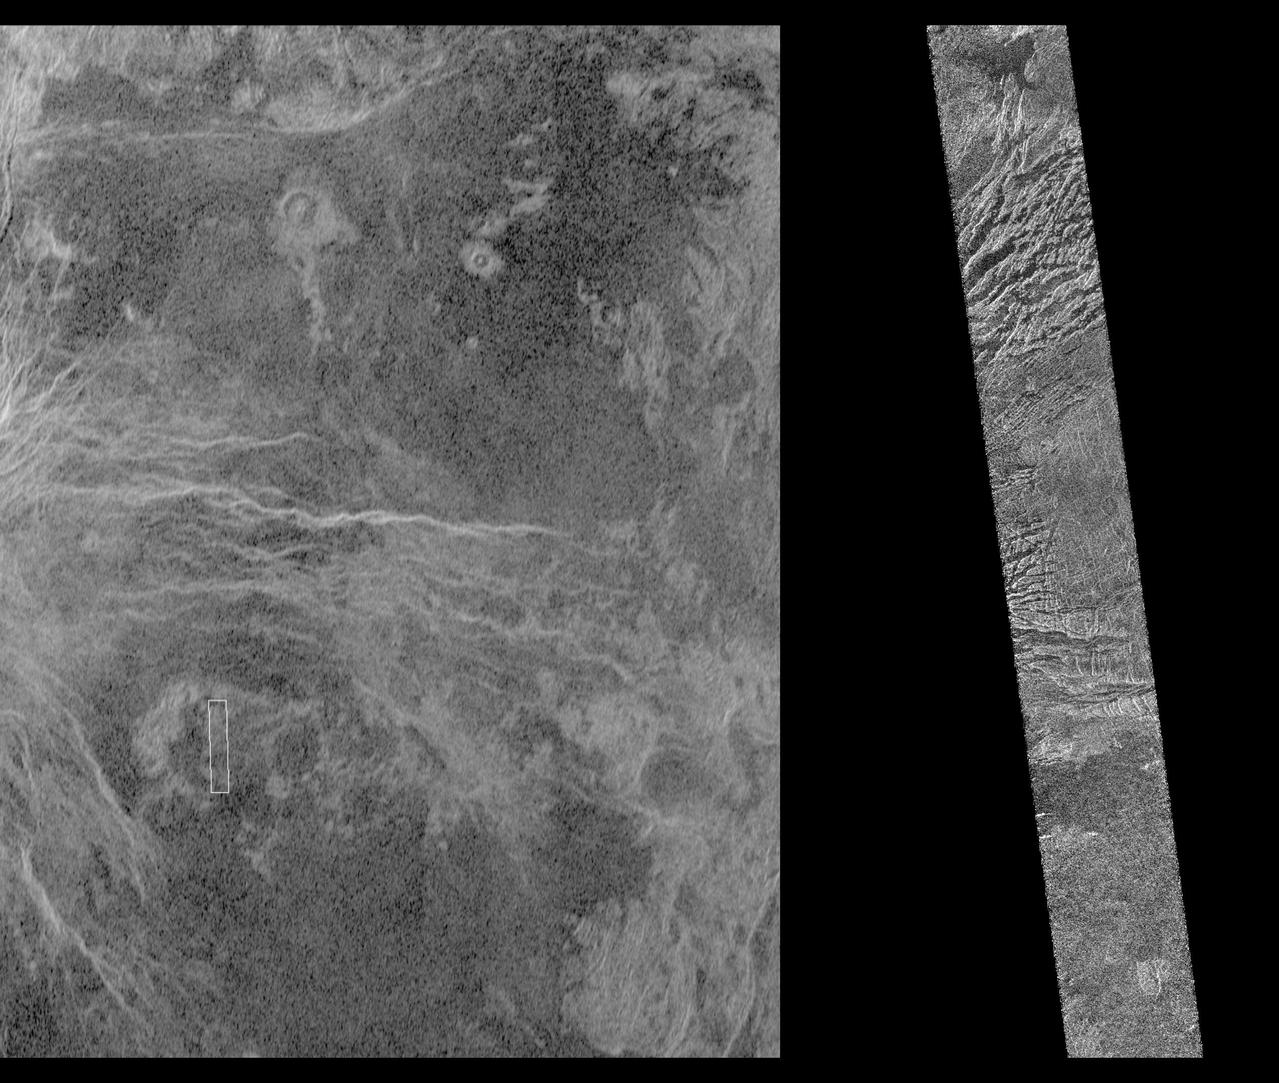
This image shows a comparison between NASA Magellan image right and the highest resolution Earth-based Arecibo radar image of Venus. http://photojournal.jpl.nasa.gov/catalog/PIA00207
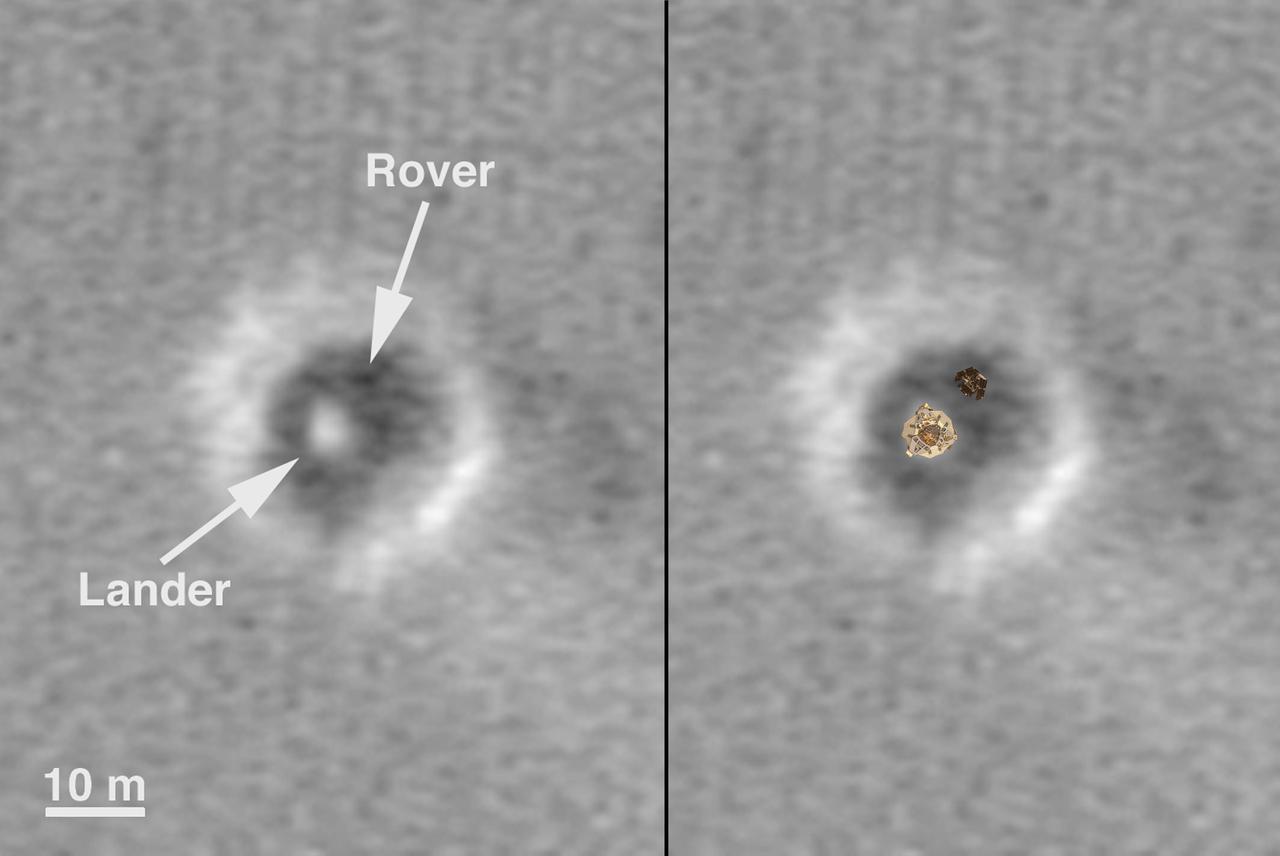
Comparison of a Computer Graphic Model of the Opportunity Lander and Rover with MOC Orbital Image

MGS Mars Orbiter Laser Altimeter MOLA - Mars/Earth Relief Comparison
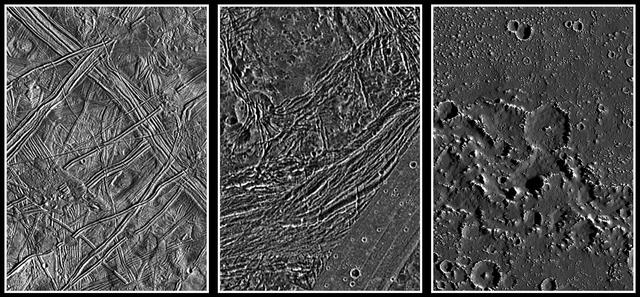
Europa, Ganymede, and Callisto: Surface Comparison at High Spatial Resolution
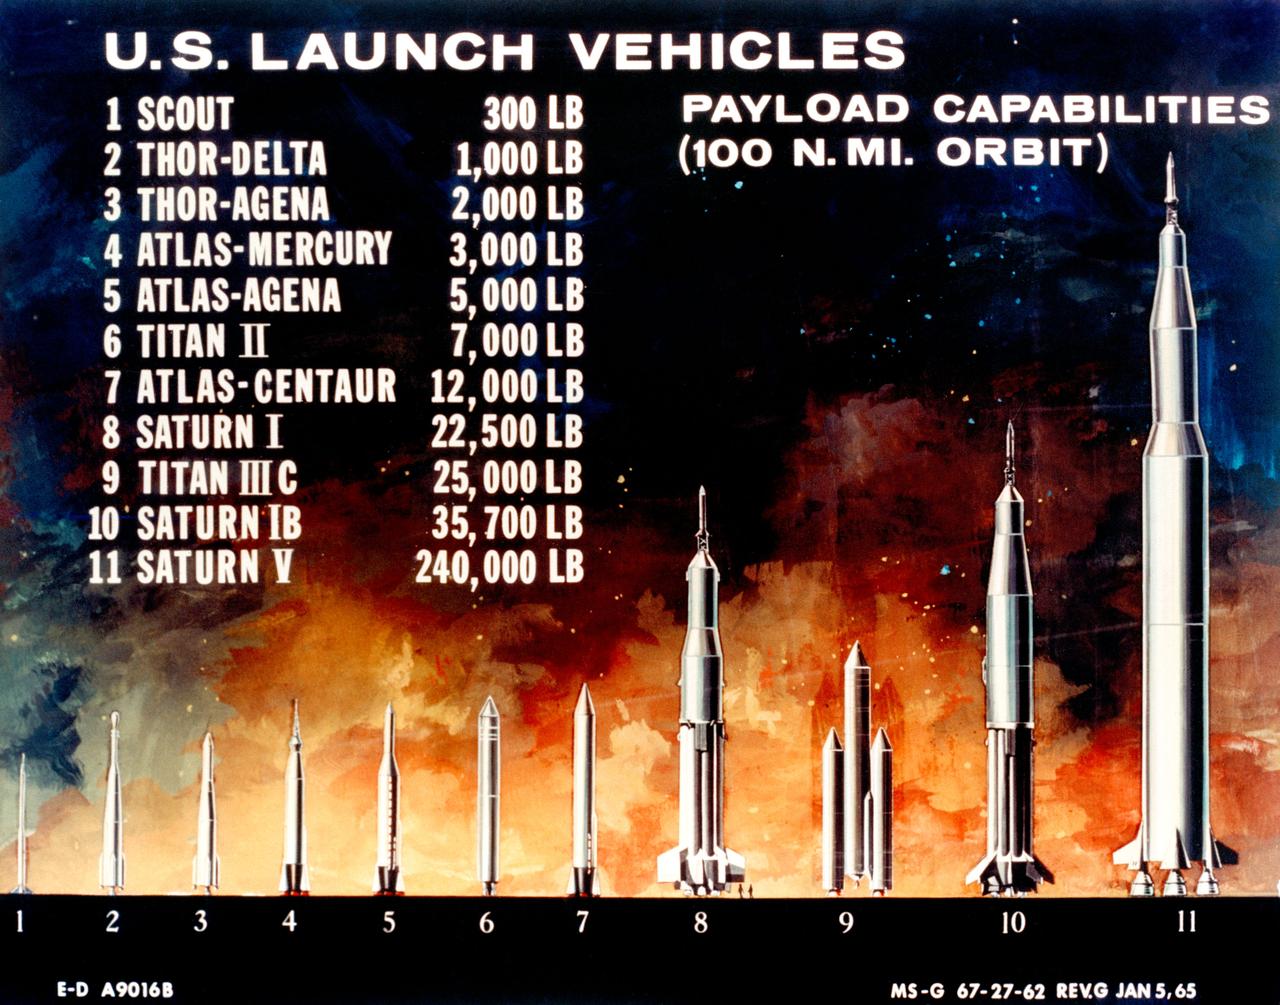
S67-20423 (1967) --- Comparison chart of U.S. launch vehicles. Photo credit: NASA
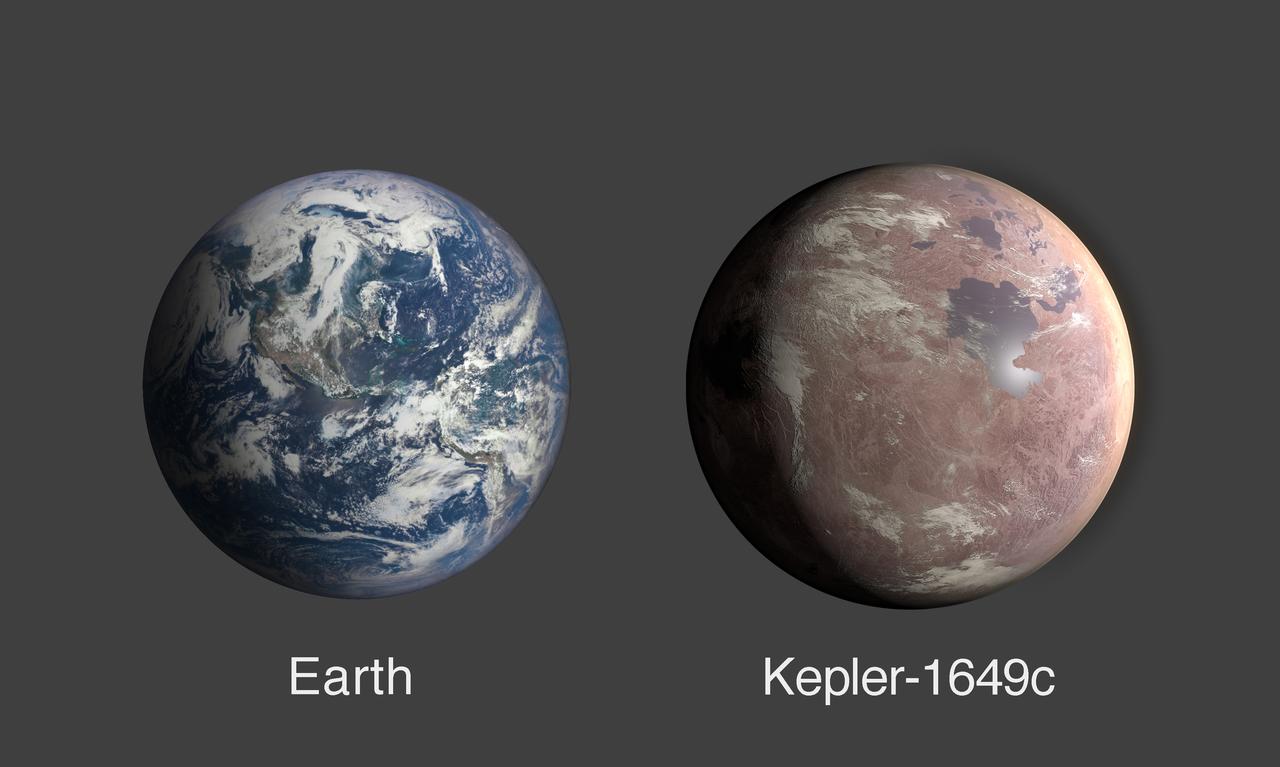
A comparison of Earth and Kepler-1649c, an exoplanet only 1.06 times Earth's radius. Labeled Art Credit: NASA/Ames Research Center/Daniel Rutter
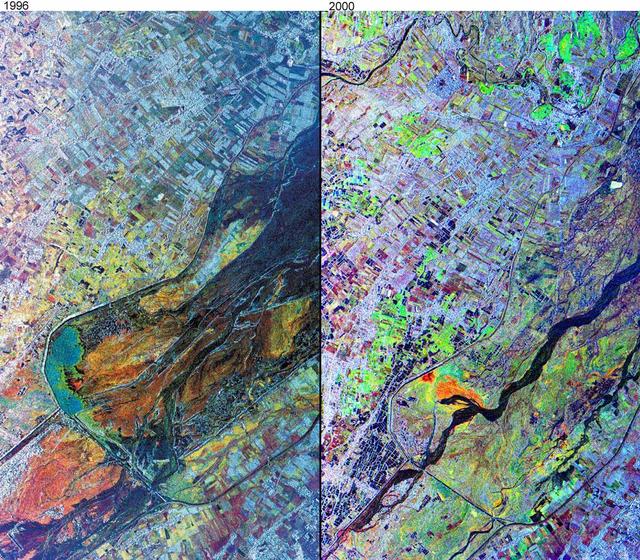
This comparison image, acquired by NASA Airborne Synthetic Aperture Radar AIRSAR November, 1996 and September, 2000, shows the effects of the June 15, 1991, eruption of Mt. Pinatubo.
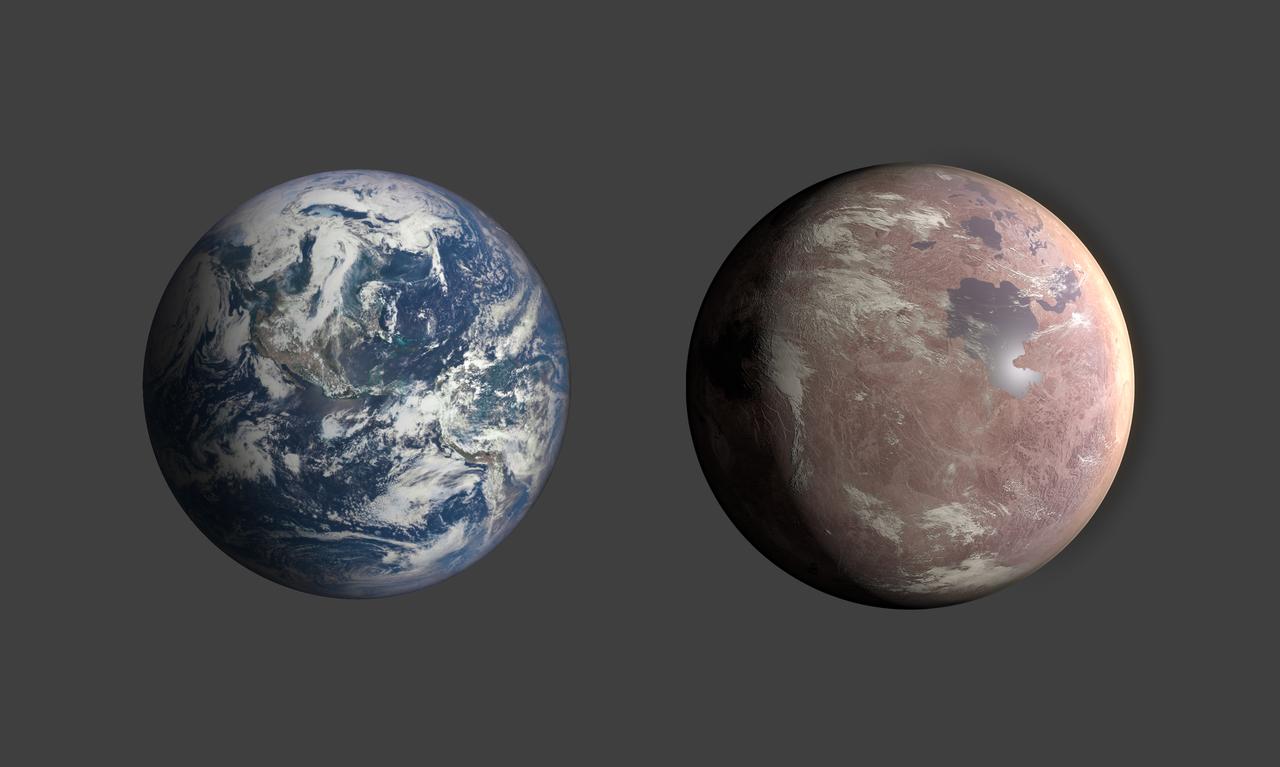
A comparison of Earth and Kepler-1649c, an exoplanet only 1.06 times Earth's radius Credit: NASA/Ames Research Center/Daniel Rutter
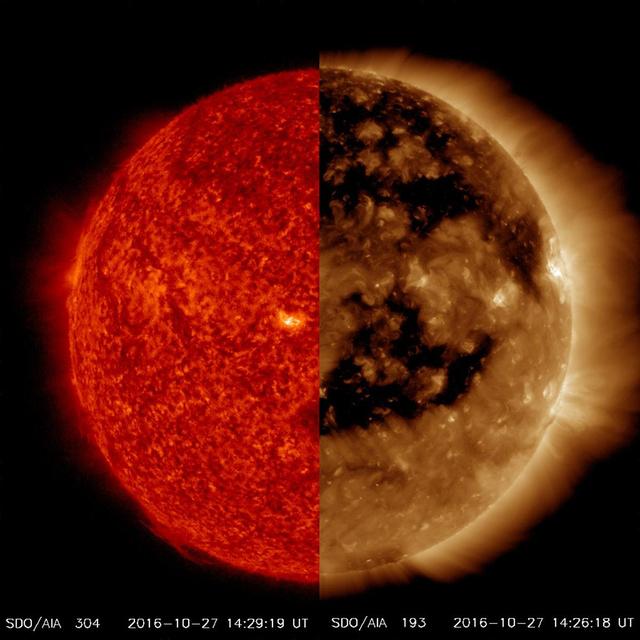
The difference in features that are visible in different wavelengths of extreme ultraviolet light can be stunning as we see when we compare very large coronal holes, easily seen in the AIA 171 image (colorized bronze) yet hardly perceptible in the AIA 304 image (colorized red). Both were taken at just about the same time (Oct. 27, 2016). Coronal holes are areas of open magnetic field that carry solar wind out into space. In fact, these holes are currently causing a lot of geomagnetic activity here on Earth. The bronze image wavelength captures material that is much hotter and further up in the corona than the red image. The comparison dramatizes the value of observing the sun in multiple wavelengths of light. Movies are available at http://photojournal.jpl.nasa.gov/catalog/PIA15377
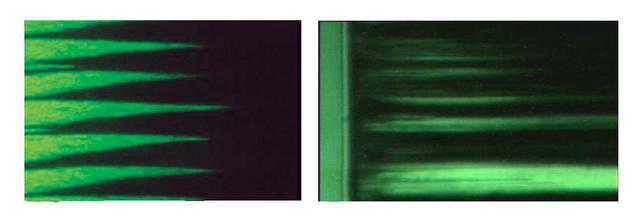
These are video microscope images of magnetorheological (MR) fluids, illuminated with a green light. Those on Earth, left, show the MR fluid forming columns or spikes structures. On the right, the fluids in microgravity aboard the International Space Station (ISS), formed broader columns.
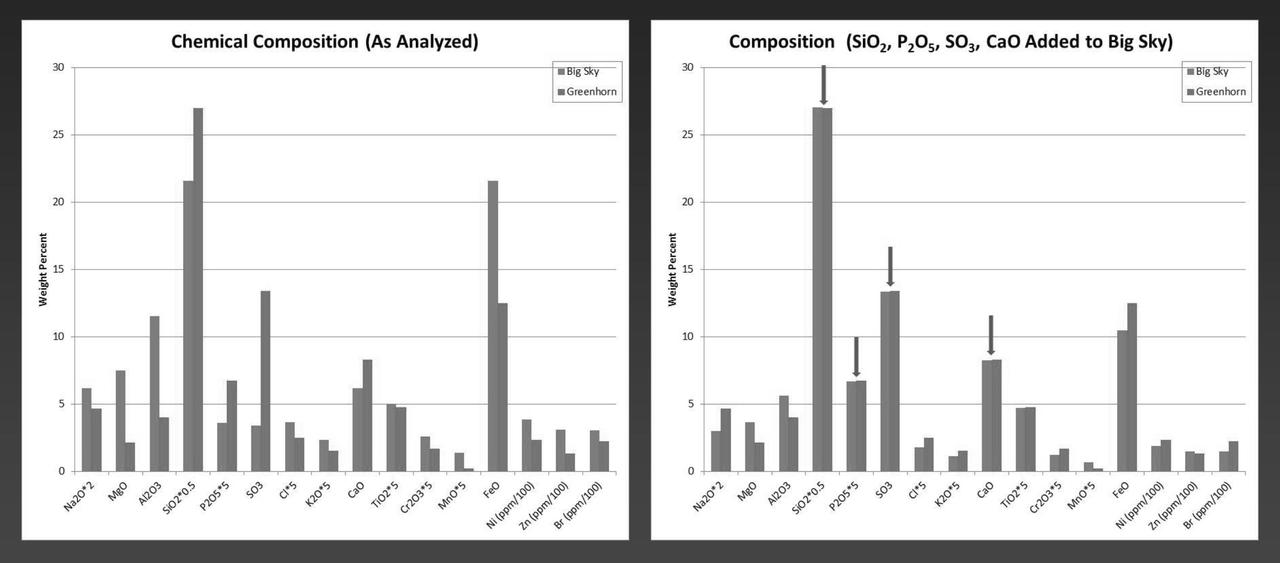
NASA's Curiosity Mars rover examined both the "Greenhorn" and "Big Sky" targets with the rover's Alpha Particle X-ray Spectrometer (APXS) instrument. Greenhorn is located within an altered fracture zone and has an elevated concentration of silica (about 60 percent by weight). Big Sky is the unaltered counterpart for comparison. The bar plot on the left shows scaled concentrations as analyzed by Curiosity's APXS. The bar plot on the right shows what the Big Sky composition would look like if silica (SiO2) and calcium-sulfate (both abumdant in Greenhorn) were added. The similarity in the resulting composition suggests that much of the chemistry of Greenhorn could be explained by the addition of silica. Ongoing research aims to distinguish between that possible explanation for silicon enrichment and an alternative of silicon being left behind when some other elements were removed by acid weathering. http://photojournal.jpl.nasa.gov/catalog/PIA20275
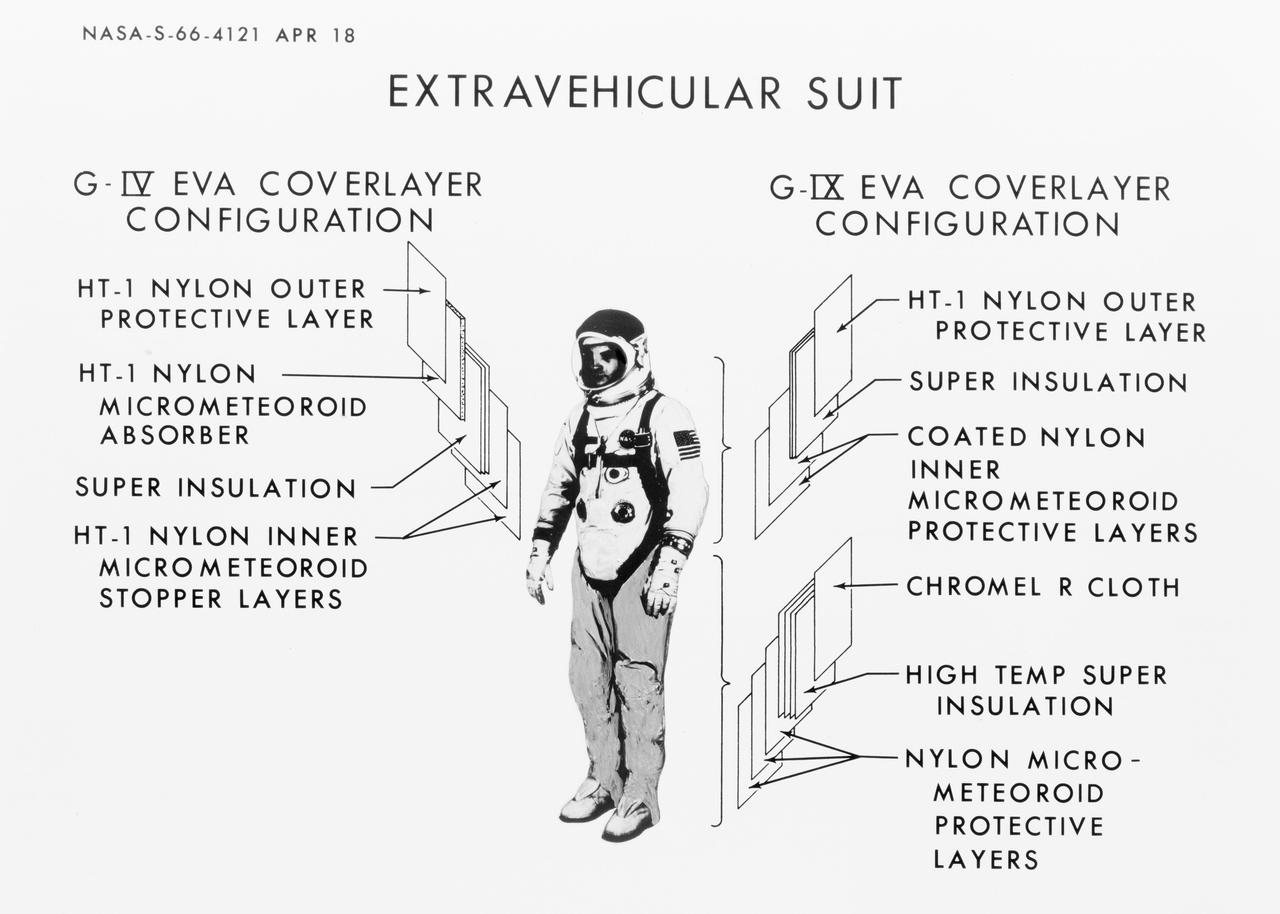
S66-04121 (18 April 1966) --- Drawing of the Gemini-9 extravehicular spacesuit, with a comparison of the breakdown between the Gemini-4 suit layers and the Gemini-9 suit layers. Photo credit: NASA
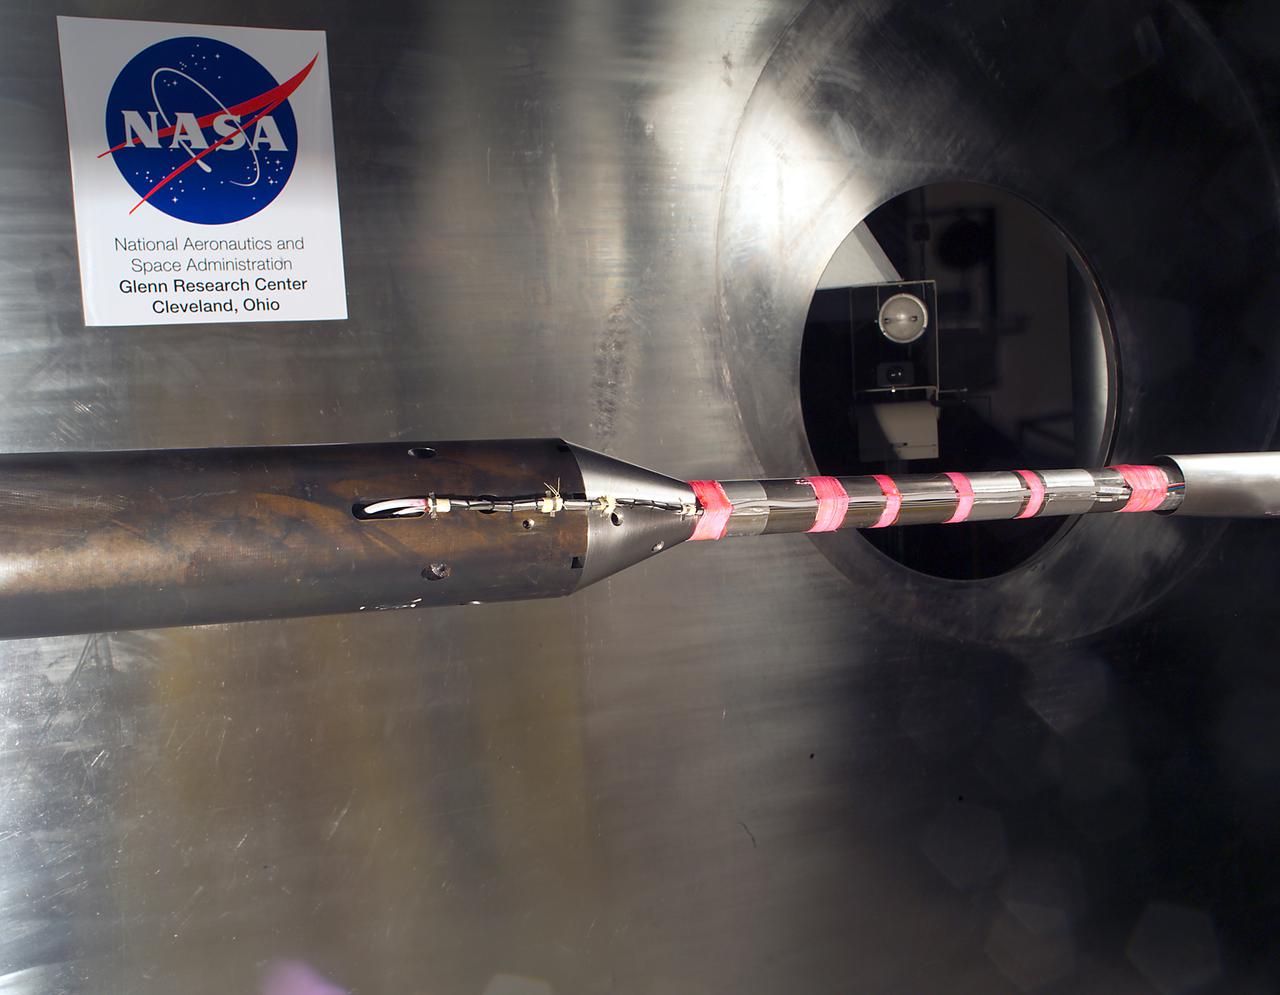
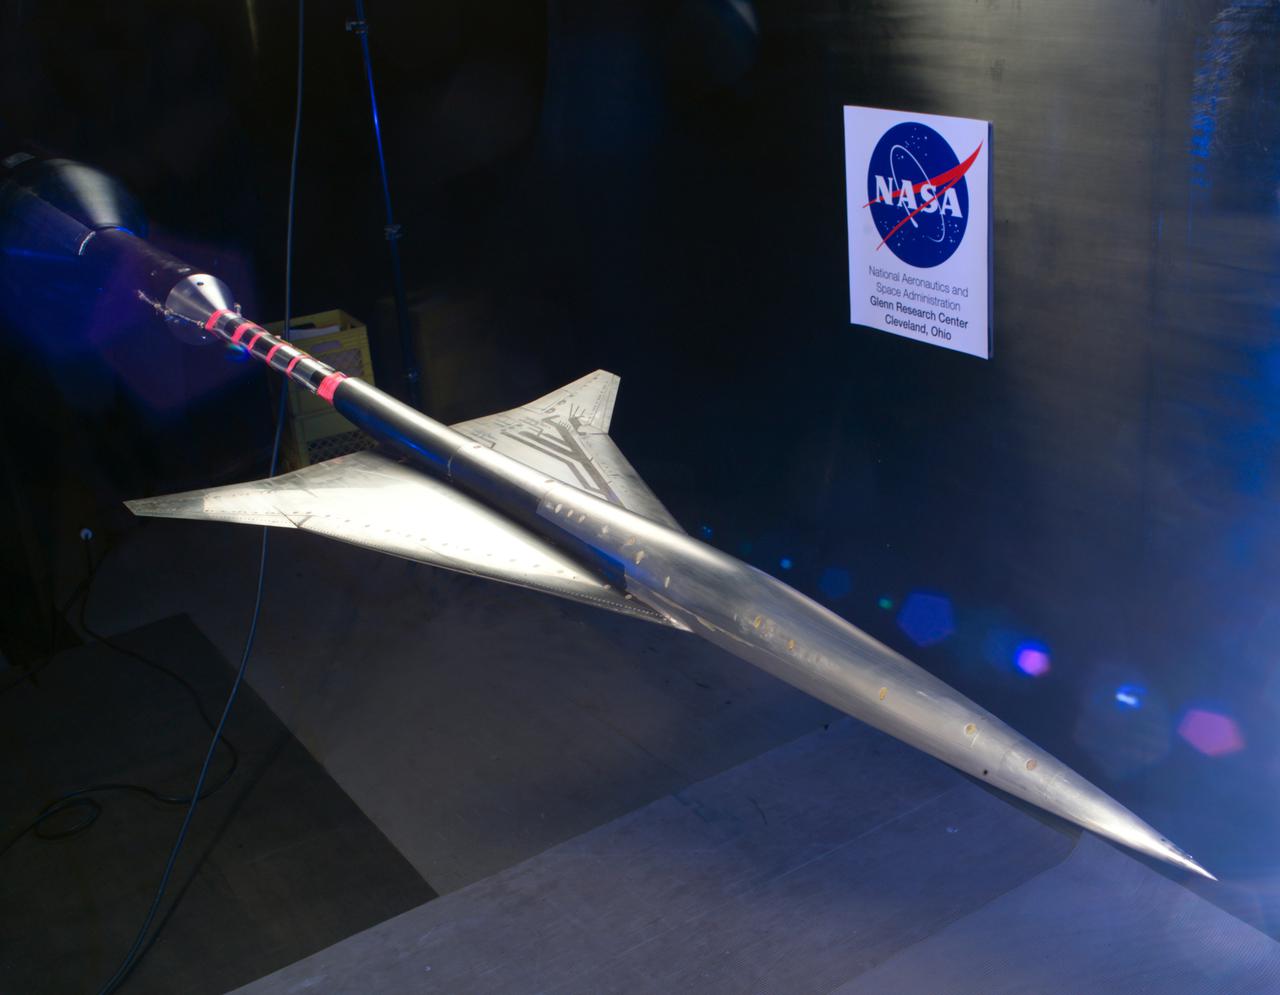
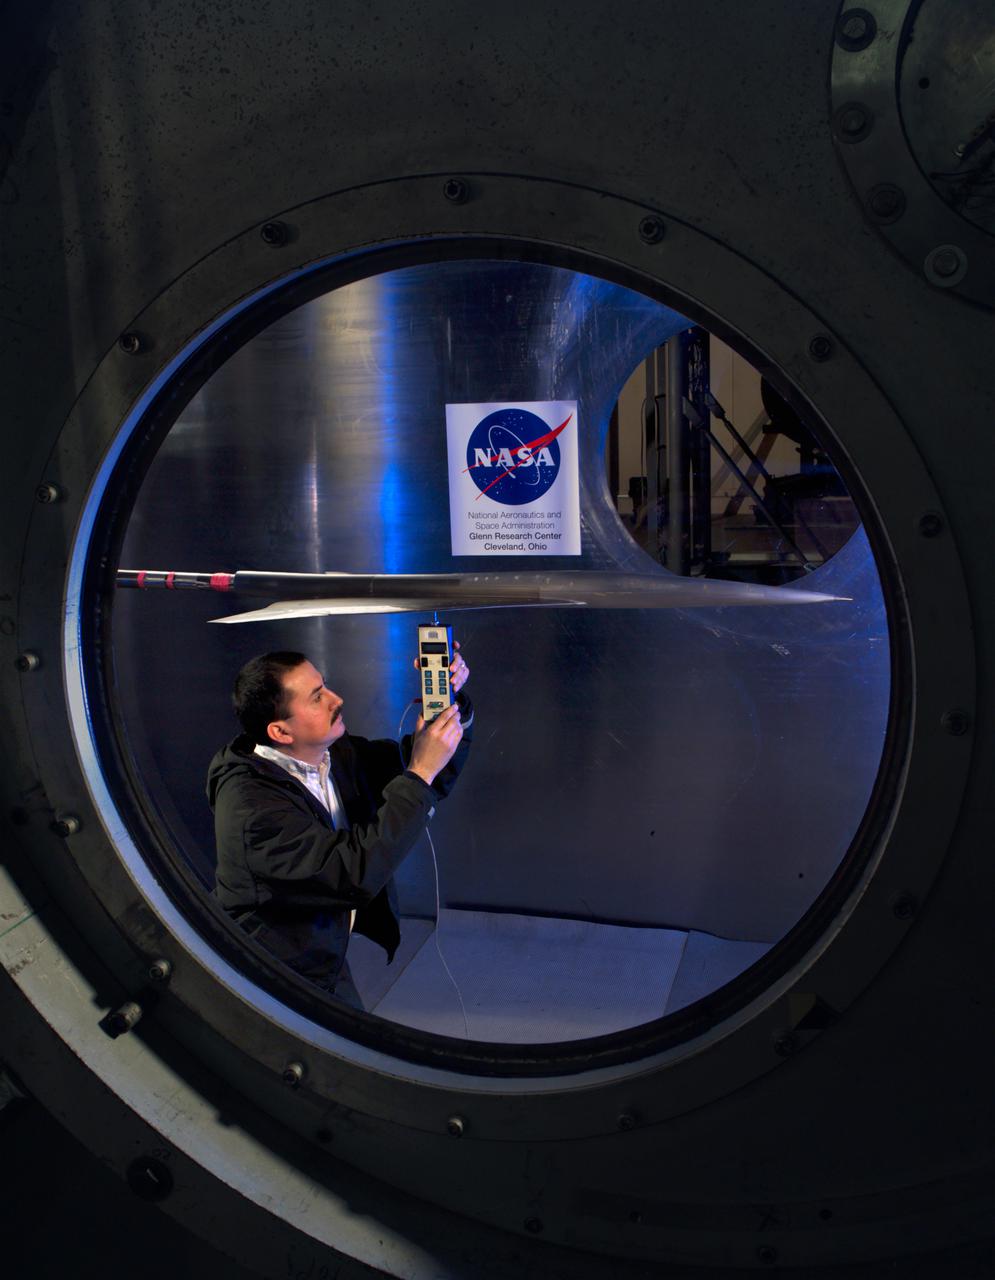
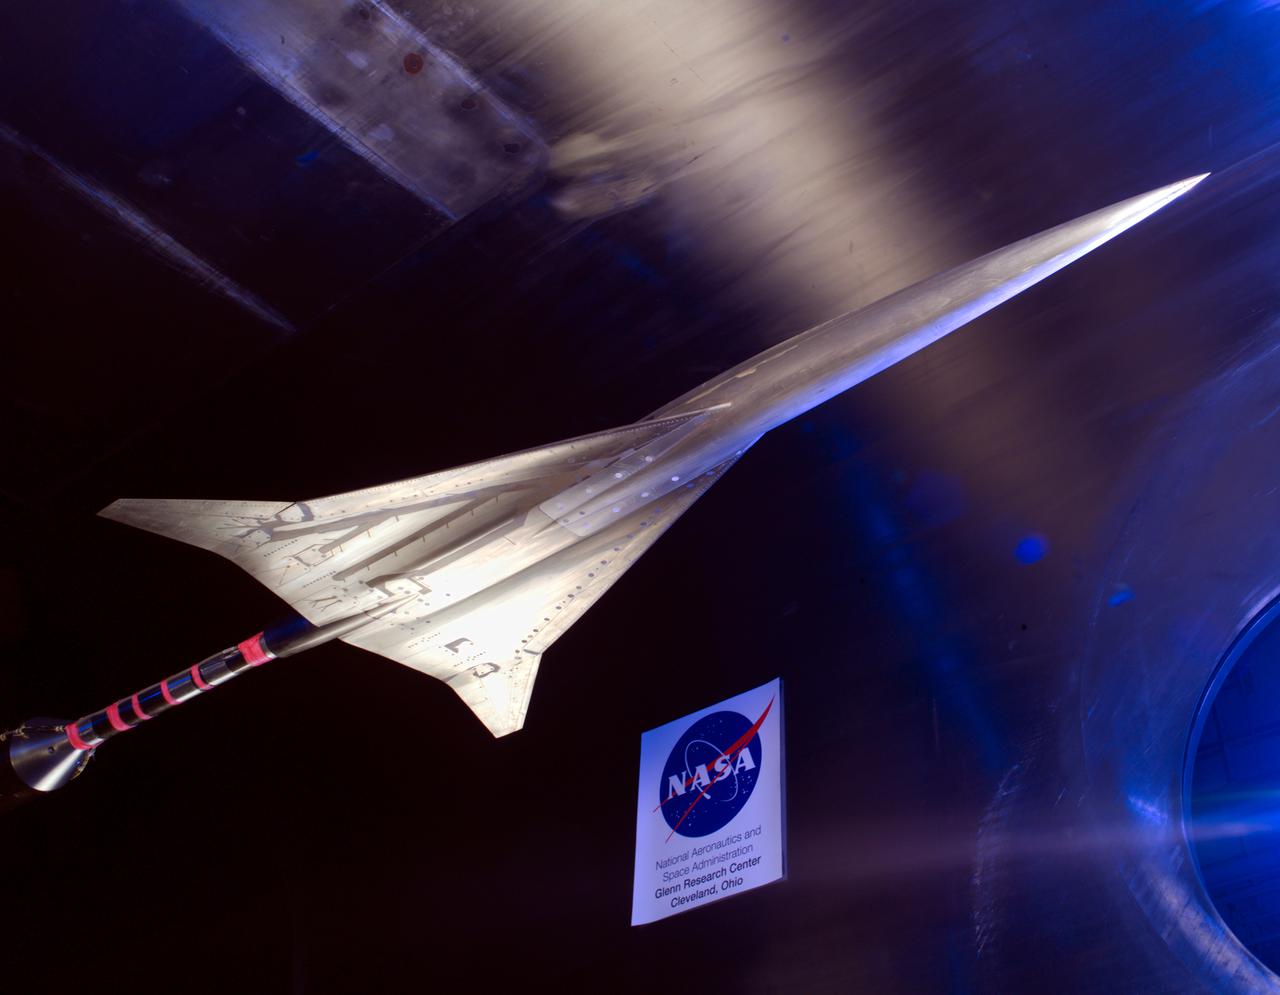
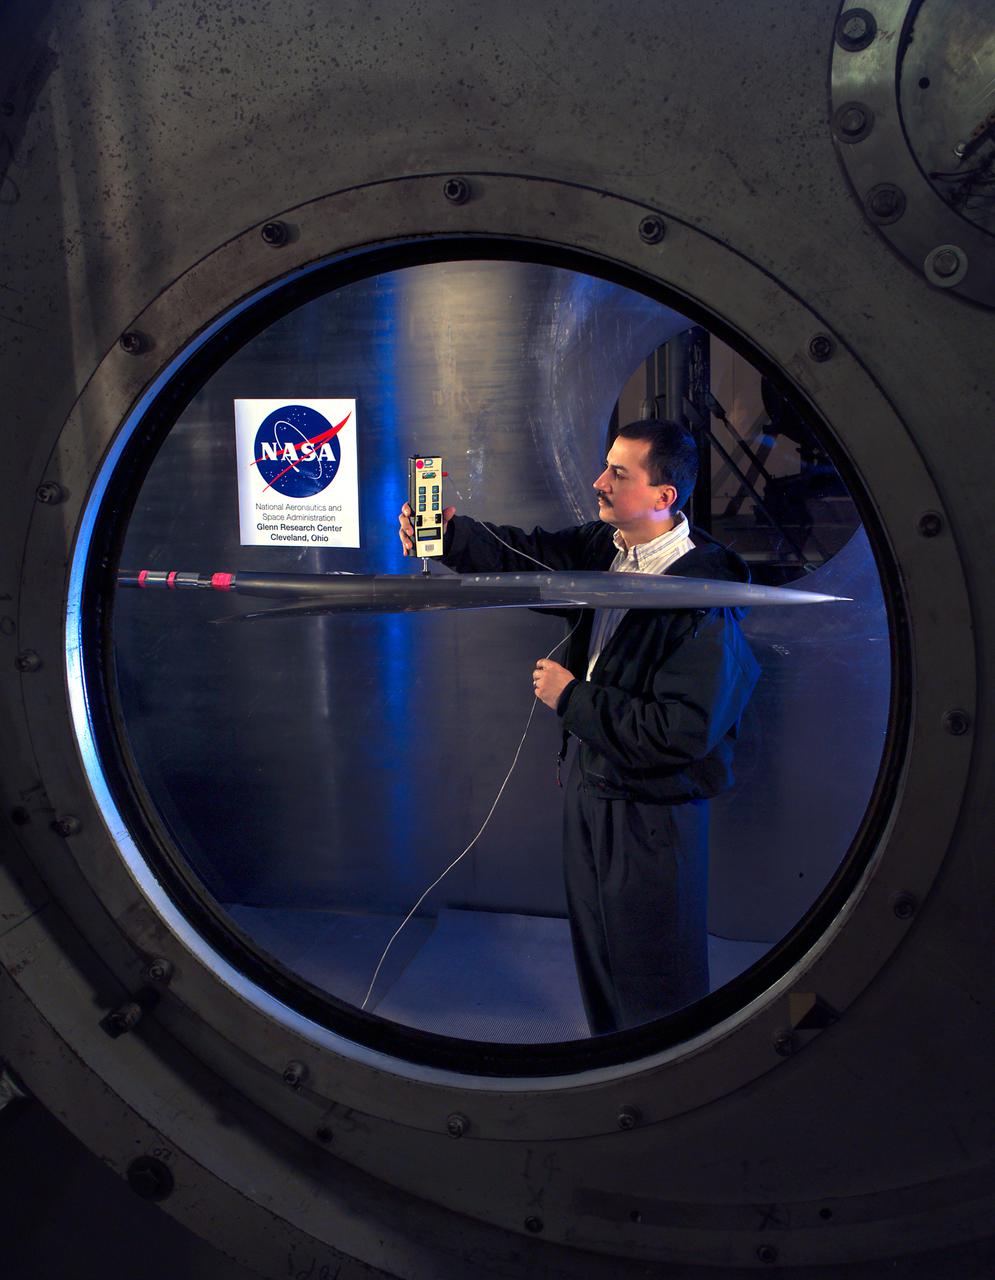
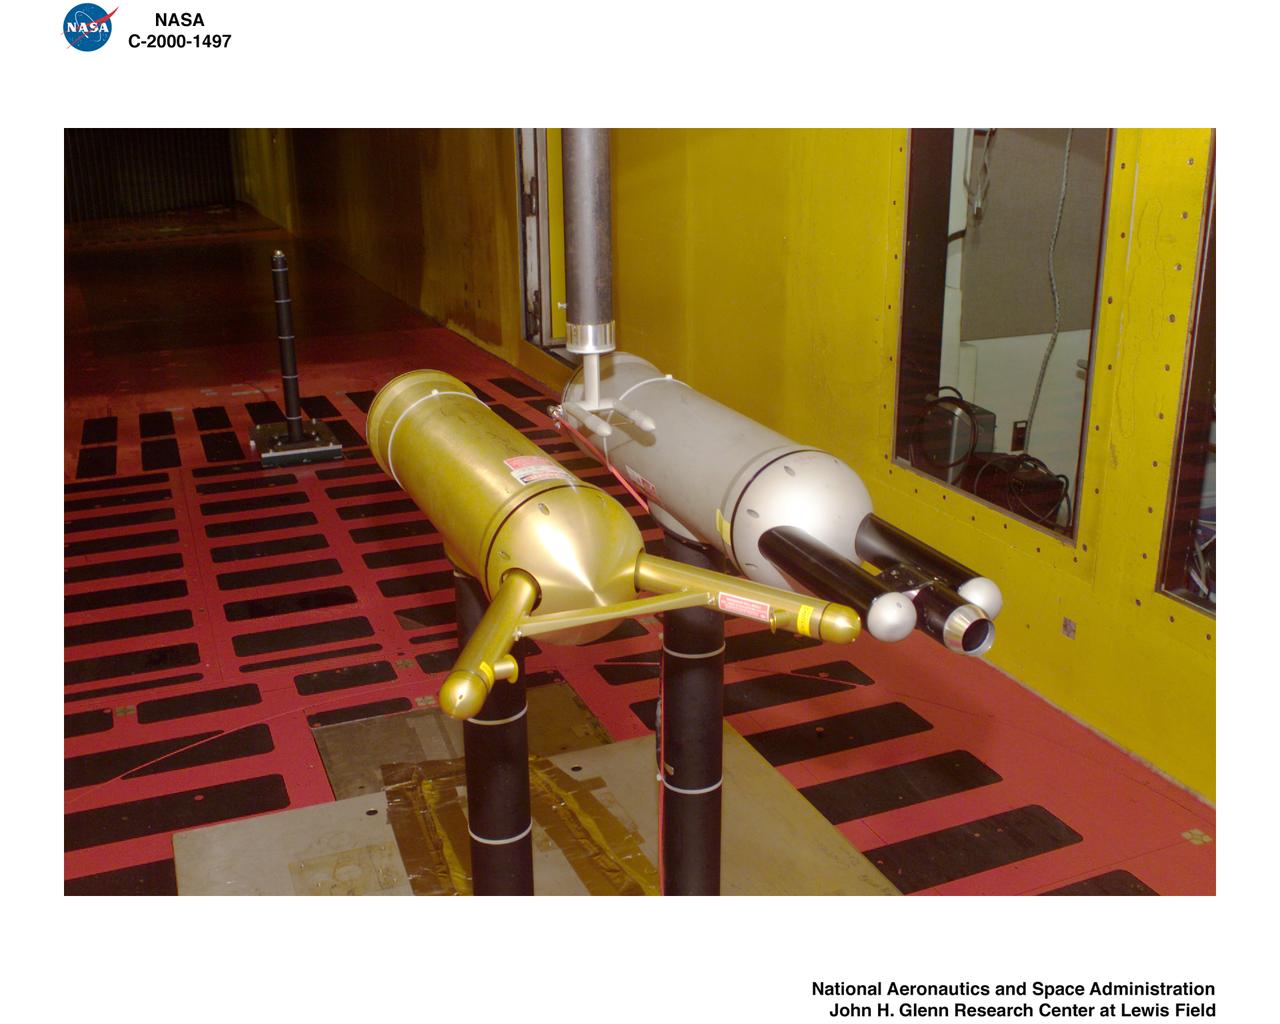
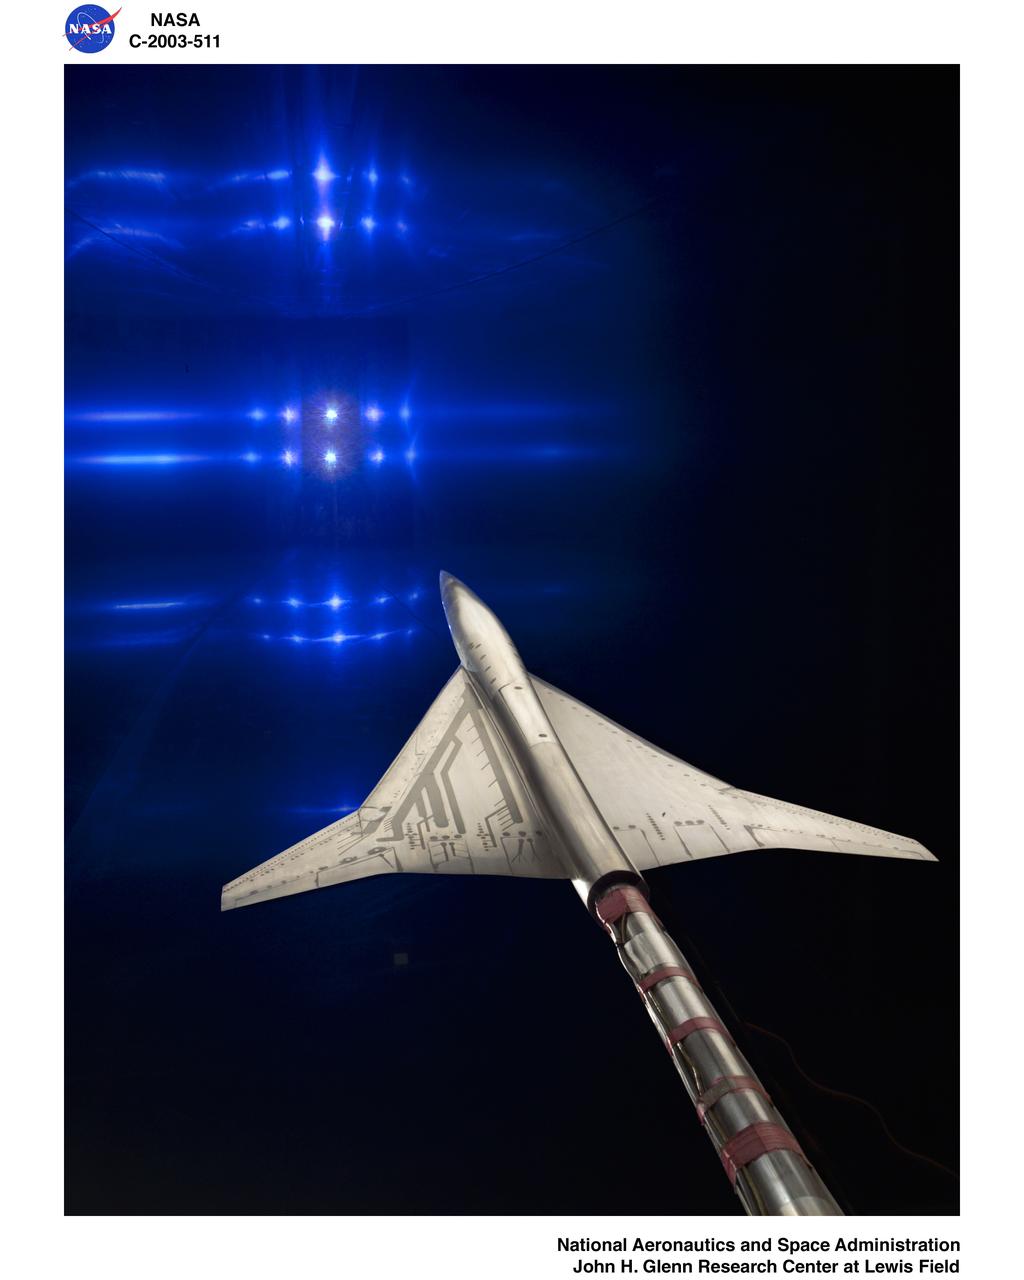
NASA GLENN/NASA LANGLEY LOADS COMPARISON TEST WITH 6 COMPONENT FORCE/MOMENT BALANCE AND 1.7% HIGH SPEED RESEARCH MODEL 5.

NASA GLENN/NASA LANGLEY LOADS COMPARISON TEST WITH 6 COMPONENT FORCE/MOMENT BALANCE AND 1.7% HIGH SPEED RESEARCH MODEL 5.
NASA GLENN/NASA LANGLEY LOADS COMPARISON TEST WITH 6 COMPONENT FORCE/MOMENT BALANCE AND 1.7% HIGH SPEED RESEARCH MODEL 5.
NASA GLENN/NASA LANGLEY LOADS COMPARISON TEST WITH 6 COMPONENT FORCE/MOMENT BALANCE AND 1.7% HIGH SPEED RESEARCH MODEL 5.
NASA GLENN/NASA LANGLEY LOADS COMPARISON TEST WITH 6 COMPONENT FORCE/MOMENT BALANCE AND 1.7% HIGH SPEED RESEARCH MODEL 5.
NASA GLENN/NASA LANGLEY LOADS COMPARISON TEST WITH 6 COMPONENT FORCE/MOMENT BALANCE AND 1.7% HIGH SPEED RESEARCH MODEL 5.
NASA GLENN/NASA LANGLEY LOADS COMPARISON TEST WITH 6 COMPONENT FORCE/MOMENT BALANCE AND 1.7% HIGH SPEED RESEARCH MODEL 5.

NASA Mars rovers keep getting bigger. This photo provides a comparison of the wheel sizes for three generations of them.
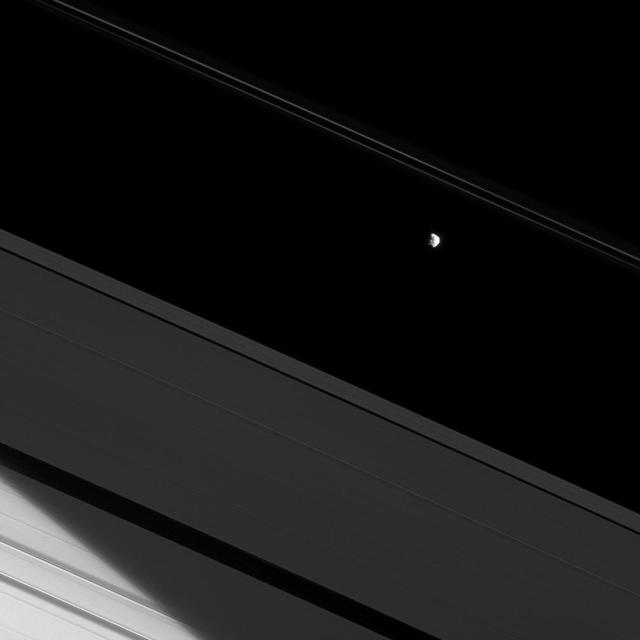
The moon Prometheus and a bit of Saturn northern hemisphere are both brilliantly lit by the sun here, making the A ring seem dim in comparison.
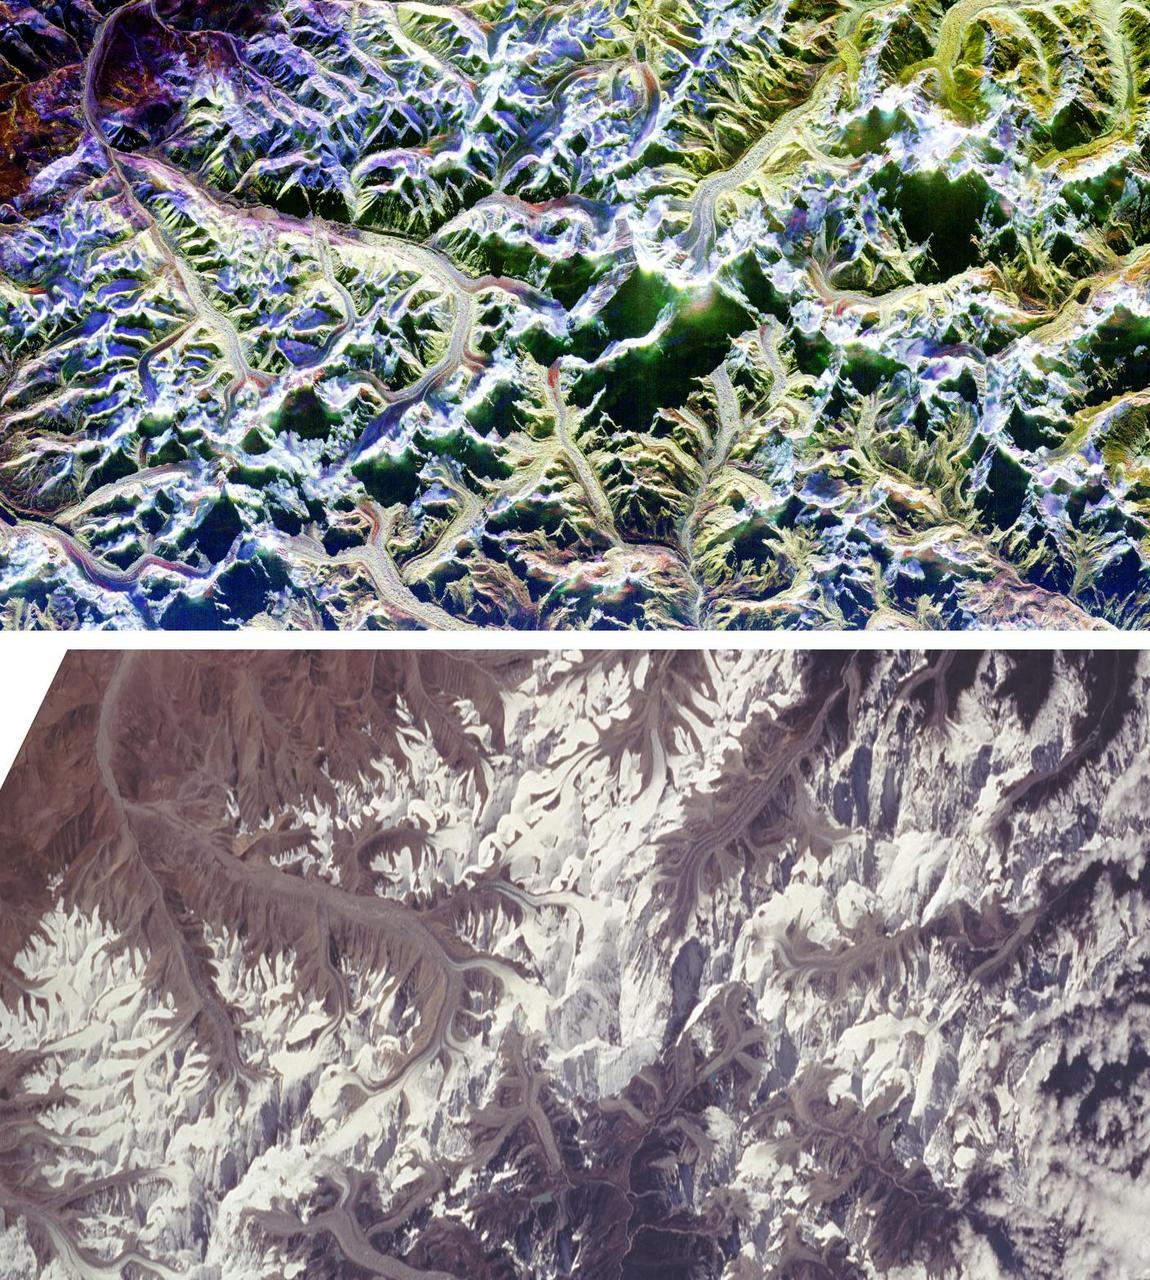
These are two comparison images of Mount Everest and its surroundings, along the border of Nepal and Tibet.
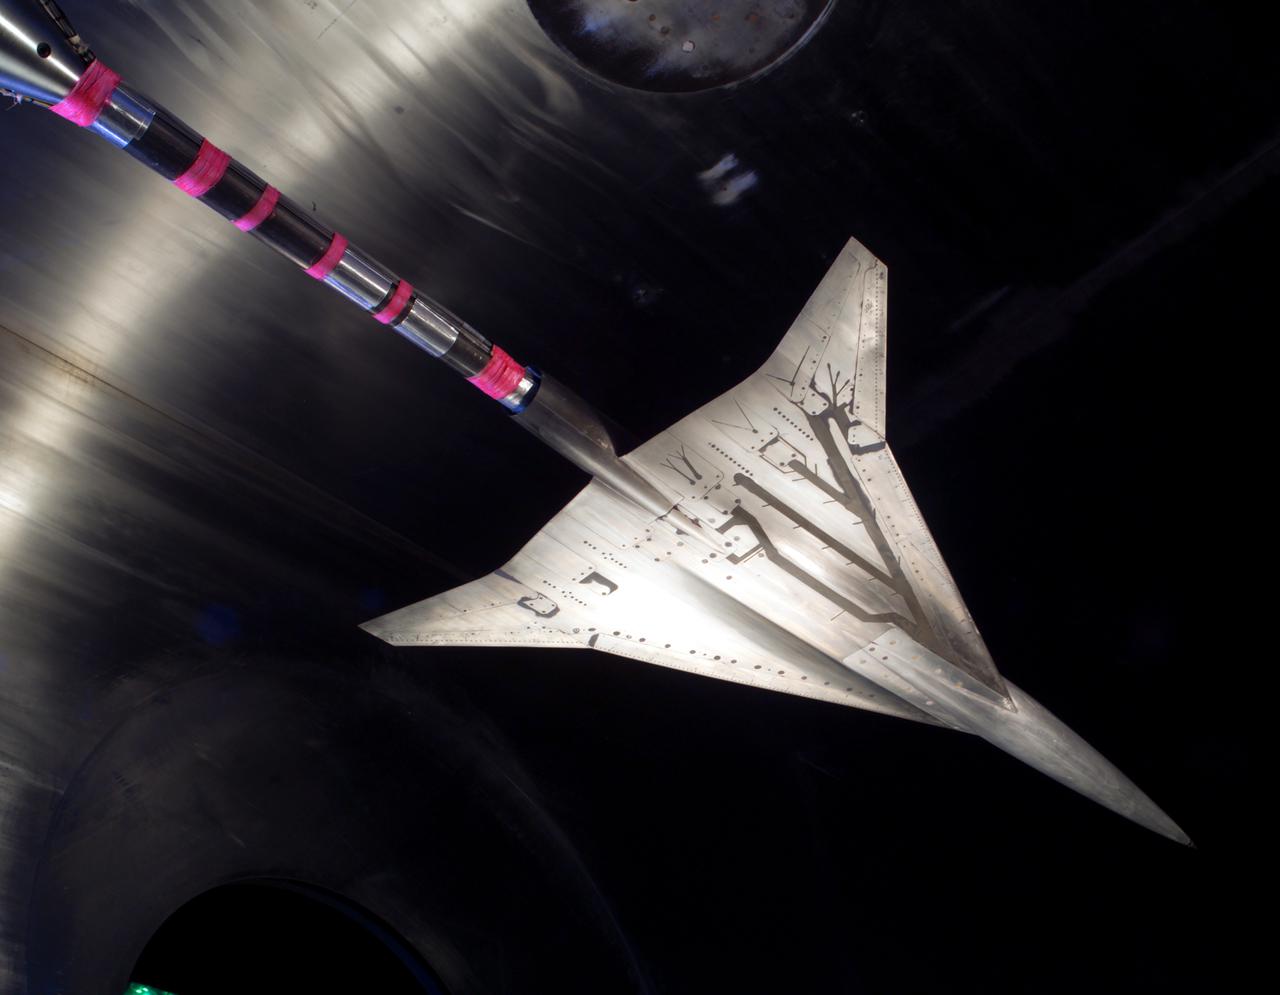
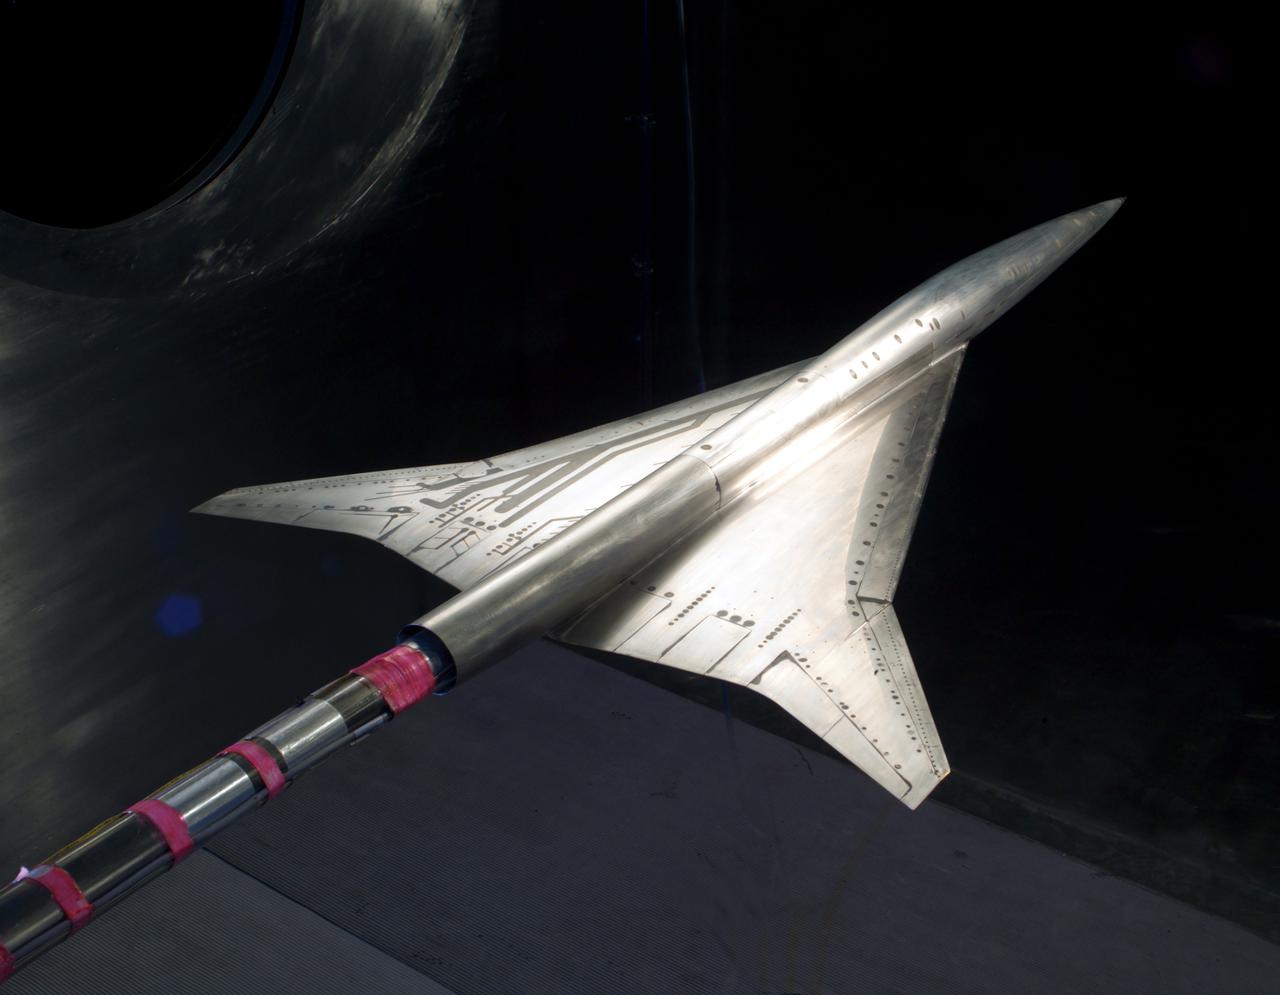
NASA Glenn/NASA Langley, Loads Comparison Test With 6 Component Force/Moment Balance and 1.7% High Speed Research, HSR Model 5. In the Glenn Research Center 10x10 Foot Supersonic Wind Tunnel, SWT
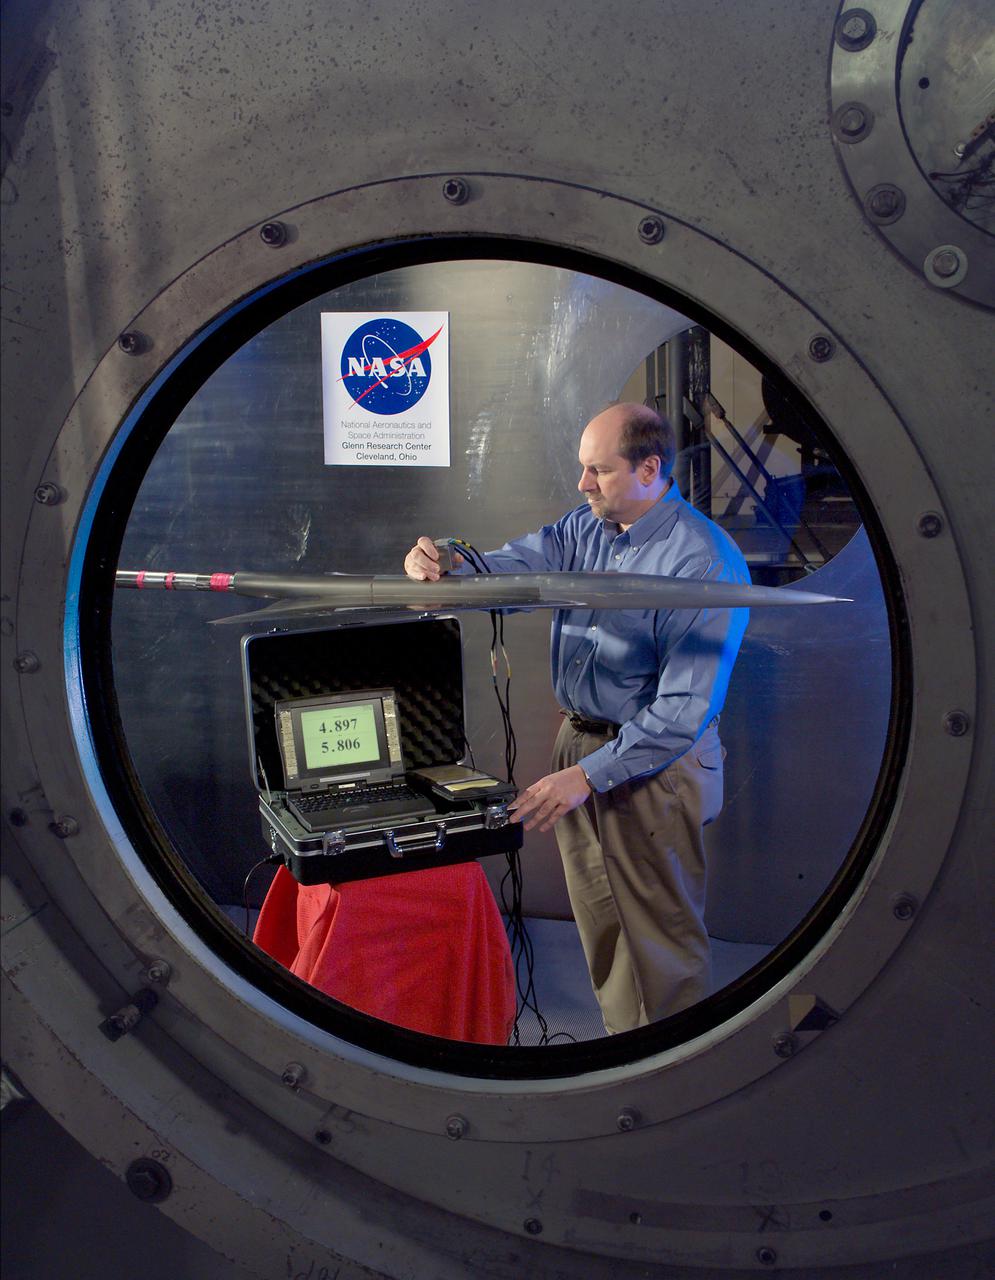
NASA GLENN/NASA LANGLEY LOADS COMPARISON TEST WITH 6 COMPONENT FORCE/MOMENT BALANCE AND 1.7% HIGH SPEED RESEARCH MODEL 5. in the 10x10 super sonic wind tunnel
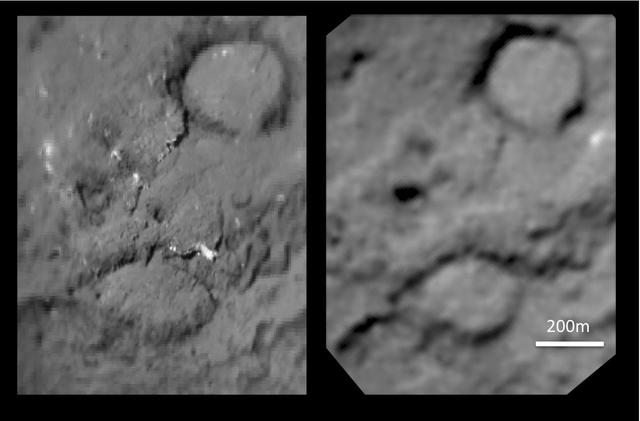
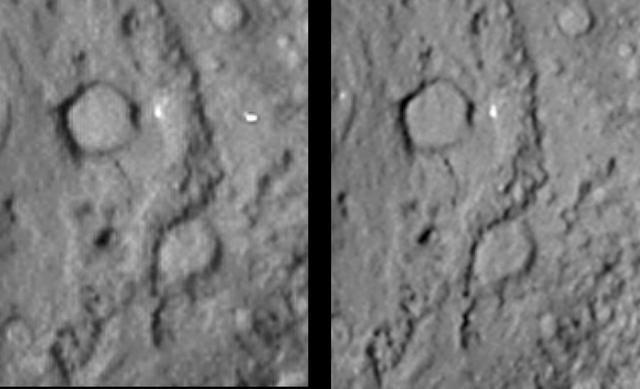
This pair of images shows the before-and-after comparison of the part of comet Tempel 1 that was hit by the impactor from NASA Deep Impact spacecraft.

This pair of images shows a before-and-after comparison of the area on comet Tempel 1 targeted by an impactor from NASA Deep Impact spacecraft in July 2005.
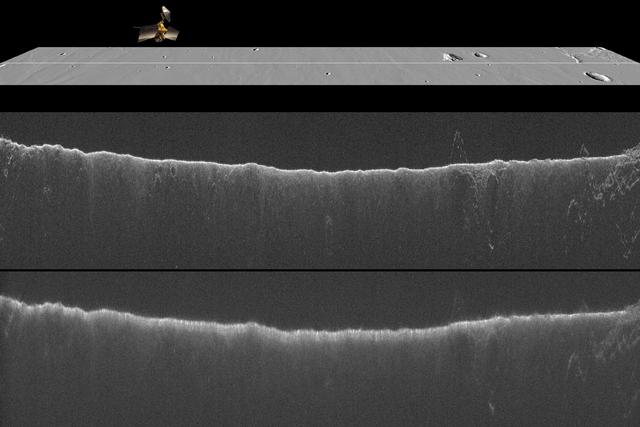
A comparison of two radargrams from the SHARAD instrument on NASA Mars Reconnaissance Orbiter shows effects on the Martian ionosphere from the close passage of a comet.

This pair of images shows the before-and-after comparison of the part of comet Tempel 1 that was hit by the impactor from NASA Deep Impact spacecraft.
This pair of images shows the before-and-after comparison of the part of comet Tempel 1 that was hit by the impactor from NASA Deep Impact spacecraft.
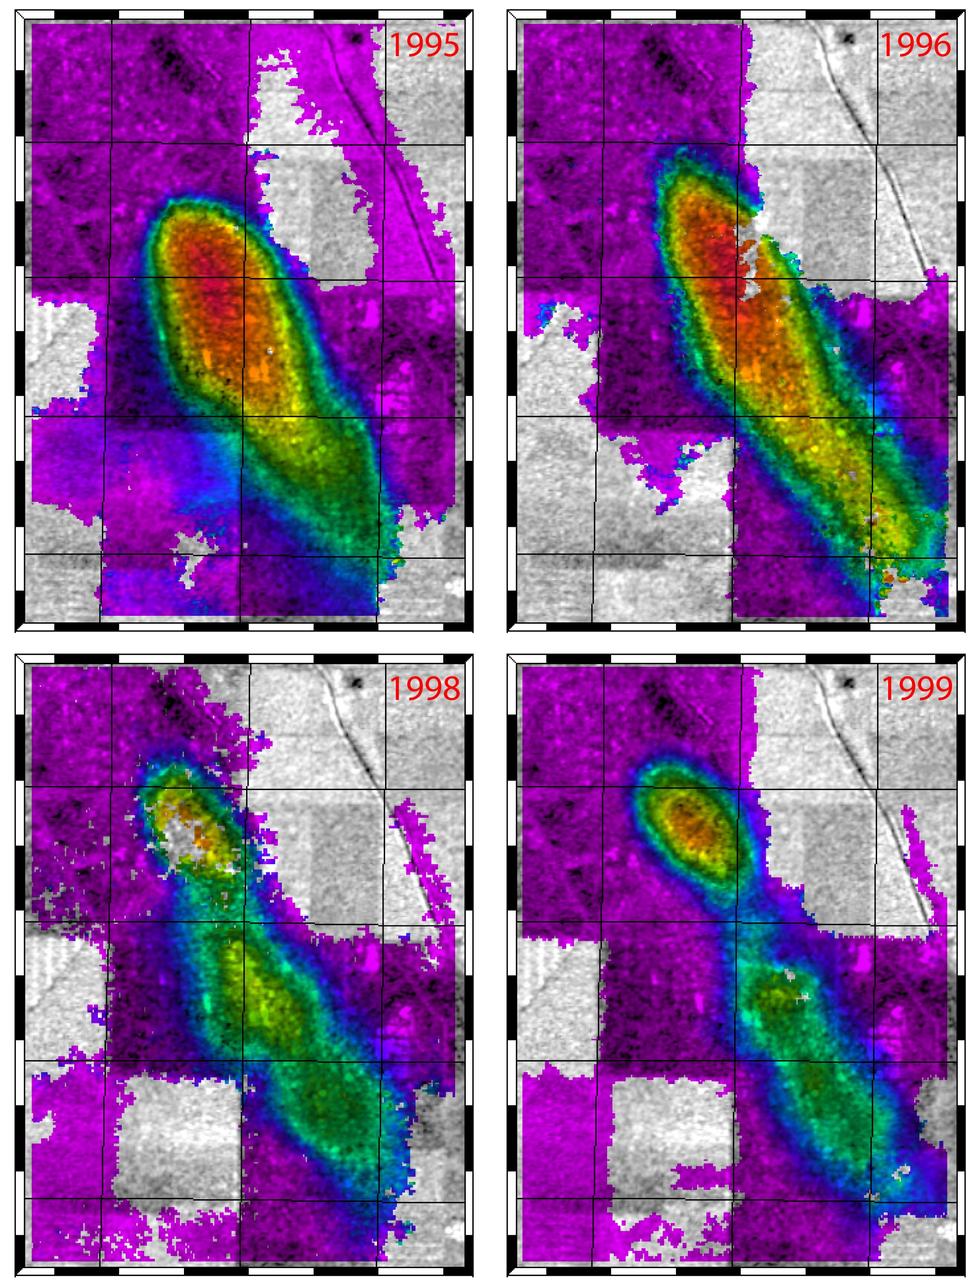
This figure shows a comparison of interferograms from four different years mapping the rapid ground subsidence over the Lost Hills oil field in California.
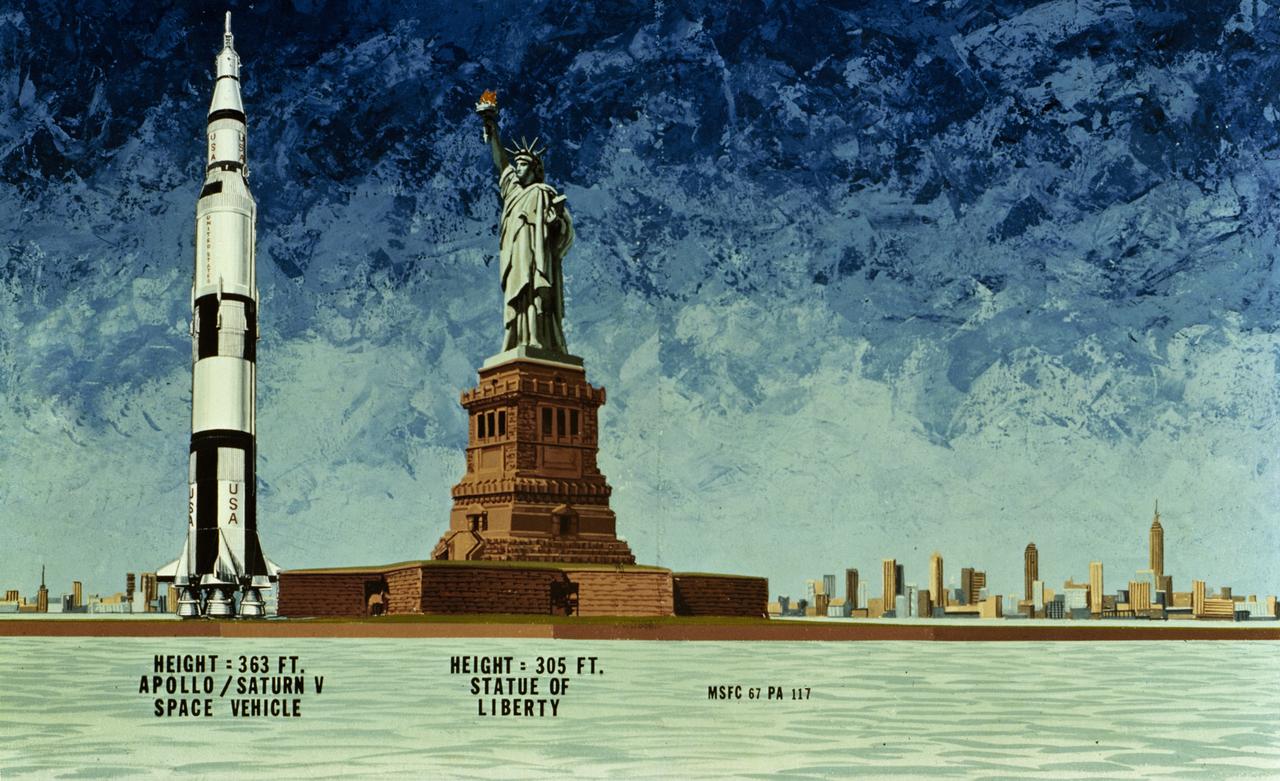
This 1967 illustration compares the Apollo Saturn V Spacecraft of the Moon Landing era to the Statue of Liberty located on Liberty Island in New York City. The Apollo Saturn V, at 363 feet towers above Lady Liberty, as the statue is called, standing at 305 feet.
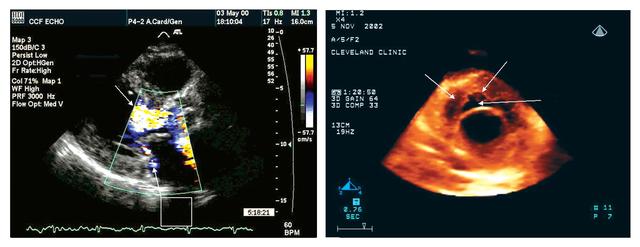
Echocardiography uses sound waves to image the heart and other organs. Developing a compact version of the latest technology improved the ease of monitoring crew member health, a critical task during long space flights. NASA researchers plan to adapt the three-dimensional (3-D) echocardiogram for space flight. The two-dimensional (2-D) echocardiogram utilized in orbit on the International Space Station (ISS) was effective, but difficult to use with precision. A heart image from a 2-D echocardiogram (left) is of a better quality than that from a 3-D device (right), but the 3-D imaging procedure is more user-friendly.
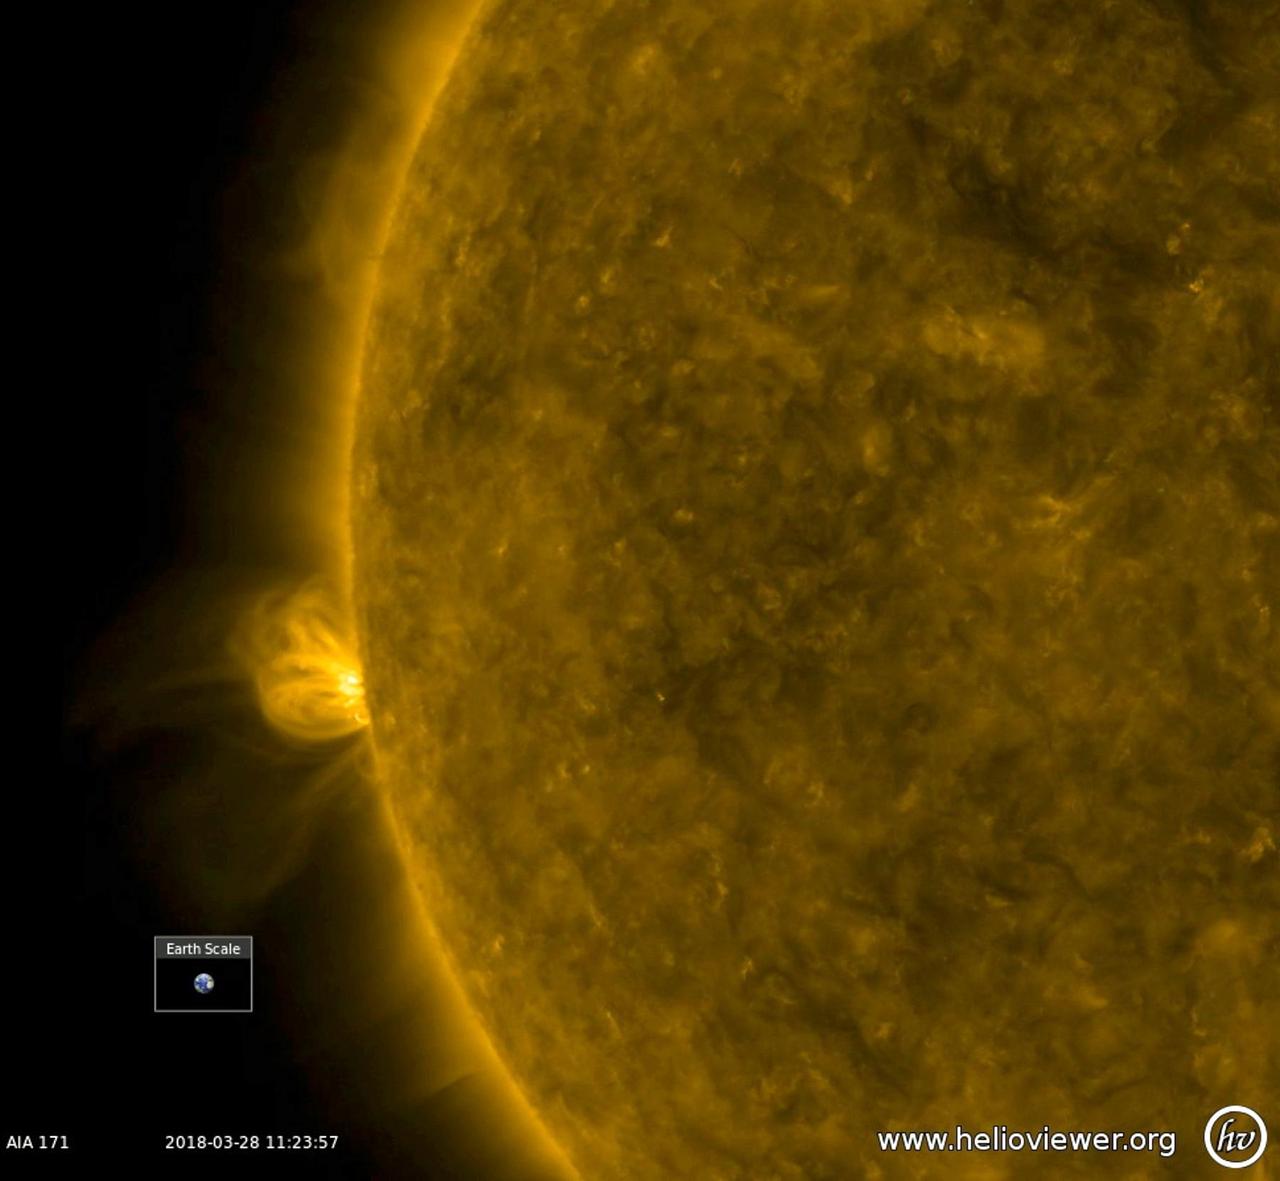
With no active regions currently on the face of the sun, a bristling active region has begun to rotate into view (Mar. 27-28, 2018). In this extreme ultraviolet view, the active region has numerous arches of bright, magnetic field lines blossoming out and towering above it. Whether this region will produce solar storms remains to be seen, but at least there is some new activity to observe. The video was produced with Helioviewer software. Animations are available at https://photojournal.jpl.nasa.gov/catalog/PIA22411
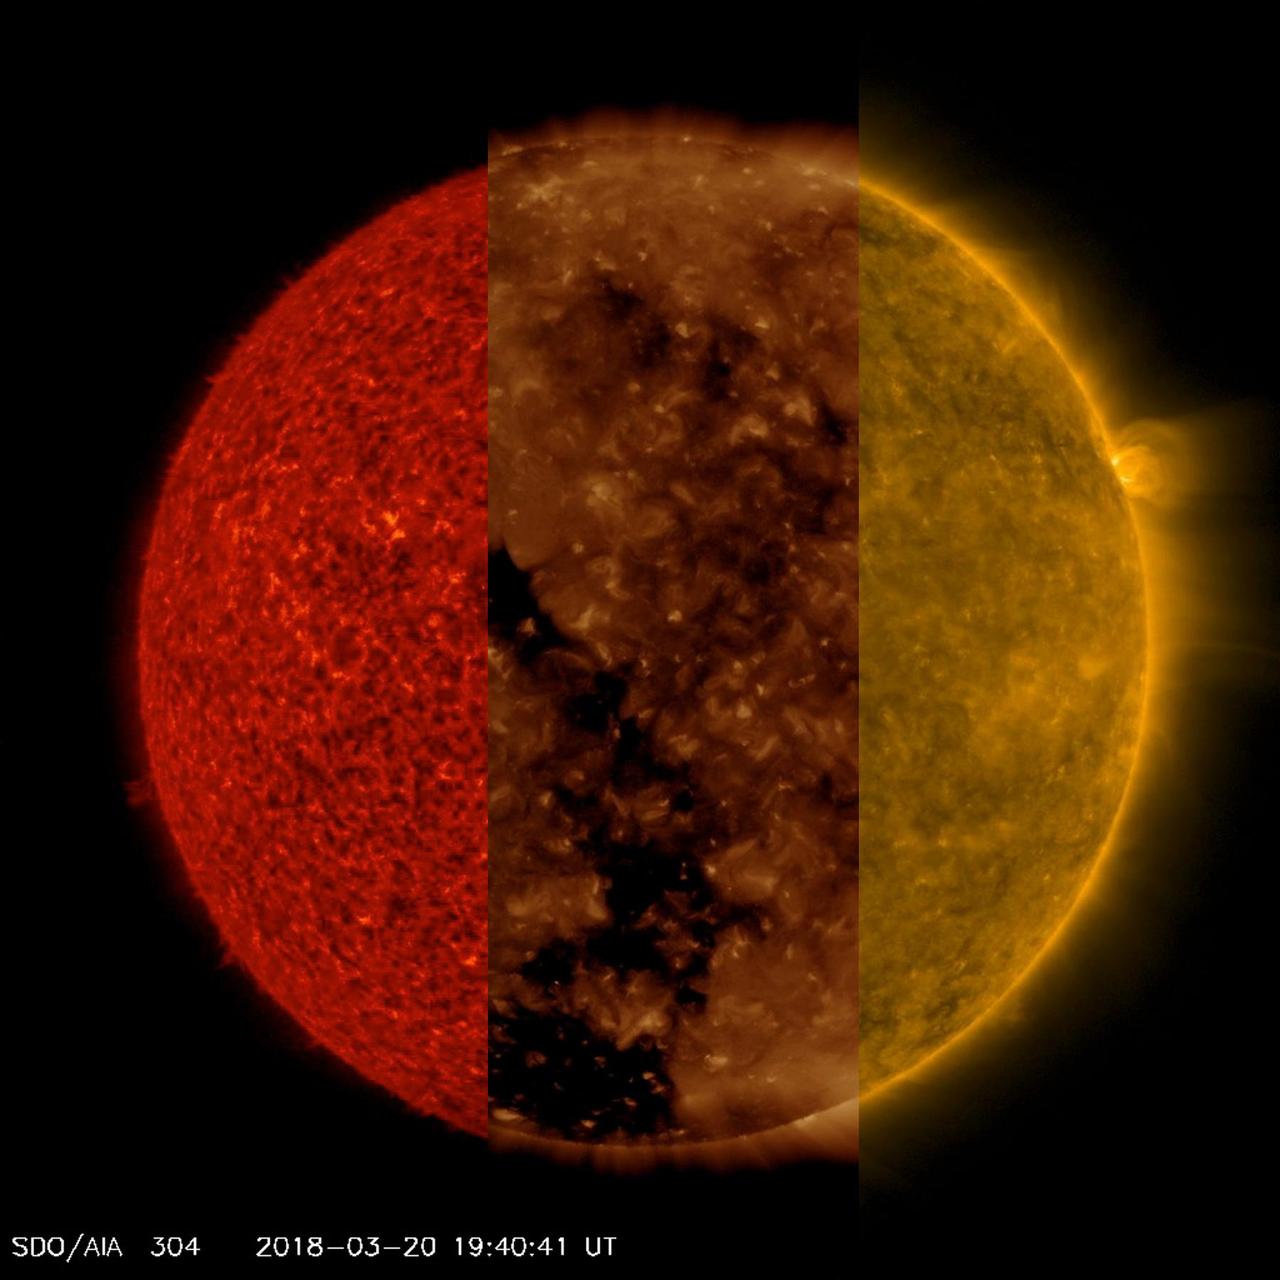
NASA's Solar Dynamics Observatory ran together three sequences of the sun taken in three different extreme ultraviolet wavelengths to better illustrate how different features that appear in one sequence are difficult if not impossible to see in the others (Mar. 20-21, 2018). In the red sequence (304 Angstroms), we can see very small spicules and some small prominences at the sun's edge, which are not easy to see in the other two sequences. In the second clip (193 Angstroms), we can readily observe the large and dark coronal hole, though it is difficult to make out in the others. In the third clip (171 wavelengths), we can see strands of plasma waving above the surface, especially above the one small, but bright, active region near the right edge. And these are just three of the 10 extreme ultraviolet wavelengths in which SDO images the sun every 12 seconds every day. That's a lot of data and a lot of science. Movies are available at https://photojournal.jpl.nasa.gov/catalog/PIA22360
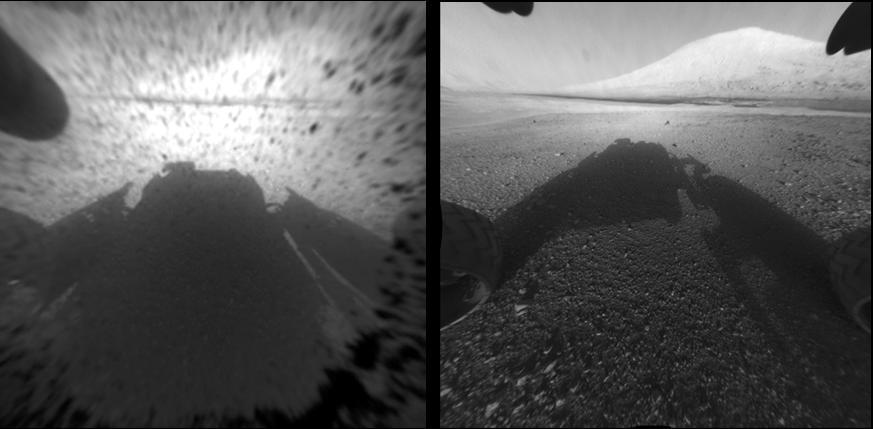
This image comparison shows a view through a Hazard-Avoidance camera on NASA Curiosity rover before and after the clear dust cover was removed. Both images were taken by a camera at the front of the rover. Mount Sharp, looms ahead.
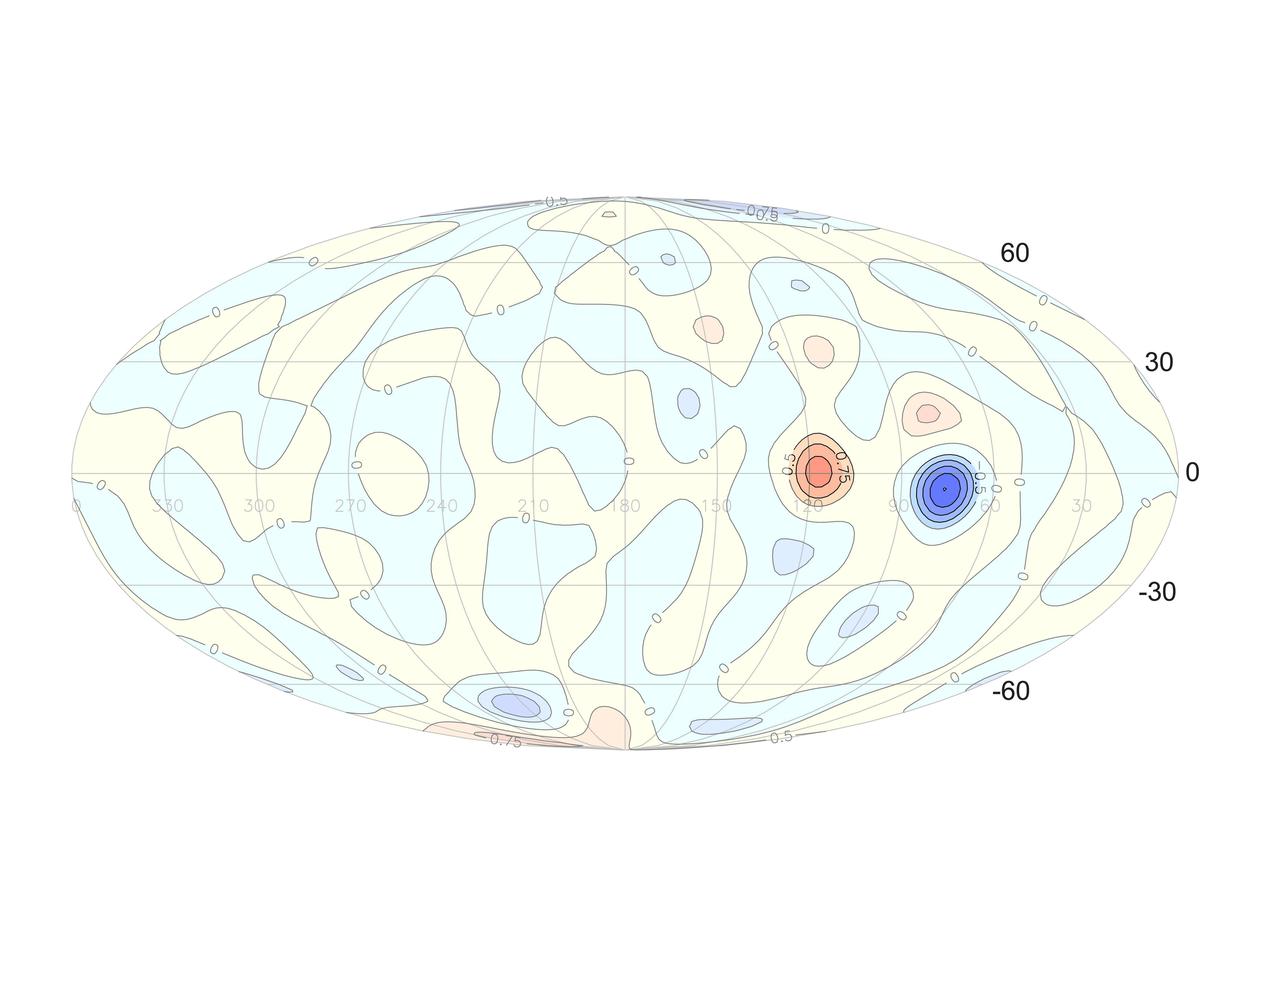
This graphic shows a comparison of the observed change in Jupiter's radial magnetic field, over time, as well as the change calculated from the model, assuming eastward drift of the "Great Blue Spot" (GBS). https://photojournal.jpl.nasa.gov/catalog/PIA25036
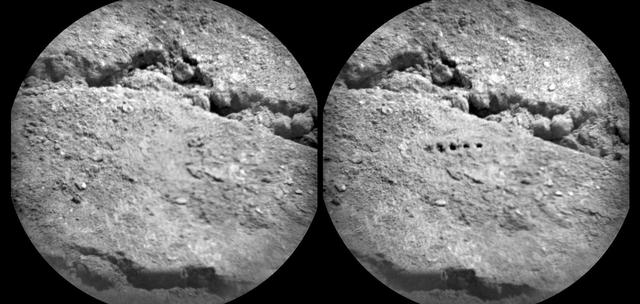
The Chemistry and Camera ChemCam instrument on NASA Mars rover Curiosity used its laser to examine side-by-side points in a target patch of soil, leaving the marks apparent in this before-and-after comparison.
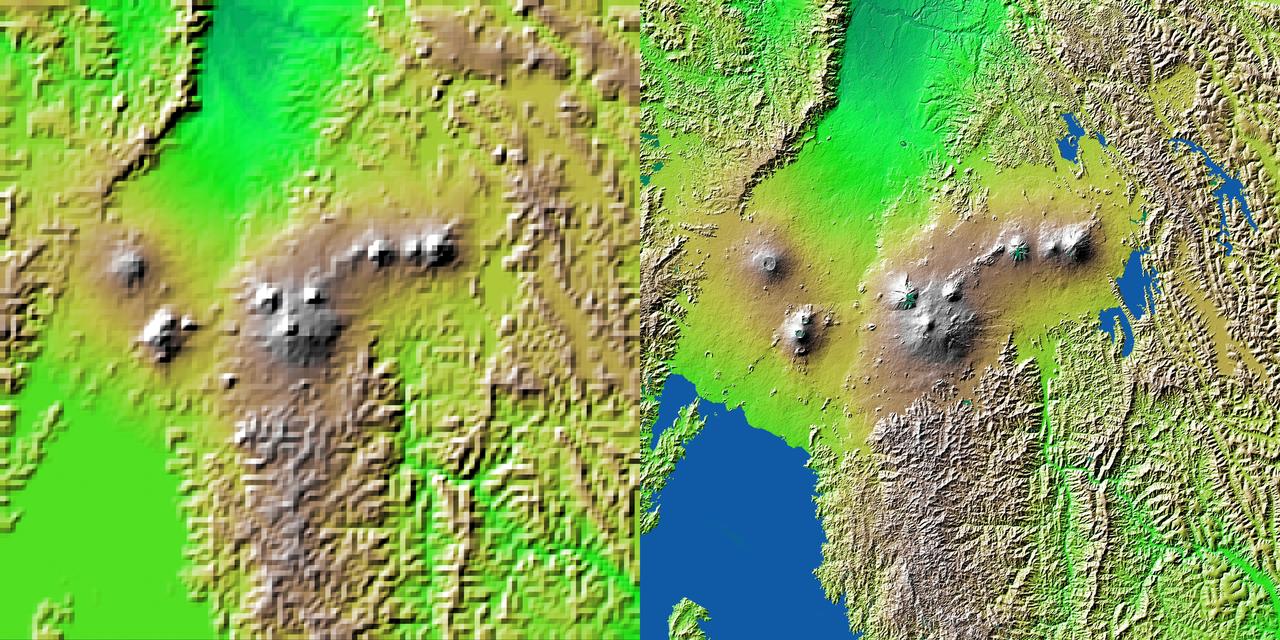
Volcanic, tectonic, erosional and sedimentary landforms are all evident in this comparison of two elevation models of a region along the East African Rift at Lake Kivu. The area shown covers parts of Congo, Rwanda and Uganda.

This grouping of two test rovers and a flight spare provides a graphic comparison of three generations of Mars rovers developed at NASA Jet Propulsion Laboratory, Pasadena, Calif. The setting is JPL Mars Yard testing area.

These side-by-side, 3-D comparisons depict the unnamed lunar mountain targeted by the NASA Gravity Recovery and Interior Laboratory GRAIL mission for controlled impact of the Ebb and Flow spacecraft.
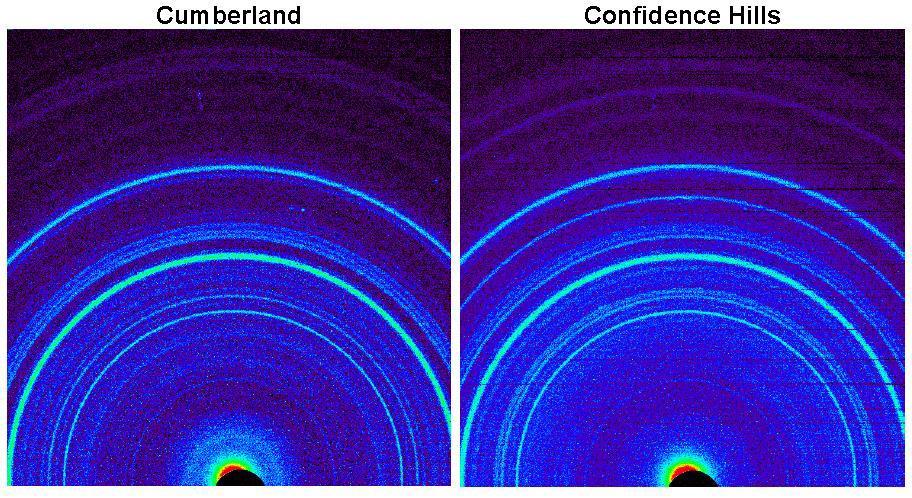
This side-by-side comparison shows the X-ray diffraction patterns of two different samples collected from rocks on Mars by NASA Curiosity rover. The images present data obtained by Curiosity Chemistry and Mineralogy instrument CheMin.

This comparison view shows a common, large vortex on Saturn as it plows through the atmosphere. The right image was taken about two Saturn rotations -- about 20 hours -- after the left image

The galaxy NGC 4395 is shown here in infrared light, captured by NASA Spitzer Space Telescope. This dwarf galaxy is relatively small in comparison with our Milky Way galaxy, which is nearly 1,000 times more massive.

This image from NASA Mars rover Curiosity provides a comparison for how big the moons of Mars appear to be, as seen from the surface of Mars, in relation to the size that Earth moon appears to be when seen from the surface of Earth.
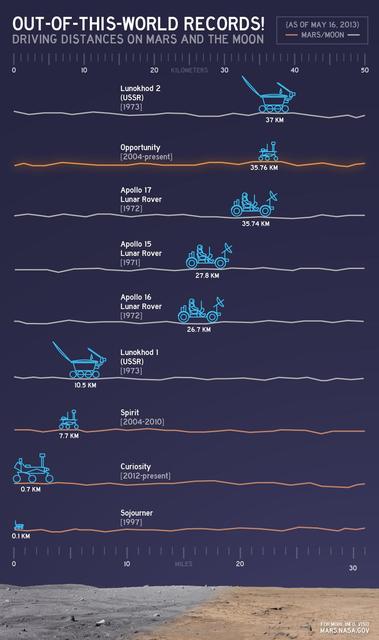
This chart illustrates comparisons among the distances driven by various wheeled vehicles on the surface of Earth moon and Mars. Of the vehicles shown, the NASA Mars rovers Opportunity and Curiosity are still active.
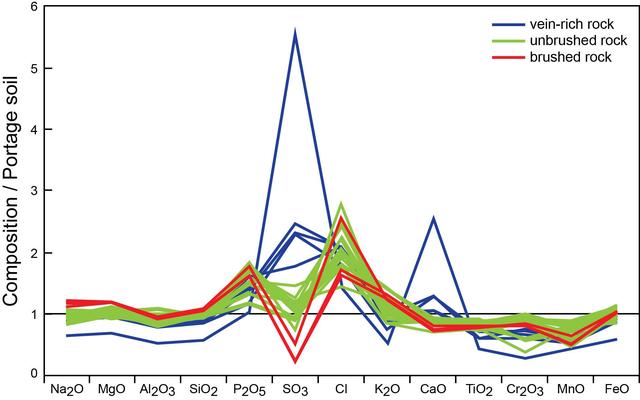
This graphic presents results from APXS onboard NASA rover Curiosity, with the comparisons simplified across diverse elements by dividing the amount of each element measured in the rocks by the amount of the same element in a local soil.

This grouping of two test rovers and a flight spare provides a graphic comparison of three generations of Mars rovers developed at NASA Jet Propulsion Laboratory, Pasadena, Calif. The setting is JPL Mars Yard testing area.

This graphic offers comparisons between the amount of an organic chemical named chlorobenzene detected in the Cumberland rock sample and amounts of it in samples from three other Martian surface targets analyzed by NASA Curiosity Mars rover.

A dense network of small rivers or swampy areas appears to connect some of the seas on Saturn moon Titan, as seen in this comparison of data of the same area from two instruments on NASA Cassini spacecraft.
INSTRUMENTATION COMPARISON HARDWARE IN ICING RESEARCH TUNNEL IRT
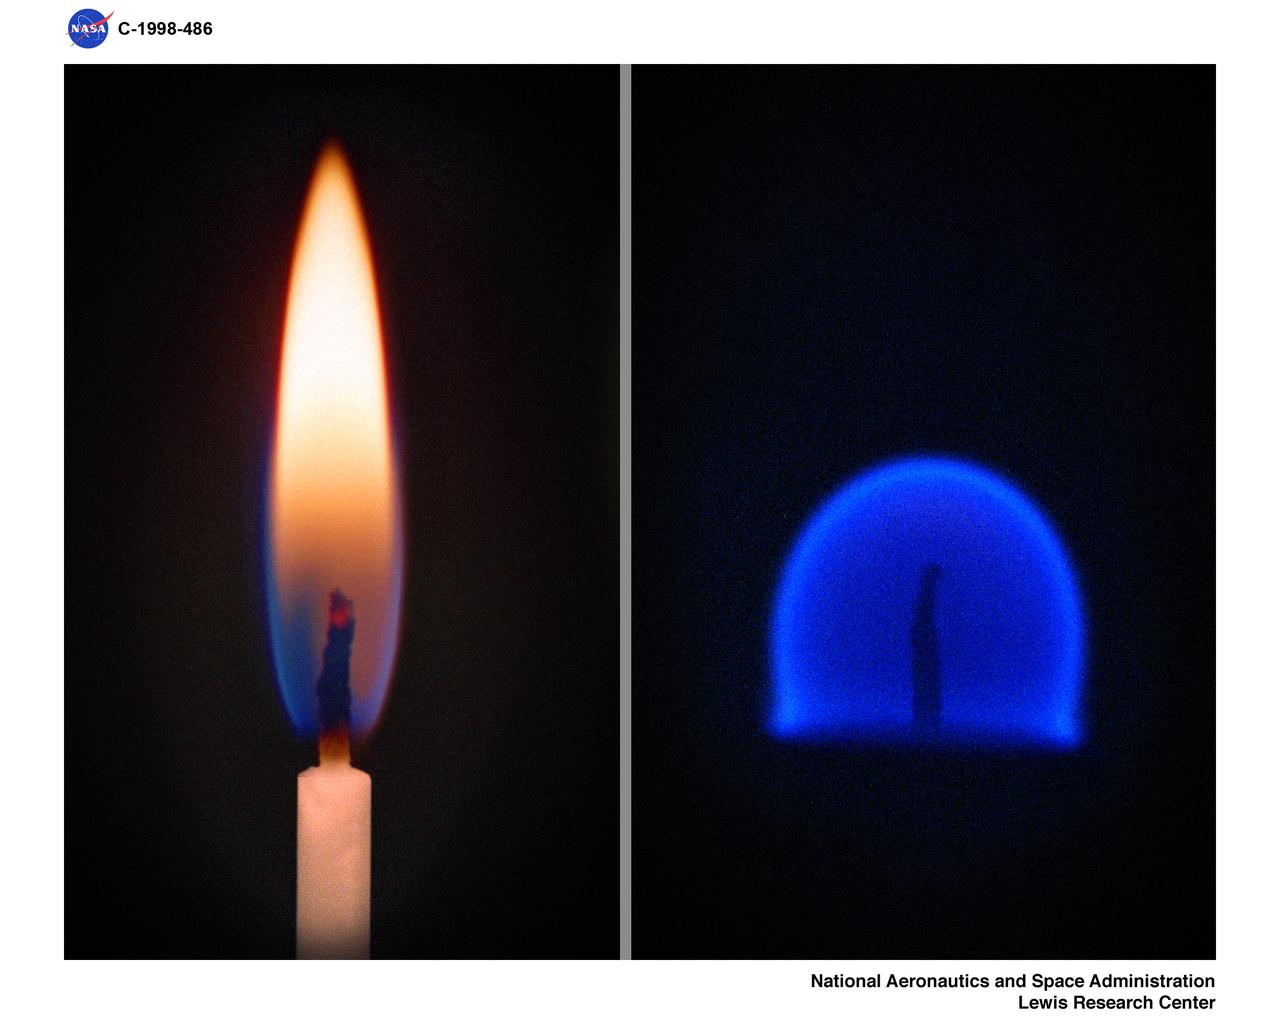
CANDLE FLAME NORMAL 1-G ONE GRAVITY AND MICROGRAVITY 0-G ZERO GRAVITY COMPARISON
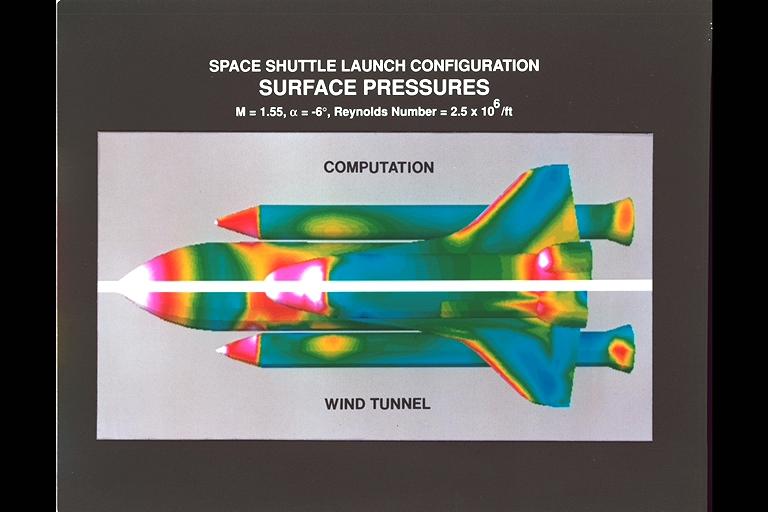
CFD: Space Shuttle Launch Configuration surface pressure comparison (right) computation and wind tunnel
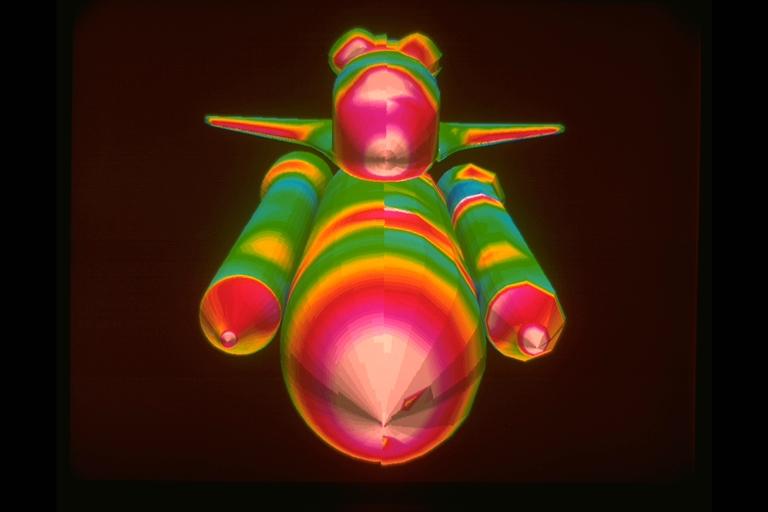
NAS CGI Space Shuttle Launch configuration showing surface pressure comparison (Computational/W.T.)
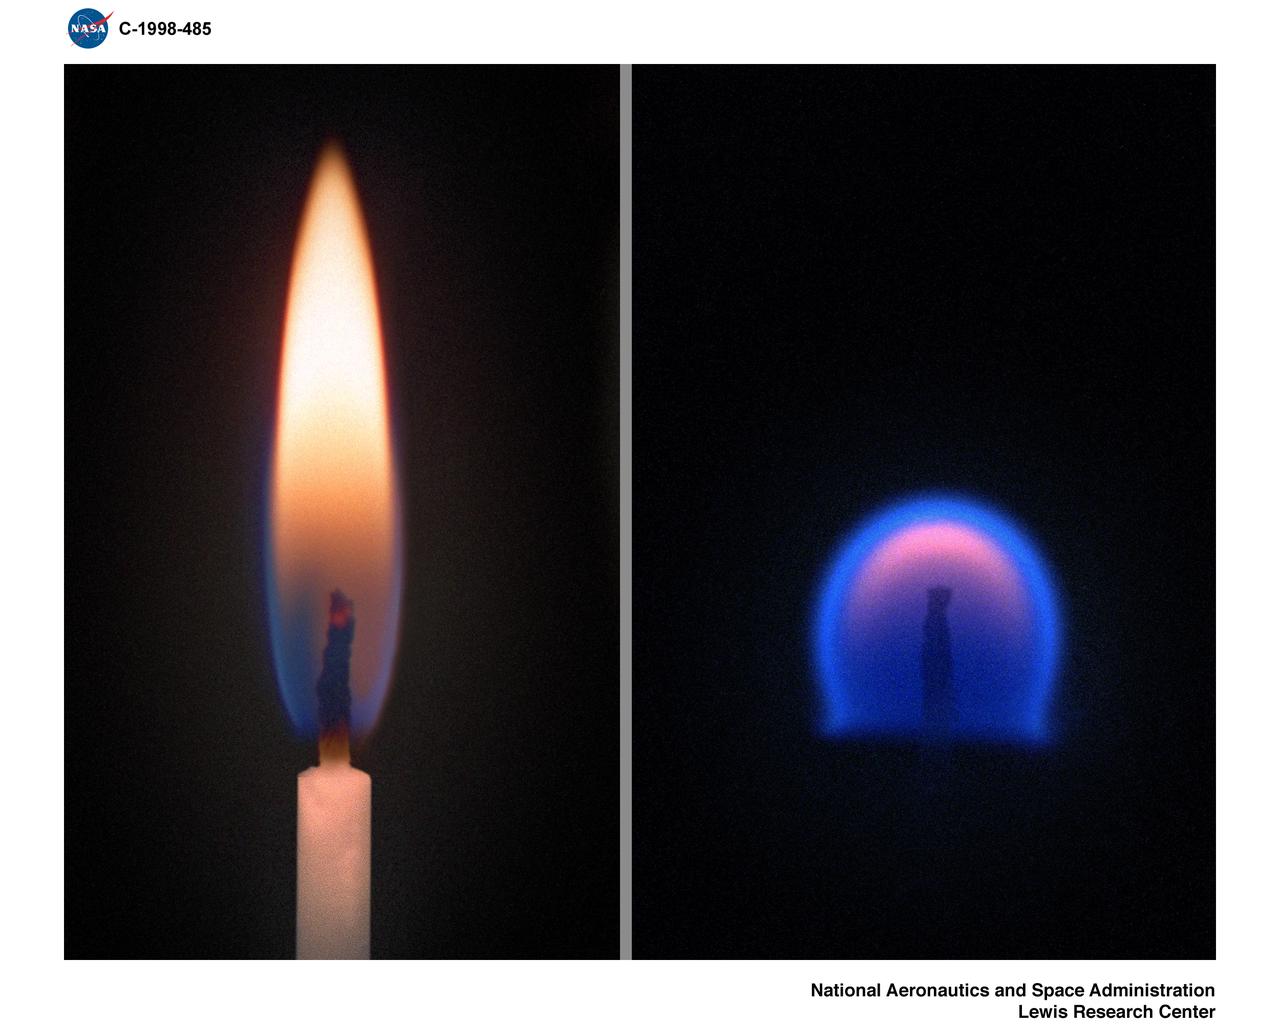
Comparison of a Candle Flame burning in normal gravity or 1-G (left) and a flame burning in Microgravity.

5 HOLE PROBE CALLIBRATION FOR 10X10 FOOT SUPERSONIC WIND TUNNEL AND 8X6 FOOT SUPERSONIC WIND TUNNEL COMPARISON TEST
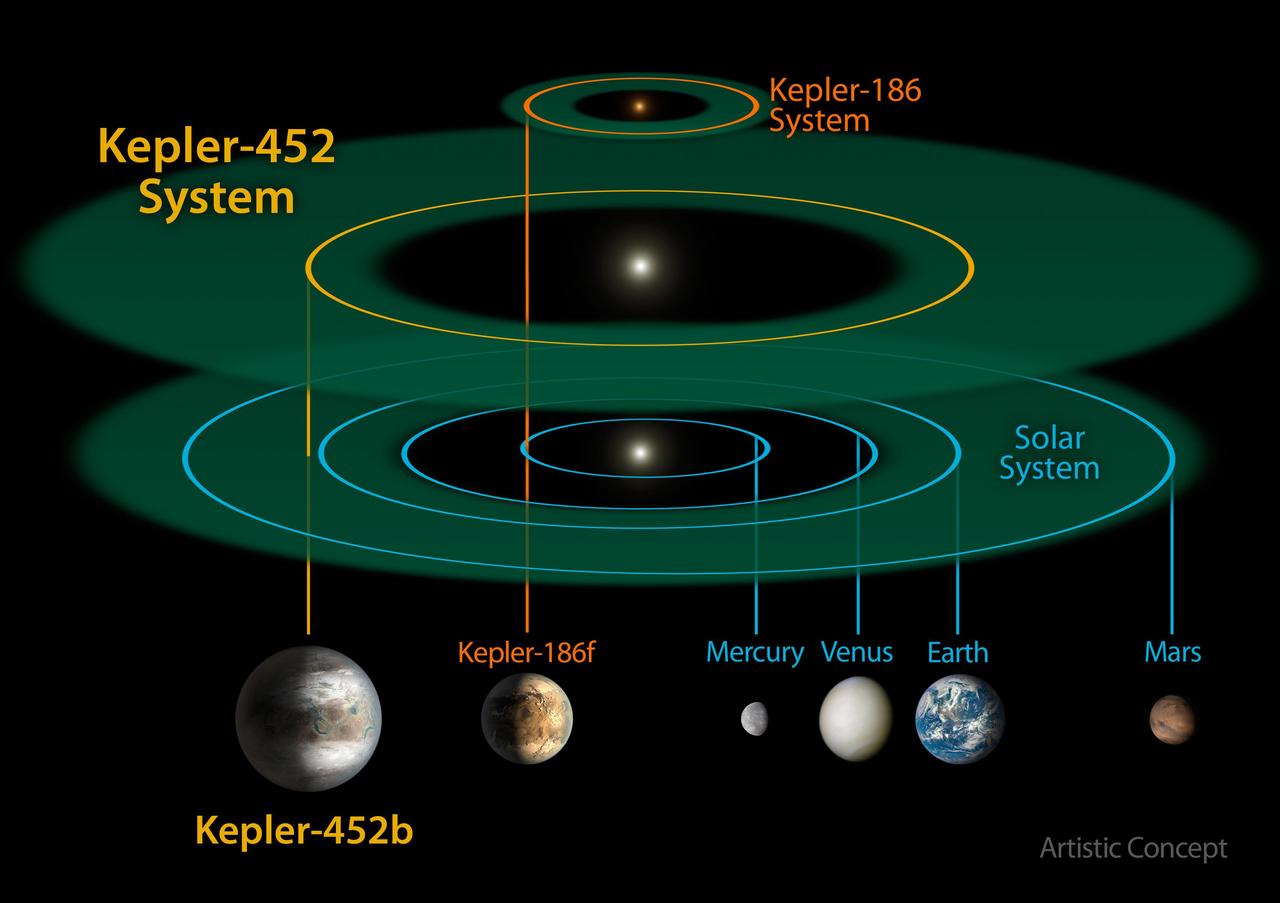
This size and scale of the Kepler-452 system compared alongside the Kepler-186 system and the solar system. Kepler-186 is a miniature solar system that would fit entirely inside the orbit of Mercury. The habitable zone of Kepler-186 is very small compared to that of Kepler-452 or the sun because it is a much smaller, cooler star. The size and extent of the habitable zone of Kepler-452 is nearly the same as that of the sun, but is slightly bigger because Kepler-452 is somewhat older, bigger and brighter. The size of the orbit of Kepler-452b is nearly the same as that of Earth at 1.05 astronomical units (an astronomical unit is the distance between Earth and the sun). Kepler-452b orbits its star once every 385 days. http://photojournal.jpl.nasa.gov/catalog/PIA19826
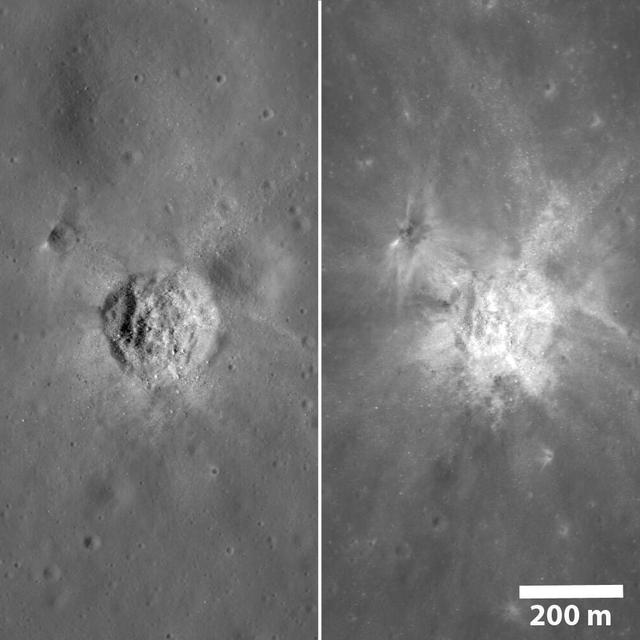
The same crater, as seen by NASA Lunar Reconnaissance Orbiter, under very different lighting. On the left the Sun was midway to the horizon and on the right the Sun was high, approaching noon.

This montage shows asteroid 951 Gaspra top compared with Deimos lower left and Phobos lower right, the moons of Mars. http://photojournal.jpl.nasa.gov/catalog/PIA00078
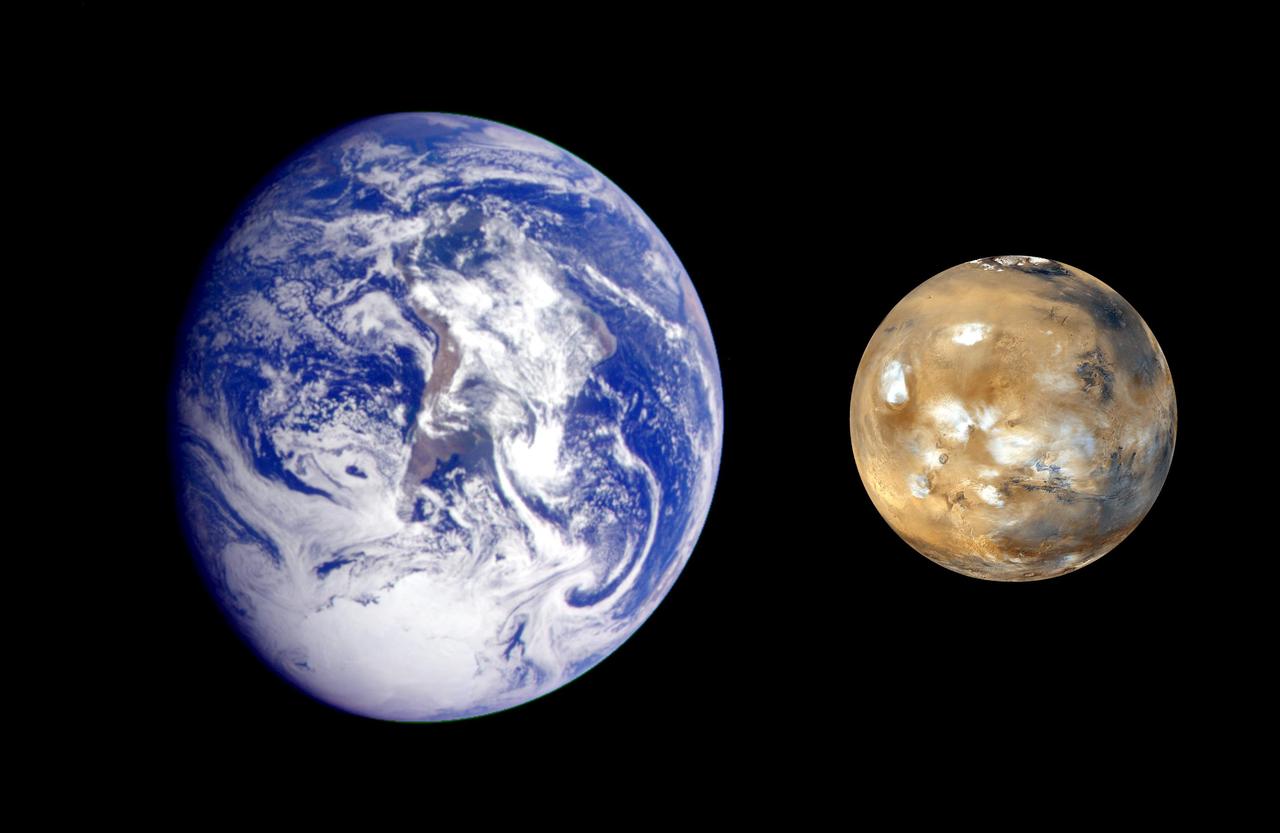
This composite image, from NASA Galileo and Mars Global Survey orbiters, of Earth and Mars was created to allow viewers to gain a better understanding of the relative sizes of the two planets.
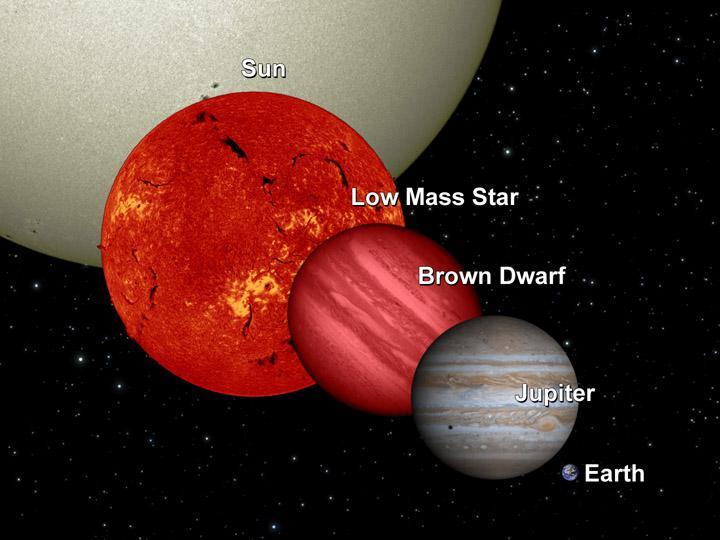
NASA Wide-field Infrared Survey Explorer will uncover many failed stars, or brown dwarfs, in infrared light. This diagram shows a brown dwarf in relation to Earth, Jupiter, a low-mass star and the sun.
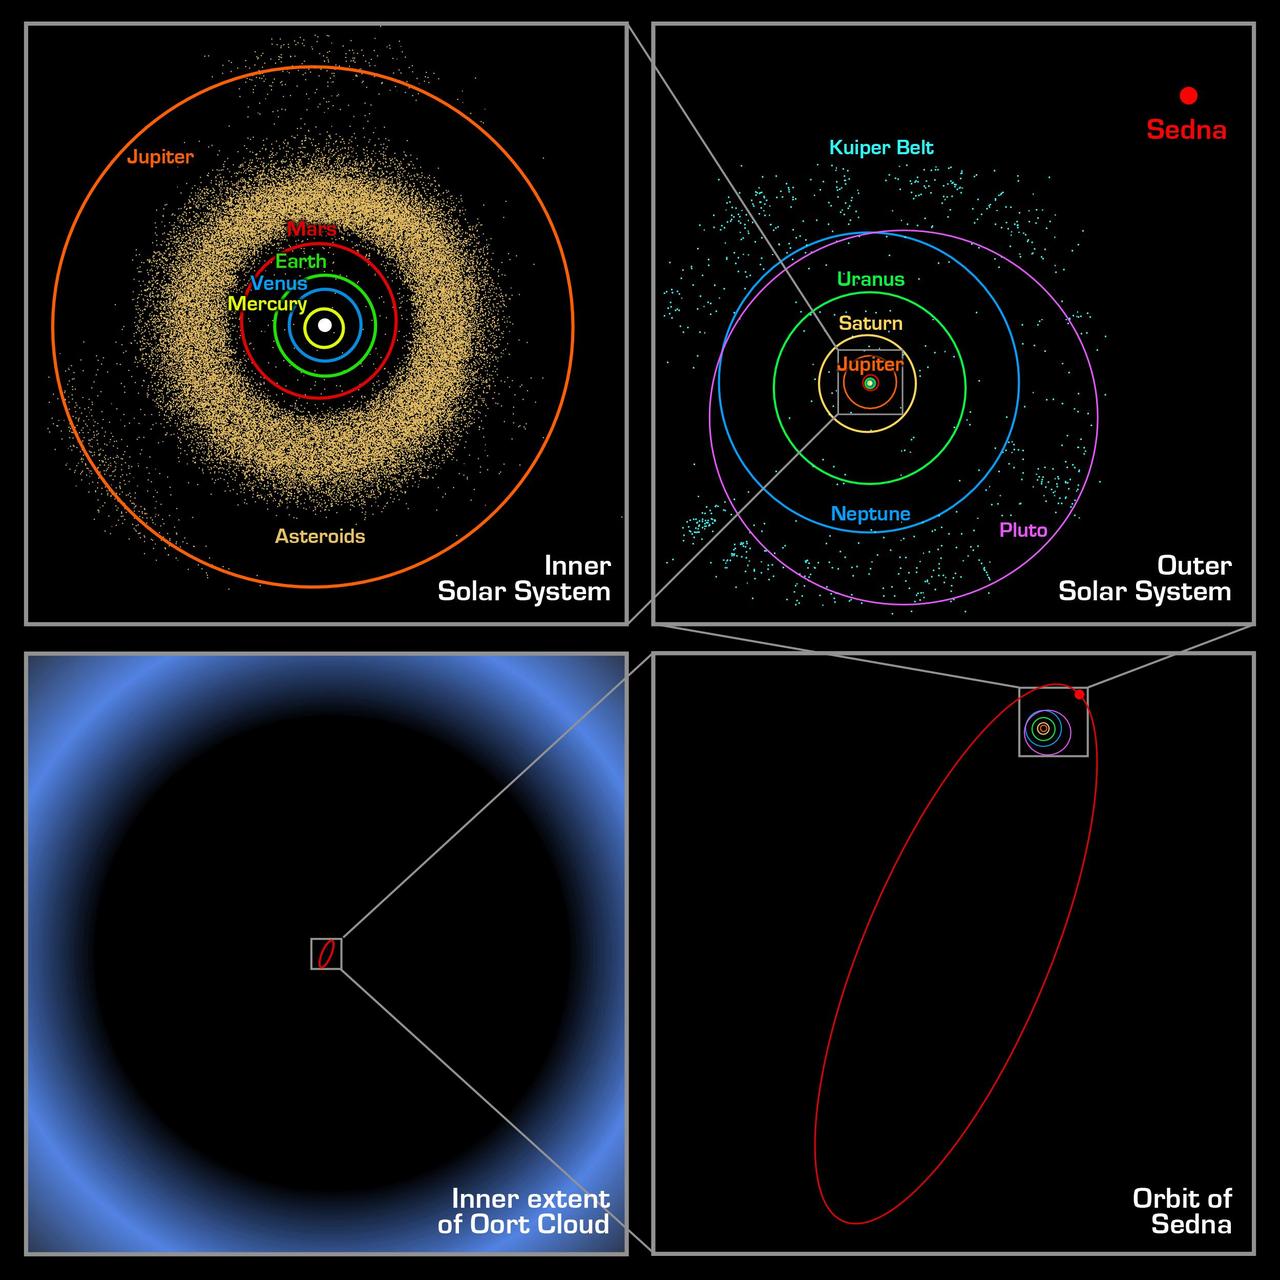
These four panels show the location of the newly discovered planet-like object, dubbed "Sedna," which lies in the farthest reaches of our solar system. Each panel, moving counterclockwise from the upper left, successively zooms out to place Sedna in context. The first panel shows the orbits of the inner planets, including Earth, and the asteroid belt that lies between Mars and Jupiter. In the second panel, Sedna is shown well outside the orbits of the outer planets and the more distant Kuiper Belt objects. Sedna's full orbit is illustrated in the third panel along with the object's current location. Sedna is nearing its closest approach to the Sun; its 10,000 year orbit typically takes it to far greater distances. The final panel zooms out much farther, showing that even this large elliptical orbit falls inside what was previously thought to be the inner edge of the Oort cloud. The Oort cloud is a spherical distribution of cold, icy bodies lying at the limits of the Sun's gravitational pull. Sedna's presence suggests that this Oort cloud is much closer than scientists believed. http://photojournal.jpl.nasa.gov/catalog/PIA05569
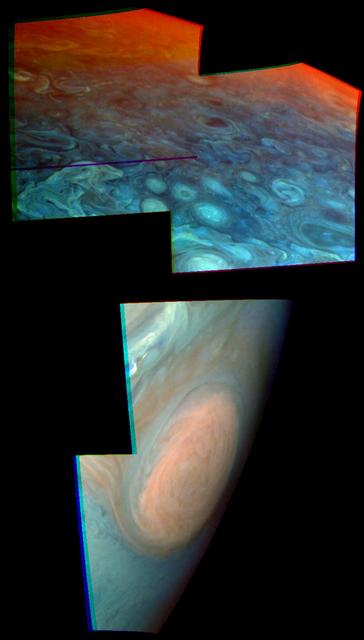
These two views of Jupiter obtained by NASA Galileo spacecraft show evidence of strikingly different stratospheric hazes between the polar regions and low or mid latitudes. The Great Red Spot shows in one mosaic taken on June 26, 1996.
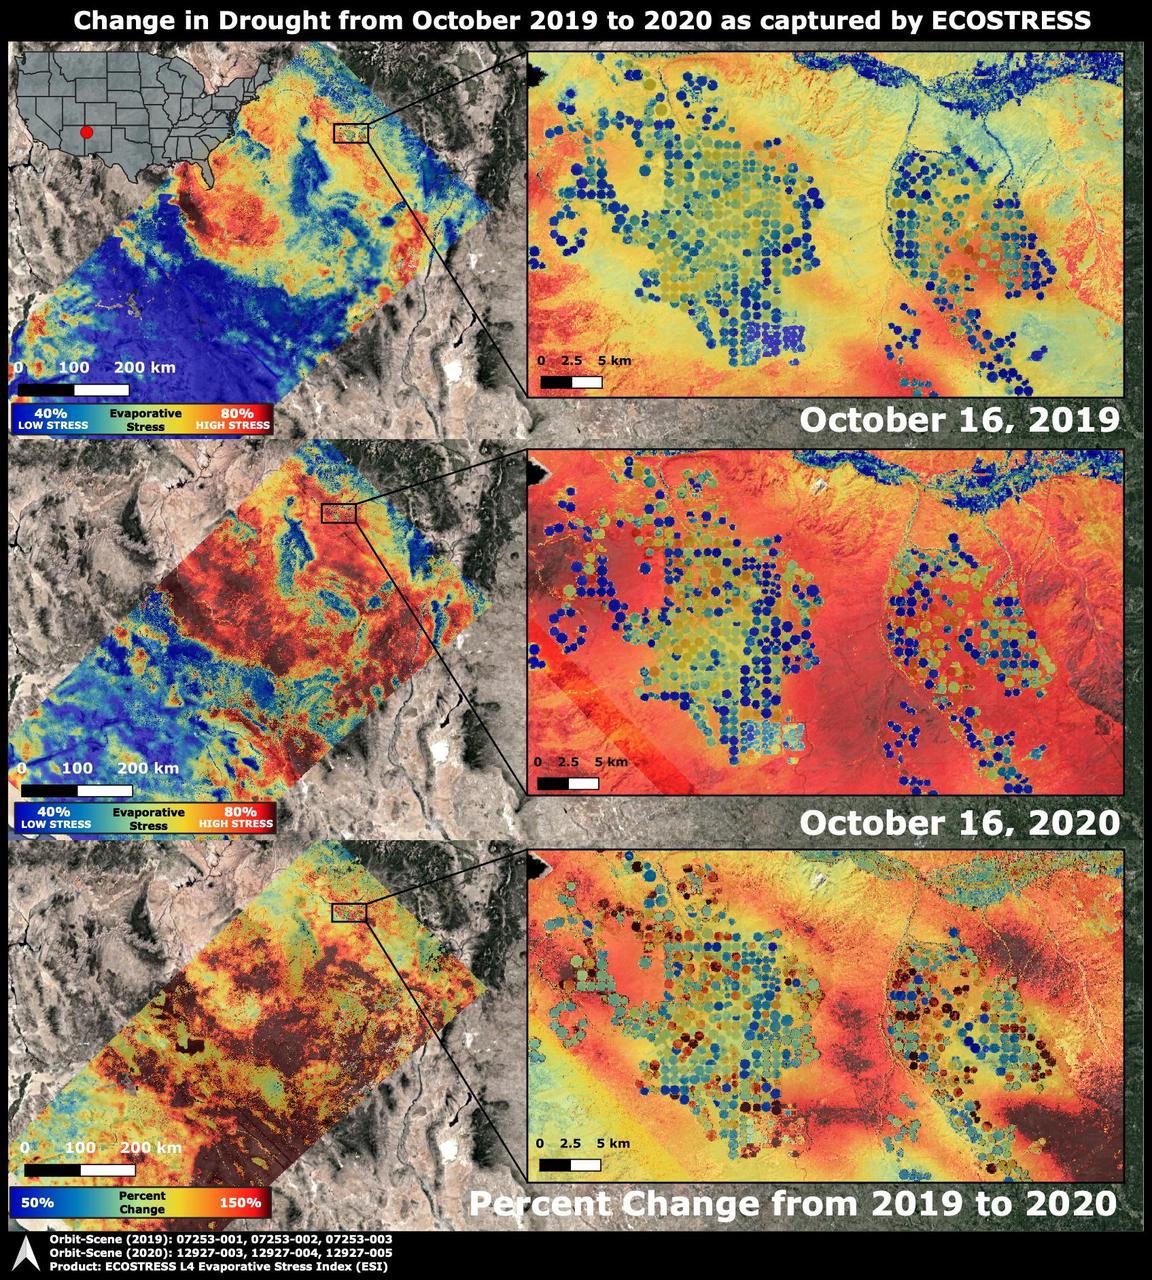
The Western United States has been entrenched in an Extreme and Exceptional drought that has extended from the summer and into the fall of 2020. NASA's ECOsystem Spaceborne Thermal Radiometer Experiment on Space Station (ECOSTRESS) imaged the drought on Oct. 16, 2020, and compared the same area to an image from ECOSTRESS taken a year earlier on Oct. 16, 2019. The bottom image shows the percentage change in plant water stress from 2019 to 2020. The images at left zoom into the Arizona and New Mexico border and Navajo Nation Territory area, featuring the ECOSTRESS Evaporative Stress Index (ESI), which shows plant water stress. The inset images on the right zoom further into the region, showing circular agricultural fields that have been irrigated. Blue colors represent low stress and high water use, whereas red colors represent high stress and low water use. Irrigation is able to alleviate plant water stress in many of the fields while the surrounding landscape suffers from the drought, though numerous agricultural fields are shut down in the drought image. The primary mission of ECOSTRESS, which launched to the International Space Station in June 2018, is to provide insight into plants' health, especially in a drought, by taking their temperature. Plants regulate their temperature by releasing water through tiny pores on their leaves. With sufficient water, they can maintain their temperature. When they lack water, their temperatures rise; ECOSTRESS can measure this change. https://photojournal.jpl.nasa.gov/catalog/PIA24132
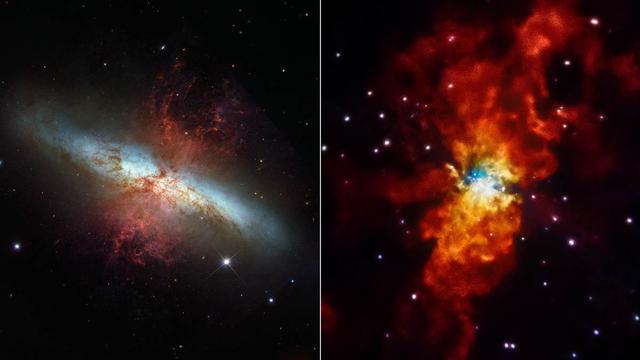
The comparison from NASA Hubble telescope and Chandra X-ray Observatory highlights how different the universe can look when viewed in other wavelengths of light. M82 is located 12 million light-years away in the Ursa Major constellation.
This NASA Mars Odyssey image covers a large area over the summit of Ulysses Patera, one of the many volcanoes that make up the giant Tharsis volcanic province, although Ulysses itself is fairly small in comparison to the other volcanoes in this area. http://photojournal.jpl.nasa.gov/catalog/PIA03900
This two-image blink shows a comparison of two exposure times in images from the panoramic camera Pancam on NASA Mars Exploration Rover Opportunity showing comet C/2013 A1 Siding Spring as it flew near Mars on Oct. 19, 2014.

In the distance stand the east hills, which are closest to NASA's Mars Exploration Rover Spirit in comparison to other hill ranges seen on the martian horizon. The top of the east hills are approximately 2 to 3 kilometers (1 to 2 miles) away from the rover's approximate location. This image was taken on Mars by the rover's panoramic camera. http://photojournal.jpl.nasa.gov/catalog/PIA05061
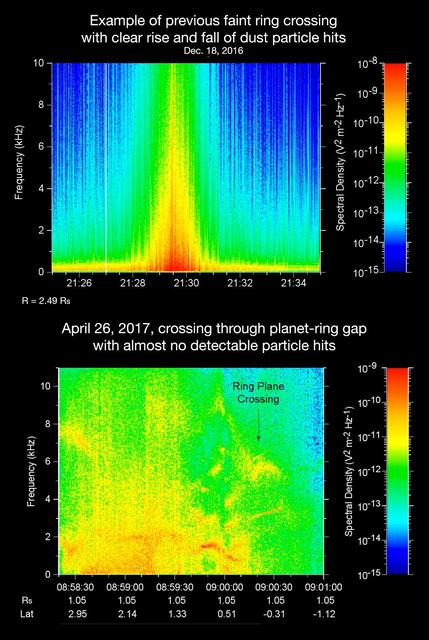
The sounds and spectrograms in these two videos represent data collected by the Radio and Plasma Wave Science, or RPWS, instrument on NASA's Cassini spacecraft, as it crossed the plane of Saturn's rings on two separate orbits. As tiny, dust-sized particles strike Cassini and the three 33-foot-long (10-meter-long), RPWS antennas, the particles are vaporized into tiny clouds of plasma, or electrically excited gas. These tiny explosions make a small electrical signal (a voltage impulse) that RPWS can detect. Researchers on the RPWS team convert the data into visible and audio formats, like those seen here, for analysis. Ring particle hits sound like pops and cracks in the audio. The first video (top image in the montage) was made using RPWS data from a ring plane crossing on Dec. 18, 2016, when the spacecraft passed through the faint, dusty Janus-Epimetheus ring (see PIA08328 for an image that features this ring). This was during Cassini's 253rd orbit of Saturn, known as Rev 253. As is typical for this sort of ring crossing, the number of audible pops and cracks rises to a maximum around the time of a ring crossing and trails off afterward. The peak of the ring density is obvious in the colored display at the red spike. The second video (bottom image in the montage) was made using data RPWS collected as Cassini made the first dive through the gap between Saturn and its rings as part of the mission's Grand Finale, on April 26, 2017. Very few pops and cracks are audible in this data at all. In comparing the two data sets, it is apparent that while Cassini detected many ring-particles striking Cassini when passing through the Janus-Epimetheus ring, the first Grand Finale crossing -- in stark contrast -- was nearly particle free. The unexpected finding that the gap is so empty is a new mystery that scientists are eager to understand. On April 26, 2017, Cassini dove through the previously unexplored ring-planet gap at speeds approaching 75,000 mph (121,000 kph), using its large, dish-shaped high-gain antenna (or HGA) as a shield to protect the rest of the spacecraft and its instruments from potential impacts by small, icy ring particles. Two of Cassini's instruments, the magnetometer and RPWS, extend beyond the protective antenna dish, and were exposed to the particle environment during the dive. The Cassini team used this data from RPWS, along with inputs from other components on the spacecraft, to make the decision of whether the HGA would be needed as a shield on most future Grand Finale dives through the planet-ring gap. Based on these inputs the team determined this protective measure would not be needed, allowing the team's preferred mode of science operations to proceed, with Cassini able to point its science instruments in any direction necessary to obtain scientists' desired observations. (Four of the 21 remaining dives pass through the inner D ring. The mission had already planned to use the HGA as a shield for those passes.) The colors on the spectrogram indicate the emitted power of the radio waves, with red as the most powerful. Time is on the x-axis, and frequency of the radio waves is on the y-axis. The audible whistle in the April 26 data, just before ring plane crossing, is due to a type of plasma wave that will be the subject of further study. In addition, there is an abrupt change beginning at the 09:00:00 mark on the spectrogram that represents a change in the RPWS antenna's operational configuration (from monopole mode to dipole mode). The videos can be viewed at https://photojournal.jpl.nasa.gov/catalog/PIA21446
NASA GLENN/NASA LANGLEY LOADS COMPARISON TEST WITH 6 COMPONENT FORCE/MOMENT BALANCE AND 1.7% HIGH SPEED RESEARCH MODEL 5.l in the 10x10 supersonic wind tunnel
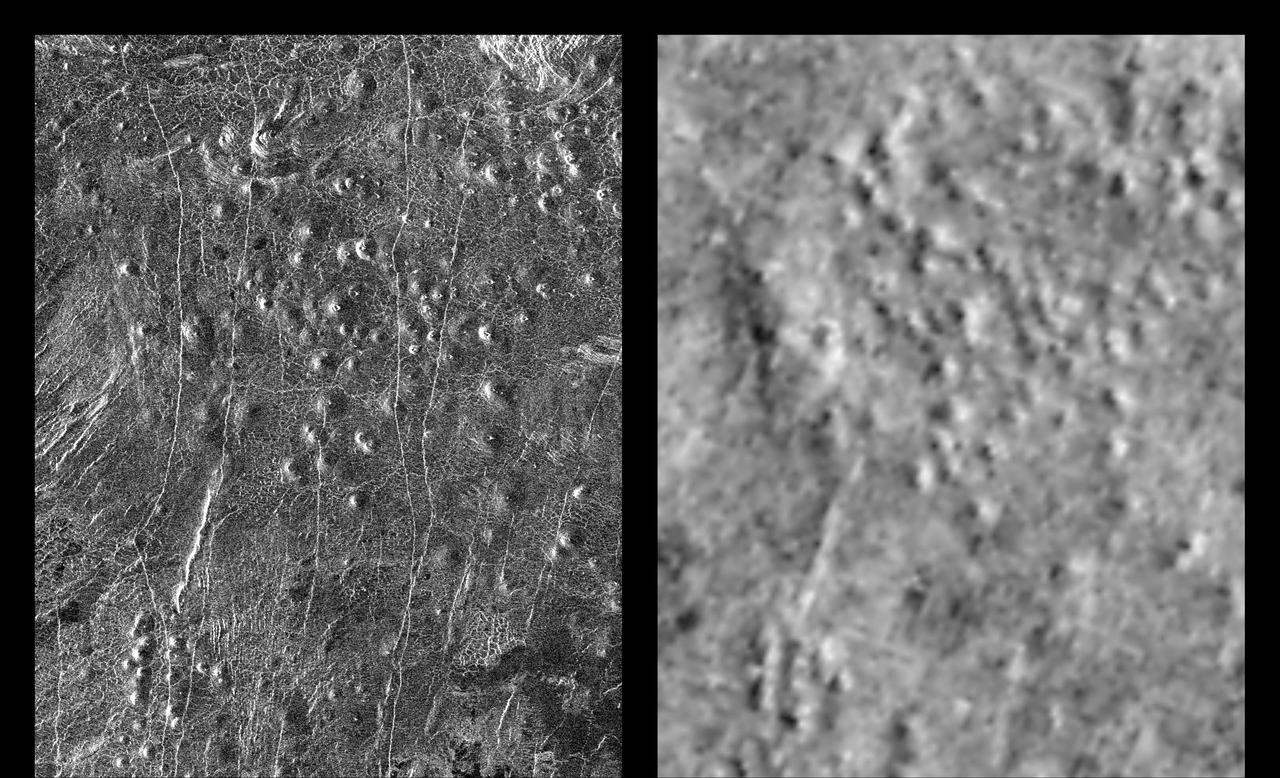
These radar images show an identical area on Venus (centered at 110 degrees longitude and 64 degrees north latitude) as imaged by the U.S. NASA Magellan spacecraft in 1991 (left) and the U.S.S.R. Venera 15/16 spacecraft in the early 1980's (right). Illumination is from the left (or west) in the Magellan image (left) and from the right (or east) in the Venera image (right). Differences in apparent shading in the images are due to differences in the two radar imaging systems. Prior to Magellan, the Venera 15/16 data was the best available for scientists studying Venus. Much greater detail is visible in the Magellan image owing to the greater resolution of the Magellan radar system. In the area seen here, approximately 200 small volcanoes, ranging in diameter from 2 to 12 kilometers (1.2 to 7.4 miles) can be identified. These volcanoes were first identified as small hills in Venera 15/16 images and were predicted to be shield-type volcanoes constructed mainly from eruptions of fluid lava flows similar to those that produce the Hawaiian Islands and sea floor volcanoes - a prediction that was confirmed by Magellan. These small shield-type volcanoes are the most abundant geologic feature on the surface of Venus, believed to number in the hundreds of thousands, perhaps millions, and are important evidence in understanding the geologic evolution of the planet. The only other planet in our Solar System with this large number of volcanoes is Earth. Clearly visible in the Magellan image are details of volcano morphology, such as variation in slope, the occurrence and size range of summit craters, and geologic age relationships between adjacent volcanoes, as well as additional volcanoes that were not identifiable in the Venera image. http://photojournal.jpl.nasa.gov/catalog/PIA00465

This graph presents measured properties of the seven TRAPPIST-1 exoplanets (labeled b through h), showing how they stack up with one another as well as with Earth and the other inner rocky worlds in our own solar system. The relative sizes of the planets are indicated by the circles. All of the known TRAPPIST-1 planets are larger than Mars, with five of them within 15% of the diameter of Earth. The vertical axis shows the uncompressed densities of the planets. Density, calculated from a planet's mass and volume, is the first important step in understanding its composition. Uncompressed density takes into account that the larger a planet is, the more its own gravity will pack the planet's material together and increase its density. Uncompressed density, therefore, usually provides a better means of comparing the composition of planets. The plot shows that the uncompressed densities of the TRAPPIST-1 planets are similar to one another, suggesting they may have all have a similar composition. The four rocky planets in our own solar system show more variation in density compared to the seven TRAPPIST-1 planets. Mercury, for example, contains a much higher percentage of iron than the other three rocky planets and thus has a much higher uncompressed density. The horizontal axis shows the level of illumination that each planet receives from its host star. The TRAPPIST-1 star is a mere 9% the mass of our Sun, and its temperature is much cooler. But because the TRAPPIST-1 planets orbit so closely to their star, they receive comparable levels of light and heat to Earth and its neighboring planets. The corresponding "habitable zones" — regions where an Earth-like planet could potentially support liquid water on its surface — of the two planetary systems are indicated near the top of the plot. The the two zones do not line up exactly because the cooler TRAPPIST-1 star emitting more of its light in the form of infrared radiation that is more efficiently absorbed by an Earth-like atmosphere. Since it takes less illumination to reach the same temperatures, the habitable zone shifts farther away from the star. The masses and densities of the TRAPPIST-1 planets were determined by measurements of slight variations in the timings of their orbits using extensive observations made by NASA's Spitzer and Kepler space telescopes, in combination with data from Hubble and a number of ground-based telescopes. The latest analysis, which includes Spitzer's complete record of over 1,000 hours of TRAPPIST-1 observations, has reduced the uncertainties of the mass measurements to a mere 3-6%. These are among the most accurate measurements of planetary masses anywhere outside of our solar system. https://photojournal.jpl.nasa.gov/catalog/PIA24371
This set of images compares test images taken by four cameras on NASA Curiosity rover at NASA Jet Propulsion Laboratory before launch.
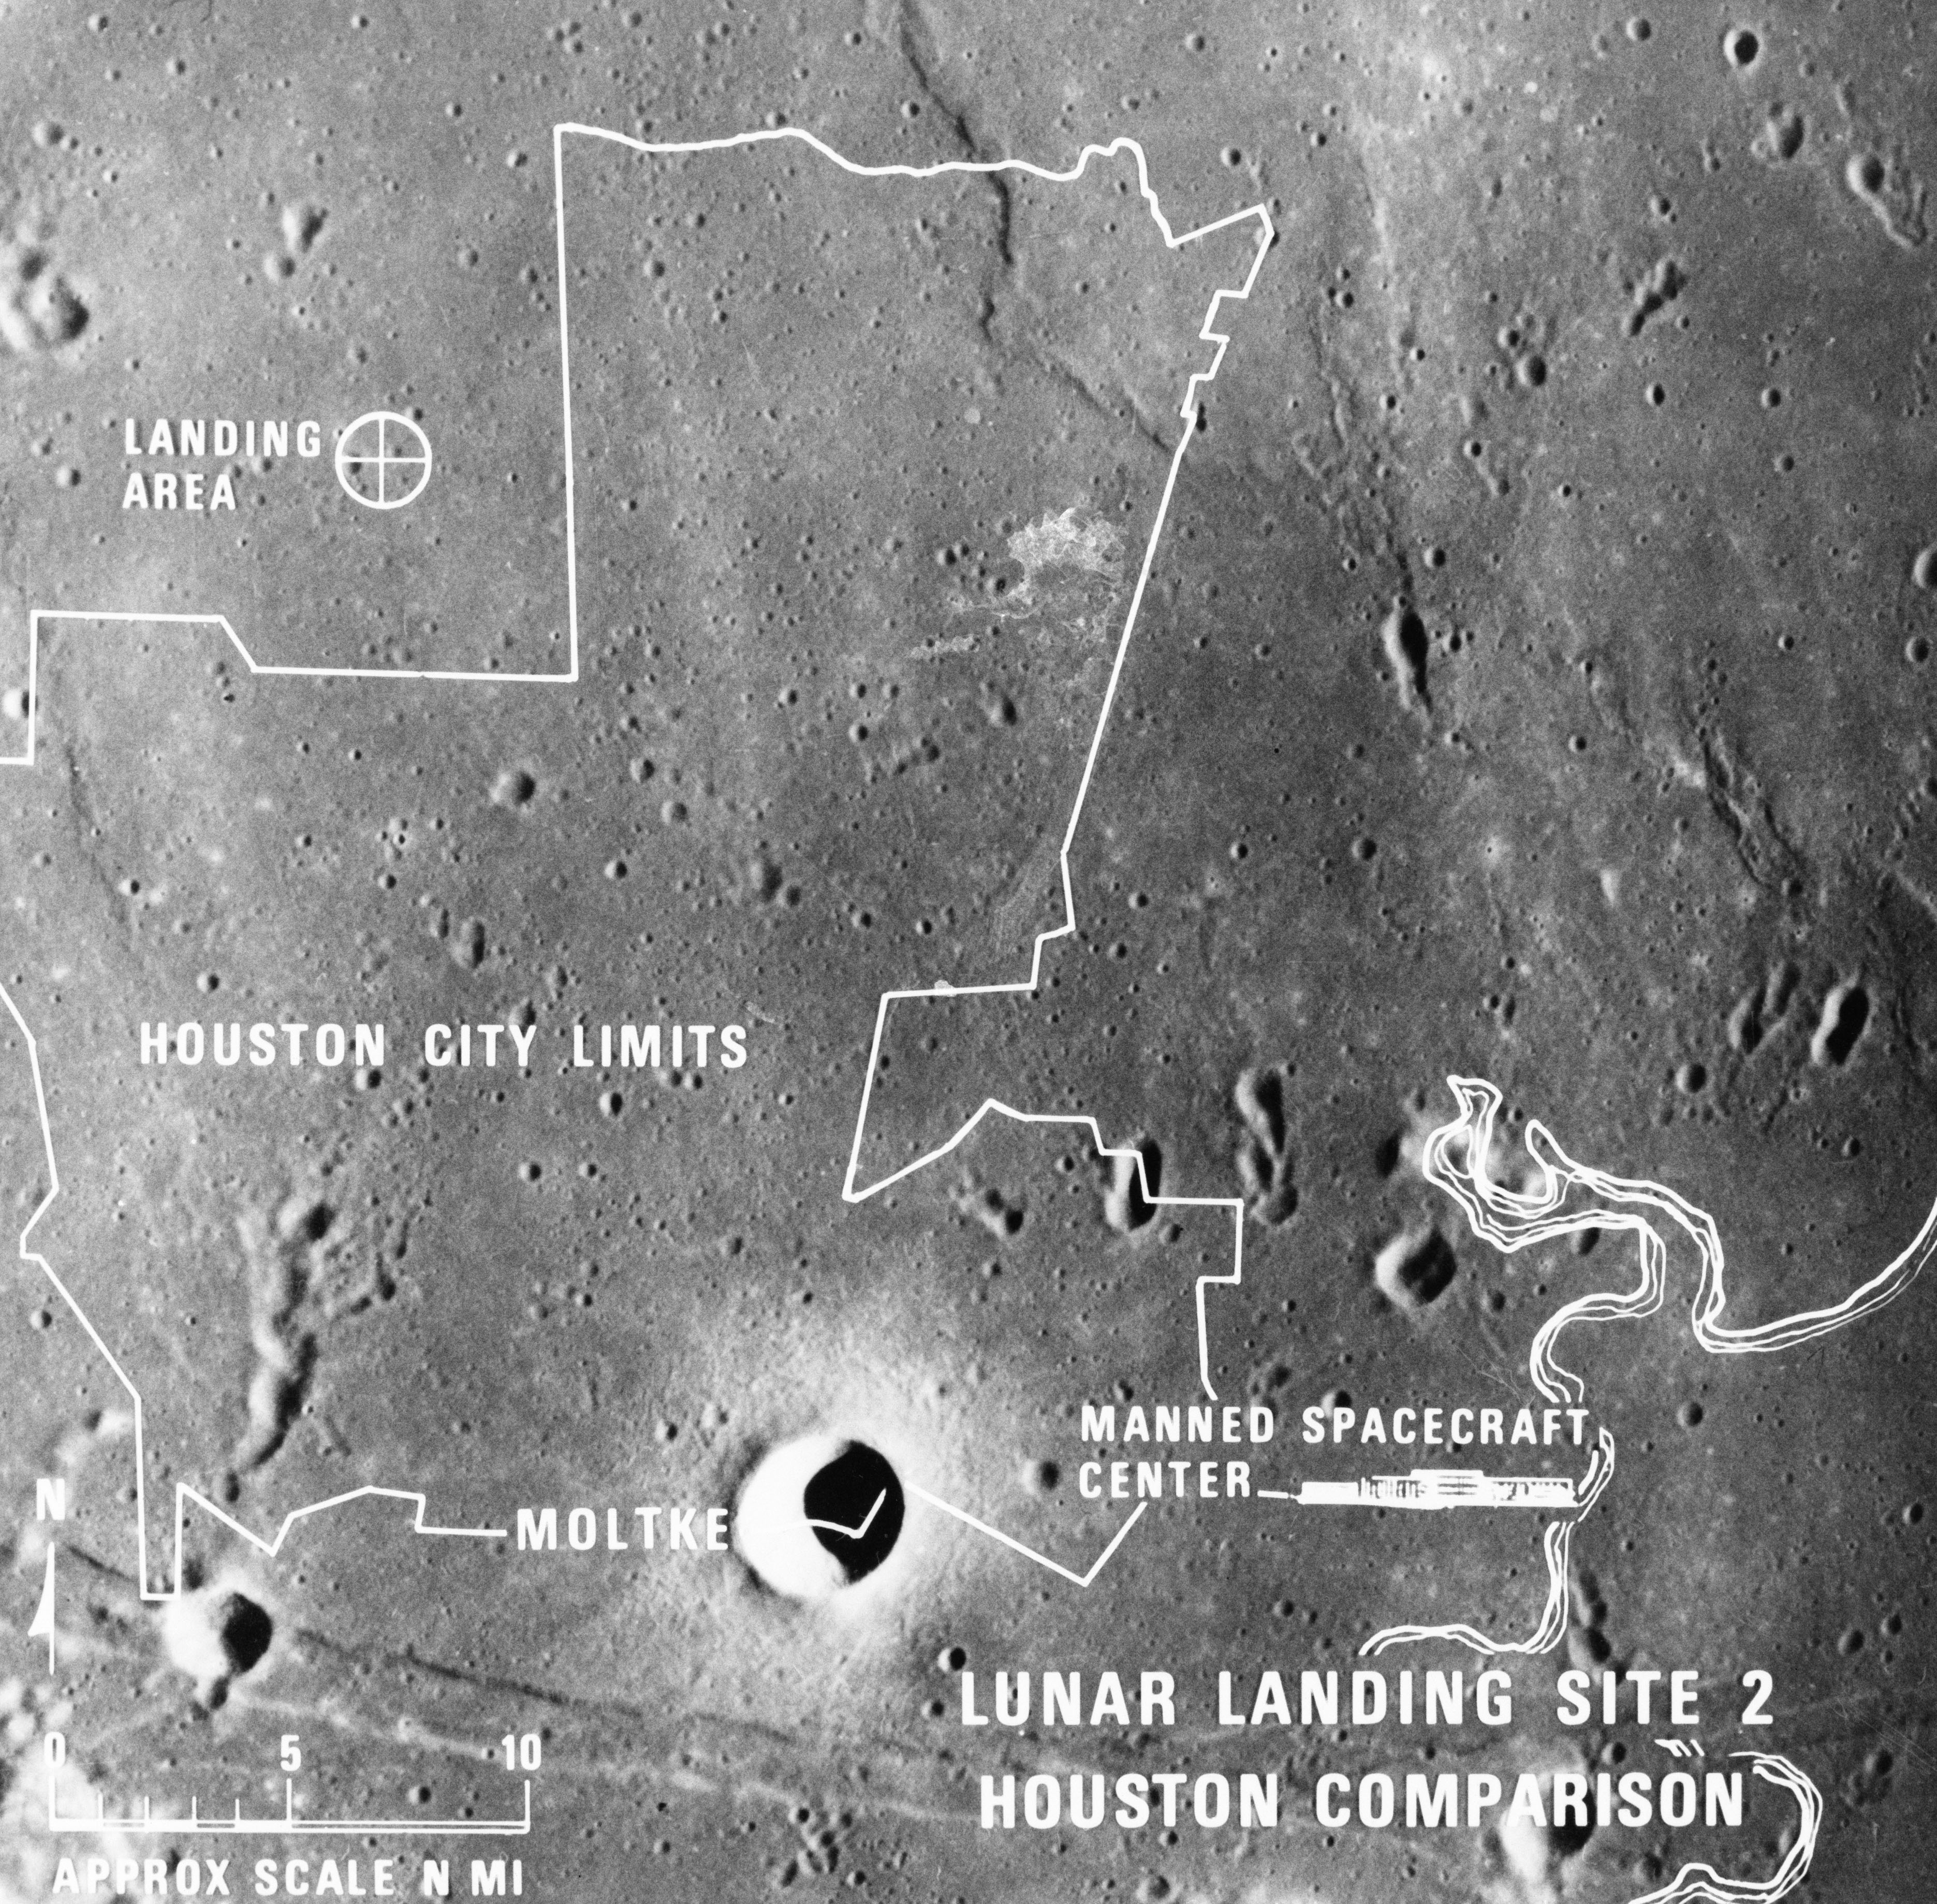
S69-38671 (July 1969) --- A photographic illustration comparing the size of Apollo Landing Site 2 with that of the metropolitan Houston, Texas area. Site 2 is one of three Apollo 11 lunar landing sites. This will be the landing site if Apollo 11 is launched on July 16, 1969, as scheduled. Site 2 is located at 23 degrees 42 minutes 28 seconds east longitude and 0 degrees 42 minutes 50 seconds north latitude in southwestern Mare Tranquillitatis (Sea of Tranquility). (The white overlay is printed over a lunar surface photograph taken from Apollo 10 during its lunar orbit mission and is numbered AS10-31-4537.)

These images demonstrate the dramatic improvement in the resolution of pictures that NASA Galileo spacecraft returned compared to previous images of the Jupiter system. http://photojournal.jpl.nasa.gov/catalog/PIA00277

The artist's rendition shows the newly discovered planet-like object, dubbed "Sedna," in relation to other bodies in the solar system, including Earth and its Moon; Pluto; and Quaoar, a planetoid beyond Pluto that was until now the largest known object beyond Pluto. The diameter of Sedna is slightly smaller than Pluto's but likely somewhat larger than Quaoar. http://photojournal.jpl.nasa.gov/catalog/PIA05567
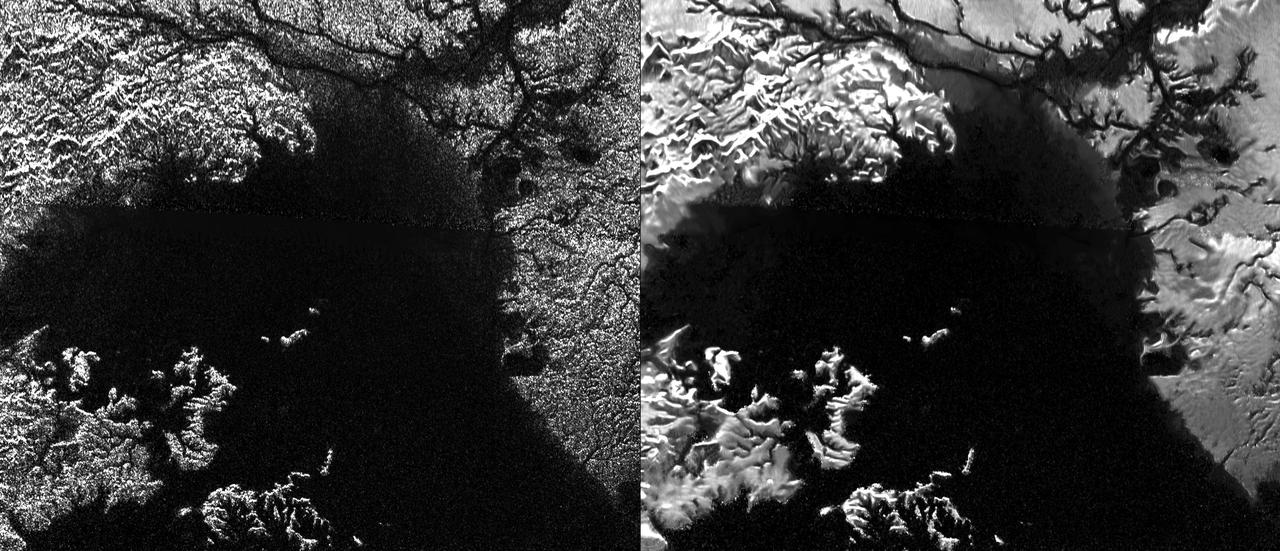
Presented here are side-by-side comparisons of a traditional Cassini Synthetic Aperture Radar (SAR) view and one made using a new technique for handling electronic noise that results in clearer views of Titan's surface. The technique, called despeckling, produces images that can be easier for researchers to interpret. The view is a mosaic of SAR swaths over Ligeia Mare, one of the large hydrocarbons seas on Titan. In particular, despeckling improves the visibility of channels flowing down to the sea. http://photojournal.jpl.nasa.gov/catalog/PIA19052

RainCube was deployed into low-Earth orbit from the International Space Station in July, 2018, where it has been measuring rain and snowfall from space. The size of the tiny weather satellite can be seen in comparison to the Space Station. RainCube is a prototype for a possible fleet of small satellites that could one day help monitor severe storms, lead to improving the accuracy of weather forecasts and track climate change over time. A closer look at these images reveals there are two CubeSats very close together -- RainCube is the bottom CubeSat closer to Earth, while the one above it is HaloSat, used to map the distribution of hot gas in the Milky Way. https://photojournal.jpl.nasa.gov/catalog/PIA22653
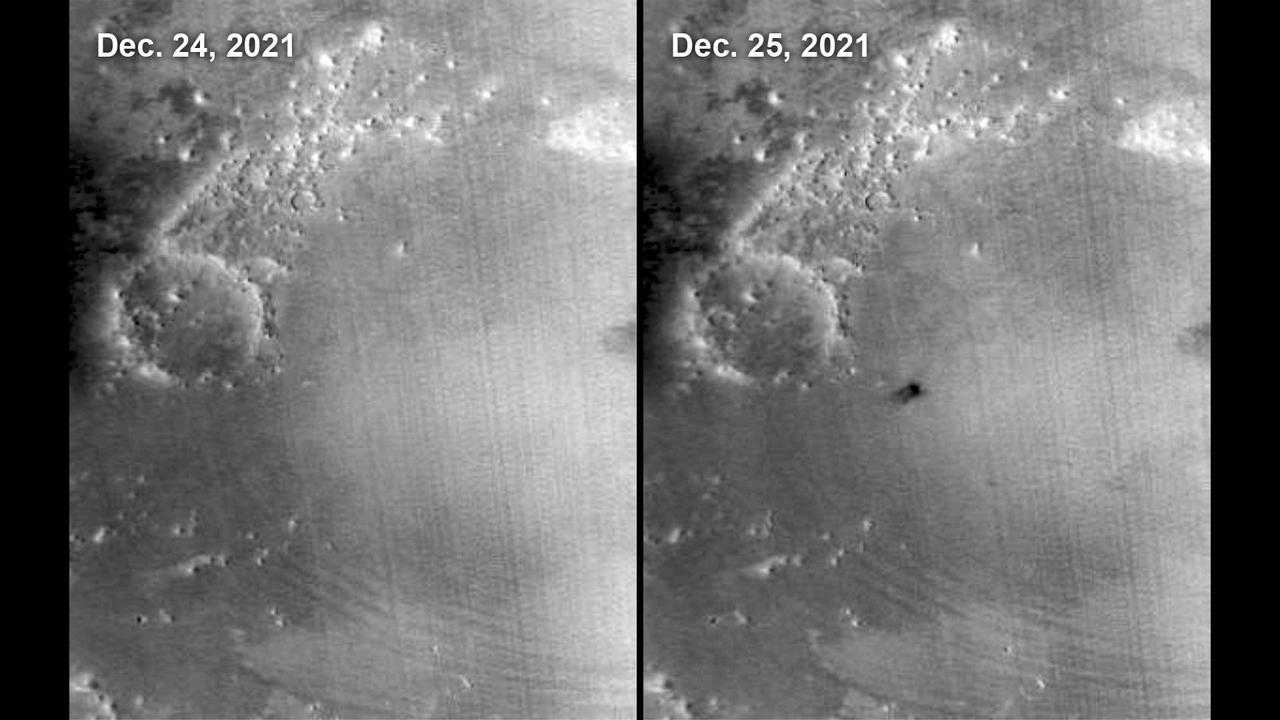
The Mars Color Imager (MARCI) camera aboard NASA's Mars Reconnaissance Orbiter (MRO) captured this before-and-after comparison of a region of Mars called Amazonis Planitia, which was struck by a meteoroid on Dec. 24, 2021. The impact was so large that MARCI can view it from space. As MRO passes over the planet, MARCI takes linear images – essentially strips – of the planet's circumference each day. The images are then stitched together to create a daily global map of the planet, data that's typically used to monitor atmospheric changes and Martian weather. https://photojournal.jpl.nasa.gov/catalog/PIA25585
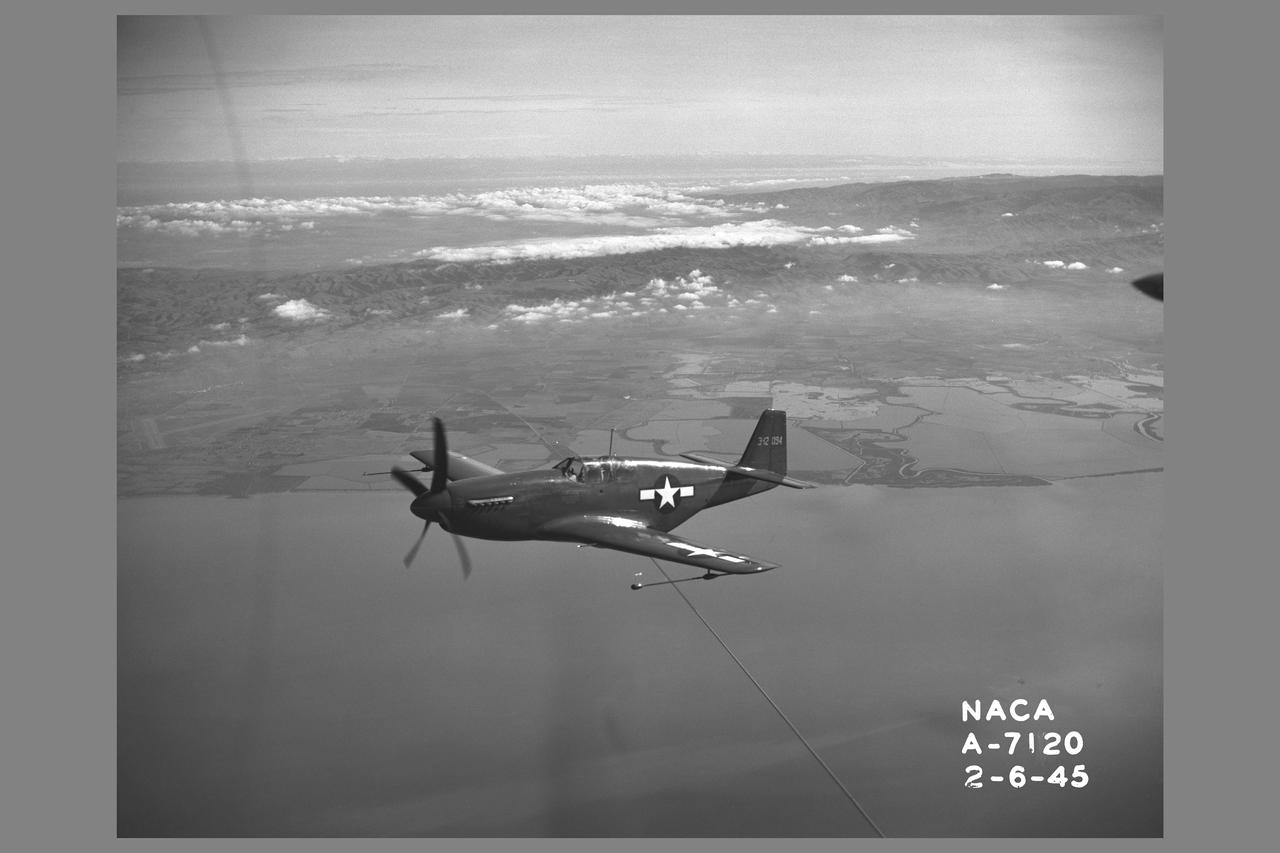
North American P-51B 'Mustang' fighter in flight over bay area. The P-51 with its new laminar-flow wing sections developed by NACA was the first airplane selected for testing of airplane drag in flight and wind tunnel comparison
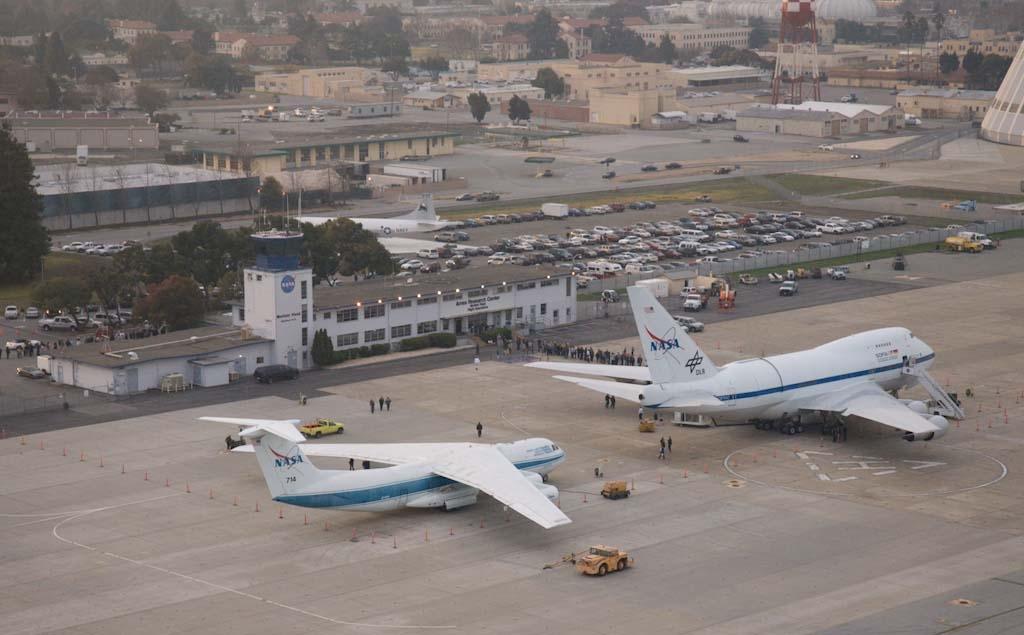
SOFIA visit to Ames: overheads of event of SOFIA (fStratospheric Observatory for Infrared Astronomy) on Moffett Federal Airfield tarmac with the KAO (Kaiper Airborne Obervatory) parked behind for comparison during the tour event for Ames & NASA Research Park staff.
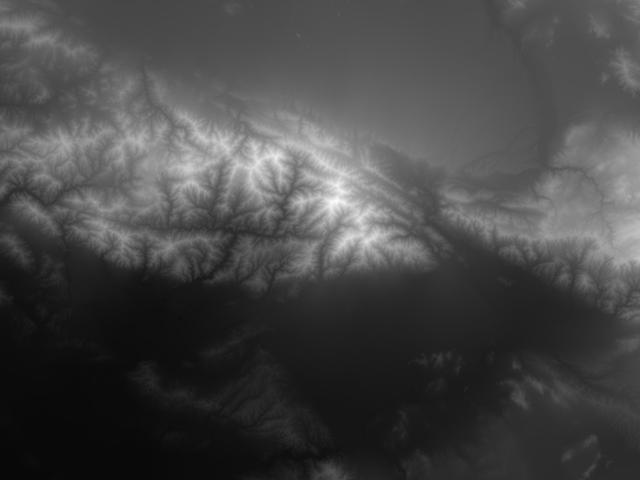
JSC2000E01553 (January 2000) --- This USGS elevation model showing increasing elevation as increasing brightness is included here for comparison purposes with the high-resolution topographic elevation map image in E01554. Both images depict the San Bernadino and San Gabriel Mountains in California, north of Los Angeles.
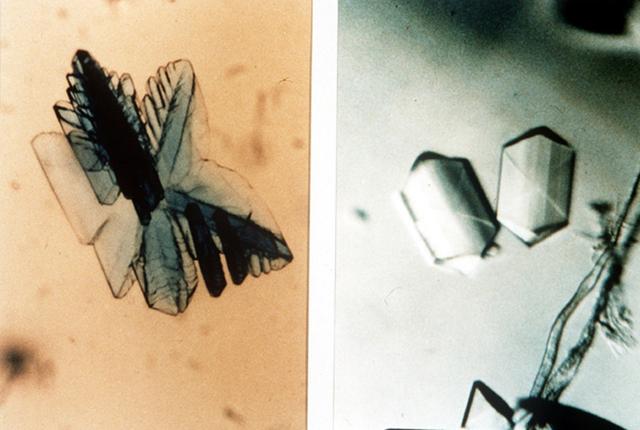
The comparison of protein crystal, Isocitrate Lyase earth-grown (left) and space-grown (right). This is a target enzyme for fungicides. A better understanding of this enzyme should lead to the discovery of more potent fungicides to treat serious crop diseases such as rice blast; it regulates the flow of metabolic intermediates required for cell growth. Principal Investigator is Larry DeLucas.

STS062-03-023 (4-14 March 1994) --- Astronaut Marsha S. Ivins, mission specialist, prepares to aim three Hasselblad cameras through the overhead windows of the earth-orbiting Space Shuttle Columbia. The three cameras were allowed to simultaneously record the same imagery on different types of file for purposes of comparison and experimentation.
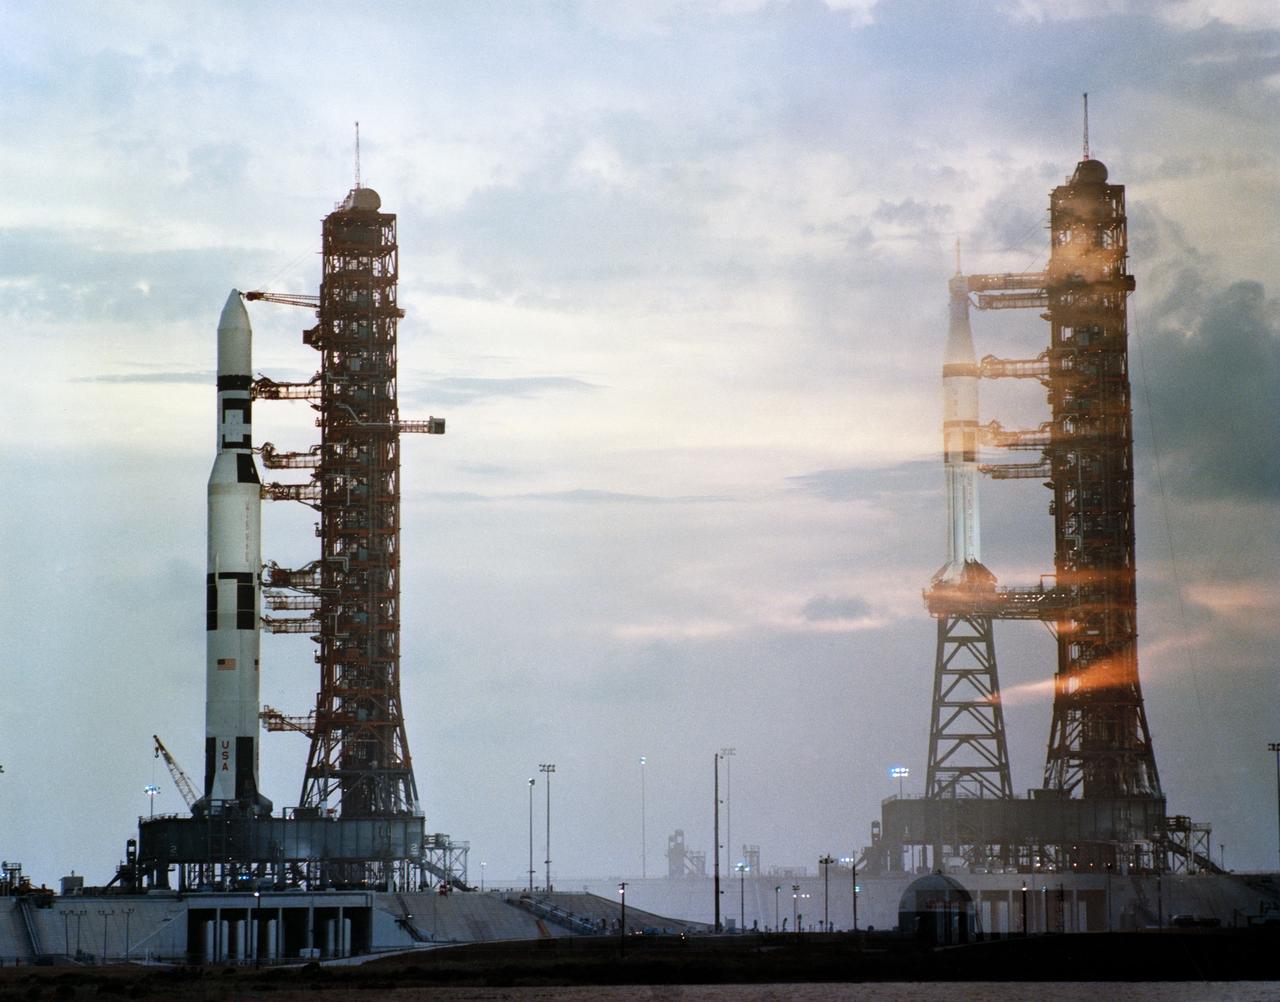
S73-25654 (7 May 1973) --- A deliberate double exposure to help illustrate the comparative sizes and configurations of the Skylab 1 and Skylab 2 space vehicles at Launch Complex 39, Kennedy Space Center, Florida. The double exposure creates an illusion that the rockets are side by side, though actually they are one and a half miles apart. The Skylab 1/ Saturn 1B space vehicle on Pad A is on the left. On the right is the Skylab 2/ Saturn 1B space vehicle on Pad B. The Skylab 1 payload is the space station cluster. The Skylab 2 payload will be an Apollo Command/Service Module (CSM) with astronauts Charles Conrad Jr., Joseph P. Kerwin and Paul J. Weitz aboard. The Saturn V launch vehicle is composed of a Saturn V first (S-1C) stage, a Saturn V second (S-11) stage, and the Skylab payload. The Saturn 1B launch vehicle consists of a Saturn 1B first (S-1B) stage, a Saturn 1B second (S-1VB) stage, and the CSM payload including its launch escape system. Photo credit: NASA
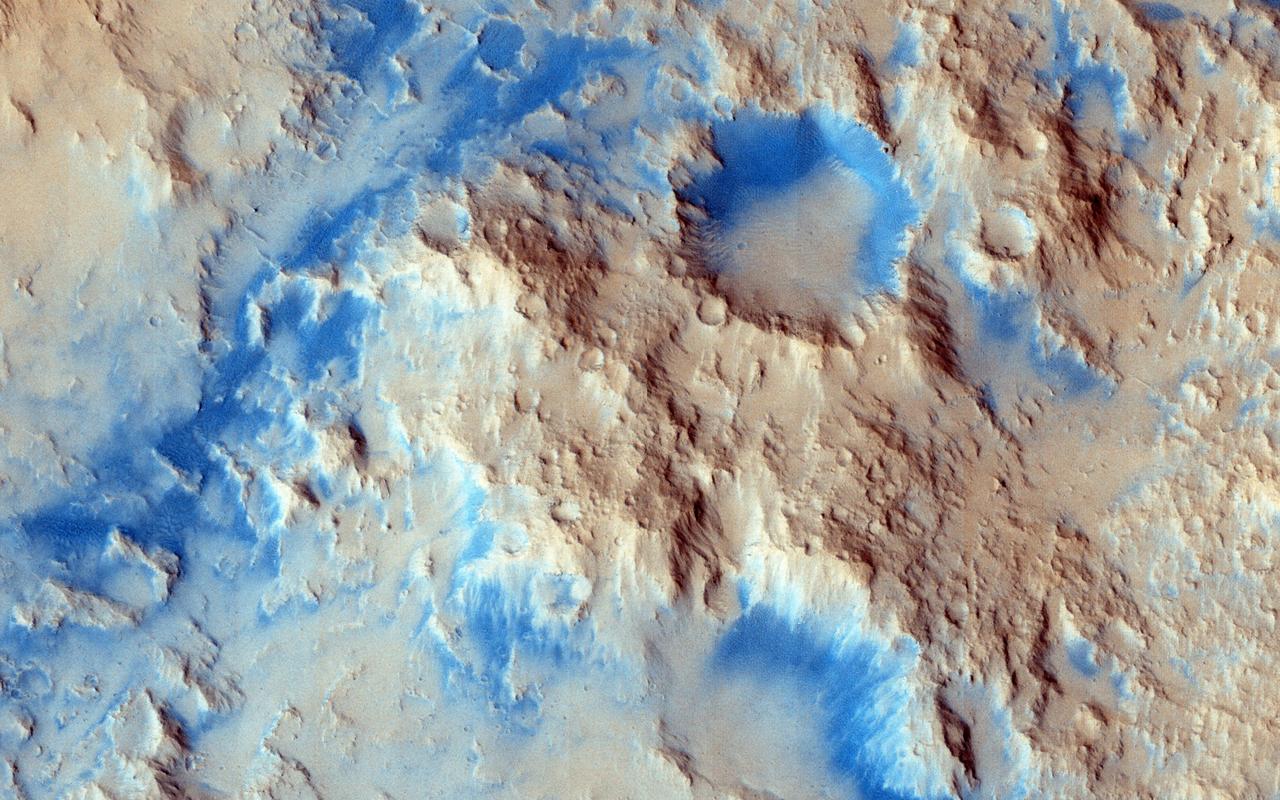
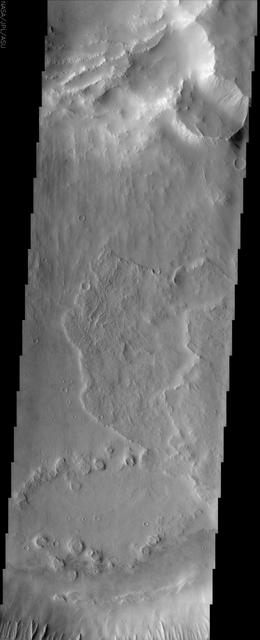
There are some interesting erosional signs in this observation from NASA Mars Reconnaissance Orbiter, which will make for a good comparison with other intracrater fans and fluvial sedimentary landforms. We can also see an inverted channel system, possibly ponded toward the southwest. As we've learned recently, it's possible that perhaps a fluid was in part of this crater, as is hypothesized for Gale Crater (see artist rendition picture) where Curiosity is exploring. At high resolution, we might be able to resolve fine-scale layering/bedding and/or large, transported clasts (boulders). Reuyl Crater is approximately 86 kilometers in diameter and was named after Dirk Reuyl, a Dutch-American physicist and astronomer (1906-1972) who made astronomical measurements of the diameter of Mars in the 1940s. http://photojournal.jpl.nasa.gov/catalog/PIA19356
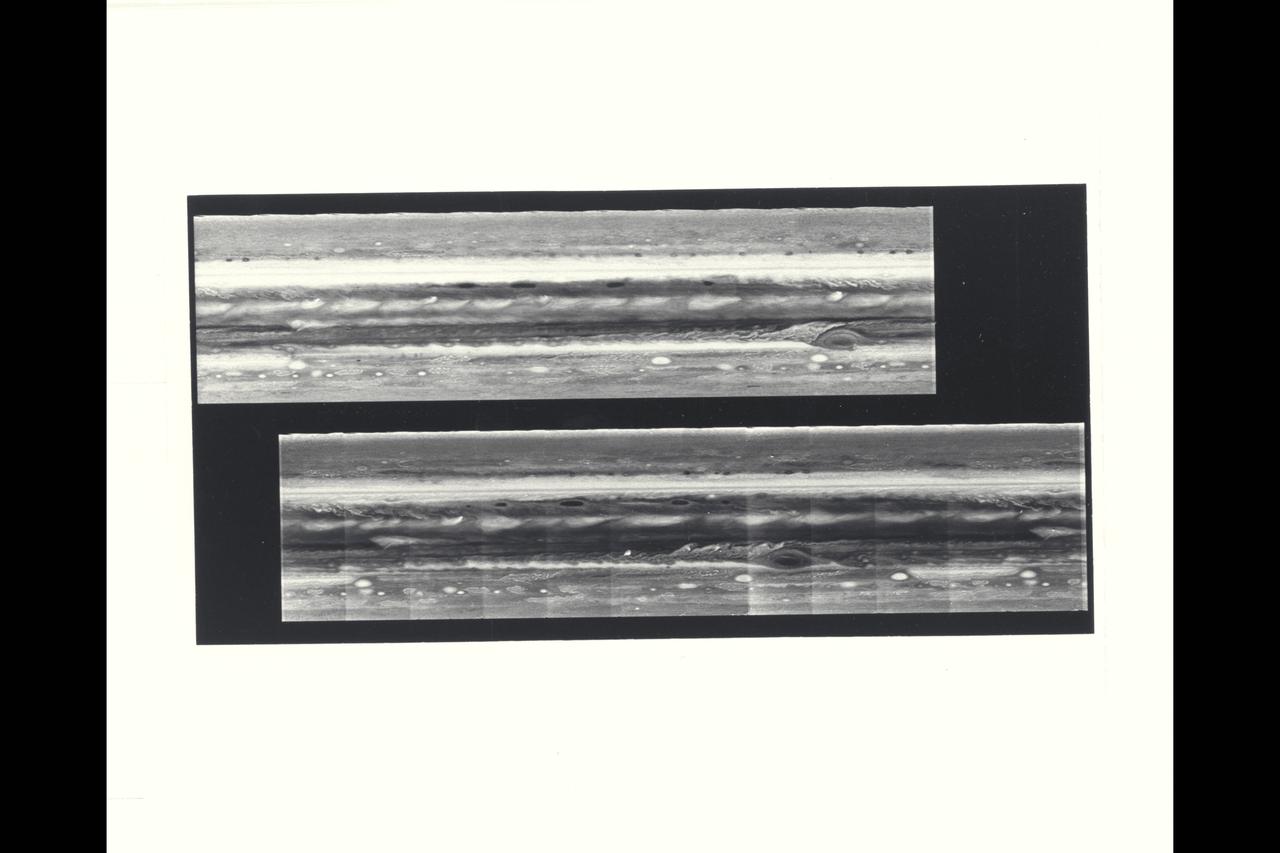
The cylindrical projections of Jupiter, representing both Voyager 1 (top) and Voyager 2 (bottom), are presented in this comparison. The top picture extends 400 degrees longitude to 0 degrees (right edge). It is aligned with the lower image so that the longitude scale is correct for both frames. The comparison between the pictures shows the relative motions of features in Jupiter's atmosphere. It can be seen that the Great Red Spot has moved westward and the white oval features eastward during the time between the acquisition of these pictures. Regulare plume patterns are equidistant around the northern edge of the equator, while a train of small spots has moved eastward at approxiamately 80 degrees south latitude. In addition to these relative motions, significant changes are evident in the recirculation flow east of the Great Red Spot, in the disturbed region west of the Greast Red Spot, and as seen in the brightening of material spreading into the equatorial region from the more southerly latitudes.
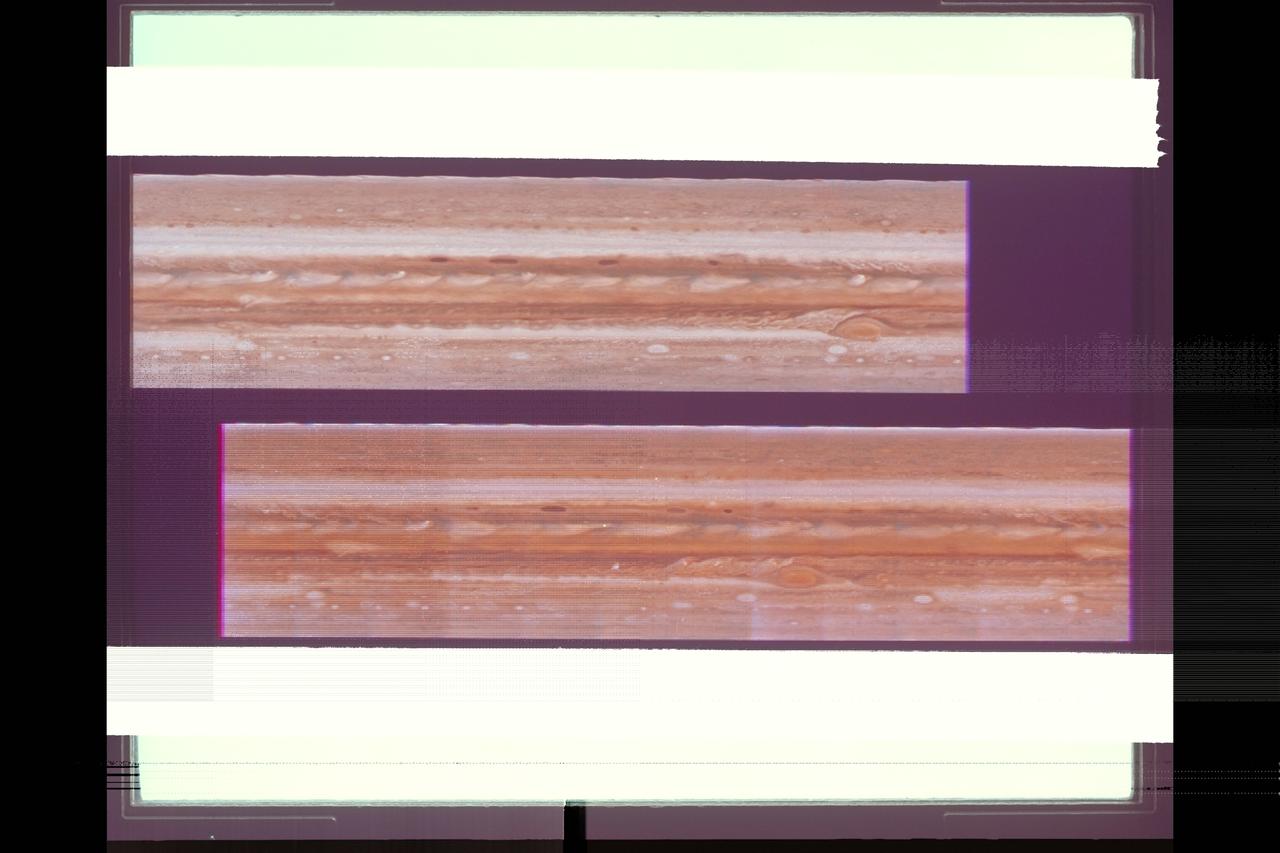
The cylindrical projections of Jupiter, representing both Voyager 1 (top) and Voyager 2 (bottom), are presented in this comparison. The top picture extends 400 degrees longitude to 0 degrees (right edge). It is aligned with the lower image so that the longitude scale is correct for both frames. The comparison between the pictures shows the relative motions of features in Jupiter's atmosphere. It can be seen that the Great Red Spot has moved westward and the white oval features eastward during the time between the acquisition of these pictures. Regulare plume patterns are equidistant around the northern edge of the equator, while a train of small spots has moved eastward at approxiamately 80 degrees south latitude. In addition to these relative motions, significant changes are evident in the recirculation flow east of the Great Red Spot, in the disturbed region west of the Greast Red Spot, and as seen in the brightening of material spreading into the equatorial region from the more southerly latitudes.
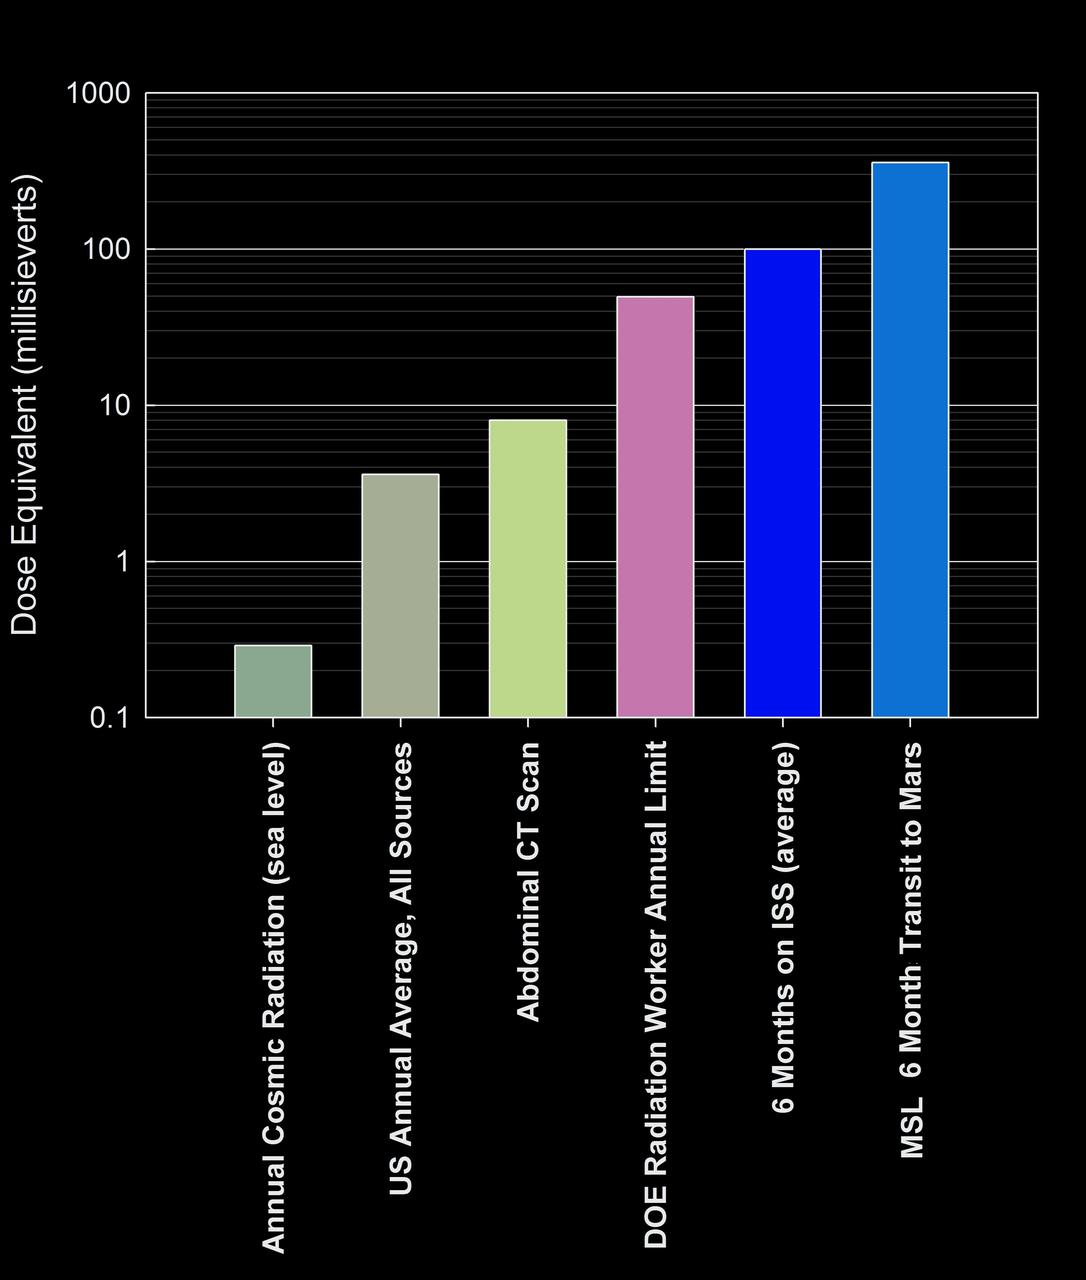
This graphic compares the radiation dose equivalent for several types of experiences, including a calculation for a trip from Earth to Mars based on measurements made by the RAD instrument shielded inside NASA Mars Science Laboratory spacecraft.