Pan Corridor
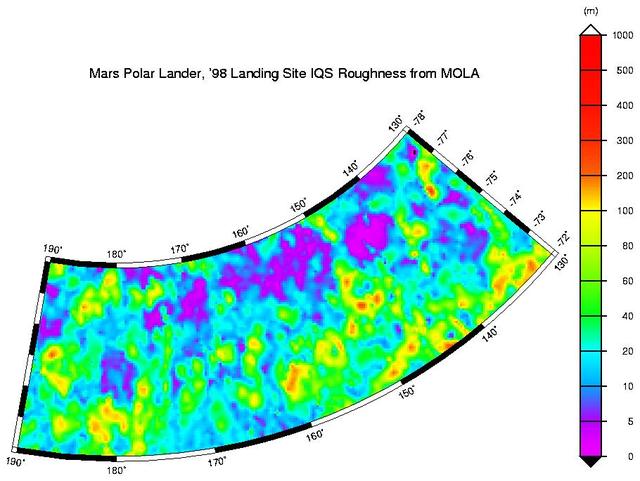
MPL LANDING SITE CORRIDOR

Rep. Chuck Fleischmann (R-Tn) being briefed on additive manufacturing at MSFC during a tour of Marshall facilities. Rep. Fleischmann was accompanied by Darrell Akins, Executive Manager of the Tennessee Valley corridor.
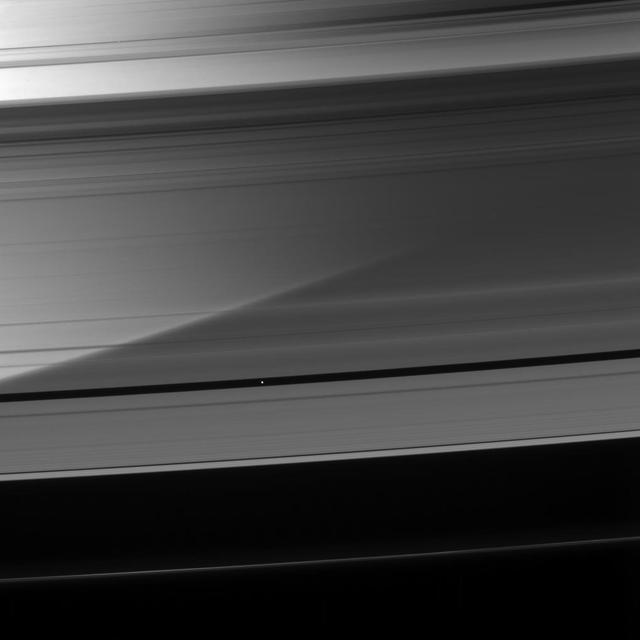
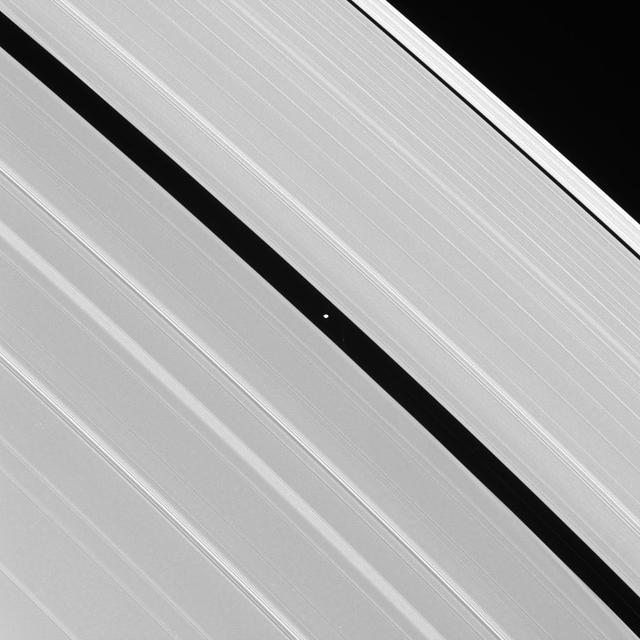
Immense Saturn is visible through the A ring as Pan coasts along its private corridor

Photographs taken from the T-34 of the PC-12 in flight over the technology corridor and the Honda motor company and the Honda test track
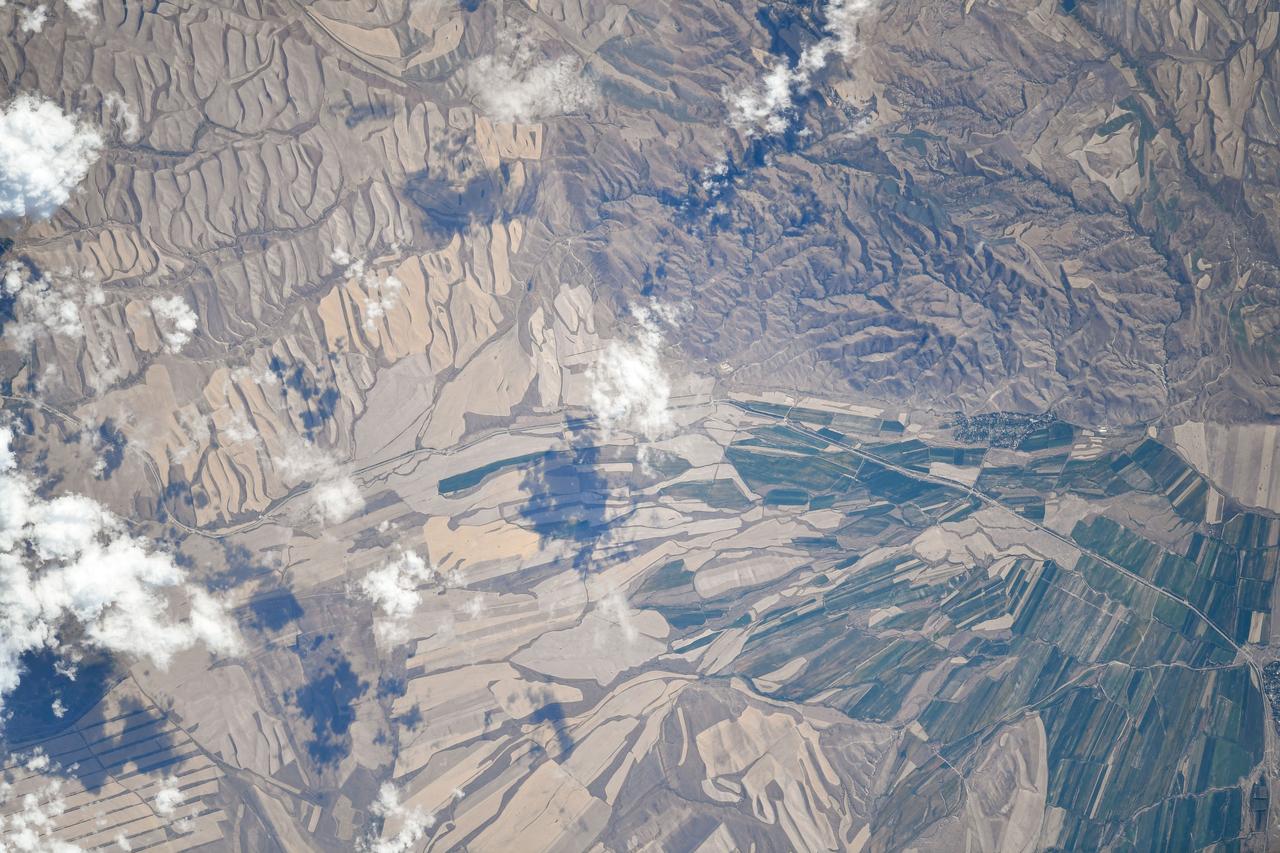
iss073e0510447 (Aug. 19, 2025) --- Agricultural activities in the diverse landscape of Kazakhstan's Jetisu region, near the Chinese border and once a key corridor of the ancient Silk Road, are pictured from the International Space Station as it orbited 263 miles above the Central Asian nation. Credit: Roscosmos
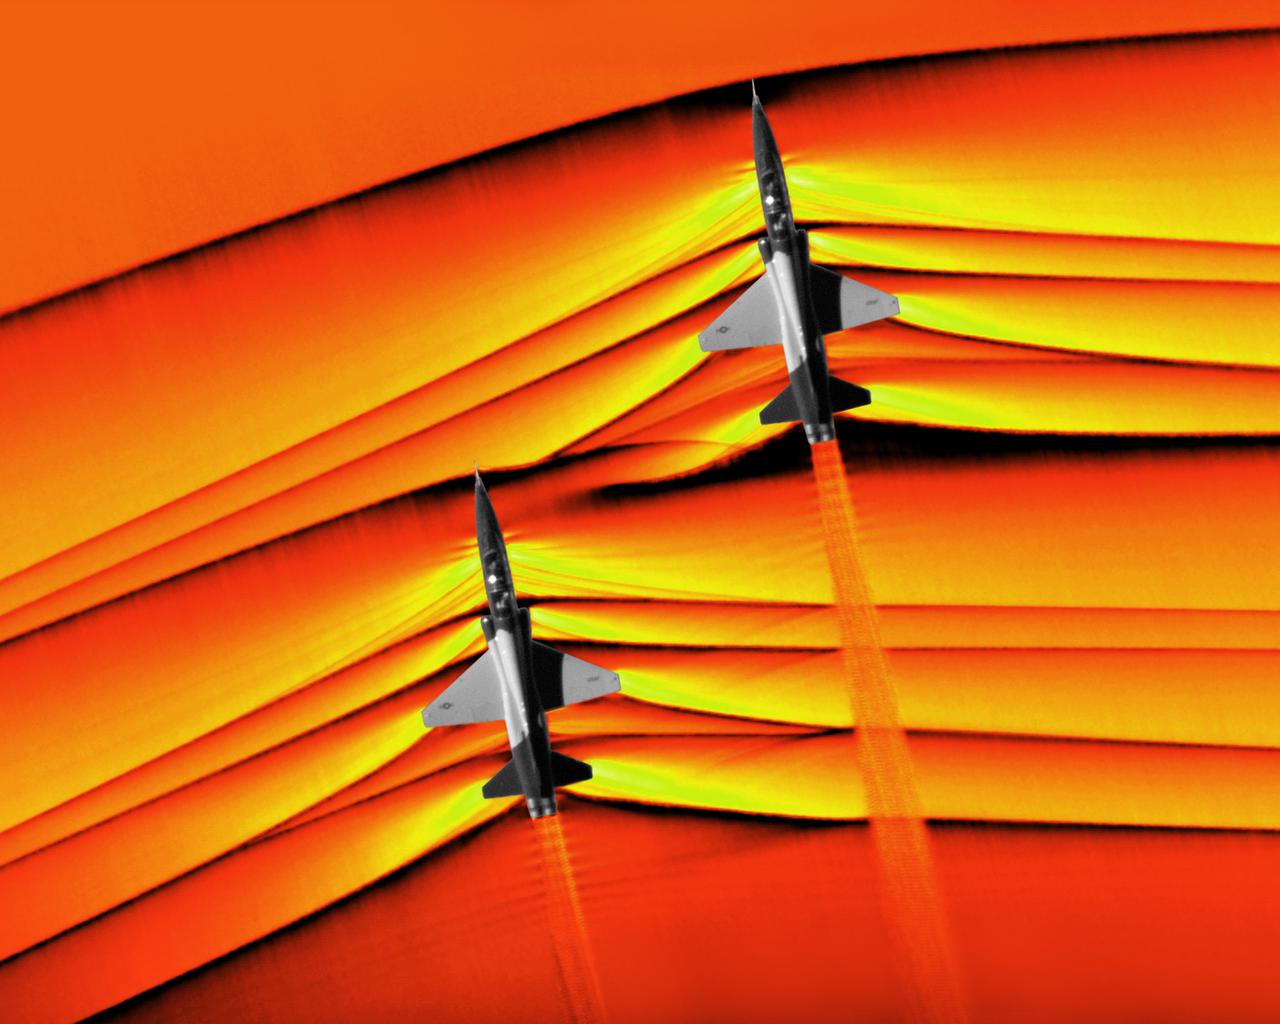
Composite image of Background Oriented Schlieren (BOS) data (contour) with a cut-out images of the T-38’s during a Mach Number 1.02 pass. The interaction of the shockwave of the trailing aircraft with the exhaust plume of the lead aircraft shows a shockwave reflection. Original recording of the pass taken in the Black Mountain Supersonic Corridor at near Edwards AFB in December of 2018. Image acquired by JT Heineck, schlieren data processed by Neal Smith.
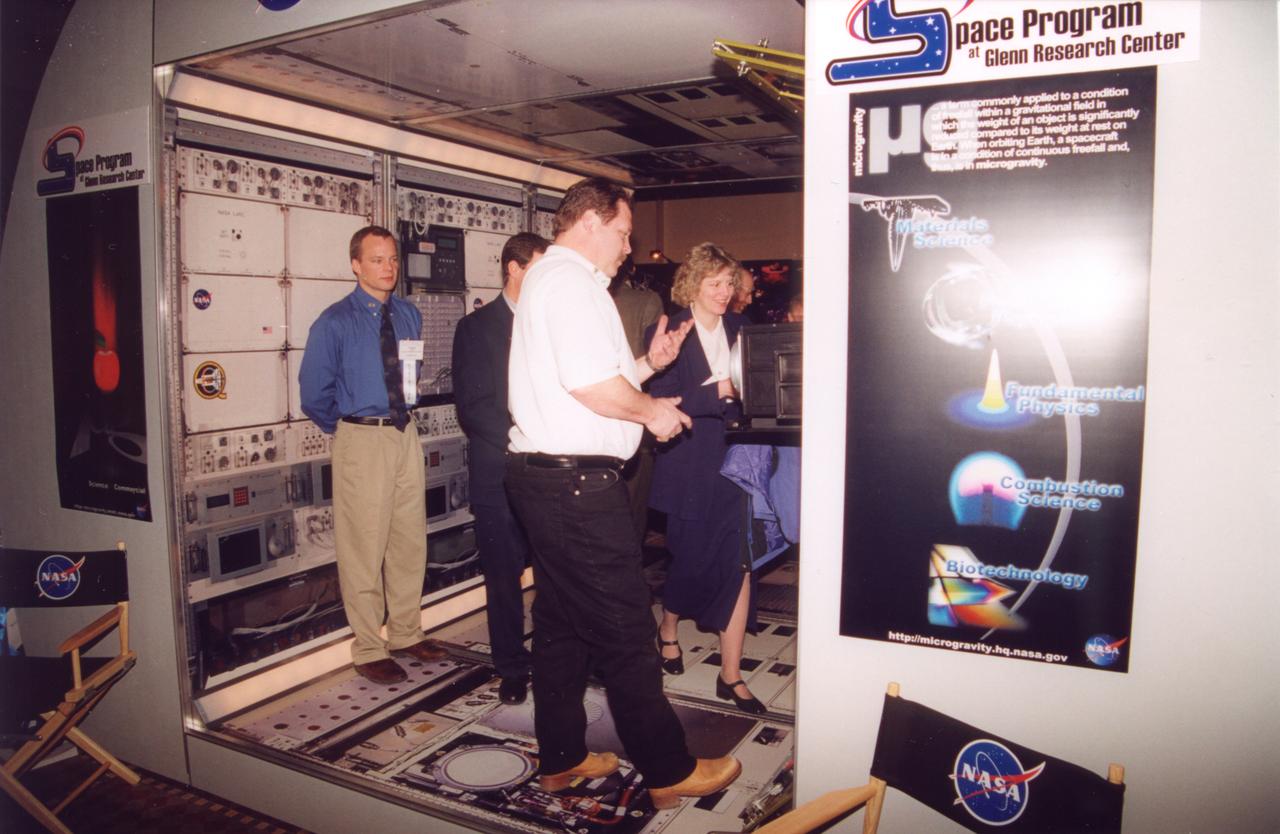
Engineers from NASA's Glenn Research Center, demonstrate access to one of the experiment racks planned for the U.S. Destiny laboratory module on the International Space Station. This mockup has the full diameter, full corridor width, and half the length of the module. The mockup includes engineering mockups of the Fluids and Combustion Facility being developed by NASA's Glenn Research Center. (The full module will be six racks long; the mockup is three rack long) Photo credit: NASA/Marshall Space Flight Center
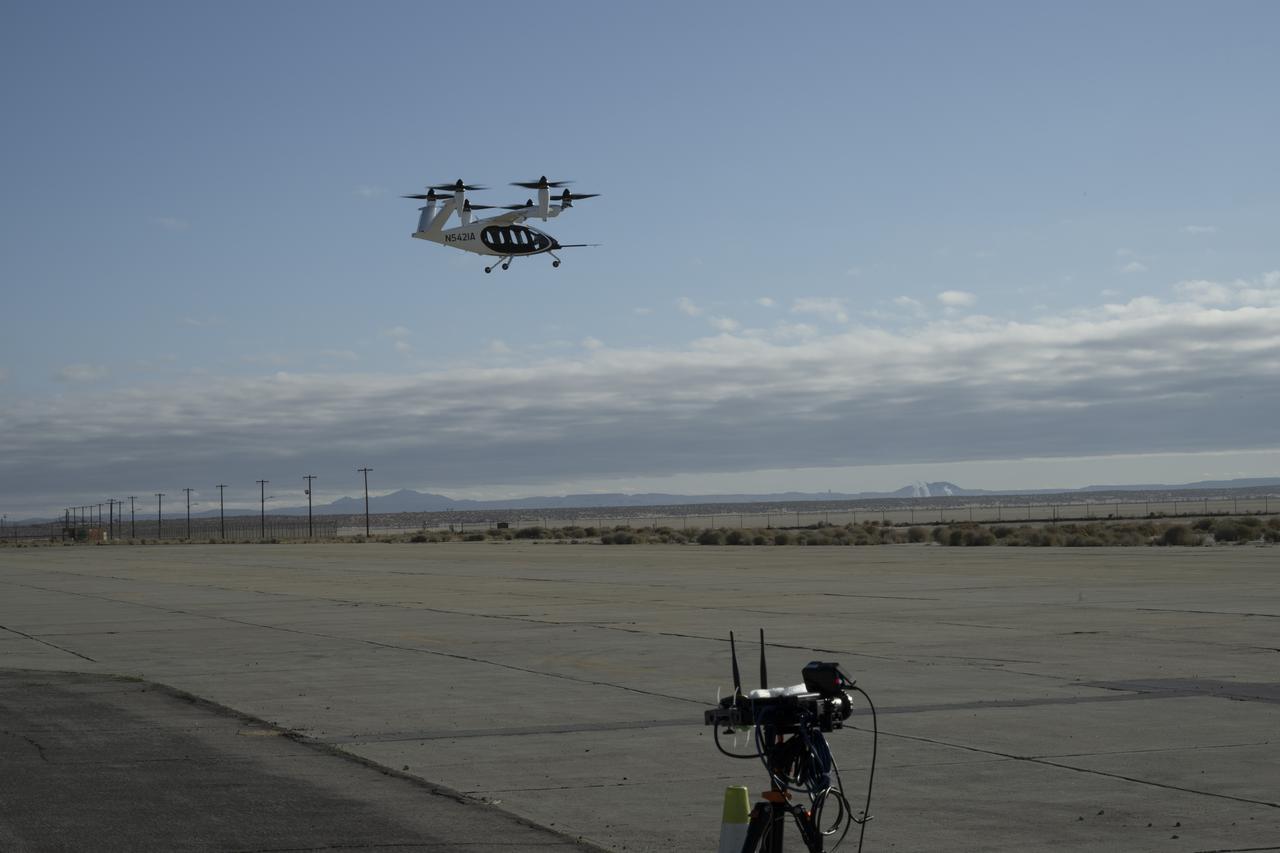
One of multiple NASA distributed sensing ground nodes is set up in the foreground while an experimental air taxi aircraft owned by Joby Aviation hovers in the background near NASA’s Armstrong Flight Research Center in Edwards, California, on March 12, 2025. NASA is collecting information during this study to help advance future air taxi flights, especially those occurring in cities, to track aircraft moving through traffic corridors and around landing zones.
Engineers from NASA's Glen Research Center demonstrate the access to one of the experiment racks plarned for the U.S. Destiny laboratory module on the International Space Station (ISS). This mockup has the full diameter, full corridor width, and half the length of the module. The mockup includes engineering mockups of the Fluids and Combustion Facility being developed by NASA's Glenn Research Center. (The full module will be six racks long; the mockup is three racks long). Photo credit: NASA/Marshall Space Flight Center (MSFC)
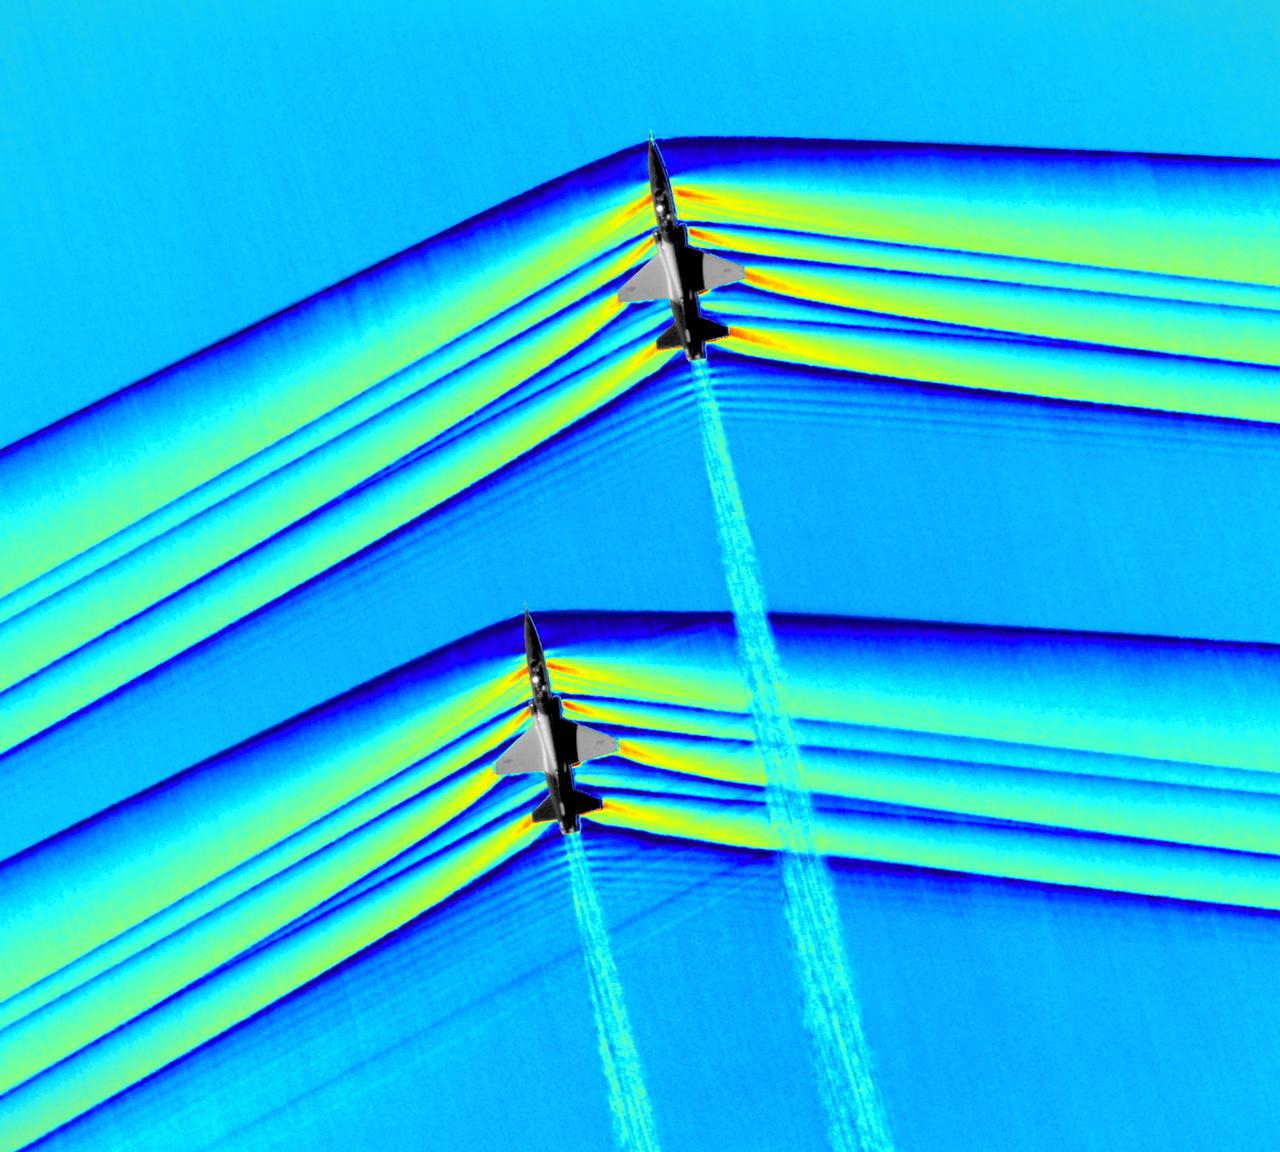
Composite image of Background Oriented Schlieren (BOS) data (contour) with a cut-out images of the T-38’s during a Mach Number 1.01 pass. This data is the first time shockwave interactions between two full scale aircraft traveling faster than the speed of sound have been imaged and shown with schlieren visualization. Original recording of the pass taken in the Black Mountain Supersonic Corridor at near Edwards AFB in December of 2018. Image acquired by JT Heineck, schlieren data processed by Neal Smith

iss074e0417326 (March 27, 2026) --- A portion of the Sahara in the Agadez Region of northeastern Niger is pictured from the International Space Station as it orbited 264 miles above the African continent. Despite the hyper-arid conditions, a groundwater-fed oasis system supports settlements and small-scale agriculture in a narrow north–south corridor of the desert nation. Credit: NASA/Chris Williams

iss073e0686732 (Aug. 30, 2025) --- The atmospheric glow blankets southern Europe and the northwestern Mediterranean coast, outlined by city lights. At left, the Po Valley urban corridor in Italy shines with the metropolitan areas of Milan and Turin and their surrounding suburbs. This photograph was taken at approximately 1:39 a.m. local time from the International Space Station as it orbited 261 miles above Earth.
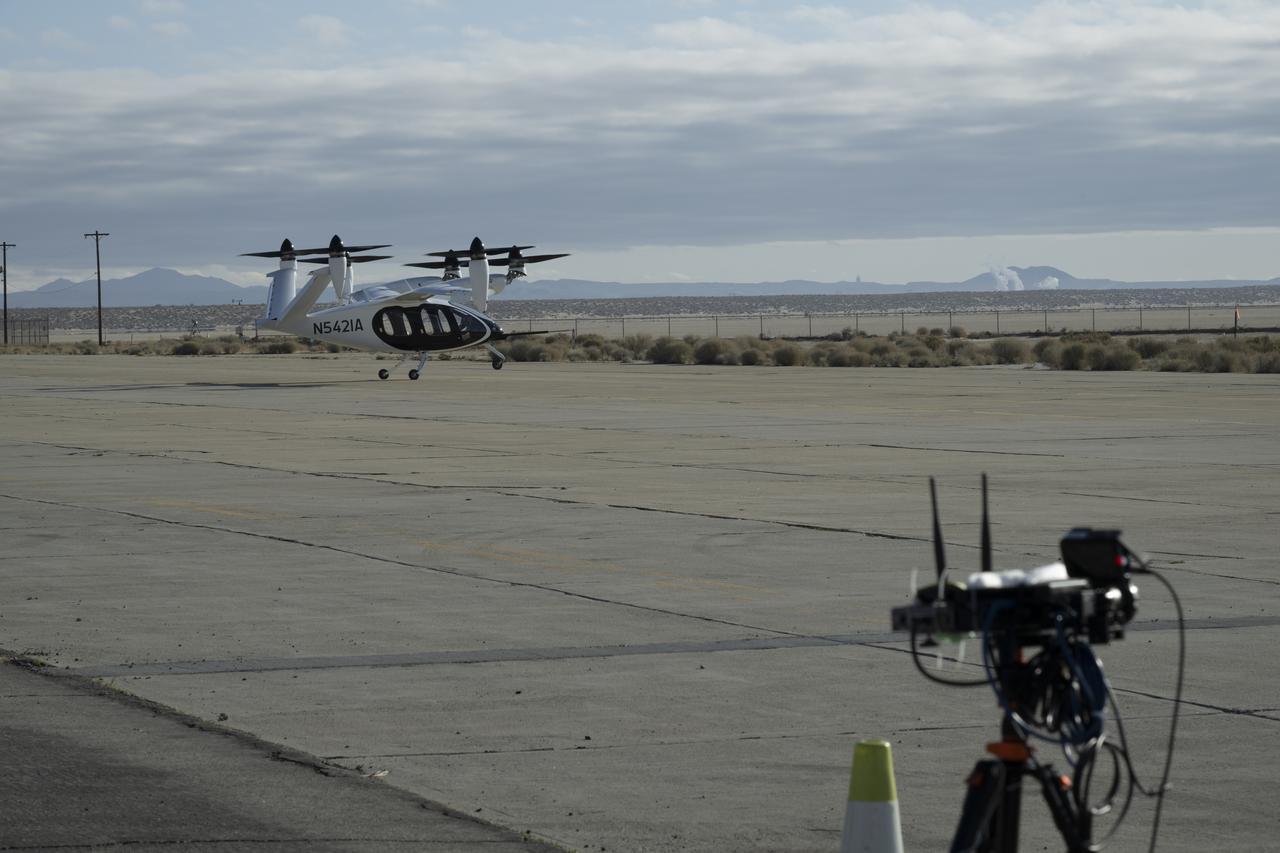
One of multiple NASA distributed sensing ground nodes is set up in the foreground while an experimental air taxi aircraft owned by Joby Aviation prepares to take off in the background near NASA’s Armstrong Flight Research Center in Edwards, California, on March 12, 2025. NASA is collecting information during this study to help advance future air taxi flights, especially those occurring in cities, to track aircraft moving through traffic corridors and around landing zones.

ISS030-E-055791 (29 Jan. 2012) --- This Jan. 29 panorama of much of the East Coast, photographed by one of the Expedition 30 crew members aboard the International Space Station, provides a look generally northeastward: Philadelphia-New York City-Boston corridor (bottom-center); western Lake Ontario shoreline with Toronto (left edge); Montreal (near center). An optical illusion in the photo makes the atmospheric limb and light activity from Aurora Borealis appear “intertwined.”

iss073e0705168 (Sept. 18, 2025) --- A faint blue-green airglow blankets Earth’s horizon as city lights define northern Italy's luminous urban corridor (center) from Turin, to Milan, and Venice. At upper right, Rome is visible along the Tyrrhenian coastline. The International Space Station was orbiting 262 miles above Southern Europe when this image was captured at approximately 11:14 p.m. local time.

Composite image of Background Oriented Schlieren (BOS) data (contour) with a cut-out images of the T-38’s during a Mach Number 1.01 pass. This data is the first time shockwave interactions between two full scale aircraft traveling faster than the speed of sound have been imaged and shown with schlieren visualization. Original recording of the pass taken in the Black Mountain Supersonic Corridor at near Edwards AFB in December of 2018. Image acquired by JT Heineck, schlieren data processed by Neal Smith.

KENNEDY SPACE CENTER, FLA. - Center Director Jim Kennedy speaks to attendees at a VIP luncheon during the 2005 FIRST Robotics Regional Competition held at the University of Central Florida March 10-12. NASA and the University of Central Florida are co-hosts of the regional event and are joined by sponsors such as Motorola iDEN, the Florida High Tech Corridor Council, Walt Disney World Company and aerospace companies Lockheed Martin and United Space Alliance, just to name a few.

Composite image of Background Oriented Schlieren (BOS) data (contour) with a cut-out images of the T-38’s during a Mach Number 1.02 pass. The interaction of the shockwave of the trailing aircraft with the exhaust plume of the lead aircraft shows a shockwave reflection. Original recording of the pass taken in the Black Mountain Supersonic Corridor at near Edwards AFB in December of 2018. Image acquired by JT Heineck, schlieren data processed by Neal Smith.
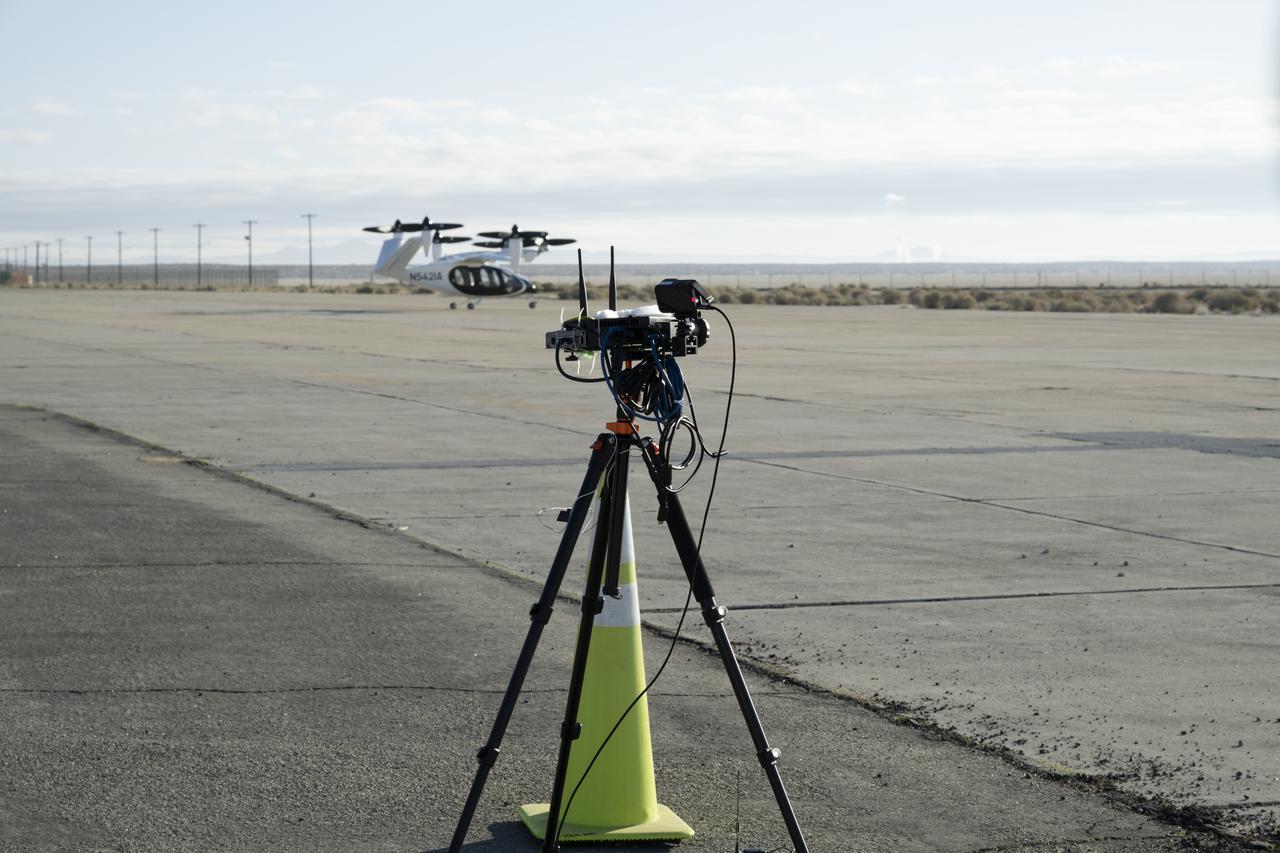
One of several NASA distributed sensing ground nodes is set up in the foreground while an experimental air taxi aircraft owned by Joby Aviation sits in the background near NASA’s Armstrong Flight Research Center in Edwards, California, on March 12, 2025. NASA is collecting information during this study to help advance future air taxi flights, especially those occurring in cities, to track aircraft moving through traffic corridors and around landing zones.

Composite image of Background Oriented Schlieren (BOS) data (contour) with a cut-out images of the T-38’s during a Mach Number 1.02 pass. The interaction of the shockwave of the trailing aircraft with the exhaust plume of the lead aircraft shows a shockwave reflection. Original recording of the pass taken in the Black Mountain Supersonic Corridor at near Edwards AFB in December of 2018. Image acquired by JT Heineck, schlieren data processed by Neal Smith.

Composite image of Background Oriented Schlieren (BOS) data (contour) with a cut-out images of the T-38’s during a Mach Number 1.01 pass. This data is the first time shockwave interactions between two full scale aircraft traveling faster than the speed of sound have been imaged and shown with schlieren visualization. Original recording of the pass taken in the Black Mountain Supersonic Corridor at near Edwards AFB in December of 2018. Image acquired by JT Heineck, schlieren data processed by Neal Smith
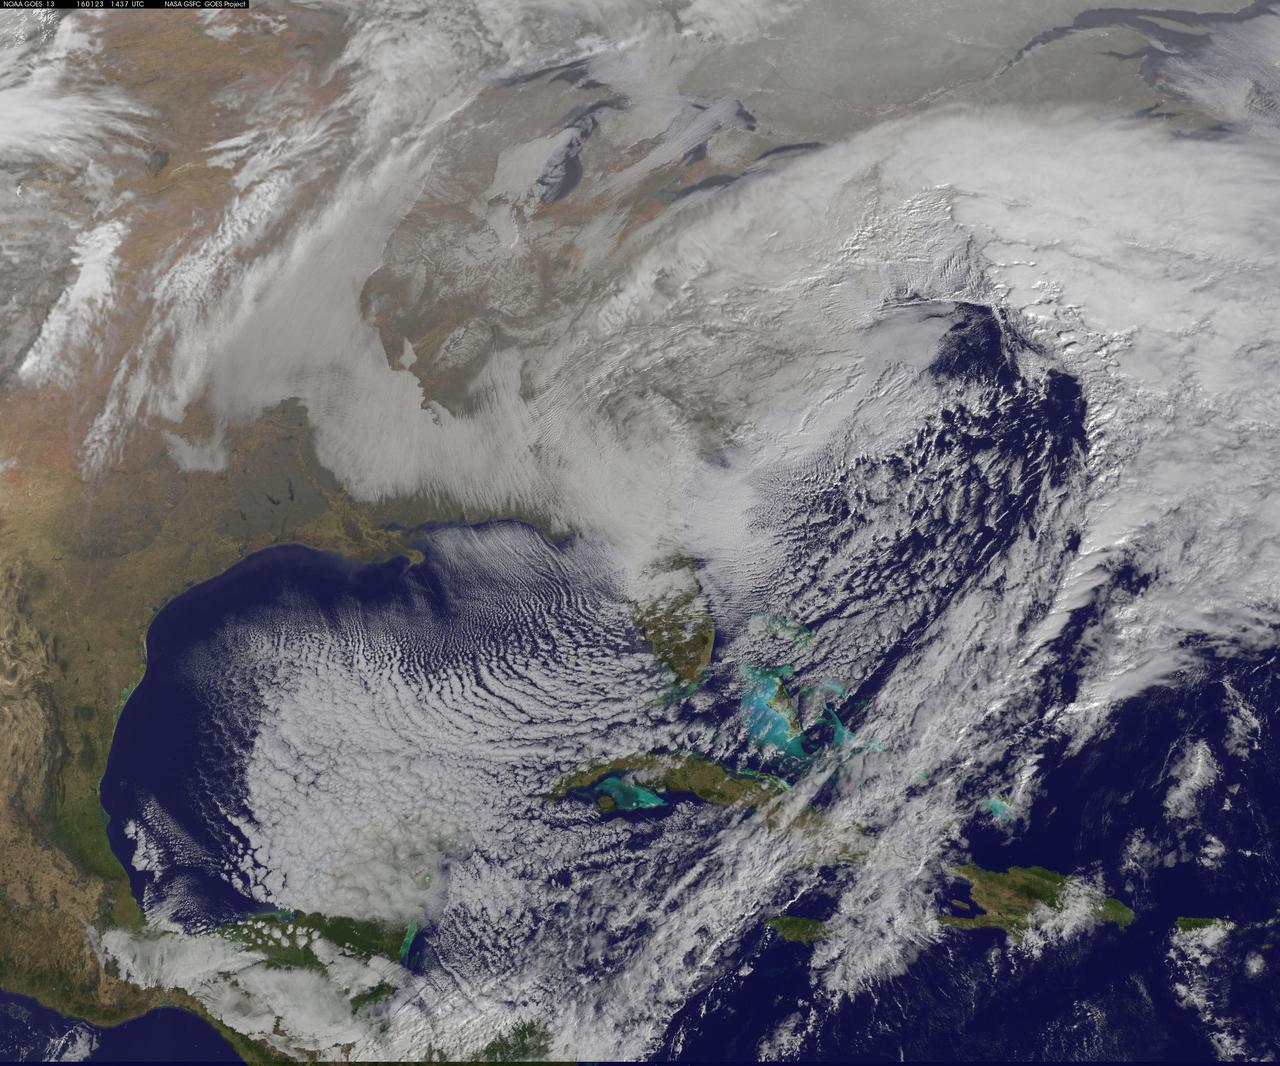
NASA satellite imagery captured the size of the massive winter storm that continued to pummel the U.S. East Coast early on January 23, 2016. This visible image of the major winter storm was taken from NOAA's GOES-East satellite on Saturday, January 23, 2016 at 1437 UTC (9:37 a.m. EST) as the Baltimore/Washington corridor was under a blizzard warning. Read more: <a href="http://go.nasa.gov/1RFv70u" rel="nofollow">go.nasa.gov/1RFv70u</a> Credits: NASA/NOAA GOES Project NASA Sees Winter Storm Slamming Eastern United States
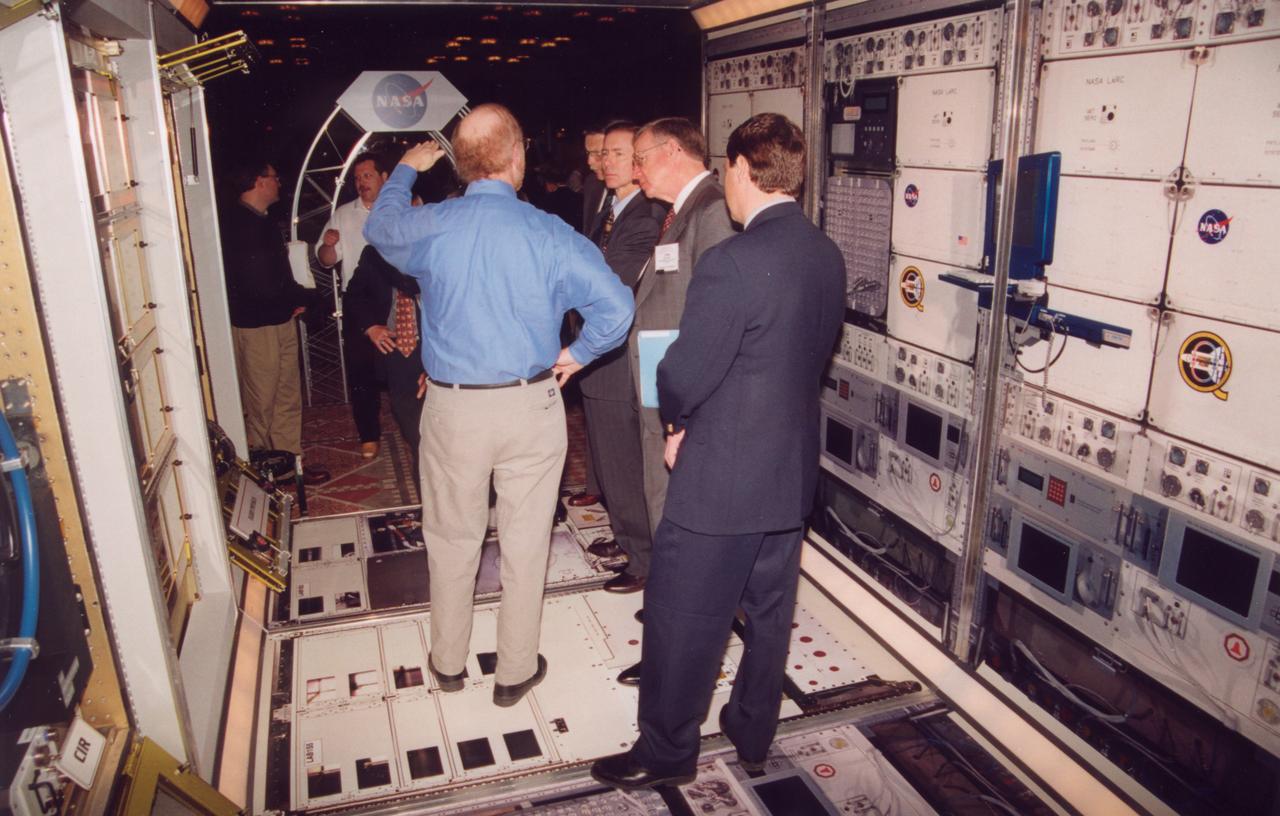
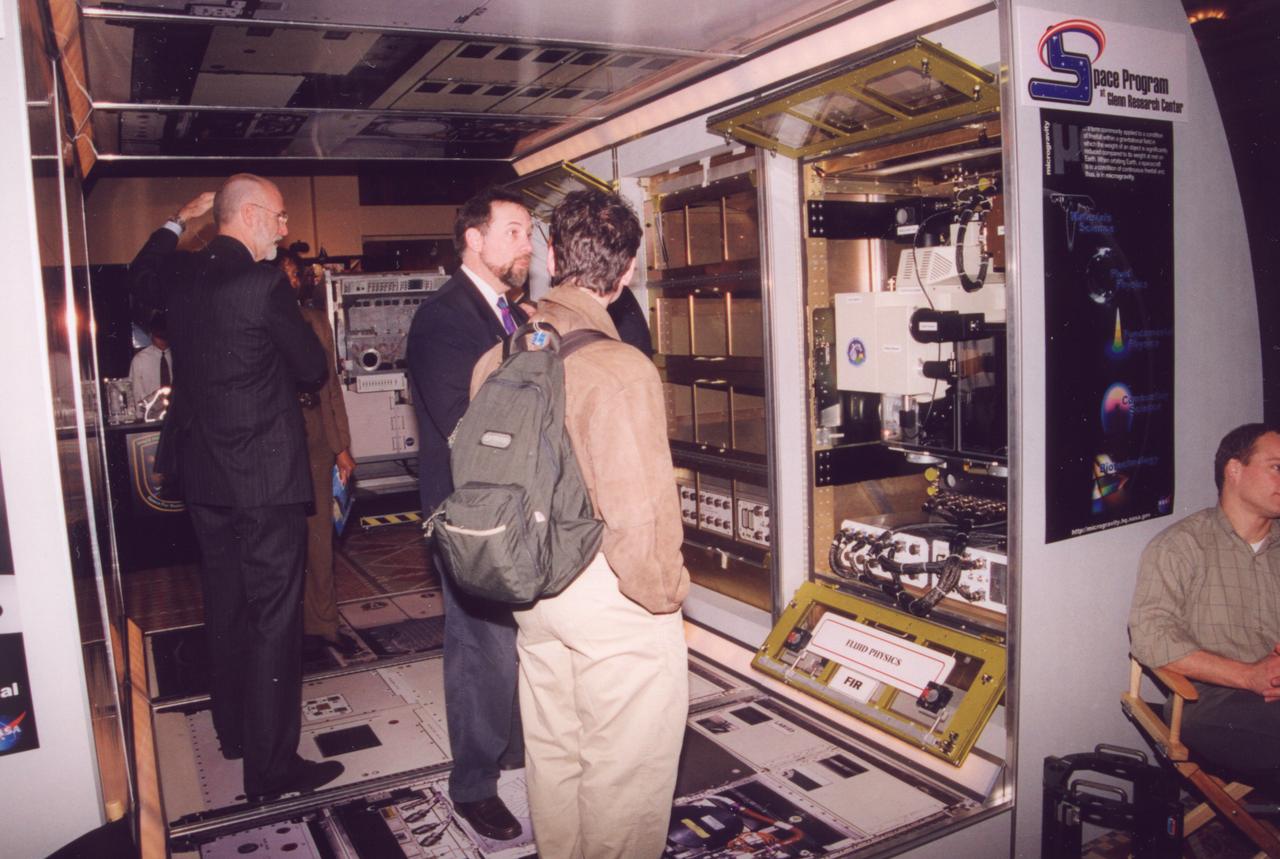
Engineers from NASA's Glenn Research Center demonstrate the access to one of the experiment racks planned for the U.S. Destiny laboratory module on the International Space Station (ISS). This mockup has the full diameter, full corridor width, and half the length of the module. The mockup includes engineering mockups of the Fluids and Combustion Facility being developed by NASA's Glenn Research Center. (The full module will be six racks long; the mockup is three racks long). Listening at center is former astronaut Brewster Shaw (center), now a program official with the Boeing Co., the ISS prime contractor. Photo credit: NASA/Marshall Space Flight Center (MSFC)
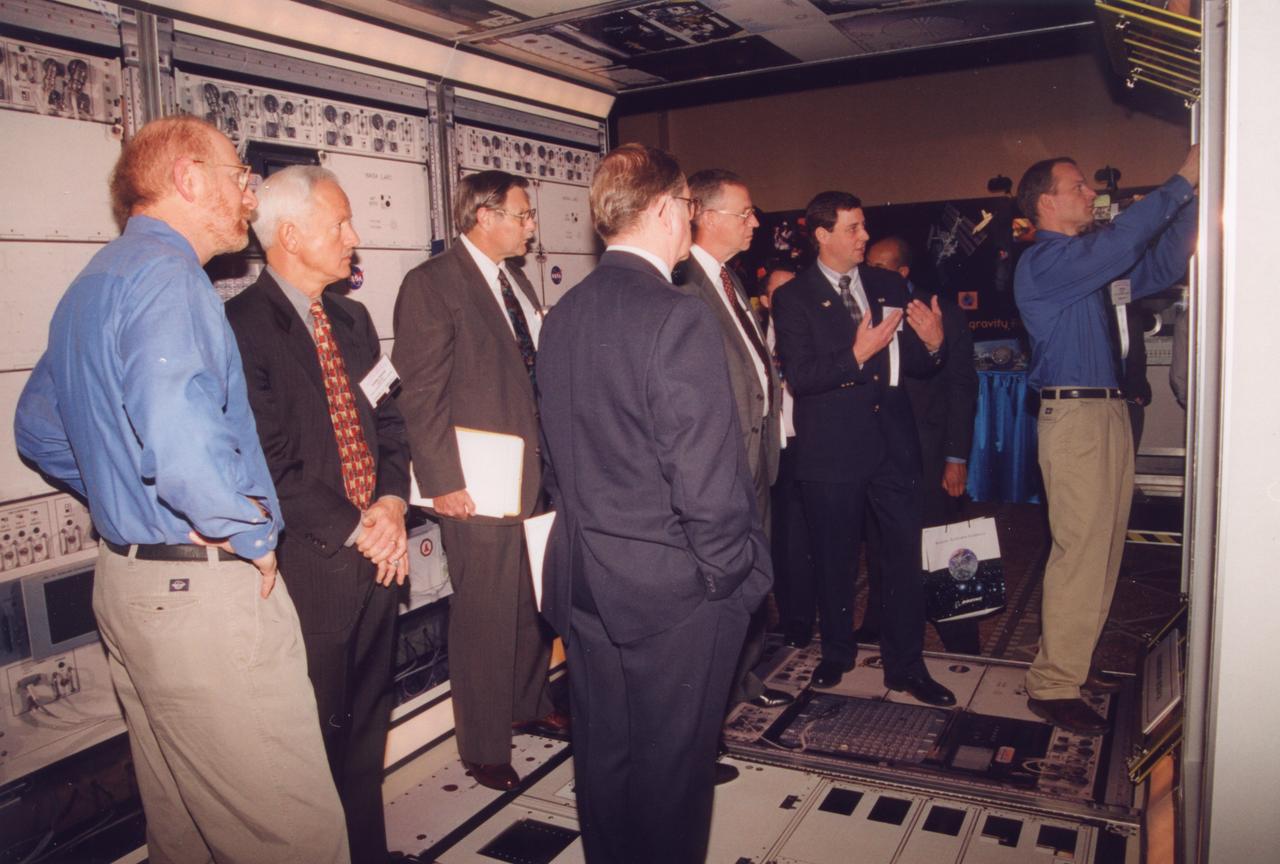
Engineers from NASA's Glenn Research Center demonstrate the access to one of the experiment racks planned for the U.S. Destiny laboratory module on the International Space Station (ISS). This mockup has the full diameter, full corridor width, and half the length of the module. The mockup includes engineering mockups of the Fluids and Combustion Facility being developed by NASA's Glenn Research Center. (The full module will be six racks long; the mockup is three racks long). Listening at left (coat and patterned tie) is John-David Bartoe, ISS research manager at NASA's Johnson Space Center and a payload specialist on Spacelab 2 mission (1985). Photo credit: NASA/Marshall Space Flight Center (MSFC)
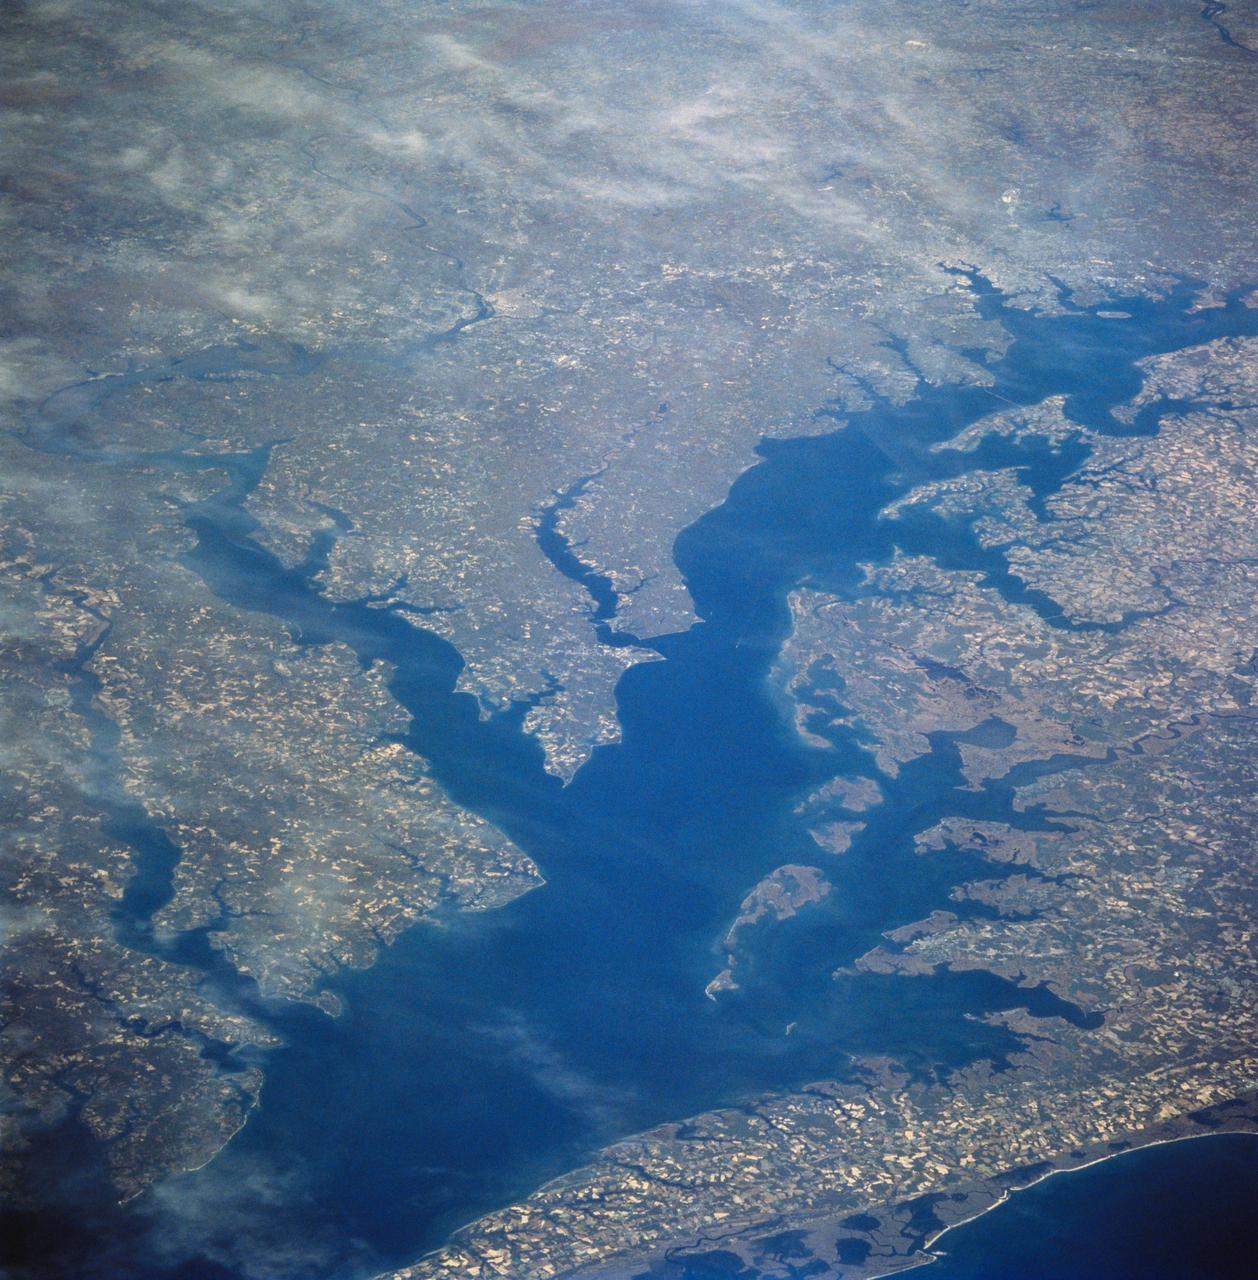
STS058-81-049 (18 Oct-1 Nov 1993) --- This view encompasses most of the large estuarine system of the Chesapeake Bay. The farmland and marshes of eastern shores of the Chesapeake (eastern Maryland and Virginia) are the foreground. The largest tributary flowing into the Bay is the Potomac River; Washington, D.C. is visible where the river bends to the northwest. The urban-suburban corridor between Washington, D.C. and Baltimore to the north (toward the right on this view) shows well as the gray zone which extends from left (D.C. on the Potomac) to right (Baltimore on the Patapsco River embayment on the Chesapeake, near the upper right).
STS039-85-029 (28 April-6 May 1991) --- This 70mm frame is one of the best pictures of the Oklahoma City area from the manned space program, according to NASA photo experts studying STS-39 onboard photography. The central business district is near the center. Several municipalities are visible, along with thousands of acres of farmland. The towns of Norman and Moore and the South Canadian River are in the bottom (south). El Reno and Wiley Post Field off I-40W are just below center in lower left quadrant. Edmond is seen at the top (north). Tinker Field can be seen north of I-40E at right center. Lake Overholser shows recent spring rainfall northwest of the central business district.

Research Support Building
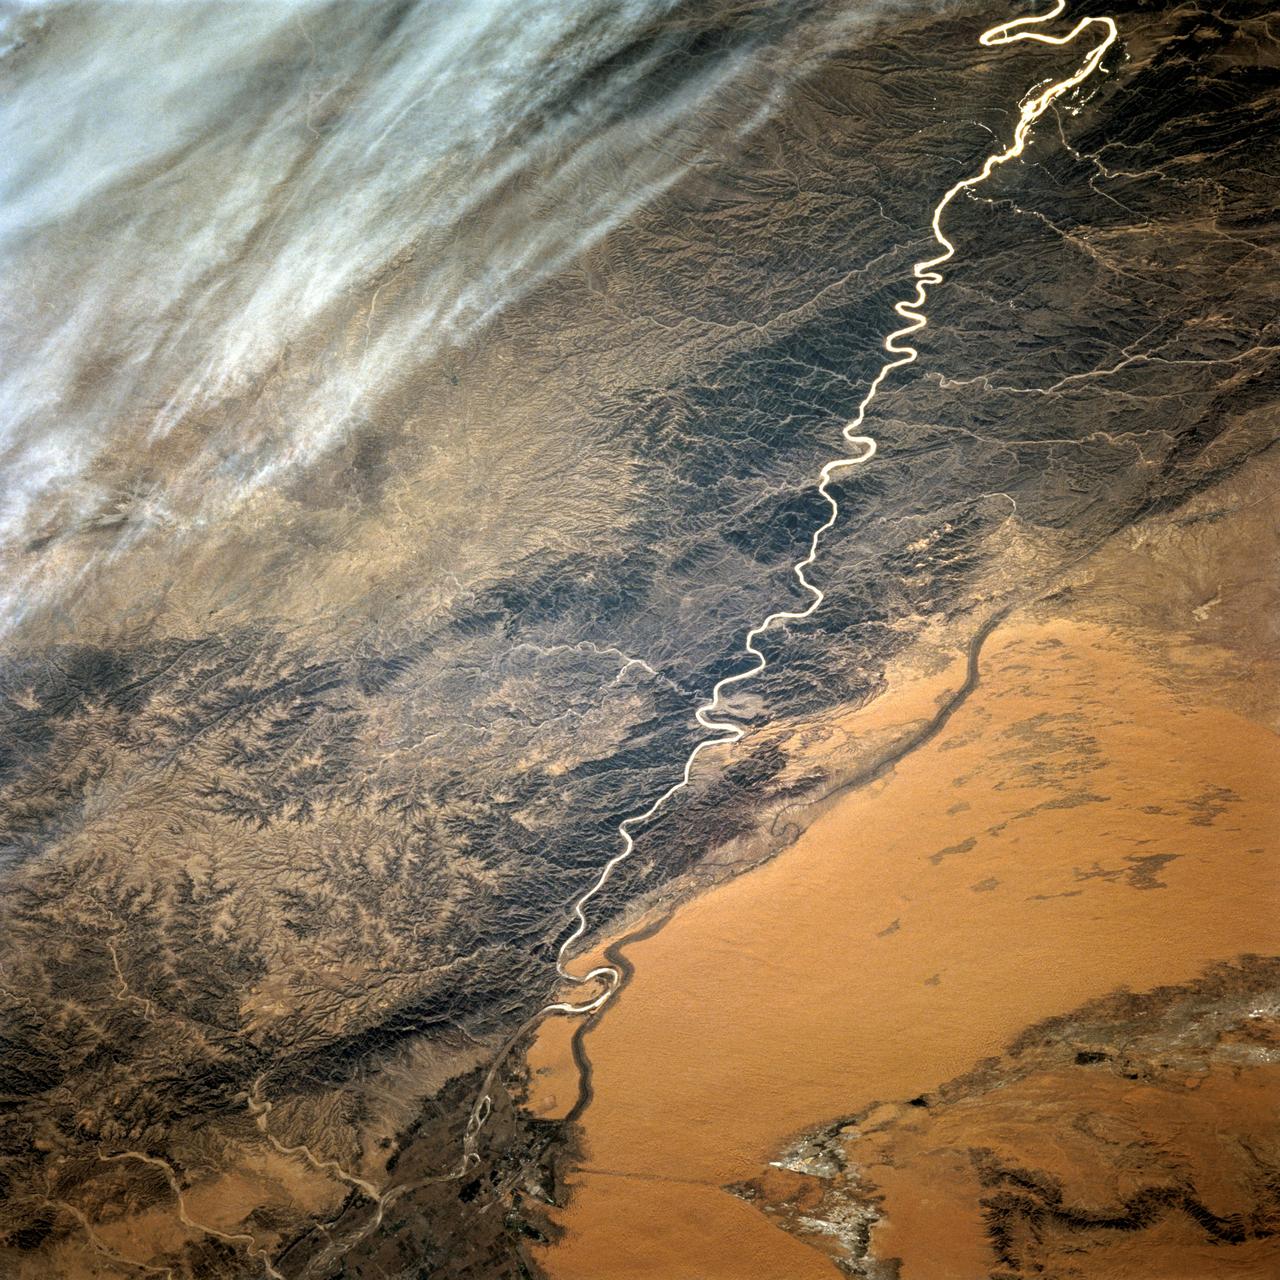
STS068-220-033 (30 September-11 October 1994) --- Photographed through the Space Shuttle Endeavour's flight deck windows, this 70mm frame shows a small section of China's Yellow River (Huang Ho) highlighted by sunglint reflection off the surface of the water. The river flows northeastward toward the village of Tung-lin-tzu. The low dissected mountains that cover more than half of this scene rise some 2,000 feet (on the average) above the valley floor. A major east-west transportation corridor (both railway and automobile) is observed traversing the landscape north of the river. This entire region is considered to be part of the Ordos Desert, actually part of the greater Gobi located just north of this area. Approximate center coordinates of this scene are 37.5 degrees north latitude and 105.0 degrees east longitude.

KENNEDY SPACE CENTER, FLA. - Randolph E. Berridge, president of the Florida High Tech Corridor Council, and Tom Feeney, Florida Representative from the 24th District, attend the 2003 Southeastern Regional FIRST Robotic Competition. The competition is being held at the University of Central Florida (UCF) in Orlando, March 20-23. Forty student teams from around the country are participating in the event that pits team-built gladiator robots against each other in an athletic-style competition. The teams are sponsored by NASA/Kennedy Space Center, The Boeing Company/Brevard Community College, and Lockheed Martin Space Operations/Mission Systems for the nonprofit organization For Inspiration and Recognition of Science and Technology, known as FIRST. The vision of FIRST is to inspire in the youth of our nation an appreciation of science and technology and an understanding that mastering these disciplines can enrich the lives of all mankind.
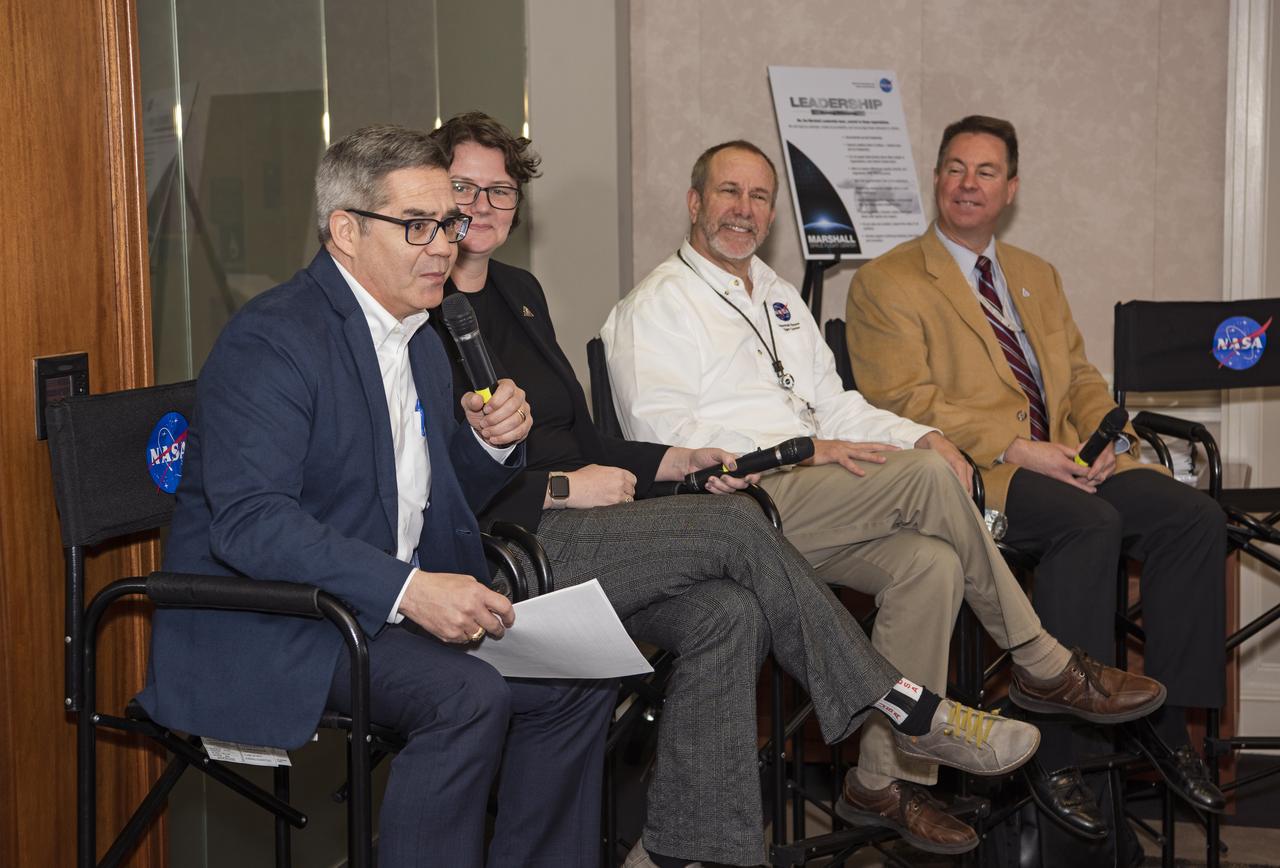
Sam Ortega, left, manager of the Partnerships Office at NASA’s Marshall Space Flight Center, moderates an Artemis Program panel featuring, second from left, Renee Weber, Marshall chief scientist; David Beaman, manager of Marshall’s Systems Engineering & Integration Office; and Don Krupp, associate program manager for the Human Landing System Program, during Universities of the Tennessee Valley Corridor activities Feb. 27 at Marshall. Leadership staff from eight universities and 10 junior colleges in Alabama, Tennessee and Kentucky also heard presentations on Office of STEM Engagement opportunities, partnership opportunities, Marshall’s Technology Transfer Office, the NASA software catalog and Marshall’s Advanced Concepts Office. The group toured several Marshall facilities to learn more about center capabilities.

CAPE CANAVERAL, Fla. – A Senate field hearing held at the Canaveral Port Authority and chaired by Florida Sen. Bill Nelson focuses on workforce related challenges at NASA's Kennedy Space Center and potential solutions to mitigate the transition's effects on the community. The hearing examined issues surrounding the retirement of the space shuttle and the transition to the new Orion/Ares system. At the table are community representatives Lynda Weatherman, president and CEO of the Economic Development Commission of Florida's Space Coast; Lisa Rice, president of the Brevard Workforce Development Board Inc.; Randy Berridge, president of the Florida High Tech Corridor Council; and Steve Kohler, president of Space Florida. NASA Administrator Michael Griffin is seated at right. Photo credit: NASA/Kim Shiflett
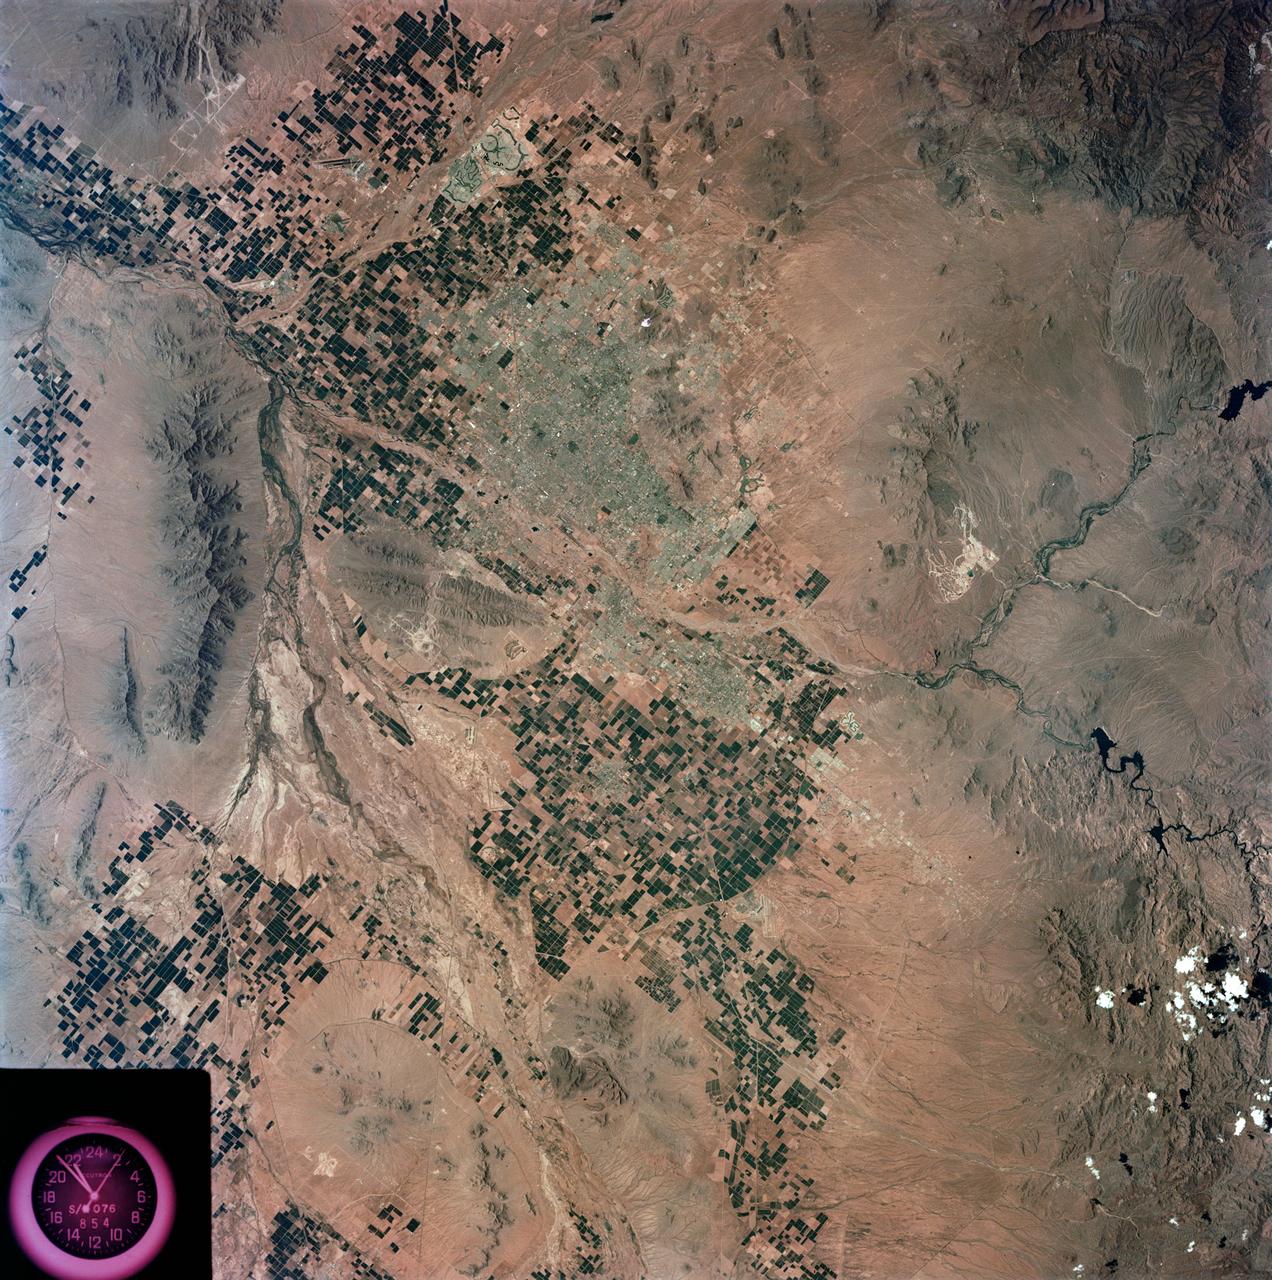
S73-35078 (July-Sept. 1973) --- A nearly vertical view of the Phoenix, Arizona metropolitan area is seen in this Skylab 3 (second manning) Earth Resources Experiments Package S190-B (five-inch Earth terrain camera) photograph taken from the Skylab space station in Earth orbit. Also in the picture are Scottsdale, Paradise Valley, Tempe, Mesa, Komatke, Salt River Indian Reservation and part of the Gila River Indian Reservation. Features which can be delineated from the photograph include: cultural patterns defined by commercial, industrial, agricultural and residential areas; transportation networks consisting of major corridors, primary, secondary and feeder streets; major urban developments in the area such as airports, Squaw Peak City Park, Turf Paradise Race Track and the State Fairgrounds. Phoenix is one of the 27 census cities of interest under study by the U.S. Geological Survey and is the center of the Arizona Regional Ecological Test Site. A large number of investigators will be using the Skylab data. This photo will be compared to earlier ones to document changes in the urban area with time. The landscape is well defined in terms of mountains, alluvial fans and river flood plains. Several different types of natural vegetation and irrigated crop lands can be mapped. Geological features are not well displayed but mining activities are readily identified. Photo credit: NASA
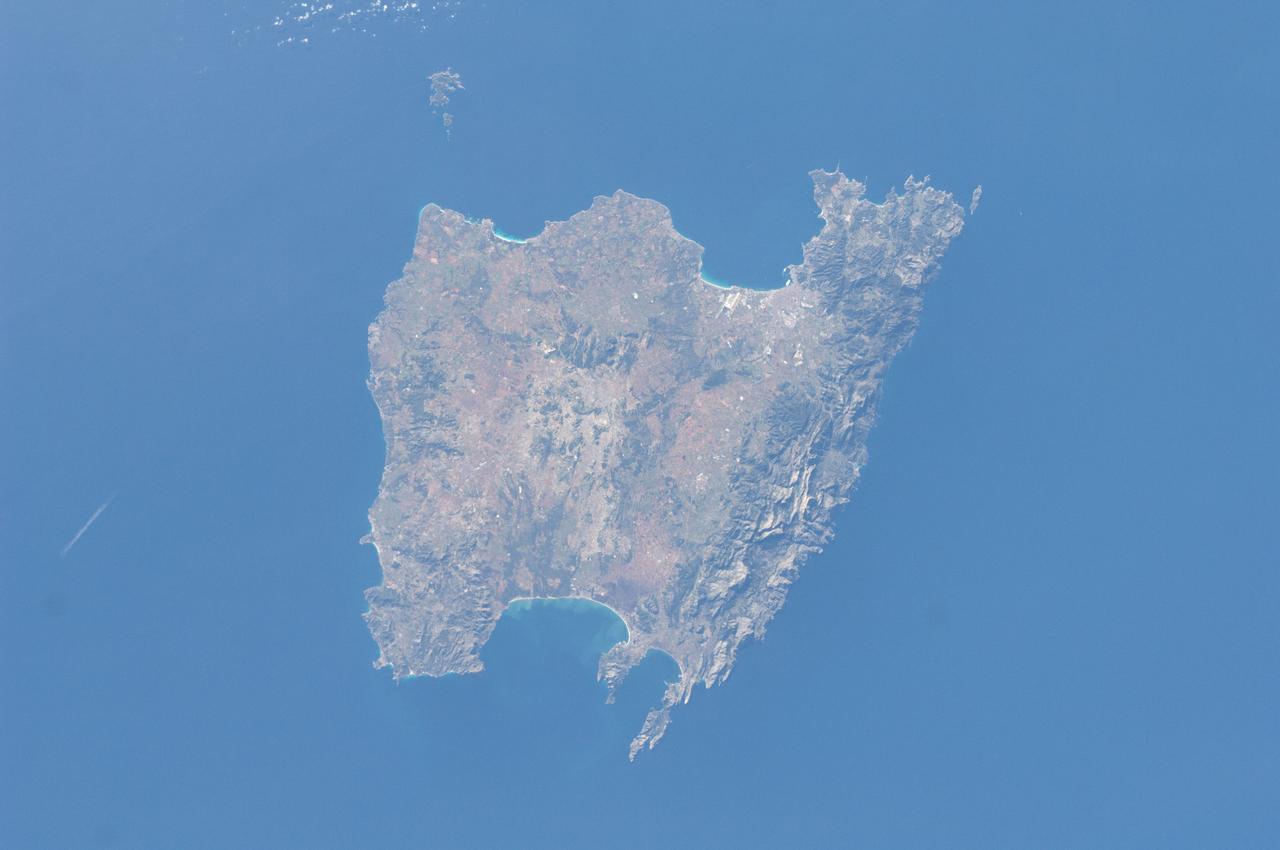
ISS030-E-030290 (31 Dec. 2011) --- Majorca in the Balearic Islands (Spain) is featured in this image photographed by an Expedition 30 crew member aboard the International Space Station. The Balearic Islands are an archipelago located to the southwest of Spain in the Mediterranean Sea. Catalan – the native tongue – and Spanish are the official languages. The islands are an autonomous community and province of Spain, located approximately midway between the southeastern coastline of Spain and the northern coastline of Algeria. This photograph highlights the large island of Majorca (approximately 5,400 square kilometers; also known as Mallorca in Spanish) on which the capital city of Palma is located (center). The small island of Cabrera to the southwest of Majorca (upper left) hosts the Parc Nacional de l’Arxipelag de Cabrera (site mainly in Spanish). Like the other Balearic Islands, Majorca is a popular holiday destination for the European community with tourism forming a major part of the island’s economy. The island’s physiography offers many recreational opportunities – mountainous regions are present along the northwest coastline and eastern third, while much of the central part of the island is flat. Diving is also a popular activity. The central region includes agricultural lands (tan, light brown, and green, center), forested patches and corridors (dark green, center), and urban centers (gray). In addition to Majorca, the other major islands of the archipelago include Ibiza, Formentera, and Minorca.
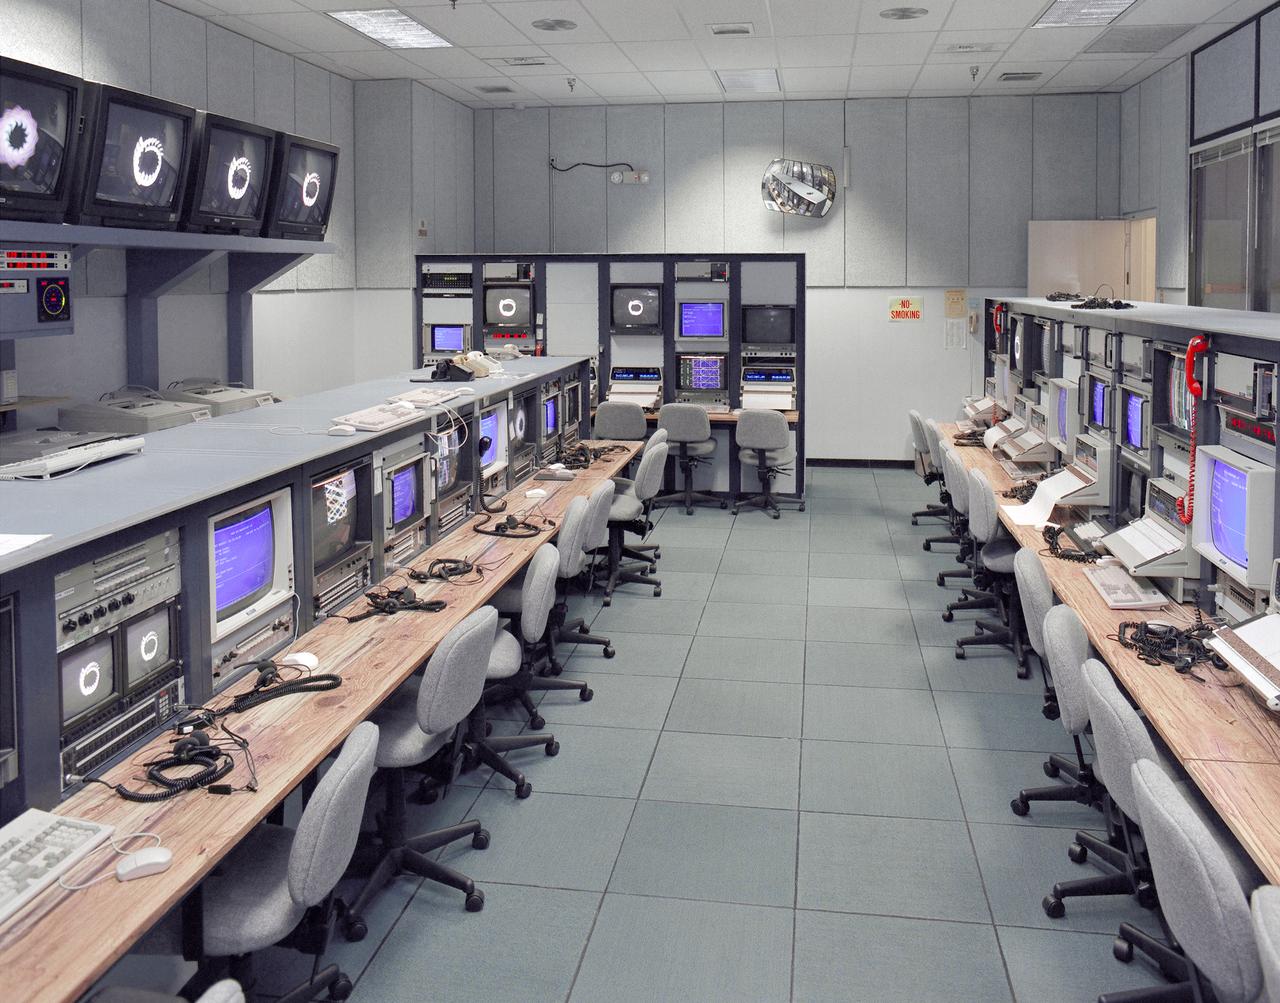
Mission control Blue Room, seen here, in building 4800 at NASA's Dryden Flight Research Center, is part of the Western Aeronautical Test Range (WATR). All aspects of a research mission are monitored from one of two of these control rooms at Dryden. The WATR consists of a highly automated complex of computer controlled tracking, telemetry, and communications systems and control room complexes that are capable of supporting any type of mission ranging from system and component testing, to sub-scale and full-scale flight tests of new aircraft and reentry systems. Designated areas are assigned for spin/dive tests, corridors are provided for low, medium, and high-altitude supersonic flight, and special STOL/VSTOL facilities are available at Ames Moffett and Crows Landing. Special use airspace, available at Edwards, covers approximately twelve thousand square miles of mostly desert area. The southern boundary lies to the south of Rogers Dry Lake, the western boundary lies midway between Mojave and Bakersfield, the northern boundary passes just south of Bishop, and the eastern boundary follows about 25 miles west of the Nevada border except in the northern areas where it crosses into Nevada.
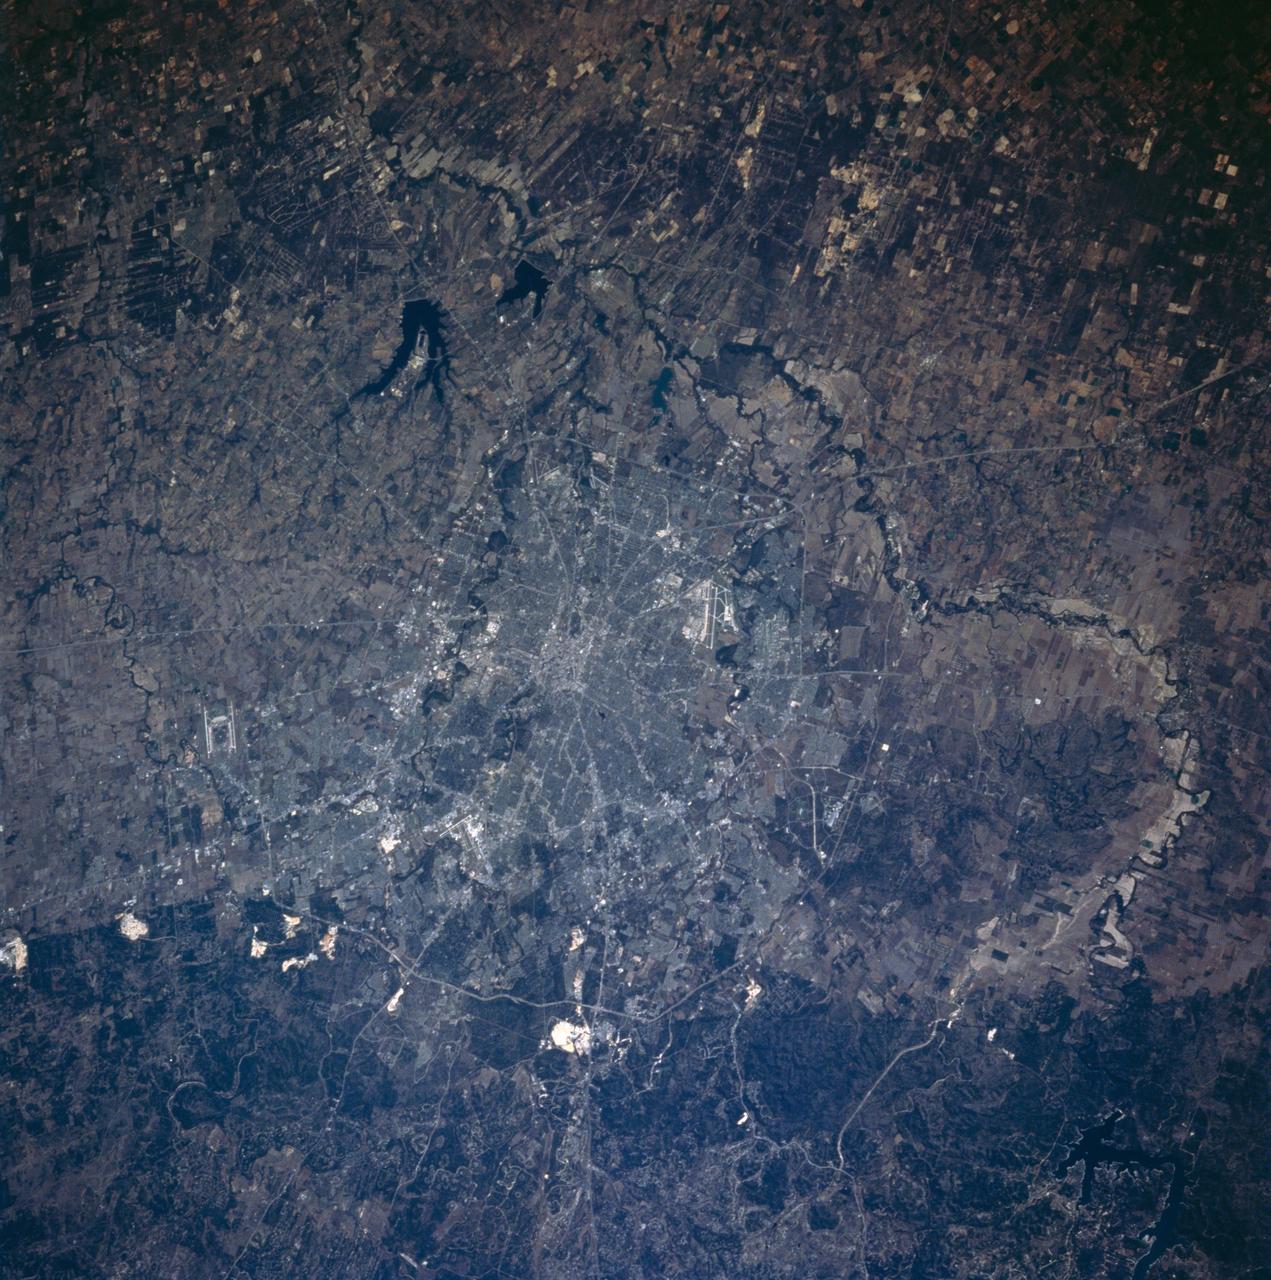
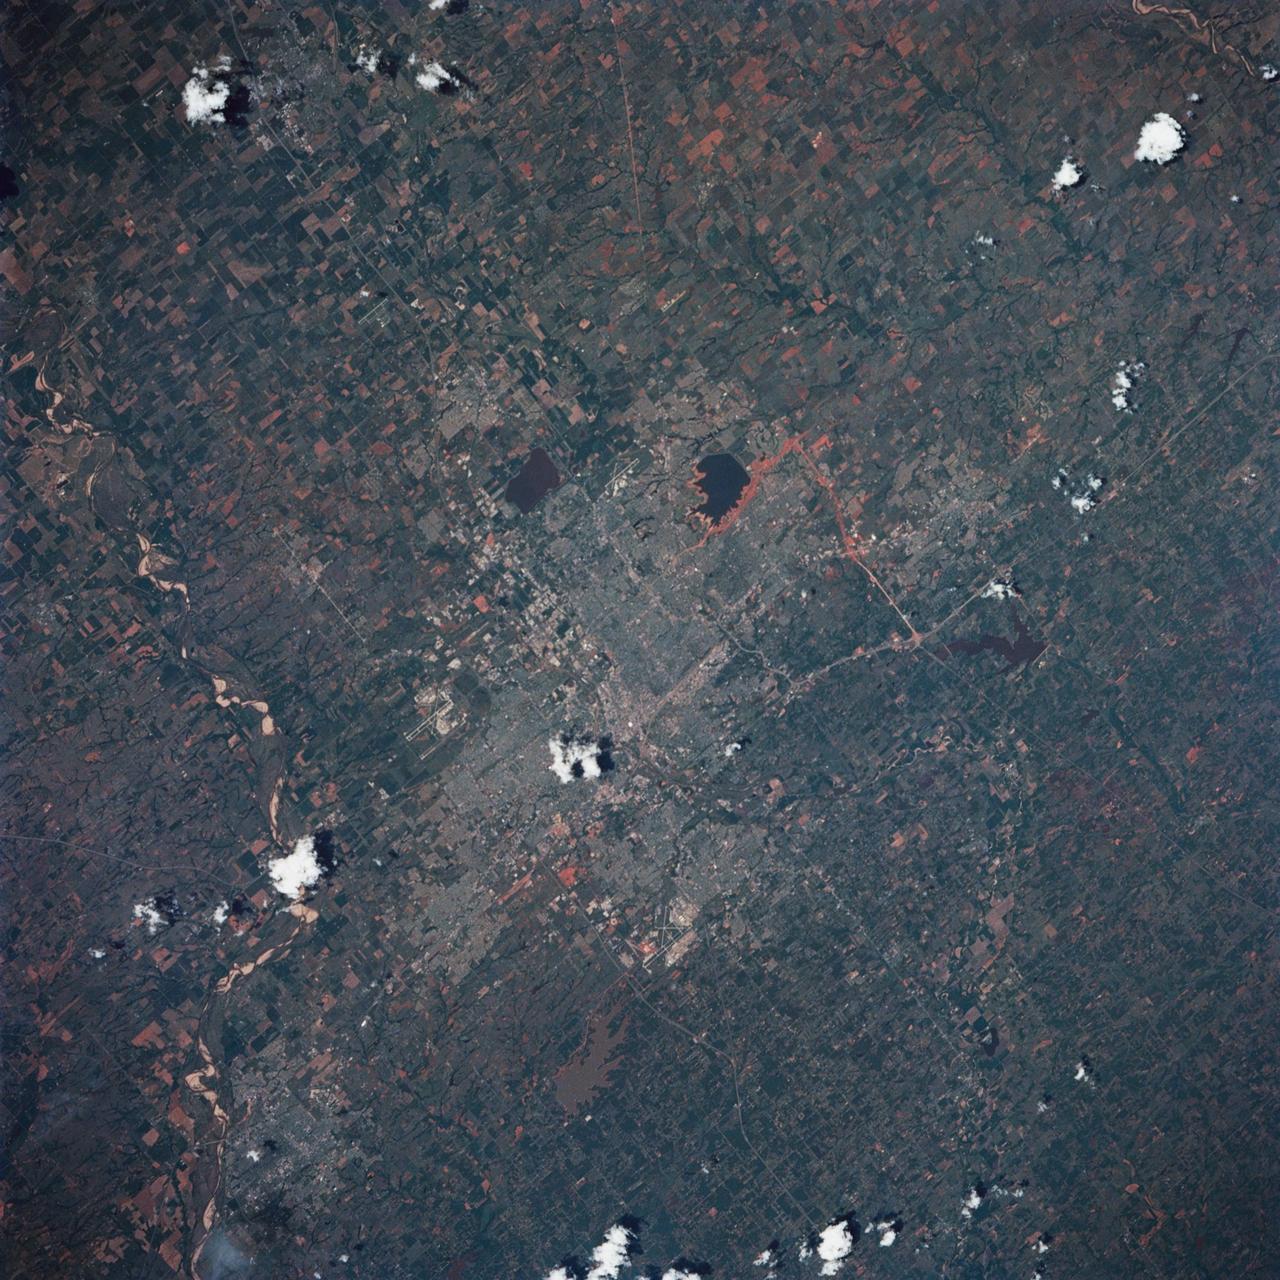
STS058-101-053 (18 Oct-1 Nov 1993) --- This sharp cloud-free photograph of San Antonio, Texas illustrates the classic pattern of western cities. The Hispanic heart of the city; an intertwining of streets along the San Antonio River and around the Alamo, surrounded by a late 19th century Anglo grid of small businesses and suburban homes. Transportation routes radiate to mid and late 20th Century ring corridors separating the urban/suburban region from the surrounding agricultural countryside. San Antonio was founded around permanent springs that rise at the foot of the Balcones Escarpment, which separates the Texas Hill Country from the South Texas Plains. Limestone quarries are conspicuous along the edge of the escarpment. San Antonio has long been a major site for military training bases: Randolph Air Force Base is outside the city to the northeast, Fort Sam Houston is contained within the northeast quadrant of the city, Brooks Air Force Base lies at the southeastern corner, and Lackland and Kelly Air Force Bases are within the suburban fringe to the southwest. San Antonio International Airport can be seen at the foot of the escarpment in the northern part of the city.
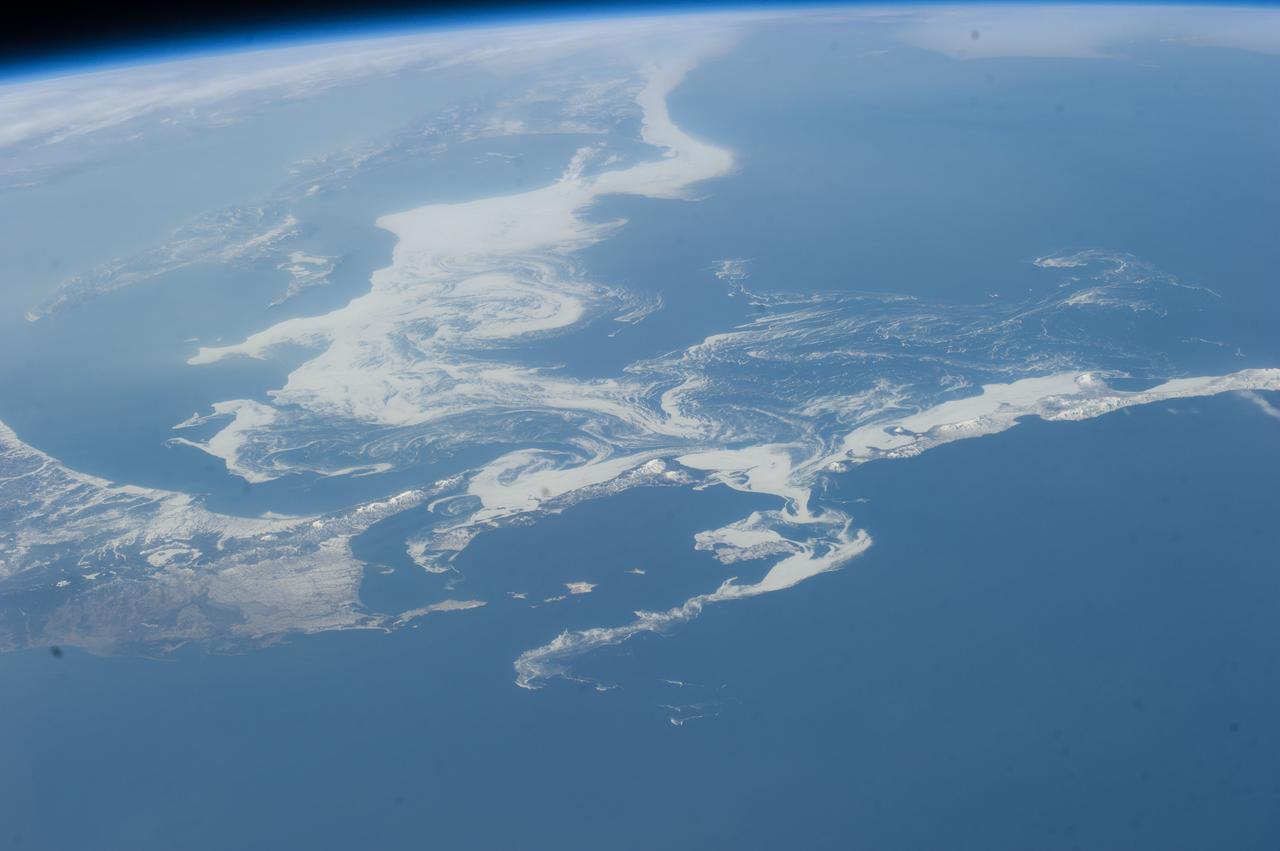
ISS039-E-11773 (14 April 2014) --- Photographed with a camera equipped with an 80mm lens from the International Space Station, patterns of sea ice in the Sea of Okhotsk reveal the dynamics of ocean currents that could otherwise only be seen in sunglint. In this Expedition 39 photo, one can see nearly 1,000 kilometers (600 miles) of the East Sakhalin Current, which is carrying winter ice south toward Japan’s Hokkaido Island. The current is marked by the narrow corridor of dense ice that hugs the coast of Russia’s Sakhalin Island. As it approaches Hokkaido, the ice patterns show a series of eddies and swirls. The East Sakhalin Current wanes in summer when the Soya Current begins to enter the Sea of Okhotsk. This inrush of summer water starts in April and, according to NASA scientists, probably expresses itself in this image as ice pattern to the east above Hokkaido. The Sakhalin current turns east and transports ice toward the Kuril Island chain. Some ice can spill through gaps in the islands, where it is swept southwest by the Kuril Current (lower right).
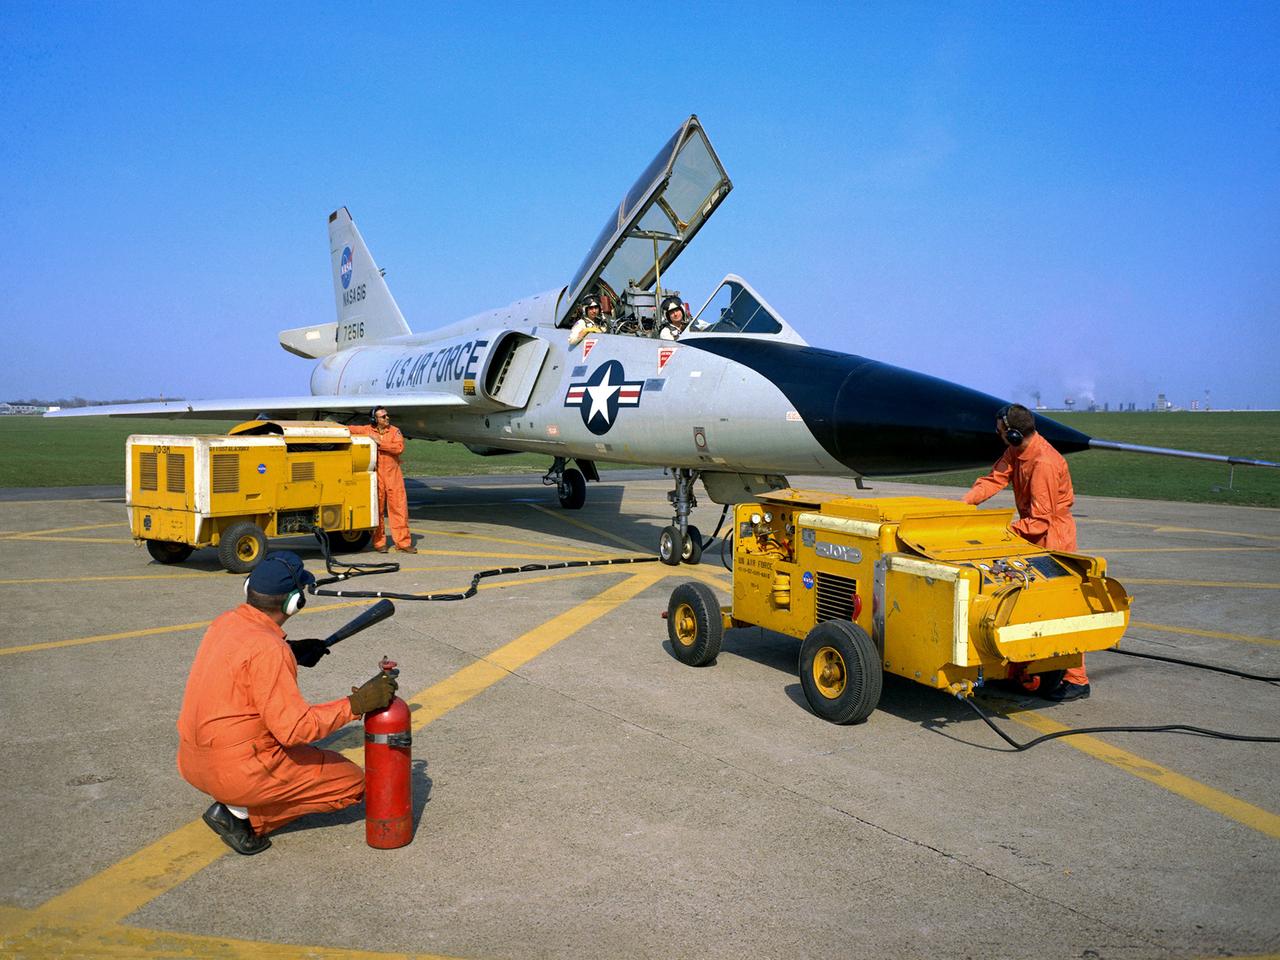
National Aeronautics and Space Administration (NASA) pilot Cliff Crabbs and the flight operations crew prepare a Convair F-106B Delta Dart for a flight from the Lewis Research Center in Cleveland, Ohio. NASA acquired the aircraft three years earlier to investigate noise-reducing inlet and nozzle designs for the supersonic transport engine program. Two General Electric J85 engines were installed underneath the aircraft’s delta wings to simulate the general shape of the supersonic transport’s engines. One of the engines was modified with experimental inlet or nozzle configurations. The unmodified engine was used for comparison. Most F-106B flights were flown in a 200-mile path over the lake between Buffalo and Sandusky, known as the Lake Erie Corridor. The 1100-miles per hour flight took only 11 minutes at an altitude of 30,000 feet. The aircraft almost always returned with a depleted fuel supply so a Visual Flight Rules operation was required. Following the crash of another jet fighter at Lewis in July 1969, the F-106s were stationed at Selfridge Air Force Base in Michigan. NASA pilots flew transport planes each morning to the base before commencing the F-106B missions.
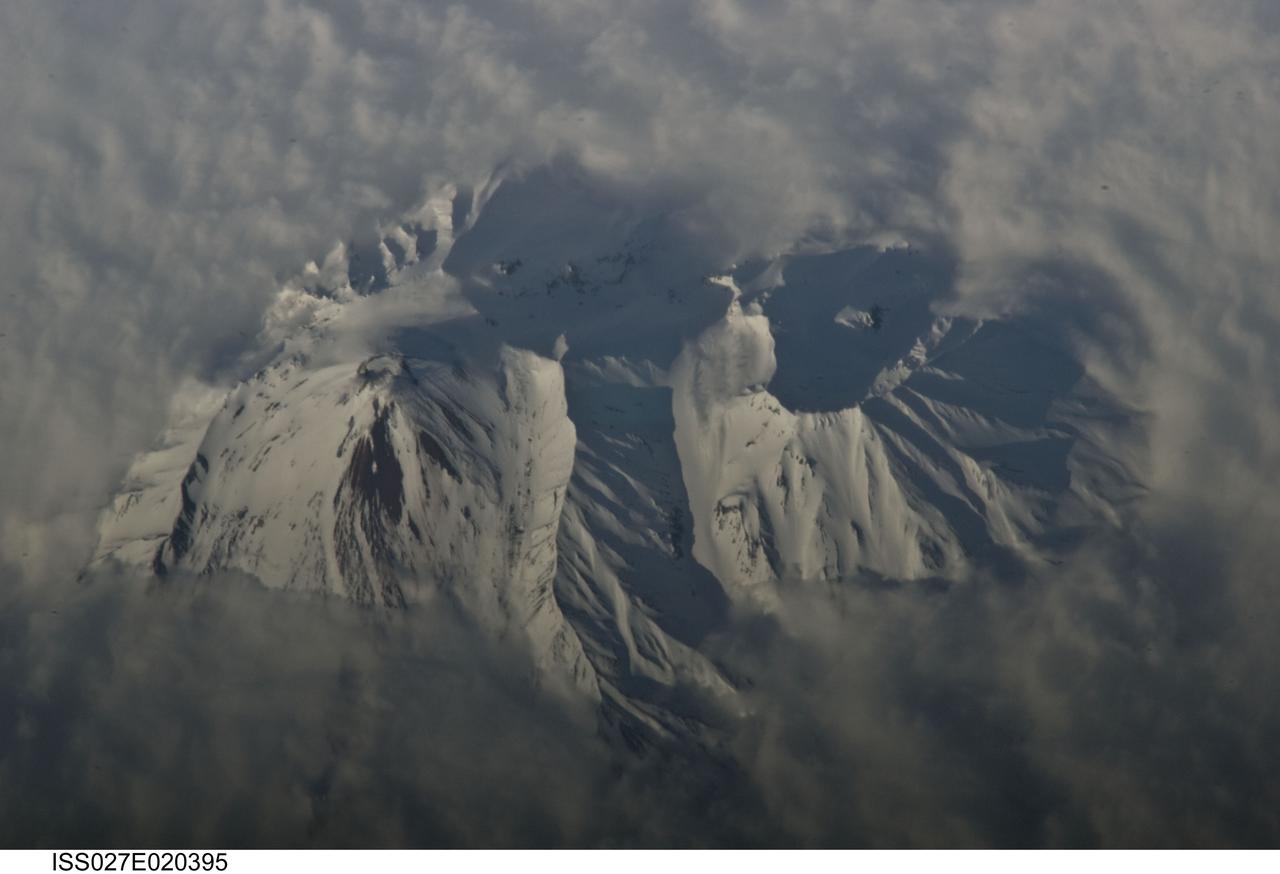
ISS027-E-020395 (2 May 2011) --- Avachinsky Volcano, Kamchatka Peninsula, Russia is featured in this image photographed by an Expedition 27 crew member on the International Space Station. The Kamchatka Peninsula, located along the Pacific ?ring of fire?, includes more than 100 identified volcanoes. While most of these volcanoes are not actively erupting, many are considered to be dangerous due to their past eruptive history and proximity to population centers and air travel corridors. This detailed photograph highlights the summit crater and snow-covered upper slopes of the Avachinsky stratovolcano exposed above a surrounding cloud deck. The 2,741-meter-high Avachinsky volcano has an extensive historical and geological record of eruptions with the latest activity observed in 2008. The large city of Petropavlovsk, Kamchatka is located approximately 25 kilometers to the southwest and, according to scientists, is built over approximately 30,000 ? 40,000 year old debris avalanche deposits that originated from Avachinsky ? suggesting that the city may be at risk from a similar hazard in the future. To the southeast (right), the large breached crater of Kozelsky Volcano is also visible above the clouds. Kozelsky is a parasitic cone, formed by the eruption of material from vents along the flank of Avachinsky volcano. The topography of the volcanoes is accentuated by shadows produced by the relatively low sun angle, and by the oblique viewing angle. Oblique images are taken looking outwards at an angle from the International Space Station, rather than the ?straight down? (or nadir) view typical of most orbital Earth-observing sensor systems.

ISS035-E-005438 (16 March 2013) --- One of the Expedition 35 crew members on the International Space Station used a still camera with a 400 millimeter lens to record this nocturnal image of the Phoenix, Arizona area. Like many large urban areas of the central and western United States, the Phoenix metropolitan area is laid out along a regular grid of city blocks and streets. While visible during the day, this grid is most evident at night, when the pattern of street lighting is clearly visible from above – in the case of this photograph, from the low Earth orbit vantage point of the International Space Station. The urban grid form encourages growth of a city outwards along its borders, by providing optimal access to new real estate. Fueled by the adoption of widespread personal automobile use during the 20th century, the Phoenix metropolitan area today includes 25 other municipalities (many of them largely suburban and residential in character) linked by a network of surface streets and freeways. The image area includes parts of several cities in the metropolitan area including Phoenix proper (right), Glendale (center), and Peoria (left). While the major street grid is oriented north-south, the northwest-southeast oriented Grand Avenue cuts across it at image center. Grand Avenue is a major transportation corridor through the western metropolitan area; the lighting patterns of large industrial and commercial properties are visible along its length. Other brightly lit properties include large shopping centers, strip centers, and gas stations which tend to be located at the intersections of north-south and east-west trending streets. While much of the land area highlighted in this image is urbanized, there are several noticeably dark areas. The Phoenix Mountains at upper right are largely public park and recreational land. To the west (image lower left), agricultural fields provide a sharp contrast to the lit streets of neighboring residential developments. The Salt River channel appears as a dark ribbon within the urban grid at lower right.
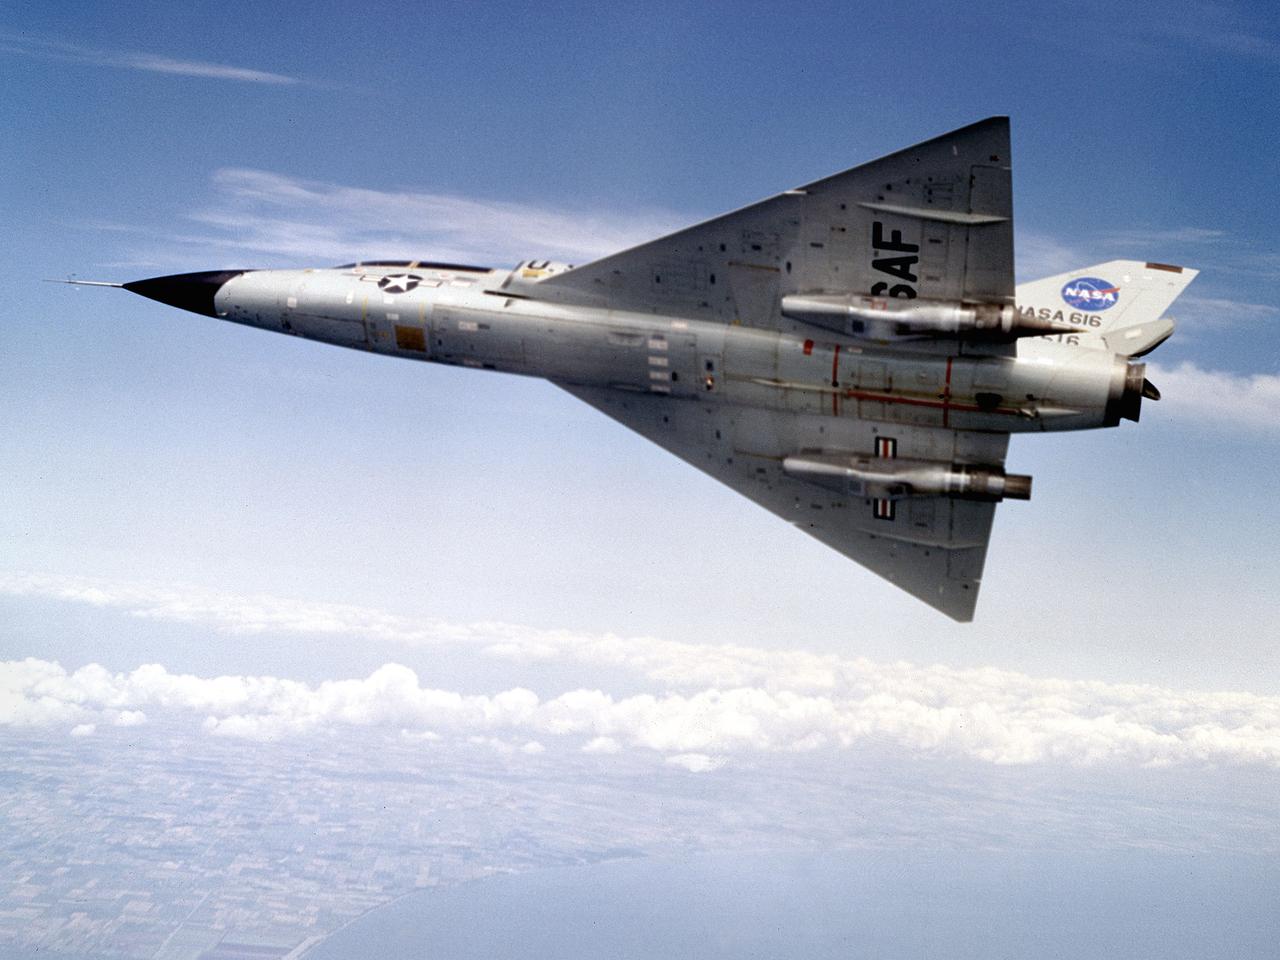
A Convair F-106B Delta Dart rolls to the right to reveal the two research engines installed under its wings by the National Aeronautics and Space Administration (NASA) Lewis Research Center. Lewis acquired the aircraft in October of 1966 to study inlet and nozzle designs for the supersonic transport engine program. Two General Electric J85 engines were mounted beneath the F-106B’s wings and operated from Mach 1 to 1.5. The right wing always carried reference nozzle for which the performance was known. Six supersonic nozzle variations and two inlets were tested on the left engine. The designs had already been studied in the Lewis wind tunnels, but those tests were limited by shock waves in the tunnels. Most F-106B flights were flown in a 200-mile path over the lake between Buffalo and Sandusky, known as the Lake Erie Corridor. The 1100-mile-per-hour flight took only 11 minutes at an altitude of 30,000 feet. The aircraft almost always returned with a depleted fuel supply so a Visual Flight Rules operation was required. Following the crash of another jet fighter at Lewis in July 1969, the F-106s were stationed at Selfridge Air Force Base in Michigan. NASA pilots flew transport planes each morning to the base before commencing the F-106B missions. After the supersonic transport program was cancelled, the F-106B was used as a test bed for additional engine exhaust nozzle configurations. The F-106B was also used to test inlet configurations for the noise reduction program.
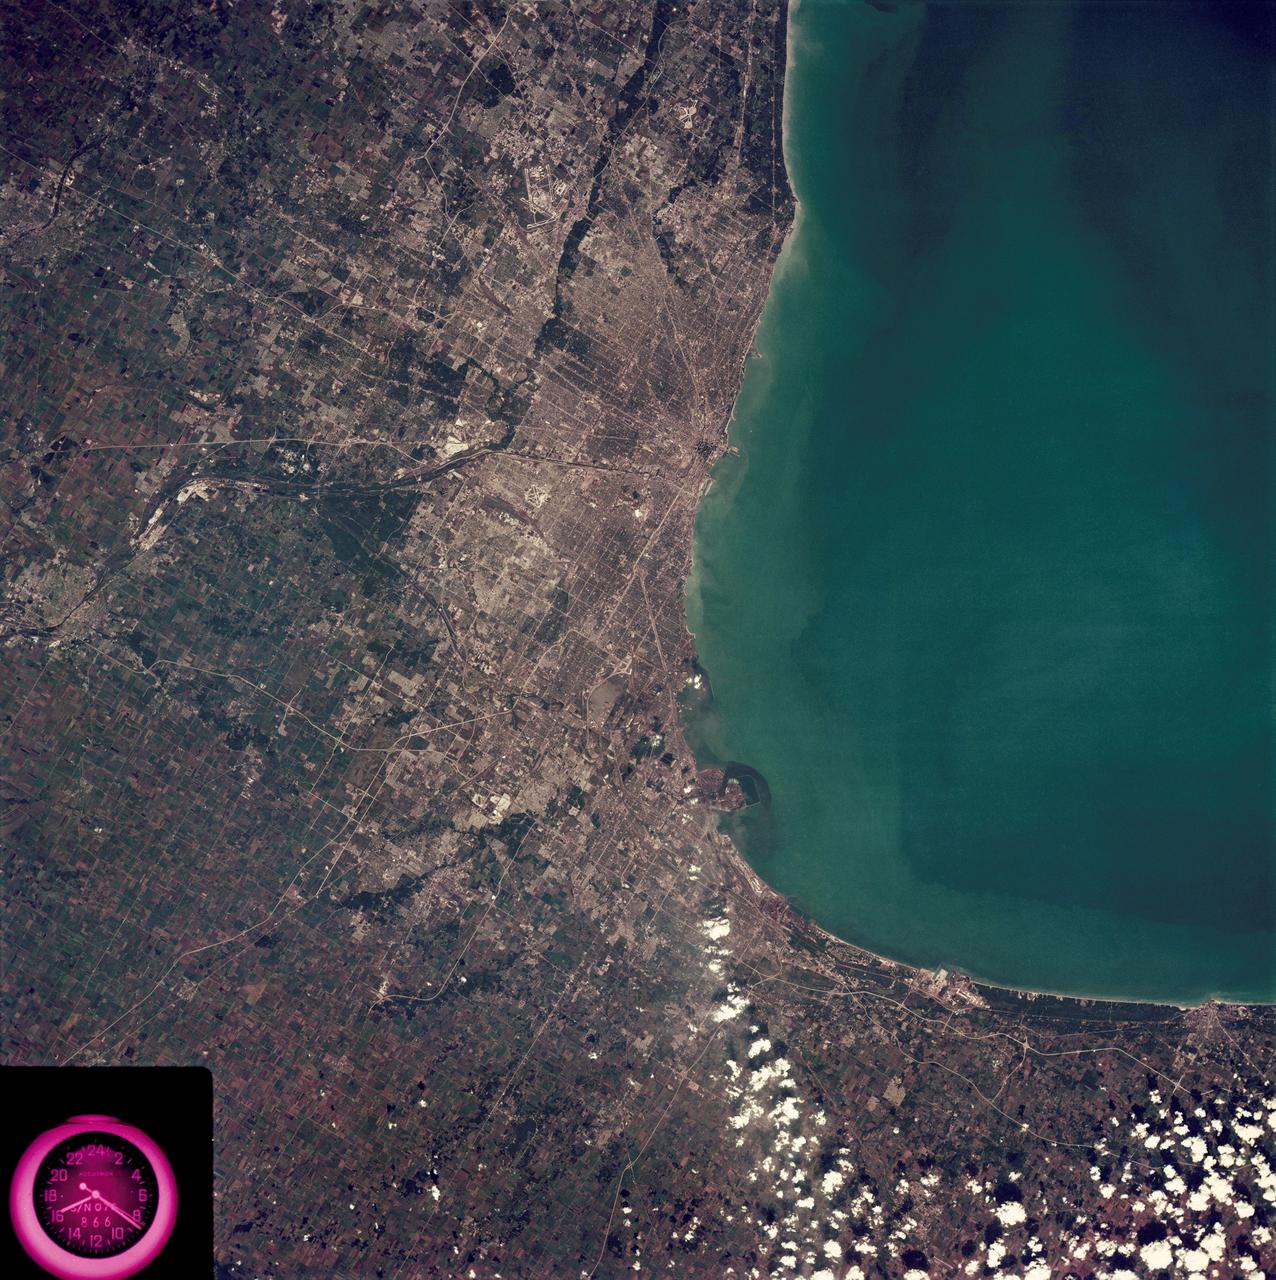
SL3-88-222 (18 Sept. 1973) --- The metropolitan area of Chicago is encompassed in this Skylab 3 Earth Resources Experiments Package (EREP) S190-B photograph taken on Sept. 18, 1973 from the Skylab space station cluster in Earth orbit. The surrounding major cities of Aurora and Joliet, Illinois; Hammond, Gary and East Chicago, Indiana, are easily delineated. The photograph reveals the following: (1) Cultural differentiation of commercial, industrial and residential areas for use in population and social studies in micro-macro community planning and in cultural pattern studies in the improvement of urban areas. (Aurora is one of 27 census cities of interest to Robert Alexander, a principal investigator. Alexander is with the U.S. Geological Survey). (2) The transportation network with major corridors and their interchanges, primary and feeder streets for use in network analysis and in the development of models for population movement and land use projection. (3) The agricultural lands for land use identification on crop inventory analysis; airports for use in delineation of service and infringement of major man-made features that affect ecosystem balance (support to environmental impact studies). (4) Air and water plumes for use in case studies, natural and man-made differentiation of pollution sources, in support of model development and in ecosystem research studies on the effects of pollution. (5) Recreational centers for use in relating recreational centers to population centers, establishing possible demands and in development of possible future recreational centers to support the demand. All EREP photography is available to the public through the Department of Interior?s Earth Resources Observations Systems Data Center, Sioux Falls, South Dakota, 57198. Photo credit: NASA
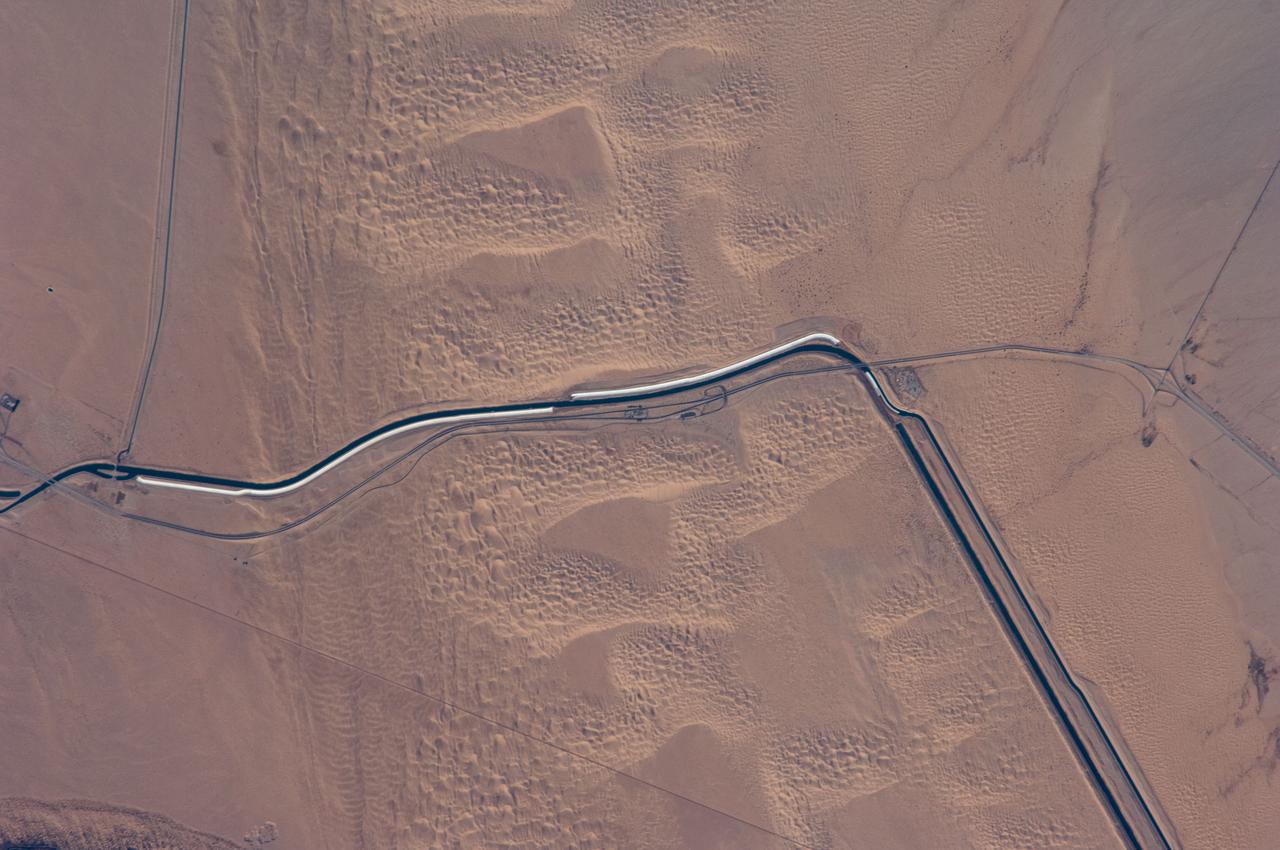
ISS018-E-024949 (31 Jan. 2009) --- The All-American Canal, the largest irrigation canal in the world and a key landmark along the California-Mexico border, is featured in this image photographed by an Expedition 18 crewmember on the International Space Station. This image captures about 15 kilometers of the important infrastructure corridor just west of Yuma, AZ. The prominent dark line crossing the image is the Canal which is crossed, in this view, by Interstate Highway 8. The canal carries 740.6 cubic meters (26,155 cubic feet) of water per second from the Colorado River westward to support the intensive agriculture of California?s Imperial Valley to the northwest, and to nine cities including San Diego, CA. The canal system is the Imperial Valley?s only source of water, and allows irrigation of more than 2,000 square kilometers (500,000 acres) of agricultural fields. The Coachella Canal, one of four main branch canals, leads water north to Imperial Valley. This section of the canal requires constant maintenance. Approximately 68,000 acre-feet of water per year are lost by seepage from the All-American Canal - especially where the canal crosses the great Algodones Dune Field, a portion of which is visible extending from top to bottom in the center of the image. Additionally, dune sand is constantly blown to the southeast, and into the canal. As part of California?s Colorado River Water Use Plan, 37 kilometers (23 miles) of the canal is being lined to prevent water loss by seepage. A recently opened sector parallels the old canal (right) and new lined sectors are under construction (bright lines, center). Engineers have sited new sections of the canal to avoid the worst areas of dune-sand invasion, so that the new configuration will be significantly cheaper to maintain and operate. A new road crosses the dunes and marks the US?Mexico border as part of border fence construction efforts. The margin of the Colorado River floodplain in Mexico is just visible two kilometers south of the border (lower left corner). This floodplain is Mexico?s equivalent of the Imperial Valley in terms of its enormous irrigated agricultural production.
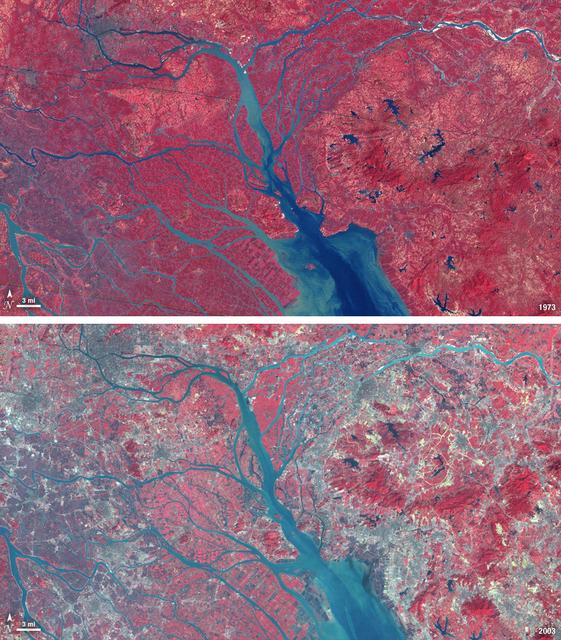
In 1979, China established two special economic zones around the Pearl River Delta, north of Hong Kong. This image, taken by Landsat 3 on October 19, 1973, shows that the region was rural when the zone was established. Plant-covered land, which is red in this false-color image, dominates the scene. Square grids are agriculture. By January 10, 2003, when Landsat 7 took this image, the Pearl River Delta was a densely populated urban corridor with several large cities. The urban areas are gray in this image. The region is a major manufacturing center with an economy the size of Taiwan’s. As of 2010, the Pearl River Economic Zone had a population of 36 million people. ---- NASA and the U.S. Department of the Interior through the U.S. Geological Survey (USGS) jointly manage Landsat, and the USGS preserves a 40-year archive of Landsat images that is freely available over the Internet. The next Landsat satellite, now known as the Landsat Data Continuity Mission (LDCM) and later to be called Landsat 8, is scheduled for launch in 2013. In honor of Landsat’s 40th anniversary in July 2012, the USGS released the LandsatLook viewer – a quick, simple way to go forward and backward in time, pulling images of anywhere in the world out of the Landsat archive. <b><a href="http://www.nasa.gov/audience/formedia/features/MP_Photo_Guidelines.html" rel="nofollow">NASA image use policy.</a></b> <b><a href="http://www.nasa.gov/centers/goddard/home/index.html" rel="nofollow">NASA Goddard Space Flight Center</a></b> enables NASA’s mission through four scientific endeavors: Earth Science, Heliophysics, Solar System Exploration, and Astrophysics. Goddard plays a leading role in NASA’s accomplishments by contributing compelling scientific knowledge to advance the Agency’s mission. <b>Follow us on <a href="http://twitter.com/NASA_GoddardPix" rel="nofollow">Twitter</a></b> <b>Like us on <a href="http://www.facebook.com/pages/Greenbelt-MD/NASA-Goddard/395013845897?ref=tsd" rel="nofollow">Facebook</a></b> <b>Find us on <a href="http://instagrid.me/nasagoddard/?vm=grid" rel="nofollow">Instagram</a></b>
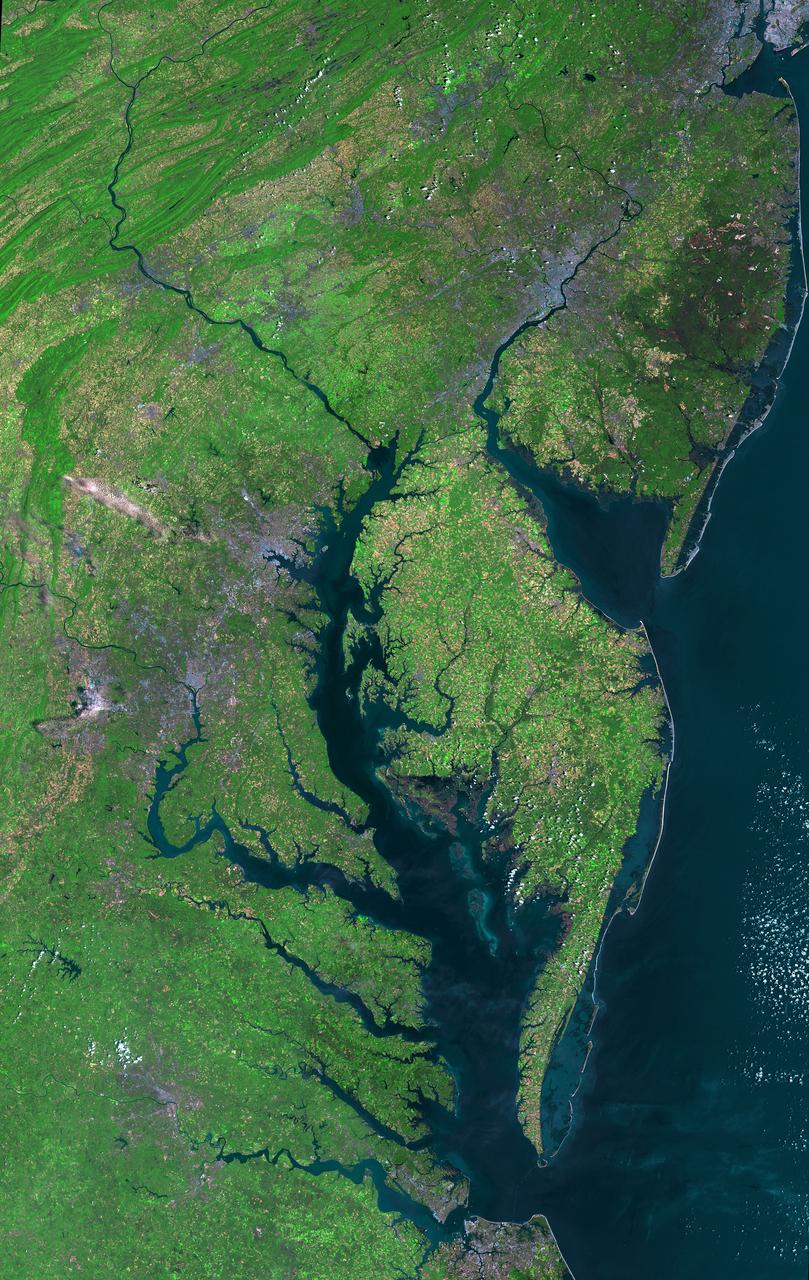
Aug 30, 2011 USGS has released a new mosaic of the Chesapeake Bay. Using six Landsat 5 images collected in July 2009 and 2011 a beautiful, seamless mosaic of the Chesapeake Bay region was created by the USGS Landsat team. The Washington D.C.-Baltimore-Philadelphia-New York City corridor can be clearly seen (look for silvery purple) as can the Chesapeake and Delaware Bays and the coastal Atlantic barrier islands from Fishermans Island, Virginia to Sandy Hook, New Jersey. To download the full high res go to: <a href="http://landsat.gsfc.nasa.gov/news/news-archive/news_0387.html" rel="nofollow">landsat.gsfc.nasa.gov/news/news-archive/news_0387.html</a> Credit: NASA/USGS/Landsat 5 <b><a href="http://www.nasa.gov/centers/goddard/home/index.html" rel="nofollow">NASA Goddard Space Flight Center</a></b> enables NASA’s mission through four scientific endeavors: Earth Science, Heliophysics, Solar System Exploration, and Astrophysics. Goddard plays a leading role in NASA’s accomplishments by contributing compelling scientific knowledge to advance the Agency’s mission. <b>Follow us on <a href="http://twitter.com/NASA_GoddardPix" rel="nofollow">Twitter</a></b> <b>Like us on <a href="http://www.facebook.com/pages/Greenbelt-MD/NASA-Goddard/395013845897?ref=tsd" rel="nofollow">Facebook</a></b> <b>Find us on <a href="http://instagrid.me/nasagoddard/?vm=grid" rel="nofollow">Instagram</a></b>
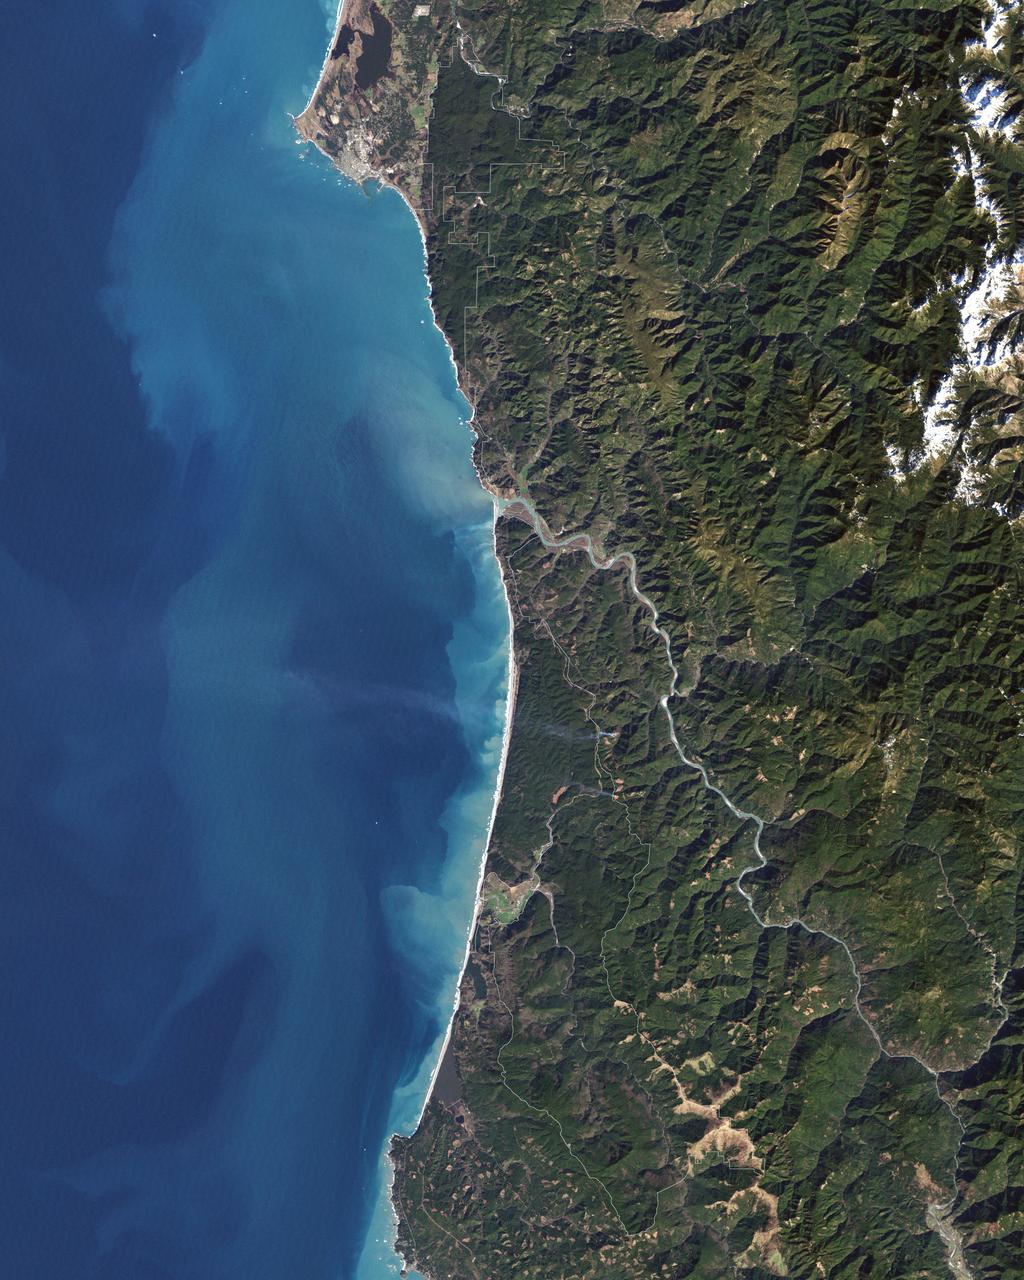
In 1968, after state parks had already been established in northern California, the U.S. Congress established Redwood National Park. This new park supplemented protected lands in the region, and in 1994, state and federal authorities agreed to jointly manage the area’s public lands. On February 6, 2003, the Enhanced Thamatic Mapper Plus on NASA’s Landsat 7 satellite captured this true-color image of the southern end of Redwood National Park - a thin coastal corridor connects the northern and southern ends of the park system. Along the coast, sandy beaches appear off-white, and sediments form swirls of pale blue in the darker blue sea. Inland, the park is dominated by green vegetation, with isolated patches of gray-beige rock. This image of the Redwood National Park includes two stands of trees: Lady Bird Johnson Grove and Tall Trees Grove. The first grove was dedicated to the former first lady by President Richard Nixon in August 1969. The second grove became the focus of efforts to protect the surrounding area from logging. Two waterways appear in this image: Redwood Creek and Klamath River. The more conspicuous Klamath River flows through the park system’s midsection (north of the area pictured here). Redwood Creek flows through the southern portion of the park system. Both waterways have carved gorges through the mountainous landscape. Redwood National and State Parks occupy an area considered to be the most seismically active in the United States. The frequent seismic activity has led to shifting waterways, landslides, and rapid erosion along the coastline. Read more: <a href="http://go.nasa.gov/2bRlryv" rel="nofollow">go.nasa.gov/2bRlryv</a> Credit: NASA/Landsat7 <b><a href="http://www.nasa.gov/audience/formedia/features/MP_Photo_Guidelines.html" rel="nofollow">NASA image use policy.</a></b> <b><a href="http://www.nasa.gov/centers/goddard/home/index.html" rel="nofollow">NASA Goddard Space Flight Center</a></b> enables NASA’s mission through four scientific endeavors: Earth Science, Heliophysics, Solar System Exploration, and Astrophysics. Goddard plays a leading role in NASA’s accomplishments by contributing compelling scientific knowledge to advance the Agency’s mission. <b>Follow us on <a href="http://twitter.com/NASAGoddardPix" rel="nofollow">Twitter</a></b> <b>Like us on <a href="http://www.facebook.com/pages/Greenbelt-MD/NASA-Goddard/395013845897?ref=tsd" rel="nofollow">Facebook</a></b> <b>Find us on <a href="http://instagrid.me/nasagoddard/?vm=grid" rel="nofollow">Instagram</a></b>
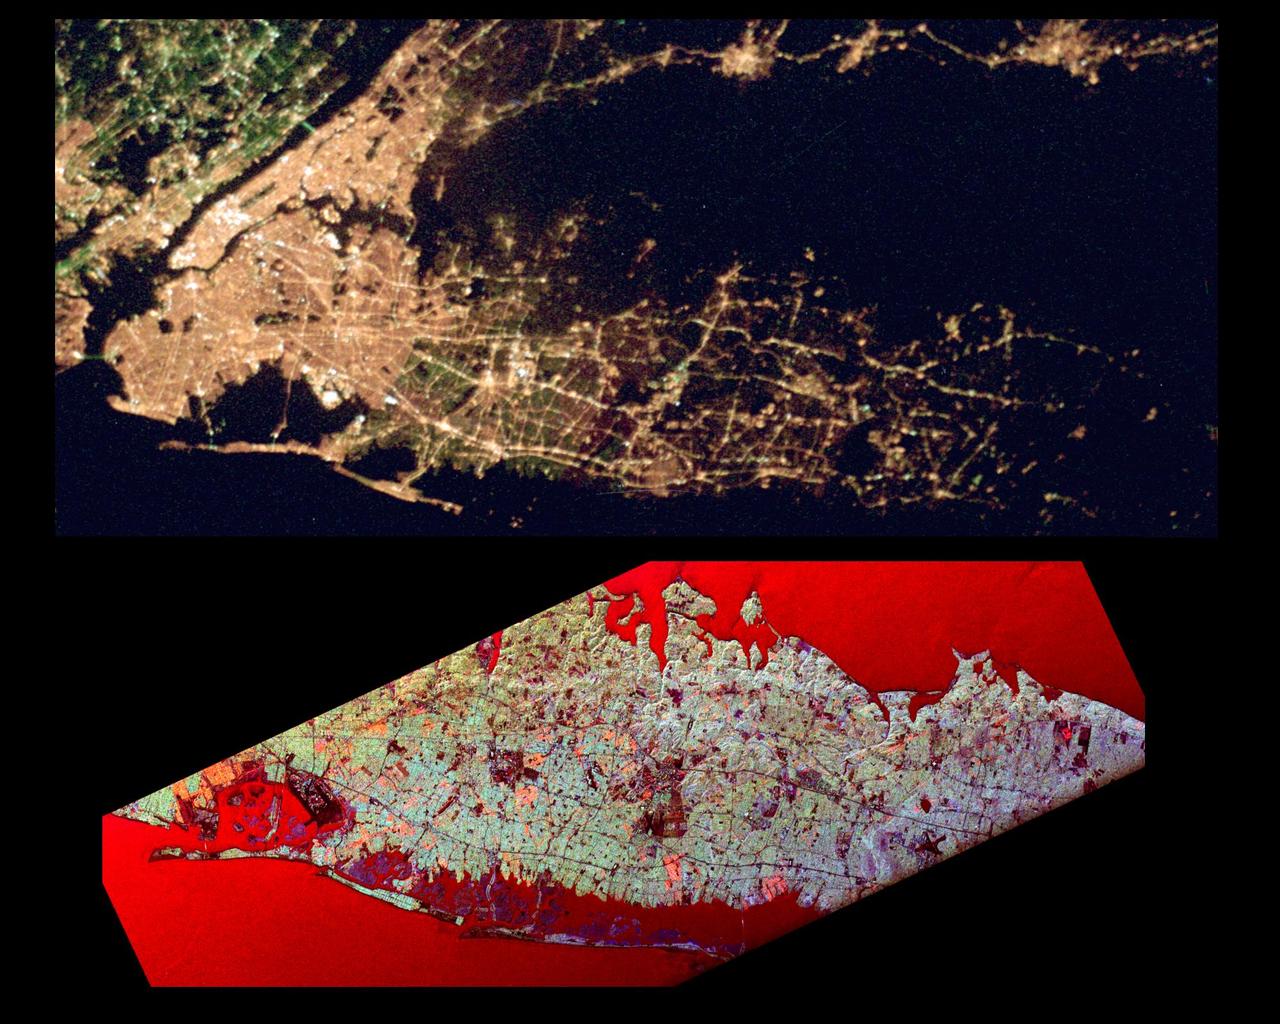
This pair of images of the Long Island, New York region is a comparison of an optical photograph (top) and a radar image (bottom), both taken in darkness in April 1994. The photograph at the top was taken by the Endeavour astronauts at about 3 a.m. Eastern time on April 20, 1994. The image at the bottom was acquired at about the same time four days earlier on April 16,1994 by the Spaceborne Imaging Radar-C/X-Band Synthetic Aperture Radar (SIR-C/X-SAR) system aboard the space shuttle Endeavour. Both images show an area approximately 100 kilometers by 40 kilometers (62 miles by 25 miles) that is centered at 40.7 degrees North latitude and 73.5 degrees West longitude. North is toward the upper right. The optical image is dominated by city lights, which are particularly bright in the densely developed urban areas of New York City located on the left half of the photo. The brightest white zones appear on the island of Manhattan in the left center, and Central Park can be seen as a darker area in the middle of Manhattan. To the northeast (right) of the city, suburban Long Island appears as a less densely illuminated area, with the brightest zones occurring along major transportation and development corridors. Since radar is an active sensing system that provides its own illumination, the radar image shows a great amount of surface detail, despite the night-time acquisition. The colors in the radar image were obtained using the following radar channels: red represents the L-band (horizontally transmitted and received); green represents the L-band (horizontally transmitted and vertically received); blue represents the C-band (horizontally transmitted and vertically received). In this image, the water surface - the Atlantic Ocean along the bottom edge and Long Island Sound shown at the top edge - appears red because small waves at the surface strongly reflect the horizontally transmitted and received L-band radar signal. Networks of highways and railroad lines are clearly visible in the radar image; many of them can also be seen as bright lines i the optical image. The runways of John F. Kennedy International Airport appear as a dark rectangle in Jamaica Bay on the left side of the image. Developed areas appear generally as bright green and orange, while agricultural, protected and undeveloped areas appear darker blue or purple. This contrast can be seen on the barrier islands along the south coast of Long Island, which are heavily developed in the Rockaway and Long Beach areas south and east of Jamaica Bay, but further to the east, the islands are protected and undeveloped. http://photojournal.jpl.nasa.gov/catalog/PIA01785
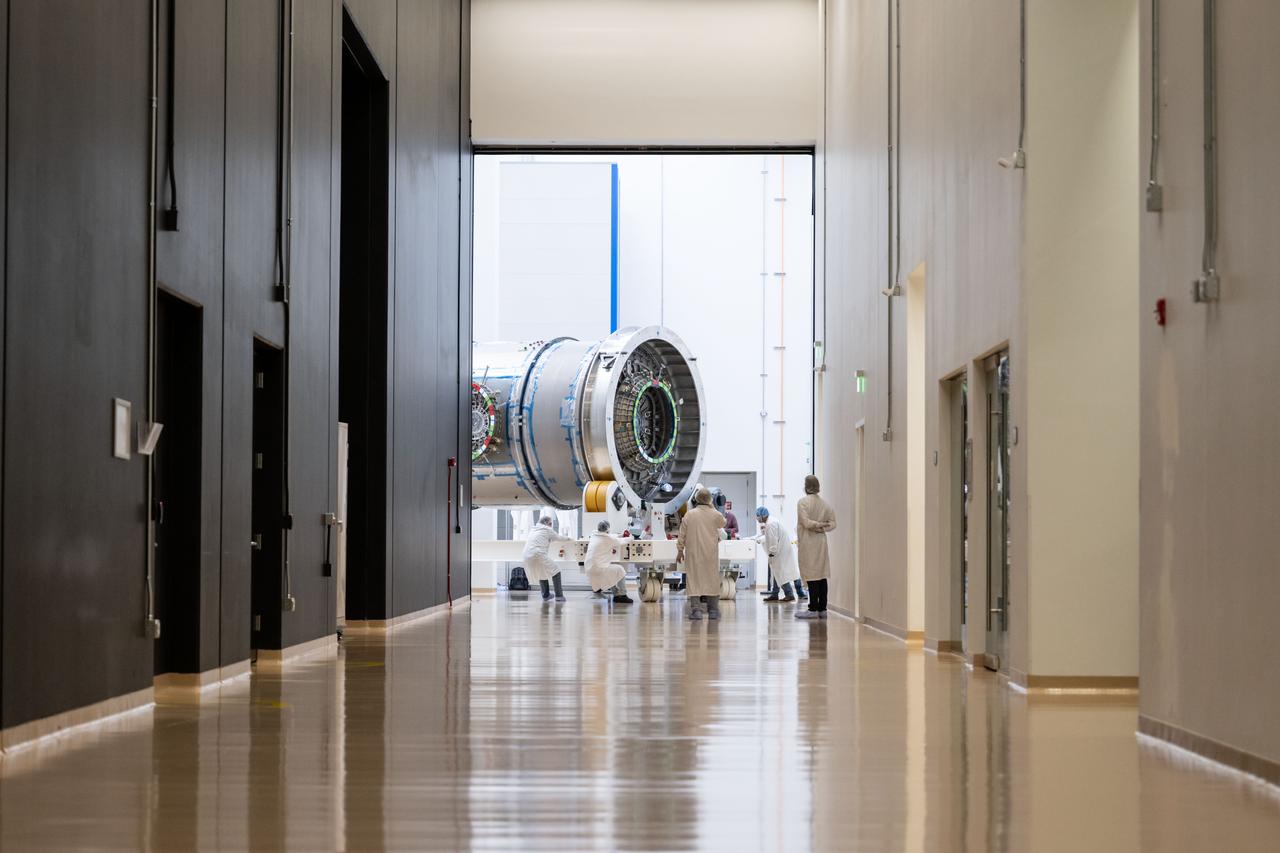
At Northrop Grumman’s Gilbert, Arizona, facility, teams transport Gateway’s HALO (Habitation and Logistics Outpost). HALO arrived from Turin, Italy, where Thales Alenia Space fabricated its primary structure. The module will undergo final outfitting in Gilbert before being integrated with the Power and Propulsion Element and launched to lunar orbit.
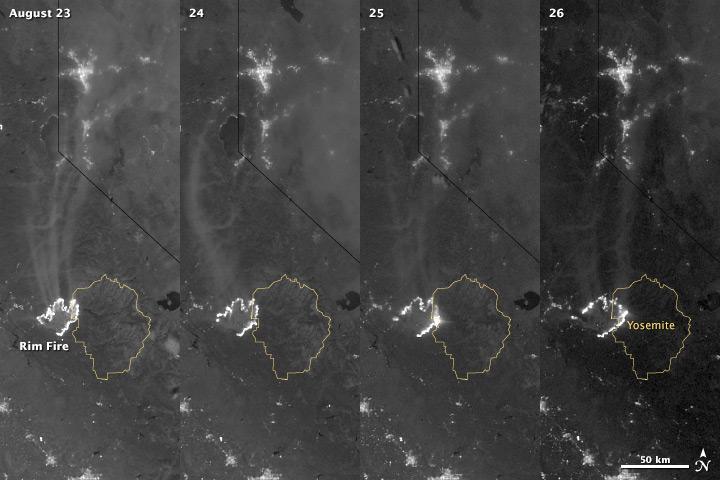
The winter of 2013 was among the driest on record for California, setting the stage for an active fire season. By August 26, the Rim Fire had made its way into the record books. At just 15 percent contained, the fire is now the 13th largest in California since records began in 1932. Apart from being large, the fire is also threatening one of the United States’ greatest natural treasures: Yosemite National Park. The Visible Infrared Imaging Radiometer Suite (VIIRS) on the Suomi NPP satellite tracked the growth of the fire between August 23 and August 26 in this series of nighttime images. The VIIRS day-night band is extremely sensitive to low light, making it possible to see the fire front from space. The brightest, most intense parts of the fire glow white, exceeding the brightness of the lights of Reno, Nevada to the north. Pale gray smoke streams north away from the fire throughout the sequence. The perimeter of the fire grows from day to day along different fronts, depending on winds and fire fighting efforts. On August 24, fire fighters focused their efforts on containing the western edge of the fire to prevent it from burning into Tuolumne City and the populated Highway 108 corridor. They also fought the eastern edge of the fire to protect Yosemite National Park. These efforts are evident in the image: Between August 23 and 24, the eastern edge of the fire held steady, and the western edge receded. The fire grew in the southeast. On the morning of August 25 fire managers reported that the fire was growing in the north and east. In the image, the most intense activity is just inside Yosemite National Park. Fire fighters reported that the Rim Fire continued to be extremely active on its eastern front on the morning of August 26, and this activity is visible in the image. By 8:00 a.m., the fire had burned 149,780 acres. The fire forced firefighters in Yosemite National Park to take measures to protect the Merced and Tuolumne Groves of Giant Sequoias, but the National Park Service reported that the trees were not in imminent danger. While parts of the park are closed, webcams show that most of the park has not been impacted. The Rim Fire started on the afternoon of August 17. It has destroyed 23 structures and threatened 4,500 other buildings. Its cause is under investigation. More details: <a href="http://1.usa.gov/18ilEAA" rel="nofollow">1.usa.gov/18ilEAA</a> NASA Earth Observatory image by Jesse Allen and Robert Simmon, using VIIRS Day Night Band data. Caption by Holli Riebeek. Instrument: Suomi NPP - VIIRS <b><a href="http://www.nasa.gov/audience/formedia/features/MP_Photo_Guidelines.html" rel="nofollow">NASA image use policy.</a></b> <b><a href="http://www.nasa.gov/centers/goddard/home/index.html" rel="nofollow">NASA Goddard Space Flight Center</a></b> enables NASA’s mission through four scientific endeavors: Earth Science, Heliophysics, Solar System Exploration, and Astrophysics. Goddard plays a leading role in NASA’s accomplishments by contributing compelling scientific knowledge to advance the Agency’s mission. <b>Follow us on <a href="http://twitter.com/NASA_GoddardPix" rel="nofollow">Twitter</a></b> <b>Like us on <a href="http://www.facebook.com/pages/Greenbelt-MD/NASA-Goddard/395013845897?ref=tsd" rel="nofollow">Facebook</a></b> <b>Find us on <a href="http://instagram.com/nasagoddard?vm=grid" rel="nofollow">Instagram</a></b>
On Jan. 20 at 2:30 p.m. EST the VIIRS instrument aboard NASA-NOAA's Suomi NPP captured this image of the winter storm moving through the central U.S. Credits: NASA Goddard Rapid Response The low pressure area from the Eastern Pacific Ocean moved into the western U.S. and tracked across the four corners region into Texas where NASA-NOAA's Suomi NPP satellite observed the clouds associated with the storm. The Visible Infrared Imaging Radiometer Suite (VIIRS) instrument aboard Suomi NPP satellite captured the visible image on January 20, 2016 at 19:30 UTC (2:30 p.m. EST) when the storm was over the central U.S. In the image, snow cover is visible in the Rockies and southern Great Lakes states. VIIRS collects visible and infrared imagery and global observations of land, atmosphere, cryosphere and oceans. That low pressure system located over the south central United States on Jan. 21 is expected to track east across the Tennessee Valley and will give way to a deepening coastal low pressure area. The National Weather Service said "This latter feature takes over and becomes a dominant force in setting up heavy snow bands over the Mid-Atlantic and very gusty winds." The storm system is expected to bring an increased risk of severe weather from far southeastern Texas across southern Louisiana/Mississippi, and into the far western Florida Panhandle on Thursday, Jan. 21. That threat for severe weather will move east as the low pressure area continues heading in that direction. The National Weather Service Weather Prediction Center in College Park, Maryland said "A potentially crippling winter storm is anticipated for portions of the mid-Atlantic Friday into early Saturday. Snowfall may approach two feet for some locations, including the Baltimore and Washington, D.C. metro areas. Farther north, there is uncertainty in snowfall for the New York City-to-Boston corridor. Farther south, significant icing is likely for portions of Kentucky and North Carolina." <b><a href="http://www.nasa.gov/audience/formedia/features/MP_Photo_Guidelines.html" rel="nofollow">NASA image use policy.</a></b> <b><a href="http://www.nasa.gov/centers/goddard/home/index.html" rel="nofollow">NASA Goddard Space Flight Center</a></b> enables NASA’s mission through four scientific endeavors: Earth Science, Heliophysics, Solar System Exploration, and Astrophysics. Goddard plays a leading role in NASA’s accomplishments by contributing compelling scientific knowledge to advance the Agency’s mission. <b>Follow us on <a href="http://twitter.com/NASAGoddardPix" rel="nofollow">Twitter</a></b> <b>Like us on <a href="http://www.facebook.com/pages/Greenbelt-MD/NASA-Goddard/395013845897?ref=tsd" rel="nofollow">Facebook</a></b> <b>Find us on <a href="http://instagram.com/nasagoddard?vm=grid" rel="nofollow">Instagram</a></b>
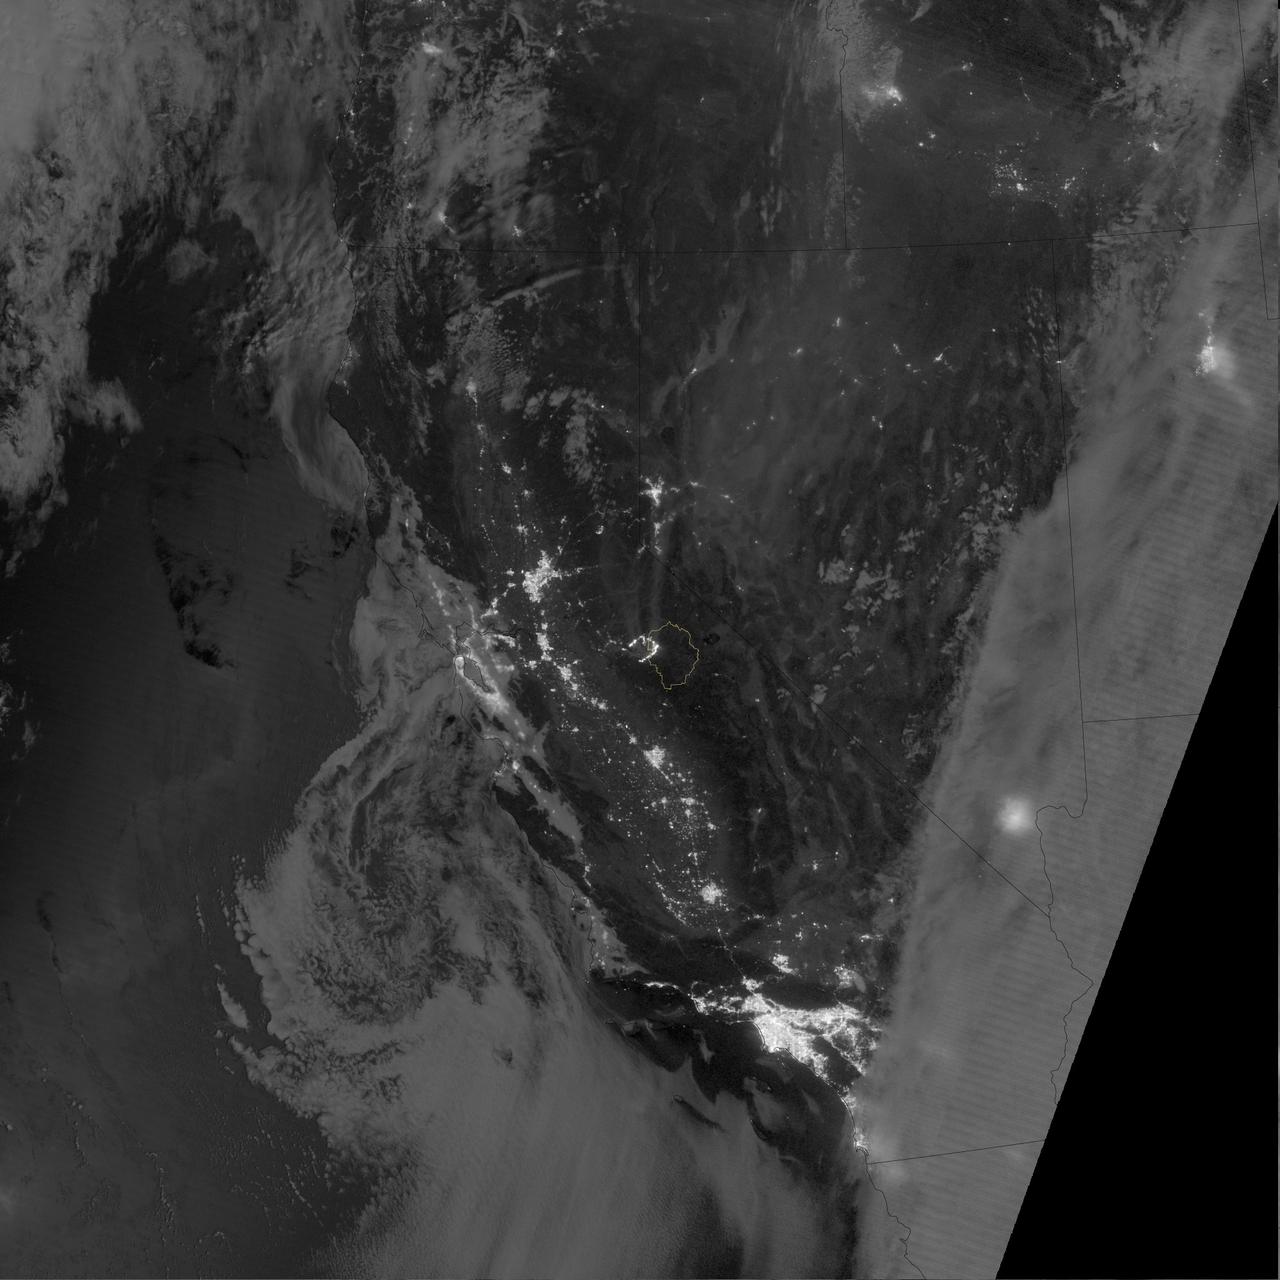
The winter of 2013 was among the driest on record for California, setting the stage for an active fire season. By August 26, the Rim Fire had made its way into the record books. At just 15 percent contained, the fire is now the 13th largest in California since records began in 1932. Apart from being large, the fire is also threatening one of the United States’ greatest natural treasures: Yosemite National Park. The Visible Infrared Imaging Radiometer Suite (VIIRS) on the Suomi NPP satellite tracked the growth of the fire between August 23 and August 26 in a series of nighttime images. The VIIRS day-night band is extremely sensitive to low light, making it possible to see the fire front from space. The brightest, most intense parts of the fire glow white, exceeding the brightness of the lights of Reno, Nevada to the north. Pale gray smoke streams north away from the fire throughout the sequence. The perimeter of the fire grows from day to day along different fronts, depending on winds and fire fighting efforts. On August 24, fire fighters focused their efforts on containing the western edge of the fire to prevent it from burning into Tuolumne City and the populated Highway 108 corridor. They also fought the eastern edge of the fire to protect Yosemite National Park. These efforts are evident in the image: Between August 23 and 24, the eastern edge of the fire held steady, and the western edge receded. The fire grew in the southeast. On the morning of August 25 fire managers reported that the fire was growing in the north and east. In the image, the most intense activity is just inside Yosemite National Park. Fire fighters reported that the Rim Fire continued to be extremely active on its eastern front on the morning of August 26, and this activity is visible in the image. By 8:00 a.m., the fire had burned 149,780 acres. The fire forced firefighters in Yosemite National Park to take measures to protect the Merced and Tuolumne Groves of Giant Sequoias, but the National Park Service reported that the trees were not in imminent danger. While parts of the park are closed, webcams show that most of the park has not been impacted. The Rim Fire started on the afternoon of August 17. It has destroyed 23 structures and threatened 4,500 other buildings. Its cause is under investigation. More details: <a href="http://1.usa.gov/18ilEAA" rel="nofollow">1.usa.gov/18ilEAA</a> NASA Earth Observatory image by Jesse Allen and Robert Simmon, using VIIRS Day Night Band data. Caption by Holli Riebeek. Instrument: Suomi NPP - VIIRS <b><a href="http://www.nasa.gov/audience/formedia/features/MP_Photo_Guidelines.html" rel="nofollow">NASA image use policy.</a></b> <b><a href="http://www.nasa.gov/centers/goddard/home/index.html" rel="nofollow">NASA Goddard Space Flight Center</a></b> enables NASA’s mission through four scientific endeavors: Earth Science, Heliophysics, Solar System Exploration, and Astrophysics. Goddard plays a leading role in NASA’s accomplishments by contributing compelling scientific knowledge to advance the Agency’s mission. <b>Follow us on <a href="http://twitter.com/NASA_GoddardPix" rel="nofollow">Twitter</a></b> <b>Like us on <a href="http://www.facebook.com/pages/Greenbelt-MD/NASA-Goddard/395013845897?ref=tsd" rel="nofollow">Facebook</a></b> <b>Find us on <a href="http://instagram.com/nasagoddard?vm=grid" rel="nofollow">Instagram</a></b>
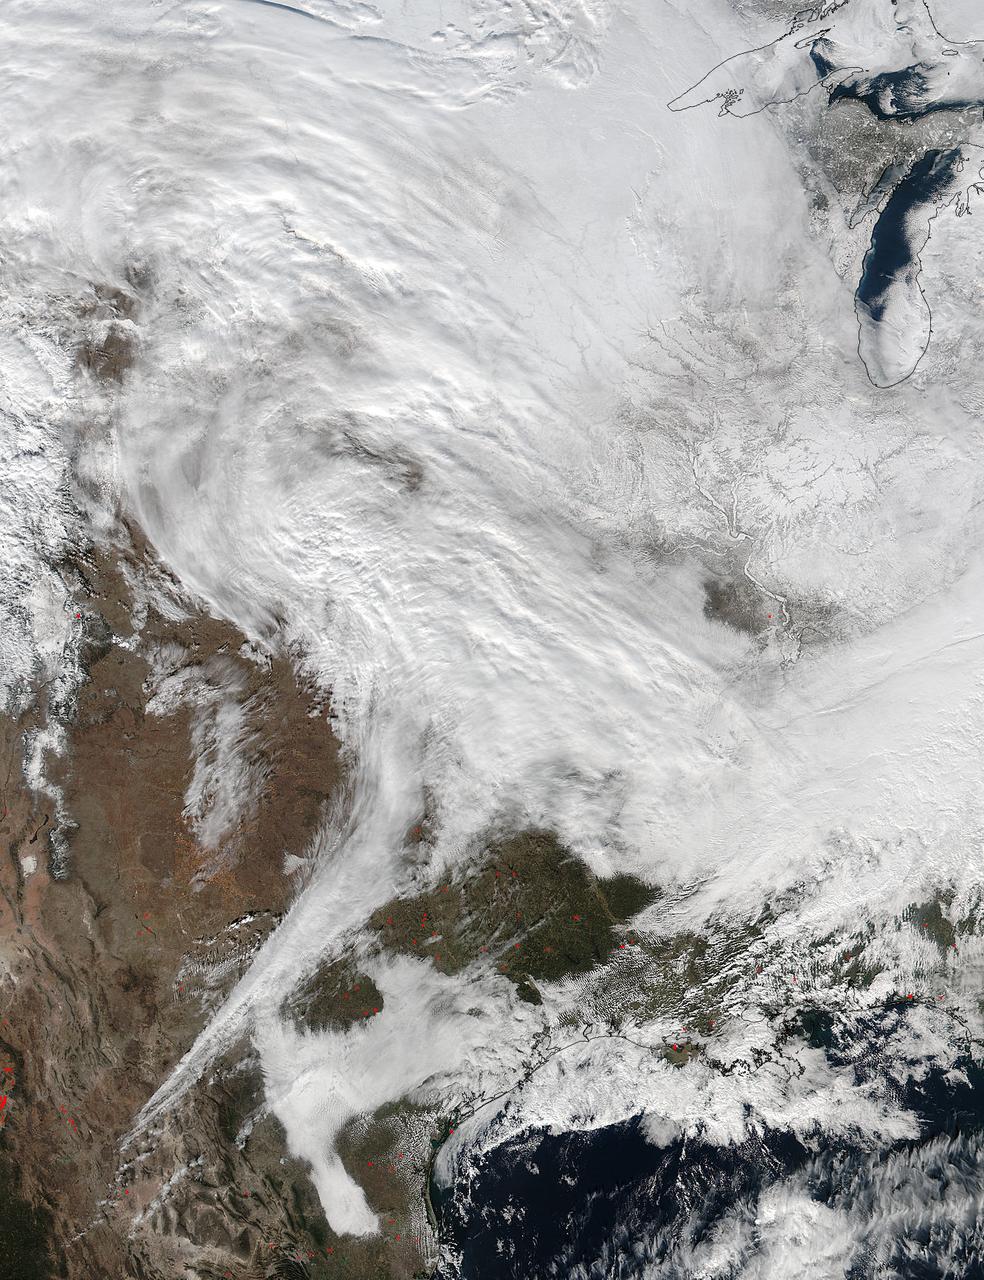
![The monster winter storm that brought icing to the U.S. southeast moved northward along the Eastern Seaboard and brought snow, sleet and rain from the Mid-Atlantic to New England on February 13. A new image from NOAA's GOES satellite showed clouds associated with the massive winter storm stretch from the U.S. southeast to the northeast. Data from NOAA's GOES-East satellite taken on Feb. 13 at 1455 UTC/9:45 a.m. EST were made into an image by NASA/NOAA's GOES Project at NASA's Goddard Space Flight Center in Greenbelt, Md. The clouds and fallen snow data from NOAA's GOES-East satellite were overlaid on a true-color image of land and ocean created by data from the Moderate Resolution Imaging Spectroradiometer or MODIS instrument that flies aboard NASA's Aqua and Terra satellites.The image showed that the clouds associated with the storm were blanketing much of the U.S. East Coast. At 3:11 a.m. EST, a surface map issued by the National Weather Service or NWS showed the storm's low pressure area was centered over eastern North Carolina. Since then, the low has continued to track north along the eastern seaboard. By 11 a.m. EST, precipitation from the storm was falling from South Carolina to Maine, according to National Weather Service radar. By 11 a.m. EST, the Washington, D.C. region snow and sleet totals ranged from 3" in far eastern Maryland to over 18" in the northern and western suburbs in Maryland and Virginia. NWS reported that snow, sleet and rain were still falling and more snow is expected as the back side of the low moves into the region. The New York City region remained under an NWS Winter Storm Warning until 6 a.m. on Friday, February 14 and the National Weather Service expects minor coastal impacts Thursday into Friday afternoon. New England was also being battered by the storm. At 10:56 a.m. EST, Barnstable, Mass. on Cape Cod was experiencing rain and winds gusting to 28 mph. An NWS wind advisory is in effect for Cape Cod until 7 p.m. EST. Further north, Portland, Maine was experiencing heavy snow with winds from the northeast at 6 mph. The National Weather Service in Gray, Maine noted "Significant snowfall is likely for much of western Maine and New Hampshire as this storm passes by. There will be a mix or changeover to sleet and freezing rain over southern and coastal sections tonight...before all areas end as a period of snow Friday (Feb. 14) morning." On February 13 at 10 a.m. EST, NOAA's National Weather Service noted "An abundance of Atlantic moisture getting wrapped into the storm will continue to fuel widespread precipitation...which should lift through the Mid-Atlantic States and Northeast Thursday into Friday. A wide swath of heavy snow accumulations are expected with this storm...but air [moving] off the warmer ocean water should change snow over to rain along the coastal areas. Also...a narrow axis of sleet and freezing rain will be possible within the transition zone...which is expected to set up near the I-95 corridor." For updates on local forecasts, watches and warnings, visit NOAA's <a href="http://www.weather.gov" rel="nofollow">www.weather.gov</a> webpage. GOES satellites provide the kind of continuous monitoring necessary for intensive data analysis. Geostationary describes an orbit in which a satellite is always in the same position with respect to the rotating Earth. This allows GOES to hover continuously over one position on Earth's surface, appearing stationary. As a result, GOES provide a constant vigil for the atmospheric "triggers" for severe weather conditions such as tornadoes, flash floods, hail storms and hurricanes. For updated information about the storm system, visit NOAA's WPC website: <a href="http://www.hpc.ncep.noaa.gov/" rel="nofollow">www.hpc.ncep.noaa.gov/</a> For more information about GOES satellites, visit: <a href="http://www.goes.noaa.gov/" rel="nofollow">www.goes.noaa.gov/</a> or <a href="http://goes.gsfc.nasa.gov/" rel="nofollow">goes.gsfc.nasa.gov/</a> Credit: NASA/GSFC/Jeff Schmaltz/MODIS Land Rapid Response Team <b><a href="http://www.nasa.gov/audience/formedia/features/MP_Photo_Guidelines.html" rel="nofollow">NASA image use policy.</a></b> <b><a href="http://www.nasa.gov/centers/goddard/home/index.html" rel="nofollow">NASA Goddard Space Flight Center</a></b> enables NASA’s mission through four scientific endeavors: Earth Science, Heliophysics, Solar System Exploration, and Astrophysics. Goddard plays a leading role in NASA’s accomplishments by contributing compelling scientific knowledge to advance the Agency’s mission. <b>Follow us on <a href="http://twitter.com/NASAGoddardPix" rel="nofollow">Twitter</a></b> <b>Like us on <a href="http://www.facebook.com/pages/Greenbelt-MD/NASA-Goddard/395013845897?ref=tsd" rel="nofollow">Facebook</a></b> <b>Find us on <a href="http://instagram.com/nasagoddard?vm=grid" rel="nofollow">Instagram</a></b>](https://images-assets.nasa.gov/image/GSFC_20171208_Archive_e001229/GSFC_20171208_Archive_e001229~medium.jpg)
The monster winter storm that brought icing to the U.S. southeast moved northward along the Eastern Seaboard and brought snow, sleet and rain from the Mid-Atlantic to New England on February 13. A new image from NOAA's GOES satellite showed clouds associated with the massive winter storm stretch from the U.S. southeast to the northeast. Data from NOAA's GOES-East satellite taken on Feb. 13 at 1455 UTC/9:45 a.m. EST were made into an image by NASA/NOAA's GOES Project at NASA's Goddard Space Flight Center in Greenbelt, Md. The clouds and fallen snow data from NOAA's GOES-East satellite were overlaid on a true-color image of land and ocean created by data from the Moderate Resolution Imaging Spectroradiometer or MODIS instrument that flies aboard NASA's Aqua and Terra satellites.The image showed that the clouds associated with the storm were blanketing much of the U.S. East Coast. At 3:11 a.m. EST, a surface map issued by the National Weather Service or NWS showed the storm's low pressure area was centered over eastern North Carolina. Since then, the low has continued to track north along the eastern seaboard. By 11 a.m. EST, precipitation from the storm was falling from South Carolina to Maine, according to National Weather Service radar. By 11 a.m. EST, the Washington, D.C. region snow and sleet totals ranged from 3" in far eastern Maryland to over 18" in the northern and western suburbs in Maryland and Virginia. NWS reported that snow, sleet and rain were still falling and more snow is expected as the back side of the low moves into the region. The New York City region remained under an NWS Winter Storm Warning until 6 a.m. on Friday, February 14 and the National Weather Service expects minor coastal impacts Thursday into Friday afternoon. New England was also being battered by the storm. At 10:56 a.m. EST, Barnstable, Mass. on Cape Cod was experiencing rain and winds gusting to 28 mph. An NWS wind advisory is in effect for Cape Cod until 7 p.m. EST. Further north, Portland, Maine was experiencing heavy snow with winds from the northeast at 6 mph. The National Weather Service in Gray, Maine noted "Significant snowfall is likely for much of western Maine and New Hampshire as this storm passes by. There will be a mix or changeover to sleet and freezing rain over southern and coastal sections tonight...before all areas end as a period of snow Friday (Feb. 14) morning." On February 13 at 10 a.m. EST, NOAA's National Weather Service noted "An abundance of Atlantic moisture getting wrapped into the storm will continue to fuel widespread precipitation...which should lift through the Mid-Atlantic States and Northeast Thursday into Friday. A wide swath of heavy snow accumulations are expected with this storm...but air [moving] off the warmer ocean water should change snow over to rain along the coastal areas. Also...a narrow axis of sleet and freezing rain will be possible within the transition zone...which is expected to set up near the I-95 corridor." For updates on local forecasts, watches and warnings, visit NOAA's <a href="http://www.weather.gov" rel="nofollow">www.weather.gov</a> webpage. GOES satellites provide the kind of continuous monitoring necessary for intensive data analysis. Geostationary describes an orbit in which a satellite is always in the same position with respect to the rotating Earth. This allows GOES to hover continuously over one position on Earth's surface, appearing stationary. As a result, GOES provide a constant vigil for the atmospheric "triggers" for severe weather conditions such as tornadoes, flash floods, hail storms and hurricanes. For updated information about the storm system, visit NOAA's WPC website: <a href="http://www.hpc.ncep.noaa.gov/" rel="nofollow">www.hpc.ncep.noaa.gov/</a> For more information about GOES satellites, visit: <a href="http://www.goes.noaa.gov/" rel="nofollow">www.goes.noaa.gov/</a> or <a href="http://goes.gsfc.nasa.gov/" rel="nofollow">goes.gsfc.nasa.gov/</a> Credit: NASA/GSFC/Jeff Schmaltz/MODIS Land Rapid Response Team <b><a href="http://www.nasa.gov/audience/formedia/features/MP_Photo_Guidelines.html" rel="nofollow">NASA image use policy.</a></b> <b><a href="http://www.nasa.gov/centers/goddard/home/index.html" rel="nofollow">NASA Goddard Space Flight Center</a></b> enables NASA’s mission through four scientific endeavors: Earth Science, Heliophysics, Solar System Exploration, and Astrophysics. Goddard plays a leading role in NASA’s accomplishments by contributing compelling scientific knowledge to advance the Agency’s mission. <b>Follow us on <a href="http://twitter.com/NASAGoddardPix" rel="nofollow">Twitter</a></b> <b>Like us on <a href="http://www.facebook.com/pages/Greenbelt-MD/NASA-Goddard/395013845897?ref=tsd" rel="nofollow">Facebook</a></b> <b>Find us on <a href="http://instagram.com/nasagoddard?vm=grid" rel="nofollow">Instagram</a></b>
![The monster winter storm that brought icing to the U.S. southeast moved northward along the Eastern Seaboard and brought snow, sleet and rain from the Mid-Atlantic to New England on February 13. A new image from NOAA's GOES satellite showed clouds associated with the massive winter storm stretch from the U.S. southeast to the northeast. Data from NOAA's GOES-East satellite taken on Feb. 13 at 1455 UTC/9:45 a.m. EST were made into an image by NASA/NOAA's GOES Project at NASA's Goddard Space Flight Center in Greenbelt, Md. The clouds and fallen snow data from NOAA's GOES-East satellite were overlaid on a true-color image of land and ocean created by data from the Moderate Resolution Imaging Spectroradiometer or MODIS instrument that flies aboard NASA's Aqua and Terra satellites.The image showed that the clouds associated with the storm were blanketing much of the U.S. East Coast. At 3:11 a.m. EST, a surface map issued by the National Weather Service or NWS showed the storm's low pressure area was centered over eastern North Carolina. Since then, the low has continued to track north along the eastern seaboard. By 11 a.m. EST, precipitation from the storm was falling from South Carolina to Maine, according to National Weather Service radar. By 11 a.m. EST, the Washington, D.C. region snow and sleet totals ranged from 3" in far eastern Maryland to over 18" in the northern and western suburbs in Maryland and Virginia. NWS reported that snow, sleet and rain were still falling and more snow is expected as the back side of the low moves into the region. The New York City region remained under an NWS Winter Storm Warning until 6 a.m. on Friday, February 14 and the National Weather Service expects minor coastal impacts Thursday into Friday afternoon. New England was also being battered by the storm. At 10:56 a.m. EST, Barnstable, Mass. on Cape Cod was experiencing rain and winds gusting to 28 mph. An NWS wind advisory is in effect for Cape Cod until 7 p.m. EST. Further north, Portland, Maine was experiencing heavy snow with winds from the northeast at 6 mph. The National Weather Service in Gray, Maine noted "Significant snowfall is likely for much of western Maine and New Hampshire as this storm passes by. There will be a mix or changeover to sleet and freezing rain over southern and coastal sections tonight...before all areas end as a period of snow Friday (Feb. 14) morning." On February 13 at 10 a.m. EST, NOAA's National Weather Service noted "An abundance of Atlantic moisture getting wrapped into the storm will continue to fuel widespread precipitation...which should lift through the Mid-Atlantic States and Northeast Thursday into Friday. A wide swath of heavy snow accumulations are expected with this storm...but air [moving] off the warmer ocean water should change snow over to rain along the coastal areas. Also...a narrow axis of sleet and freezing rain will be possible within the transition zone...which is expected to set up near the I-95 corridor." For updates on local forecasts, watches and warnings, visit NOAA's <a href="http://www.weather.gov" rel="nofollow">www.weather.gov</a> webpage. GOES satellites provide the kind of continuous monitoring necessary for intensive data analysis. Geostationary describes an orbit in which a satellite is always in the same position with respect to the rotating Earth. This allows GOES to hover continuously over one position on Earth's surface, appearing stationary. As a result, GOES provide a constant vigil for the atmospheric "triggers" for severe weather conditions such as tornadoes, flash floods, hail storms and hurricanes. For updated information about the storm system, visit NOAA's WPC website: <a href="http://www.hpc.ncep.noaa.gov/" rel="nofollow">www.hpc.ncep.noaa.gov/</a> For more information about GOES satellites, visit: <a href="http://www.goes.noaa.gov/" rel="nofollow">www.goes.noaa.gov/</a> or <a href="http://goes.gsfc.nasa.gov/" rel="nofollow">goes.gsfc.nasa.gov/</a> Credit: NASA/GSFC/Jeff Schmaltz/MODIS Land Rapid Response Team <b><a href="http://www.nasa.gov/audience/formedia/features/MP_Photo_Guidelines.html" rel="nofollow">NASA image use policy.</a></b> <b><a href="http://www.nasa.gov/centers/goddard/home/index.html" rel="nofollow">NASA Goddard Space Flight Center</a></b> enables NASA’s mission through four scientific endeavors: Earth Science, Heliophysics, Solar System Exploration, and Astrophysics. Goddard plays a leading role in NASA’s accomplishments by contributing compelling scientific knowledge to advance the Agency’s mission. <b>Follow us on <a href="http://twitter.com/NASAGoddardPix" rel="nofollow">Twitter</a></b> <b>Like us on <a href="http://www.facebook.com/pages/Greenbelt-MD/NASA-Goddard/395013845897?ref=tsd" rel="nofollow">Facebook</a></b> <b>Find us on <a href="http://instagram.com/nasagoddard?vm=grid" rel="nofollow">Instagram</a></b>](https://images-assets.nasa.gov/image/GSFC_20171208_Archive_e001228/GSFC_20171208_Archive_e001228~medium.jpg)
The monster winter storm that brought icing to the U.S. southeast moved northward along the Eastern Seaboard and brought snow, sleet and rain from the Mid-Atlantic to New England on February 13. A new image from NOAA's GOES satellite showed clouds associated with the massive winter storm stretch from the U.S. southeast to the northeast. Data from NOAA's GOES-East satellite taken on Feb. 13 at 1455 UTC/9:45 a.m. EST were made into an image by NASA/NOAA's GOES Project at NASA's Goddard Space Flight Center in Greenbelt, Md. The clouds and fallen snow data from NOAA's GOES-East satellite were overlaid on a true-color image of land and ocean created by data from the Moderate Resolution Imaging Spectroradiometer or MODIS instrument that flies aboard NASA's Aqua and Terra satellites.The image showed that the clouds associated with the storm were blanketing much of the U.S. East Coast. At 3:11 a.m. EST, a surface map issued by the National Weather Service or NWS showed the storm's low pressure area was centered over eastern North Carolina. Since then, the low has continued to track north along the eastern seaboard. By 11 a.m. EST, precipitation from the storm was falling from South Carolina to Maine, according to National Weather Service radar. By 11 a.m. EST, the Washington, D.C. region snow and sleet totals ranged from 3" in far eastern Maryland to over 18" in the northern and western suburbs in Maryland and Virginia. NWS reported that snow, sleet and rain were still falling and more snow is expected as the back side of the low moves into the region. The New York City region remained under an NWS Winter Storm Warning until 6 a.m. on Friday, February 14 and the National Weather Service expects minor coastal impacts Thursday into Friday afternoon. New England was also being battered by the storm. At 10:56 a.m. EST, Barnstable, Mass. on Cape Cod was experiencing rain and winds gusting to 28 mph. An NWS wind advisory is in effect for Cape Cod until 7 p.m. EST. Further north, Portland, Maine was experiencing heavy snow with winds from the northeast at 6 mph. The National Weather Service in Gray, Maine noted "Significant snowfall is likely for much of western Maine and New Hampshire as this storm passes by. There will be a mix or changeover to sleet and freezing rain over southern and coastal sections tonight...before all areas end as a period of snow Friday (Feb. 14) morning." On February 13 at 10 a.m. EST, NOAA's National Weather Service noted "An abundance of Atlantic moisture getting wrapped into the storm will continue to fuel widespread precipitation...which should lift through the Mid-Atlantic States and Northeast Thursday into Friday. A wide swath of heavy snow accumulations are expected with this storm...but air [moving] off the warmer ocean water should change snow over to rain along the coastal areas. Also...a narrow axis of sleet and freezing rain will be possible within the transition zone...which is expected to set up near the I-95 corridor." For updates on local forecasts, watches and warnings, visit NOAA's <a href="http://www.weather.gov" rel="nofollow">www.weather.gov</a> webpage. GOES satellites provide the kind of continuous monitoring necessary for intensive data analysis. Geostationary describes an orbit in which a satellite is always in the same position with respect to the rotating Earth. This allows GOES to hover continuously over one position on Earth's surface, appearing stationary. As a result, GOES provide a constant vigil for the atmospheric "triggers" for severe weather conditions such as tornadoes, flash floods, hail storms and hurricanes. For updated information about the storm system, visit NOAA's WPC website: <a href="http://www.hpc.ncep.noaa.gov/" rel="nofollow">www.hpc.ncep.noaa.gov/</a> For more information about GOES satellites, visit: <a href="http://www.goes.noaa.gov/" rel="nofollow">www.goes.noaa.gov/</a> or <a href="http://goes.gsfc.nasa.gov/" rel="nofollow">goes.gsfc.nasa.gov/</a> Credit: NASA/GSFC/Jeff Schmaltz/MODIS Land Rapid Response Team <b><a href="http://www.nasa.gov/audience/formedia/features/MP_Photo_Guidelines.html" rel="nofollow">NASA image use policy.</a></b> <b><a href="http://www.nasa.gov/centers/goddard/home/index.html" rel="nofollow">NASA Goddard Space Flight Center</a></b> enables NASA’s mission through four scientific endeavors: Earth Science, Heliophysics, Solar System Exploration, and Astrophysics. Goddard plays a leading role in NASA’s accomplishments by contributing compelling scientific knowledge to advance the Agency’s mission. <b>Follow us on <a href="http://twitter.com/NASAGoddardPix" rel="nofollow">Twitter</a></b> <b>Like us on <a href="http://www.facebook.com/pages/Greenbelt-MD/NASA-Goddard/395013845897?ref=tsd" rel="nofollow">Facebook</a></b> <b>Find us on <a href="http://instagram.com/nasagoddard?vm=grid" rel="nofollow">Instagram</a></b>