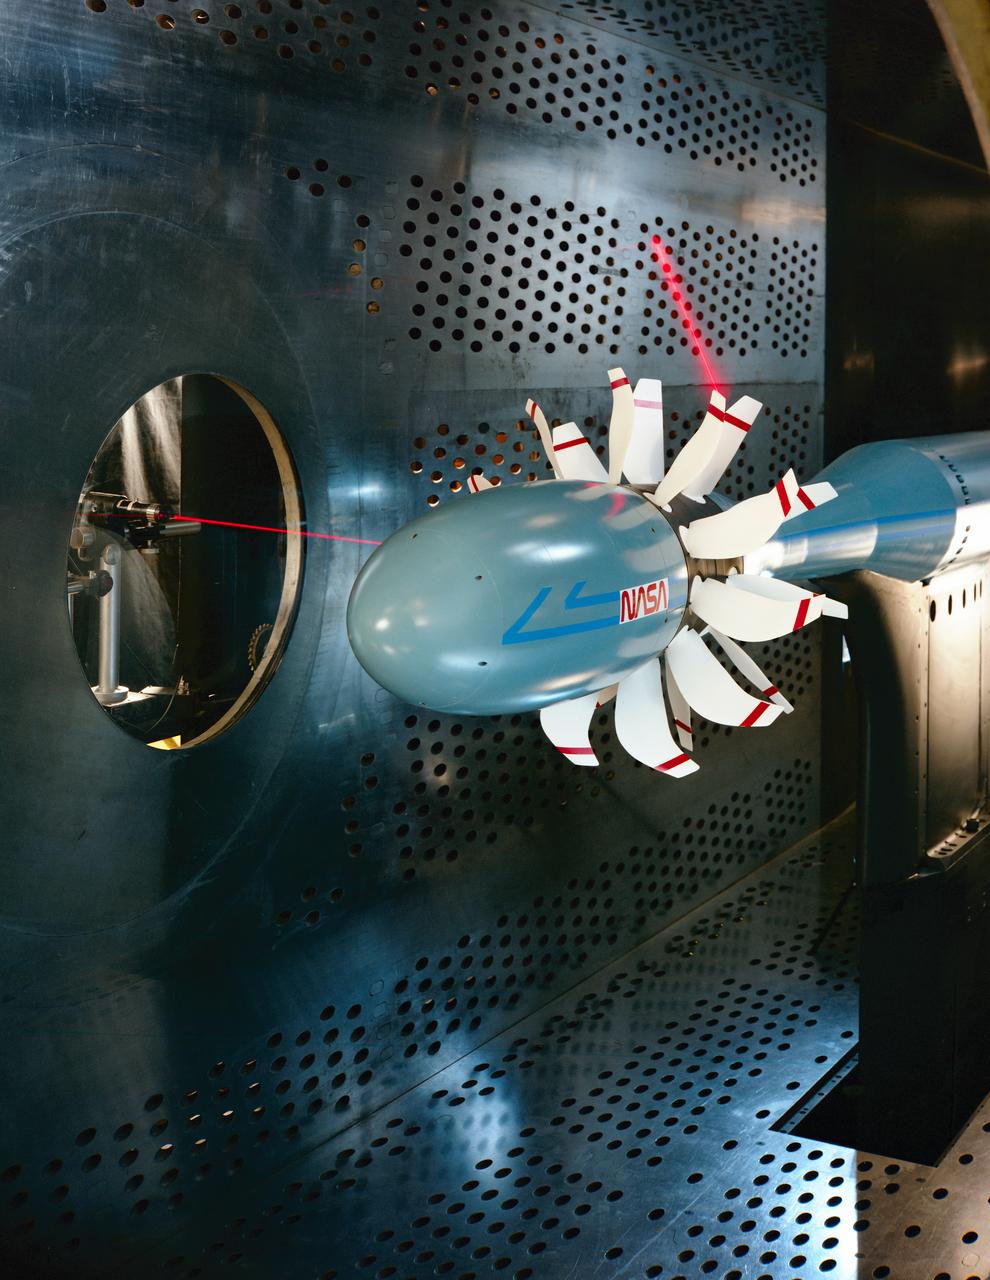
Counter Rotating Propeller Model in the NASA Glenn 8x6-Foot Supersonic Wind Tunnel
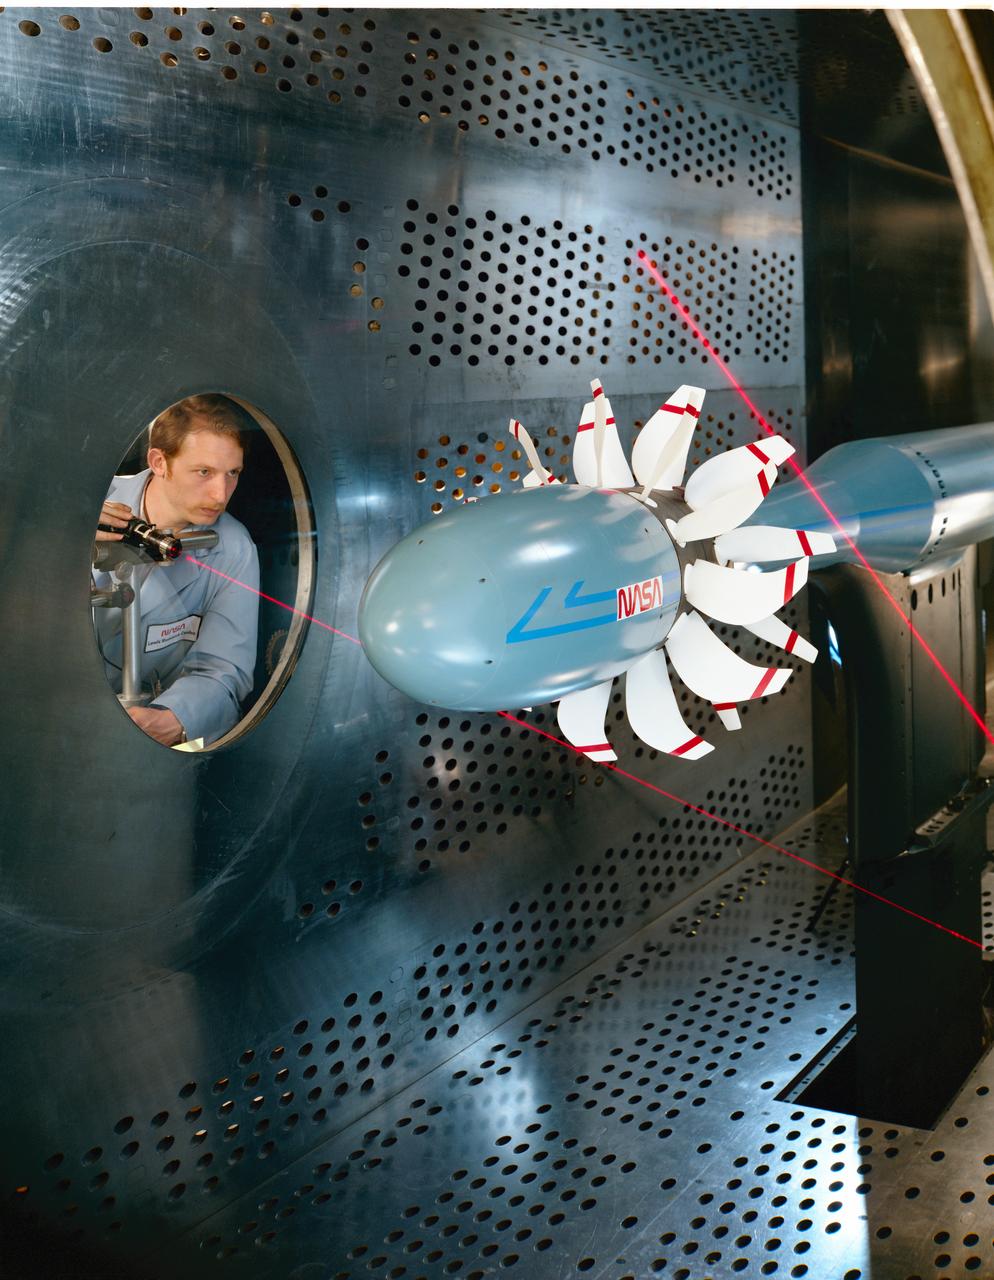
Laser based blade deflection measurement system on Counter Rotation Pusher Propeller model in 8x6 SWT (Supersonic Wind Tunnel)
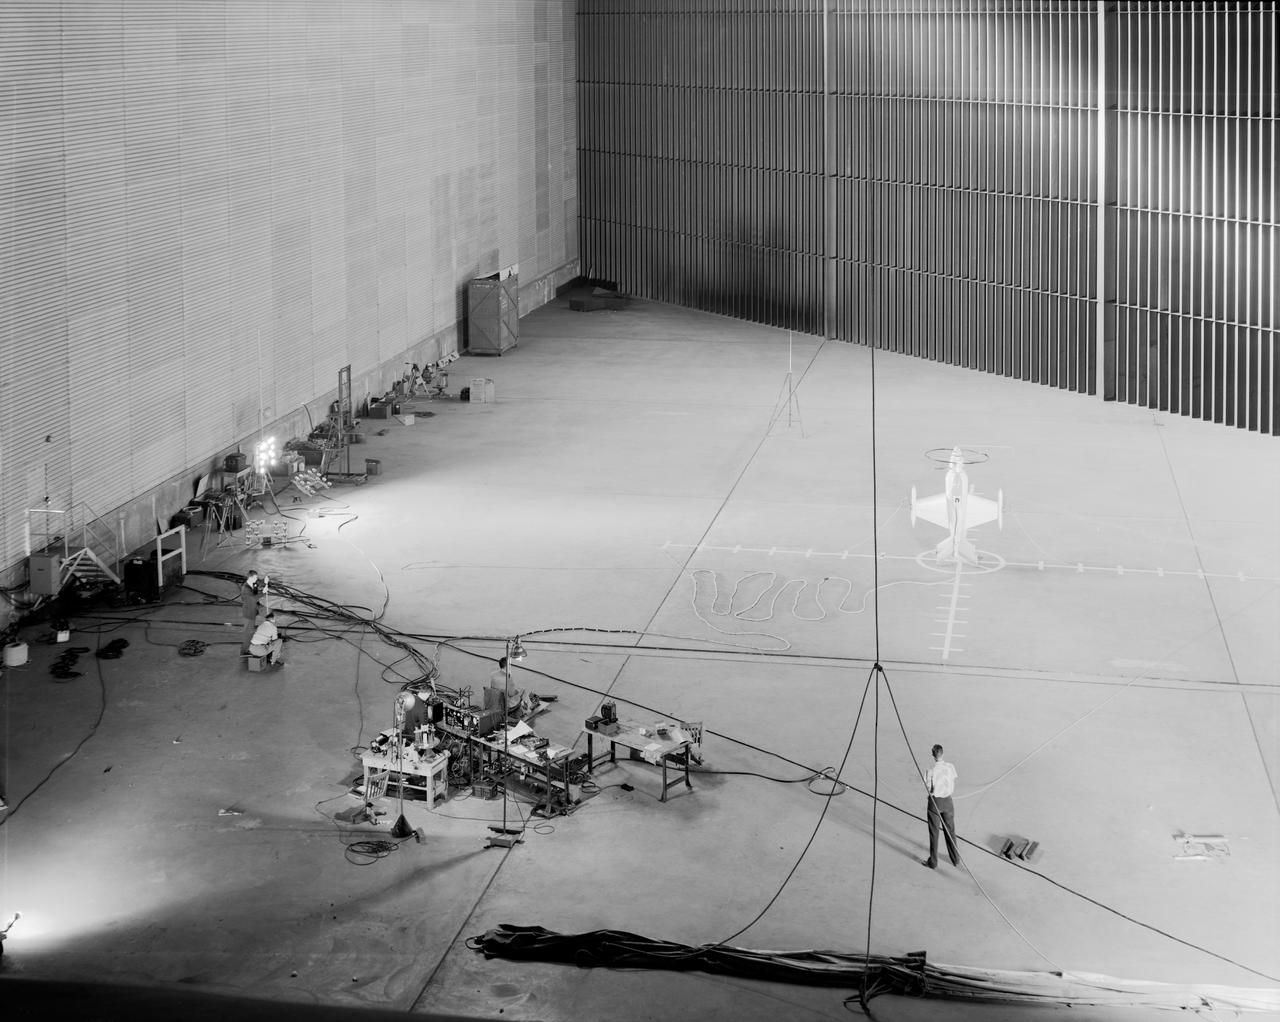
Wide shot of 40x 80 wind tunnel settling chamber with Lockheed XFV-1 model. Project engineer Mark Kelly (not shown). Remote controlled model flown in the settling chamber of the 40x80 wind tunnel. Electric motors in the model, controlled the counter-rotating propellers to test vertical takeoff. Test no. 71

Lockheed XFV-1 model. Project engineer Mark Kelly (not shown). Remote controlled model flown in the settling chamber of the 40x80 wind tunnel. Electric motors in the model, controlled the counter-rotating propellers to test vertical takeoff. Test no. 71
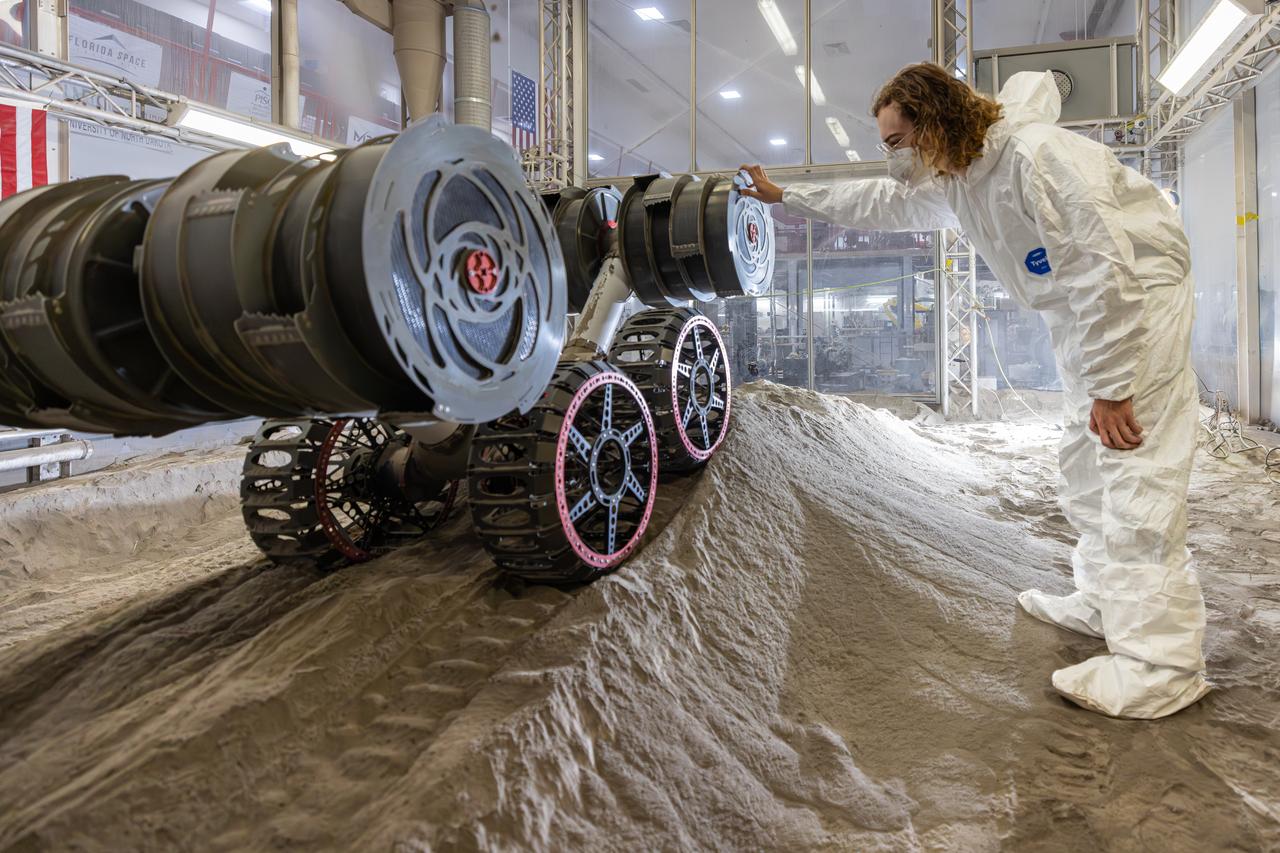
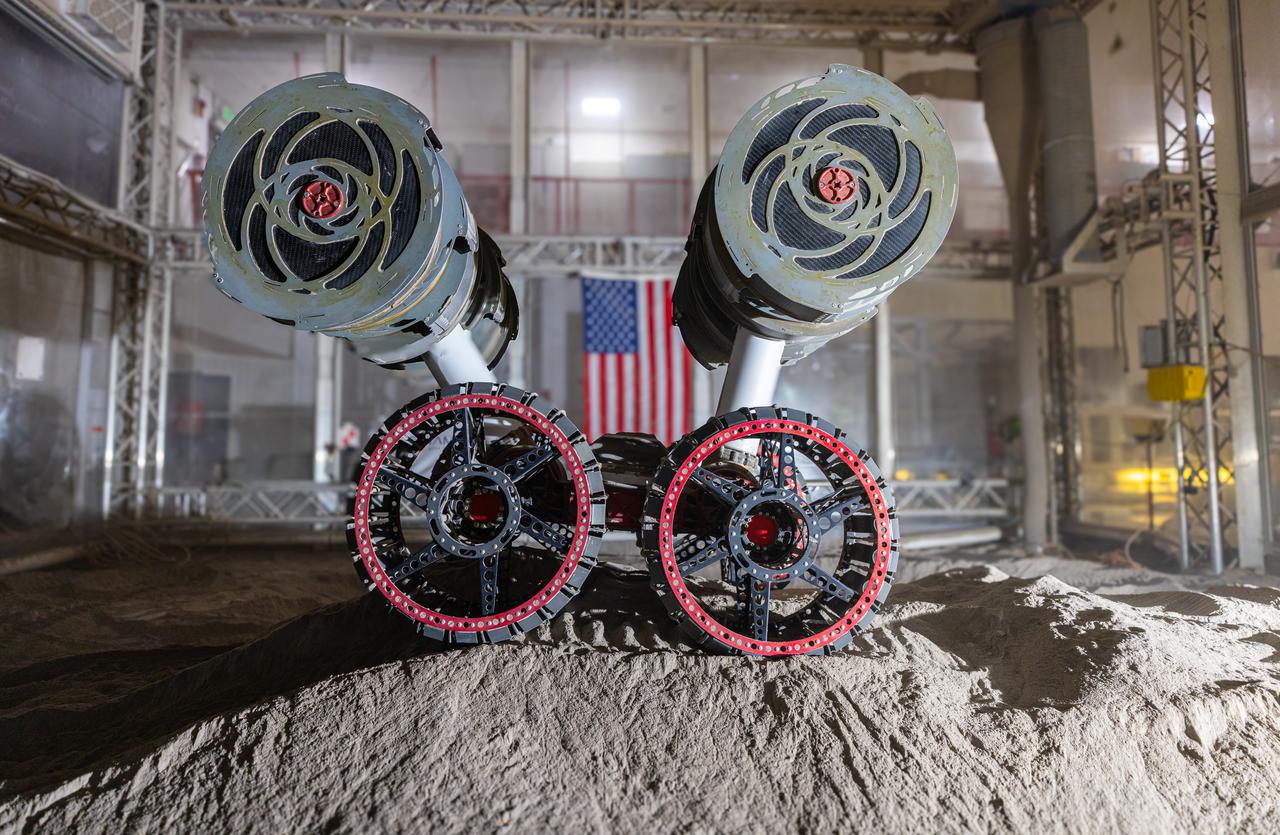
Ben Burdess, mechanical engineer, observes NASA’s RASSOR (Regolith Advanced Surface Systems Operations Robot) excavation testing of simulated regolith, or lunar dust found on the Moon’s surface, inside of the Granular Mechanics and Regolith Operations Lab at the agency’s Kennedy Space Center in Florida on Tuesday, May 27, 2025. RASSOR is designed to work in low-gravity situations, using counter rotating bucket drums on each arm to collect and dump regolith for the extraction of hydrogen, oxygen, or water, resources critical for sustaining a habitable presence.
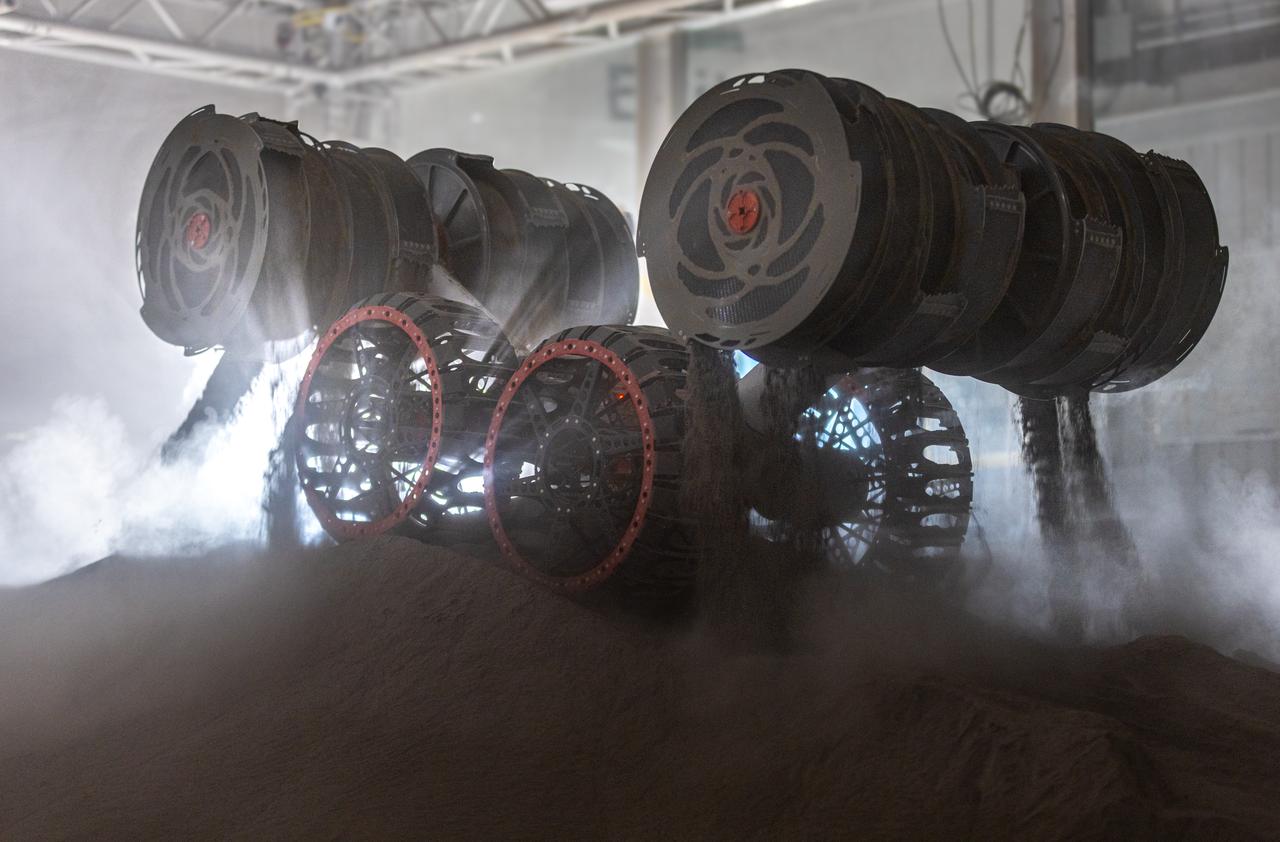
NASA’s RASSOR (Regolith Advanced Surface Systems Operations Robot) conducts excavation testing of simulated regolith, or lunar dust found on the Moon’s surface, inside of the Granular Mechanics and Regolith Operations Lab at the agency’s Kennedy Space Center in Florida on Tuesday, May 27, 2025. RASSOR is designed to work in low-gravity situations, using counter rotating bucket drums on each arm to collect and dump regolith for the extraction of hydrogen, oxygen, or water, resources critical for sustaining a habitable presence.
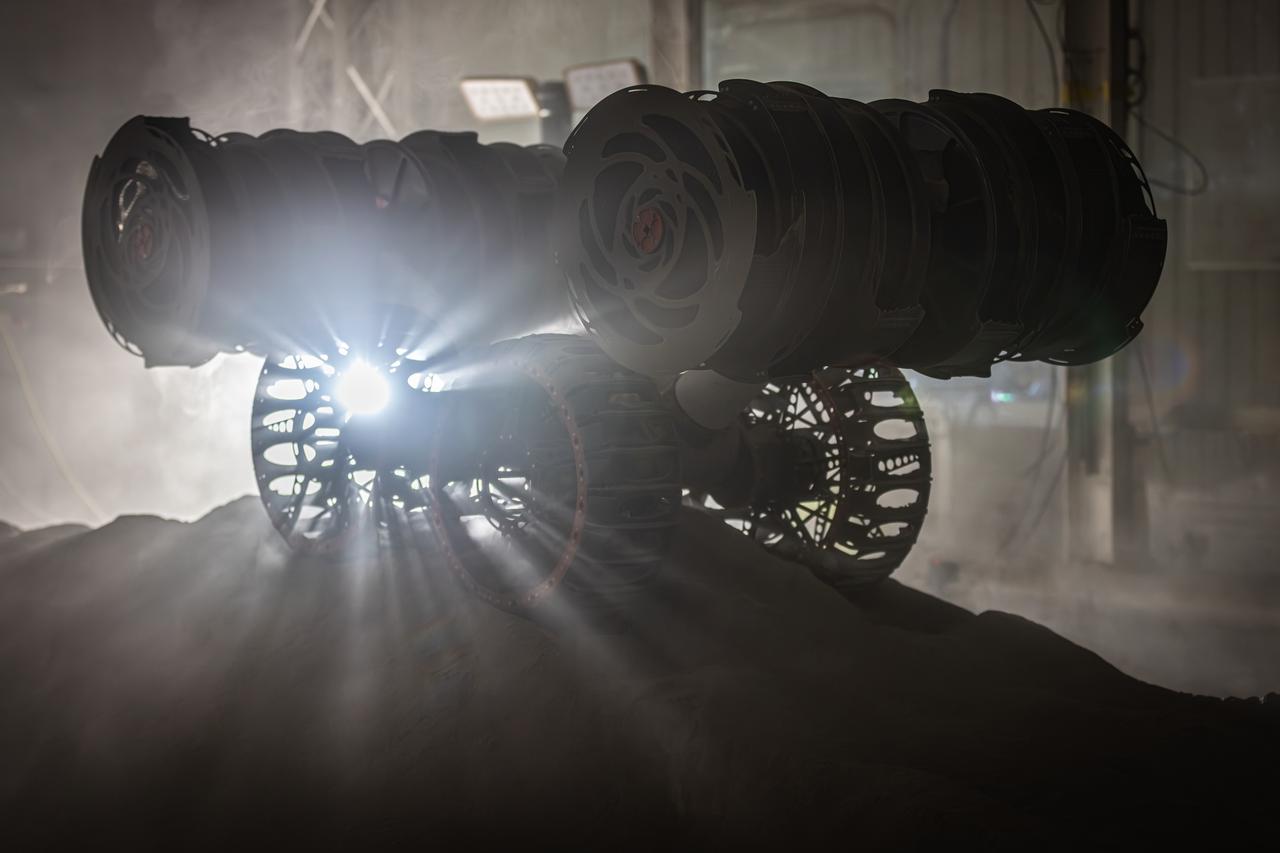
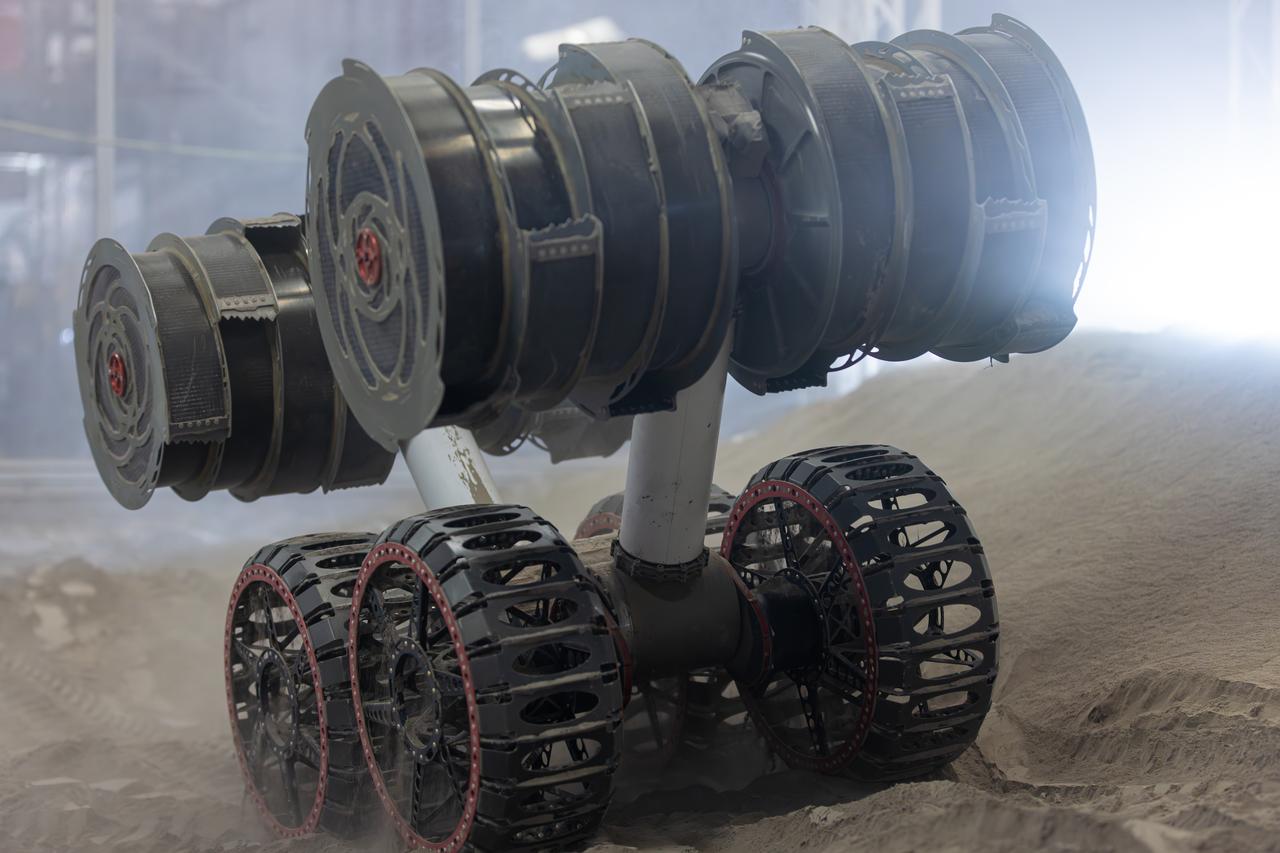
NASA’s RASSOR (Regolith Advanced Surface Systems Operations Robot) conducts excavation testing of simulated regolith, or lunar dust found on the Moon’s surface, inside of the Granular Mechanics and Regolith Operations Lab at the agency’s Kennedy Space Center in Florida on Tuesday, May 27, 2025. RASSOR is designed to work in low-gravity situations, using counter rotating bucket drums on each arm to collect and dump regolith for the extraction of hydrogen, oxygen, or water, resources critical for sustaining a habitable presence.
NASA’s RASSOR (Regolith Advanced Surface Systems Operations Robot) conducts excavation testing of simulated regolith, or lunar dust found on the Moon’s surface, inside of the Granular Mechanics and Regolith Operations Lab at the agency’s Kennedy Space Center in Florida on Tuesday, May 27, 2025. RASSOR is designed to work in low-gravity situations, using counter rotating bucket drums on each arm to collect and dump regolith for the extraction of hydrogen, oxygen, or water, resources critical for sustaining a habitable presence.
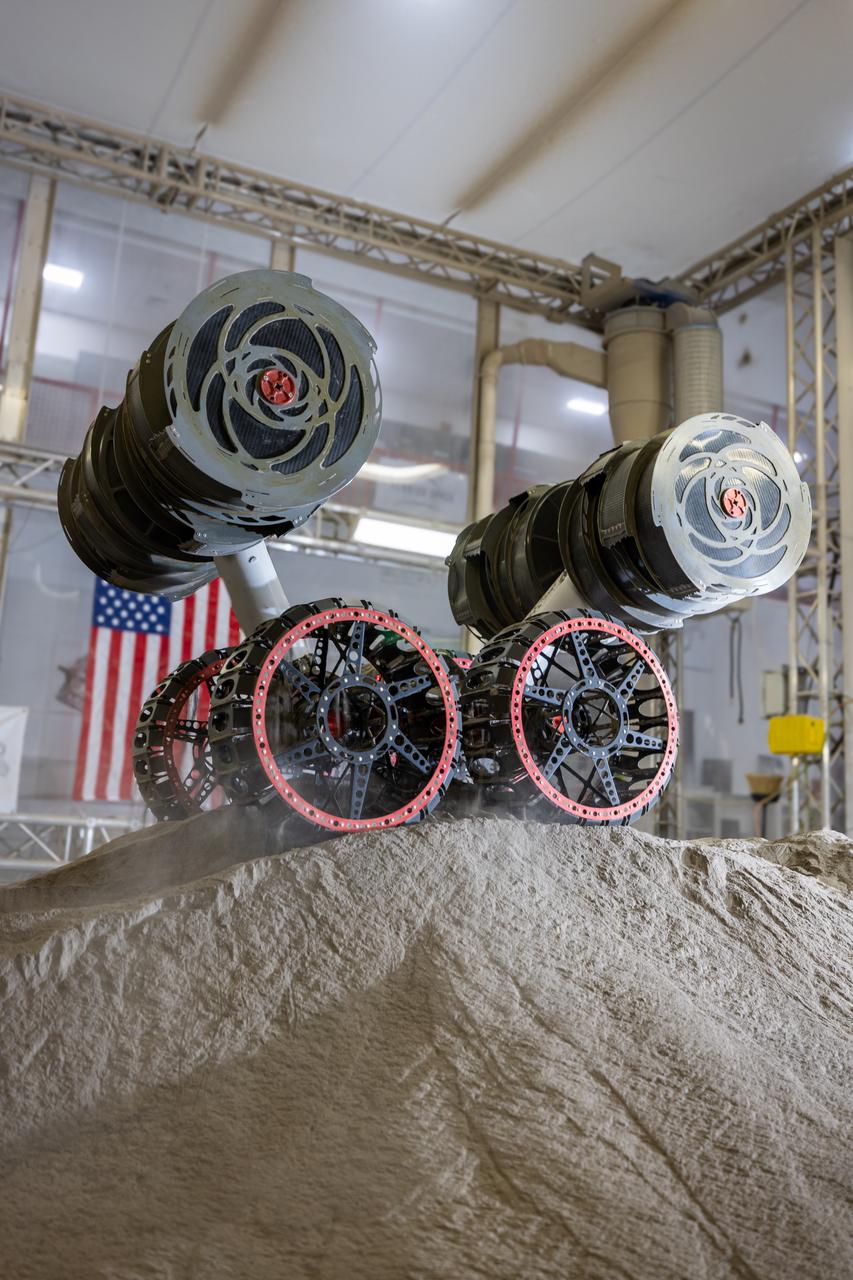
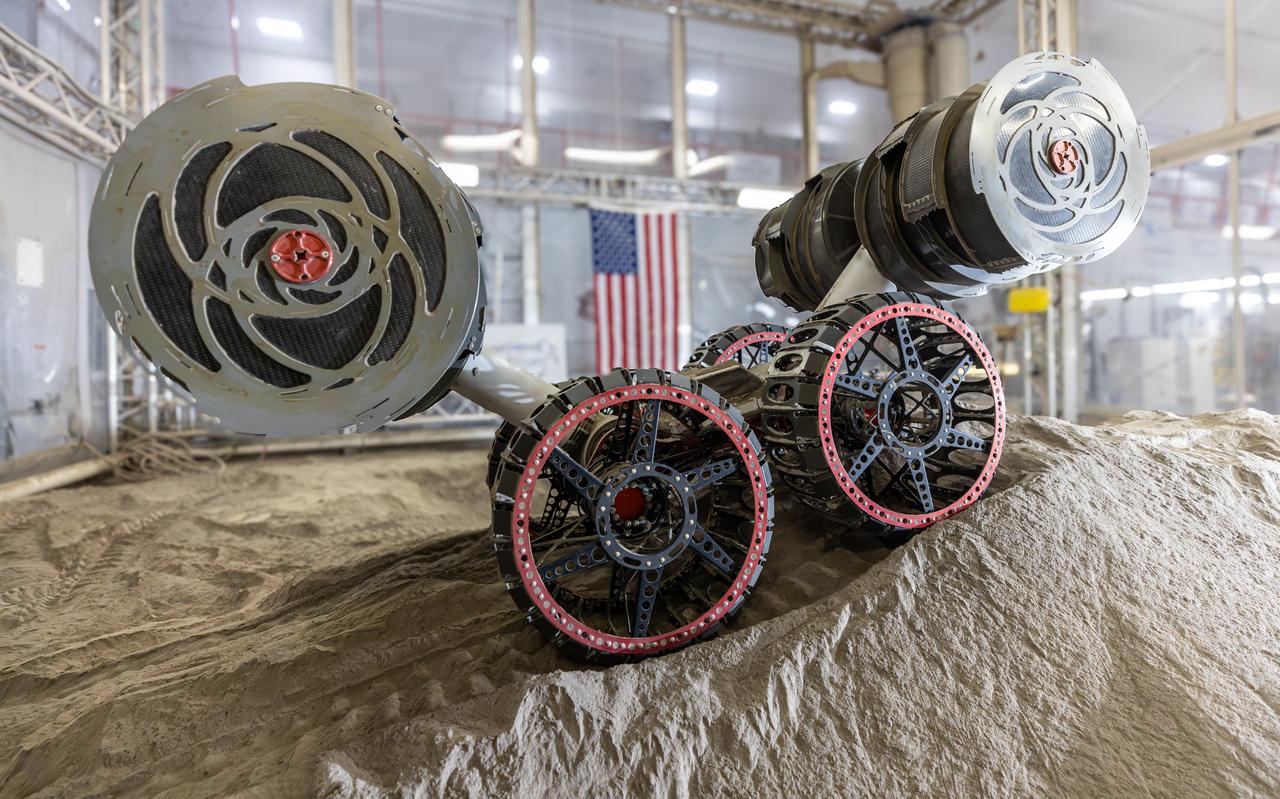
NASA’s RASSOR (Regolith Advanced Surface Systems Operations Robot) conducts excavation testing of simulated regolith, or lunar dust found on the Moon’s surface, inside of the Granular Mechanics and Regolith Operations Lab at the agency’s Kennedy Space Center in Florida on Tuesday, May 27, 2025. RASSOR is designed to work in low-gravity situations, using counter rotating bucket drums on each arm to collect and dump regolith for the extraction of hydrogen, oxygen, or water, resources critical for sustaining a habitable presence.
NASA’s RASSOR (Regolith Advanced Surface Systems Operations Robot) conducts excavation testing of simulated regolith, or lunar dust found on the Moon’s surface, inside of the Granular Mechanics and Regolith Operations Lab at the agency’s Kennedy Space Center in Florida on Tuesday, May 27, 2025. RASSOR is designed to work in low-gravity situations, using counter rotating bucket drums on each arm to collect and dump regolith for the extraction of hydrogen, oxygen, or water, resources critical for sustaining a habitable presence.
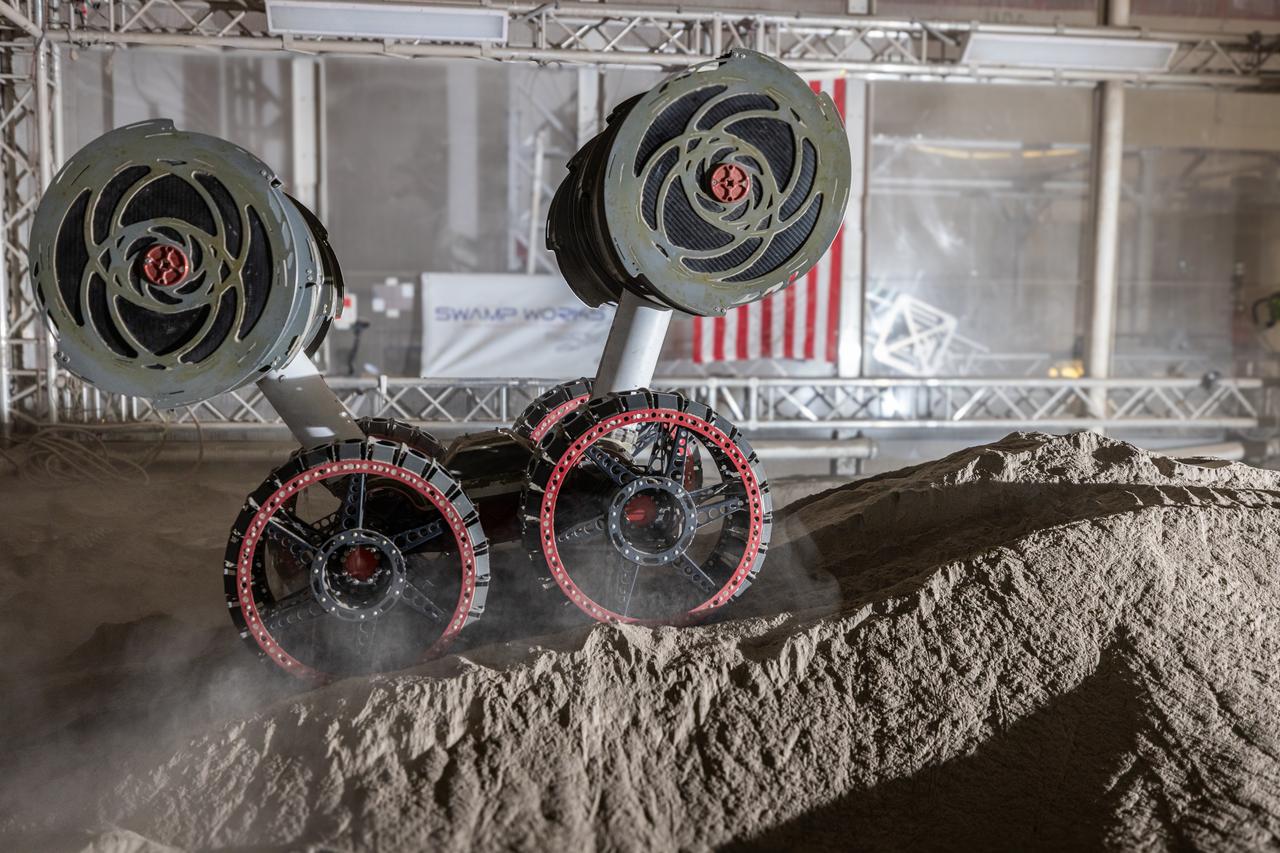
NASA’s RASSOR (Regolith Advanced Surface Systems Operations Robot) conducts excavation testing of simulated regolith, or lunar dust found on the Moon’s surface, inside of the Granular Mechanics and Regolith Operations Lab at the agency’s Kennedy Space Center in Florida on Tuesday, May 27, 2025. RASSOR is designed to work in low-gravity situations, using counter rotating bucket drums on each arm to collect and dump regolith for the extraction of hydrogen, oxygen, or water, resources critical for sustaining a habitable presence.
NASA’s RASSOR (Regolith Advanced Surface Systems Operations Robot) conducts excavation testing of simulated regolith, or lunar dust found on the Moon’s surface, inside of the Granular Mechanics and Regolith Operations Lab at the agency’s Kennedy Space Center in Florida on Tuesday, May 27, 2025. RASSOR is designed to work in low-gravity situations, using counter rotating bucket drums on each arm to collect and dump regolith for the extraction of hydrogen, oxygen, or water, resources critical for sustaining a habitable presence.
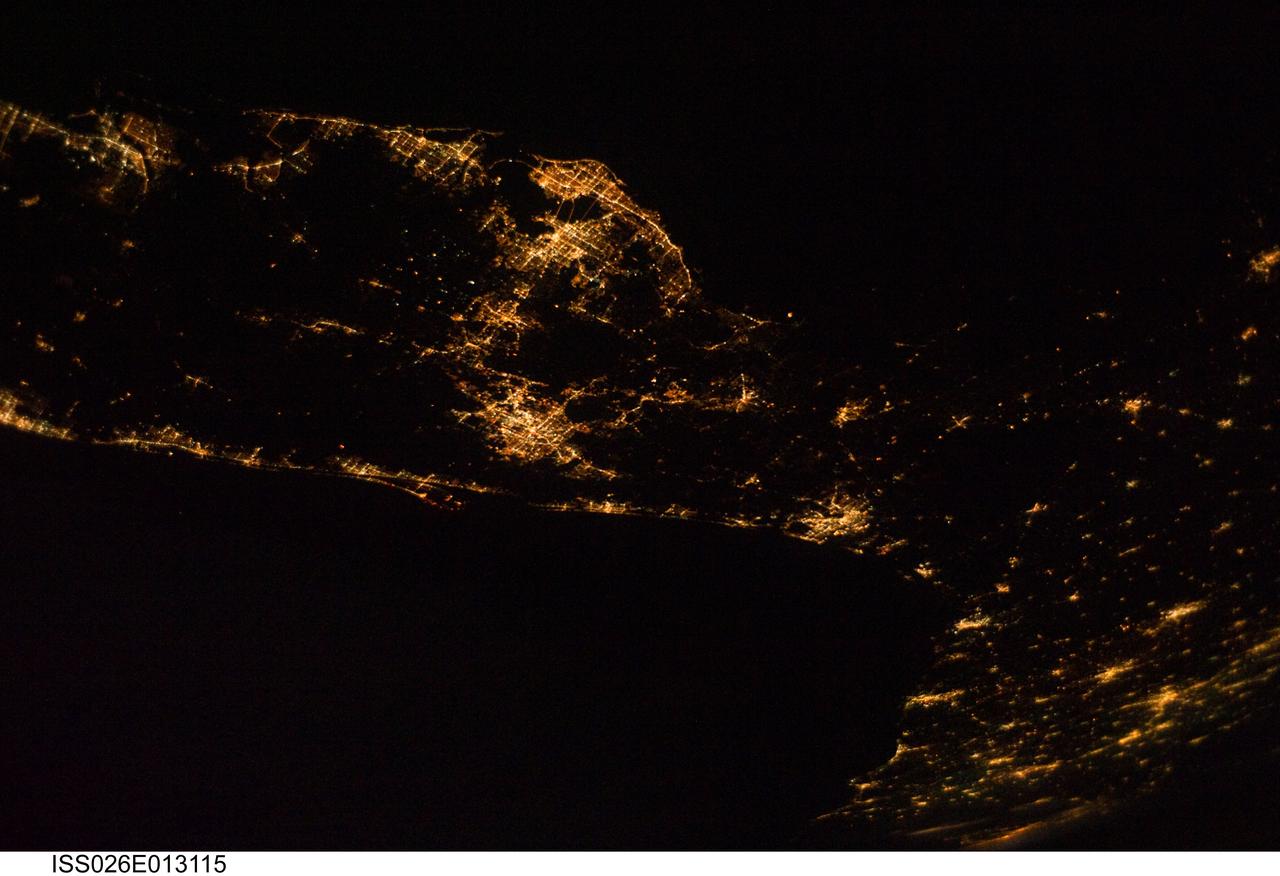
ISS026-E-013115 (28 Dec. 2010) --- From 220 miles above Earth, one of the Expedition 26 crew members used a 32-mm lens to capture this night time image of much of the Florida peninsula. The picture needs to be rotated 90 degrees counter-clockwise to situate north at the top. St. Petersburg, Tampa Bay and Fort Myers can be easily delineated on the Gulf of Mexico (top in the original orientation) side and the spread-out bright lights of the Orlando area appear near frame center. Cape Canaveral and the Kennedy Space Center can also be spotted on the Atlantic side of Florida, with lights of Jacksonville visible further northward.
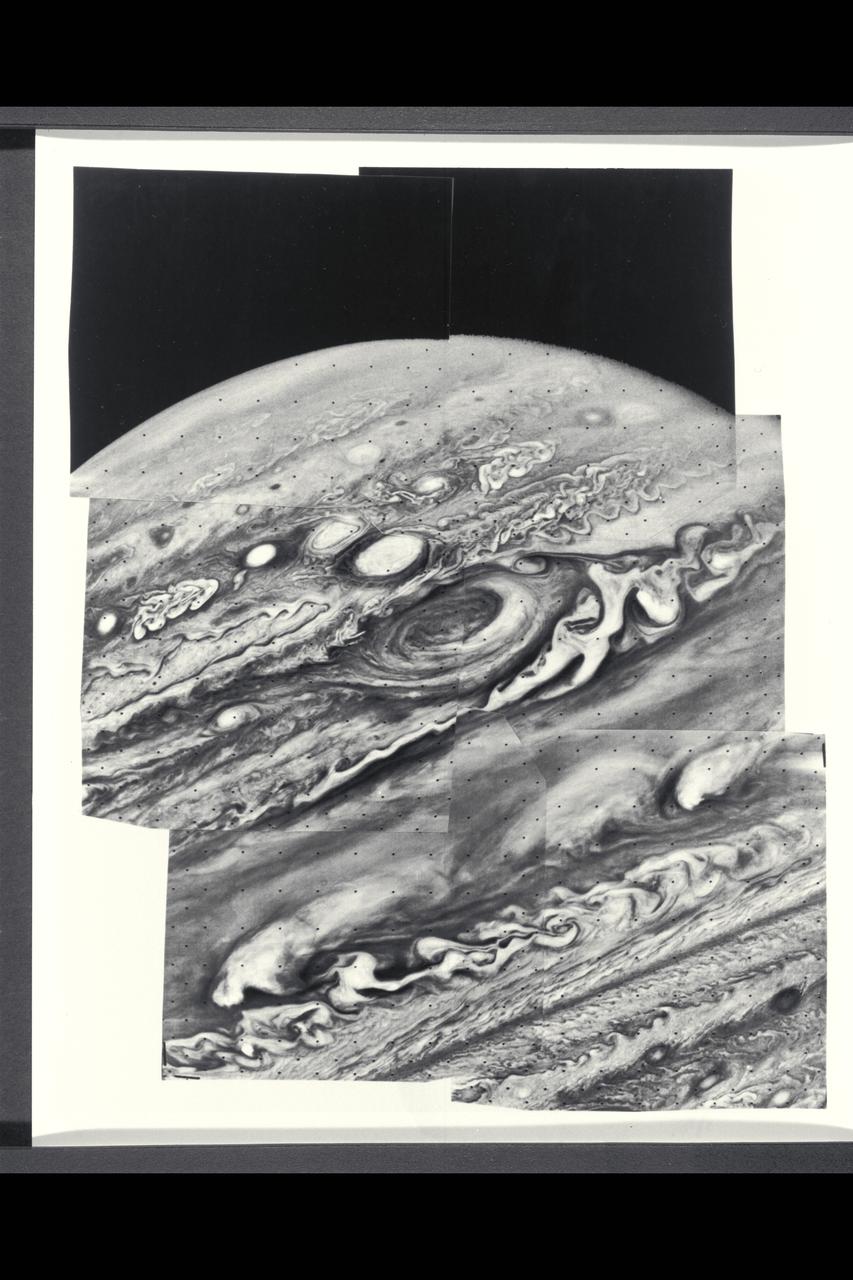
Range : 6.5 million kilometers (4 million miles) Six violet images of Jupiter makes the mosaic photo, showing the Great Red Spot as a swirling vortex type motion. This motion is also seen in several nearby white clouds. These bright white clouds and the Red Spot are rotating in a counter clockwise direction, except the peculiar filimentary cloud to the right of the Red Spot is going clockwise. The top of the picture shows the turbulence from the equatorial jet and more northerly atmospheric currents. The smallest clouds shown are only 70 miles (120 km) across.
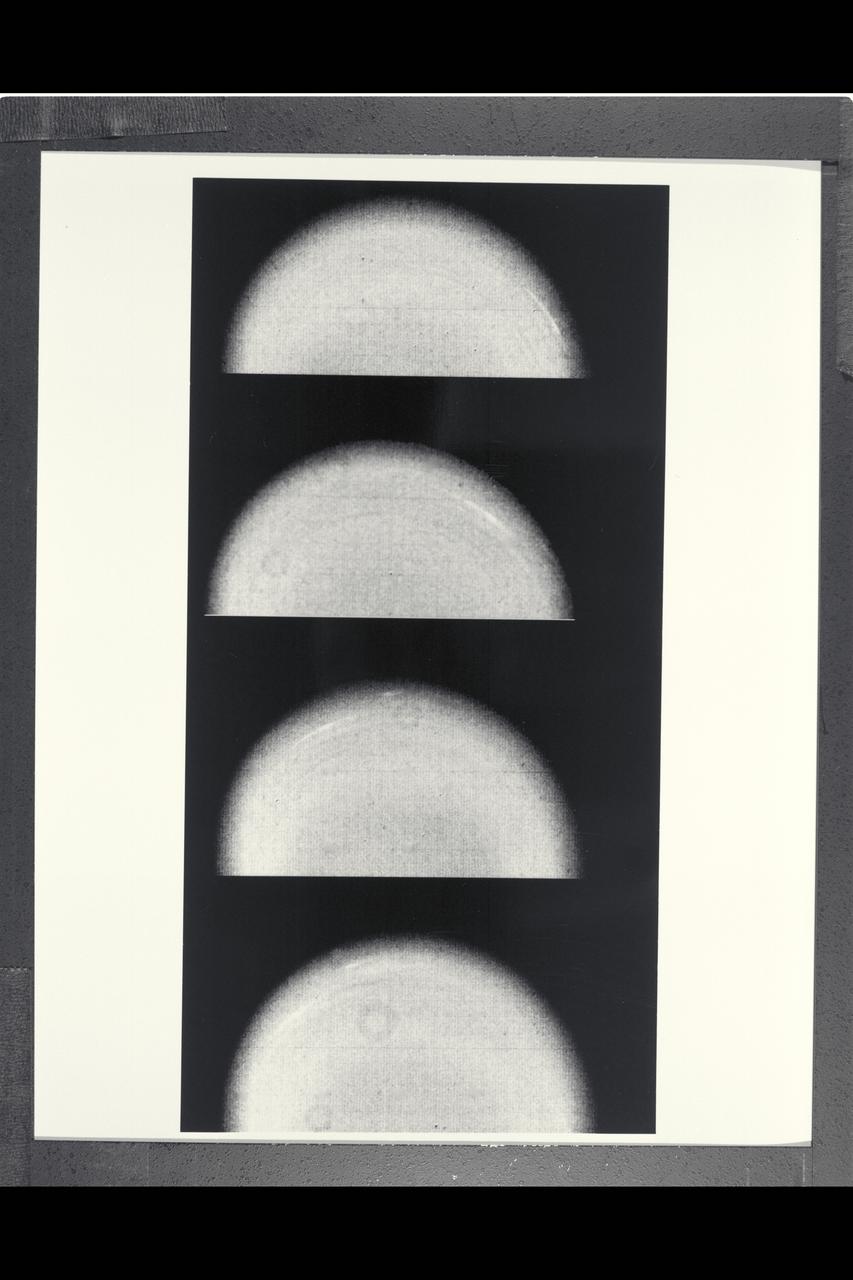
Range : 12.9 million km. ( 8.0 million miles ) P-29467B/W Time lapse Voyager 2 images of Uranus show the movement of two small, bright, streaky clouds, the first such features ever seen on the planet. The clouds were detected in this series of orange filtered images, over a 4.6 hour interval ( from top to bottom ). Uranus, which is tipped on its side with respect to the other planets, is rotating in a counter-clockwise direction, with its pole of rotation near the center of the disk, as are the two clouds seen here as bright streaks. The larger of the two clouds is ata lattitude of 33 degrees. The smaller cloud, seen faintly in the three lower images, lies at 26 degrees ( a lower alttitude and hence closer to the limb). Their counterclockwise periods of rotation are 16.2 and 16.9 hours, respectively. This difference implies that the lower lattitude feature is lagging behind the higher latitude feture at a speed of almost 100 meters pers second (220 mph). Latitudinal bands are also visible in these images, the faint bands, more numerous now then in previous Voyager images from longer range, are concentric with the pole rotation. thatis, they circle the planet in lines of contant latitude.
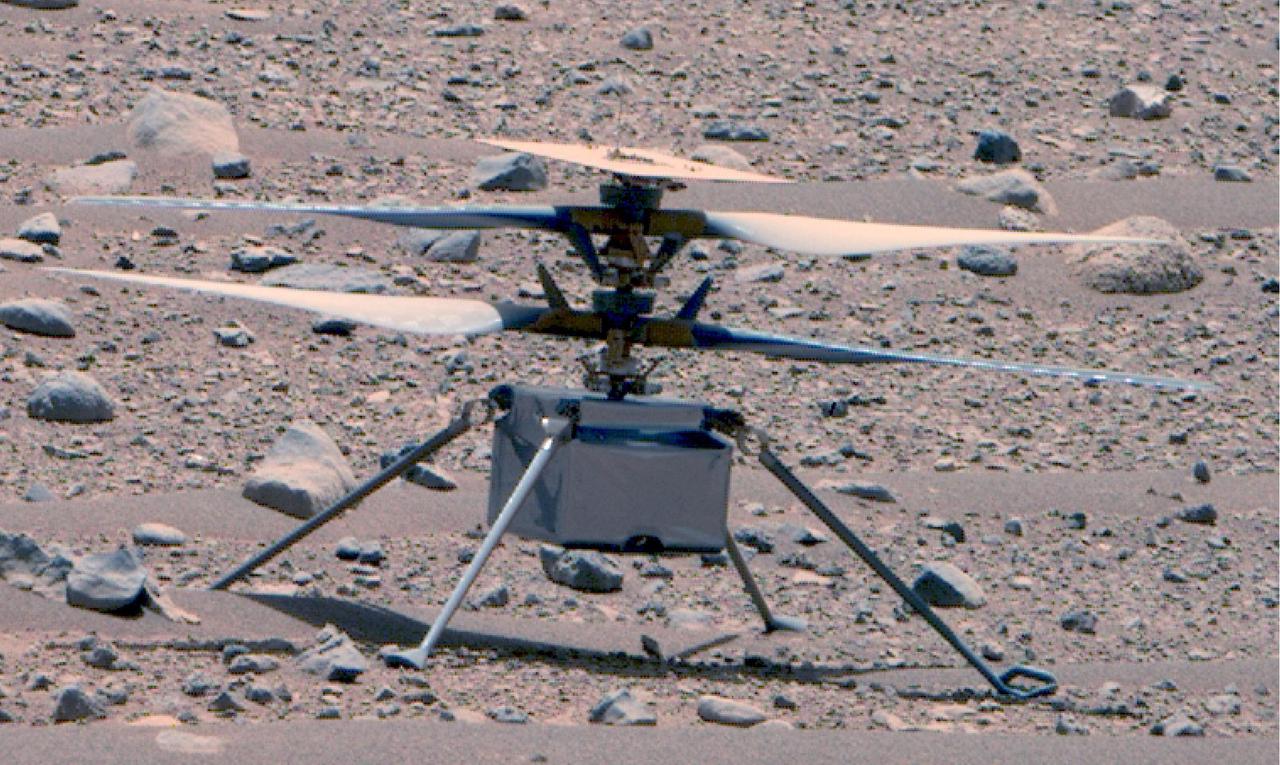
This enhanced color image of NASA's Ingenuity Mars Helicopter was taken by the Mastcam-Z instrument aboard Perseverance on April 16, 2023, the 766th Martian day, or sol, of the rover's mission. At the time the image was taken, the rover was about 75 feet (23 meters) away. The helicopter's first flight on Mars was on April 19, 2021. This is the best look the Ingenuity team has had of the rotorcraft since its first flight. Small diodes (visible more clearly in this image of helicopter) appear as small protrusions on the top of the helicopter's solar panel. The panel and the two 4-foot (1.2-meter) counter-rotating rotors have accumulated a fine coating of dust. The metalized insulating film covering the exterior of the helicopter's fuselage appears to be intact. Ingenuity's color, 13-megapixel, horizon-facing terrain camera can be seen at the center-bottom of the fuselage. https://photojournal.jpl.nasa.gov/catalog/PIA25881
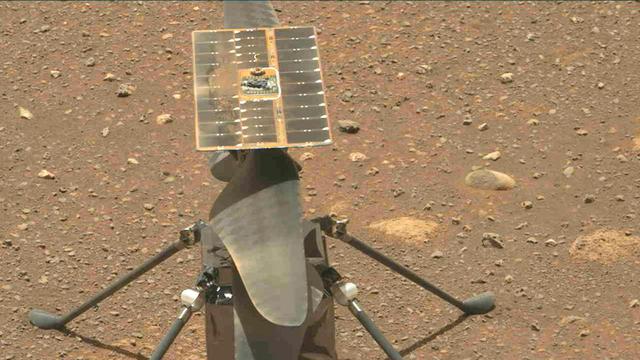
The Ingenuity Mars Helicopter's carbon fiber blades can be seen in this video taken by the Mastcam-Z instrument aboard NASA's Perseverance Mars rover on April 8, 2021, the 48th Martian day, or sol, of the mission. The four blades are arranged into two 4-foot-long (1.2-meter-long) counter-rotating rotors that can spin at roughly 2,400 rpm. The video shows the blades performing a wiggle test before the actual spin-up to ensure they were working properly. The helicopter weighs about 4 pounds (1.8 kilograms) on Earth, and about 1.5 pounds (0.68 kilograms) on Mars. It stands 1.6 feet (0.49 meters) high. It's four specially made carbon fiber blades are arranged into two 4-foot-long (1.2-meter-long) counter-rotating rotors that spin at roughly 2,400 rpm. The helicopter's fuselage is 5.4 inches by 7.7 inches by 6.4 inches (13.6 centimeters by 19.5 centimeters by 16.3 centimeters); it has four carbon composite landing legs, each 1.26 feet (0.384 meters) long, giving the helicopter about 5 inches (13 centimeters) of clearance above the ground. It is powered by a solar array on top of the rotor system, which charges six lithium-ion batteries A key objective for Perseverance's mission on Mars is astrobiology, including the search for signs of ancient microbial life. The rover will characterize the planet's geology and past climate, pave the way for human exploration of the Red Planet, and be the first mission to collect and cache Martian rock and regolith (broken rock and dust). Subsequent NASA missions, in cooperation with ESA (European Space Agency), would send spacecraft to Mars to collect these sealed samples from the surface and return them to Earth for in-depth analysis. The Mars 2020 Perseverance mission is part of NASA's Moon to Mars exploration approach, which includes Artemis missions to the Moon that will help prepare for human exploration of the Red Planet. Animation available at https://photojournal.jpl.nasa.gov/catalog/PIA24549
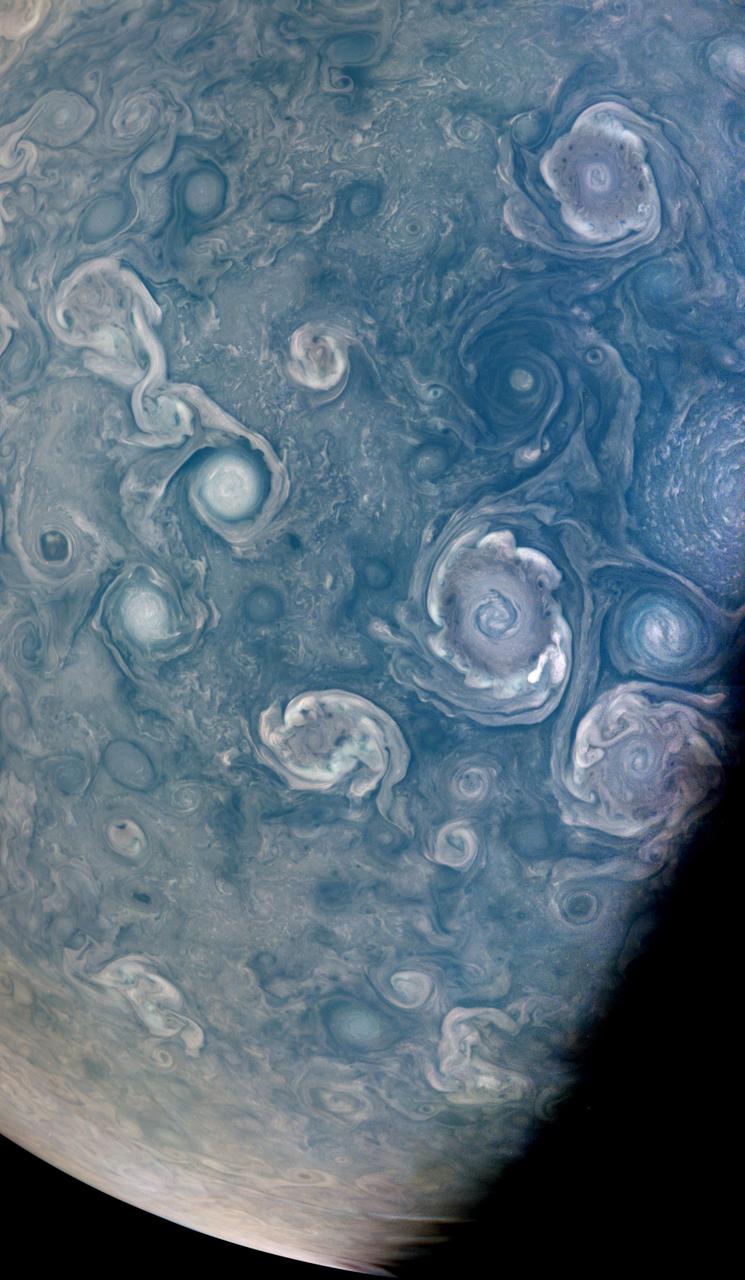
As NASA's Juno mission completed its 43rd close flyby of Jupiter on July 5, 2022, its JunoCam instrument captured this striking view of vortices – hurricane-like spiral wind patterns – near the planet's north pole. These powerful storms can be over 30 miles (50 kilometers) in height and hundreds of miles across. Figuring out how they form is key to understanding Jupiter's atmosphere, as well as the fluid dynamics and cloud chemistry that create the planet's other atmospheric features. Scientists are particularly interested in the vortices' varying shapes, sizes, and colors. For example, cyclones, which spin counter-clockwise in the northern hemisphere and clockwise in the southern, and anti-cyclones, which rotate clockwise in the northern hemisphere and counter-clockwise in the southern hemisphere, exhibit very different colors and shapes. A NASA citizen science project, Jovian Vortex Hunter, seeks help from volunteer members of the public to spot and help categorize vortices and other atmospheric phenomena visible in JunoCam photos of Jupiter. This process does not require specialized training or software, and can be done by anyone, anywhere, with a cellphone or laptop. As of July 2022, 2,404 volunteers had made 376,725 classifications using the Jovian Vortex Hunter project web site at https://www.zooniverse.org/projects/ramanakumars/jovian-vortex-hunter. Another citizen scientist, Brian Swift, created this enhanced color and contrast view of vortices using raw JunoCam image data. At the time the raw image was taken, the Juno spacecraft was about 15,600 miles (25,100 kilometers) above Jupiter's cloud tops, at a latitude of about 84 degrees. https://photojournal.jpl.nasa.gov/catalog/PIA25017
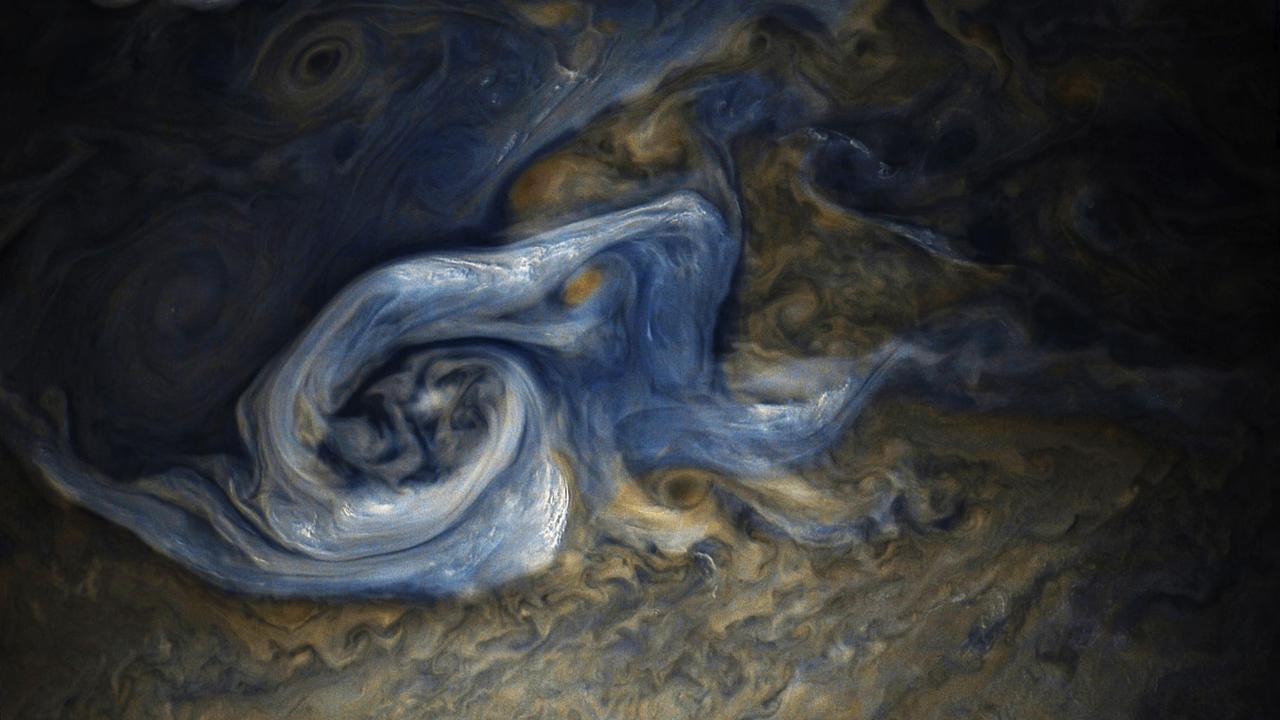
This color-enhanced image of a massive, raging storm in Jupiter's northern hemisphere was captured by NASA's Juno spacecraft during its ninth close flyby of the gas giant planet. The image was taken on Oct. 24, 2017 at 10:32 a.m. PDT (1:32 p.m. EDT). At the time the image was taken, the spacecraft was about 6,281 miles (10,108 kilometers) from the tops of the clouds of Jupiter at a latitude of 41.84 degrees. The spatial scale in this image is 4.2 miles/pixel (6.7 kilometers/pixel). The storm is rotating counter-clockwise with a wide range of cloud altitudes. The darker clouds are expected to be deeper in the atmosphere than the brightest clouds. Within some of the bright "arms" of this storm, smaller clouds and banks of clouds can be seen, some of which are casting shadows to the right side of this picture (sunlight is coming from the left). The bright clouds and their shadows range from approximately 4 to 8 miles (7 to 12 kilometers) in both widths and lengths. These appear similar to the small clouds in other bright regions Juno has detected and are expected to be updrafts of ammonia ice crystals possibly mixed with water ice. Citizen scientists Gerald Eichstädt and Seán Doran processed this image using data from the JunoCam imager. https://photojournal.jpl.nasa.gov/catalog/PIA21971
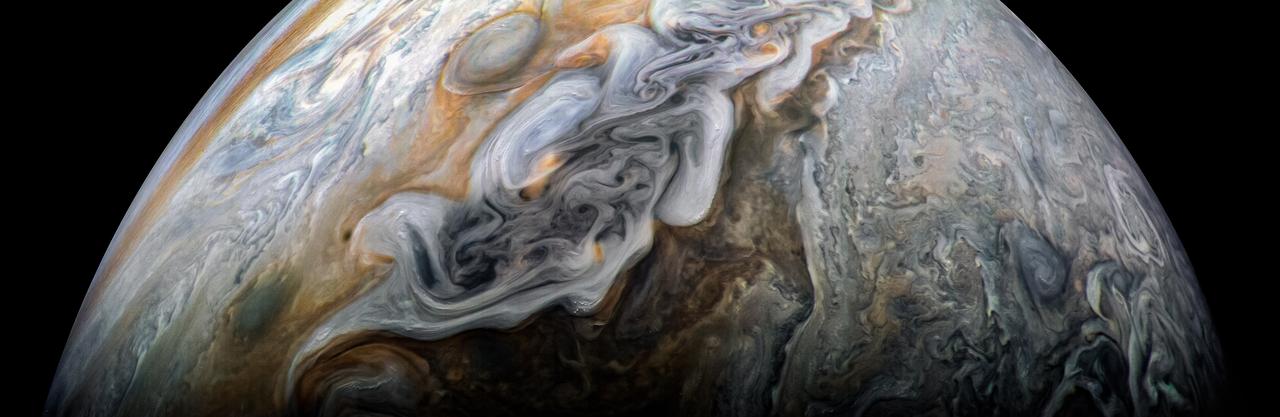
This image captures the intensity of the jets and vortices in Jupiter's North North Temperate Belt. NASA's Juno spacecraft took this color-enhanced image at 10:31 p.m. PDT on May 23, 2018 (1:31 a.m. EDT on May 24), as Juno performed its 13th close flyby of Jupiter. At the time, the spacecraft was about 4,900 miles (7,900 kilometers) from the tops of the clouds of the gas giant planet at a northern latitude of about 41 degrees. The view is oriented with south on Jupiter toward upper left and north toward lower right. The North North Temperate Belt is the prominent reddish-orange band left of center. It rotates in the same direction as the planet and is predominantly cyclonic, which in the northern hemisphere means its features spin in a counter-clockwise direction. Within the belt are two gray-colored anticyclones. To the left of the belt is a brighter band (the North North Temperate Zone) with high clouds whose vertical relief is accentuated by the low angle of sunlight near the terminator. These clouds are likely made of ammonia-ice crystals, or possibly a combination of ammonia ice and water. Although the region as a whole appears chaotic, there is an alternating pattern of rotating, lighter-colored features on the zone's north and south sides. Scientists think the large-scale dark regions are places where the clouds are deeper, based on infrared observations made at the same time by Juno's JIRAM experiment and Earth-based supporting observations. Those observations show warmer, and thus deeper, thermal emission from these regions. To the right of the bright zone, and farther north on the planet, Jupiter's striking banded structure becomes less evident and a region of individual cyclones can be seen, interspersed with smaller, darker anticyclones. https://photojournal.jpl.nasa.gov/catalog/PIA22423 . - Enhanced image by Kevin M. Gill (CC-BY) based on images provided courtesy of NASA/JPL-Caltech/SwRI/MSSS
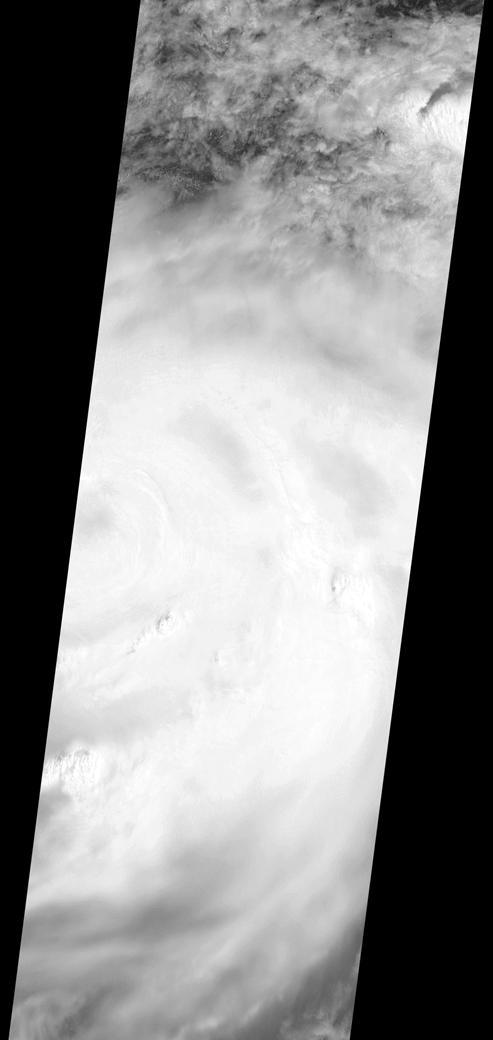
On the morning of October 4, 2016, Hurricane Matthew passed over the island nation of Haiti. A Category 4 storm, it made landfall around 7 a.m. local time (5 a.m. PDT/8 a.m. EDT) with sustained winds over 145 mph. This is the strongest hurricane to hit Haiti in over 50 years. On October 4, at 10:30 a.m. local time (8:30 a.m. PDT/11:30 a.m. EDT), the Multi-angle Imaging SpectroRadiometer (MISR) instrument aboard NASA's Terra satellite passed over Hurricane Matthew. This animation was made from images taken by MISR's downward-pointing (nadir) camera is 235 miles (378 kilometers) across, which is much narrower than the massive diameter of Matthew, so only the hurricane's eye and a portion of the storm's right side are visible. Haiti is completely obscured by Matthew's clouds, but part of the Bahamas is visible to the north. Several hot towers are visible within the central part of the storm, and another at the top right of the image. Hot towers are enormous thunderheads that punch through the tropopause (the boundary between the lowest layer of the atmosphere, the troposphere, and the next level, the stratosphere). The rugged topography of Haiti causes uplift within the storm, generating these hot towers and fueling even more rain than Matthew would otherwise dump on the country. MISR has nine cameras fixed at different angles, which capture images of the same point on the ground within about seven minutes. This animation was created by blending images from these nine cameras. The change in angle between the images causes a much larger motion from south to north than actually exists, but the rotation of the storm is real motion. From this animation, you can get an idea of the incredible height of the hot towers, especially the one to the upper right. The counter-clockwise rotation of Matthew around its closed (cloudy) eye is also visible. These data were acquired during Terra orbit 89345. An animation is available at http://photojournal.jpl.nasa.gov/catalog/PIA21070
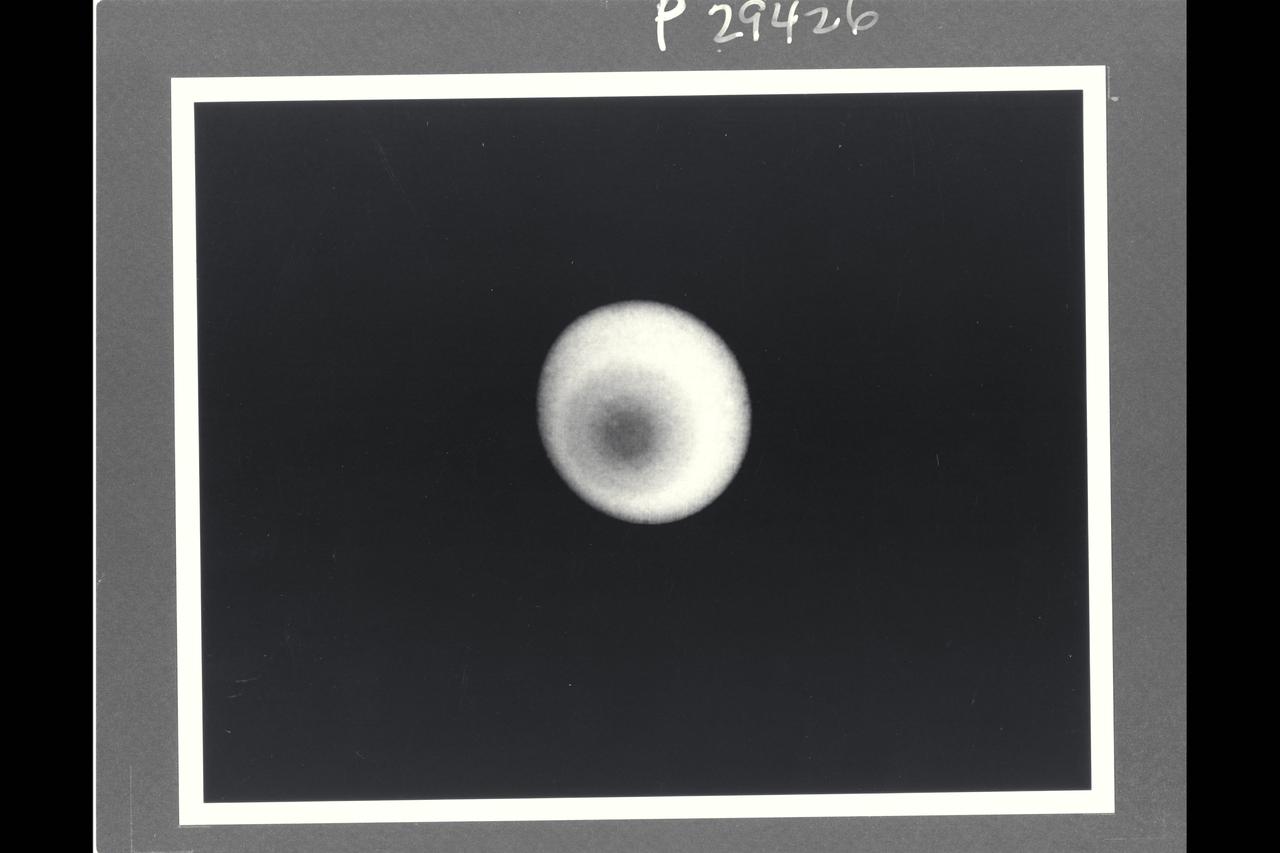
Range : 36 million km. ( 22 million miles ) P-29426B/W This Voyager 2 photograph of Uranus shows the is the first picture to show clear evidence of latitudinal banding in the planet's atmosphere. This is a computerized summation of five images shot by the narrow angle camera. The concentric pattern emanates like a bulls-eye from the planets pole of rotation, which, in this view, lies left of center. uranus lies almost on its side with respect to the other planets and is rotating in a counter clockwise direction, as seen here. Clouds in the Uranian atmosphere give rise to the pattern, the first clear evidence of banding similiar to that seen previosly on Saturn and Jupiter. The bandind on Uranus, however, shows much less contrast. At the distance at which the images were acquired, Voyager's camera could have detected individual features as small as 660 km. (410 miles) across, but no such cloud or markings were apparent. Scientists cannot yet say what properties, such as cloud height, composition, or particle size, are giving rise to the varying levels of brightness visible here. The images composing this picture were shot through a filter that transmits only violet light. in the original, unprocessed images, the contrast of features producing the banding is low, not more than 10 percent. In order to reduce 'noise' and enhance the visiblity of the features, processors combined five images and then compared the resulting composite to a hypothetical featureless planet illuminated by the Sun from the proper direction. Only the ratio between the original data and the hypothetical image is shown.
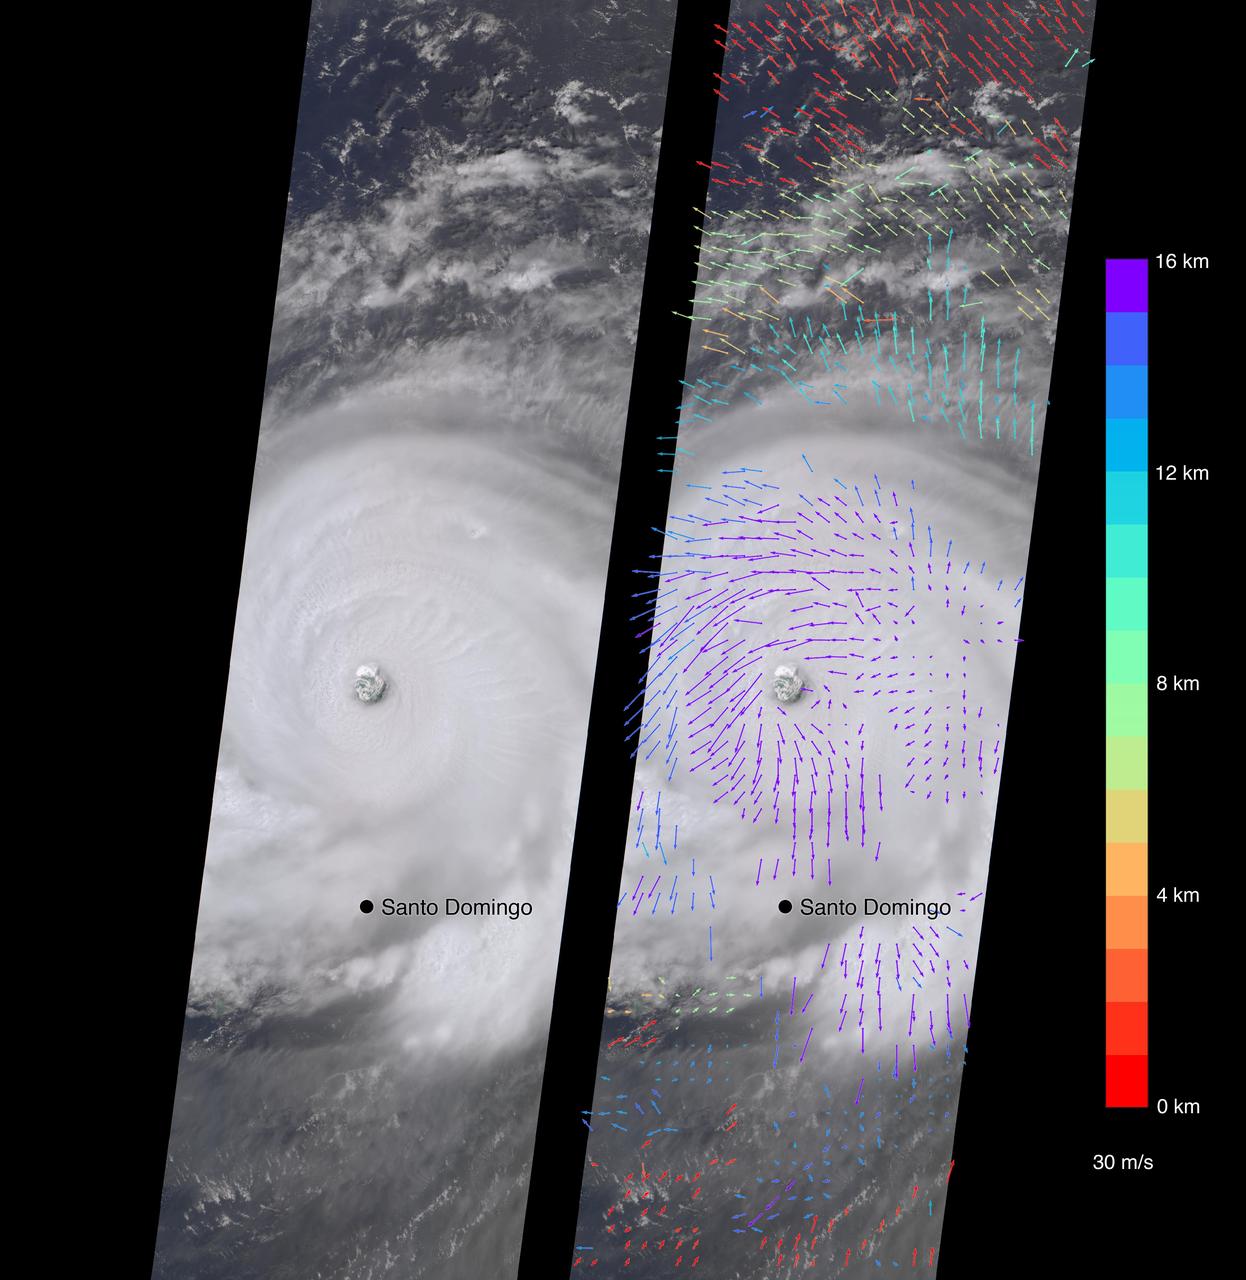
On Sept. 7, the Multi-angle Imaging SpectroRadiometer (MISR) instrument on NASA's Terra satellite passed over Hurricane Irma at approximately 11:20 a.m. local time. The MISR instrument comprises nine cameras that view the Earth at different angles, and since it takes roughly seven minutes for all nine cameras to capture the same location, the motion of the clouds between images allows scientists to calculate the wind speed at the cloud tops. The animated GIF shows Irma's motion over the seven minutes of the MISR imagery. North is toward the top of the image. This composite image shows Hurricane Irma as viewed by the central, downward-looking camera (left), as well as the wind speeds (right) superimposed on the image. The length of the arrows is proportional to the wind speed, while their color shows the altitude at which the winds were calculated. At the time the image was acquired, Irma's eye was located approximately 60 miles (100 kilometers) north of the Dominican Republic and 140 miles (230 kilometers) north of its capital, Santo Domingo. Irma was a powerful Category 5 hurricane, with wind speeds at the ocean surface up to 185 miles (300 kilometers) per hour, according to the National Oceanic and Atmospheric Administration. The MISR data show that at cloud top, winds near the eye wall (the most destructive part of the storm) were approximately 90 miles per hour (145 kilometers per hour), and the maximum cloud-top wind speed throughout the storm calculated by MISR was 135 miles per hour (220 kilometers per hour). While the hurricane's dominant rotation direction is counter-clockwise, winds near the eye wall are consistently pointing outward from it. This is an indication of outflow, the process by which a hurricane draws in warm, moist air at the surface and ejects cool, dry air at its cloud tops. These data were captured during Terra orbit 94267. An animation is available at https://photojournal.jpl.nasa.gov/catalog/PIA21946
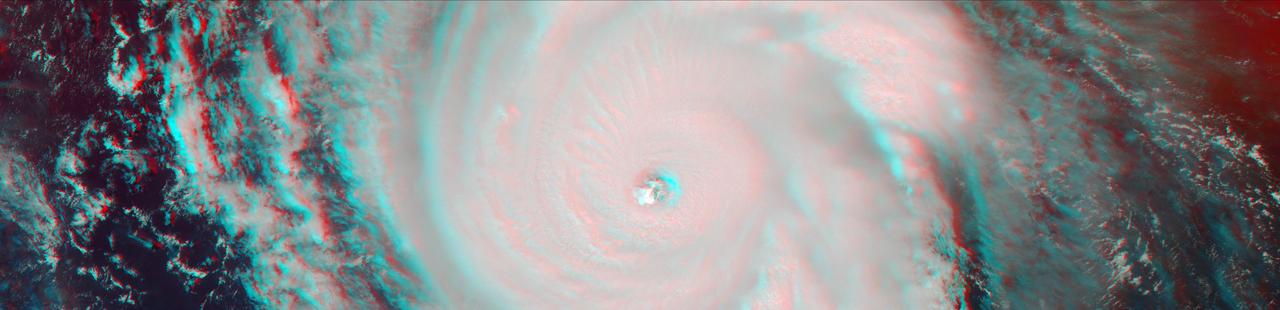
On Sept. 7, the Multi-angle Imaging SpectroRadiometer (MISR) instrument on NASA's Terra satellite passed over Hurricane Irma at approximately 11:20 am local time. The MISR instrument comprises nine cameras that view the Earth at different angles, and since it takes roughly seven minutes for all nine cameras to capture the same location, the motion of the clouds between images allows scientists to calculate the wind speed at the cloud tops. This stereo anaglyph combines two of the MISR angles to show a three-dimensional view of Irma. You will need red-blue glasses to view the anaglyph; place the red lens over your left eye. At this time, Irma's eye was located approximately 60 miles (100 kilometers) north of the Dominican Republic and 140 miles (230 kilometers) north of its capital, Santo Domingo. Irma was a powerful Category 5 hurricane, with wind speeds at the ocean surface up to 185 miles (300 kilometers) per hour. The MISR data show that at cloud top, winds near the eye wall (the most destructive part of the storm) were approximately 90 miles per hour (145 kilometers per hour), and the maximum cloud-top wind speed throughout the storm calculated by MISR was 135 miles per hour (220 kilometers per hour). While the hurricane's dominant rotation direction is counter-clockwise, winds near the eye wall are consistently pointing outward from it. This is an indication of outflow, the process by which a hurricane draws in warm, moist air at the surface and ejects cool, dry air at its cloud tops. https://photojournal.jpl.nasa.gov/catalog/PIA21945