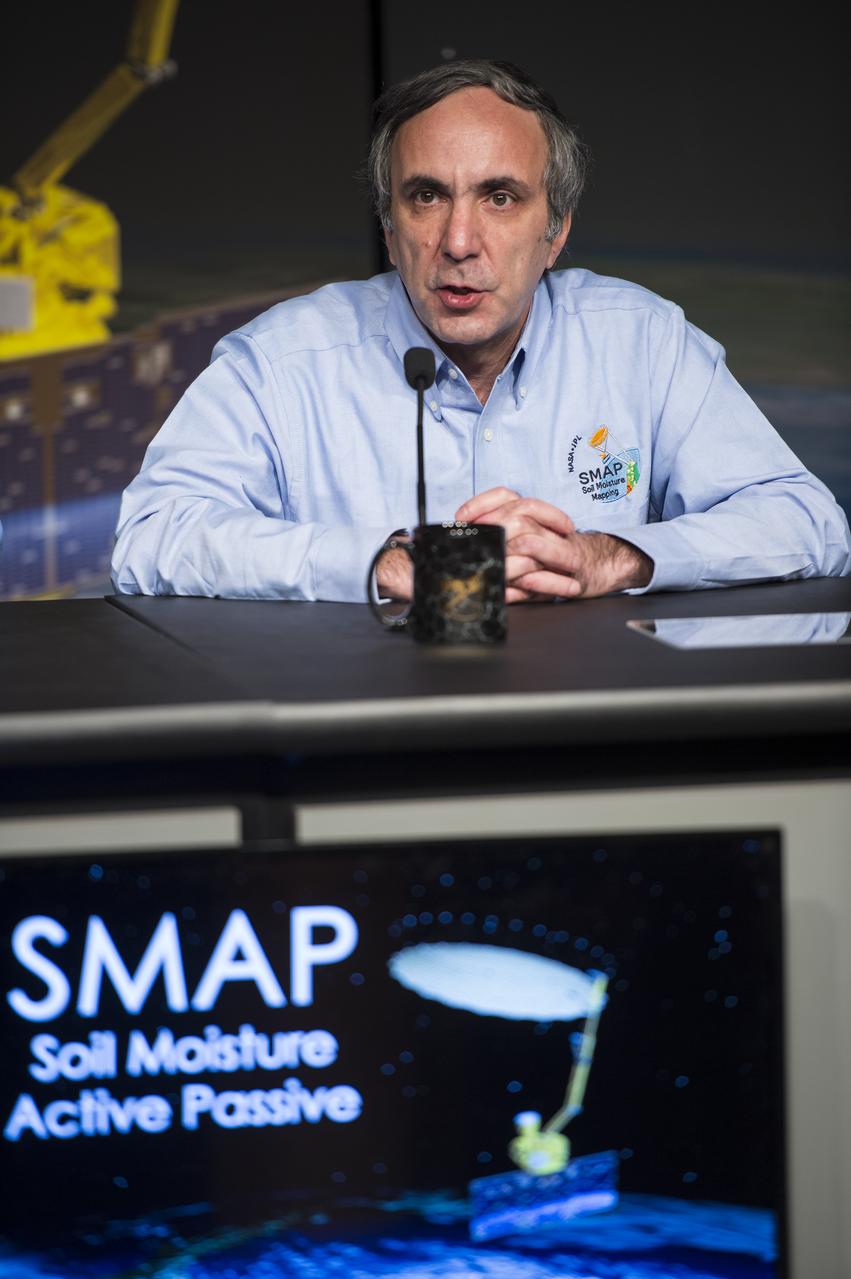
Dara Entekhabi, SMAP science team lead, Massachusetts Institute of Technology, speaks during a briefing about the upcoming launch of the Soil Moisture Active Passive (SMAP) mission, Thursday, Jan. 08, 2015, at NASA Headquarters in Washington DC. The mission is scheduled for a Jan. 29 launch from Vandenberg Air Force Base in California, and will provide the most accurate, highest-resolution global measurements of soil moisture ever obtained from space. The data will be used to enhance scientists' understanding of the processes that link Earth's water, energy and carbon cycles. Photo Credit: (NASA/Aubrey Gemignani)

Dara Entekhabi, SMAP science team lead, Massachusetts Institute of Technology, center, speaks during a briefing about the upcoming launch of the Soil Moisture Active Passive (SMAP) mission, Thursday, Jan. 08, 2015, at NASA Headquarters in Washington DC. The mission is scheduled for a Jan. 29 launch from Vandenberg Air Force Base in California, and will provide the most accurate, highest-resolution global measurements of soil moisture ever obtained from space. The data will be used to enhance scientists' understanding of the processes that link Earth's water, energy and carbon cycles. Photo Credit: (NASA/Aubrey Gemignani)
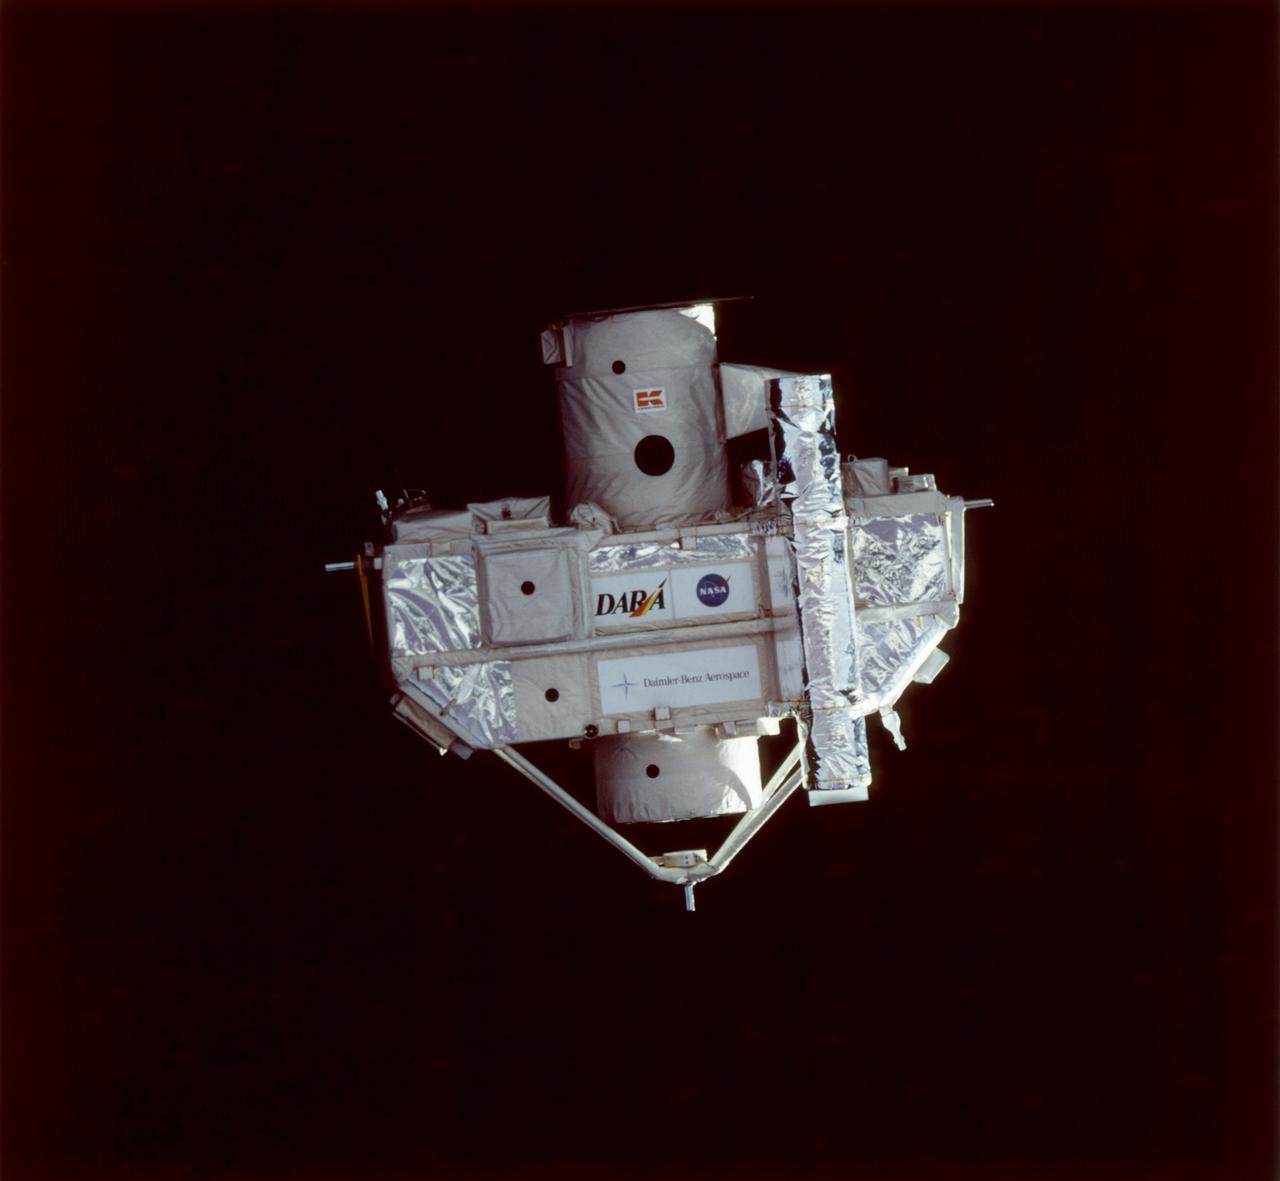
This STS-80 onboard photograph shows the Orbiting Retrievable Far and Extreme Ultraviolet Spectrometer-Shuttle Pallet Satellite II (ORFEUS-SPAS II), photographed during approach by the Space Shuttle Orbiter Columbia for retrieval. Built by the German Space Agency, DARA, the ORFEUS-SPAS II, a free-flying satellite, was dedicated to astronomical observations at very short wavelengths to: investigate the nature of hot stellar atmospheres, investigate the cooling mechanisms of white dwarf stars, determine the nature of accretion disks around collapsed stars, investigate supernova remnants, and investigate the interstellar medium and potential star-forming regions. Some 422 observations of almost 150 astronomical objects were completed, including the Moon, nearby stars, distant Milky Way stars, stars in other galaxies, active galaxies, and quasar 3C273. The STS-80 mission was launched November 19, 1996.

Christine Bonniksen, SMAP program executive with the Science Mission Directorate’s Earth Science Division, NASA Headquarters, left, Kent Kellogg, SMAP project manager, NASA Jet Propulsion Laboratory (JPL), second from left, Dara Entekhabi, SMAP science team lead, Massachusetts Institute of Technology, second from right, and Brad Doorn, SMAP applications lead, Science Mission Directorate’s Applied Sciences Program, NASA Headquarters, right, are seen during a briefing about the upcoming launch of the Soil Moisture Active Passive (SMAP) mission, Thursday, Jan. 08, 2015, at NASA Headquarters in Washington DC. The mission is scheduled for a Jan. 29 launch from Vandenberg Air Force Base in California, and will provide the most accurate, highest-resolution global measurements of soil moisture ever obtained from space. The data will be used to enhance scientists' understanding of the processes that link Earth's water, energy and carbon cycles. Photo Credit: (NASA/Aubrey Gemignani)

Christine Bonniksen, SMAP program executive with the Science Mission Directorate’s Earth Science Division, NASA Headquarters, left, Kent Kellogg, SMAP project manager, NASA Jet Propulsion Laboratory (JPL), second from left, Dara Entekhabi, SMAP science team lead, Massachusetts Institute of Technology, second from right, and Brad Doorn, SMAP applications lead, Science Mission Directorate’s Applied Sciences Program, NASA Headquarters, right, are seen during a briefing about the upcoming launch of the Soil Moisture Active Passive (SMAP) mission, Thursday, Jan. 08, 2015, at NASA Headquarters in Washington DC. The mission is scheduled for a Jan. 29 launch from Vandenberg Air Force Base in California, and will provide the most accurate, highest-resolution global measurements of soil moisture ever obtained from space. The data will be used to enhance scientists' understanding of the processes that link Earth's water, energy and carbon cycles. Photo Credit: (NASA/Aubrey Gemignani)
New Center Network Deployment ribbon Cutting: from left to right: Maryland Edwards, Code JT upgrade project deputy task manager; Ed Murphy, foundry networks systems engineer; Bohdan Cmaylo, Code JT upgrade project task manager, Scott Santiago, Division Chief, Code JT; Greg Miller, Raytheon Network engineer and Frank Daras, Raytheon network engineering manager.

STS060-93-043 (9 Feb 1994) --- BREMSAT, a 140 pound (63 kilogram) satellite, quickly leaves the cargo bay of the Space Shuttle Discovery. The 480 mm (19 inch) deployable satellite was built by the University of Bremen's Center of Applied Space Technology and Microgravity (ZARM) under sponsorship of the German Space Agency (DARA). A modified ejection system in one of the payload bay's getaway special (GAS) type canisters aided the STS-60 crew members in deploying the satellite toward the end of their eight-day mission in Earth orbit.
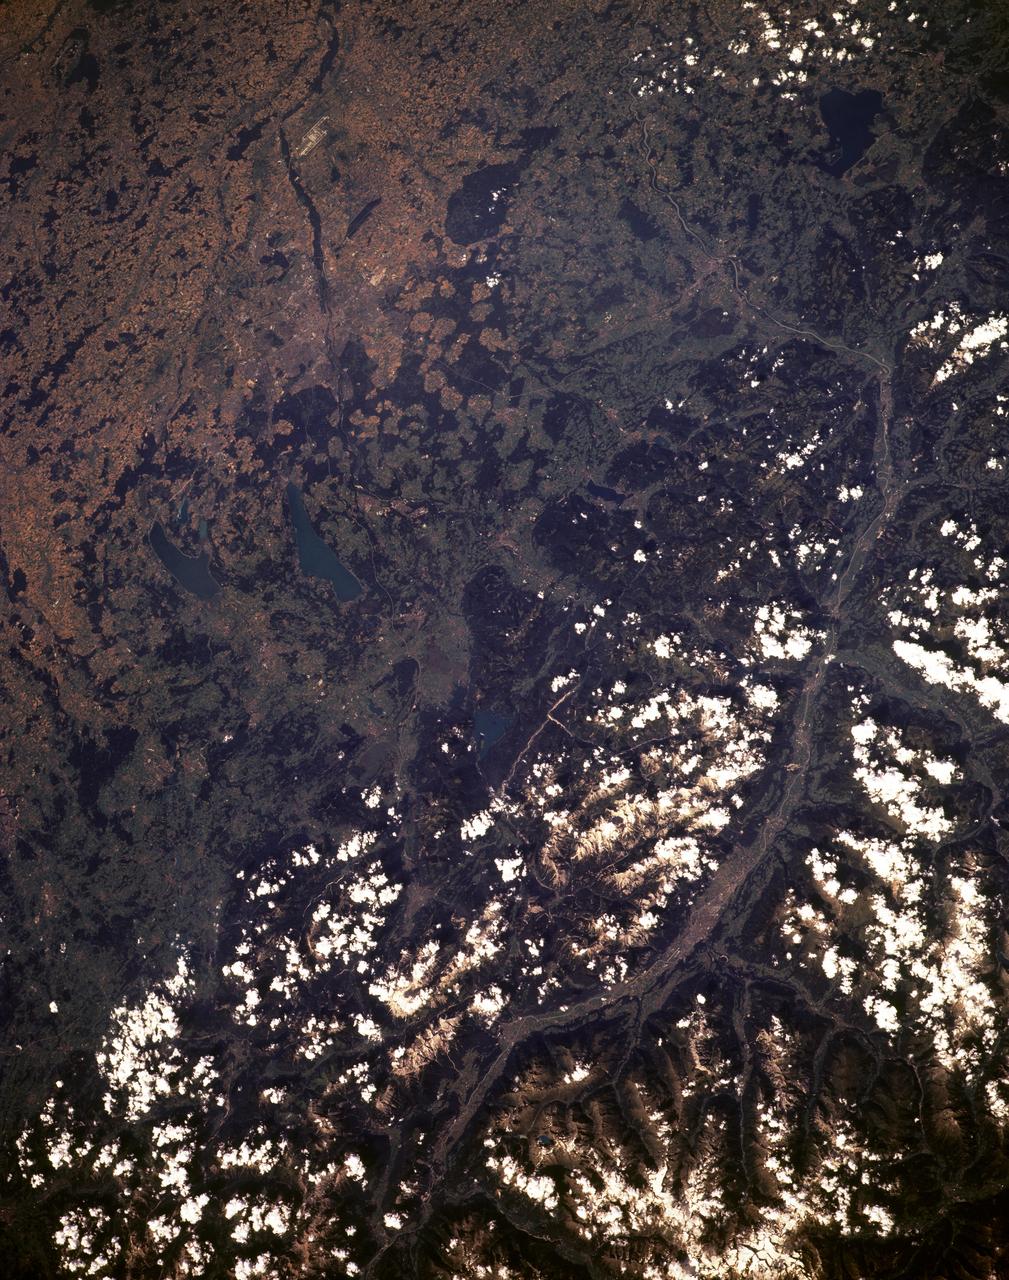
STS085-501-069 (7 - 19 August 1997) --- This 70mm frame was photographed from the Space Shuttle Discovery during the mission. Bare, brown rock and snow-capped Alpine summits in Austria contrast with dark, heavily-wooded upper slopes, the patchy silviculture of lower slopes, and completely farmed plains of Bavaria to the north. The large river is the Inn; Innsbruck is visible within the flat-bottomed, formerly glaciated valley. The new and old airports of Munich are prominent on the flat land to the north. Oberpfaffenhofen, the home of the German Space Agency (DARA), can be picked out west of Munich, south of an autobahn.
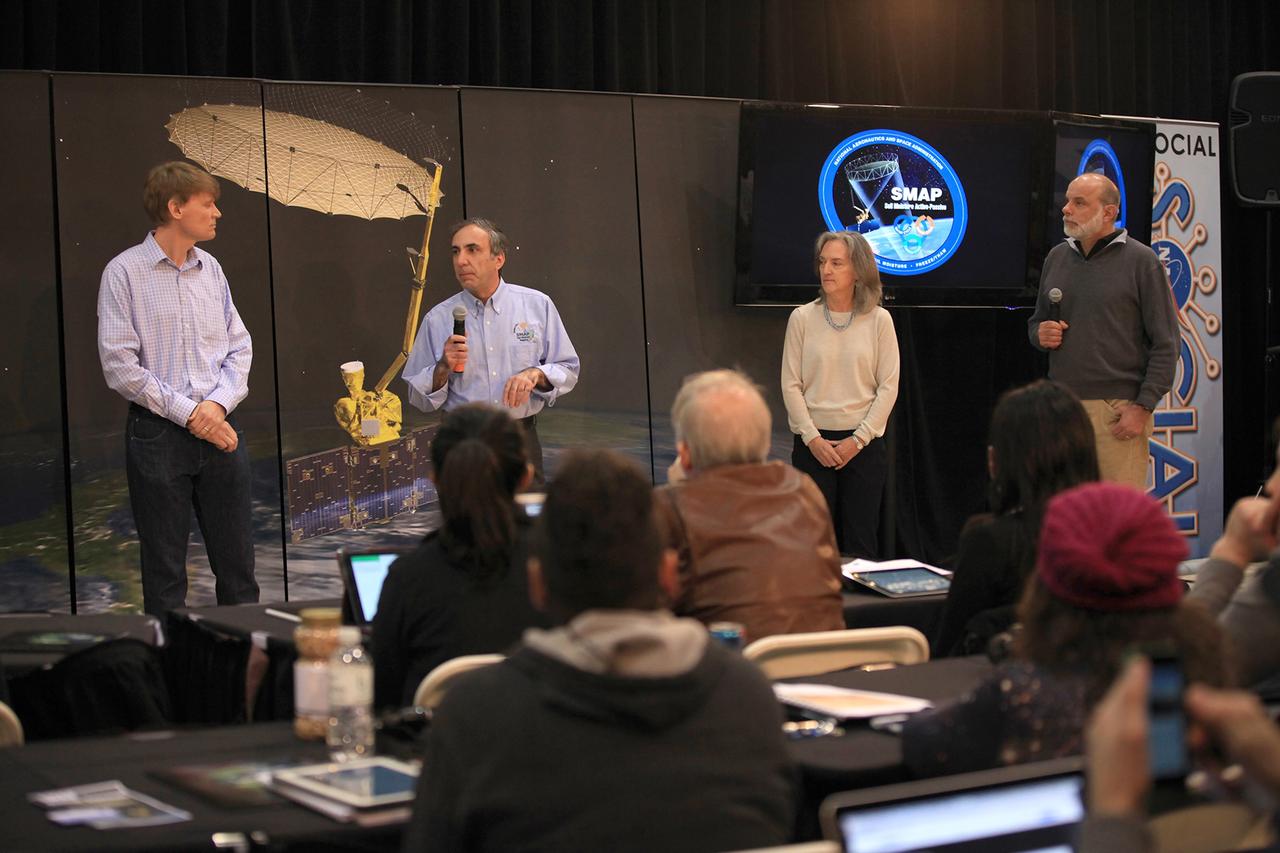
VANDENBERG AIR FORCE BASE, Calif. – Dara Entekhabi, science team leader at the Massachusetts Institute of Technology in Cambridge, Massachusetts, and other experts discuss the science and engineering of NASA's Soil Moisture Active Passive mission, or SMAP, with the audience of a NASA Social held at Vandenberg Air Force Base in California. This NASA Social brought together mission scientists and engineers with an audience of 70 students, educators, social media managers, bloggers, photographers and videographers who were selected from a pool of 325 applicants from 45 countries to participate in launch activities and communicate their experience with social media followers. The SMAP mission is scheduled to launch from Vandenberg on Jan. 29. To learn more about SMAP, visit http://www.nasa.gov/smap. Photo credit: NASA/Kim Shiflett
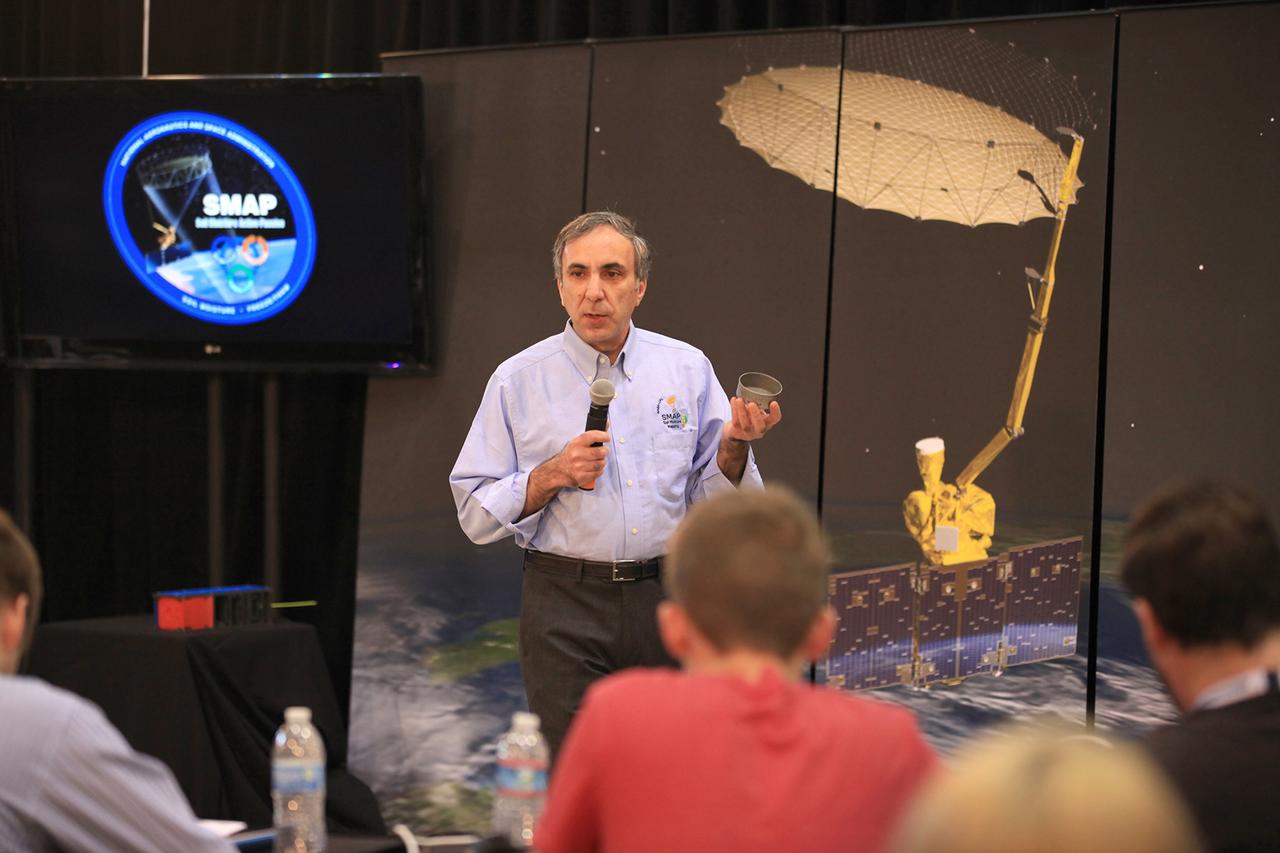
VANDENBERG AIR FORCE BASE, Calif. – Dara Entekhabi, science team leader at the Massachusetts Institute of Technology in Cambridge, Massachusetts, discusses the science and engineering of NASA's Soil Moisture Active Passive mission, or SMAP, with the audience of a NASA Social held at Vandenberg Air Force Base in California. This NASA Social brought together mission scientists and engineers with an audience of 70 students, educators, social media managers, bloggers, photographers and videographers who were selected from a pool of 325 applicants from 45 countries to participate in launch activities and communicate their experience with social media followers. The SMAP mission is scheduled to launch from Vandenberg on Jan. 29. To learn more about SMAP, visit http://www.nasa.gov/smap. Photo credit: NASA/Kim Shiflett

VANDENBERG AIR FORCE BASE, California – At Vandenberg Air Force Base, California, agency and industry leaders spoke to members of the news media as the Soil Moisture Active Passive, or SMAP, satellite and its Delta II rocket were being prepared for launch. From left are: Christine Bonniksen, SMAP program executive at NASA Headquarters, Tim Dunn, NASA launch manager at Kennedy Space Center, Florida, Vern Thorp, program manager for NASA Missions for United Launch Alliance in Centennial, Colorado, Kent Kellogg, SMAP Project manager at the Jet Propulsion Laboratory in Pasadena, California, Dara Entekhabi, SMAP science team leader at the Massachusetts Institute of Technology in Cambridge, Massachusetts, and 1st Lt. John Martin, launch weather officer, 30th Operations Support Squadron at Vandenberg. Photo credit: NASA/Kim Shiflett

VANDENBERG AIR FORCE BASE, California – At Vandenberg Air Force Base, California, agency and industry leaders spoke to members of the news media as the Soil Moisture Active Passive, or SMAP, satellite and its Delta II rocket were being prepared for launch. From left are: George Diller of NASA Public Affairs, Christine Bonniksen, SMAP program executive at NASA Headquarters, Tim Dunn, NASA launch manager at Kennedy Space Center, Florida Vern Thorp, program manager for NASA Missions for United Launch Alliance in Centennial, Colorado, Kent Kellogg, SMAP Project manager at the Jet Propulsion Laboratory in Pasadena, California, Dara Entekhabi, SMAP science team leader at the Massachusetts Institute of Technology in Cambridge, Massachusetts, and 1st Lt. John Martin, launch weather officer, 30th Operations Support Squadron at Vandenberg. Photo credit: NASA/Kim Shiflett

This is the Space Shuttle Orbiter Discovery, STS-42 mission, with the First International Microgravity Laboratory (IML-1) module shown in the cargo bay. IML-1, the first in a series of Shuttle flights, was dedicated to study the fundamental materials and life sciences in the microgravity environment inside Spacelab, a laboratory carried aloft by the Shuttle. The mission explored how life forms adapt to weightlessness and investigated how materials behave when processed in space. The IML program gave a team of scientists from around the world access to a unique environment, one that is free from most of Earth's gravity. The 14-nation European Space Agency (ESA), the Canadian Space Agency (SCA), the French National Center for Space Studies (CNES), the German Space Agency and the German Aerospace Research Establishment (DARA/DLR), and the National Space Development Agency of Japan (NASDA) participated in developing hardware and experiments for the IML missions. The missions were managed by NASA's Marshall Space Flight Center. The Orbiter Discovery was launched on January 22, 1992 for the IML-1 mission.
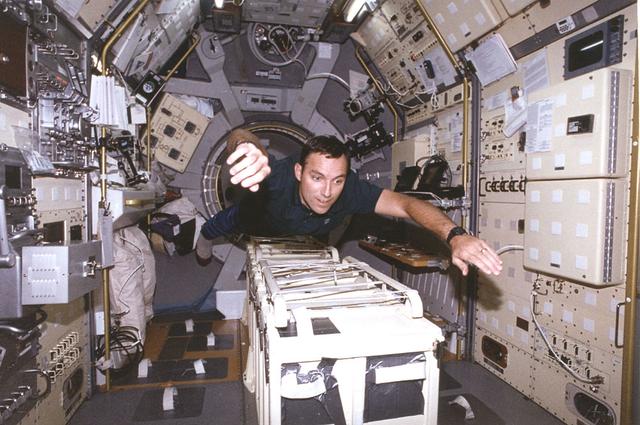
Astronaut Carl E. Walz, mission specialist, flies through the second International Microgravity Laboratory (IML-2) science module, STS-65 mission. IML was dedicated to study fundamental materials and life sciences in a microgravity environment inside Spacelab, a laboratory carried aloft by the Shuttle. The mission explored how life forms adapt to weightlessness and investigated how materials behave when processed in space. The IML program gave a team of scientists from around the world access to a unique environment, one that is free from most of Earth's gravity. Managed by the NASA Marshall Space Flight Center, the 14-nation European Space Agency (ESA), the Canadian Space Agency (SCA), the French National Center for Space Studies (CNES), the German Space Agency and the German Aerospace Research Establishment (DARA/DLR), and the National Space Development Agency of Japan (NASDA) participated in developing hardware and experiments for the IML missions. The missions were managed by NASA's Marshall Space Flight Center. The Orbiter Columbia was launched on July 8, 1994 for the IML-2 mission.
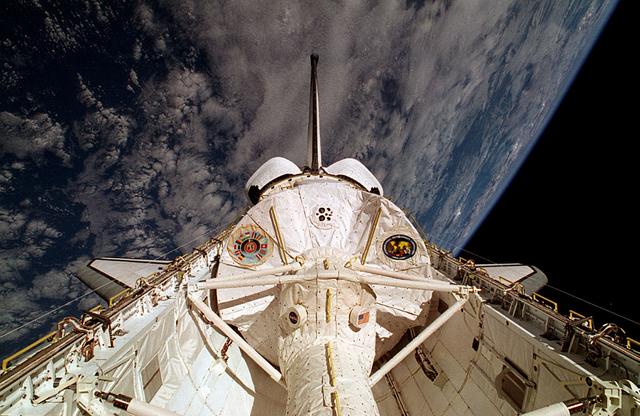
This is a Space Shuttle Columbia (STS-65) onboard photo of the second International Microgravity Laboratory (IML-2) in the cargo bay with Earth in the background. Mission objectives of IML-2 were to conduct science and technology investigations that required the low-gravity environment of space, with emphasis on experiments that studied the effects of microgravity on materials processes and living organisms. Materials science and life sciences are two of the most exciting areas of microgravity research because discoveries in these fields could greatly enhance the quality of life on Earth. If the structure of certain proteins can be determined by examining high-quality protein crystals grown in microgravity, advances can be made to improve the treatment of many human diseases. Electronic materials research in space may help us refine processes and make better products, such as computers, lasers, and other high-tech devices. The 14-nation European Space Agency (ESA), the Canadian Space Agency (SCA), the French National Center for Space Studies (CNES), the German Space Agency and the German Aerospace Research Establishment (DARA/DLR), and the National Space Development Agency of Japan (NASDA) participated in developing hardware and experiments for the IML missions. The missions were managed by NASA's Marshall Space Flight Center. The Orbiter Columbia was launched from the Kennedy Space Center on July 8, 1994 for the IML-2 mission.
STS059-S-084 (17 April 1994) --- This is a three-dimensional perspective of Mammoth Mountain, California. This view was constructed by overlaying a SIR-C radar image on a U.S. Geological Survey digital elevation map. Vertical exaggeration is 2x. The image is centered at 37.6 degrees north, 119.0 degrees west. It was acquired from the Spaceborne Imaging Radar-C and X-Band Synthetic Aperture Radar (SIR-C/X-SAR) onboard the Space Shuttle Endeavour on its 67th orbit, April 13, 1994. In this color representation, red is C-Band HV-polarization, green is C-Band VV-polarization and blue is the ratio of C-Band VV to C-Band HV. Blue areas are smooth and yellow areas are rock outcrops with varying amounts of snow and vegetation. Crowley Lake is in the foreground and Highway 395 crosses in the middle of the image. Mammoth Mountain is shown in the upper right. SIR-C/X-SAR is part of NASA's Mission to Planet Earth (MTPE). SIR-C/X-SAR radars illuminate Earth with microwaves allowing detailed observations at any time, regardless of weather or sunlight conditions. SIR-C/X-SAR uses three microwave wavelengths: L-Band (24 cm), C-Band (6 cm), and X-Band (3 cm). The multi-frequency data will be used by the international scientific community to better understand the global environment and how it is changing. The SIR-C/X-SAR data, complemented by aircraft and ground studies, will give scientists clearer insights into those environmental changes which are caused by nature and those changes which are induced by human activity. SIR-C was developed by NASA's Jet Propulsion Laboratory (JPL). X-SAR was developed by the Dornire and Alenia Spazio Companies for the German Space Agency, Deutsche Agentur fuer Raumfahrtangelegenheiten (DARA), and the Italian Space Agency, Agenzia Spaziale Italiana (ASI). JPL Photo ID: P-43933

S96-18546 (5 Nov. 1996) --- Following their selection from among 2,400 applicants, the 44 astronaut candidates begin a lengthy period of training and evaluation at NASA's Johnson Space Center as they gather for their group portrait. This year?s class is the largest in the history of space shuttle astronauts and their early program predecessors. Ten pilots and 25 mission specialists make up the internationally diverse class. The international trainees represent the Canadian, Japanese, Italian, French, German and European space agencies. Back row ? from the left, Christer Fuglesang, John Herrington, Steve MacLean, Peggy Whitson, Stephen Frick, Duane Carey, Daniel Tani, Heidemarie Stefanyshyn-Piper, Jeffrey Williams and Donald Pettit. Second to back row ? from the left, Philippe Perrin, Daniel Burbank, Michael Massimino, Lee Morin, Piers Sellers, John Phillips, Richard Mastraccio, Christopher Loria, Paul Lockhart, Charles Hobaugh and William McCool. Second to front row ? from the left, Pedro Duque, Soichi Noguchi, Mamoru Mohri, Gerhard Thiele, Mark Polansky, Sandra Magnus, Paul Richards, Yvonne Cagle, James Kelly, Patrick Forrester and David Brown. Front row ? from the left, Umberto Guidoni, Edward Fincke, Stephanie Wilson, Julie Payette, Lisa Nowak, Fernando Caldeiro, Mark Kelly, Laurel Clark, Rex Walheim, Scott Kelly, Joan Higginbotham and Charles Camarda. Guidoni represents the Italian Space Agency (ASI). Fuglesang and Duque represent the European Space Agency (ESA). Mohri and Noguchi represent the Japanese Space Agency (NASDA). MacLean and Payette are with the Canadian Space Agency. Perrin is associated with the French Space Agency (CNES) and Thiele represents the German Space Agency (DARA). Photo credit: NASA or National Aeronautics and Space Administration
STS059-S-074 (15 April 1994) --- This color composite C-Band and L-Band image of the Kilauea volcano on the big island of Hawaii was acquired by the Spaceborne Imaging Radar-C and X-Band Synthetic Aperture Radar (SIR-C/X-SAR) flying on the Space Shuttle Endeavour. The city of Hilo can be seen at the top. The image shows the different types of lava flows around the crater Pu'u O'o. Ash deposits which erupted in 1790 from the summit of Kilauea volcano show up as dark in this image, and fine details associated with lava flows which erupted in 1919 and 1974 can be seen to the south of the summit in an area called the Ka'u Desert. In addition, the other historic lava flows created in 1881 and 1984 from Mauna Loa volcano (out of view to the left of this image) can easily be seen despite the fact that the surrounding area is covered by forest. Such information will be used to map the extent of such flows, which can pose a hazard to the subdivisions of Hilo. Highway 11 is the linear feature running from Hilo to the Kilauea volcano. The Kilauea volcano has been almost continuously active for more than the last 11 years. Field teams that were on the ground specifically to support these radar observations report that there was vigorous surface activity about 400 meters (one-quarter mile) inland from the coast. A moving lava flow about 200 meters (660 feet) in length was observed at the time of the Shuttle over flight, raising the possibility that subsequent images taken during this mission will show changes in the landscape. SIR-C/X-SAR is part of NASA's Mission to Planet Earth (MTPE). SIR-C/X-SAR radars illuminate Earth with microwaves allowing detailed observations at any time, regardless of weather or sunlight conditions. SIR-C/X-SAR uses three microwave wavelengths: L-Band (24 cm), C-Band (6 cm), and X-Band (3 cm). The multi-frequency data will be used by the international scientific community to better understand the global environment and how it is changing. The SIR-C/X-SAR data, complemented by aircraft and ground studies, will give scientists clearer insights into those environmental changes which are caused by nature and those changes which are induced by human activity. SIR-C was developed by NASA's Jet Propulsion Laboratory (JPL). X-SAR was developed by the Dornire and Alenia Spazio Companies for the German Space Agency, Deutsche Agentur fuer Raumfahrtangelegenheiten (DARA), and the Italian Space Agency, Agenzia Spaziale Italiana (ASI). JPL Photo ID: P-43918
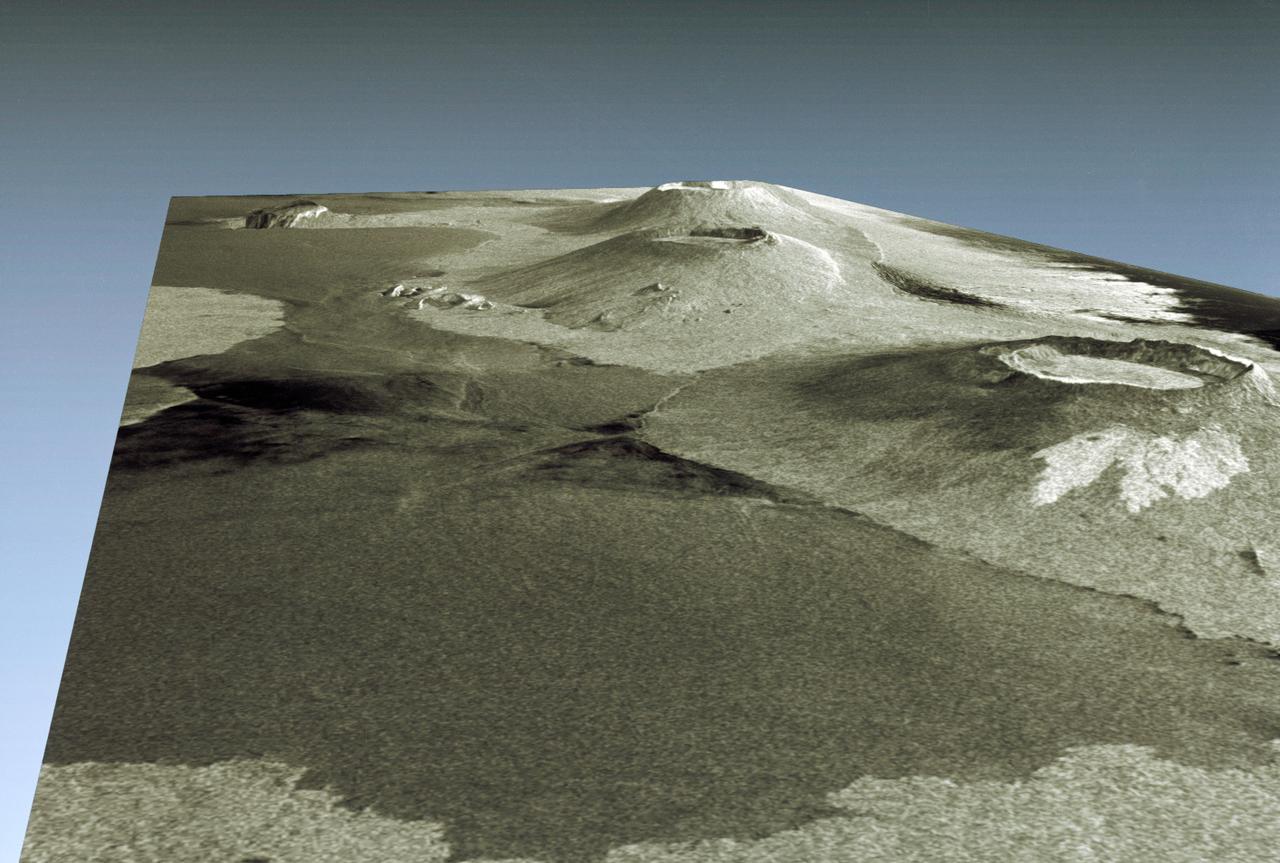
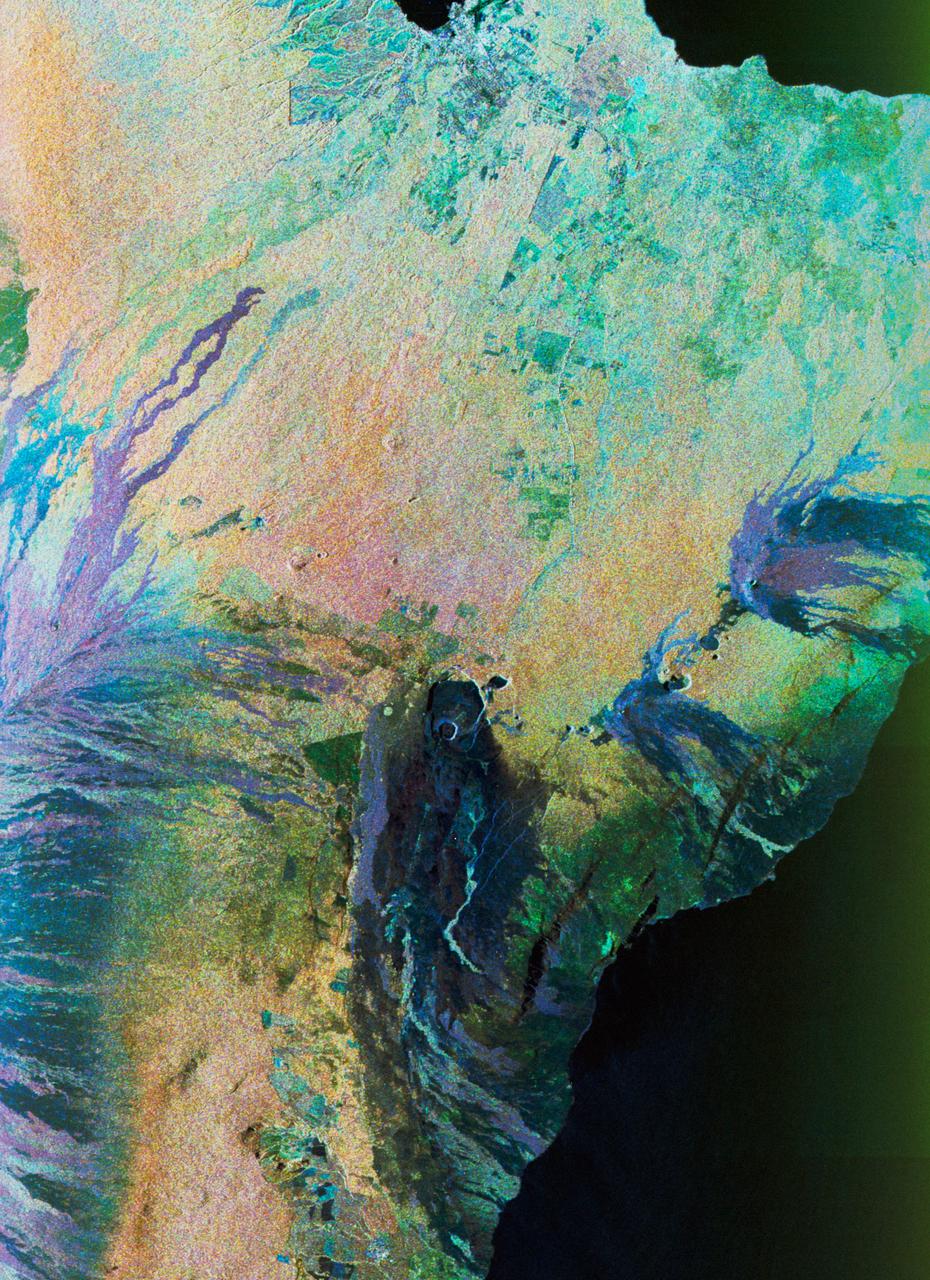
STS059-S-085 (18 April 1994) --- This is a three-dimensional perspective view of part of Isla Isabela in the western Galapagos Islands. It was taken by the L-Band radar in HH polarization from the Spaceborne Imaging Radar-C and X-Band Synthetic Aperture Radar (SIR-C/X-SAR) on the 40th orbit of the Space Shuttle Endeavour. This view was constructed by overlaying a SIR-C radar image on a U.S. Geological Survey digital elevation map. The image is centered at about .5 degrees south latitude and 91 degrees west longitude, and covers an area of 75 by 60 kilometers. The radar incidence angle at the center of the image is about 20 degrees. The western Galapagos Islands, which lie about 1200 kilometers west of Ecuador in the eastern Pacific, have six active volcanoes similar to the volcanoes found in Hawaii. Since the time of Charles Darwin's visit to the area in 1835, there have been over 60 recorded eruptions on these volcanoes. This SIR-C/X-SAR image of Alcedo and Sierra Negra volcanoes shows the rougher lava flows as bright features, while ash deposits and smooth pahoehoe lava flows appear dark. The Galapagos Islands are one of the SIR-C/X-SAR supersites and data of this area will be taken several times during the flight to allow scientists to conduct topographic change studies and to search for different lava flow types, ash deposits and fault lines. SIR-C/X-SAR is part of NASA's Mission to Planet Earth (MTPE). SIR-C/X-SAR radars illuminate Earth with microwaves allowing detailed observations at any time, regardless of weather or sunlight conditions. SIR-C/X-SAR uses three microwave wavelengths: L-Band (24 cm), C-Band (6 cm), and X-Band (3 cm). The multi-frequency data will be used by the international scientific community to better understand the global environment and how it is changing. The SIR-C/X-SAR data, complemented by aircraft and ground studies, will give scientists clearer insights into those environmental changes which are caused by nature and those changes which are induced by human activity. SIR-C was developed by NASA's Jet Propulsion Laboratory (JPL). X-SAR was developed by the Dornire and Alenia Spazio Companies for the German Space Agency, Deutsche Agentur fuer Raumfahrtangelegenheiten (DARA), and the Italian Space Agency, Agenzia Spaziale Italiana (ASI). JPL Photo ID: P-43938
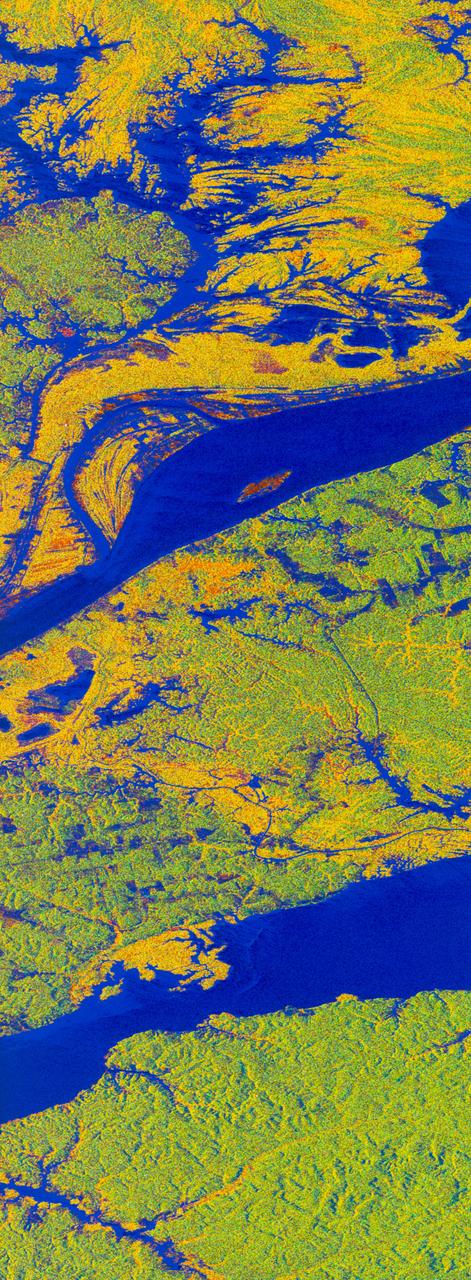
STS059-S-068 (13 April 1994) --- This false-color L-Band image of the Manaus region of Brazil was acquired by the Spaceborne Imaging Radar-C and X-Band Synthetic Aperture Radar (SIR-C/X-SAR) aboard the Space Shuttle Endeavour on orbit 46 of the mission. The area shown is approximately 8 kilometers by 40 kilometers (5 by 25 miles). At the top of the image are the Solimoes and Rio Negro Rivers just before they combine at Manaus to form the Amazon River. The image is centered at about 3 degrees south latitude, and 61 degrees west longitude. The false colors are created by displaying three L-Band polarization channels; red areas correspond to high backscatter at HH polarization, while green areas exhibit high backscatter at HV polarization. Blue areas show low returns at VV polarization; hence the bright blue colors of the smooth river surfaces. Using this color scheme, green areas in the image are heavily forested, while blue areas are either cleared forest or open water. The yellow and red areas are flooded forest. Between Rio Solimoes and Rio Negro a road can be seen running from some cleared areas (visible as blue rectangles north of Rio Solimoes) north towards a tributary of Rio Negro. SIR-C/X-SAR is part of NASA's Mission to Planet Earth (MTPE). SIR-C/X-SAR radars illuminate Earth with microwaves allowing detailed observations at any time, regardless of weather or sunlight conditions. SIR-C/X-SAR uses three microwave wavelengths: L-Band (24 cm), C-Band (6 cm), and X-Band (3 cm). The multi-frequency data will be used by the international scientific community to better understand the global environment and how it is changing. The SIR-C/X-SAR data, complemented by aircraft and ground studies, will give scientists clearer insights into those environmental changes which are caused by nature and those changes which are induced by human activity. SIR-C was developed by NASA's Jet Propulsion Laboratory (JPL). X-SAR was developed by the Dornire and Alenia Spazio Companies for the German Space Agency, Deutsche Agentur fuer Raumfahrtangelegenheiten (DARA), and the Italian Space Agency, Agenzia Spaziale Italiana (ASI). JPL Photo ID: P-43895
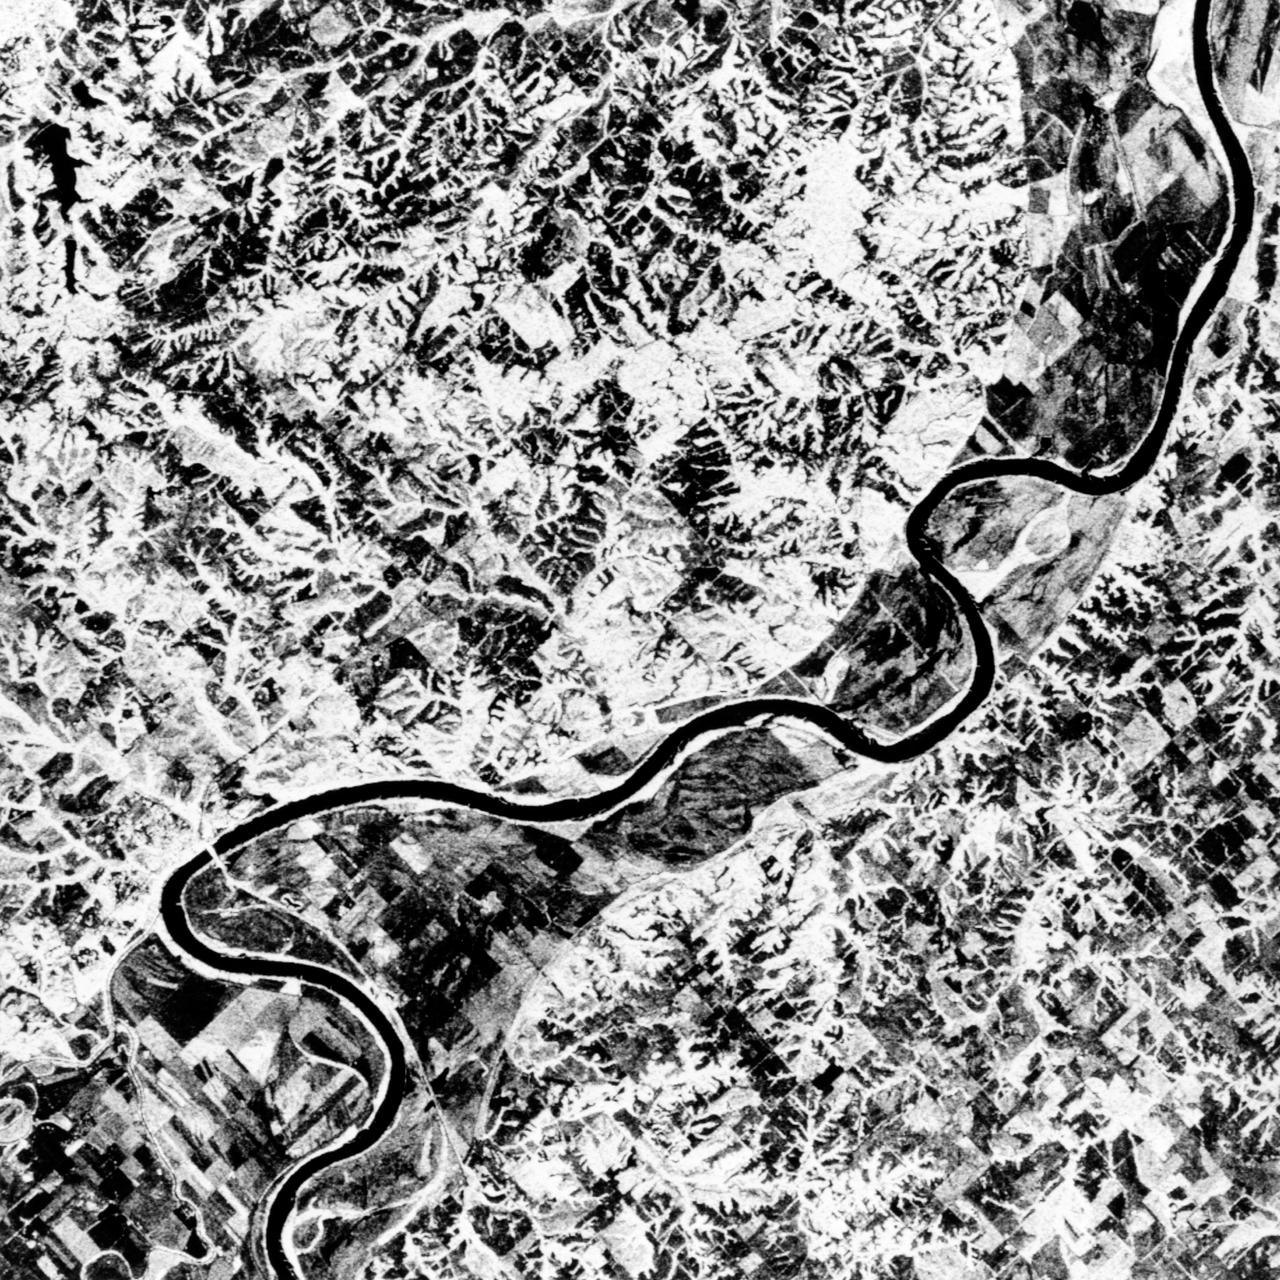
STS068-S-055 (7 October 1994) --- This is a false-color L-Band image of an area near Glasgow, Missouri, centered at about 39.2 degrees north latitude and 92.8 degrees west longitude. The image was acquired using the L-Band radar channel (horizontally transmitted and received and horizontally transmitted and vertically received) polarization's combined. The data were acquired by the Spaceborne Imaging Radar-C/X-Band Synthetic Aperture Radar (SIR-C/X-SAR) aboard the Space Shuttle Endeavour on orbit 50 on October 3, 1994. The area shown is approximately 37 by 25 kilometers (23 by 16 miles). The radar data, coupled with pre-flood aerial photography and satellite data and post-flood topographic and field data, are being used to evaluate changes associated with levee breaks in land forms, where deposits formed during the widespread flooding in 1993 along the Missouri and Mississippi Rivers. The distinct radar scattering properties of farmland, sand fields and scoured areas will be used to inventory flood plains along the Missouri River and determine the processes by which these areas return to preflood conditions. The image shows one such levee break near Glasgow, Missouri. In the upper center of the radar image, below the bend of the river, is a region covered by several meters of sand, shown as dark regions. West (left) of the dark areas, a gap in the levee tree canopy shows the area where the levee failed. Radar data such as these can help scientists more accurately assess the potential for future flooding in this region and how that might impact surrounding communities. Spaceborne Imaging Radar-C/X-Band Synthetic Aperture Radar (SIR-C/X-SAR) is part of NASA's Mission to Planet Earth. The radars illuminate Earth with microwaves, allowing detailed observations at any time, regardless of weather or sunlight conditions. SIR-C/X-SAR uses the three microwave wavelengths: the L-Band (24 centimeters), C-Band (6 centimeters) and X-Band (3 centimeters). The multi-frequency data will be used by the international scientific community to better understand the global environment and how it is changing. The SIR-C/X-SAR data, complemented by aircraft and ground studies, will give scientists clearer insights into those environmental changes which are caused by nature and those changes which are induced by human activity. SIR-C was developed by NASA's Jet Propulsion Laboratory (JPL). X-SAR was developed by the Dornier and Alenia Spazio companies for the German space agency, Deutsche Agentur fuer Raumfahrtangelegenheiten (DARA), and the Italian space agency, Agenzia Spaziale Italiana (ASI), with the Deutsche Forschungsanstalt fuer Luft und Raumfahrt e.v. (DLR), the major partner in science, operations and data processing of X-SAR. (P-44734)
STS059-S-027 (10 April 1994) --- This image is a false-color composite of Raco, Michigan, centered at 46.39 degrees north latitude, 84.88 degrees east longitude. This image was acquired by the Spaceborne Imaging Radar-C and X-Band Synthetic Aperture Radar (SIR-C/X-SAR) aboard the Space Shuttle Endeavour on its 6th orbit and during the first full-capacity test of the instrument. This image was produced using both L-Band and C-Band data. The area shown is approximately 20 kilometers by 50 kilometers. Raco is located at the eastern end of Michigan's upper peninsula, west of Sault Ste. Marie and south of Whitefish Bay on Lake Superior. The site is located at the boundary between the boreal forests and the northern temperate forests, a transitional zone that is expected to be ecologically sensitive to anticipated global changes resulting from climatic warming. On any given day, there is a 60 percent chance that this area will be obscured to some extent by cloud cover which makes it difficult to image using optical sensors. In this color representation (Red=LHH, Green=LHV, Blue=CHH), darker areas in the image are smooth surfaces such as frozen lakes and other non-forested areas. The colors are related to the types of trees and the brightness is related to the amount of plant material covering the surface, called forest biomass. Accurate information about land-cover is important to area resource managers and for use in regional- to global-scale scientific models used to understand global change. SIR-C/X-SAR radars illuminate Earth with microwaves allowing detailed observations at any time, regardless of weather or sunlight conditions. SIR-C/X-SAR uses three microwave wavelengths: L-Band (24 cm), C-Band (6 cm), and X-Band (3 cm). The multi-frequency data will be used by the international scientific community to better understand the global environment and how it is changing. The SIR-C/X-SAR data, complemented by aircraft and ground studies, will give scientists clearer insights into those environmental changes which are caused by nature and those changes which are induced by human activity. SIR-C was developed by NASA's Jet Propulsion Laboratory (JPL). X-SAR was developed by the Dornire and Alenia Spazio Companies for the German Space Agency, Deutsche Agentur fuer Raumfahrtangelegenheiten (DARA), and the Italian Space Agency, Agenzia Spaziale Italiana (ASI). JPL Photo ID: P-43882
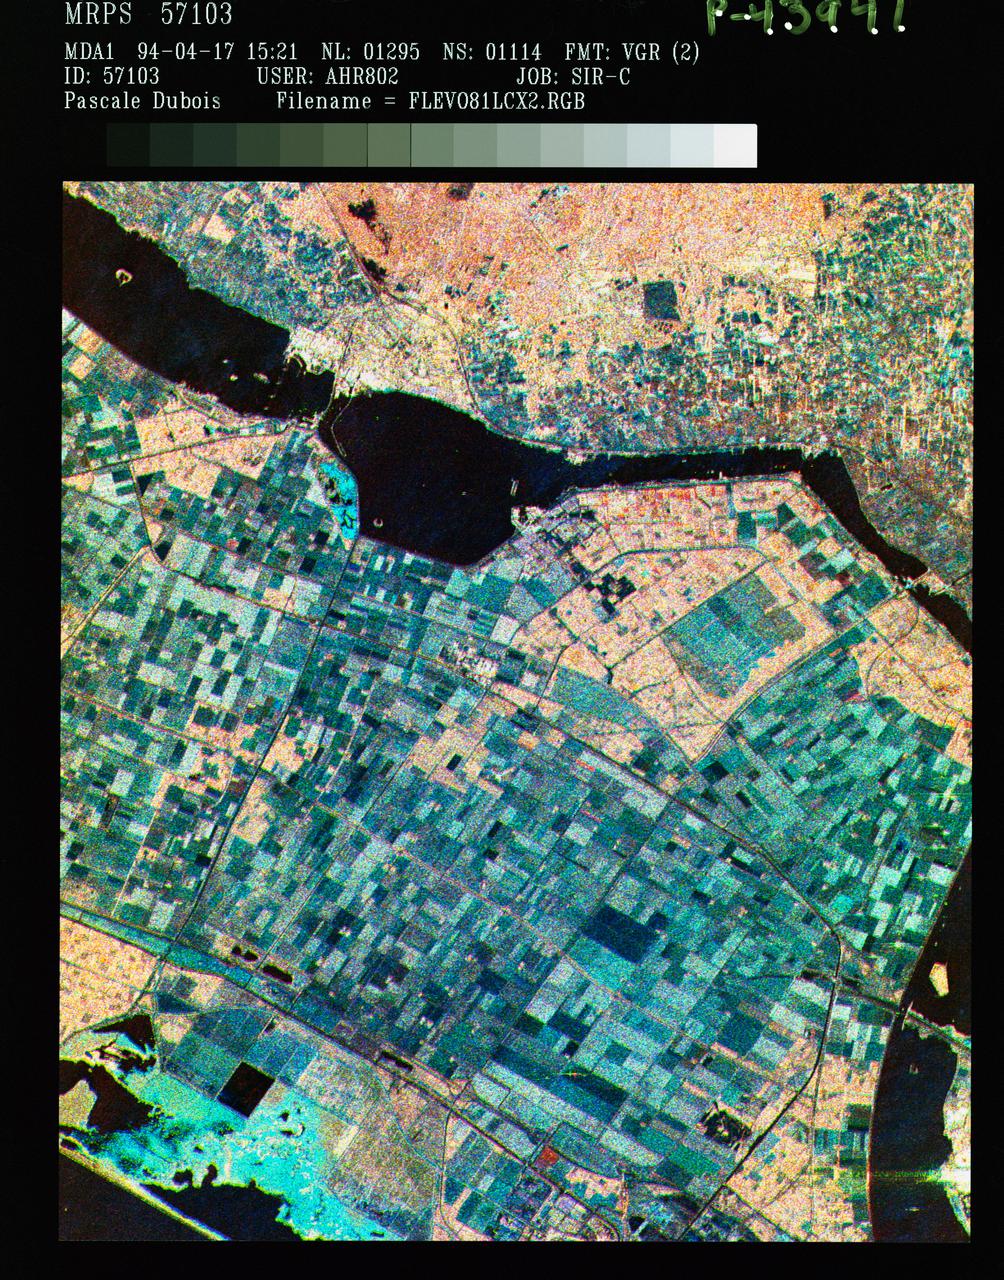
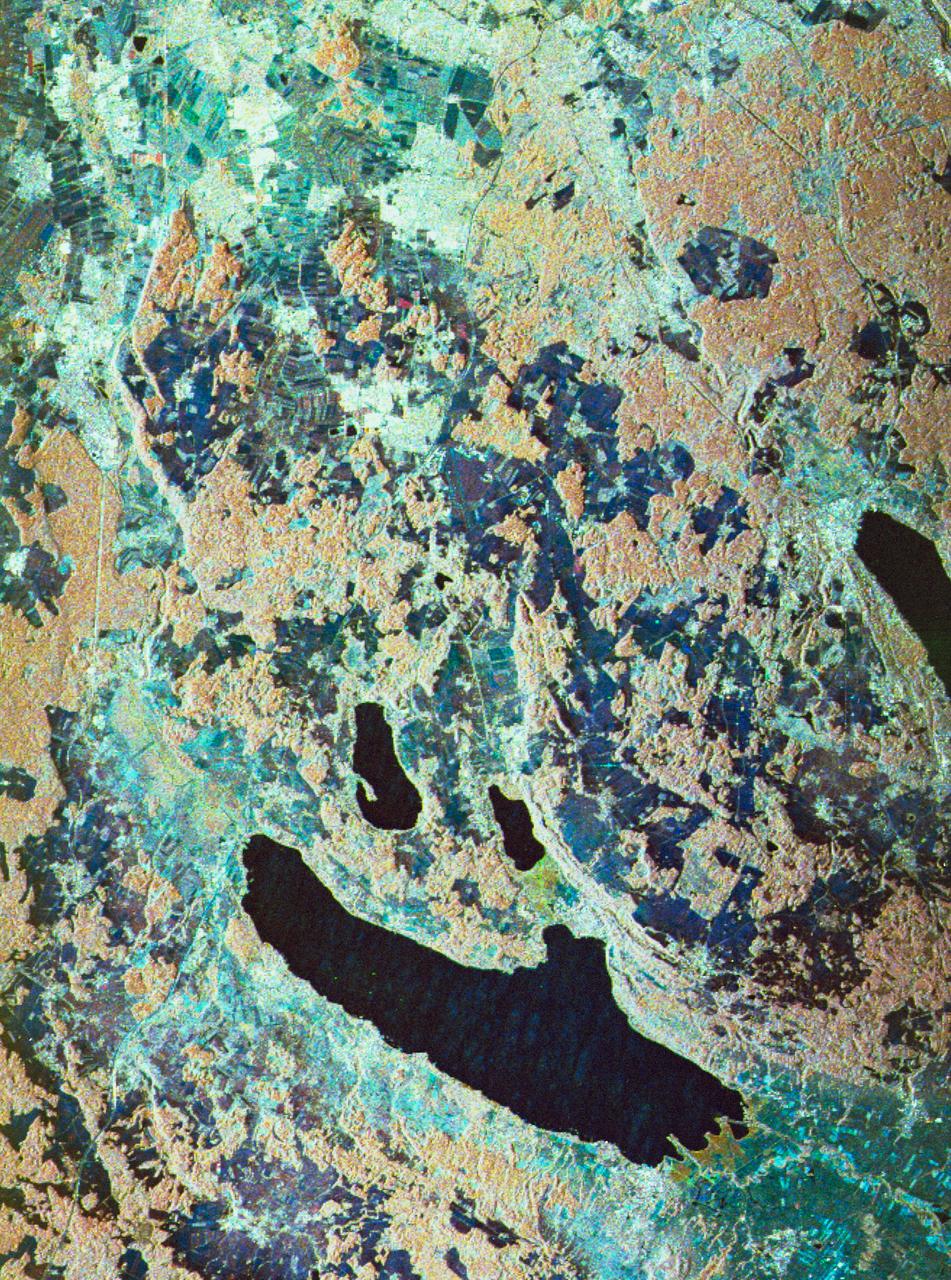
STS059-S-086 (18 April 1994) --- This is a three-frequency false-color image of Flevoland, the Netherlands, centered at 52.4 degrees north latitude, and 5.4 degrees east longitude. This image was acquired by the Spaceborne Imaging Radar-C and X-Band Synthetic Aperture Radar (SIR-C/X-SAR) aboard the Space Shuttle Endeavour on April 14, 1994. It was produced by combining data from the X-Band, C-Band and L-Band radar's. The area shown is approximately 25 by 28 kilometers (15 1/2 by 17 1/2 miles). Flevoland, which fills the lower two-thirds of the image, is a very flat area that is made up of reclaimed land that is used for agriculture and forestry. At the top of the image, across the canal from Flevoland, is an older forest shown in red; the city of Harderwijk is shown in white on the shore of the canal. At this time of the year, the agricultural fields are bare soil, and they show up in this images in blue. The changes in the brightness of the blue areas are equal to the changes in roughness. The dark blue areas are water and the small dots in the canal are boats. This SIR-C/X-SAR supersite is being used for both calibration and agricultural studies. Several soil and crop ground-truth studies will be conducted during the Shuttle flight. In addition, about 10 calibration devices and 10 corner reflectors have been deployed to calibrate and monitor the radar signal. One of these transponders can be seen as a bright star in the lower right quadrant of the image. This false-color image was made using L-Band total power in the red channel, C-Band total power in the green channel, and X-Band VV polarization in the blue channel. SIR-C/X-SAR is part of NASA's Mission to Planet Earth (MTPE). SIR-C/X-SAR radars illuminate Earth with microwaves allowing detailed observations at any time, regardless of weather or sunlight conditions. SIR-C/X-SAR uses three microwave wavelengths: L-Band (24 cm), C-Band (6 cm), and X-Band (3 cm). The multi-frequency data will be used by the international scientific community to better understand the global environment and how it is changing. The SIR-C/X-SAR data, complemented by aircraft and ground studies, will give scientists clearer insights into those environmental changes which are caused by nature and those changes which are induced by human activity. SIR-C was developed by NASA's Jet Propulsion Laboratory (JPL). X-SAR was developed by the Dornire and Alenia Spazio Companies for the German Space Agency, Deutsche Agentur fuer Raumfahrtangelegenheiten (DARA), and the Italian Space Agency, Agenzia Spaziale Italiana (ASI). JPL Photo ID: P-43941
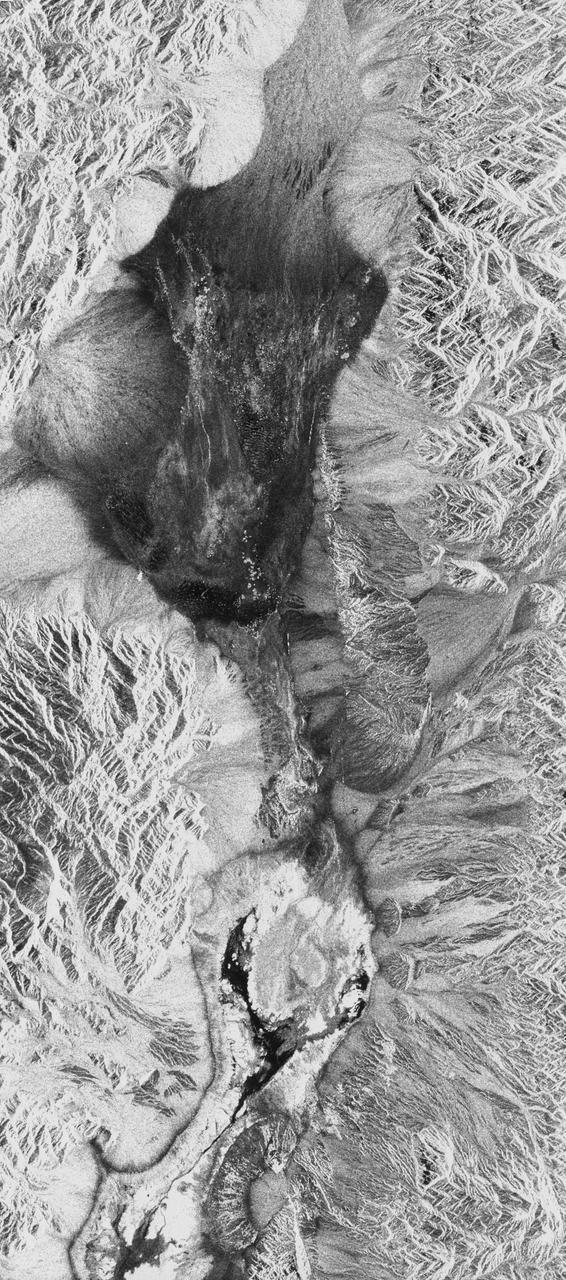
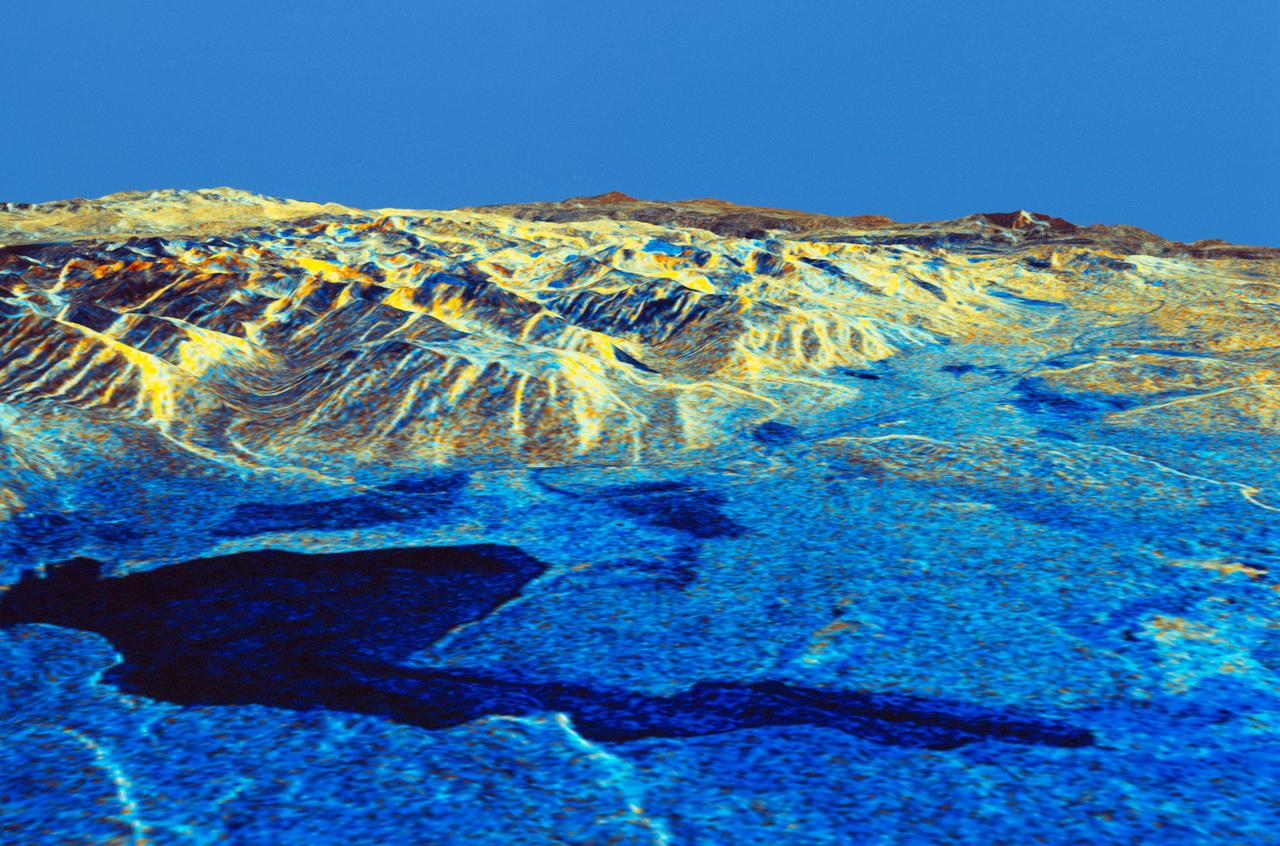
STS059-S-026 (11 April 1994) --- This is an image of Death Valley, California, centered at 36.629 degrees north latitude, 117.069 degrees west longitude. The image shows Furnace Creek alluvial fan and Furnace Creek Ranch at the far right, and the sand dunes near Stove Pipe Wells at the center. The dark fork-shaped feature between Furnace Creek fan and the dunes is a smooth flood-plain which encloses Cottonball Basin. The SIR-C/X-SAR supersite is an area of extensive field investigations and has been visited by both Space Radar Lab astronaut crews. Elevations in the Valley range from 70 meters below sea level, the lowest in the United States, to more than 3300 meters above sea level. Scientists are using SIR-C/X-SAR data from Death Valley to help answer a number of different questions about the Earth's geology. One question concerns how alluvial fans are formed and change through time under the influence of climatic changes and earthquakes. Alluvial fans are gravel deposits that wash down from the mountains over time. They are visible in the image as circular, fan-shaped bright areas extending into the darker valley floor from the mountains. Information about the alluvial fans help scientists study Earth's ancient climate. Scientists know the fans are bulit up through climatic and tectonic processes and they will use the SIR-C/X-SAR data to understand the nature and rates of weathering processes on the fans, soil formation, and the transport of sand and dust by the wind. SIR-C/X-SAR's sensitivity to centimeter-scale (or inch-scale) roughness provides detailed maps of surface texture. Such information can be used to study the occurrence and movement of dust storms and sand dunes. the goal of these studies is to gain a better understanding of the record of past climatic changes and the effects of those changes on a sensitive environment. This may lead to a better ability to predict future response of the land to different potential global cimate-change scenarios. Death Valley is also one of the primary calibration sites for SIR-C/X-SAR. The bright dots near the center of the image are corner reflectors that have been set-up to calibrate the radar as the Shuttle passes overhead. Thirty triangular-shaped reflectors (they look like aluminum pyramids) have been deployed by the calibration team from JPL over a 40 kilometer by 40 kilometer area in and around Death Valley. The calibration team will also deploy transponders (electronic reflectors) and recievers to measure the radar signals from SIR-C/X-SAR on the ground. Spaceborne Imaging Radar-C and X-Synthetic Aperture Radar (SIR-C/X-SAR) is part of NASA's Mission to Planet Earth (MTPE). The radars illuminate Earth with microwaves allowing detailed observations at any time, regardless of weather or sunlight conditions. SIR-C/X-SAR uses three microwave wavelengths: L-Band (24 cm), C-Band (6 cm), and X-Band (3 cm). The multi-frequency data will be used by the international scientific community to better understand the global environment and how it is changing. The SIR-C/X-SAR data, complemented by aircraft and ground studies, will give scientists clearer insights into those environmental changes which are caused by nature and those changes which are induced by human activity. SIR-C was develpoed by NASA's Jet Propulsion Laboratory (JPL). X-SAR was developed by the Dornire and Alenia Spazio Companies for the German Space Agency, Deutsche Agentur fuer Raumfahrtangelegenheiten (DARA), and the Italian Space Agency, Agenzia Spaziale Italiana (ASI). JPL Photo ID: P-43883
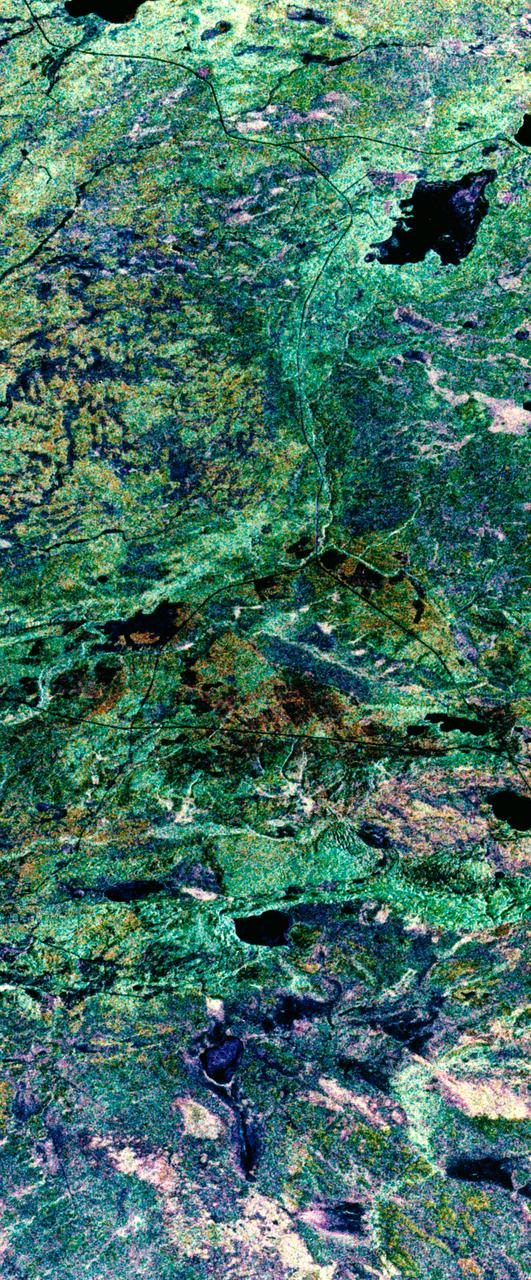
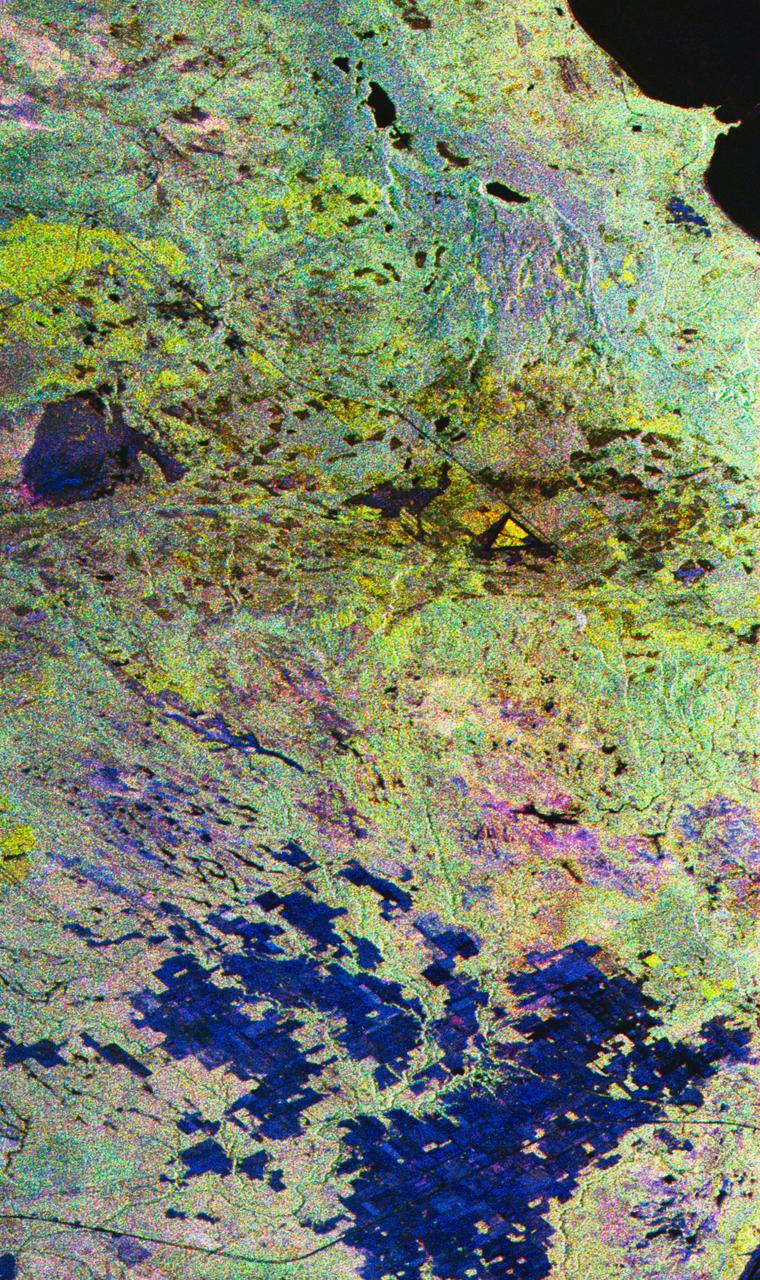
STS059-S-039 (11 April 1994) --- This is a false-color composite of Prince Albert, Canada, centered at 53.91 north latitude and 104.69 west longitude. This image was acquired by the Spaceborne Imaging Radar-C and X-Band Synthetic Aperture Radar (SIR-C/X-SAR) aboard the Space Shuttle Endeavour on its 20th orbit. The area is located 40 kilometers (25 miles) north and 30 kilometers (20 miles) east of the town of Prince Albert in the Saskatchewan province of Canada. The image covers the area east of the Candle Lake, between gravel surface Highways 120 and 106 and west of 106. The area in the middle of the image covers the entire Nipawin (Narrow Hills) provincial park. The look angle of the radar is 30 degrees and the size of the image is approximately 20 kilometers by 50 kilometers (12 by 30 miles). The image was produced by using only the L-Band. The three polarization channels HH, HV and VV are illustrated by red, green and blue respectively. The changes in the intensity of each color are related to various surface conditions such as variations in forest stands, frozen or thawed condition of the surface, disturbances (fire and deforestation), and areas of re-growth. Most of the dark areas in the image are the ice-covered lakes in the region. The dark area on the top right corner of the image is the White Gull Lake north of the intersection of Highway 120 and 913. The right middle part of the image shows Lake Ispuchaw and Lower Fishing Lake. The deforested areas are also shown by dark areas in the image. Since most of the logging practice at the Prince Albert area is around the major highways, the deforested areas can be easily detected as small geometrically shaped dark regions along the roads. At the time of the SIR-C/X-SAR overpass, a major part of the forest is either frozen or undergoing the spring thaw. The L-Band HH shows a high return in the jack pine forest. The reddish areas in the image are old jack pine forest, 12-17 meters (40-55 feet) in height and 60-75 years old. The orange-greenish areas are young jack pine trees, 3-5 meters (10-16 feet) in height and 11-16 years old. The green areas are due to the relative high intensity of the HV channel which is strongly correlated with the amount of biomass. L-Band HV channel shows the biomass variations over the entire region. Most of the green areas, when compared to the forest cover maps are identified as black spruce trees. The dark blue and dark purple colors show recently harvested or re-growth areas respectively. SIR-C/X-SAR is part of NASA's Mission to Planet Earth (MTPE). SIR-C/X-SAR radars illuminate Earth with microwaves allowing detailed observations at any time, regardless of weather or sunlight conditions. SIR-C/X-SAR uses three microwave wavelengths: L-Band (24 cm), C-Band (6 cm), and X-Band (3 cm). The multi-frequency data will be used by the international scientific community to better understand the global environment and how it is changing. The SIR-C/X-SAR data, complemented by aircraft and ground studies, will give scientists clearer insights into those environmental changes which are caused by nature and those changes which are induced by human activity. SIR-C was developed by NASA's Jet Propulsion Laboratory (JPL). X-SAR was developed by the Dornire and Alenia Spazio Companies for the German Space Agency, Deutsche Agentur fuer Raumfahrtangelegenheiten (DARA), and the Italian Space Agency, Agenzia Spaziale Italiana (ASI). JPL Photo ID: P-43886
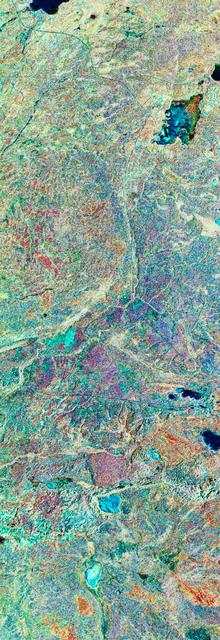
STS059-S-080 (18 April 1994) --- This is a false-color three frequency image of the Oberpfaffenhofen supersite, an area just south-west of Munich in southern Germany. The colors show the different conditions that the three radars (X-Band, C-Band and L-Band) can see on the ground. The image covers a 27 by 36 kilometer area. The center of the site is 48.09 degrees north and 11.29 degrees east. The image was acquired by the Spaceborne Imaging Radar-C and X-Band Synthetic Aperture Radar (SIR-C/X-SAR) onboard the Space Shuttle Endeavour on April 11, 1994. The dark area on the left is Lake Ammersee. The two smaller lakes are the Woerthsee and the Pilsensee. On the bottom is the tip of the Starnbergersee. The city of Munich is located just beyond the right of the image. The Oberpfaffenhofen supersite is the major test site for SIR-C/X-SAR calibration and scientific investigations concerning agriculture, forestry, hydrology and geology. This color composite image is a three frequency overlay. L-Band total power was assigned red, the C-Band total power is shown in green and the X-Band VV polarization appears blue. The colors on the image stress the differences between the L-Band, C-Band, X-Band images. If the three radar antennas were getting an equal response from objects on the ground, this image would appear in black and white. However, in this image, the blue areas corresponds to area for which the X-Band backscatter is relatively higher than the backscatter at L and C-Bands. This behavior is characteristic of grasslands, clear cuts and shorter vegetation. Similarly, the forested areas have a reddish tint (L-Band). The green areas seen near both the Ammersee and the Pilsensee lakes indicate marshy areas. The agricultural fields in the upper right hand corner appear mostly in blue and green (X-Band and C-Band). The white areas are mostly urban areas, while the smooth surfaces of the lakes appear very dark. SIR-C/X-SAR is part of NASA's Mission to Planet Earth (MTPE). SIR-C/X-SAR radars illuminate Earth with microwaves allowing detailed observations at any time, regardless of weather or sunlight conditions. SIR-C/X-SAR uses three microwave wavelengths: L-Band (24 cm), C-Band (6 cm), and X-Band (3 cm). The multi-frequency data will be used by the international scientific community to better understand the global environment and how it is changing. The SIR-C/X-SAR data, complemented by aircraft and ground studies, will give scientists clearer insights into those environmental changes which are caused by nature and those changes which are induced by human activity. SIR-C was developed by NASA's Jet Propulsion Laboratory (JPL). X-SAR was developed by the Dornire and Alenia Spazio Companies for the German Space Agency, Deutsche Agentur fuer Raumfahrtangelegenheiten (DARA), and the Italian Space Agency, Agenzia Spaziale Italiana (ASI). JPL Photo ID: P-43930
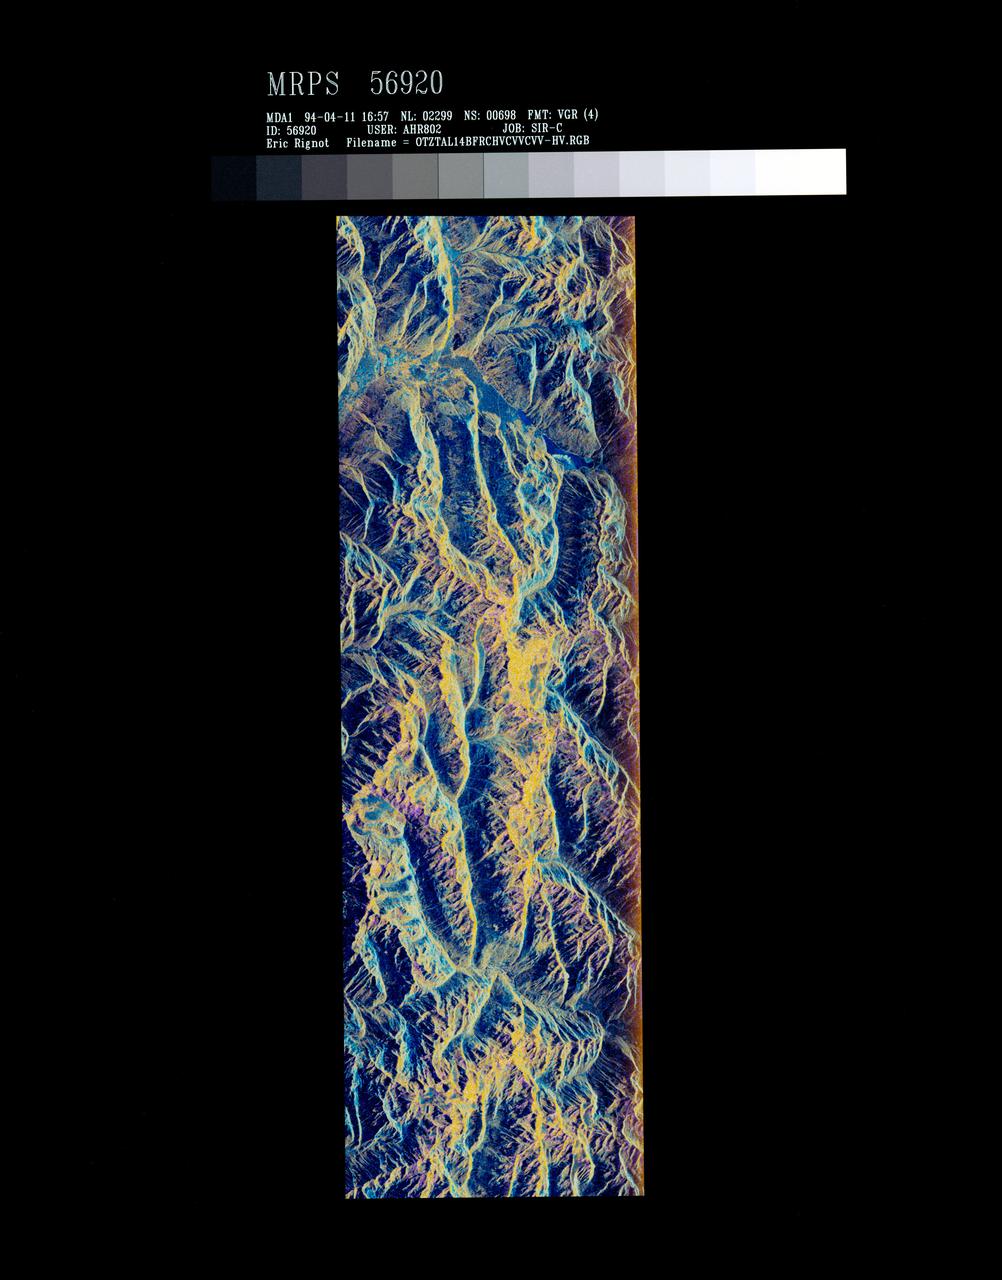
STS059-S-072 (13 April 1994) --- This image is a false-color composite of Oetztal, Austria located in the Central Alps, centered at 46.8 degrees north latitude, and 10.70 degrees east longitude, at the border between Switzerland (top), Italy (left) and Austria (right and bottom). The area shown is 50 kilometers (30 miles) south of Innsbruck, Austria. This image was acquired by the Spaceborne Imaging Radar-C and X-Band Synthetic Aperture Radar (SIR-C/X-SAR) aboard the Space Shuttle Endeavour on its 14th orbit. Oetztal is a SIR-C/X-SAR hydrology supersite. Approximately one quarter of this image is covered by glaciers, the largest of which, Gepatschferner, is visible as a triangular yellow patch in the center of the scene. The summits of the main peaks reach elevations between 3,500 and 3,768 meters (11,500 and 12,362 feet) above sea level. The tongues of the glaciers are descending from elevated plateaus down into narrow valleys which were formed during the last ice age. This color image was produced in C-Band using multi-polarization information (Red=CHV, Green=CVV, Blue=CVV/CHV). The blue areas are lakes (Gepatsch Dam at center right; Lake Muta at top right) and glacier ice. The yellow areas are slopes facing the radar and areas of dry snow. Purple corresponds to slopes facing away from the radar. Yellow in the valley bottom corresponds to tree covered areas. There is 30 to 50 centimeters (12 to 20 inches) of dry, fresh snow on the glaciers, and about 10 centimeters (4 inches) in the valley at the city of Vent, Austria (center). At these data were taken, the weather was cold, with snow and thick fog. The entire area would appear white to an optical sensor because it is all covered under a winter snowpack. Researchers are interested in Oetztal because knowing how glaciers shrink and grow over time is an important indication of climatic change. SIR-C/X-SAR is part of NASA's Mission to Planet Earth (MTPE). SIR-C/X-SAR radars illuminate Earth with microwaves allowing detailed observations at any time, regardless of weather or sunlight conditions. SIR-C/X-SAR uses three microwave wavelengths: L-Band (24 cm), C-Band (6 cm), and X-Band (3 cm). The multi-frequency data will be used by the international scientific community to better understand the global environment and how it is changing. The SIR-C/X-SAR data, complemented by aircraft and ground studies, will give scientists clearer insights into those environmental changes which are caused by nature and those changes which are induced by human activity. SIR-C was developed by NASA's Jet Propulsion Laboratory (JPL). X-SAR was developed by the Dornire and Alenia Spazio Companies for the German Space Agency, Deutsche Agentur fuer Raumfahrtangelegenheiten (DARA), and the Italian Space Agency, Agenzia Spaziale Italiana (ASI). JPL Photo ID: P-43890
STS059-S-079 (18 April 1994) --- This is a false-color, three frequency image of Prince Albert, Canada, centered at 53.91 north latitude and 104.69 west longitude. It was produced using data from the X-Band, C-Band and L-Band radars that comprise the Spaceborne Imaging Radar-C and X-Band Synthetic Aperture Radar (SIR-C/X-SAR). SIR-C/X-SAR acquired this image on the 20th orbit of the Space Shuttle Endeavour. The area is located 40 kilometers north and 30 kilometers east of the town of Prince Albert in the Saskatchewan province of Canada. The image covers the area east of the Candle Lake, between gravel surface Highways 120 and 106 and west of 106. The area in the middle of the image covers the entire Nipawin (Narrow Hills) provincial park. The look angle of the radar is 30 degrees and the size of the image is approximately 20 by 50 kilometers. The red, green, and blue colors represent L-Band total power, C-Band total power, and XVV respectively. The changes in the intensity of each color are related to various surface conditions such as frozen or thawed forest, fire, deforestation and areas of regrowth. Most of the dark blue areas in the image are the ice covered lakes. The dark area on the top right corner of the image is the White Gull Lake north of the intersection of Highway 120 and 913. The right middle part of the image shows Lake Ispuchaw and Lower Fishing Lake. The deforested areas are shown by light blue in the image. Since most of the logging practice at the Prince Albert area is around the major highways, the deforested areas can be easily detected as small geometrically shaped dark regions along the roads. At the time these data were taken, a major part of the forest was either frozen or undergoing the spring thaw. In such conditions, due to low volume of water in the vegetation, a deeper layer of the canopy is imaged by the radar, revealing valuable information about the type of trees, the amount of vegetation biomass and the condition of the surface. As the frequency increases, the penetration depth in the canopy decreases. Over forest canopies, the X-Band radar contains information about the top of the canopy. Whereas, C-Band and L-Band radar returns show contributions from the crown and trunk areas respectively. The bright areas in the image are dense mixed aspen and old jackpine forests where the return from all three bands is high. The reddish area corresponds to more sparse old jack pine (12 to 17 meters in height and 60 to 75 years old) where the L-Band signal penetrates deeper in the canopy and dominates C-Band and X-Band returns. Comparison of the image with the forest cover map of the area indicates that the three band radar can be used to classify various stands. SIR-C/X-SAR is part of NASA's Mission to Planet Earth (MTPE). SIR-C/X-SAR radars illuminate Earth with microwaves allowing detailed observations at any time, regardless of weather or sunlight conditions. SIR-C/X-SAR uses three microwave wavelengths: L-Band (24 cm), C-Band (6 cm), and X-Band (3 cm). The multi-frequency data will be used by the international scientific community to better understand the global environment and how it is changing. The SIR-C/X-SAR data, complemented by aircraft and ground studies, will give scientists clearer insights into those environmental changes which are caused by nature and those changes which are induced by human activity. SIR-C was developed by NASA's Jet Propulsion Laboratory (JPL). X-SAR was developed by the Dornire and Alenia Spazio Companies for the German Space Agency, Deutsche Agentur fuer Raumfahrtangelegenheiten (DARA), and the Italian Space Agency, Agenzia Spaziale Italiana (ASI). JPL Photo ID: P-43929