
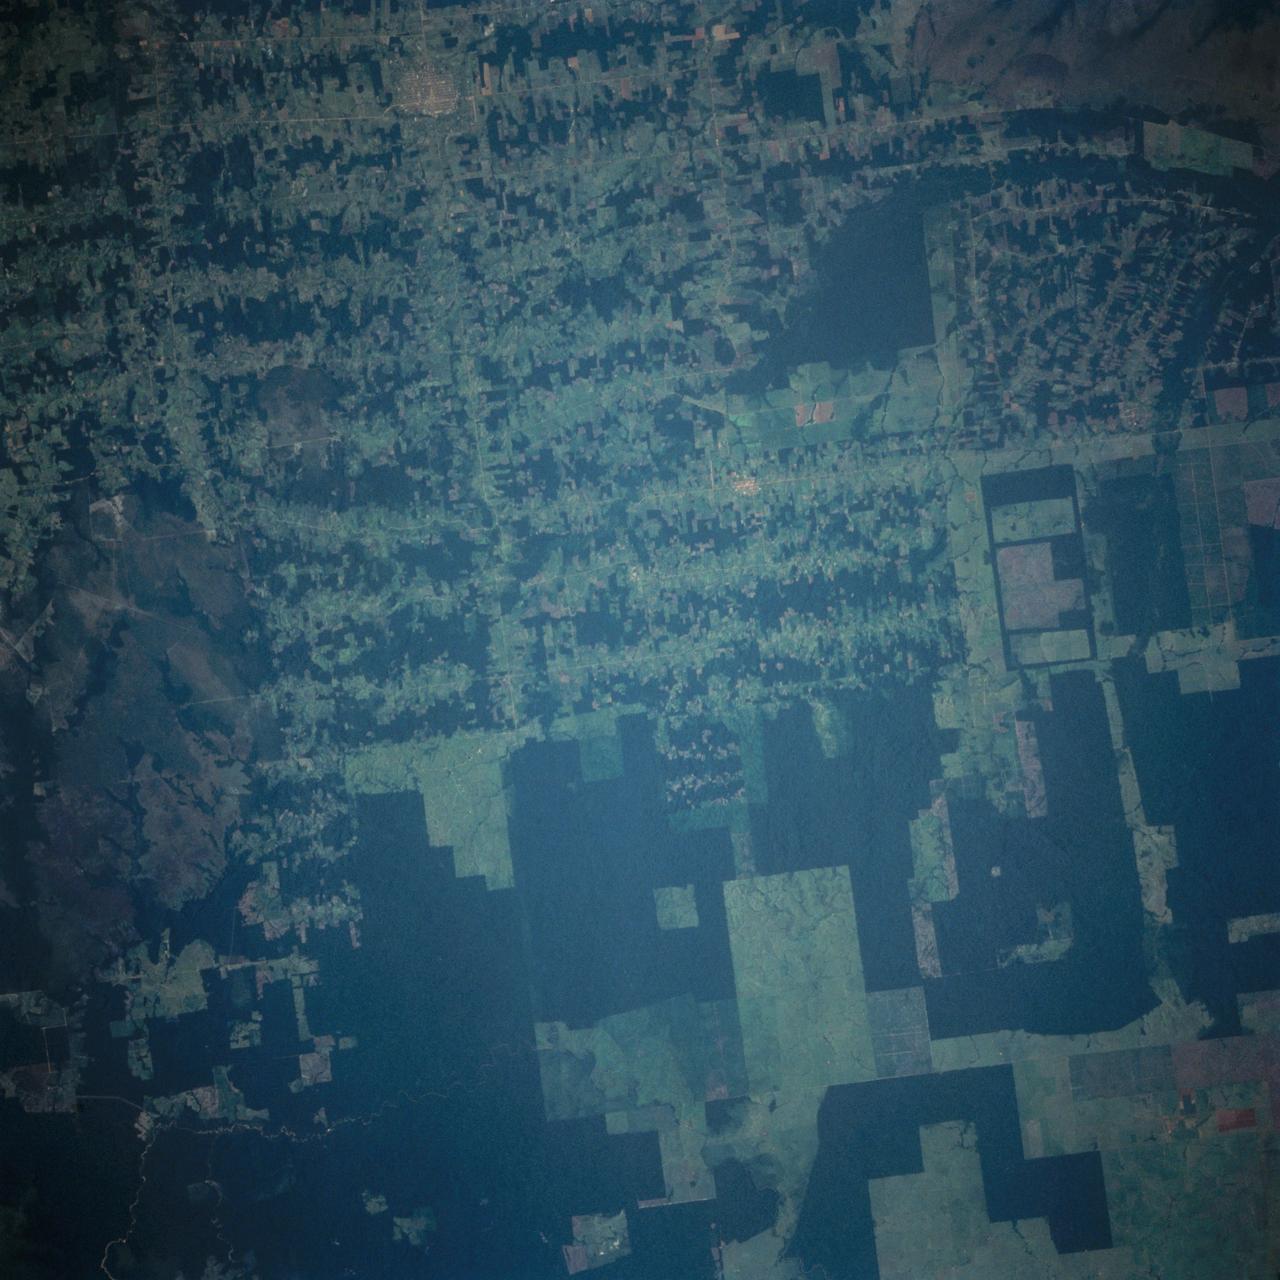
This view of deforestation in Rondonia, far western Brazil, (10.0S, 63.0W) is part of an agricultural resettlement project which ultimately covers an area about 80% the size of France. The patterns of deforestation in this part of the Amazon River Basin are usually aligned adjacent to highways, secondary roads, and streams for ease of access and transportation. Compare this view with the earlier 51G-37-062 for a comparison of deforestation in the region.
This high oblique view shows the majority of the island of Madagascar (19.0S, 47.5E). This Texas sized island is now largely deforested and is suffering from severe soil erosion as well as a declining biological species diversity and productivity. At the turn of the century, the island was almost totally forested but now, forests cover only about 10 percent of the surface. Evidence of soil erosion can be seen in the offshore sediment plumes.
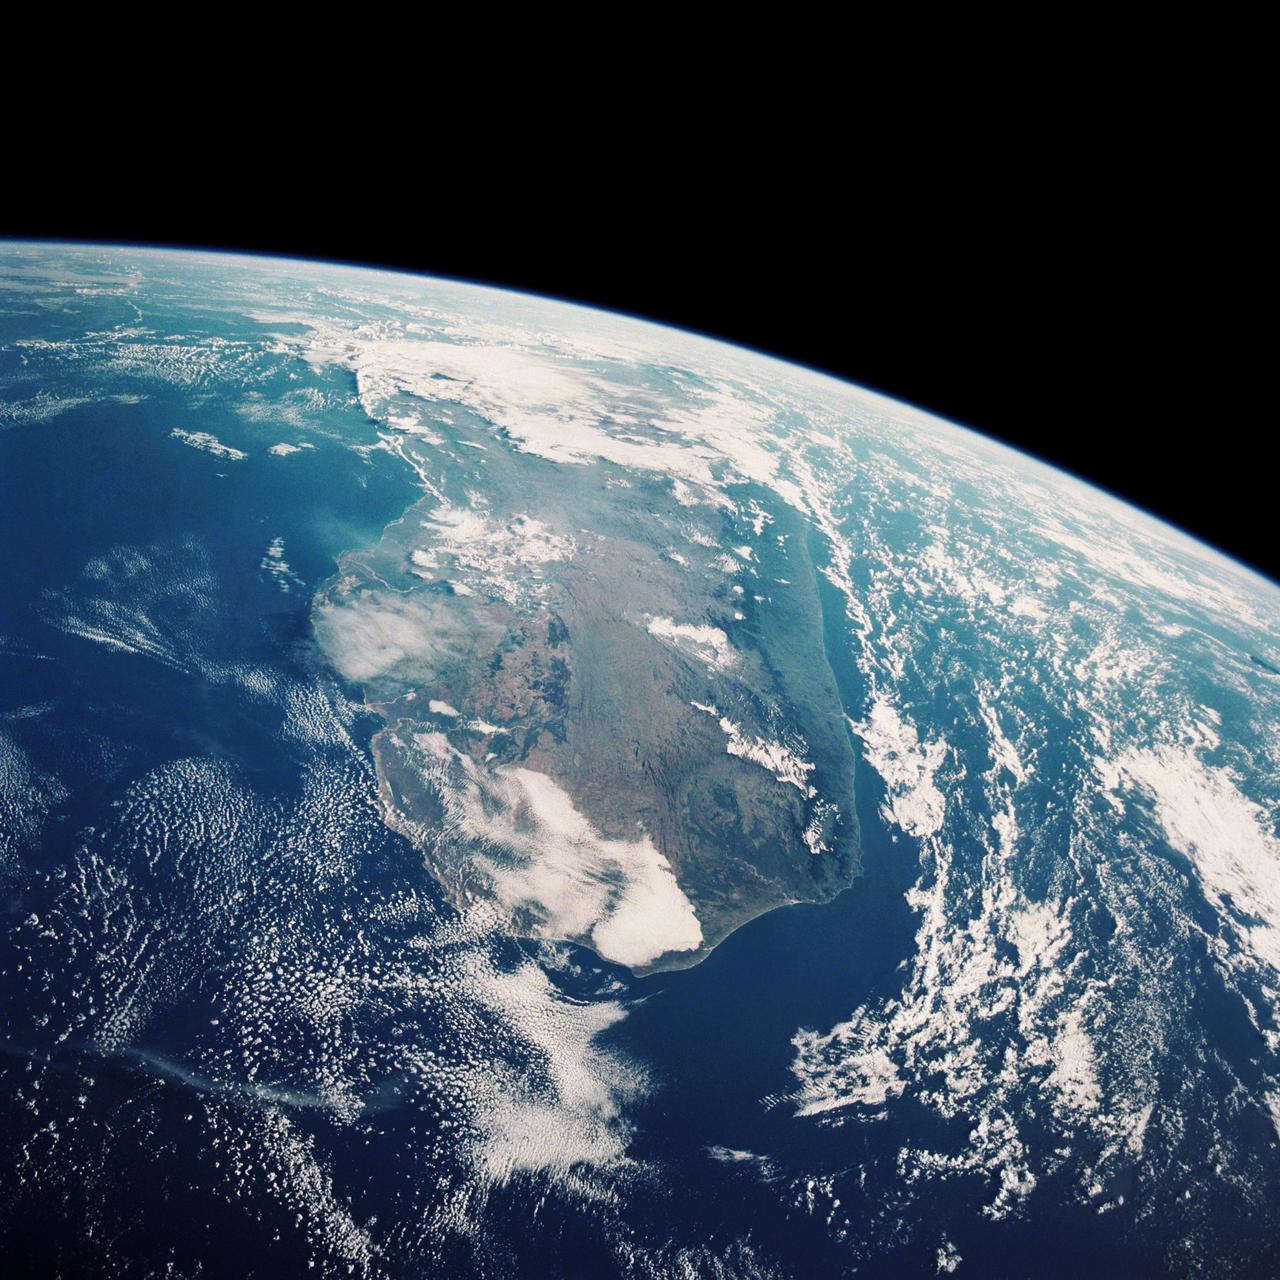
STS033-82-103 (22-27 Nov. 1989) --- This oblique view of the southern half of Madagascar was taken by the crew members of the Space Shuttle Discovery as they orbited Earth at an altitude of 289 nautical miles.
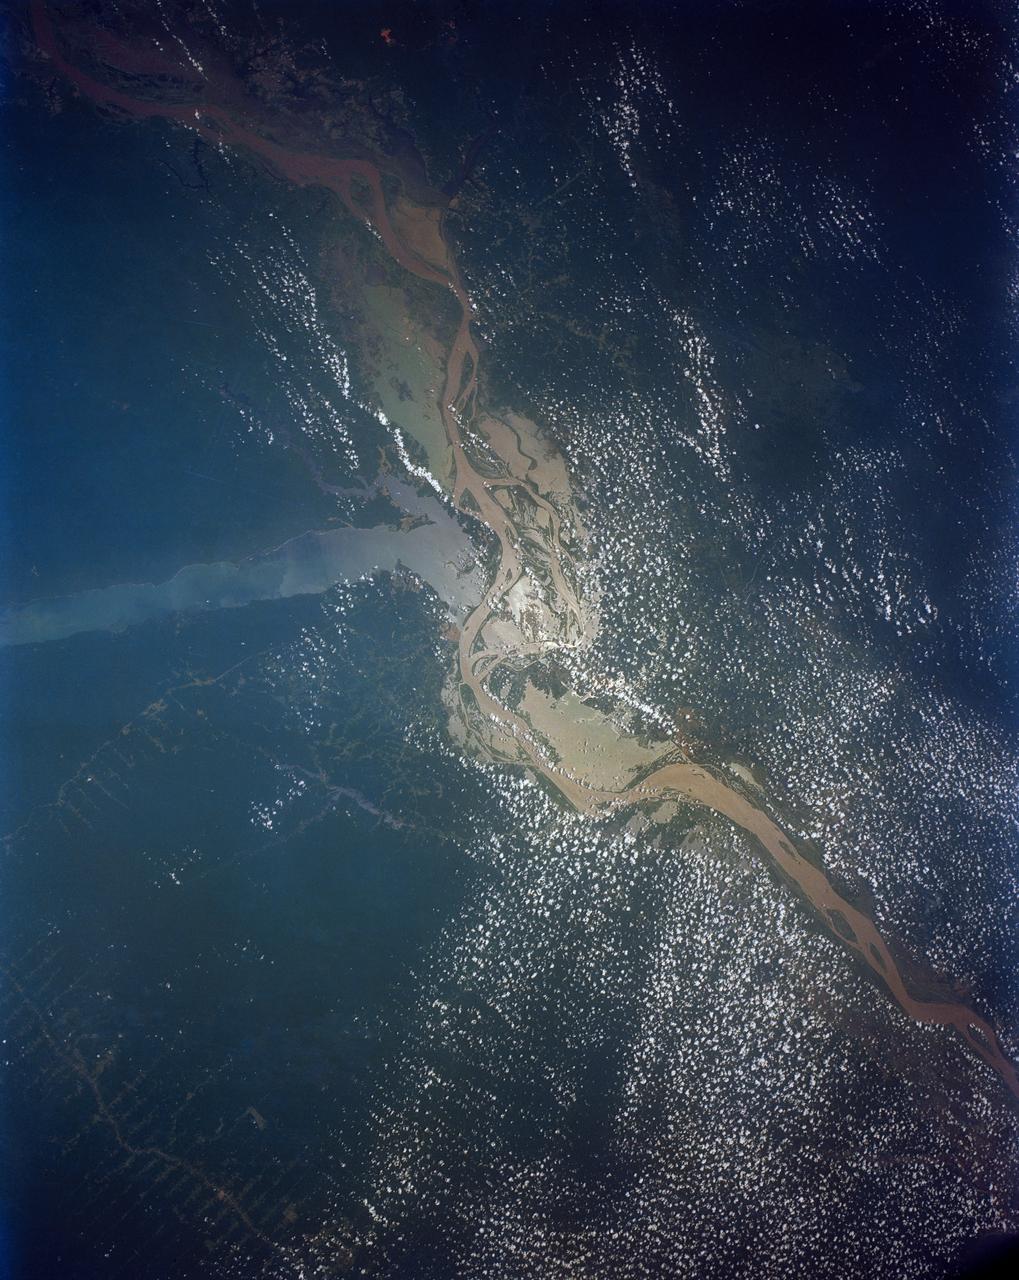
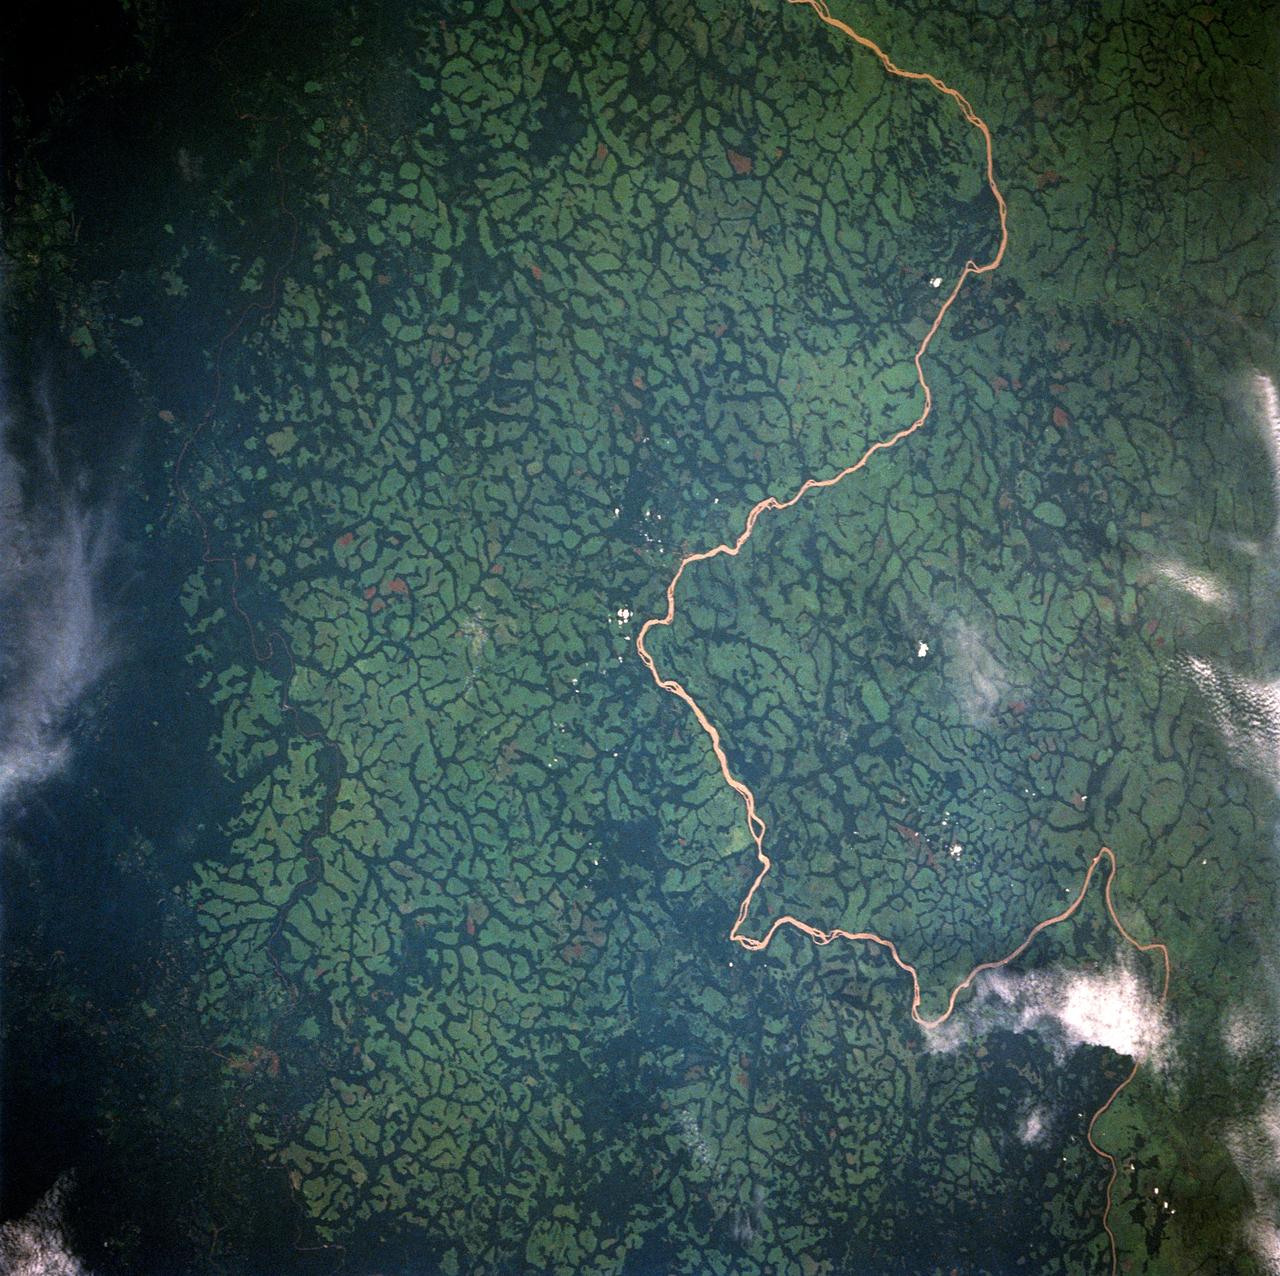
This view shows the confluence of the Amazon and the Topajos Rivers at Santarem, Brazil (2.0S, 55.0W). The Am,azon flows from lower left to upper right of the photo. Below the river juncture of the Amazon and Tapajos, there is considerable deforestation activity along the Trans-Amazon Highway.
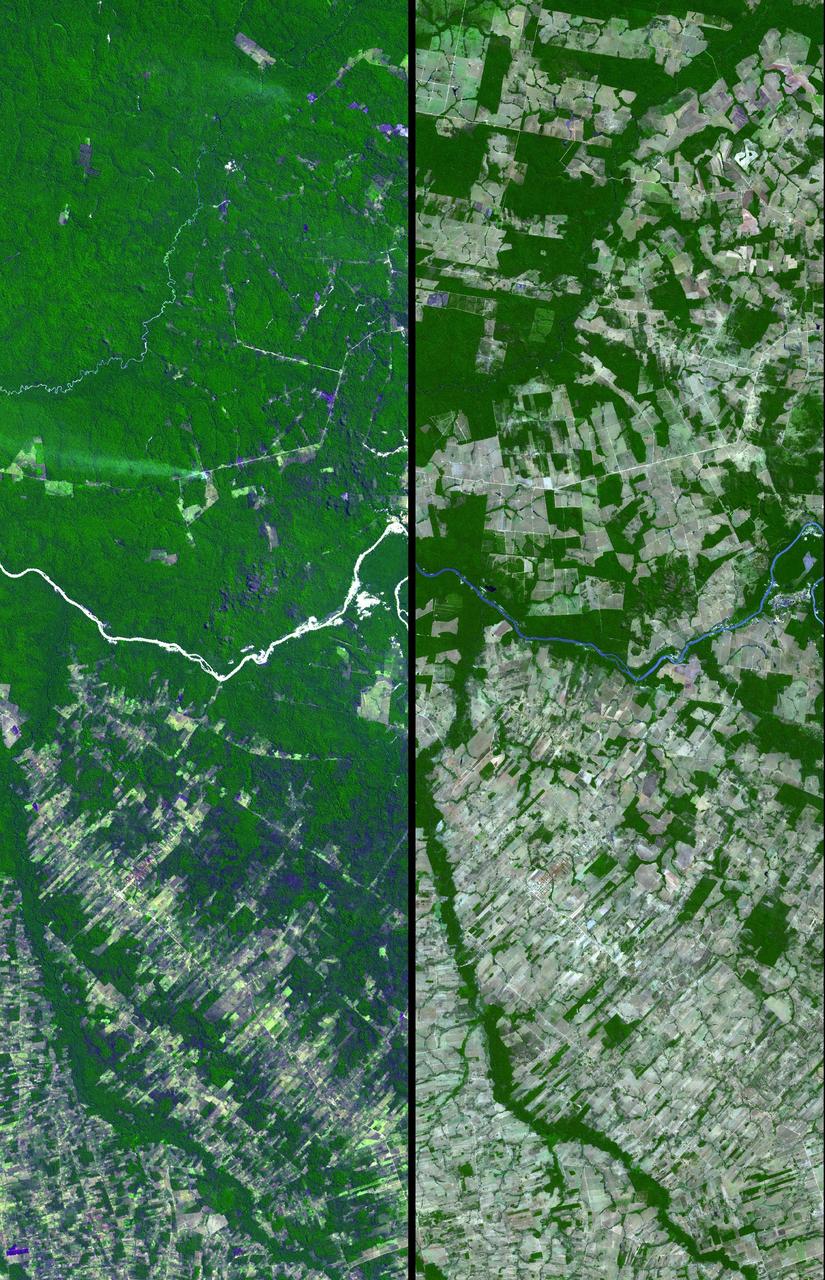
Dense green vegetation gives way to pale fields in these satellite images of deforestation in Brazil Amazon rainforest. This image is from NASA Terra satellite.

Craig DeForest, a staff scientist at the Southwest Research Institute in Boulder, Colo., speaks during a press briefing, Thursday, Aug. 18, 2011, at NASA Headquarters in Washington. The briefing was held to discusses new details about the structure of solar storms and the impact they have on Earth. The new information comes from NASA's Solar Terrestrial Relations Observatory, or STEREO, spacecraft and other NASA probes. Photo Credit: (NASA/GSFC/Rebecca Roth)
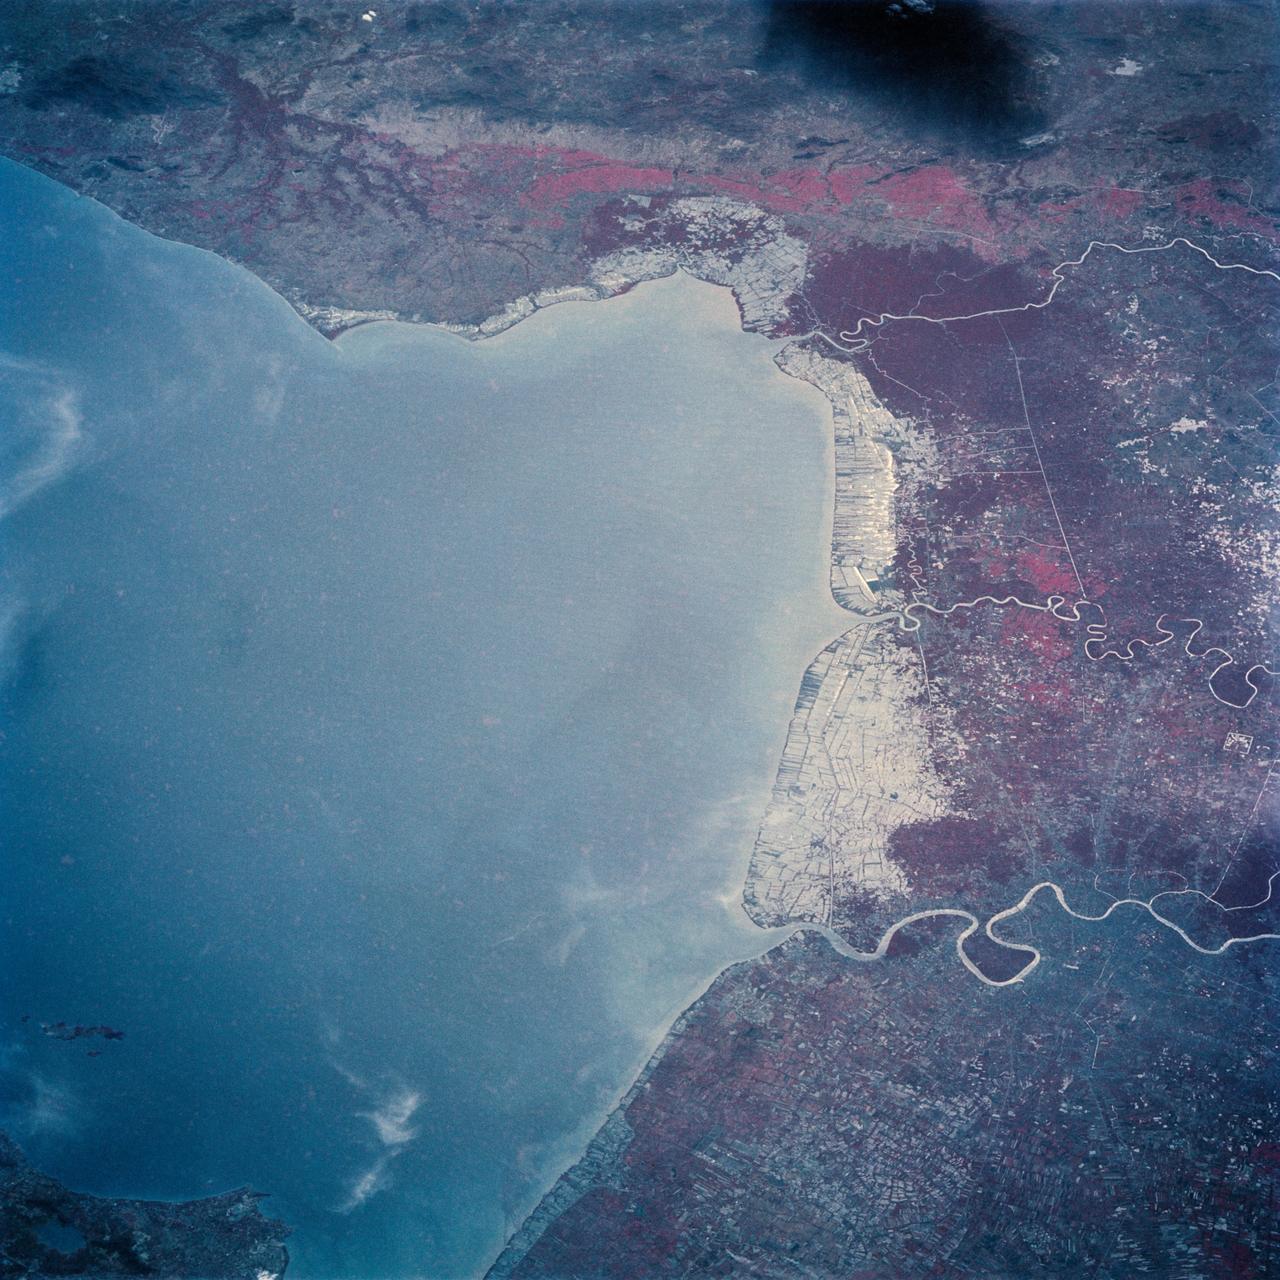
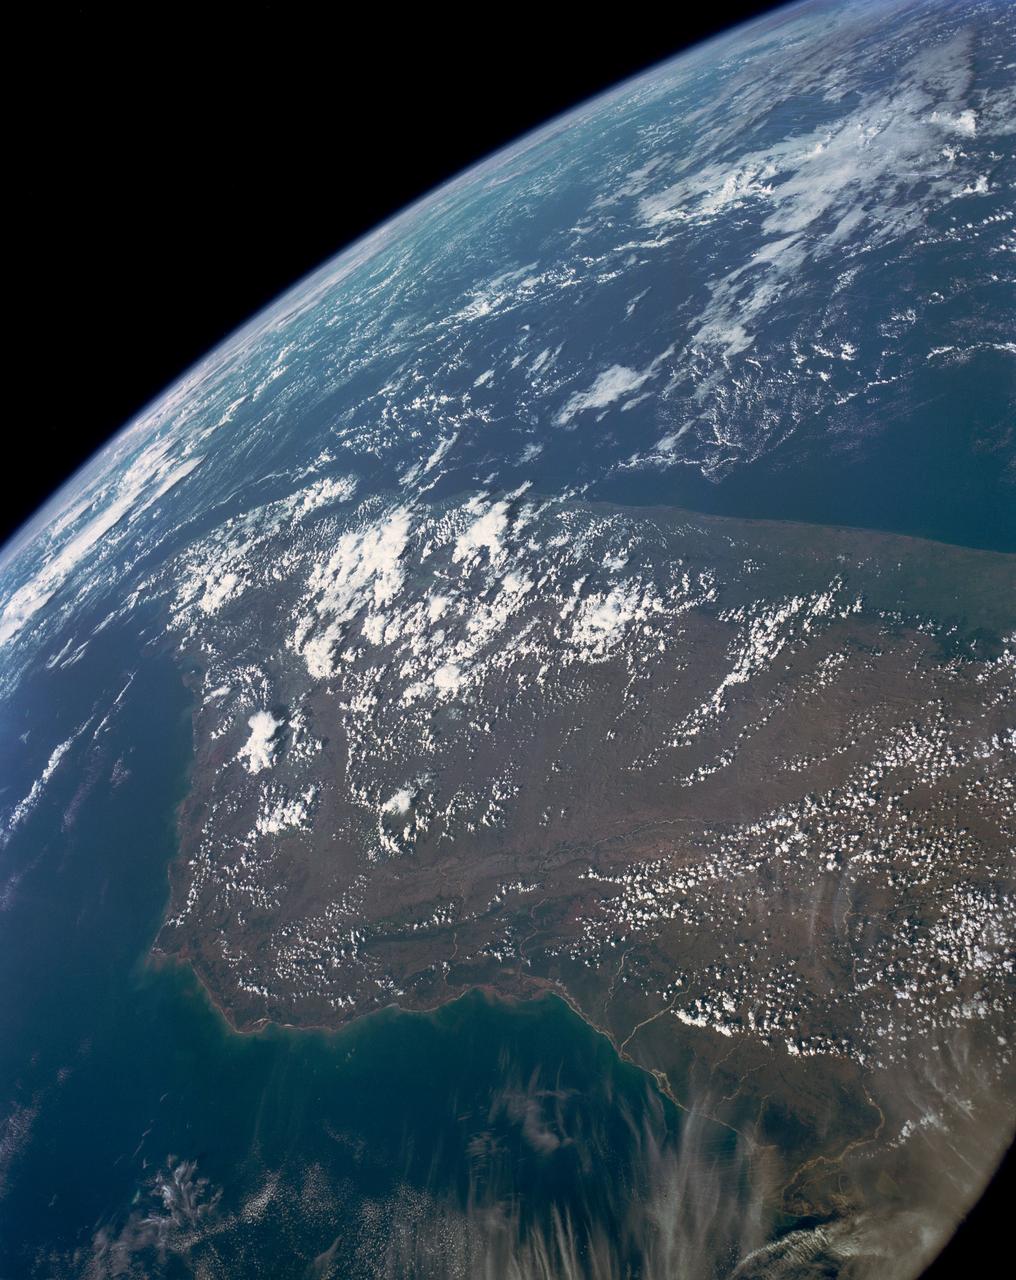
The Bight of Bangkok and the city of Bangkok, Thailand are visible in this west looking view. The city of Bangkok, with an estimated population in excess of 3.7 million people, can be seen in the lower right-hand corner of the view. The city, famous as a jewelry trading center, dealing in precious stones and silver and bronze ware, is situated in a vast lowland. This lowland is a major rice growing area interspersed with canals used for irrigation and drainage. Rice is a major export commodity of Thailand. The deforested hills of the Bilauktaung Range can be seen at the top of the view.
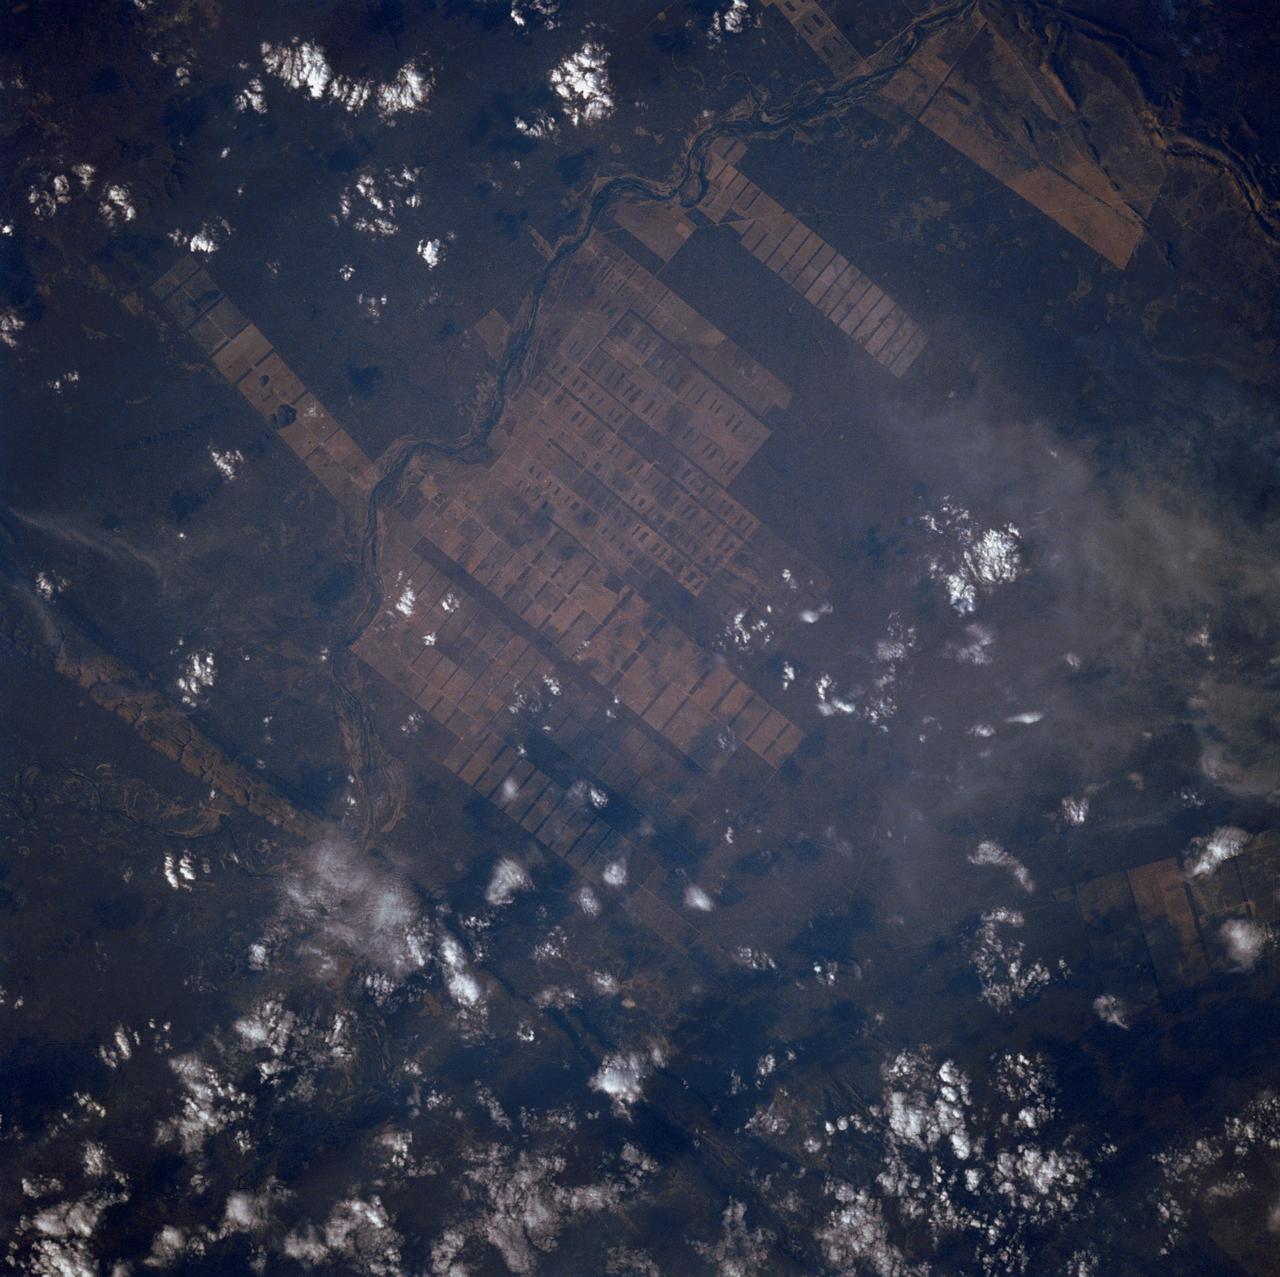
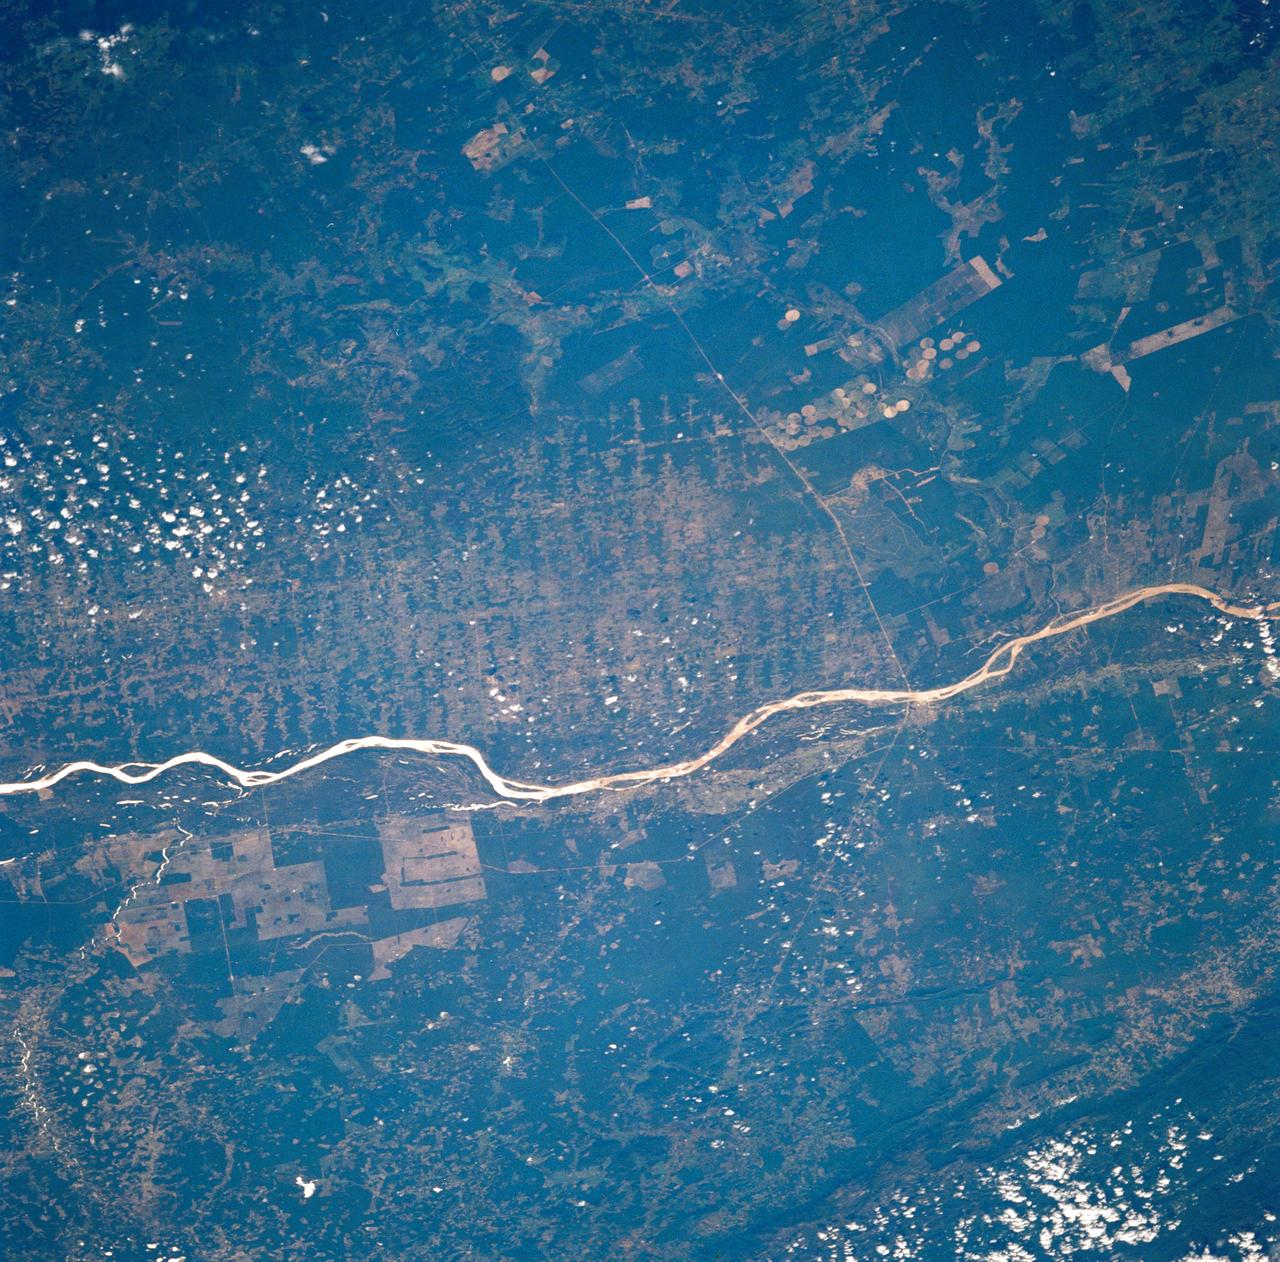
This near vertical photograph illustrates the differences in agricultural land patterns typically seen in many parts of southwestern Brazil, near the Bolivian border. The larger rectangular field patterns reflect a mature, fully developed agricultural environment. The smaller areas are less well defined and indicate new agricultural development.

Madhulika Guhathakurta, seated left, STEREO program scientist, speaks during a press briefing, Thursday, Aug. 18, 2011, at NASA Headquarters in Washington as Craig DeForest, David Webb and Alysha Reinard, look on. The briefing was held to discusses new details about the structure of solar storms and the impact they have on Earth. The new information comes from NASA's Solar Terrestrial Relations Observatory, or STEREO, spacecraft and other NASA probes. Photo Credit: (NASA/GSFC/Rebecca Roth).

Craig DeForest, second from left, speaks during a press briefing, Thursday, Aug. 18, 2011, at NASA Headquarters in Washington as Madhulika Guhathakurta, left, David Webb and Alysha Reinard look on. The briefing was held to discusses new details about the structure of solar storms and the impact they have on Earth. The new information comes from NASA's Solar Terrestrial Relations Observatory, or STEREO, spacecraft and other NASA probes. Photo Credit: (NASA/GSFC/Rebecca Roth)
The large field patterns in this view of the Rio Sao Francisco basin, Brazil, South America, (11.5S, 43.5W) indicate a commercial agriculture venture; family subsistence farms are much smaller and laid out in different patterns. Land clearing in Brazil has increased at an alarming rate in recent years and preliminary estimates suggest a 25 to 30% increase in deforestation since 1984. The long term impact on the ecological processes are still unknown.

Madhulika Guhathakurta, seated left, STEREO program scientist, speaks during a press briefing, Thursday, Aug. 18, 2011, at NASA Headquarters in Washington as Craig DeForest, David Webb and Alysha Reinard, look on. The briefing was held to discusses new details about the structure of solar storms and the impact they have on Earth. The new information comes from NASA's Solar Terrestrial Relations Observatory, or STEREO, spacecraft and other NASA probes. Photo Credit: (NASA/GSFC/Rebecca Roth)
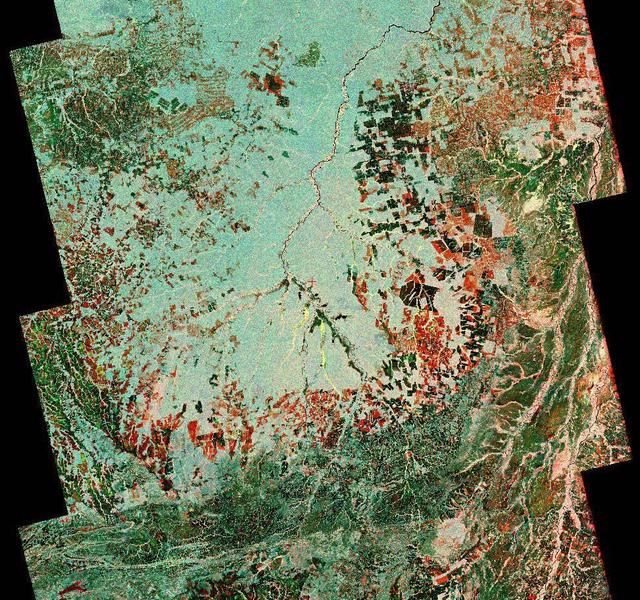
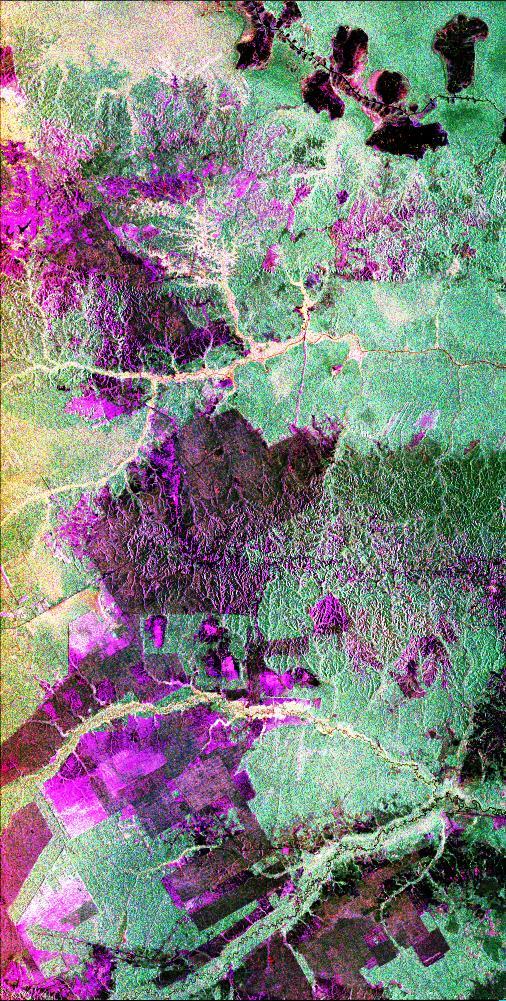
To show the kind of imagery that data from the NISAR (NASA-ISRO Synthetic Aperture Radar) satellite mission will produce, researchers pointed to this composite image of a portion of the so-called "arc of deforestation," a region on the southeast edge of the Amazonian jungle in Brazil where forests are being cleared at a fast pace through human activity. This three-color image shows change to the land cover in the Xingu River basin between 1996 (red) and 2007 (blue/green), using data from the Japanese L-band SAR satellites JERS-1 and ALOS-1, respectively. Black indicates areas converted from rainforest to agricultural land prior to 1996, and red shows the additional areas that had been cleared by 2007. NISAR will offer detailed insights into how the planet's forest ecosystems are changing over time, which will help researchers understand regional and global dynamics of deforestation and study the role of wooded areas in the global carbon cycle. NISAR could also help improve accounting of forest loss and growth, as countries that rely on logging try to shift toward more sustainable practices. NISAR is a joint mission of the U.S. and Indian space agencies. When in orbit, its sophisticated L- and S-band radar systems will scan nearly all of Earth's land and ice surfaces twice every 12 days with exquisite precision. Scheduled to launch in early 2024, NISAR is an equal collaboration between NASA and the Indian Space Research Organisation and marks the first time the two agencies have cooperated on hardware development for an Earth-observing mission. NASA's Jet Propulsion Laboratory, which is managed for the agency by Caltech in Pasadena, leads the U.S. component of the project and is providing the mission's L-band SAR. NASA is also providing the radar reflector antenna, the deployable boom, a high-rate communication subsystem for science data, GPS receivers, a solid-state recorder, and payload data subsystem. ISRO's U R Rao Satellite Centre in Bengaluru, which is leading the ISRO component of the mission, is providing the spacecraft bus, the S-band SAR electronics, the launch vehicle, and associated launch services and satellite mission operations. https://photojournal.jpl.nasa.gov/catalog/PIA26111

The 1960s Star Trek television series’ cast members visit NASA Dryden Flight Research Center, now Armstrong, in 1967. Chief Medical Officer Leonard ‘Bones’ McCoy played by DeForest Kelley and the show’s creator Gene Roddenberry receive briefing on X-15 cockpit as they view inside.

The 1960s Star Trek television series’ cast members visit NASA Dryden Flight Research Center, now Armstrong, in 1967. Chief Medical Officer Leonard ‘Bones’ McCoy played by DeForest Kelley talks with NASA officials in one of the center’s aircraft hangar.

The 1960s Star Trek television series’ cast member Chief Medical Officer Leonard ‘Bones’ McCoy played by DeForest Kelley talks to Bill Dana, NASA X-15 pilot, in front of one of three X-15’s during visit to NASA Dryden Flight Research Center, now Armstrong, back in 1967.

The 1960s Star Trek television series cast members Chief Engineer Montgomery ‘Scotty’ Scott played by James Doohan and Chief Medical Officer Leonard ‘Bones’ McCoy played by DeForest Kelley and the show’s creator Gene Roddenberry receive briefing on NASA Dryden Flight Research Center, now Armstrong, in front of HL-10
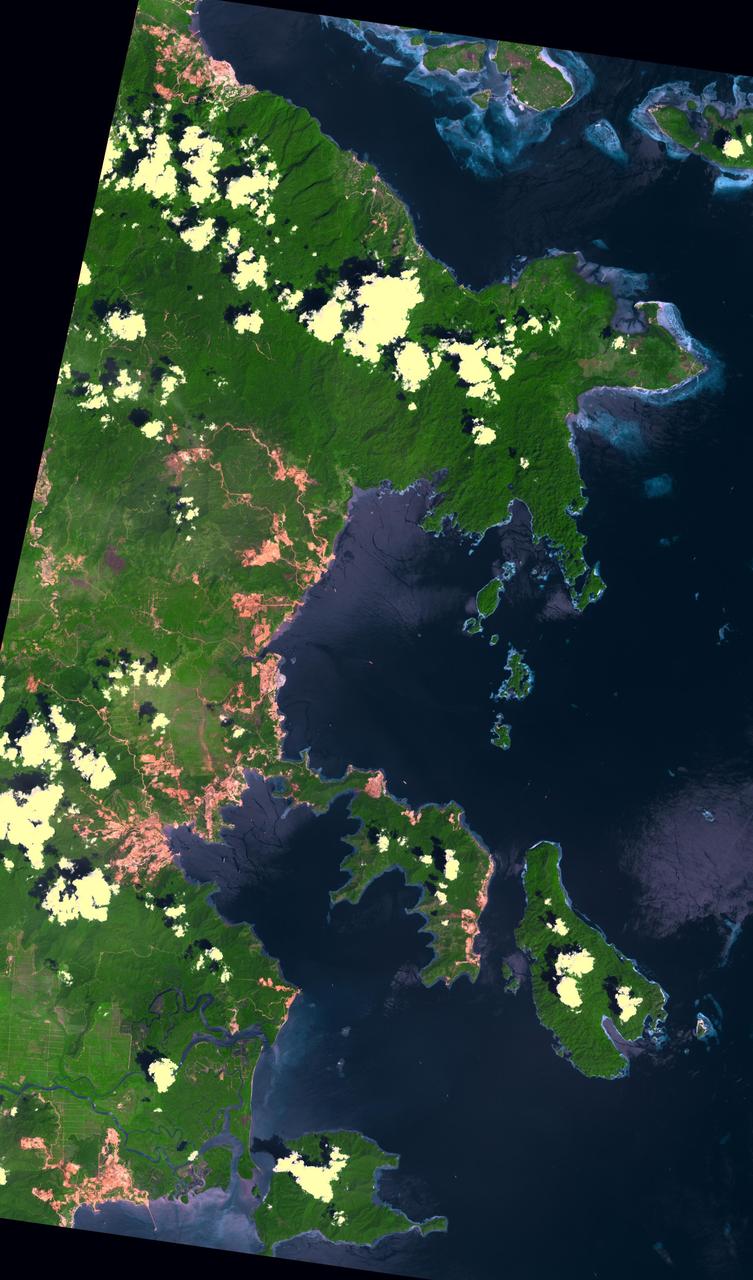
Indonesia produces two thirds of the world's nickel from open pit mines. In southeast Sulawesi, about 50 nickel mining companies currently operate. In order to mine nickel, large areas of trees are cut down to create open pits. The areas of deforestation appear as reddish where the iron-rich soil is exposed; surrounded by bright green areas of tropical vegetation. The image was acquired 12 September 2019, covers an area of 38.3 by 65.2 km, and is located at 3.3 degrees south, 122.3 degrees east. https://photojournal.jpl.nasa.gov/catalog/PIA26007

ISS040-E-103496 (19 Aug. 2014) --- On an unusually cloud-free day at the height of the dry season in Amazonia, several fires were burning, giving rise to a broad smoke pall easily seen from the International Space Station, photographed by an Expedition 40 crew member. Parts of the space station appear along the margins of the image. Against the backdrop of the dark green rainforest, several fires follow the major highway BR 163 (lower center of the image to the top left). Fires are set to clear patches of forest for agriculture, a process that reveals red-brown soils. A long line of new cleared patches snakes east from BR 163 towards the remote valley of the Rio Crepori. Extensive deforested areas in Brazil?s state of Mato Grosso appear as tan areas across the top of the image. Fires show the advance of deforestation into the state of Para, the area shown in most of this view. Para is now second after Mato Grosso in terms of deforestation acreage.
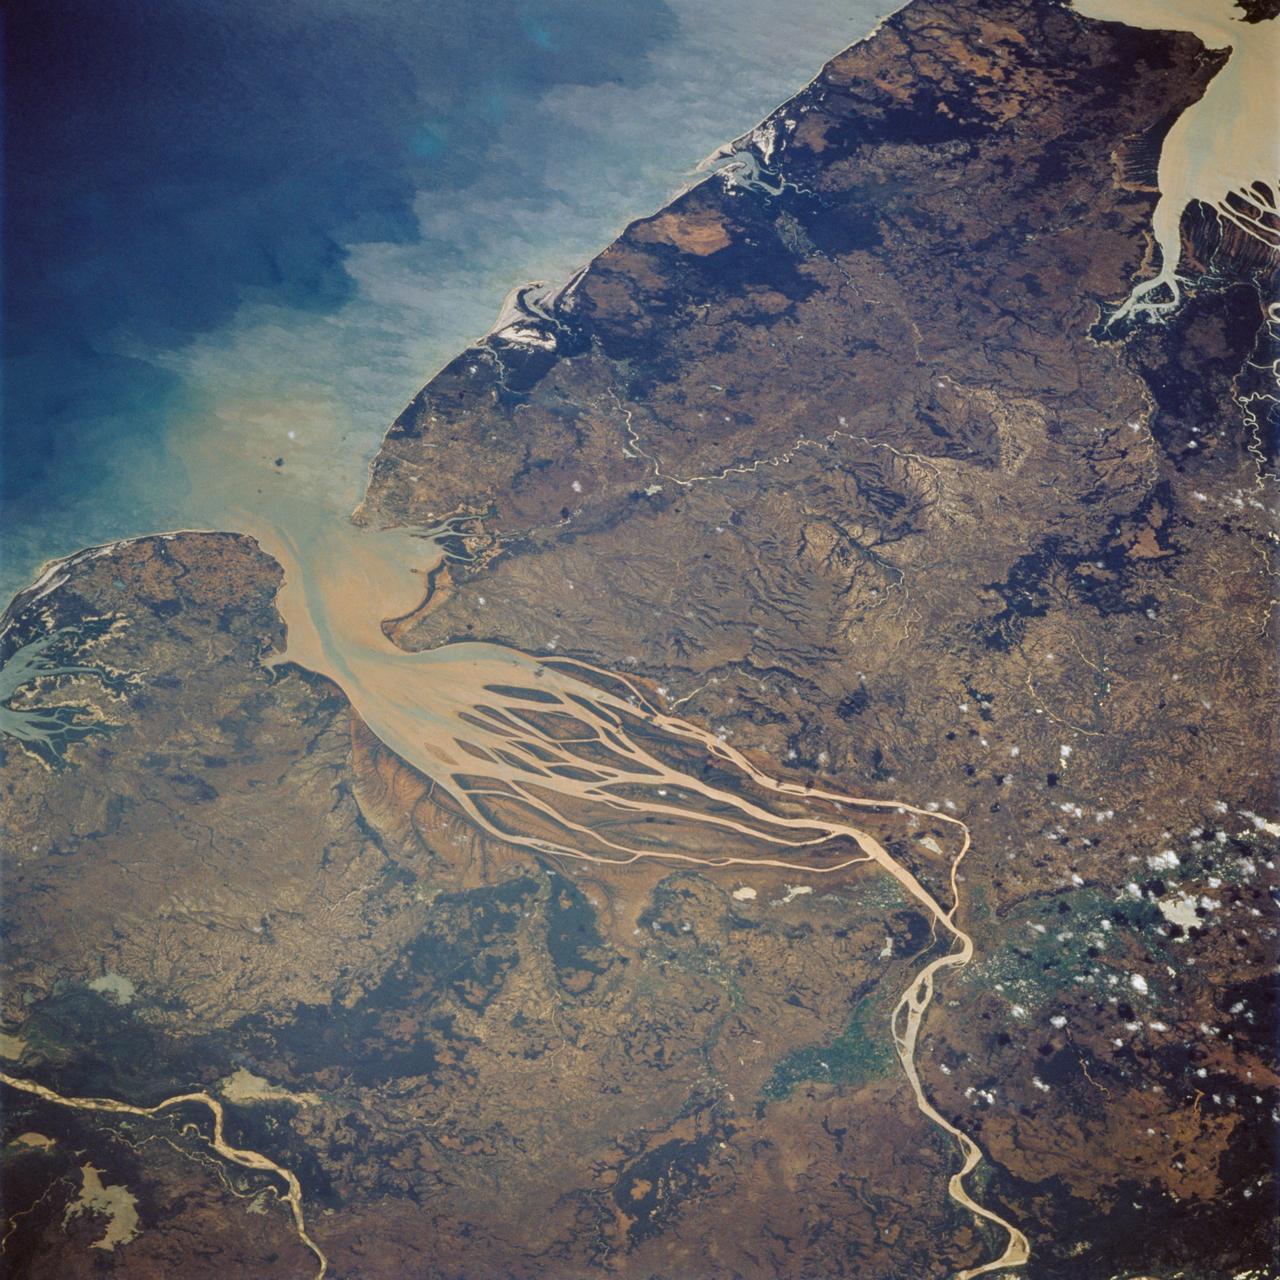
51F-37-059 (29 July-6 Aug 1985) --- The mouth of the Betsiboka River in northwest Madagascar is seen. The estuary at Mahajanga is being quickly filled with river borne sediments due to poor land management, mainly deforest-action in the river basin. Changes in the estuary can be seen from one Shuttle flight to the next.
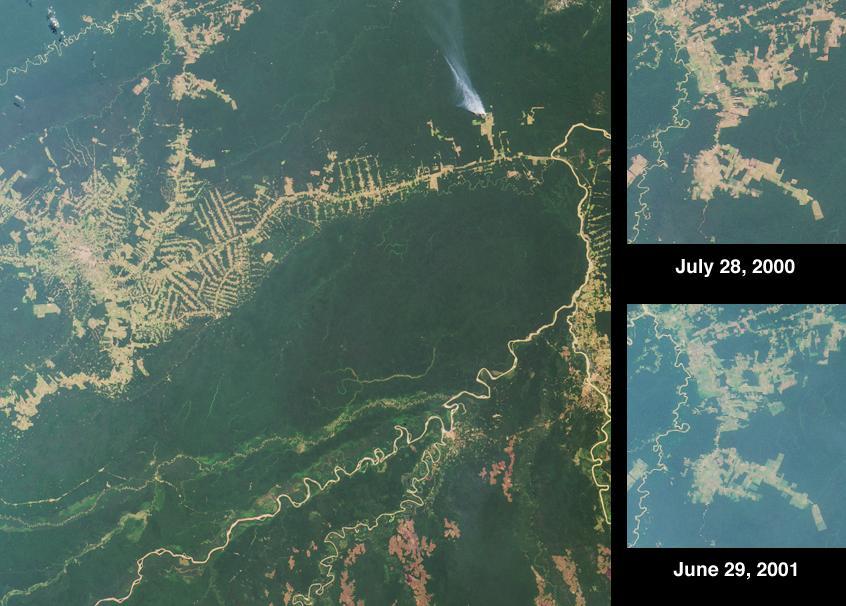
Rio Brancois the capital of the Brazilian state of Acre and is situated near the border with northeastern Bolivia. This image from NASA Terra satellite was acquired on July 28, 2000.
Numerous fires occurred near the headwaters of the Xingu River and the Xingu Indigenous Peoples Reserve in Mato Grosso, Brazil, during late June and early July, 2004, as seen by NASA Terra spacecraft.
STS049-91-079 (7 - 16 May 1992) --- This 70mm frame, photographed from the Earth-orbiting Space Shuttle Endeavour, features a dendritic drainage pattern in Zaire. Cleared pasture land shows light green in this color photograph, in contrast to the dark, closed-canopy forest of Zaire. Remnant woodland along minor streams indicates the intricate drainage network of this hilly region. Scattered vegetation-free spots show the deep red, tropical soil of the region. The sediment-laden stream is the Vele River just west of the village of Niangara. A crew member used a 70mm handheld Hasselblad camera with a 250mm lens to record the image.
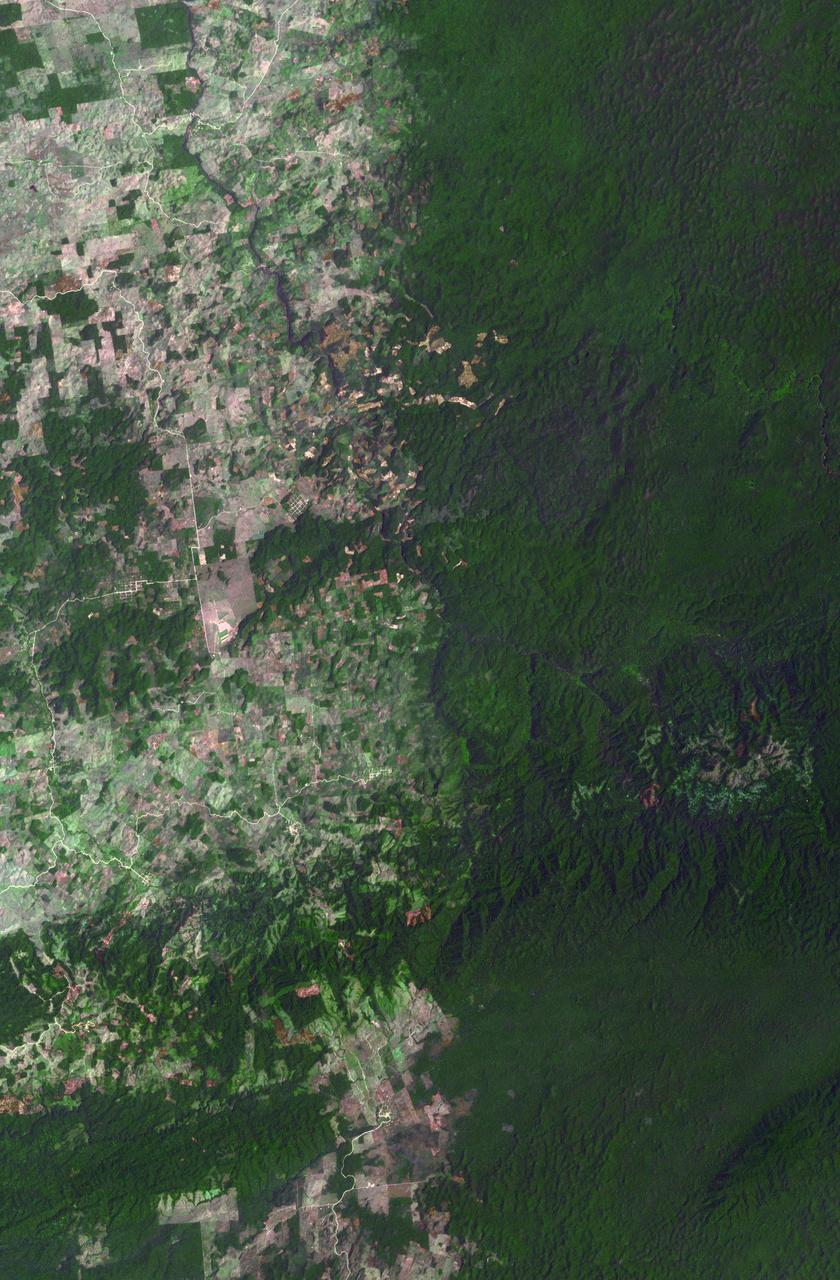
The border between Belize and Guatemala illustrates striking differences in land use practices. In a study of deforestation published in 2016, Chicas and co-authors found that in their study area between 1991 and 2014, on the Guatemalan side of the border forested land declined 32%; in Belize, forested area declined 11%. In part of their study area shown in this image, the difference is more dramatic: near-pristine forest in Belize on the right, and agricultural fields in Guatemala on the left. The image was acquired May 10, 2016, covers an area of 27 by 41 km, and is located at 16.7 degrees north, 89.2 degrees west. https://photojournal.jpl.nasa.gov/catalog/PIA21826
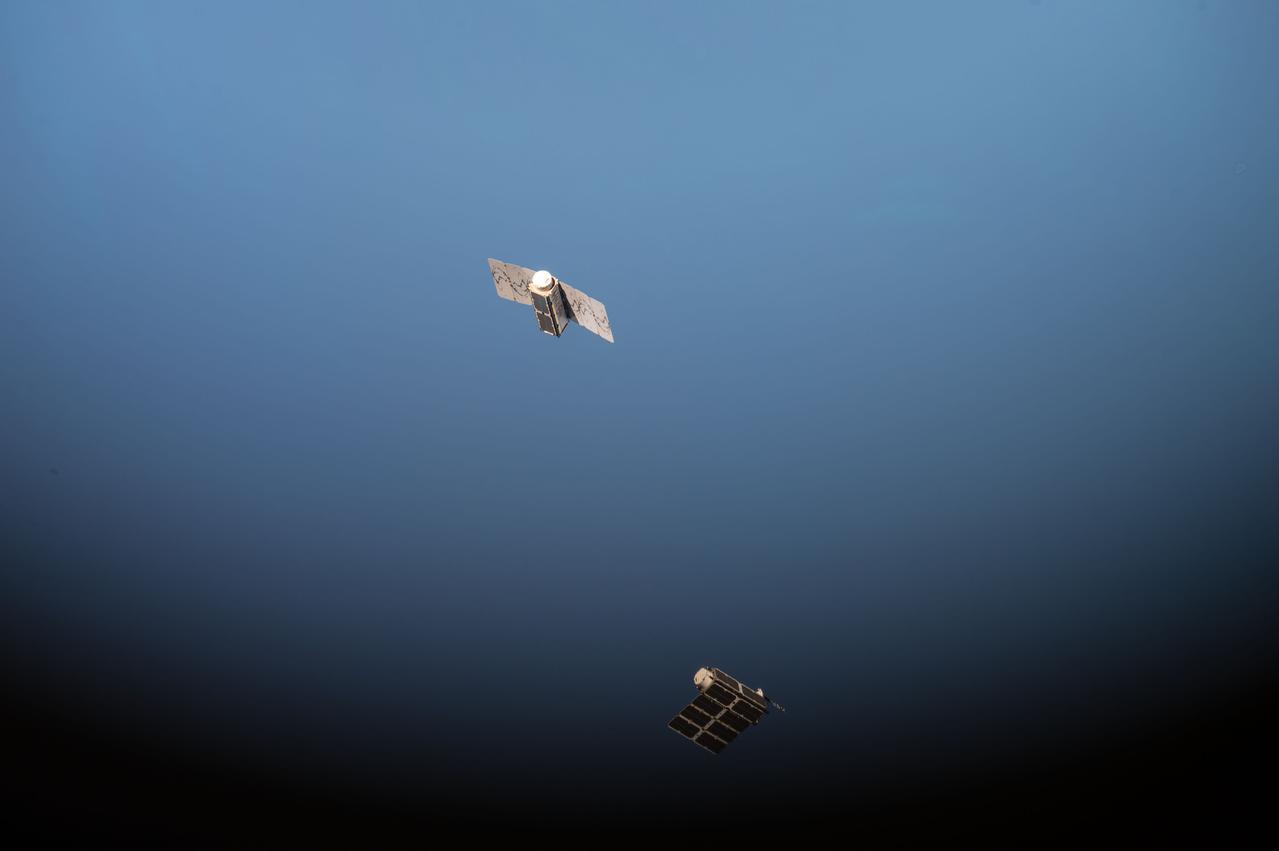
View taken by the Expedition 49 crew of track of first of four pairs of Planet Lab DoveSats over the Earth. This deployment titled “Flock 2” is a fleet of nanosatellites designed, built and operated by Planet Labs Inc., and will enable imagery of the changing planet to be taken on a frequent basis, with humanitarian and environmental applications ranging from monitoring deforestation and the ice caps to disaster relief and improving agriculture yields in developing nations. Image used as part of Twitter message - We launched two satellites from @Space_Station today – like skydivers soaring towards the earth." #AstroKate.
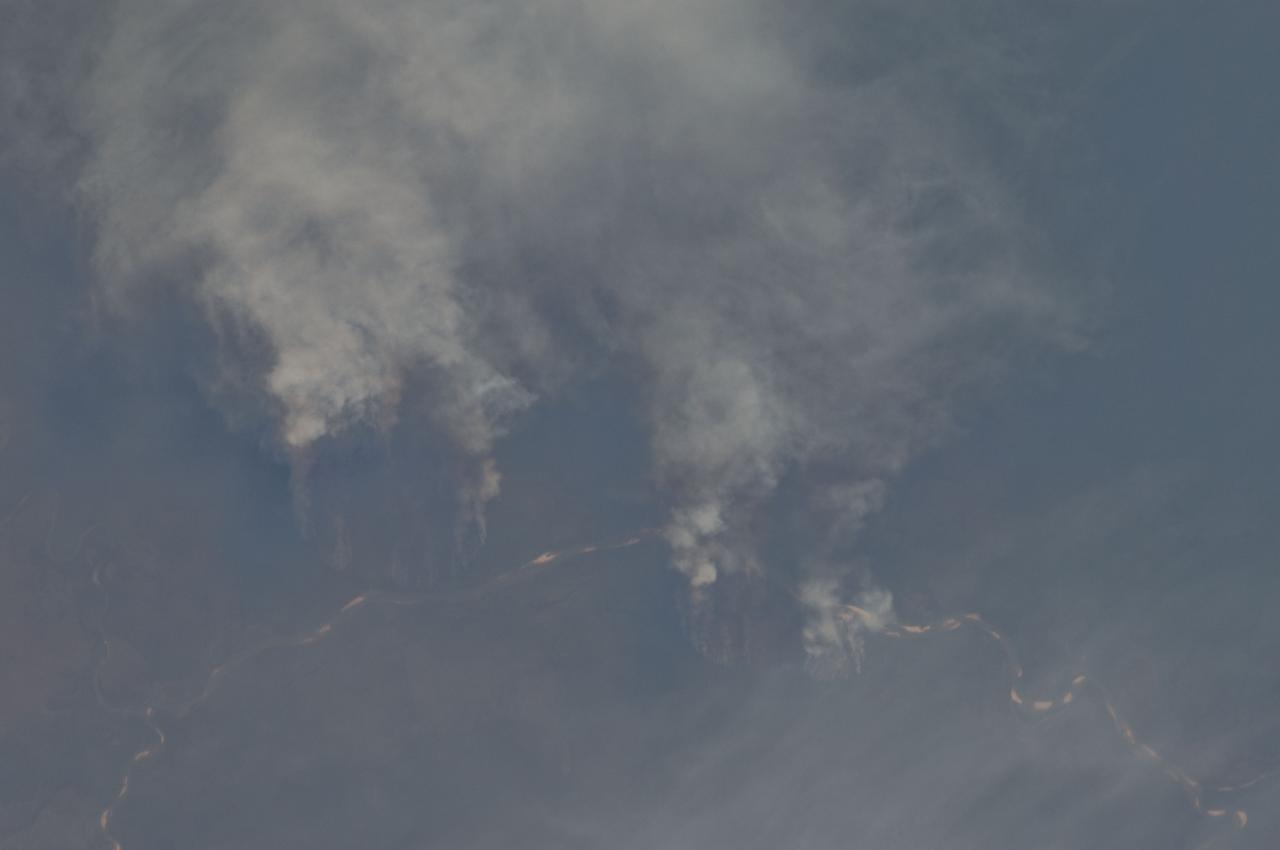
ISS029-E-008032 (17 Sept. 2011) --- Fires along the Rio Xingu, Brazil are featured in this image photographed by an Expedition 29 crew member on the International Space Station. The rain forest of South America, also known as ?Amazonia??the largest such forest on Earth?has been undergoing a continual and accelerated land use conversion process into farmlands (including pasture for livestock) since the early 1960s. This process has typically been achieved by clearing of the forest using fire ? ?slash and burn? ? followed by planting of crops. The generally infertile soils of the region make sustainable farming difficult; this drives more forest conversion into new farmland. The area of clearing can be considerable, and as the deforested regions are easily identifiable and measurable from space the rate of deforestation is likewise easy to track. This detailed photograph illustrates slash-and-burn forest clearing along the Xingu River (Rio) in the northeast of the state of Matto Grasso, Brazil. The perspective of this image allows for a striking visualization of both the horizontal position and extent of the fire lines next to the river, as well as providing a sense of the vertical structure of the smoke plumes due to the viewing angle and shadowing. Light colored areas within the river channel are sand bars, which show that the river is in its annual low-flow/ low water stage. For a sense of scale, the Xingu River channel within the view is approximately 63 kilometers long. Rivers in Amazonia are its natural highways, which may explain why the burning is occurring right next to the Xingu River, one of Amazonia?s largest. In recent years, preservation has gained traction in the region as a result of such considerations as new valuation of the ecosystem services provided by the forest, concerns about the impact of widespread burning on global climate change, and greater sensitivity to the ethnic and biological heritage of Amazonia.
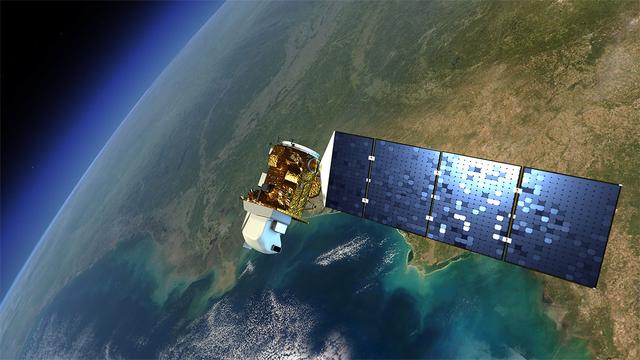
An artist's rendition of the next Landsat satellite, the Landsat Data Continuity Mission (LDCM) that will launch in Feb. 2013. Credit: NASA The Landsat program is the longest continuous global record of Earth observations from space – ever. Since its first satellite went up in the summer of 1972, Landsat has been looking at our planet. The view of Earth that this 40-year satellite program has recorded allows scientists to see, in ways they never imagined, how the Earth's surface has transformed, over time. In the 1970s Landsat captured the first views from space of the Amazonian rainforest and continued to track the area year after year after year, giving the world an unprecedented view of systemic and rapid deforestation. This view from space let us see an activity that was taking place in an exceptionally remote part of our world. These now iconic-images of tropical deforestation spurred the global environmental community to rally in an unprecedented way, and resulted in worldwide attention and action. To read more go to: <a href="http://www.nasa.gov/mission_pages/landsat/news/landsat-history.html" rel="nofollow">www.nasa.gov/mission_pages/landsat/news/landsat-history.html</a> <b><a href="http://www.nasa.gov/audience/formedia/features/MP_Photo_Guidelines.html" rel="nofollow">NASA image use policy.</a></b> <b><a href="http://www.nasa.gov/centers/goddard/home/index.html" rel="nofollow">NASA Goddard Space Flight Center</a></b> enables NASA’s mission through four scientific endeavors: Earth Science, Heliophysics, Solar System Exploration, and Astrophysics. Goddard plays a leading role in NASA’s accomplishments by contributing compelling scientific knowledge to advance the Agency’s mission. <b>Follow us on <a href="http://twitter.com/NASA_GoddardPix" rel="nofollow">Twitter</a></b> <b>Like us on <a href="http://www.facebook.com/pages/Greenbelt-MD/NASA-Goddard/395013845897?ref=tsd" rel="nofollow">Facebook</a></b> <b>Find us on <a href="http://instagrid.me/nasagoddard/?vm=grid" rel="nofollow">Instagram</a></b>
STS035-73-082 (2-10 Dec 1990) --- This agricultural and ranching area, Rio Sao Francisco, Brazil (13.0S, 43.5W) has been under study for several years. See scene STS-31-92-045 for comparison. This area has many small single family subsistence farms, large square and rectangular commercial farms and pastures for livestock grazing. Over the several years of observation, the number and size of farms has increased and center-pivot, swing-arm irrigation systems have been installed.
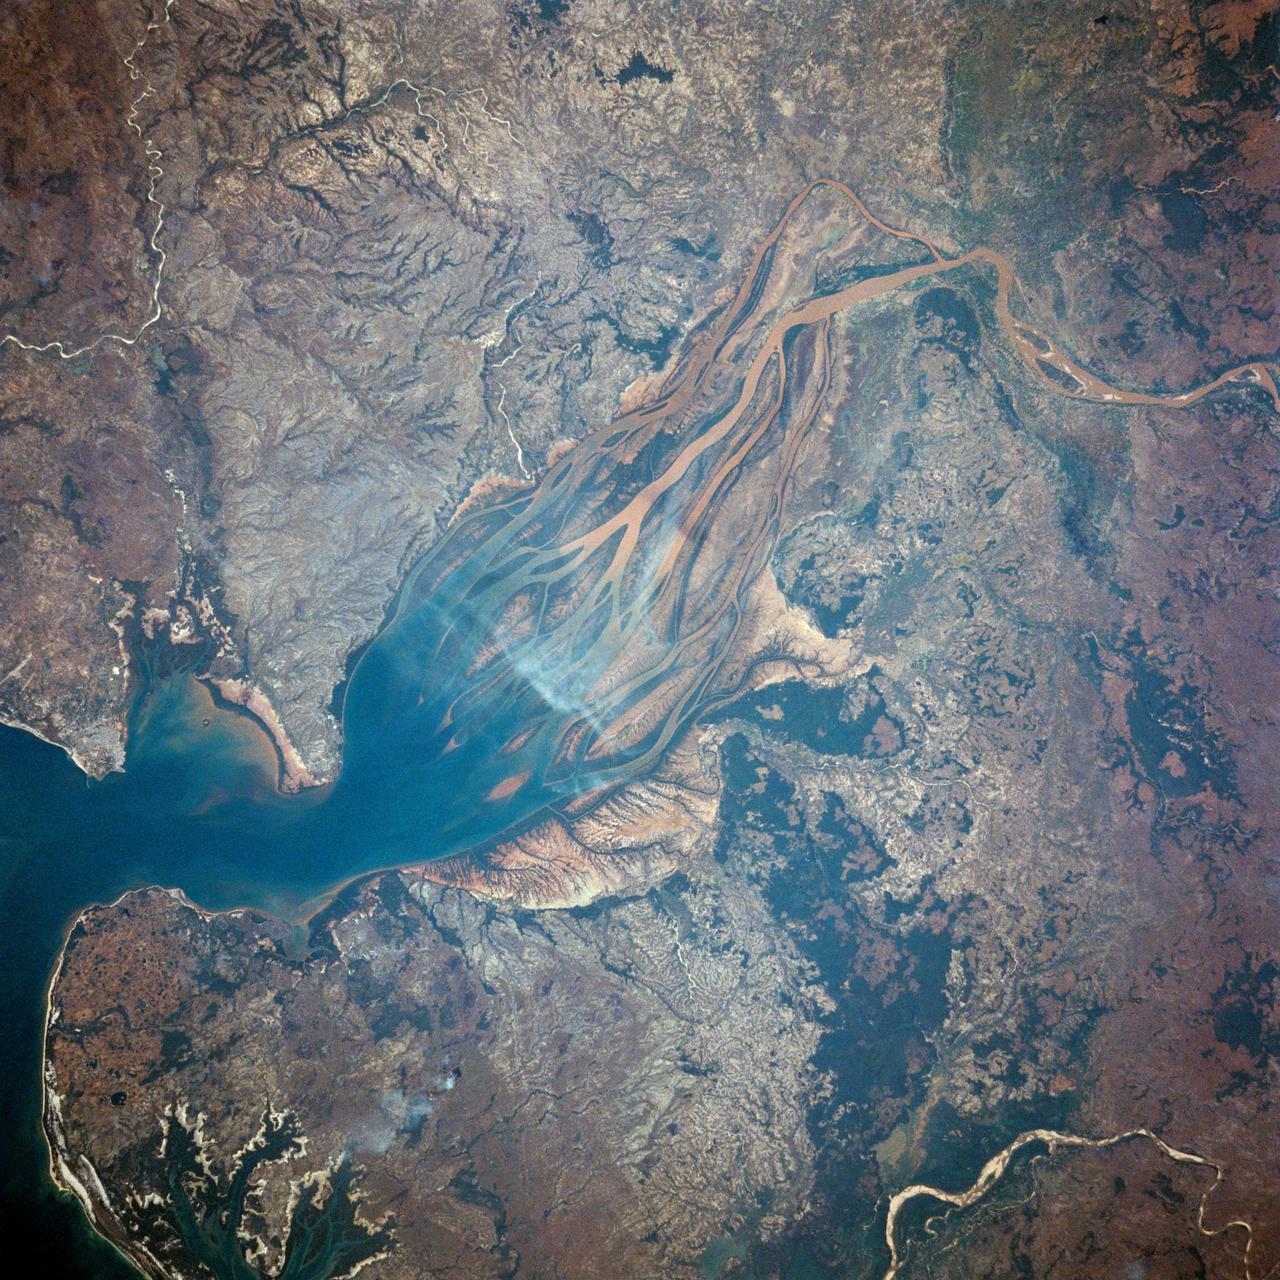
STS007-03-058 (18-24 June 1983) --- The Island of Madagascar in the Indian Ocean off the coast of Africa. The colorful area is the mouth of the Betsiboka River near the city of Majunga. The photograph was taken with a 70mm handheld camera aimed through the aft flight deck?s overhead windows on the Earth-orbiting Space Shuttle Challenger.
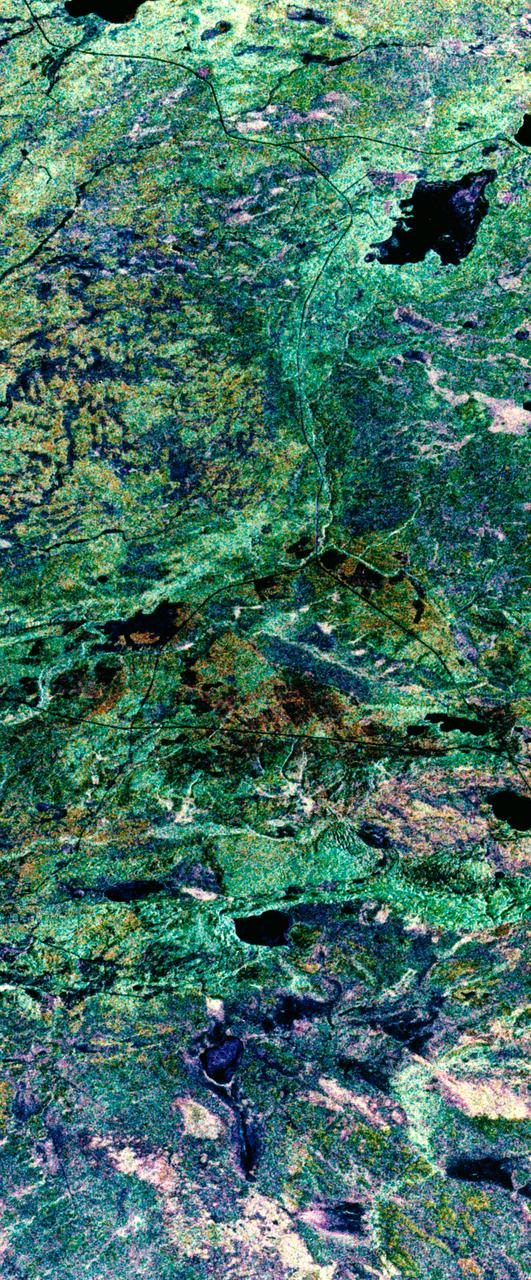
STS059-S-039 (11 April 1994) --- This is a false-color composite of Prince Albert, Canada, centered at 53.91 north latitude and 104.69 west longitude. This image was acquired by the Spaceborne Imaging Radar-C and X-Band Synthetic Aperture Radar (SIR-C/X-SAR) aboard the Space Shuttle Endeavour on its 20th orbit. The area is located 40 kilometers (25 miles) north and 30 kilometers (20 miles) east of the town of Prince Albert in the Saskatchewan province of Canada. The image covers the area east of the Candle Lake, between gravel surface Highways 120 and 106 and west of 106. The area in the middle of the image covers the entire Nipawin (Narrow Hills) provincial park. The look angle of the radar is 30 degrees and the size of the image is approximately 20 kilometers by 50 kilometers (12 by 30 miles). The image was produced by using only the L-Band. The three polarization channels HH, HV and VV are illustrated by red, green and blue respectively. The changes in the intensity of each color are related to various surface conditions such as variations in forest stands, frozen or thawed condition of the surface, disturbances (fire and deforestation), and areas of re-growth. Most of the dark areas in the image are the ice-covered lakes in the region. The dark area on the top right corner of the image is the White Gull Lake north of the intersection of Highway 120 and 913. The right middle part of the image shows Lake Ispuchaw and Lower Fishing Lake. The deforested areas are also shown by dark areas in the image. Since most of the logging practice at the Prince Albert area is around the major highways, the deforested areas can be easily detected as small geometrically shaped dark regions along the roads. At the time of the SIR-C/X-SAR overpass, a major part of the forest is either frozen or undergoing the spring thaw. The L-Band HH shows a high return in the jack pine forest. The reddish areas in the image are old jack pine forest, 12-17 meters (40-55 feet) in height and 60-75 years old. The orange-greenish areas are young jack pine trees, 3-5 meters (10-16 feet) in height and 11-16 years old. The green areas are due to the relative high intensity of the HV channel which is strongly correlated with the amount of biomass. L-Band HV channel shows the biomass variations over the entire region. Most of the green areas, when compared to the forest cover maps are identified as black spruce trees. The dark blue and dark purple colors show recently harvested or re-growth areas respectively. SIR-C/X-SAR is part of NASA's Mission to Planet Earth (MTPE). SIR-C/X-SAR radars illuminate Earth with microwaves allowing detailed observations at any time, regardless of weather or sunlight conditions. SIR-C/X-SAR uses three microwave wavelengths: L-Band (24 cm), C-Band (6 cm), and X-Band (3 cm). The multi-frequency data will be used by the international scientific community to better understand the global environment and how it is changing. The SIR-C/X-SAR data, complemented by aircraft and ground studies, will give scientists clearer insights into those environmental changes which are caused by nature and those changes which are induced by human activity. SIR-C was developed by NASA's Jet Propulsion Laboratory (JPL). X-SAR was developed by the Dornire and Alenia Spazio Companies for the German Space Agency, Deutsche Agentur fuer Raumfahrtangelegenheiten (DARA), and the Italian Space Agency, Agenzia Spaziale Italiana (ASI). JPL Photo ID: P-43886
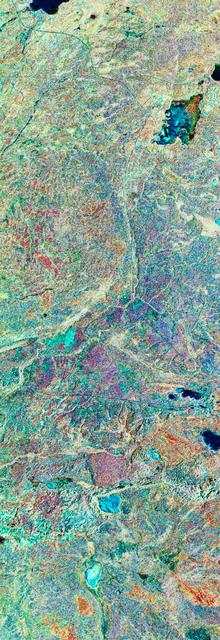
STS059-S-079 (18 April 1994) --- This is a false-color, three frequency image of Prince Albert, Canada, centered at 53.91 north latitude and 104.69 west longitude. It was produced using data from the X-Band, C-Band and L-Band radars that comprise the Spaceborne Imaging Radar-C and X-Band Synthetic Aperture Radar (SIR-C/X-SAR). SIR-C/X-SAR acquired this image on the 20th orbit of the Space Shuttle Endeavour. The area is located 40 kilometers north and 30 kilometers east of the town of Prince Albert in the Saskatchewan province of Canada. The image covers the area east of the Candle Lake, between gravel surface Highways 120 and 106 and west of 106. The area in the middle of the image covers the entire Nipawin (Narrow Hills) provincial park. The look angle of the radar is 30 degrees and the size of the image is approximately 20 by 50 kilometers. The red, green, and blue colors represent L-Band total power, C-Band total power, and XVV respectively. The changes in the intensity of each color are related to various surface conditions such as frozen or thawed forest, fire, deforestation and areas of regrowth. Most of the dark blue areas in the image are the ice covered lakes. The dark area on the top right corner of the image is the White Gull Lake north of the intersection of Highway 120 and 913. The right middle part of the image shows Lake Ispuchaw and Lower Fishing Lake. The deforested areas are shown by light blue in the image. Since most of the logging practice at the Prince Albert area is around the major highways, the deforested areas can be easily detected as small geometrically shaped dark regions along the roads. At the time these data were taken, a major part of the forest was either frozen or undergoing the spring thaw. In such conditions, due to low volume of water in the vegetation, a deeper layer of the canopy is imaged by the radar, revealing valuable information about the type of trees, the amount of vegetation biomass and the condition of the surface. As the frequency increases, the penetration depth in the canopy decreases. Over forest canopies, the X-Band radar contains information about the top of the canopy. Whereas, C-Band and L-Band radar returns show contributions from the crown and trunk areas respectively. The bright areas in the image are dense mixed aspen and old jackpine forests where the return from all three bands is high. The reddish area corresponds to more sparse old jack pine (12 to 17 meters in height and 60 to 75 years old) where the L-Band signal penetrates deeper in the canopy and dominates C-Band and X-Band returns. Comparison of the image with the forest cover map of the area indicates that the three band radar can be used to classify various stands. SIR-C/X-SAR is part of NASA's Mission to Planet Earth (MTPE). SIR-C/X-SAR radars illuminate Earth with microwaves allowing detailed observations at any time, regardless of weather or sunlight conditions. SIR-C/X-SAR uses three microwave wavelengths: L-Band (24 cm), C-Band (6 cm), and X-Band (3 cm). The multi-frequency data will be used by the international scientific community to better understand the global environment and how it is changing. The SIR-C/X-SAR data, complemented by aircraft and ground studies, will give scientists clearer insights into those environmental changes which are caused by nature and those changes which are induced by human activity. SIR-C was developed by NASA's Jet Propulsion Laboratory (JPL). X-SAR was developed by the Dornire and Alenia Spazio Companies for the German Space Agency, Deutsche Agentur fuer Raumfahrtangelegenheiten (DARA), and the Italian Space Agency, Agenzia Spaziale Italiana (ASI). JPL Photo ID: P-43929
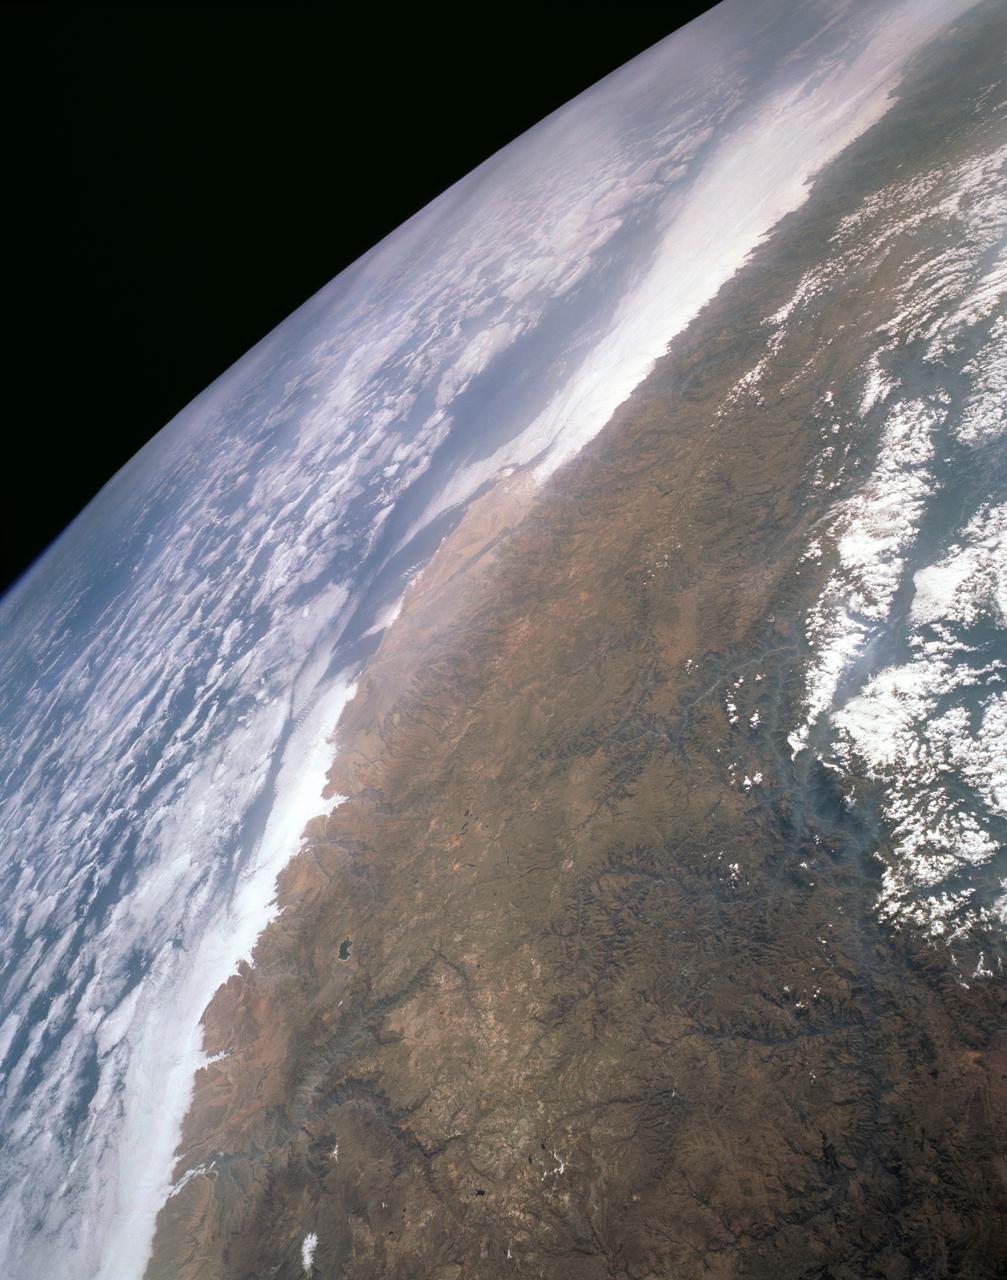
STS043-151-159 (2-11 August 1991) --- This photograph looks westward over the high plateau of the southern Peruvian Andes west and north of Lake Titicaca (not in field of view). Lima, Peru lies under the clouds just north of the clear coastal area. Because the high Andes have been uplifted 10,000 to 13,000 feet during the past 20 million years, the rivers which cut down to the Pacific Ocean have gorges almost that deep, such as the Rio Ocona at the bottom of the photograph. The eastern slopes of the Andes are heavily forested, forming the headwaters of the Amazon system. Smoke from burning in the Amazon basin fills river valleys on the right side of the photograph. A Linhof camera was used to take this view.
This is a radar image of the central part of the island of Sumatra in Indonesia that shows how the tropical rainforest typical of this country is being impacted by human activity. Native forest appears in green in this image, while prominent pink areas represent places where the native forest has been cleared. The large rectangular areas have been cleared for palm oil plantations. The bright pink zones are areas that have been cleared since 1989, while the dark pink zones are areas that were cleared before 1989. These radar data were processed as part of an effort to assist oil and gas companies working in the area to assess the environmental impact of both their drilling operations and the activities of the local population. Radar images are useful in these areas because heavy cloud cover and the persistent smoke and haze associated with deforestation have prevented usable visible-light imagery from being acquired since 1989. The dark shapes in the upper right (northeast) corner of the image are a chain of lakes in flat coastal marshes. This image was acquired in October 1994 by the Spaceborne Imaging Radar C/X-Band Synthetic Aperture Radar (SIR-C/X-SAR) onboard the space shuttle Endeavour. Environmental changes can be easily documented by comparing this image with visible-light data that were acquired in previous years by the Landsat satellite. The image is centered at 0.9 degrees north latitude and 101.3 degrees east longitude. The area shown is 50 kilometers by 100 kilometers (31 miles by 62 miles). The colors in the image are assigned to different frequencies and polarizations of the radar as follows: red is L-band horizontally transmitted, horizontally received; green is L-band horizontally transmitted, vertically received; blue is L-band vertically transmitted, vertically received. SIR-C/X-SAR, a joint mission of the German, Italian and United States space agencies, is part of NASA's Mission to Planet Earth program. http://photojournal.jpl.nasa.gov/catalog/PIA01797
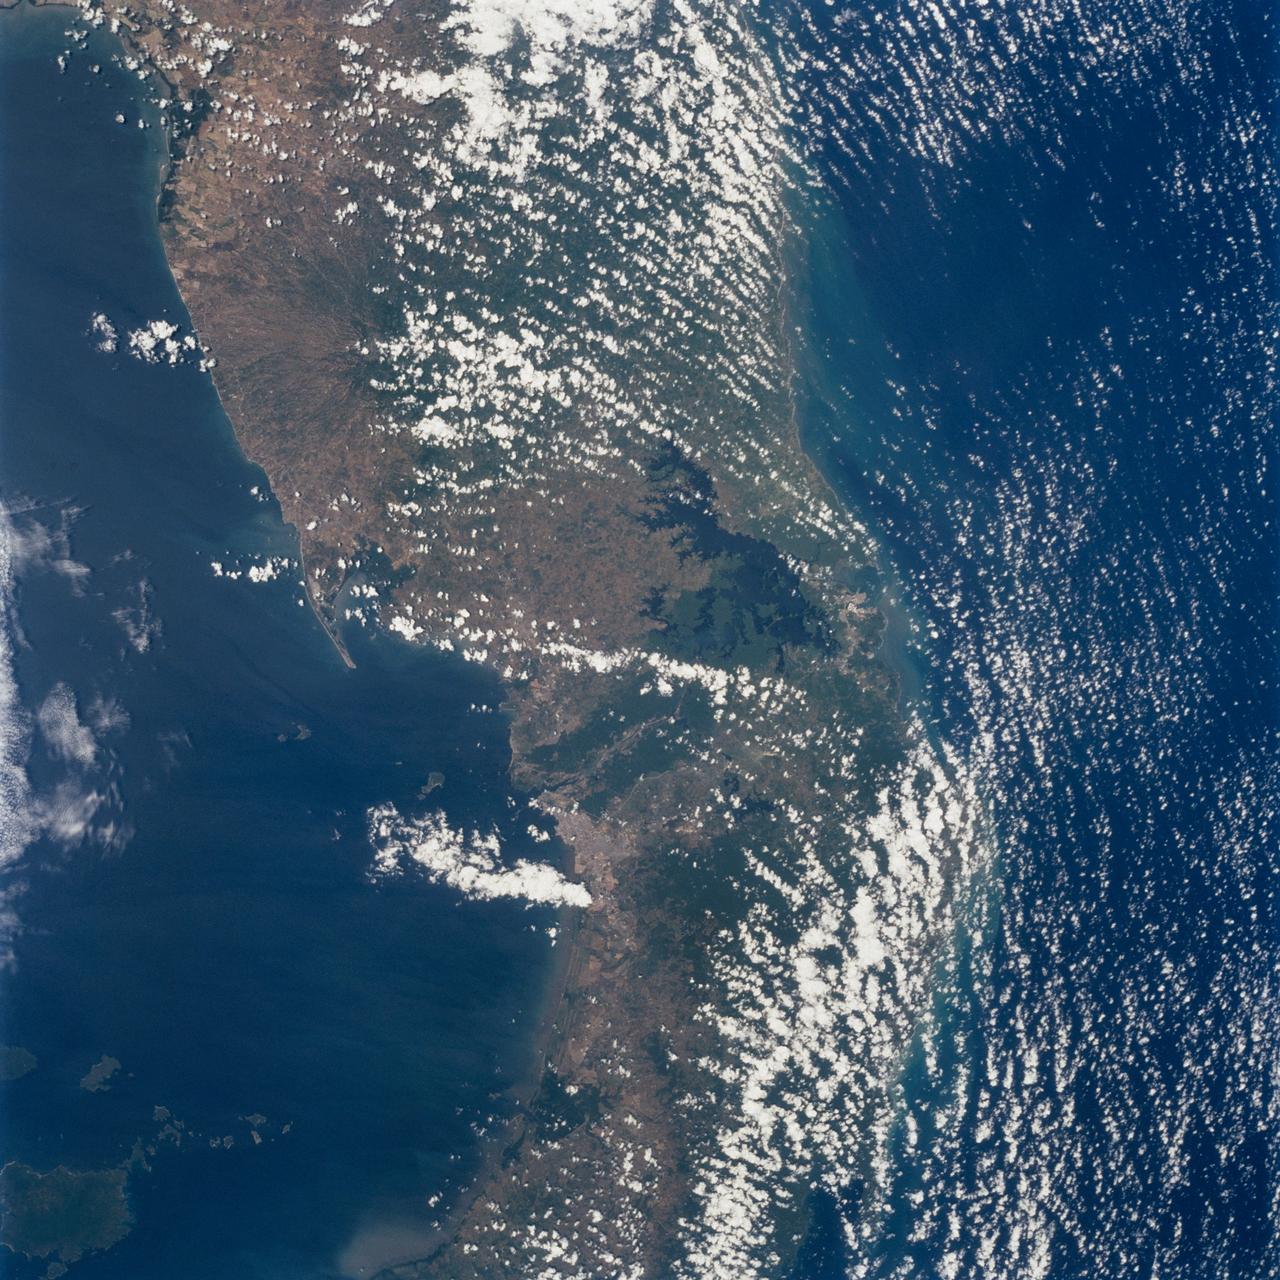
STS098-712-091 (7-20 February 2001) --- The forested area of the Panama Canal Zone can be seen near the center of this north-looking image, photographed with a 70mm handheld camera from the Earth-orbiting Space Shuttle Atlantis. (NOTE: The image should be oriented with Panama running horizontally and the majority of the clouds at the top). The Panama Canal Zone extends 5 miles (8 kilometers) on either side of the Panama Canal. The forested zone acts as a buffer for the canal to help prevent erosion and sediment from clogging the canal. Most of the countryside on both sides of the Canal Zone has been deforested to make way for large ranches and the raising of cattle. Though some sedimentation is occurring, dredging of the canal keeps the passage clear. The Panama Canal is 40 miles (64 kilometers) long including dredged approach channels at each end. With the Caribbean Sea covering the upper portion of the image and the Pacific Ocean covering the lower portion of the image, the canal traverses the Isthmus of Panama in a northwest to southeast direction. Gatun Lake, one of the largest artificial lakes in the world, is visible at the north end of the Canal Zone. Panama City (light-colored grayish area) is discernible to the right of the canal at its southern entrance from the Pacific Ocean. In 1996, 15,000 ships traveled through the canal, an average of 42 ships per day. Passage through the canal requires 7 to 8 hours.

"When we do passes over parts of the world where you can see the human impact to the world, you get to really see the magnitude of the impact. When we’re flying over North America, we come up over Vancouver, and a short five minutes later we’re flying over Houston. We’d just cross over all of the Western United States. And during the daylight, you may not really see a whole lot of human influence, with all the great plains are stretched out and the cities blending into everything. "But when we’d do that same view over South America, at what at one point was rainforest, as far as we can see, has all been deforested. You can understand the reasons why people are doing it. They’re trying to survive. But you also know at your core that we’re having a significant impact on how life is balancing on the world. And so, I walked away with a deep sense of stewardship of the planet. My wife chuckles at this being my mid-life crisis. I came home and signed up for 100% renewable energy and looked at EV cars and everything. "When you look out into space, and you see all those stars and all those galaxies — there’s just so much stuff out there. But the only thing you see with any life on it is what’s right below you. You know that we’re on this island out in the middle of this vast darkness, and we need to just take care of it as best we can." NASA astronaut Nick Hague, Monday, Jan. 13, 2020 in Washington, DC. Hague most recently spent 203 days living and working onboard the International Space Station as part of Expeditions 59 and 60. Hague ventured outside the space station on three spacewalks totaling 19 hours and 56 minutes. Photo Credit: (NASA/Aubrey Gemignani)

ISS013-E-74843 (2 Sept. 2006) --- Rio Negro in Amazonia, Brazil is featured in this image photographed by an Expedition 13 crewmember onboard the International Space Station. The wide, multi-island zone in the Rio Negro (Black River) shown in this image is one of two, long "archipelagoes" upstream of the city of Manaus (not shown) in central Amazonia. Ninety kilometers of the total 120 kilometers length of this archipelago appear in this view. On the day the photo was taken, air temperatures over the cooler river water of the archipelago were just low enough to prevent cloud formation. Over the neighboring rainforest, temperatures were warm enough to produce small convection-related clouds, known to pilots as "popcorn" cumulus. Several zones of deforestation, represented by lighter green zones along the river banks, are also visible. Two different types of river appear in this image. Flowing east-southeast (left to right) is the multi-island, Rio Negro, 20 kilometers wide near the right of the view. Two other "black" rivers, Rio Caures and Rio Jufari, join Rio Negro downstream. The second river type is the Rio Branco (White River; right) which is the largest tributary of the Rio Negro. The difference in water color is controlled by the source regions: black-water rivers derive entirely from soils of lowland forests. Water in these rivers has the color of weak tea, which appears black in images from space. By contrast, white-water rivers like the Branco carry a load of sand and mud particles, mudding the waters. The reason for the tan color is that white-water rivers rise in mountainous country where headwater streams erode exposed rock. The Amazon itself rises in the Andes Mts., where very high erosion occurs, and it is thus the most famous white river in Amazonia. This image was taken in September, near low-water stage. Pictures taken at other times show the channels much wider during high-water season (May--July) when water levels rise several meters. It was discovered recently, from high resolution GPS measurements at Manaus, that the land surface actually rises vertically a small amount in compensation when this vast mass of water drains away each season. Although small, the vertical displacement--50-70 mm--was unexpectedly large according to the scientists who performed the study.
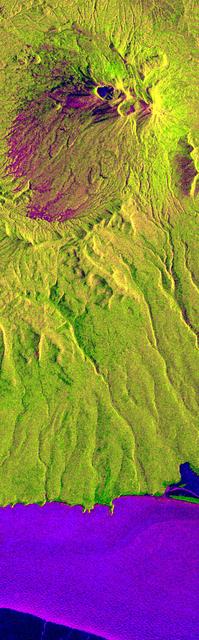
This is an X-band seasonal image of the Maly Semlyachik volcano, which is part of the Karymsky volcano group on Kamchatka peninsula, Russia. The image is centered at 54.2 degrees north latitude and 159.6 degrees east longitude. This image was acquired by the Spaceborne Imaging Radar-C and X-band Synthetic Aperture Radar (SIR-C/X-SAR) aboard the space shuttle Endeavour on April 9, 1994, during the first flight of the radar system, and on September 30, 1994, during the second flight. The image channels have been assigned the following colors: red corresponds to data acquired on April 9; green corresponds to data acquired on September 30; and blue corresponds to the ratio between data from April 9 and September 30, 1994. Kamchatka is twice as large as England, Scotland and Wales combined and is home to approximately 470,000 residents. The region is characterized by a chain of volcanoes stretching 800 kilometers (500 miles) across the countryside. Many of the volcanoes, including the active Maly Semlyachik volcano in this image, have erupted during this century. But the most active period in creating the three characteristic craters of this volcano goes back 20,000, 12,000 and 2,000 years ago. The highest summit of the oldest crater reaches about 1,560 meters (1,650 feet). The radar images reveal the geological structures of craters and lava flows in order to improve scientists' knowledge of these sometimes vigorously active volcanoes. This seasonal composite also highlights the ecological differences that have occurred between April and October 1994. In April the whole area was snow-covered and, at the coast, an ice sheet extended approximately 5 kilometers (3 miles) into the sea. The area shown surrounding the volcano is covered by low vegetation much like scrub. Kamchatka also has extensive forests, which belong to the northern frontier of Taiga, the boreal forest ecosystem. This region plays an important role in the world's carbon cycle. Trees require 60 years to mature in Kamchatka's 120-day growing season. The forest industry is managing these forests and practicing selective cutting to allow younger trees time to grow and reseed. X-SAR images will aid in mapping these deforested areas and in encouraging further recultivation efforts. http://photojournal.jpl.nasa.gov/catalog/PIA01728
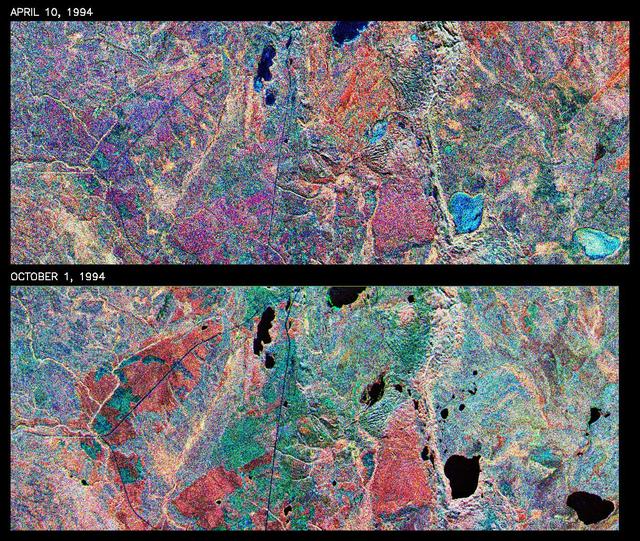
This is a comparison of images over Prince Albert, produced by NASA Spaceborne Imaging Radar-C and X-band Synthetic Aperture Radar aboard the space shuttle Endeavour on its 20th orbit on April 10, 1994. The area is centered at 53.91 degrees north latitude and 104.69 degrees west longitude and is located 40 kilometers (25 miles) north and 30 kilometers (18.5 miles) east of the town of Prince Albert in the Saskatchewan province of Canada. The image covers the area east of Candle Lake, between the gravel highway of 120 and west of highway 106. The area imaged is near the southern limit of the boreal forest. The boreal forest of North America is a continuous vegetation belt at high latitudes stretching across the continent from the Atlantic shoreline of central Labrador and then westward across Canada to the interior mountains and central coastal plains of Alaska. The forest is also part of a larger northern hemisphere circumpolar boreal forest belt. Coniferous trees dominate the entire forest but deciduous trees are also present. During the month of April, the forest experiences seasonal changes from a frozen condition to a thawed condition. The trees are completely frozen over the winter season and the forest floor is covered by snow. As the average temperature rises in the spring, the trees are thawed and the snow melts. This transition has an impact on the rate of moisture evaporation and release of carbon dioxide into the atmosphere. In late September and early October, the boreal forest experiences a relatively different seasonal change. At this time, the leaves on deciduous trees start changing color and dropping off. The soil and trees are quite often moist due to frequent rainfall and cloud cover. The evaporation of moisture and carbon dioxide into the atmosphere also diminishes at this time. SIR-C/X-SAR is sensitive to the moisture of soil and vegetation and can sense this freeze-thaw cycle and the summer-fall seasonal transition over forested areas in particular. Optical sensors, by contrast, are blind to these regions, which are perpetually obscured by thick cloud cover. These changes were detected by comparing the April and October color composite images of L-band data in red, C-band data in green and X-band (vertically received and transmitted) in blue. The changes in intensity of each color over lakes, various forest stands and clear cuts in the two images is striking. Lakes such as Lake Heiberg, Crabtree Lake and Williams Lake, in the right middle part of the image, are frozen in April (appearing in bright blue) and melted (appearing in black) in October. The higher intensity of blue over lakes in April is due to low penetration of the X-band (vertically received and transmitted) and the radar's high sensitivity to surface features. Forest stands also exhibit major changes between the two images. The red areas in the October image are old jack pine canopies that cause higher return at L-band because of their moist condition in late summer compared to their partially frozen condition in April (in purple). Similarly, in the areas near the middle of the image, where black spruce and mixed aspen and jack pine trees dominate, the contrast between blue in October and red and green in April is an indication that the top of the canopy (needles and branches) were frozen in April and moist in October. The changes due to deforestation by logging companies or natural fires can also be detected by comparing the images. For example, the small blue area near the intersection of Harding Road and Highway 120 is the result of logging which occurred after the April data was acquired. The surface area of clear cut is approximately 4 hectares, which is calculated from the high-resolution capability of the radar images and verified by scientists participating in field work during the mission. http://photojournal.jpl.nasa.gov/catalog/PIA01732