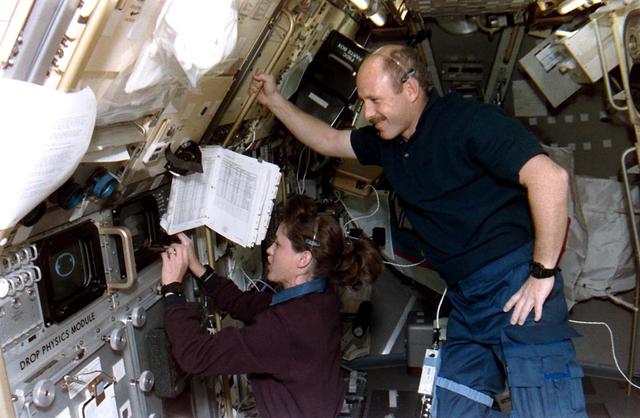
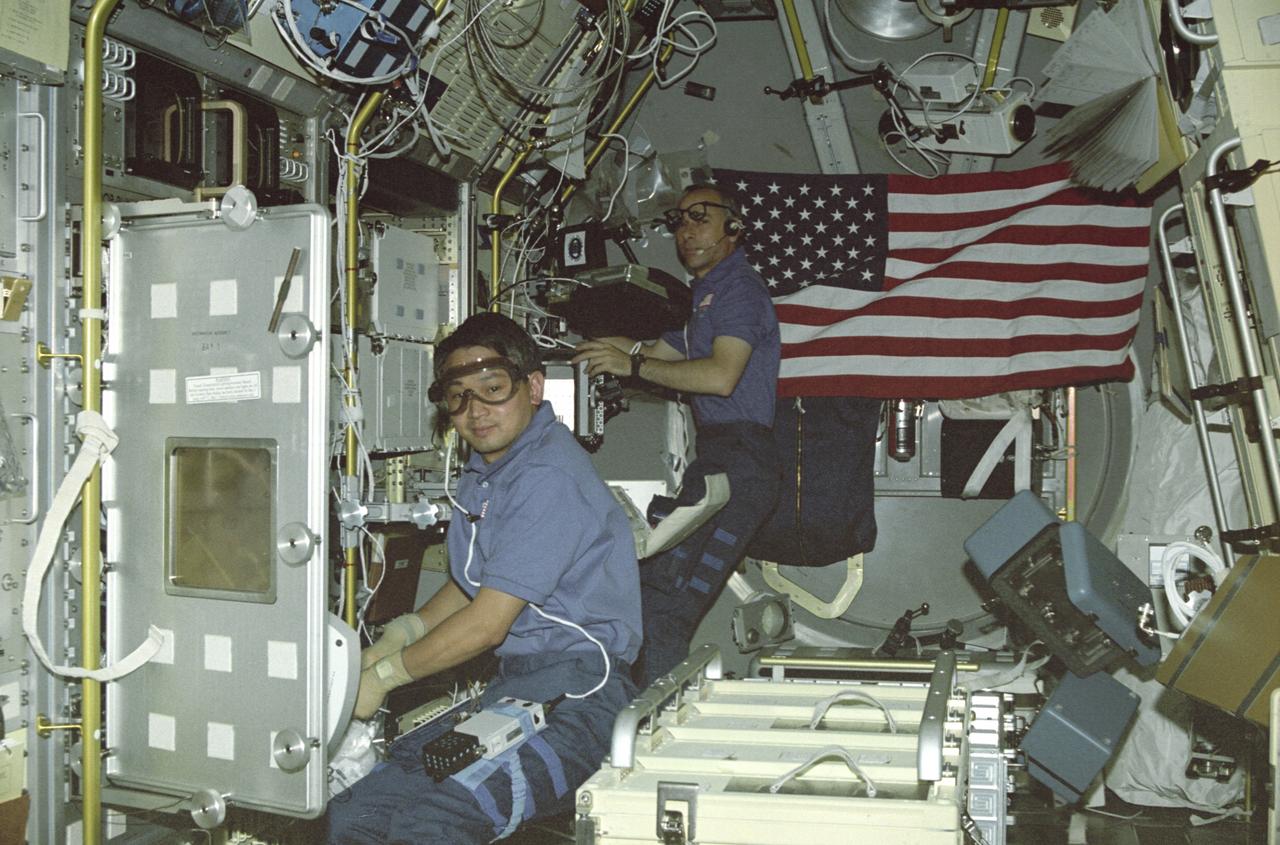
Astronaut Kathryn C. Thornton, payload commander, works at the Drop Physics Module (DPM) on the portside of the science module supporting the U.S. Microgravity Laboratory (USML-2). Astronaut Kerneth D. Bowersox, mission commander, looks on.
Astronaut Kathryn C. Thornton, payload commander for STS-73, works at the drop physics module (DPM) on the portside of the science module aboard the Space Shuttle Columbia in Earth orbit.
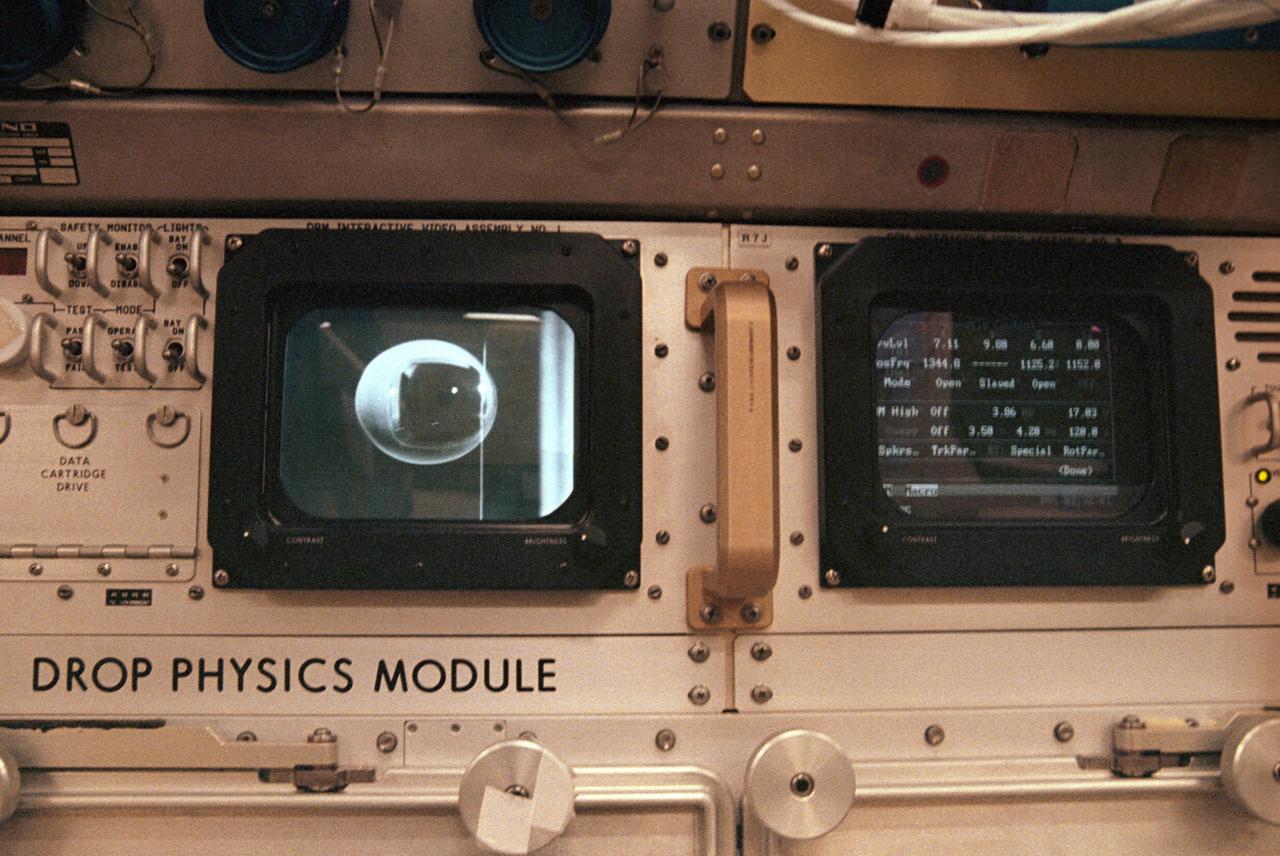
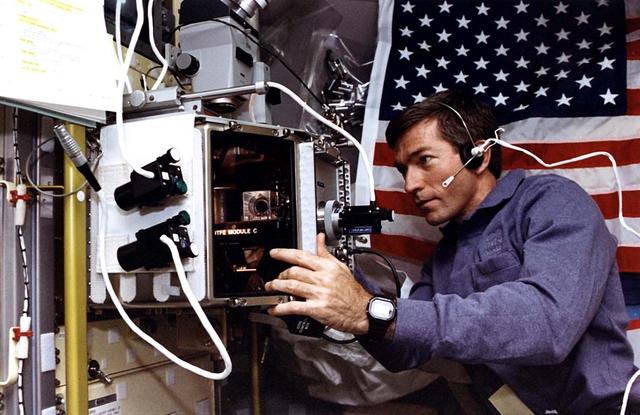
The first United States Microgravity Laboratory (USML-1) was one of NASA's science and technology programs that provided scientists an opportunity to research various scientific investigations in a weightlessness environment inside the Spacelab module. It also provided demonstrations of new equipment to help prepare for advanced microgravity research and processing aboard the Space Station. The USML-1 flew in orbit for extended periods, providing greater opportunities for research in materials science, fluid dynamics, biotechnology (crystal growth), and combustion science. This is a close-up view of the Drop Physics Module (DPM) in the USML science laboratory. The DPM was dedicated to the detailed study of the dynamics of fluid drops in microgravity: their equilibrium shapes, the dynamics of their flows, and their stable and chaotic behaviors. It also demonstrated a technique known as containerless processing. The DPM and microgravity combine to remove the effects of the container, such as chemical contamination and shape, on the sample being studied. Sound waves, generating acoustic forces, were used to suspend a sample in microgravity and to hold a sample of free drops away from the walls of the experiment chamber, which isolated the sample from potentially harmful external influences. The DPM gave scientists the opportunity to test theories of classical fluid physics, which have not been confirmed by experiments conducted on Earth. This image is a close-up view of the DPM. The USML-1 flew aboard the STS-50 mission on June 1992, and was managed by the Marshall Space Flight Center.
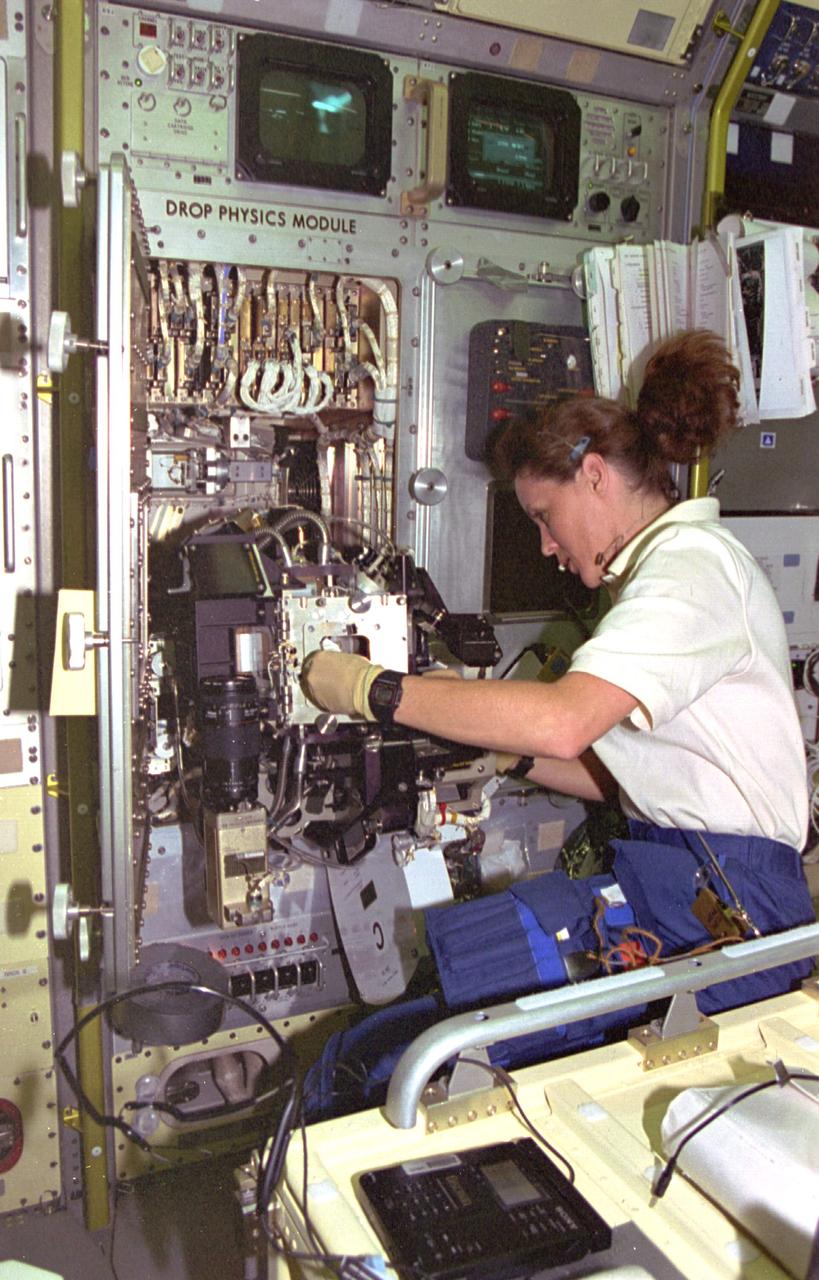
STS073-143-026 (20 October-5 November 1995) --- Astronaut Kathryn C. Thornton, STS-73 payload commander for the United States Microgravity Laboratory (USML-2), explores the inner workings of the Drop Physics Module (DPM). Thornton was joined by four other NASA astronauts and two guest researchers for almost 16 days of research aboard the Space Shuttle Columbia in Earth-orbit.

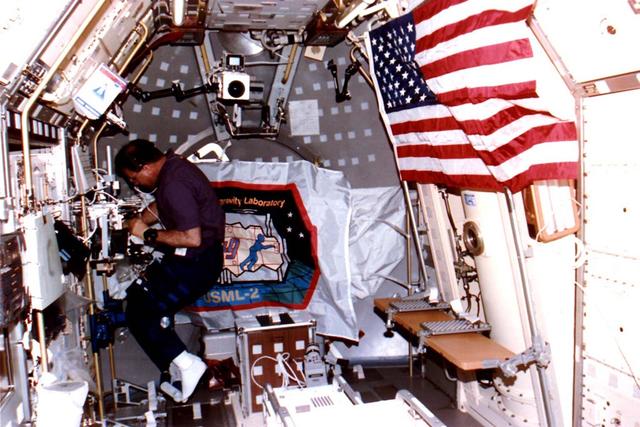
STS073-225-036 (20 October-5 November 1995) --- Payload specialist Fred W. Leslie monitors the response of a liquid drop at the Drop Physics Module (DPM) in the U.S. Microgravity Laboratory (USML-2) science module aboard the Space Shuttle Columbia. Leslie joined another guest researcher and five NASA astronauts for almost 16-days of Earth-orbit research in support of the mission.
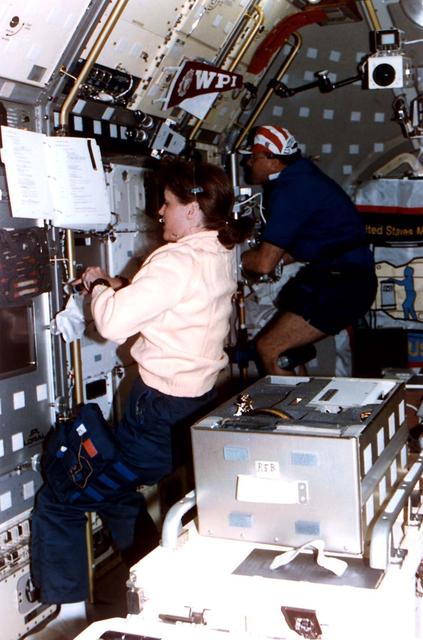
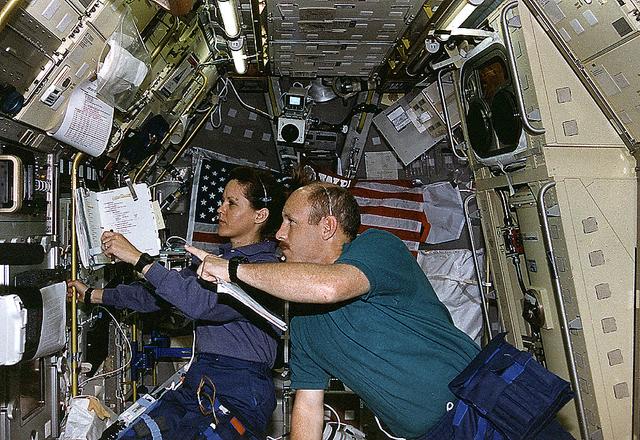
STS073-108-005 (20 October-5 November 1995) --- Two members of the crew perform an in-flight maintenance on the Drop Physics Module (DPM) in the science module aboard the Earth-orbiting Space Shuttle Columbia. Payload commander Kathryn C. Thornton and payload specialist Albert Sacco Jr. were part of a seven-member crew that spent 16 full days in space in support of the United States Microgravity Laboratory (USML-2) mission.

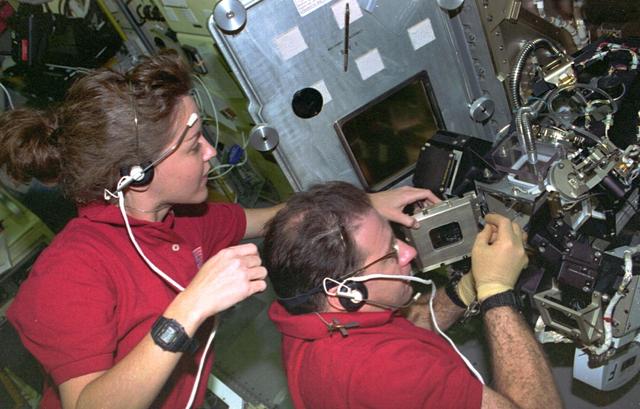
STS073-E-5311 (3 Nov. 1995) --- Astronaut Kathryn C. Thornton, STS-73 payload commander, works at the Drop Physics Module (DPM) on the portside of the science module supporting the U.S. Microgravity Laboratory (USML-2). Astronaut Kenneth D. Bowersox, mission commander, looks on. Five NASA astronauts and two payload specialists are in the last few days of a scheduled 16-day mission. This frame was exposed with the Electronic Still Camera (ESC).
STS073-229-014 (20 October - 5 November 1995) --- Astronauts Kathryn C. Thornton, STS-73 payload commander, and Kenneth D. Bowersox, mission commander, observe a liquid drop's activity at the Drop Physics Module (DPM) in the science module aboard the Earth-orbiting Space Shuttle Columbia. The drop is partially visible at the center of the left edge of the frame. The two were joined by three other NASA astronauts and two guest researchers for almost 16-days of in-orbit research in support of the U.S. Microgravity Laboratory (USML-2) mission.

STS073-E-5003 (23 Oct. 1995) --- Astronaut Kathryn C. Thornton, STS-73 payload commander, works at the Drop Physics Module (DPM) on the portside of the science module aboard the Space Shuttle Columbia in Earth orbit. Payload specialist Albert Sacco Jr. conducts an experiment at the Glovebox. This frame was exposed with the color Electronic Still Camera (ESC) assigned to the 16-day United States Microgravity Laboratory (USML-2) mission.
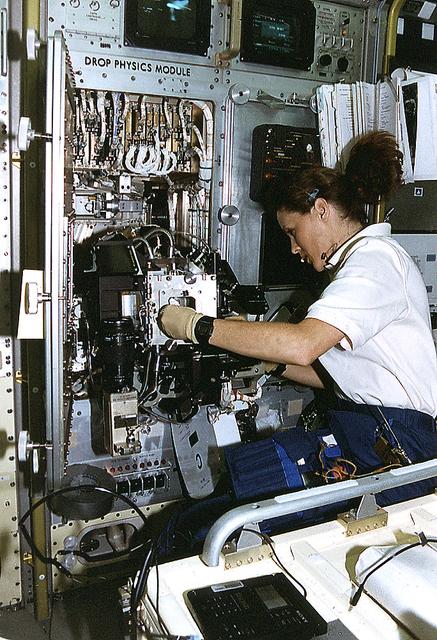
Onboard Space Shuttle Columbia (STS-73) Payload Commander Kathryn Thornton works with the Drop Physics Module (DPM) in the United States Microgravity Laboratory 2 (USML-2) Spacelab Science Module cleaning the experiment chamber of the DPM.

Astronaut Catherine G. Coleman, mission specialist for STS-73, works in the glovebox on the portside of the science module aboard the Space Shuttle Columbia in earth-orbit.
Albert Sacco Jr., payload specialist for STS-73, works in the glovebox on the portside of the science module aboard the Space Shuttle Columbia in earth orbit.
Payload specialist Fred Leslie makes use of the versatile U.S. Microgravity Laboratory (USML-2) glovebox to conduct an investigation with the Oscillatory Thermocapillary Flow Experiment (OTFE). This complement of the Surface-Tension-Driven Convection Experiment (STDCE) studies the shapes that fluid surfaces in weightless environments assume within specific containers. Leslie was one of two guest researchers who joined five NASA astronauts for 16 days of on Earth-orbit research in support of USML-2.
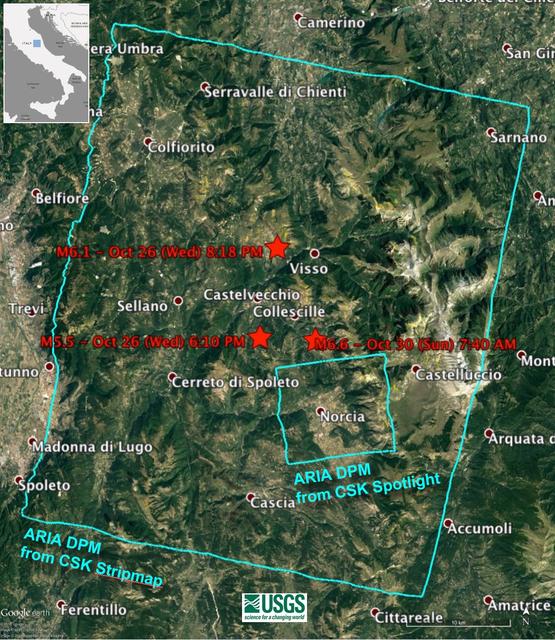
Damage Proxy Map (DPM) v0.5, derived from the Italian Space Agency's COSMO-SkyMed Spotlight synthetic aperture radar (SAR) data acquired from an ascending orbit, covering an area of 6.2-by-6.2 miles (10-by-10 kilometers), centered at Norcia, Italy. Red pixels (pixel size about 16 feet, or 5 meters)represent areas of potential damage due to the Magnitude 6.6 Oct 30, 2016, Central Italy earthquakes, as well as ground surface change during the time period Oct. 30, 2016 -- Oct. 31, 2016. The color variation from yellow to red indicate increasingly more significant ground surface change. Preliminary validation was carried out by comparing with high-resolution pre- and post-event optical imagery acquired by DigitalGlobe's WorldView satellites, and a damage map produced by the European Commission Copernicus Emergency Management Service based upon visual inspection of high-resolution pre- (Orthophoto) and post-event (Pleiades-1) optical imagery. This DPM provides broad geographic coverage of the earthquake's impact in the region. Areas that fall in radar shadow and layover were masked out. The DPM should be used as guidance to identify damaged areas, and may be less reliable over vegetated areas. http://photojournal.jpl.nasa.gov/catalog/PIA15374
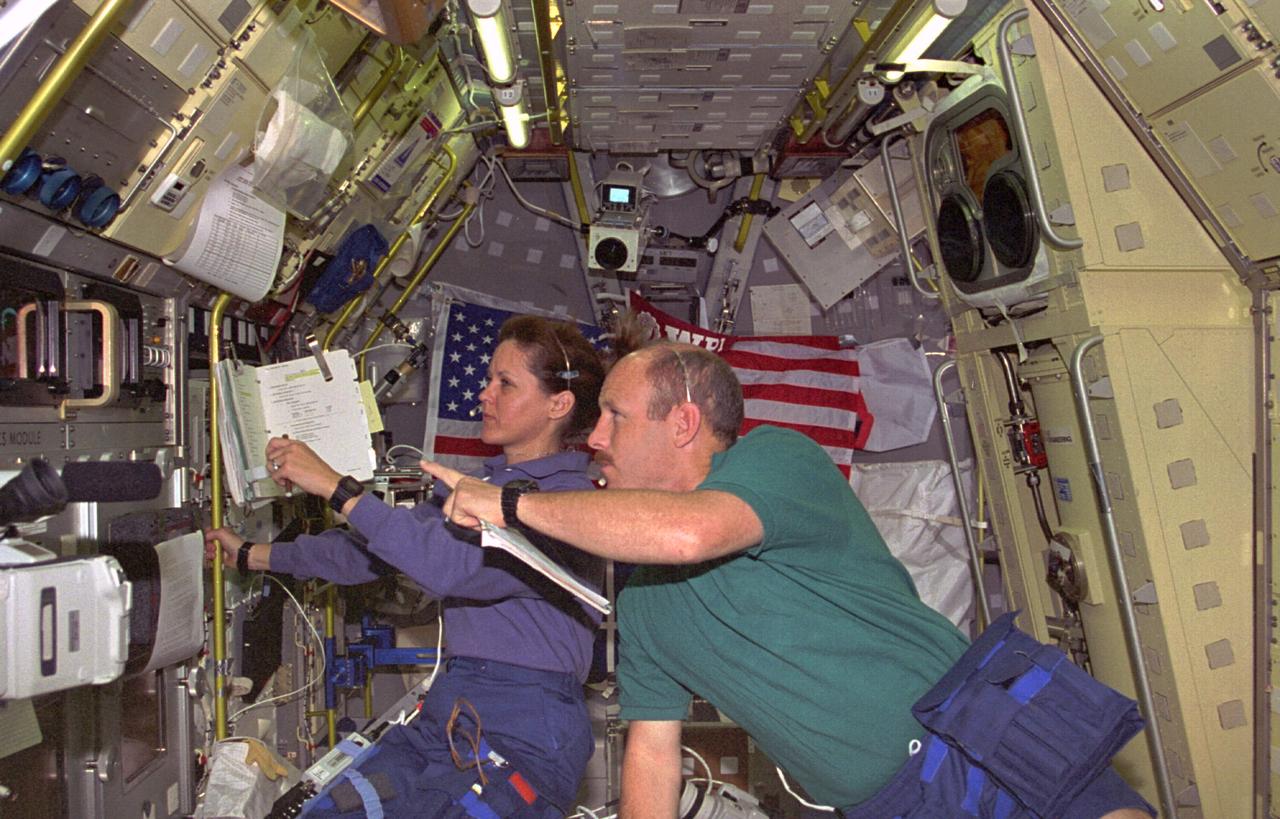
Onboard Space Shuttle Columbia (STS-73) Payload Commander Kathryn Thornton and Commander Ken Bowersox discuss the Drop Physics Module (DPM) experiment in the United States Microgravity Laboratory 2 (USML-2) spacelab science module.
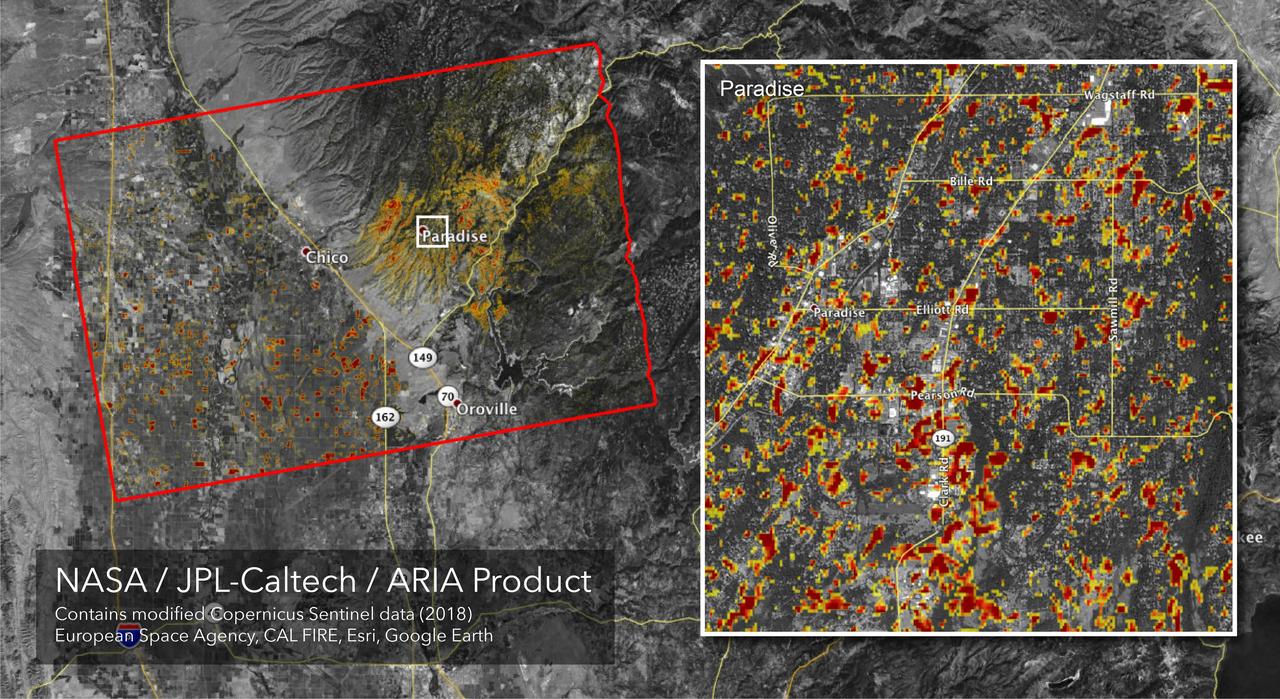
The Advanced Rapid Imaging and Analysis (ARIA) team at NASA's Jet Propulsion Laboratory in Pasadena, California, created this Damage Proxy Map (DPM) depicting areas of Northern California that are likely damaged (shown by red and yellow pixels) as a result of the Camp Fire. The map is derived from synthetic aperture radar (SAR) images from the Copernicus Sentinel-1 satellites, operated by the European Space Agency (ESA). The pre-event images were taken before (November 4, 2018) and the post-event image was acquired during the fire (6pm November 16, 2018, both local time). https://photojournal.jpl.nasa.gov/catalog/PIA22819
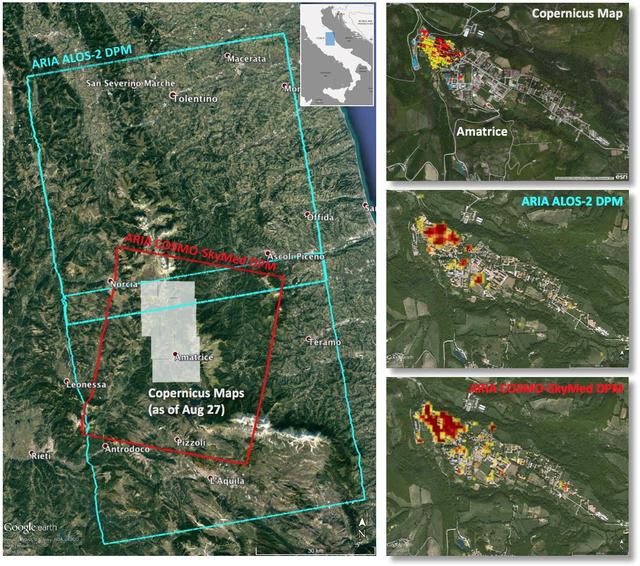
Italy earthquake. The quake has caused significant damage in the historic town of Amatrice. To assist in the disaster response efforts, scientists at NASA's Jet Propulsion Laboratory, Pasadena, California, and the California Institute of Technology in Pasadena, in collaboration with the Italian Space Agency (ASI), generated this image of the earthquake's hardest-hit region. The 40-by-75 mile (65-by-120 kilometer) Damage Proxy Map (DPM) was derived from two consecutive frames of the Japan Aerospace Exploration Agency's (JAXA's) L-band interferometric synthetic aperture radar (InSAR) data from the ALOS-2 satellite (cyan rectangles), and the 25-by-31 mile (40-by-50 kilometer) DPM was derived from InSAR data from the Agenzia Spaciale Italiana's (ASI's) X-band COSMO-SkyMed satellite (red rectangle). Both DPMs cover the historic town of Amatrice, revealing severe damage in the western side of the town (right panels). The time span of the data for the change is Jan. 27, 2016 to Aug. 24, 2016 for ALOS-2 and Aug. 20, 2016 to Aug. 28, 2016 for COSMO-SkyMed. Each pixel in the damage proxy map is about 100 feet (30 meters) across. The SAR data were processed by the Advanced Rapid Imaging and Analysis (ARIA) team at JPL and Caltech. The technique uses a prototype algorithm to rapidly detect surface changes caused by natural or human-produced damage. The assessment technique is most sensitive to destruction of the built environment. When the radar images areas with little to no destruction, its image pixels are transparent. Increased opacity of the radar image pixels reflects damage, with areas in red reflecting the heaviest damage to cities and towns. The color variations from yellow to red indicate increasingly more significant ground surface change. Preliminary validation was done by comparing the DPMs to a damage assessment map produced by the Copernicus Emergency Management Service, which is based on visual inspection of before and after high-resolution aerial imagery -- the extent indicated with gray boxes in the left panel. http://photojournal.jpl.nasa.gov/catalog/PIA20897
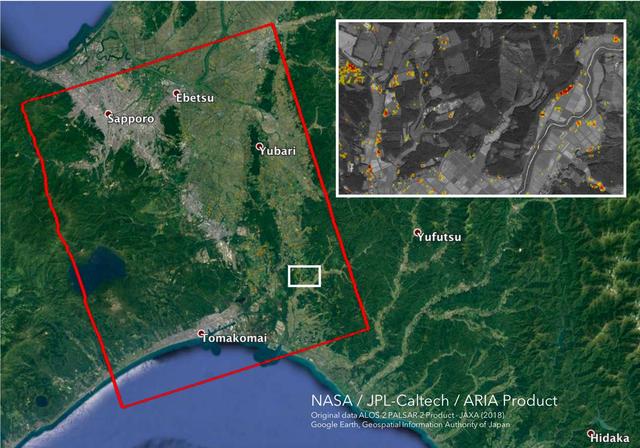
The Advanced Rapid Imaging and Analysis (ARIA) team at NASA's Jet Propulsion Laboratory in Pasadena, California, and Caltech, also in Pasadena, created this Damage Proxy Map (DPM) depicting areas in the southwestern part of Hokkaido, Japan, that are likely damaged as a result of the M6.6 September 5 earthquake in 2018 (shown by red and yellow pixels). The map is derived from synthetic aperture radar (SAR) images from the ALOS-2 satellites, operated by Japan Aerospace Exploration Agency (JAXA). The images were taken before and after the earthquake -- August 23 and September 6, respectively. The map covers an area of 70 by 57 kilometers, shown by the large red polygon. Each pixel measures about 30 meters across. The color variation from yellow to red indicates increasingly more significant ground surface change. Preliminary validation was done by comparing with the high-resolution airborne optical imagery provided by the Geospatial Information Authority of Japan. This damage proxy map should be used as guidance to identify damaged areas, and may be less reliable over vegetated areas. For example, pixels over vegetated areas and farmlands may be false positives, and the lack of colored pixels over vegetated areas does not necessarily mean no damage. The DPM was created by the NASA-JPL/Caltech ARIA team, and the ALOS-2 data were provided by JAXA. The algorithm development was carried out at JPL under a contract with NASA. https://photojournal.jpl.nasa.gov/catalog/PIA22696
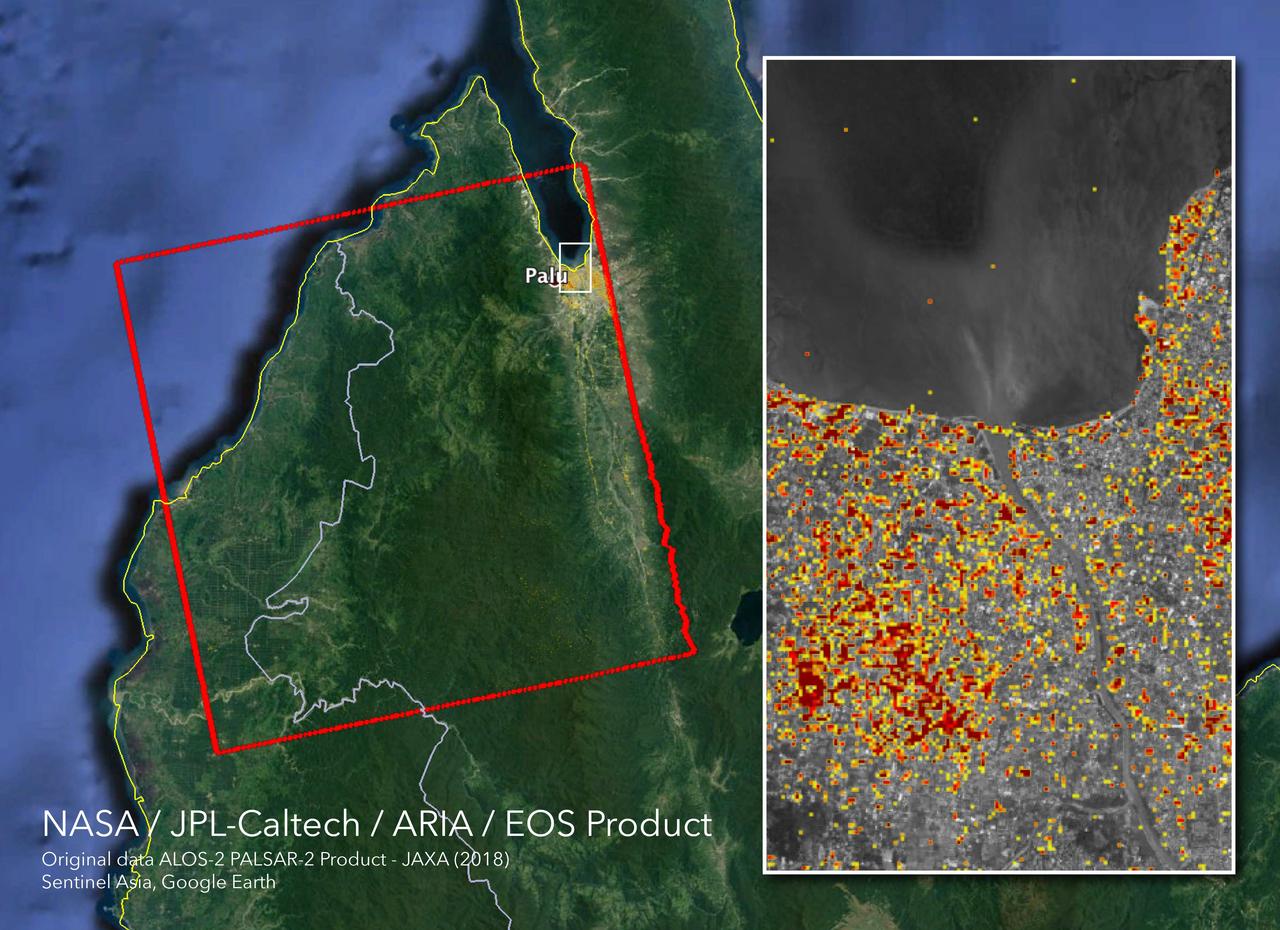
The Advanced Rapid Imaging and Analysis (ARIA) team at NASA's Jet Propulsion Laboratory in Pasadena, California, and Caltech, also in Pasadena, created this Damage Proxy Map (DPM) depicting areas in Central Sulawesi, Indonesia, including the city of Palu, that are likely damaged (shown by red and yellow pixels) as a result of the magnitude 7.5 September 28, 2018 earthquake. The map is derived from synthetic aperture radar (SAR) images from the ALOS-2 satellite, operated by Japan Aerospace Exploration Agency (JAXA). The images were taken before (Aug. 8, 2018) and after (Oct. 3, 2018) the earthquake. The map covers an area of 42 by 44 miles (67 by 70 kilometers), shown by the large red polygon. Each pixel measures about 33 yards (30 meters) across. The color variation from yellow to red indicates increasingly more significant ground surface change. Preliminary validation was done in collaboration with the Earth Observatory of Singapore by comparing with local media information and photos. This damage proxy map should be used as guidance to identify damaged areas, and may be less reliable over vegetated areas. For example, the scattered single colored pixels over vegetated areas may be false positives, and the lack of colored pixels over vegetated areas does not necessarily mean no damage. The DPM was created by the NASA-JPL/Caltech ARIA team, and the ALOS-2 data were provided by JAXA. The Earth Observatory of Singapore coordinated with the Sentinel Asia to timely task the ALOS-2 satellite. The algorithm development was carried out at JPL under a contract with NASA. https://photojournal.jpl.nasa.gov/catalog/PIA22746

The Advanced Rapid Imaging and Analysis (ARIA) team at NASA's Jet Propulsion Laboratory in Pasadena, California, and Caltech, also in Pasadena, created this Damage Proxy Map (DPM) depicting areas in the northeastern part of Lombok Island, Indonesia, that are likely damaged (shown by red and yellow pixels) as a result of the major earthquake sequence (including the M6.4 July 29, the M6.9 August 5, the M5.9 August 9, and the M6.4 August 18 earthquakes) in 2018. The map is derived from synthetic aperture radar (SAR) images from the ALOS-2 satellites, operated by Japan Aerospace Exploration Agency (JAXA). The images were taken before the (May 13, 2018 00:30) and after the (August 19, 2018 00:30, both local time) earthquakes. The map covers an area of 73 by 70 kilometers, shown by the large red polygon. Each pixel measures about 30 meters across. The color variation from yellow to red indicates increasingly more significant ground surface change. Preliminary validation was done by comparing with the DigitalGlobe's high-resolution optical satellite imagery. This damage proxy map should be used as guidance to identify damaged areas, and may be less reliable over vegetated areas. For example, the scattered single colored pixels over vegetated areas may be false positives, and the lack of colored pixels over vegetated areas does not necessarily mean no damage. The DPM was created by the NASA-JPL/Caltech ARIA team, and the ALOS-2 data were provided by JAXA. The Earth Observatory of Singapore coordinated with the Sentinel Asia to timely task the ALOS-2 satellite. The algorithm development was carried out at JPL under a contract with NASA. https://photojournal.jpl.nasa.gov/catalog/PIA22495
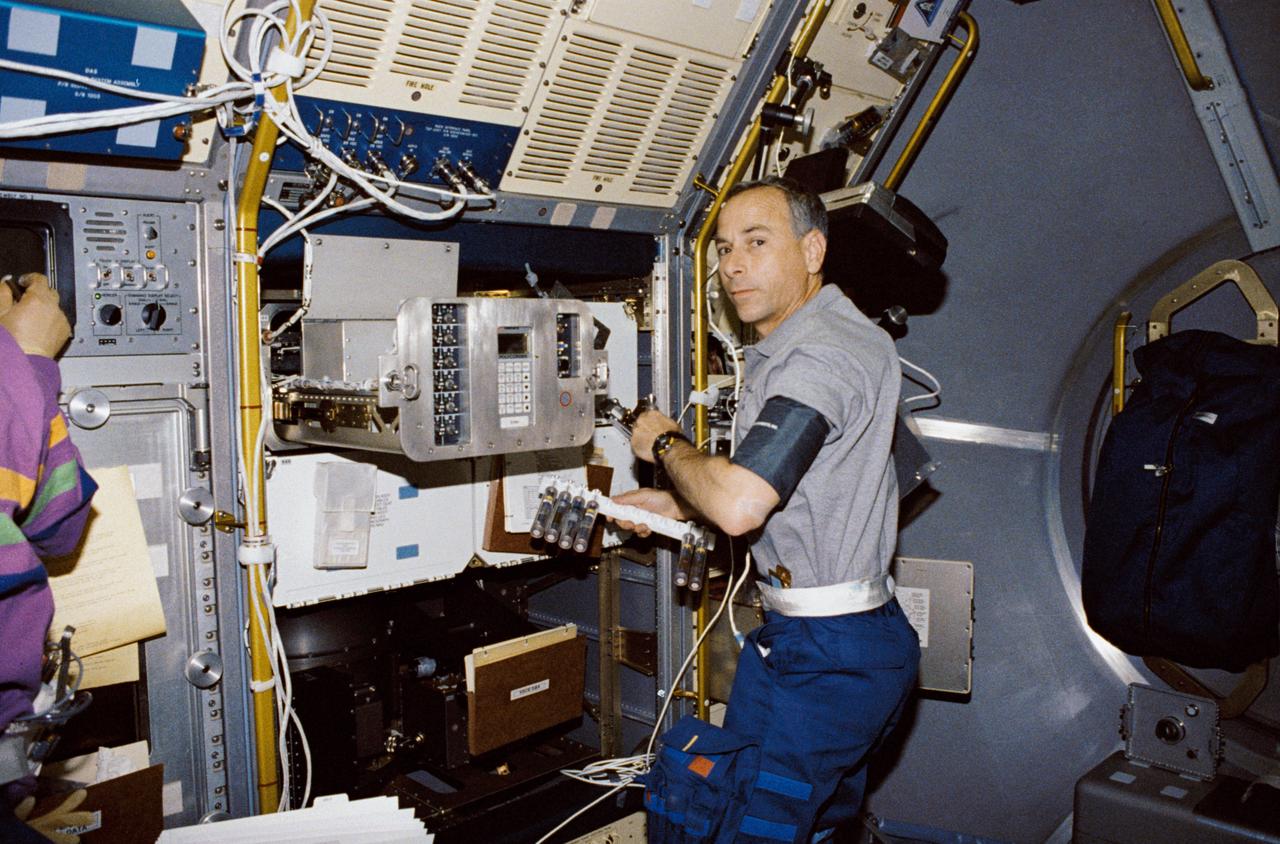
STS050-301-001 (25 June-9July 1992) --- Astronaut Carl J. Meade, mission specialist, works with the Generic Bioprocessing Apparatus in the science module aboard the Earth-orbiting Space Shuttle Columbia. Payload specialist Eugene H. Trinh is partially visible (left), monitoring an experiment in the Drop Physics Module (DPM). The two joined four other astronauts and a second scientist from the private sector for 14-days of scientific data-gathering.

STS050-255-027 (25 June-9 July 1992) --- Payload specialist Eugene H. Trinh, left, and astronaut Carl J. Meade, mission specialist, go to work in the U.S. Microgravity Laboratory (USML-1) science module as the blue shift crew takes over from the red. Trinh is working with an experiment at the Drop Physics Module (DPM) and Meade prepares to monitor an experiment in the Glovebox. The two joined four other astronauts and a second scientist from the private sector for 14-days of scientific data-gathering.
In this photograph, astronaut Eugene Trinh, a payload specialist for this mission, is working at the Drop Physics Module (DPM), and mission specialist Carl Meade is working on the experiment at the Glovebox inside the first United States Microgravity Laboratory (USML-1) Science Module. The USML-1 was one of NASA's missions dedicated to scientific investigations in a microgravity environment inside the Spacelab module. Investigations aboard the USML-1 included: materials science, fluid dynamics, biotechnology (crystal growth), and combustion science. The DPM is dedicated to the detailed study of the dynamics of fluid drops in microgravity. The Glovebox offers experimenters new capabilities and technologies in microgravity with a clean working space and minimizes contamination risks to both Spacelab and experiment samples. Payload specialists are professional scientists or engineers whose only assignment on a space flight is to carry out scientific and technological experiments. Their specific training for a space flight is usually limited to a short period of learning how to live and work in weightlessness. Mission Specialists are both professional scientists and career astronauts. Thus they are a link or bridge between the other crew members, and combine the functions of resident maintenance engineers, in-space counterparts of flight engineers in aircraft, and fully qualified scientists. The USML-1 flew aboard the STS-50 mission on June 1992, and was managed by the Marshall Space Flight Center.
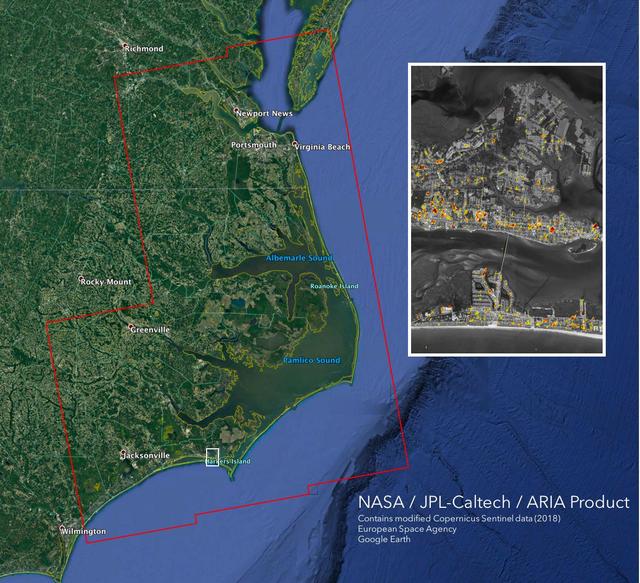
The Advanced Rapid Imaging and Analysis (ARIA) team at NASA's Jet Propulsion Laboratory in Pasadena, California, created this Damage Proxy Map (DPM) depicting areas of the Carolinas that are likely damaged (shown by red and yellow pixels) as a result of Hurricane Florence. The map is derived from synthetic aperture radar (SAR) images from the Copernicus Sentinel-1 satellites, operated by the European Space Agency (ESA). The images were taken before (September 02, 2016) and 12 hours after the hurricane's landfall (September 14, 2018 7:06 PM local time). The map covers an area of 155 miles x 210 miles (250 km x 340 km), indicated with the big red polygon. Each pixel measures about 33 yards x 33 yards (30 m x 30 m). The color variation from yellow to red indicates increasingly more significant ground surface change. Media reports provided anecdotal preliminary validation. This damage proxy map should be used as guidance to identify damaged areas, and may be less reliable over vegetated areas and flooded areas. For example, the scattered single colored pixels over vegetated areas may be false positives, and the lack of colored pixels over vegetated areas does not necessarily mean no damage. https://photojournal.jpl.nasa.gov/catalog/PIA22702
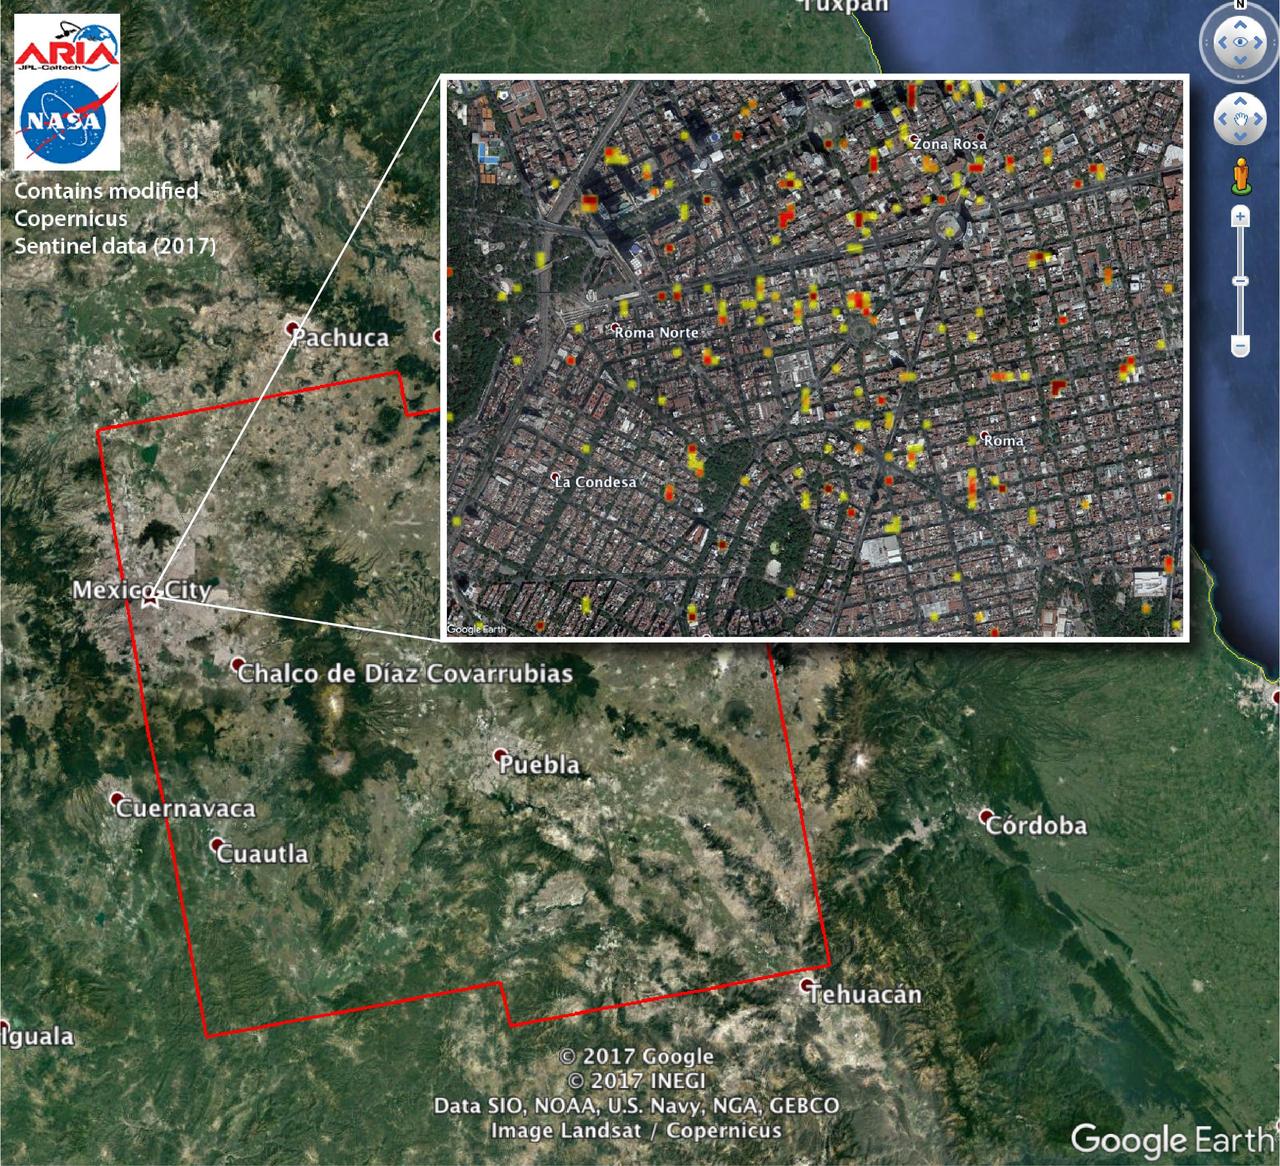
The Advanced Rapid Imaging and Analysis (ARIA) team at NASA's Jet Propulsion Laboratory in Pasadena, California, and Caltech, also in Pasadena, created this Damage Proxy Map (DPM) depicting areas of Central Mexico, including Mexico City, that are likely damaged (shown by red and yellow pixels) from the magnitude 7.1 Raboso earthquake of Sept. 19, 2017 (local time). The map is derived from synthetic aperture radar (SAR) images from the Copernicus Sentinel-1A and Sentinel-1B satellites, operated by the European Space Agency (ESA). The images were taken before (Sept. 8, 2017) and after (Sept. 20, 2017) the earthquake. The map covers an area of 109 by 106 miles (175 by 170 kilometers). Each pixel measures about 33 yards (30 meters) across. The color variation from yellow to red indicates increasingly more significant ground and building surface change. Preliminary validation was done by comparing the DPM to a crowd-sourced Google Map (https://www.google.com/maps/d/u/0/viewer?mid=1_-V97lbdgLFHpx-CtqhLWlJAnYY&ll=19.41452166501326%2C-99.16498240436704&z=16). This damage proxy map should be used as guidance to identify damaged areas, and may be less reliable over vegetated areas. Sentinel-1 data were accessed through the Copernicus Open Access Hub. The image contains modified Copernicus Sentinel data (2017), processed by ESA and analyzed by the NASA-JPL/Caltech ARIA team. This research was carried out at JPL under contract with NASA. https://photojournal.jpl.nasa.gov/catalog/PIA21963
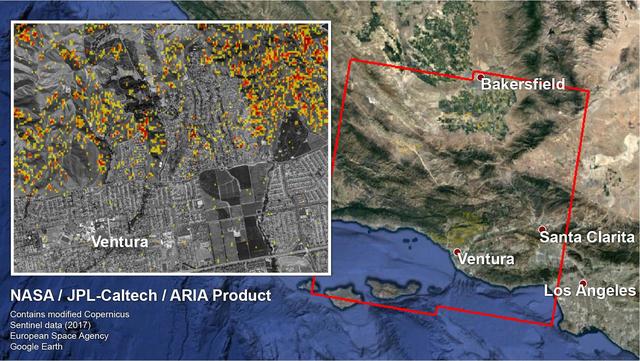
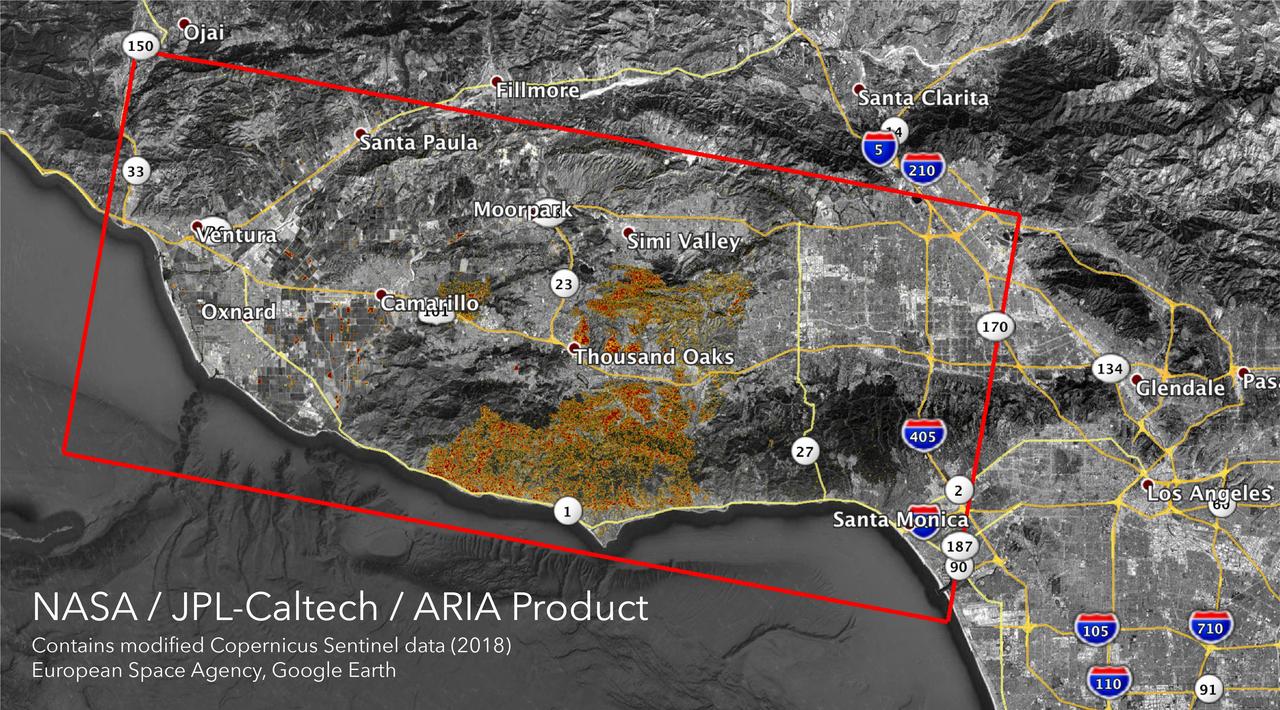
The Advanced Rapid Imaging and Analysis (ARIA) team at NASA's Jet Propulsion Laboratory in Pasadena, California, and Caltech, also in Pasadena, created a Damage Proxy Map (DPM) depicting areas in Southern California that are likely damaged (shown by red and yellow pixels) as a result of recent wildfires, including the Thomas Fire in Ventura and Santa Barbara Counties, highlighted in the attached image taken from the DPM. The map is derived from synthetic aperture radar (SAR) images from the Copernicus Sentinel-1 satellites, operated by the European Space Agency (ESA). The images were taken before (Nov. 28, 2017, 6 a.m. PST) and after (Dec. 10, 2017, 6 a.m. PST) the onset of the fires. The map covers an area of 107 by 107 miles (172 by 172 kilometers), shown by the large red polygon. Each pixel measures about 33 yards (30 meters) across. The color variation from yellow to red indicates increasingly more significant ground surface change. Preliminary validation was done by comparing the map to optical satellite imagery from DigitalGlobe. This damage proxy map should be used as guidance to identify damaged areas, and may be less reliable over vegetated areas. For example, the colored pixels seen over mountainous areas may seem a little scattered even though the reality could be that the contiguous areas were burned. Patches of farmland can also appear as signals due to plowing or irrigation. The full map is available to download from https://aria-share.jpl.nasa.gov/events/20171210-SoCal_Fire/. https://photojournal.jpl.nasa.gov/catalog/PIA22191
The Advanced Rapid Imaging and Analysis (ARIA) team at NASA's Jet Propulsion Laboratory in Pasadena, California, created these Damage Proxy Maps (DPMs) depicting areas in California likely damaged by the Woolsey and Camp Fires. They are derived from synthetic aperture radar (SAR) images from the Copernicus Sentinel-1 satellites, operated by the European Space Agency (ESA). The pre-event images for the Woolsey Fire in Southern California were taken before the fire on Oct. 30, 2018 and the post-event image was acquired during the fire on Nov. 11, 2018. The map covers an area of 50 miles x 25 miles (80 km x 40 km), indicated with the big red polygon. Each pixel measures about 33 yards x 33 yards (30 m x 30 m). The color variation from yellow to red indicates increasingly more significant ground surface change. The pre-event images for the Camp Fire in Northern California were taken on Nov. 4, 2018 and the post-event images were acquired during the fire on Nov. 10, 2018. The map covers an area of 55 miles x 48 miles (88 km x 77 km). As in the previous image, each pixel measures about 33 yards x 33 yards (30 m x 30 m). The color variation from yellow to red indicates increasingly more significant ground surface change. Preliminary validation for both maps was done by comparing approximate location data to Google's Crisismap. These damage proxy maps can be used as guidance to identify damaged areas with the understanding that they may be less reliable over vegetated areas including farmlands. For example, the scattered single colored pixels over vegetated areas may be false positives, and the lack of colored pixels over vegetated areas does not necessarily mean no damage. https://photojournal.jpl.nasa.gov/catalog/PIA22816
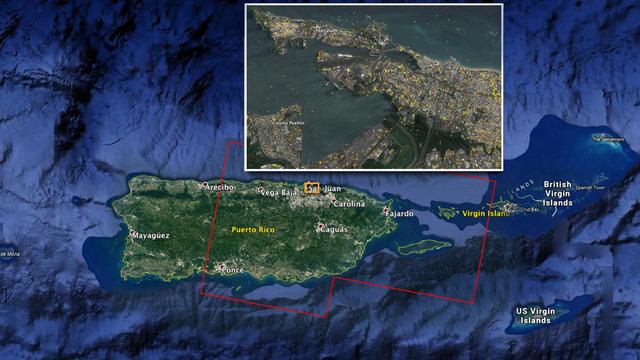
The Advanced Rapid Imaging and Analysis (ARIA) team at NASA's Jet Propulsion Laboratory in Pasadena, California, and Caltech, also in Pasadena, created this Damage Proxy Map (DPM) depicting areas of Eastern Puerto Rico that are likely damaged (shown by red and yellow pixels) as a result of Hurricane Maria (a Category 4 hurricane at landfall in Puerto Rico on Sept. 20, 2017). The map is derived from synthetic aperture radar (SAR) images from the Copernicus Sentinel-1A and Sentinel-1B satellites, operated by the European Space Agency (ESA). The images were taken before (March 25, 2017) and after (Sept. 21, 2017) the storm's landfall. The map was delivered to responding agencies, including the Federal Emergency Management Agency (FEMA), on Sept. 22, 2017. FEMA combined the map with building infrastructure data to estimate a damage density map, which was sent to its Urban Search and Rescue teams in the field in Puerto Rico. The map covers an area of 105 by 60 miles (169 by 96 kilometers), shown by the large red polygon in the figure. The inset, denoted by the orange rectangle, shows the extent of damage in and around the capital city of San Juan. Each pixel measures about 98 feet (30 meters) across. The color variation from yellow to red indicates increasingly more significant ground surface change. Preliminary validation was done by comparing the map with anecdotal reports of damage. This damage proxy map should be used as guidance to identify damaged areas, and may be less reliable over vegetated and flooded areas. Sentinel-1 data were accessed through the Copernicus Open Access Hub. The image contains modified Copernicus Sentinel data (2017), processed by ESA and analyzed by the NASA-JPL/Caltech ARIA team. This research was carried out at JPL under a contract with NASA. https://photojournal.jpl.nasa.gov/catalog/PIA21964
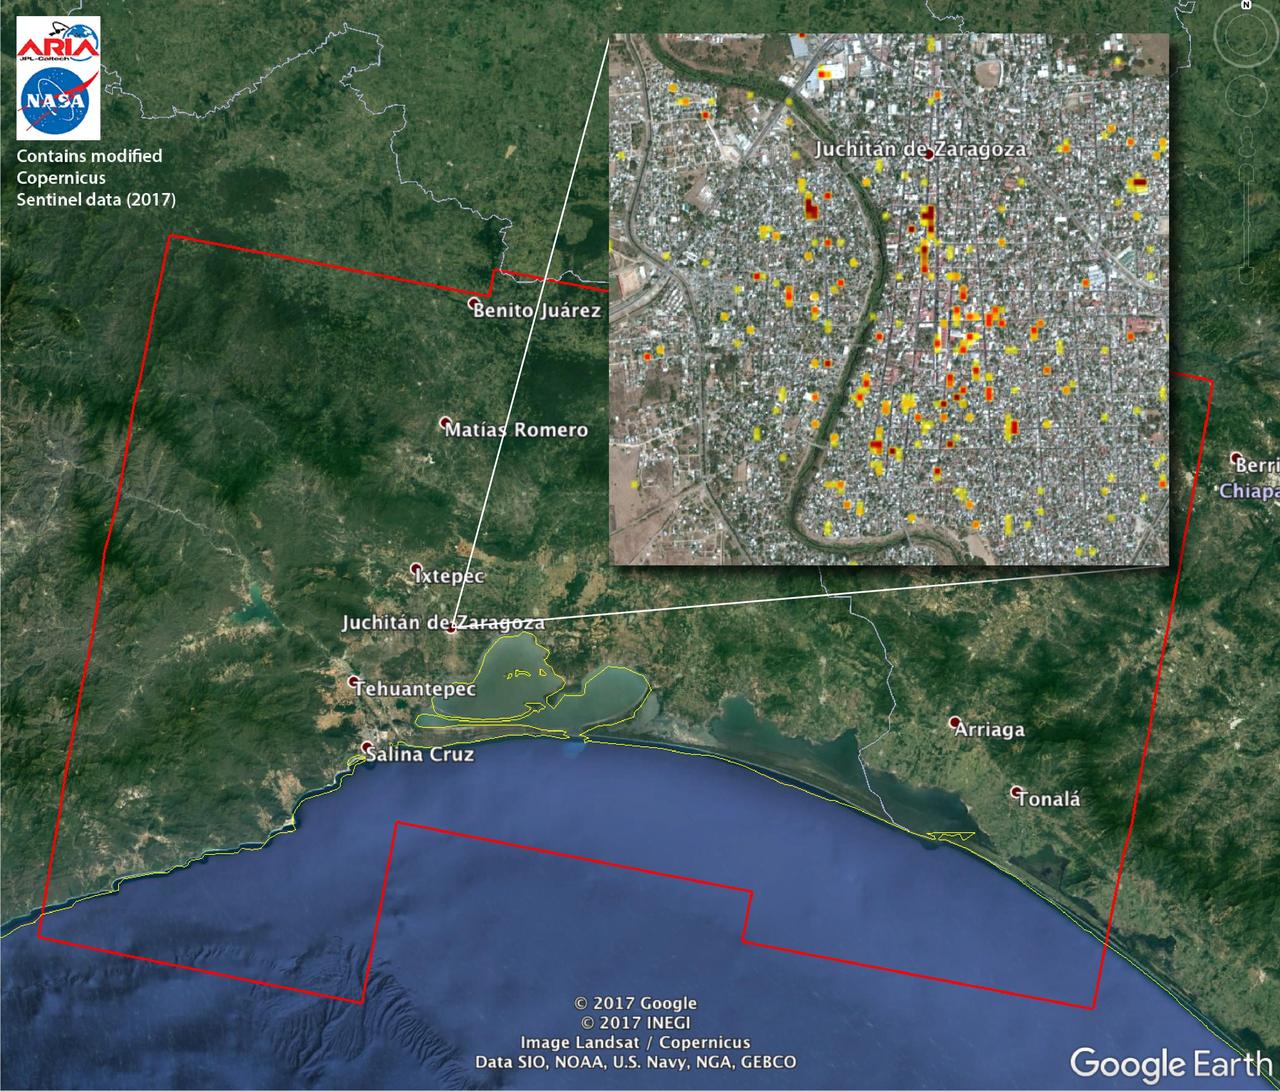
The Advanced Rapid Imaging and Analysis (ARIA) team at NASA's Jet Propulsion Laboratory in Pasadena, California, and Caltech, also in Pasadena, created this Damage Proxy Map (DPM) depicting areas of Southern Mexico that are likely damaged (shown by red and yellow pixels) from the magnitude 8.1 Chiapas earthquake of Sept. 7, 2017 (near midnight local time, early morning on Sept. 8 UTC). The map is derived from synthetic aperture radar (SAR) images from the Copernicus Sentinel-1A and Sentinel-1B satellites, operated by the European Space Agency (ESA). The images were taken before (Sept. 7, 2017 UTC) and after (Sept. 13, 2017 UTC) the earthquake. The map covers an area of 155 by 106 miles (250 by 170 kilometers). Each pixel measures about 33 yards (30 meters) across. The color variation from yellow to red indicates increasingly more significant ground surface change. Preliminary validation was done by comparing the SAR images to optical satellite imagery from DigitalGlobe. This damage proxy map should be used as guidance to identify damaged areas, and may be less reliable over vegetated areas. Sentinel-1 data were accessed through the Copernicus Open Access Hub. The image contains modified Copernicus Sentinel data (2017), processed by ESA and analyzed by the NASA-JPL/Caltech ARIA team. This research was carried out at JPL under a contract with NASA. https://photojournal.jpl.nasa.gov/catalog/PIA21956
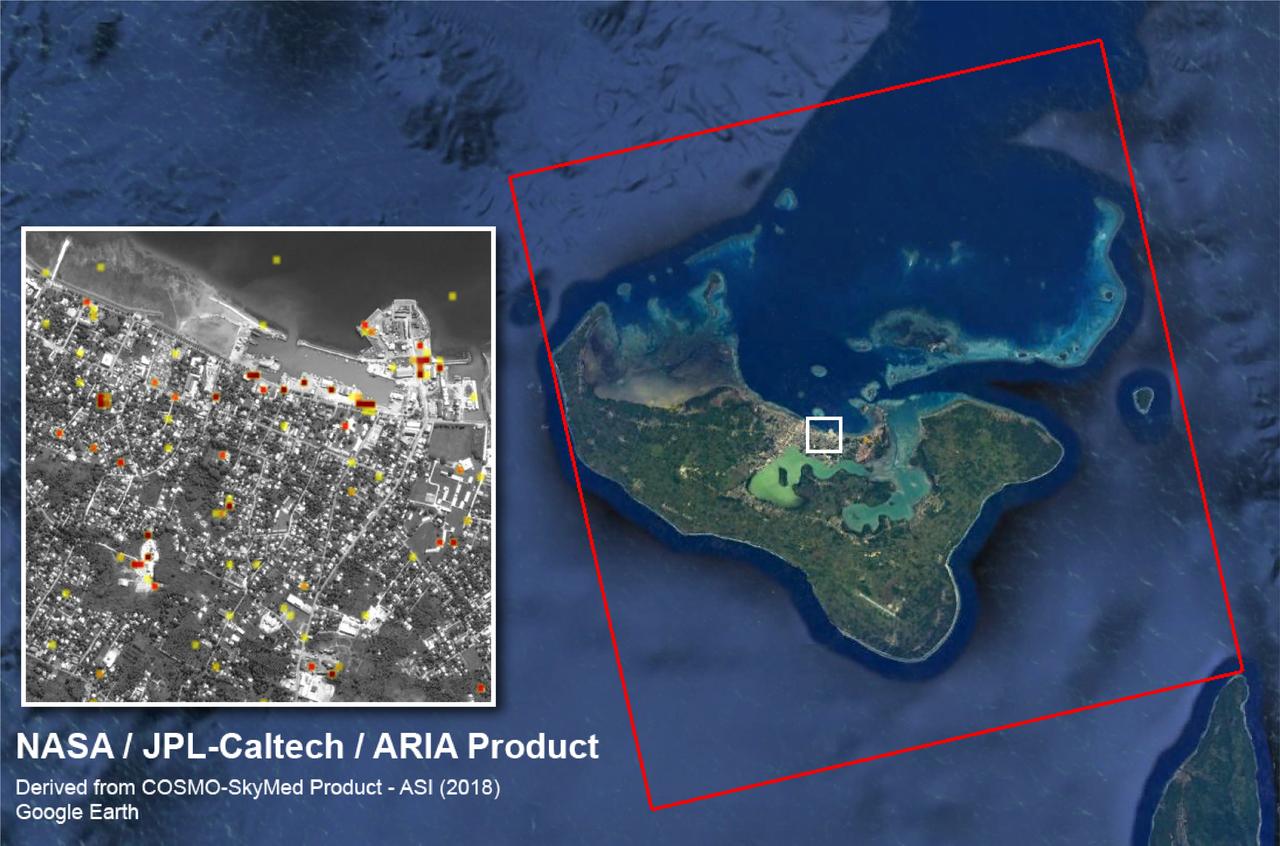
The Advanced Rapid Imaging and Analysis (ARIA) team at NASA's Jet Propulsion Laboratory created this Damage Proxy Map (DPM) of Tongatapu, the main island of Tonga, following the landfall of Cyclone Gita, a Category 4 storm that hit Tonga on Feb. 12-13, 2018. The map depicts areas that are likely damaged from the storm, shown by red and yellow pixels. The map was produced by comparing two pairs of interferometric synthetic aperture radar (InSAR) images from the COSMO-SkyMed satellites, operated by the Italian Space Agency (ASI). The pre- and post-cyclone images were acquired on Jan. 19 and Feb. 13, 2018, respectively. The later image was acquired just 4-1/2 hours after the peak damage by the cyclone. The map covers the entire island of Tongatapu (the 25-by-25-mile, or 40-by-40 kilometer SAR image footprint indicated with the large red polygon). Each pixel measures about 98 feet (30 meters) across. The color variation from yellow to red indicates increasingly more significant ground surface change. Preliminary validation of the SAR data was done by comparing them with high-resolution optical imagery acquired by DigitalGlobe. This Damage Proxy Map should be used as guidance to identify damaged areas and may be less reliable over vegetated and flooded areas. https://photojournal.jpl.nasa.gov/catalog/PIA22257
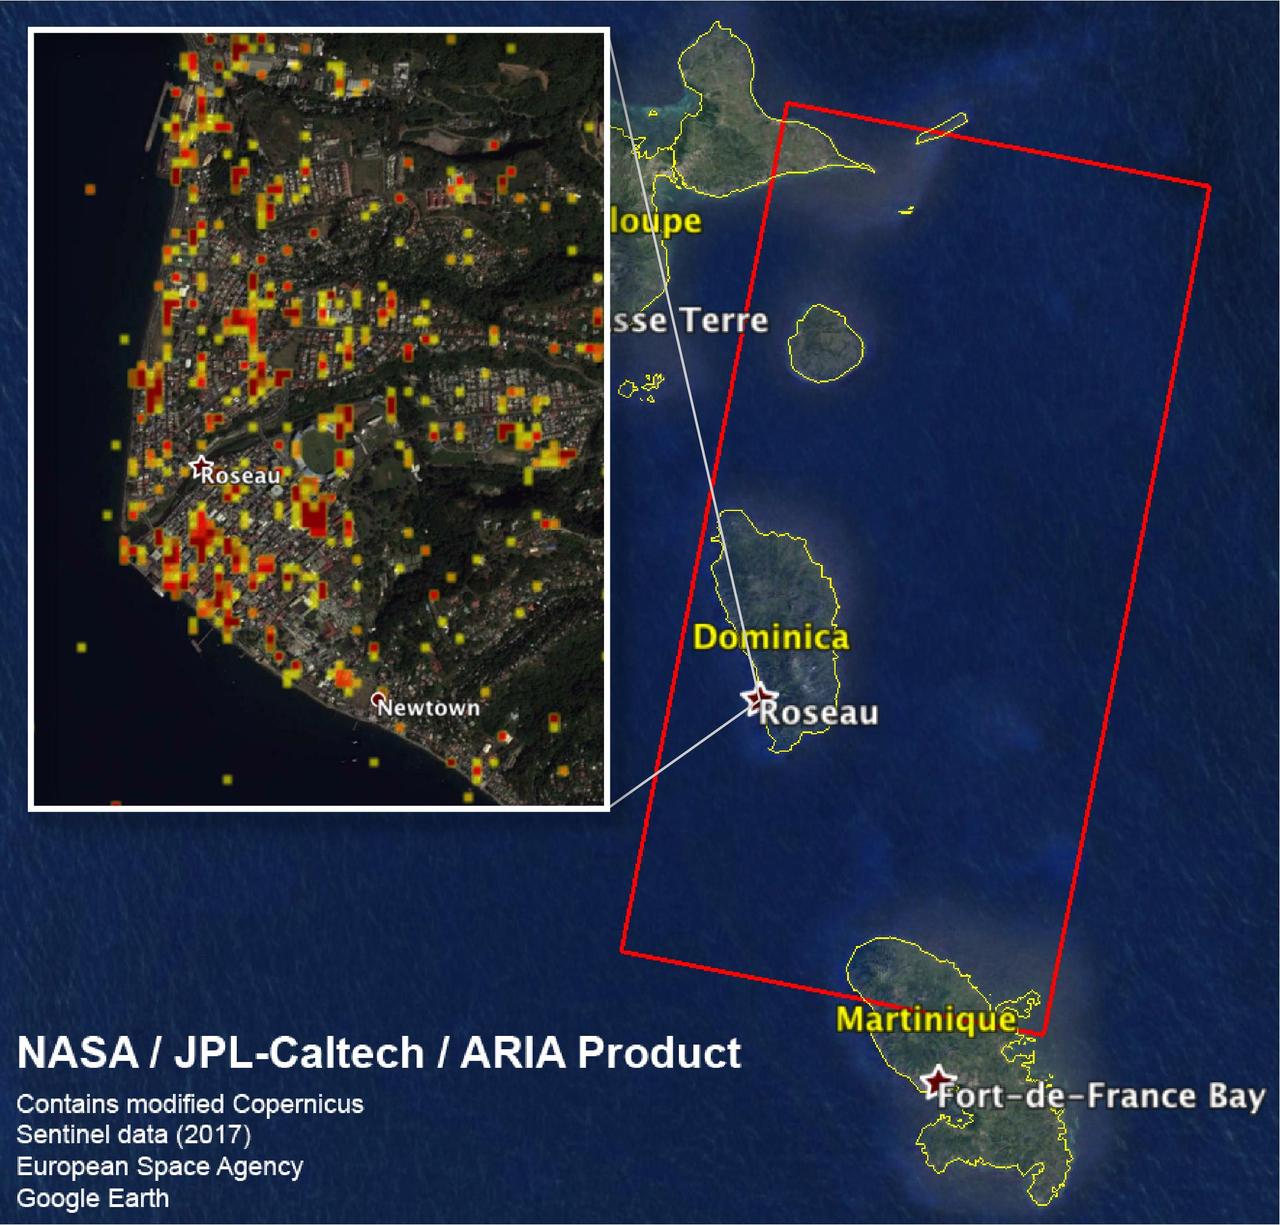
The Advanced Rapid Imaging and Analysis (ARIA) team at NASA's Jet Propulsion Laboratory in Pasadena, California, and Caltech, also in Pasadena, created this Damage Proxy Map (DPM) depicting areas including the Commonwealth of Dominica, that are likely damaged (shown by red and yellow pixels) as a result of Hurricane Maria (a Category 5 storm at landfall in Dominica on Sept. 18, 2017). The map is derived from synthetic aperture radar (SAR) images from the Copernicus Sentinel-1 satellites, operated by the European Space Agency (ESA). The images were taken before (March 27, 2017) and after (Sept. 23, 2017) the landfall of the storm. The map covers the area within the large red polygon, which measures 53 by 106 miles (85 by 170 kilometers). Each pixel measures about 98 feet (30 meters) across. The color variation from yellow to red indicates increasingly more significant ground surface change. Preliminary validation was done by comparing the data to a crowdsourced map by Clemson Center for Geospatial Technologies and optical satellite imagery feom DigitalGlobe. This damage proxy map should be used as guidance to identify damaged areas, and may be less reliable over vegetated areas. Sentinel-1 data were accessed through the Copernicus Open Access Hub. The image contains modified Copernicus Sentinel data (2017), processed by ESA and analyzed by the NASA/JPL-Caltech ARIA team. This research was carried out at JPL under a contract with NASA. https://photojournal.jpl.nasa.gov/catalog/PIA22037