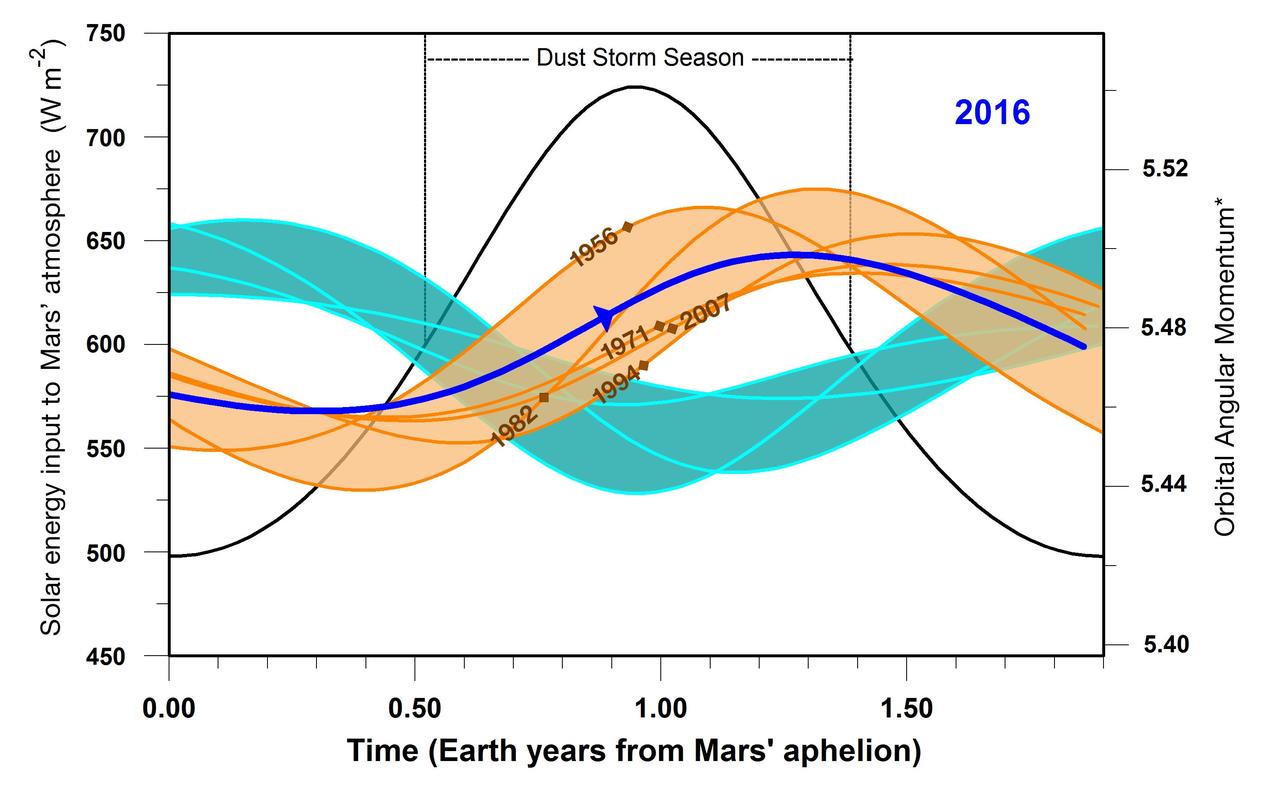
This graphic indicates a similarity between 2016 (dark blue line) and five past years in which Mars has experienced a global dust storm (orange lines and band), compared to years with no global dust storm (blue-green lines and band). The arrow nearly midway across in the dark blue line indicates the Mars time of year in late September 2016. A key factor in the graph is the orbital angular momentum of Mars, which would be steady in a system of only one planet orbiting the sun, but varies due to relatively small effects of having other planets in the solar system. The horizontal scale is time of year on Mars, starting at left with the planet's farthest distance from the sun in each orbit. This point in the Mars year, called "Mars aphelion," corresponds to late autumn in the southern hemisphere. Numeric values on the horizontal axis are in Earth years; each Mars year lasts for about 1.9 Earth years. The vertical scale bar at left applies only to the black-line curve on the graph. The amount of solar energy entering Mars' atmosphere (in watts per square meter) peaks at the time of year when Mars is closest to the sun, corresponding to late spring in the southern hemisphere. The duration of Mars' dust storm season, as indicated, brackets the time of maximum solar input to the atmosphere. The scale bar at right, for orbital angular momentum, applies to the blue, brown and blue-green curves on the graph. The values are based on mass, velocity and distance from the gravitational center of the solar system. Additional information on the units is in a 2015 paper in the journal Icarus, from which this graph is derived. The band shaded in orange is superimposed on the curves of angular momentum for five Mars years that were accompanied by global dust storms in 1956, 1971, 1982, 1994 and 2007. Brown diamond symbols on the curves for these years in indicate the times when the global storms began. The band shaded blue-green lies atop angular momentum curves for six years when no global dust storms occurred: 1939, 1975, 1988, 1998, 2000 and 2011. Note that in 2016, as in the pattern of curves for years with global dust storms, the start of the dust storm season corresponded to a period of increasing orbital angular momentum. In years with no global storm, angular momentum was declining at that point. Observations of whether dust from regional storms on Mars spreads globally in late 2016 or early 2017 will determine whether this correspondence holds up for the current Mars year. http://photojournal.jpl.nasa.gov/catalog/PIA20855
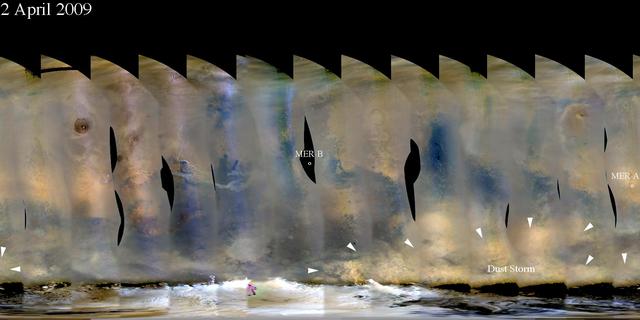
Dust Storm

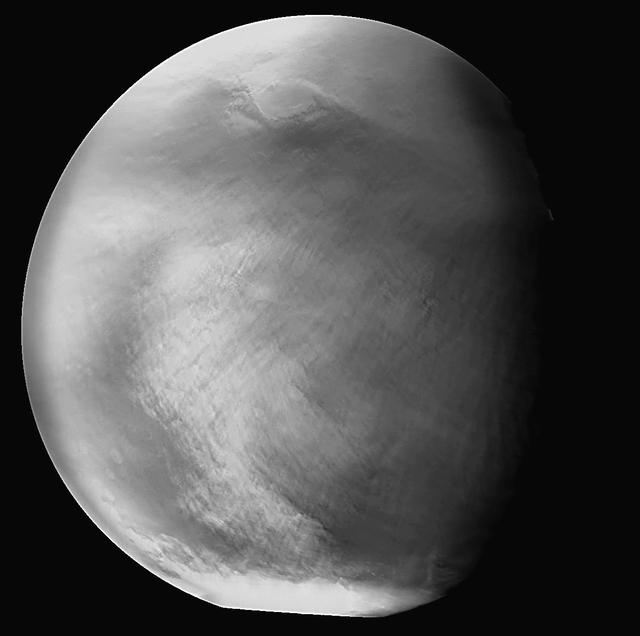
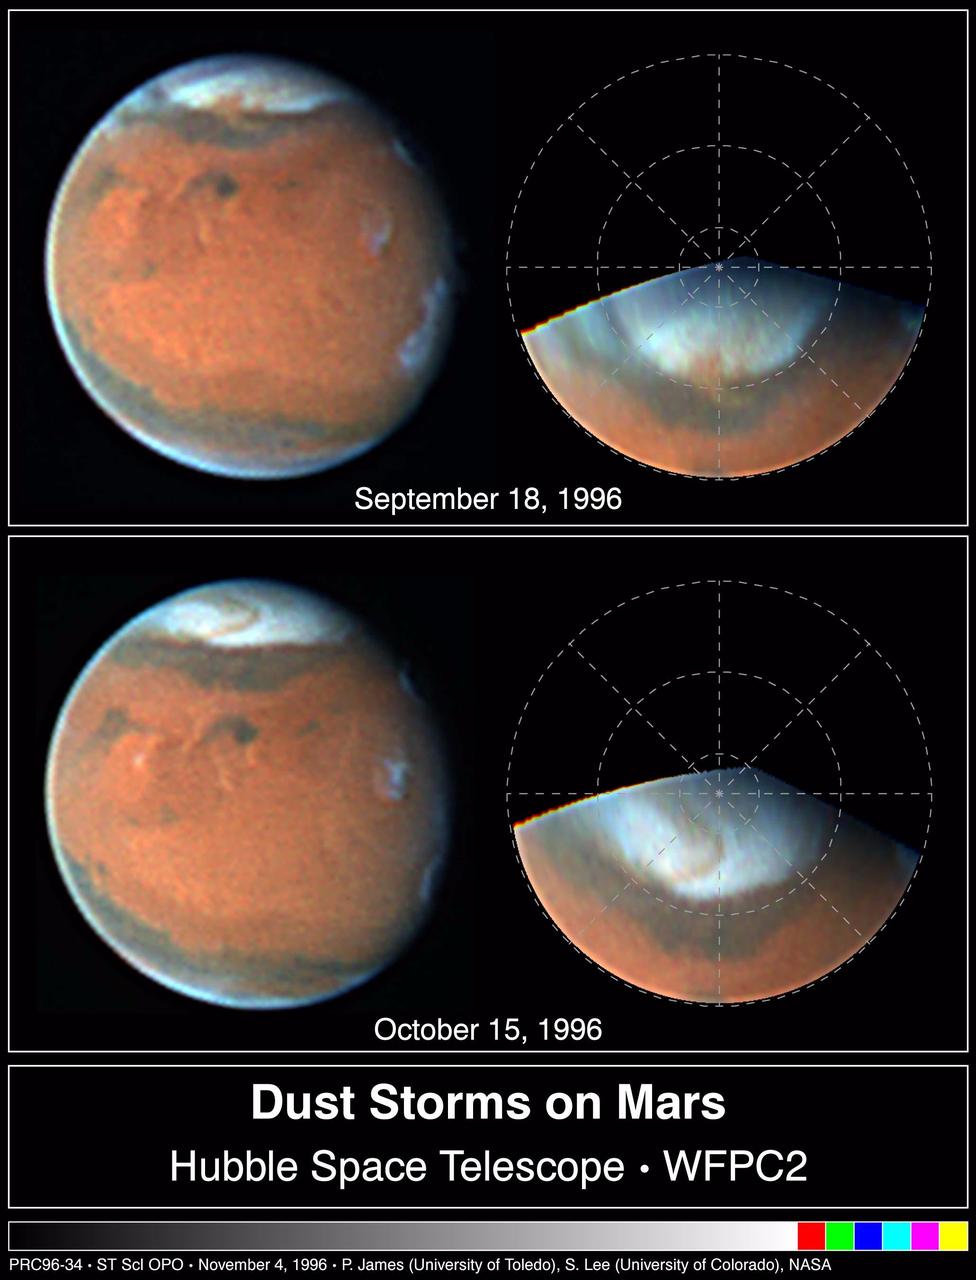
Dust Storms

This global map of Mars shows a growing dust storm as of June 6, 2018. The map was produced by the Mars Color Imager (MARCI) camera on NASA's Mars Reconnaissance Orbiter spacecraft. The blue dot shows the approximate location of Opportunity. The storm was first detected on June 1. The MARCI camera has been used to monitor the storm ever since. Full dust storms like this one are not surprising, but are infrequent. They can crop up suddenly but last weeks, even months. During southern summer, sunlight warms dust particles, lifting them higher into the atmosphere and creating more wind. That wind kicks up yet more dust, creating a feedback loop that NASA scientists still seek to understand. https://photojournal.jpl.nasa.gov/catalog/PIA22329
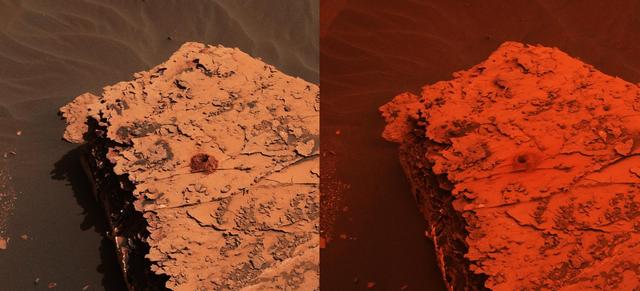
Two images from the Mast Camera (Mastcam) on NASA's Curiosity rover depict the change in the color of light illuminating the Martian surface since a dust storm engulfed Gale Crater. The left image shows the "Duluth" drill site on Sol 2058 (May 21, 2018); the right image is from Sol 2084 (June 17). The cherry red color in the post-storm image is due to a few factors. One difference between the two images is exposure time: the dust over Curiosity creates low-lighting conditions that require longer exposure times for the cameras. The pre-storm image had an exposure time of 7.3 milliseconds, which is normal for the rover; the later image had an exposure time that was 66 milliseconds -- or nine times longer. But a primary factor is red light being filtered through the dust; very little green and essentially no blue light makes it through the dust cloud. It's not unlike the way a forest fire changes the color of light, or a red stage light filters the other colors out. Though the first pre-storm image was taken at an earlier time of day, it has a much deeper shadow than the second image. That is because the whole sky is red and illuminating the rock from all sides. Individual images are available at https://photojournal.jpl.nasa.gov/catalog/PIA22330
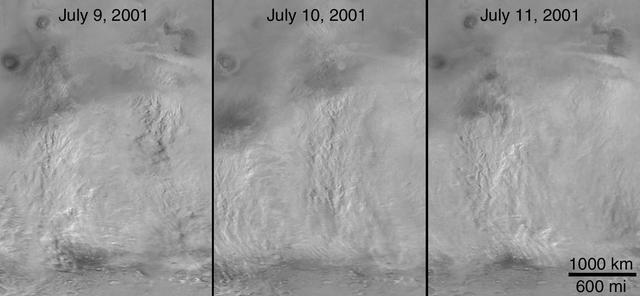
The view from May shows Valles Marineris chasms (left), Meridiani center, an autumn dust storm in Acidalia (top) and the early spring south polar cap (bottom). The view from July shows the same regions, but most of the surface was obscured by the planet-encircling dust cloud and haze. Movies are available at https://photojournal.jpl.nasa.gov/catalog/PIA22487
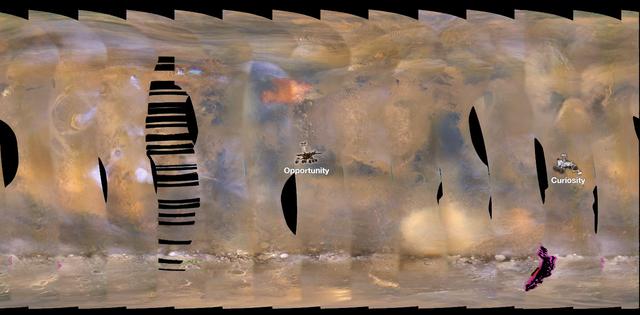
This set of images from NASA's Mars Reconnaissance Orbiter (MRO) shows a fierce, giant dust storm is kicking up on Mars, with rovers on the surface indicated as icons. The spread of the storm can be seen in the salmon-colored overlay. These images from MRO's Mars Color Imager start from May 31, when the dust event was first detected, and go through June 11, 2018. MRO creates global maps of Mars but roll maneuvers for targeted observations produce gaps in the coverage, which appear as black gores in the maps. On some days there are data drops where partial or full orbits of coverage are missing. Green and purple observed in the south polar region indicate saturated pixels. Latitude is indicated along the vertical axis. Longitude is indicated along the horizontal axis. https://photojournal.jpl.nasa.gov/catalog/PIA22519
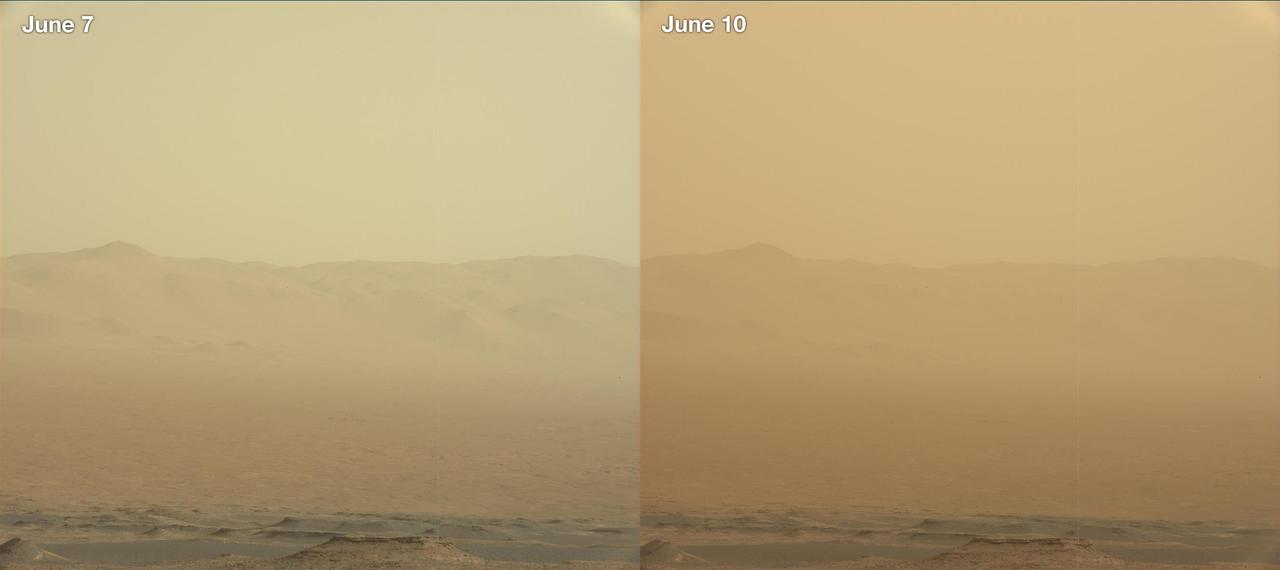
These two views from NASA's Curiosity rover, acquired specifically to measure the amount of dust inside Gale Crater, show that dust has increased over three days from a major Martian dust storm. The left-hand image shows a view of the east-northeast rim of Gale Crater on June 7, 2018 (Sol 2074); the right-hand image shows a view of the same feature on June 10, 2018 (Sol 2077). The images were taken by the rover's Mastcam. https://photojournal.jpl.nasa.gov/catalog/PIA22520

Dust Storm in Syria
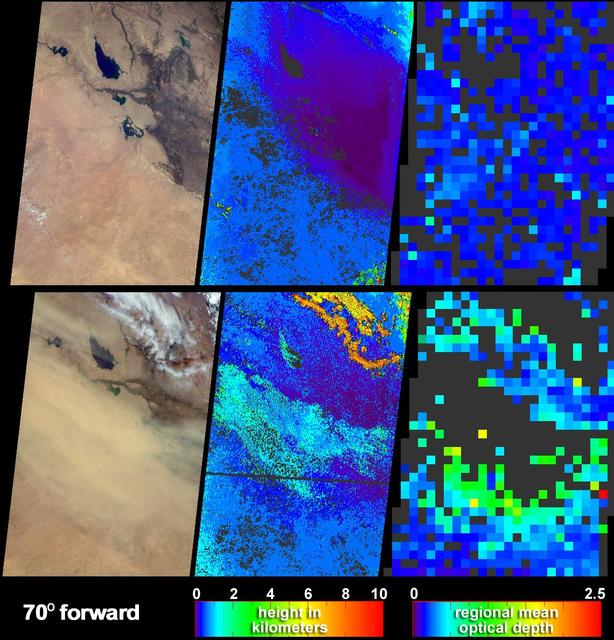
Noachis Dust Storm
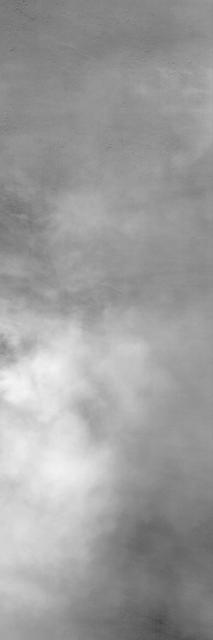
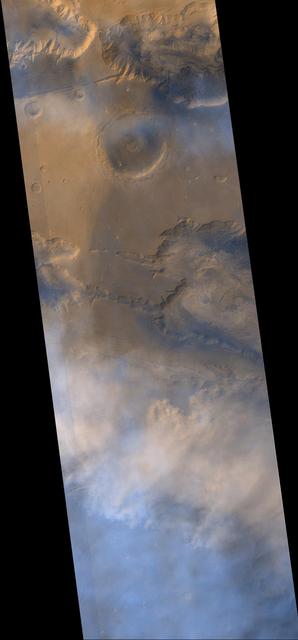
Clouds and Dust Storms

Polar Dust Storm

May Dust Storm in Acidalia
Autumn Dust Storm

Decay of a Martian Dust Storm

Autumn Dust Storm
Melas Dust Storm
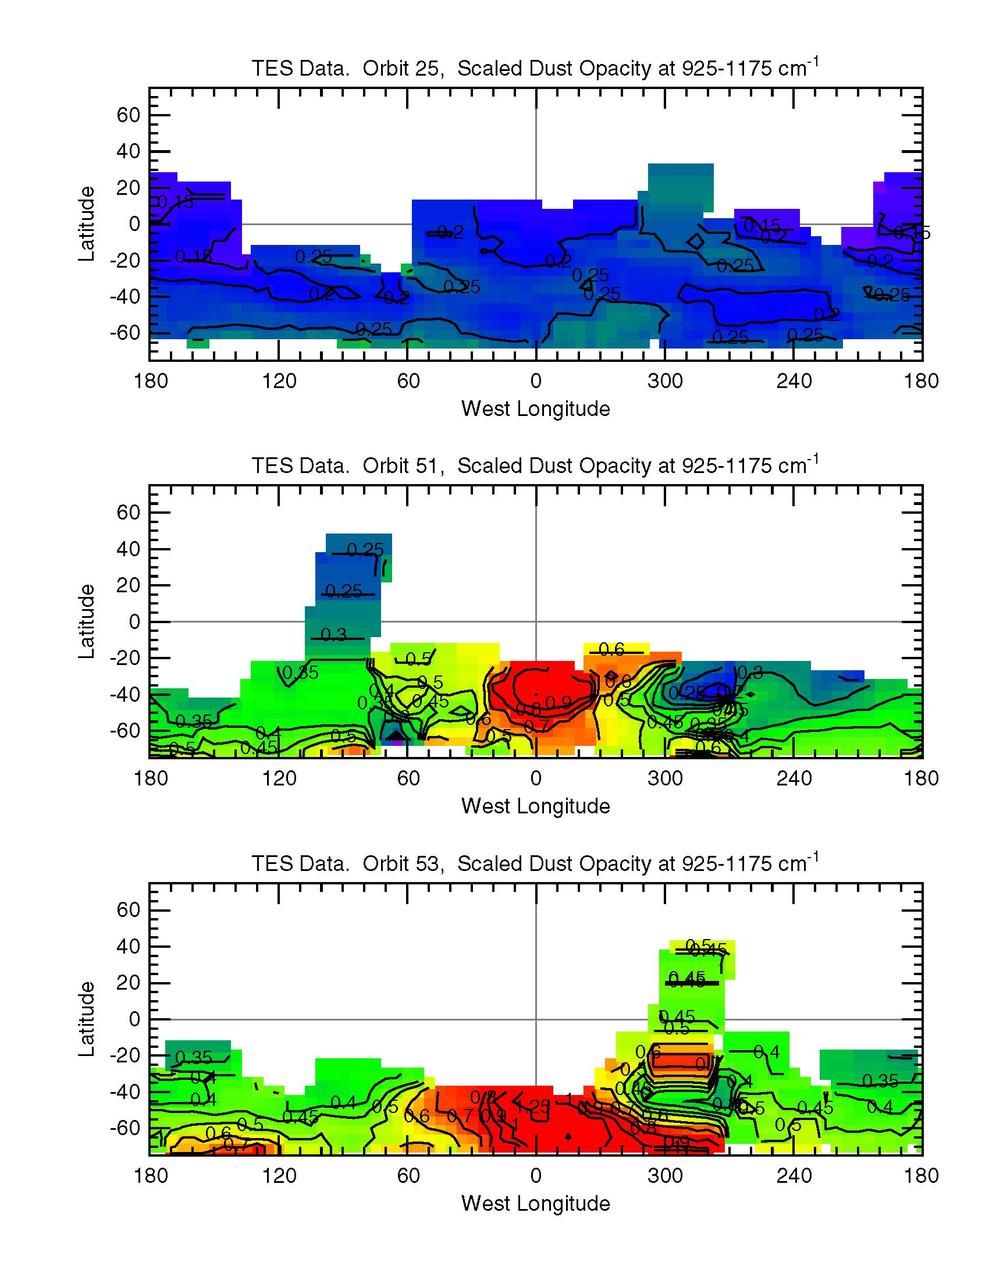
Growth of a Dust Storm TES
Time for Dust Storms
Early Autumn Dust Storm
1997 Martian Dust Storm
Syria/Claritas Dust Storm
North Polar Dust Storm
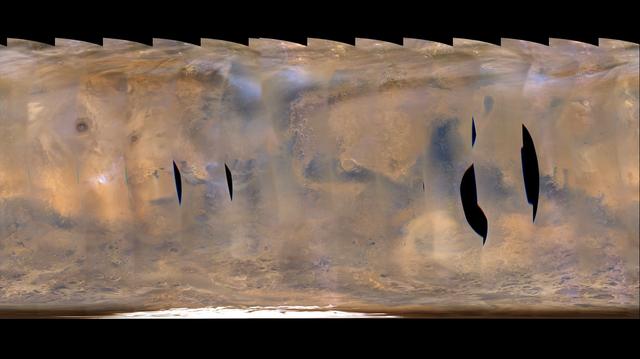
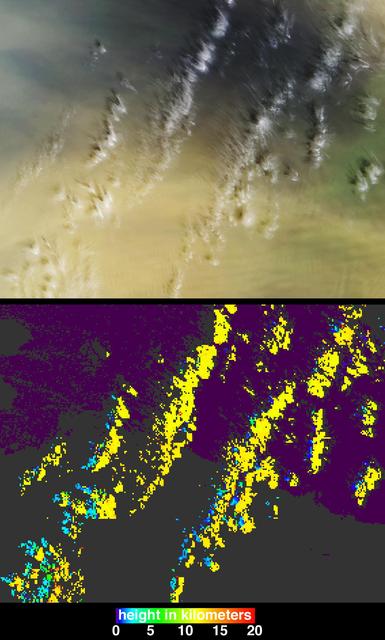
This frame from a movie clip of hundreds of images from NASA's Mars Reconnaissance Orbiter shows a global map of Mars with atmospheric changes from Feb. 18, 2017 through March 6, 2017, a period when two regional-scale dust storms appeared. It combines hundreds of images from the Mars Color Imager (MARCI) camera on NASA's Mars Reconnaissance Orbiter. The date for each map in the series is given at upper left. Dust storms appear as pale tan. In the opening frames, one appears left of center, near the top (north) of the map, then grows in size as it moves south, eventually spreading to about half the width of the map after reaching the southern hemisphere. As the dust from that first storm becomes more diffuse in the south, another storm appears near the center of the map in the final frames. In viewing the movie, it helps to understand some of the artifacts produced by the nature of MARCI images when seen in animation. MARCI acquires images in swaths from pole-to-pole during the dayside portion of each orbit. The camera can cover the entire planet in just over 12 orbits, and takes about one day to accumulate this coverage. The individual swaths for each day are assembled into a false-color, map-projected mosaic for the day. Equally spaced blurry areas that run from south-to-north result from the high off-nadir viewing geometry in those parts of each swath, a product of the spacecraft's low orbit. Portions with sharper-looking details are the central part of an image, viewing more directly downward through less atmosphere than the obliquely viewed portions. MARCI has a 180-degree field of view, and Mars fills about 78 percent of that field of view when the camera is pointed down at the planet. However, the Mars Reconnaissance Orbiter often is pointed to one side or the other off its orbital track in order to acquire targeted observations by other imaging systems on the spacecraft. When such rolls exceed about 20 degrees, gaps occur in the mosaic of MARCI swaths. Other dark gaps appear where data are missing. It isn't easy to see the actual dust motion in the atmosphere in these images, owing to the apparent motion of these artifacts. However, by concentrating on specific surface features (craters, prominent ice deposits, etc.) and looking for the tan clouds of dust, it is possible to see where the storms start and how they grow, move and eventually dissipate. Movies are available at http://photojournal.jpl.nasa.gov/catalog/PIA21484
Dust storm in Alaska captured by Aqua/MODIS on Nov. 17, 2013 at 21:45 UTC. When glaciers grind against underlying bedrock, they produce a silty powder with grains finer than sand. Geologists call it “glacial flour” or “rock flour.” This iron- and feldspar-rich substance often finds its ways into rivers and lakes, coloring the water brown, grey, or aqua. When river or lake levels are low, the flour accumulates on drying riverbanks and deltas, leaving raw material for winds to lift into the air and create plumes of dust. Scientists are monitoring Arctic dust for a number of reasons. Dust storms can reduce visibility enough to disrupt air travel, and they can pose health hazards to people on the ground. Dust is also a key source of iron for phytoplankton in regional waters. Finally, there is the possibility that dust events are becoming more frequent and severe due to ongoing recession of glaciers in coastal Alaska. To read more about dust storm in this region go to: <a href="http://earthobservatory.nasa.gov/IOTD/view.php?id=79518" rel="nofollow">earthobservatory.nasa.gov/IOTD/view.php?id=79518</a> Credit: NASA/GSFC/Jeff Schmaltz/MODIS Land Rapid Response Team <b><a href="http://www.nasa.gov/audience/formedia/features/MP_Photo_Guidelines.html" rel="nofollow">NASA image use policy.</a></b> <b><a href="http://www.nasa.gov/centers/goddard/home/index.html" rel="nofollow">NASA Goddard Space Flight Center</a></b> enables NASA’s mission through four scientific endeavors: Earth Science, Heliophysics, Solar System Exploration, and Astrophysics. Goddard plays a leading role in NASA’s accomplishments by contributing compelling scientific knowledge to advance the Agency’s mission. <b>Follow us on <a href="http://twitter.com/NASA_GoddardPix" rel="nofollow">Twitter</a></b> <b>Like us on <a href="http://www.facebook.com/pages/Greenbelt-MD/NASA-Goddard/395013845897?ref=tsd" rel="nofollow">Facebook</a></b> <b>Find us on <a href="http://instagram.com/nasagoddard?vm=grid" rel="nofollow">Instagram</a></b>
Springtime North Polar Dust Storms
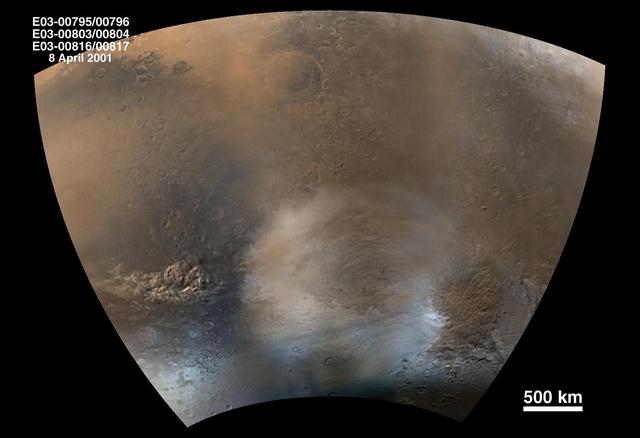
The 2001 Great Dust Storms - Tharsis

Late-summer Martian Dust Storm
Dust storm in the Thaumasia region of Mars

Small Dust Storm in Syria/Claritas
The 2001 Great Dust Storms - Daedalia/Claritas/Syria Dust Plumes
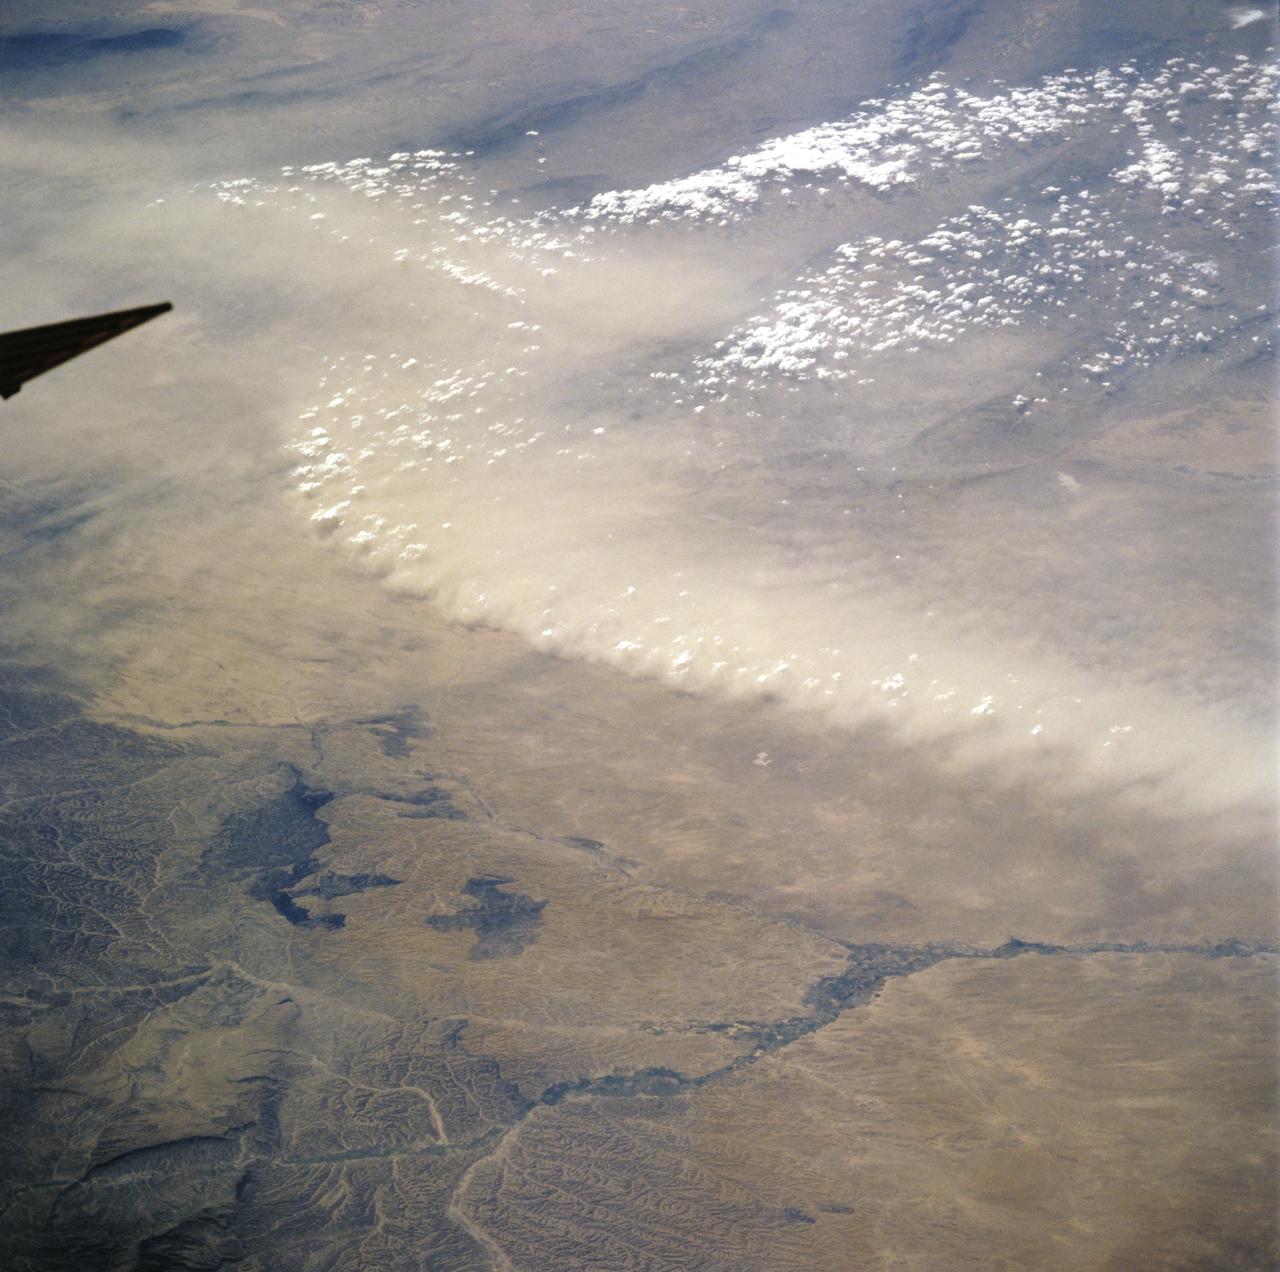
STS049-92-071 (13 May 1992) --- The STS-49 crew aboard the Earth-orbiting Space Shuttle Endeavour captured this Saharan dust storm on the Algeria-Niger border. The south-looking, late-afternoon view shows one of the best examples in the Shuttle photo data base of a dust storm. A series of gust fronts, caused by dissipating thunderstorms have picked up dust along the outflow boundaries. Small cumulus clouds have formed over the most vigorously ascending parts of the dust front, enhancing the visual effect of the front. The storm is moving roughly north-northwest, at right angles to the most typical path for dust storms in this part of the Sahara (shown by lines of sand on the desert surface in the foreground). Storms such as this can move out into the Atlantic, bringing dust even as far as the Americas on some occasions. A crewmember used a 70mm handheld Hasselblad camera with a 100mm lens to record the frame.
Snapshot of Southern Spring Dust Storm Activity
Martian Dust Storm near South Polar Cap

Early Spring Dust Storms at the North Pole of Mars
Springtime Dust Storm Swirls at Martian North Pole
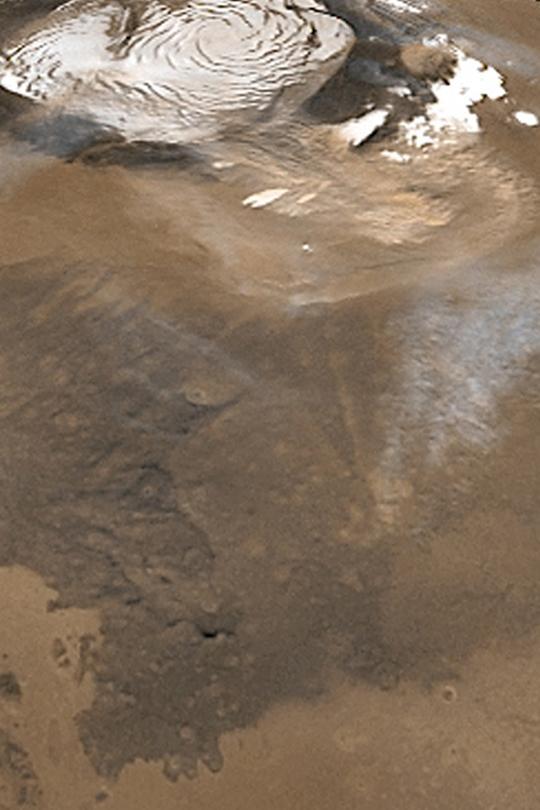
Mid-Winter Dust Storms Near Hellas Planitia
May 1999 Dust Storm in Valles Marineris
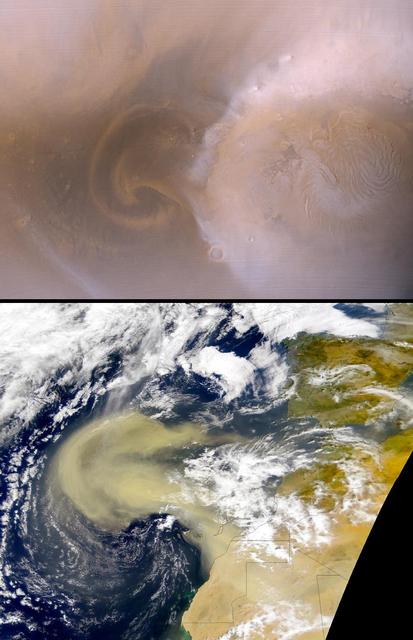
Recent Mars and Earth Dust Storms Compared
The 2001 Great Dust Storms - Hellas/Syrtis Major
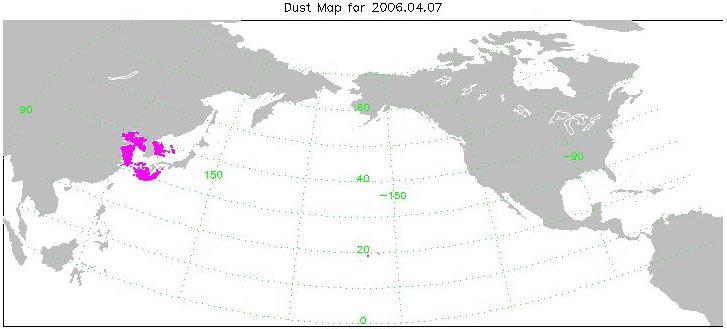
Transport of dust from China Dust Storm of April 2006, from the Atmospheric Infrared Sounder AIRS on NASA Aqua satellite.
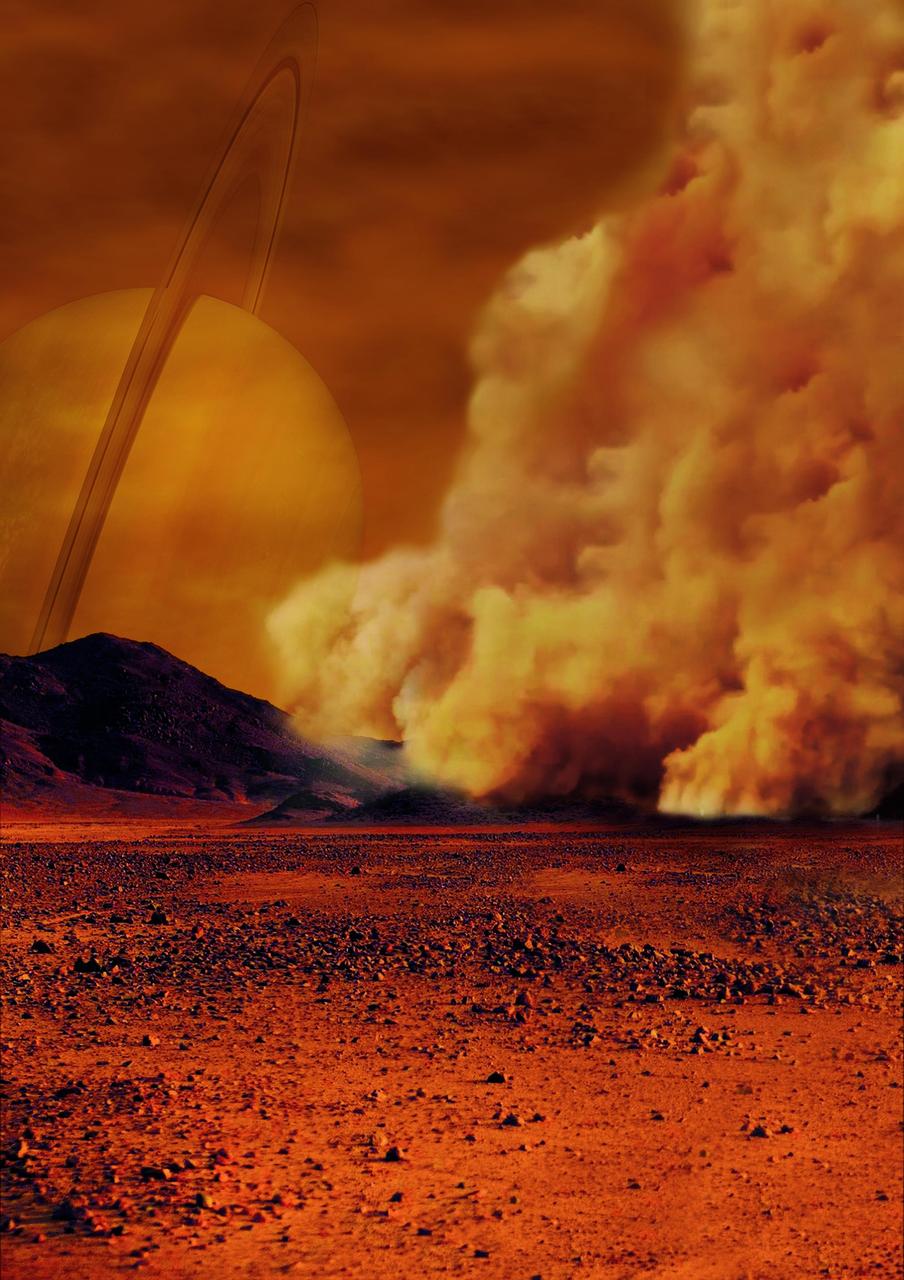
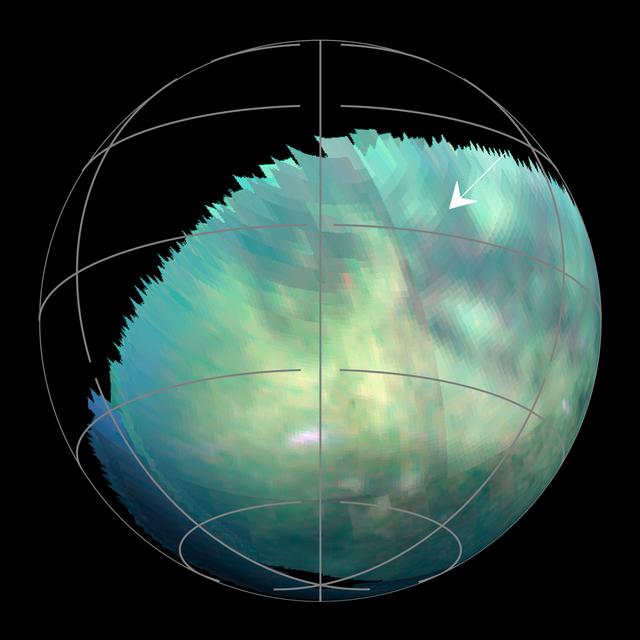
Artist's concept of a dust storm on Titan. Researchers believe that huge amounts of dust can be raised on Titan, Saturn's largest moon, by strong wind gusts that arise in powerful methane storms. Such methane storms, previously observed in images from the international Cassini spacecraft, can form above dune fields that cover the equatorial regions of this moon especially around the equinox, the time of the year when the Sun crosses the equator. The Cassini spacecraft ended its mission on Sept. 15, 2017. https://photojournal.jpl.nasa.gov/catalog/PIA22482

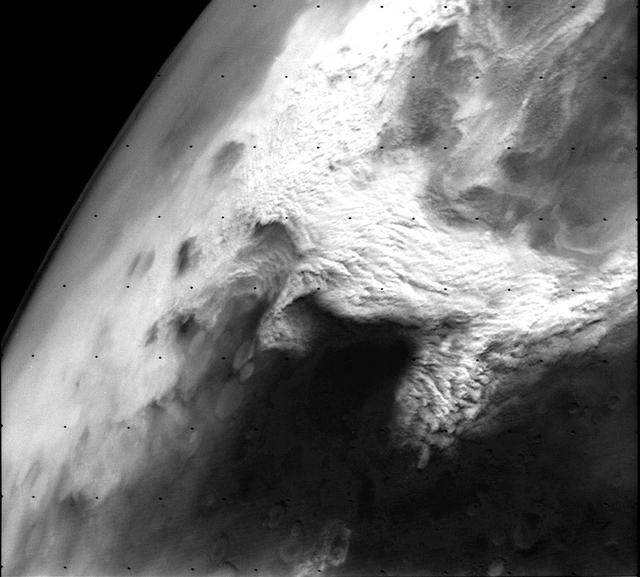
Mariner 9 views Canyon System emerging from Martian Dust Storm
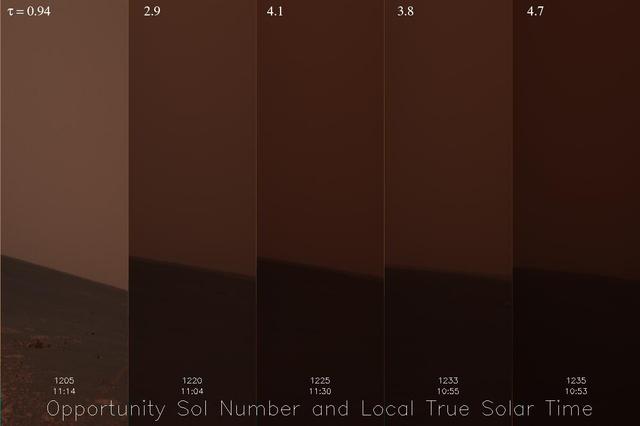
Dust Storm Time Lapse Shows Opportunity Skies Darken

Mariner 9 views Olympus Mons standing above the Martian Dust Storm
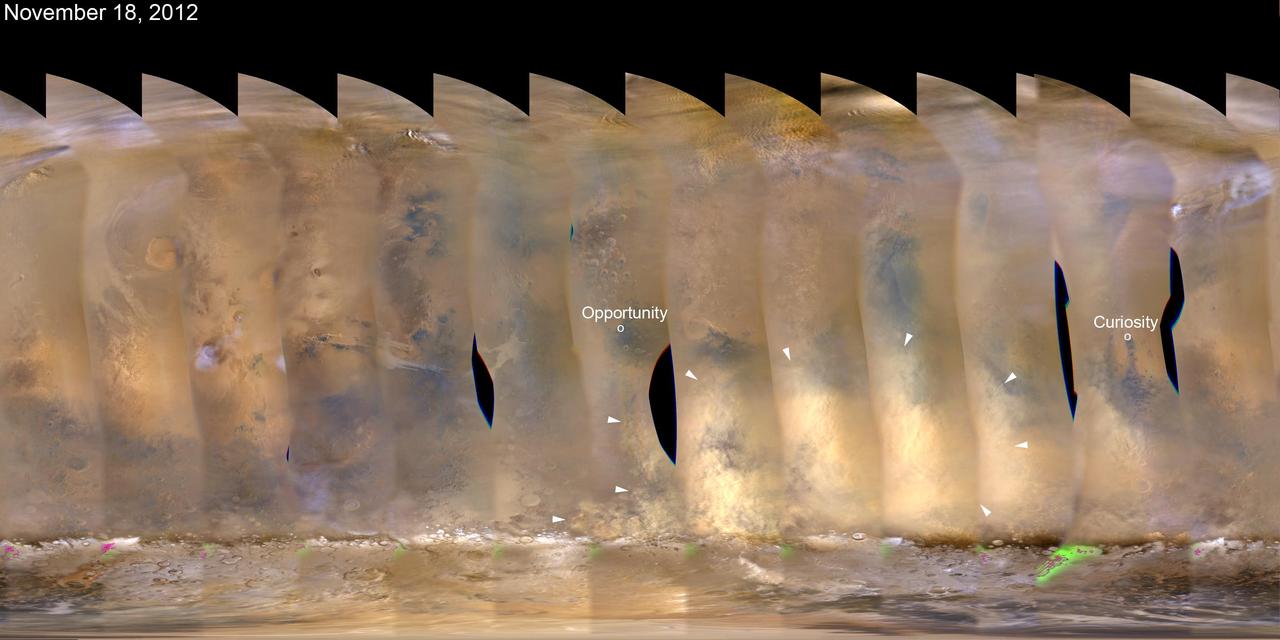
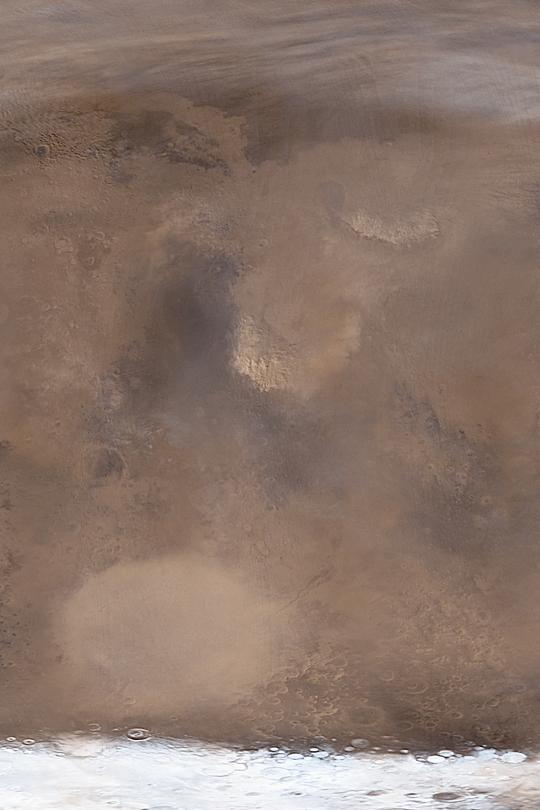
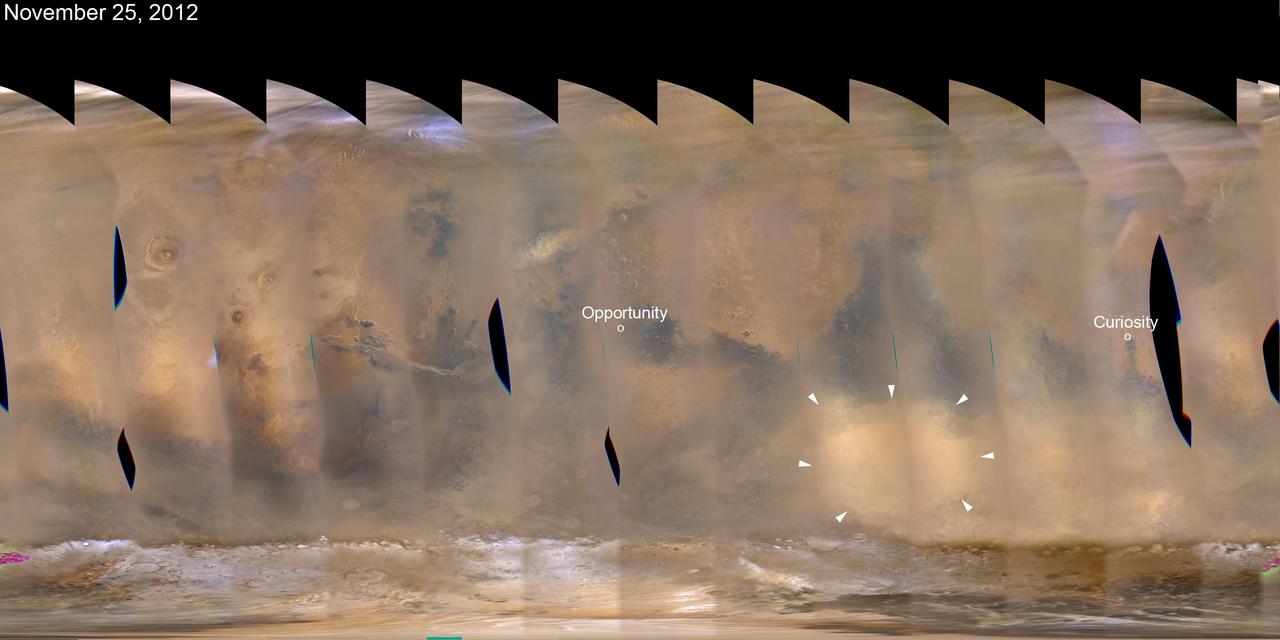
This nearly global mosaic of observations from NASA Mars Reconnaissance Orbiter on Nov. 18, 2012, shows a dust storm in Mars southern hemisphere. Small white arrows outline the area where dust from the storm is apparent in the atmosphere.
This close-up image of a dust storm on Mars was acquired by the Mars Color Imager instrument on NASA Mars Reconnaissance Orbiter on Nov. 7, 2007. This image is centered on Utopia Planitia.
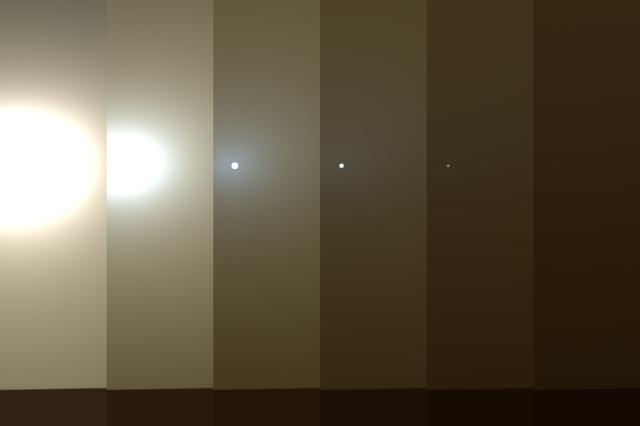
This series of images shows simulated views of a darkening Martian sky blotting out the Sun from NASA's Opportunity rover's point of view, with the right side simulating Opportunity's current view in the global dust storm (June 2018). The left starts with a blindingly bright mid-afternoon sky, with the sun appearing bigger because of brightness. The right shows the Sun so obscured by dust it looks like a pinprick. Each frame corresponds to a tau value, or measure of opacity: 1, 3, 5, 7, 9, 11. https://photojournal.jpl.nasa.gov/catalog/PIA22521
This frame from an animation -- based on images captured by the Visual and Infrared Mapping Spectrometer on NASA's Cassini mission during several Titan flybys in 2009 and 2010 -- shows clear bright spots appearing close to the equator around the equinox that have been interpreted as evidence of dust storms. The brightenings were visible only for a short period of time -- between 11 hours to five Earth weeks -- and cannot be seen in previous or subsequent images. The Cassini spacecraft ended its mission on Sept. 15, 2017. The animation is available at https://photojournal.jpl.nasa.gov/catalog/PIA22483
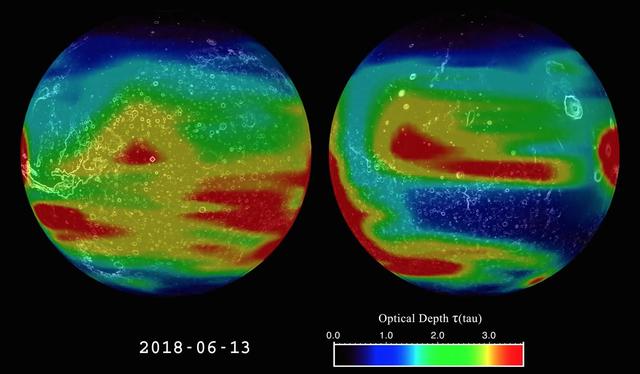
This image is from an animation that shows the evolution of the 2018 Mars global dust storm from late May to September. The animation shows the optical depth tau -- a measure of how much light is being blocked by atmospheric dust as measured by the Mars Climate Sounder instrument onboard NASA's Mars Reconnaissance Orbiter. NASA's Opportunity rover is marked with a red dot. The dust is mapped to two opposite hemispheres of Mars, giving a view of the full globe. Certain features of the Martian terrain, including Olympus Mons, the three volcanoes in the equatorial region, and Vallis Marineris, are also visible. The data shows the daily global column of dust, illustrating how the dust behaves over the course of the storm. The storm has a complex growth affecting most of Mars over the first month. It then remains near the peak for three weeks. Finally, the storm starts a multi-month decay back to regular weather. A color scale in the lower right-hand corner of the animation explains the colors in relation to approximate tau values. A tau of three indicates that only about 5 percent of the sunlight entering the atmosphere directly reaches the surface. Animation is available at https://photojournal.jpl.nasa.gov/catalog/PIA22737
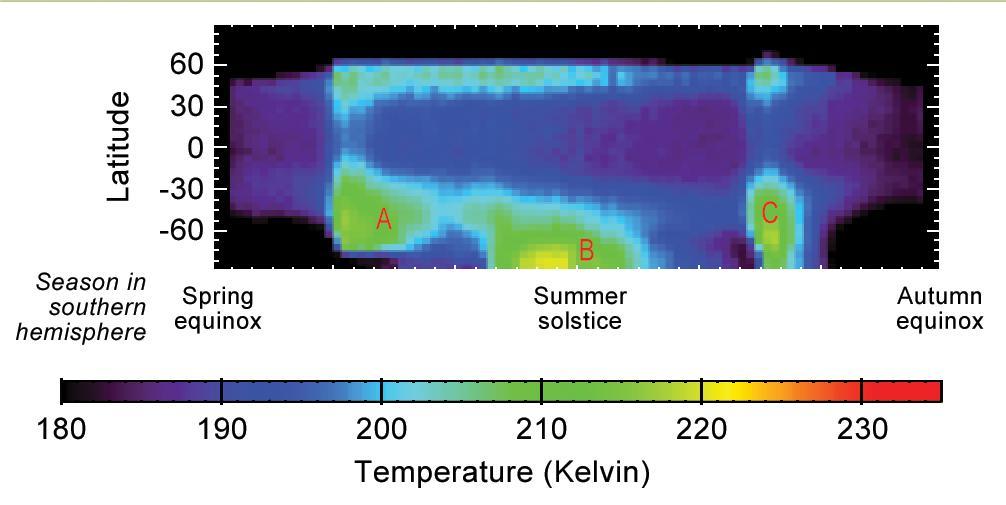
This graphic shows Martian atmospheric temperature data related to seasonal patterns in occurrence of large regional dust storms. The data shown here were collected by the Mars Climate Sounder instrument on NASA's Mars Reconnaissance Orbiter over the course of one-half of a Martian year, during 2012 and 2013. The color coding indicates daytime temperatures of a layer of the atmosphere centered about 16 miles (25 kilometers) above ground level, corresponding to the color-key bar at the bottom of the graphic. Three regional dust storms indicated by increased temperatures are labeled A, B and C. A similar sequence of three large regional dust storms has been seen in atmosphere-temperature data from five other Martian years. The vertical axis is latitude on Mars, from the north pole at the top to south pole at the bottom. Each graphed data point is an average for all Martian longitudes around the planet. The horizontal axis is the time of year, spanning from the beginning of Mars' southern-hemisphere spring (on the left) to the end of southern-hemisphere summer. This is the half of the year when large Martian dust storms are most active. http://photojournal.jpl.nasa.gov/catalog/PIA20746
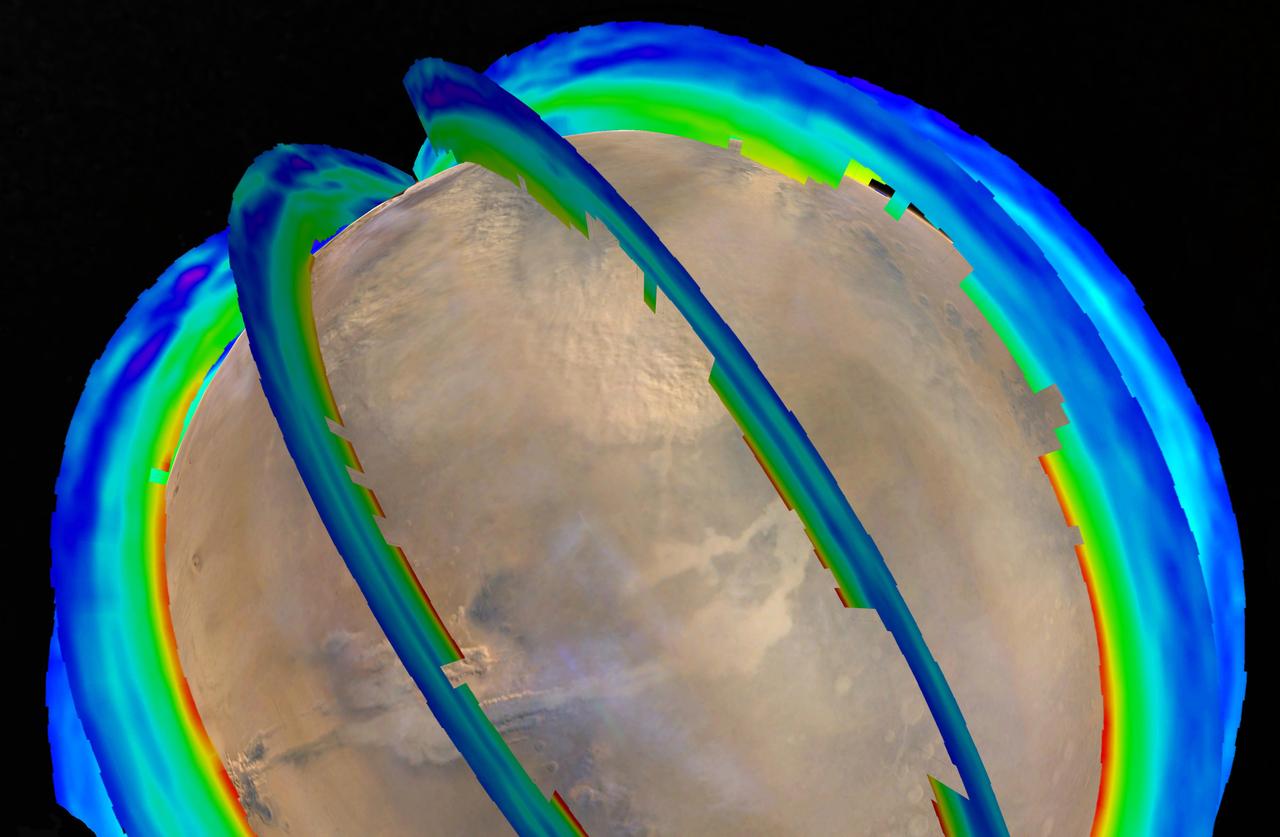
This graphic overlays Martian atmospheric temperature data as curtains over an image of Mars taken during a regional dust storm. The temperature profiles extend from the surface to about 50 miles (80 kilometers) up. Temperatures are color coded, ranging from minus 243 degrees Fahrenheit (minus 153 degrees Celsius) where coded purple to minus 9 F (minus 23 C) where coded red. The temperature data and global image were both recorded on Oct. 18, 2014, by instruments on NASA's Mars Reconnaissance Orbiter: Mars Climate Sounder and Mars Color Imager. On that day a regional dust storm was active in the Acidalia Planitia region of northern Mars, at the upper center of this image. A storm from this area in typically travels south and grows into a large regional storm in the southern hemisphere during southern spring. That type of southern-spring storm and two other large regional dust storms repeat as a three-storm series most Martian years. The pattern has been identified from their effects on atmospheric temperature in a layer about 16 miles (25 kilometers) above the surface. http://photojournal.jpl.nasa.gov/catalog/PIA20747

This graph compares a typical daily pattern of changing atmospheric pressure blue with the pattern during a regional dust storm hundreds of miles away red. The data are by the Rover Environmental Monitoring Station REMS on NASA Curiosity rover.
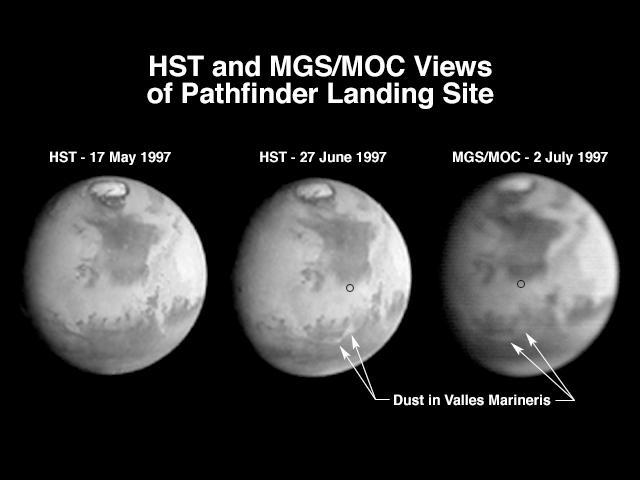
A comparison of images taken by the Hubble Space Telescope Wide Field/Planetary Camera (HST/WFPC) and the Mars Global Surveyor Orbiter Camera (MGS/MOC) shows the progress of a regional dust storm within the Valles Marineris canyons on Mars. The first HST image (left), taken in mid-May, shows no dust within the canyons. The most recent HST image (center), taken on 27 June in support of the Mars Pathfinder landing activities, shows a dust storm filling part of the canyon system and extending into the chaotic terrains at the eastern end of the canyons. The MGS/MOC image (right), acquired on July 2, shows that bright dust continues to fill the valleys. However, it does not appear to have moved significantly north of the previously observed position, suggesting that the storm remains confined to the canyon region, and does not appear to directly threaten the Pathfinder landing site (small black circle). The HST images shown here have been reduced in scale to match that of the MGS/MOC image. Although the HST is 10 times farther from Mars than MGS, its images are sharper because its resolving power is 15 times better than the MOC, and the light gathering area is almost 50 times greater. However, MGS is presently 45,000 times farther from Mars than it will be when the MOC begins its primary photography mission. At 400 km above the martian surface, the MOC wide angle camera will collect daily images at a resolution of 7.5 km/pixel, compared to HST's best of about 20 km/pixel. The narrow angle camera will observe portions of Mars at better than 1.5 m/pixel. http://photojournal.jpl.nasa.gov/catalog/PIA00607
This false-color scene from the panoramic camera (Pancam) on NASA's Mars Exploration Rover Opportunity documents movement of dust as a regional dust storm approached the rover's location on Feb. 24, 2017, during the 4,653rd Martian day, or sol, of the rover's work on Mars. Key to detecting the movement is that Pancam color images are combinations of different images taken a short time apart through different color filters. Note that along the horizon, the left portion of the image has a bluish band (with label and arrow in Figure 1). The component image admitting blue light was taken about 150 seconds after the component image admitting red light. A layer of dust-carrying wind hadn't reached this location by the earlier exposure, but had by the later one. This Sol 4653 Opportunity view is toward the north from the rover's location on the western rim of Endeavour Crater in the Meridiani Planum region of Mars. http://photojournal.jpl.nasa.gov/catalog/PIA21485

Hubble Look at Mars Shows Canyon Dust Storm, Cloudy Conditions for Pathfinder Landing
Multiple images from the Mars Color Imager (MARCI) aboard NASA's Mars Reconnaissance Orbiter (MRO) were used to generate this view of a regional dust storm obscuring Syrtis Major and Jezero Crater (white circle). The images were acquired on Jan. 9, 2022. MRO creates global maps of Mars but roll maneuvers for targeted observations produce gaps in the coverage, which appear as black gores in the maps. On some days there are data drops where partial or full orbits of coverage are missing. Green and purple observed in the south polar region indicate saturated pixels. https://photojournal.jpl.nasa.gov/catalog/PIA25068
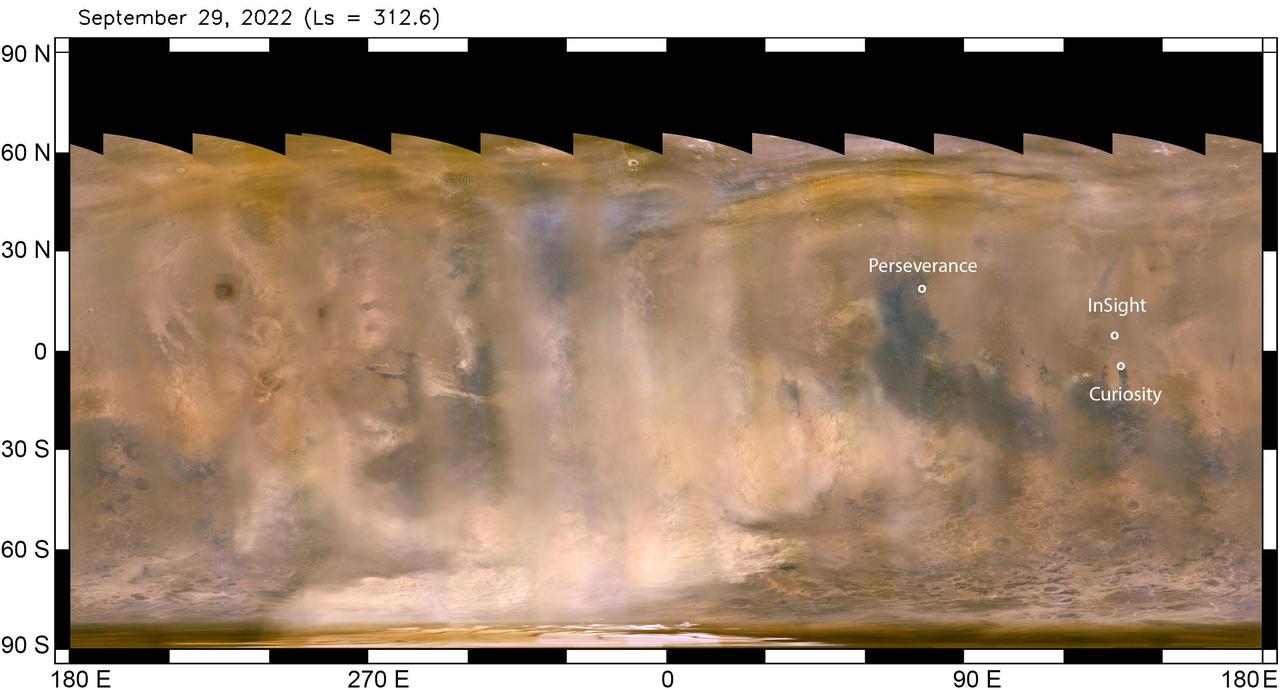
The beige clouds seen in this flat global map of Mars are a continent-size dust storm captured on Sept. 29, 2022 by the Mars Color Imager (MARCI) camera aboard NASA's Mars Reconnaissance Orbiter (MRO). As MRO passes over the planet, MARCI takes linear images – essentially strips – of the planet's circumference each day. The images are then stitched together to create a daily global map of the planet, showing atmospheric features across the planet as seen at the same time of day (mid-afternoon). Comparison of daily maps show atmospheric changes over time. Besides providing unique scientific data, MARCI's global maps are useful for monitoring weather changes that could affect NASA's surface missions. The agency's Perseverance, Curiosity, and InSight missions are also labeled, showing the vast distances between them. NASA's Perseverance rover and Ingenuity helicopter, are located at the white dot farthest north, roughly 2,147 miles (3,455 kilometers) from the agency's InSight lander, just above the equator. The Curiosity rover is just below the equator, about 373 miles (600 kilometers) from InSight. Neither Curiosity nor Perseverance and Ingenuity (the helicopter must remain relatively close to Perseverance, which serves as its base station) can travel the distance to the solar-powered InSight lander. The regional dust storm in this map was first observed Sept. 21. By the time these images were taken (Sept. 29), it had expanded considerably. Within the following week, the storm appeared to have entered its decay phase, when it's no longer lifting dust into the atmosphere. At that point, the dust that has already been lofted into the atmosphere and spread far beyond the dust-raising sector can take weeks to settle back to the surface. While this particular storm was roughly 2,175 miles (3,500 kilometers) from InSight, it lofted enough dust to significantly reduce the energy being produced by the lander's solar arrays, which have become covered by dust since the spacecraft landed in November 2018. The lander has long since surpassed its primary mission. With its power steadily declining, it is now close to the end of its extended mission, conducting "bonus science" by measuring marsquakes, which reveal details about the deep interior of the Red Planet. https://photojournal.jpl.nasa.gov/catalog/PIA25412
A regional dust storm visible in the southern hemisphere of Mars in this nearly global mosaic of observations made by the Mars Color Imager on NASA Mars Reconnaissance Orbiter on Nov. 25, 2012, has contracted from its size a week earlier.
This frame from an animation shows the movement of several dust storms near NASA Phoenix Mars Lander. These images were taken by the lander Surface Stereo Imager SSI on the 137th Martian day, or sol, of the mission Oct. 13, 2008.
This image taken by NASA's Opportunity rover's HiRISE, a high-resolution camera onboard Mars Reconnaissance Orbiter, shows the dust storm over Perseverance Valley has substantially cleared. Opportunity appears as a blip in this image taken on Thursday, September 20, 2018, from about 166 miles (268 kilometers) above the surface. More information is available at https://photojournal.jpl.nasa.gov/catalog/PIA22549
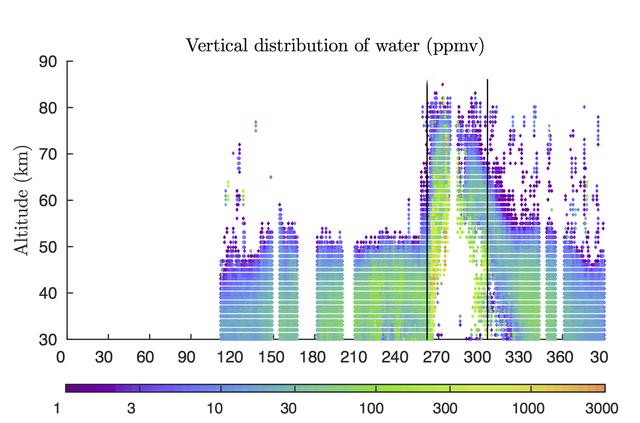
Rising air during a 2007 global dust storm on Mars lofted water vapor into the planet's middle atmosphere, researchers learned from data graphed here, derived from observations by the Mars Climate Sounder instrument on NASA's Mars Reconnaissance Orbiter. The two vertical black lines in the right half of the graph (at about 260 and 310 on the horizontal scale) mark the beginning and end of the most recent global dust storm on Mars, which burst from regional scale to globe-encircling scale in July 2007. The presence of more colored dots, particularly green ones, in the upper portion of the graph between those lines, compared to the upper portion of the graph outside those lines, documents the uplift of water vapor in connection with the global dust storm. The vertical scale is altitude, labeled at left in kilometers above the surface of Mars (50 kilometers is about 30 miles; 80 kilometers is about 50 miles). The color bar below the graph gives the key to how much water vapor each dot represents, in parts per million, by volume, in Mars' atmosphere. Note that green to yellow represents about 100 times as much water as purple does. The horizontal axis of the graph is time, from January 2006 to February 2008. It is labeled with numbers representing the 360 degrees of Mars' orbit around the Sun, from zero to 360 degrees and then further on to include the first 30 degrees of the following Martian year. (The zero point is autumnal equinox -- end of summer -- in Mars' northern hemisphere.) This graph, based on Mars Reconnaissance Orbiter observations, was used in a January 2018 paper in Nature Astronomy by Nicholas Heavens of Hampton University in Hampton, Virginia, and co-authors. The paper presents Martian dust storms' uplifting effect on water vapor as a factor in seasonal patterns that other spacecraft have detected in the rate of hydrogen escaping from the top of Mars' atmosphere. https://photojournal.jpl.nasa.gov/catalog/PIA22080
![Oblique view of the crater complex near Ascraeus Lacus in the Tharsis region of Mars was taken by Mariner 9. It is the northernmost of the prominent dark spots observed by Mariner during its approach to the planet. The spot consists of several intersecting shallow crater-like depressions. The main crater is approximately 21 kilometers (13 miles) across, the whole complex about 40 kilometers (25 miles) across. The crater probably is in a relatively high area of the Martian surface, which accounts for its being visible above the dust storm. The faint circular features outside the crater are probably atmospheric. Mariner 9 was the first spacecraft to orbit another planet. The spacecraft was designed to continue the atmospheric studies begun by Mariners 6 and 7, and to map over 70% of the Martian surface from the lowest altitude (1500 kilometers [900 miles]) and at the highest resolutions (1 kilometer per pixel to 100 meters per pixel) of any previous Mars mission. Mariner 9 was launched on May 30, 1971 and arrived on November 14, 1971. http://photojournal.jpl.nasa.gov/catalog/PIA03100](https://images-assets.nasa.gov/image/PIA03100/PIA03100~medium.jpg)
Oblique view of the crater complex near Ascraeus Lacus in the Tharsis region of Mars was taken by Mariner 9. It is the northernmost of the prominent dark spots observed by Mariner during its approach to the planet. The spot consists of several intersecting shallow crater-like depressions. The main crater is approximately 21 kilometers (13 miles) across, the whole complex about 40 kilometers (25 miles) across. The crater probably is in a relatively high area of the Martian surface, which accounts for its being visible above the dust storm. The faint circular features outside the crater are probably atmospheric. Mariner 9 was the first spacecraft to orbit another planet. The spacecraft was designed to continue the atmospheric studies begun by Mariners 6 and 7, and to map over 70% of the Martian surface from the lowest altitude (1500 kilometers [900 miles]) and at the highest resolutions (1 kilometer per pixel to 100 meters per pixel) of any previous Mars mission. Mariner 9 was launched on May 30, 1971 and arrived on November 14, 1971. http://photojournal.jpl.nasa.gov/catalog/PIA03100
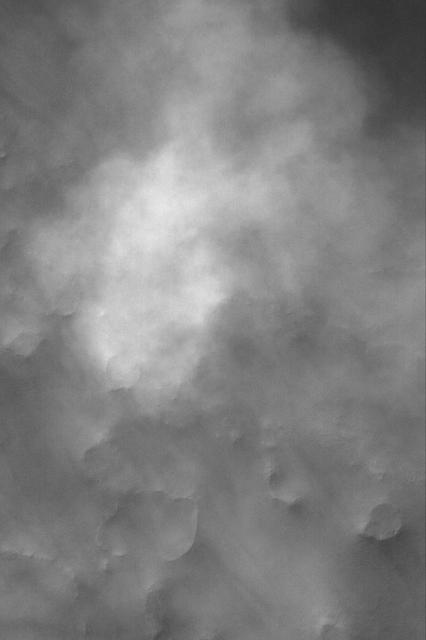
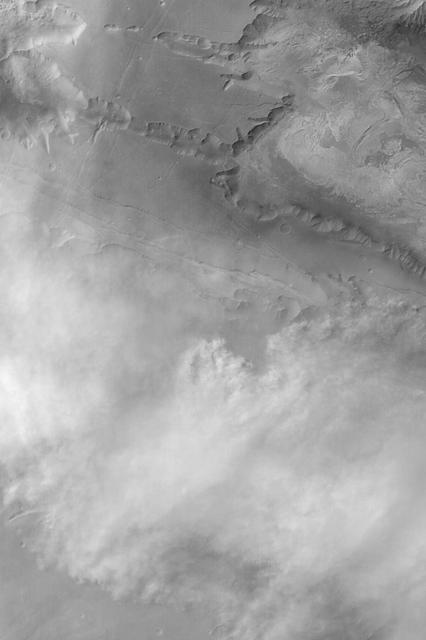
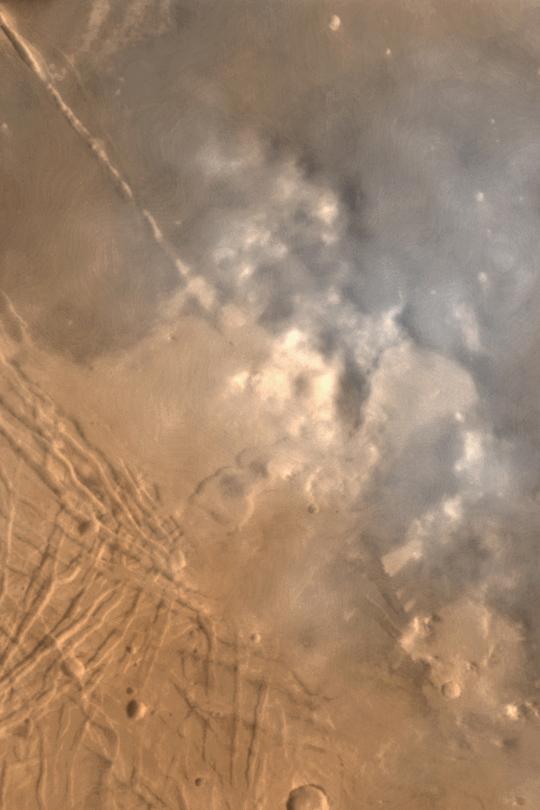
This MOC image shows billowing clouds of dust rising from a storm southeast of Hellas Planitia. The dust storm in this case obscured the Mars Orbiter Camera view of the martian surface
STS106-718-056 (11 September 2000) --- One of the STS-106 crew members on board the Space Shuttle Atlantis used a handheld 70mm camera to photograph this image of Afghanistan dust/front winds in the upper Amu Darya Valley. The strong winds along the northern border of Afghanistan lofted thick, light brown dust into the air (top half of the view). In this desert environment land surfaces are not protected by vegetation from the effect of blowing wind. The central Asian deserts experience the greatest number of dust storm days on the planet each year. The sharp dust front shows that the dust has not traveled far, but has been raised from the surfaces in the view. Dust is entrained in the atmosphere by horizontal winds but also by vertical movements. Here the vertical component is indicated by the fact that the higher points along the dust front are each topped by a small cumulus cloud, which appear as a line of small white puffballs. Cumulus clouds indicate upward motion and here the air which has entrained the dust is lifting the air above to the level of condensation at each point where a small cloud has formed.
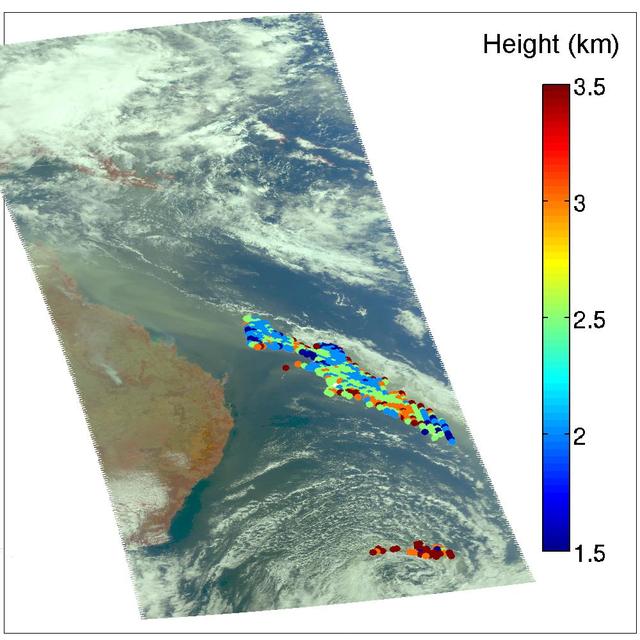
A major dust storm moved across the eastern and northeastern regions of Australia on Sept. 23, 2009, out towards the Pacific as seen by NASA Aqua satellite.
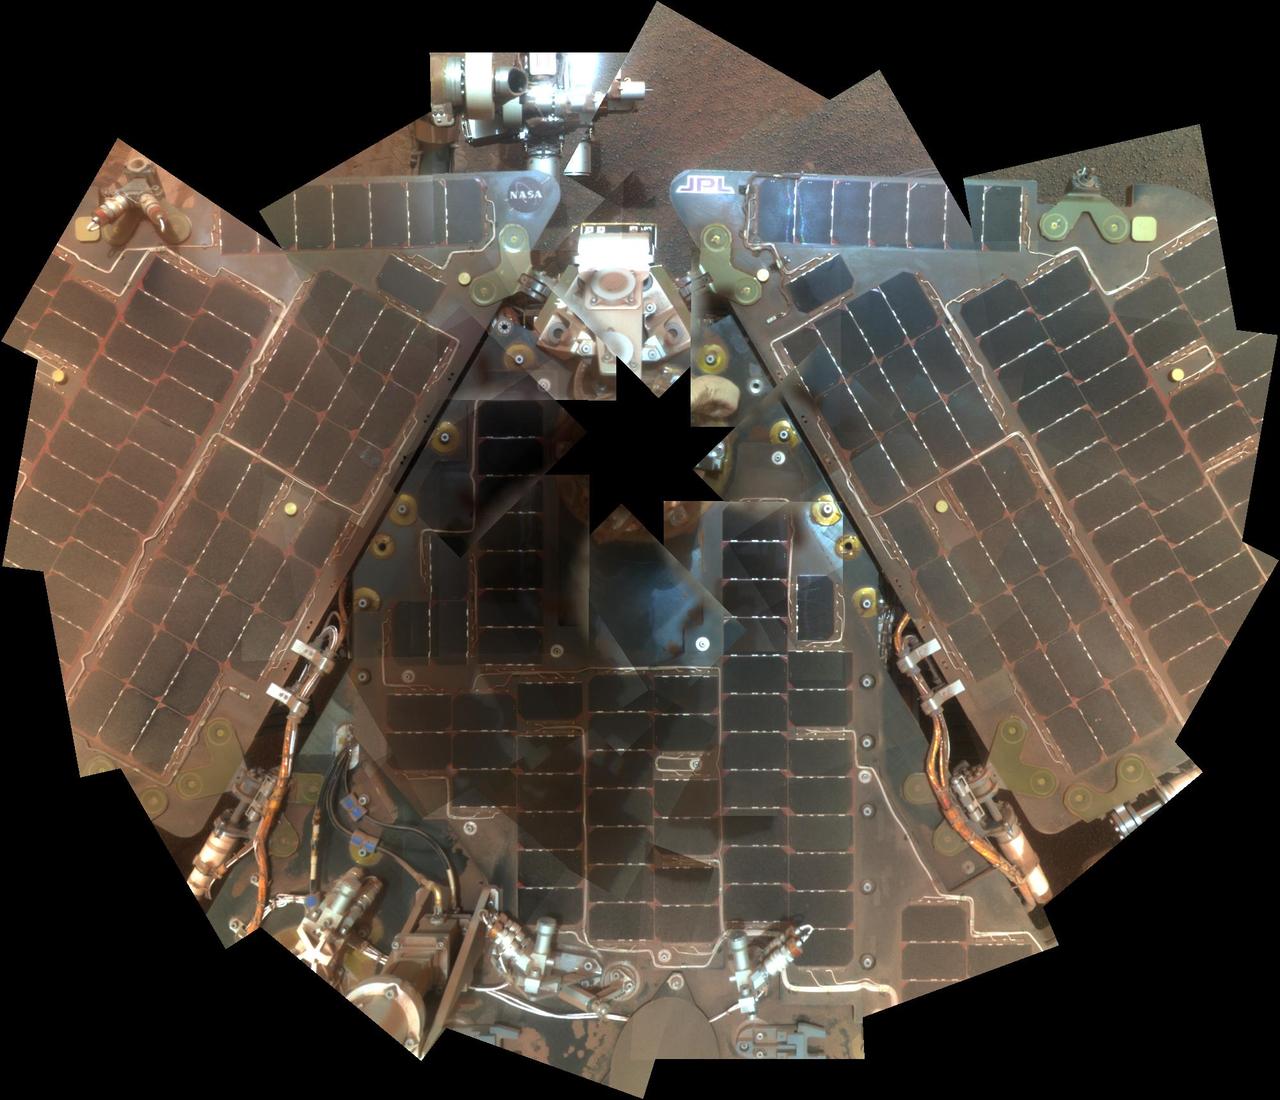
In 2007, NASA Mars Exploration Rover Opportunity had endured a Martian dust storm and the rover team wanted to assess the dustiness of the solar panels.
Clear skies on April 11, 2004 top panels contrast strongly with the dust storm that swept across Iraq and Saudi Arabia on May 13 bottom panels as seen by NASA Terra spacecraft.
This false-color polar map was generated from images obtained by the Mars Reconnaissance Orbiter Mars Color Imager MARCI. It shows a large local dust storm that researchers were monitoring on May 25, 2008.
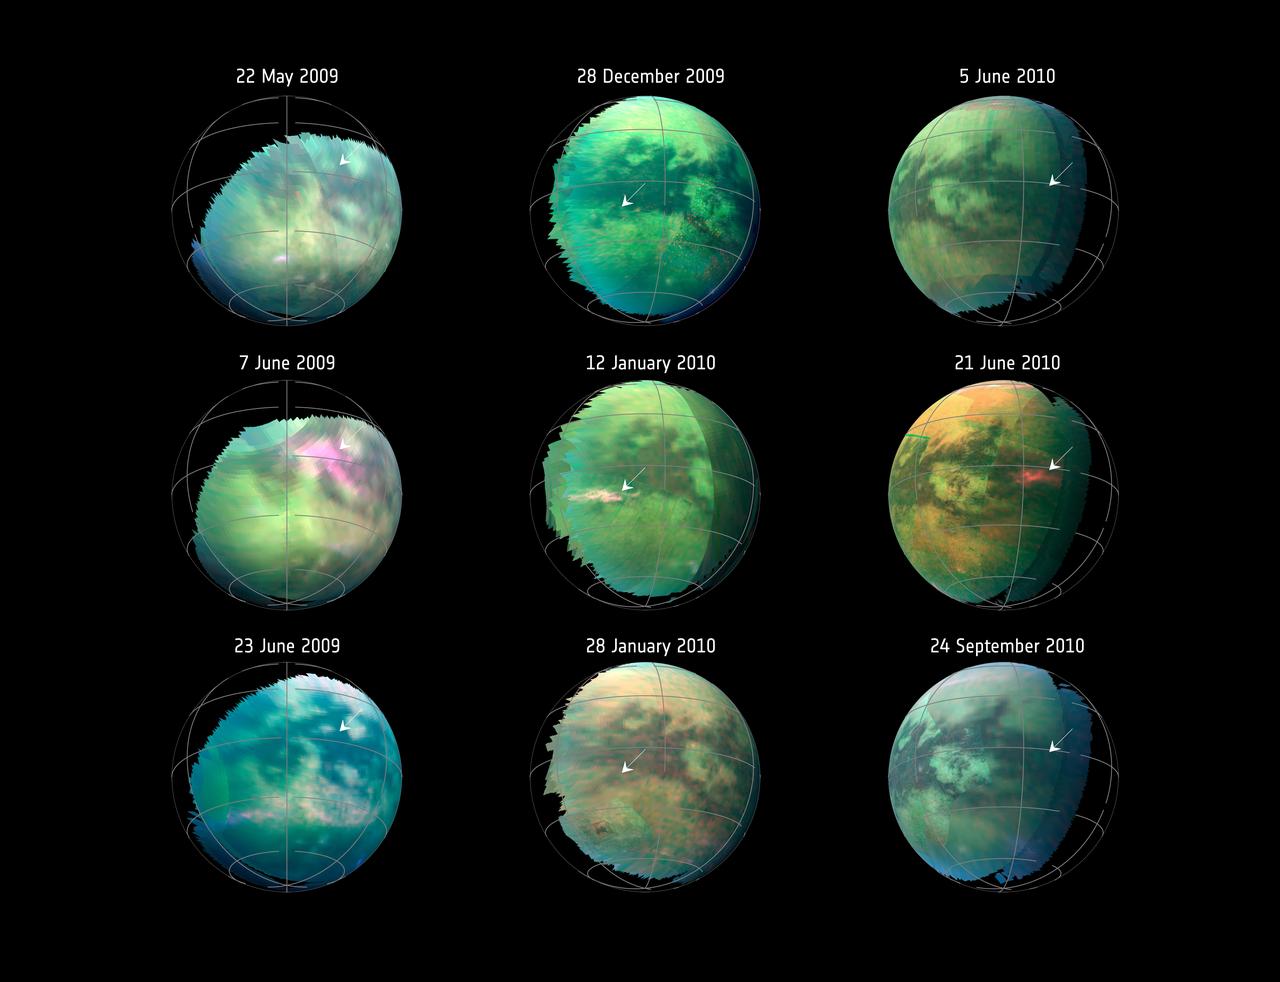
This compilation of images from nine Cassini flybys of Titan in 2009 and 2010 captures three instances when clear bright spots suddenly appeared in images taken by the spacecraft's Visual and Infrared Mapping Spectrometer. The brightenings were visible only for a short period of time -- between 11 hours to five Earth weeks -- and cannot be seen in previous or subsequent images. The Cassini spacecraft ended its mission on Sept. 15, 2017. https://photojournal.jpl.nasa.gov/catalog/PIA22484

A self-portrait of NASA's Curiosity rover taken on Sol 2082 (June 15, 2018). A Martian dust storm has reduced sunlight and visibility at the rover's location in Gale Crater. Self-portraits are created using images taken by Curiosity's Mars Hands Lens Imager (MAHLI). https://photojournal.jpl.nasa.gov/catalog/PIA22486
Powerful winds and dry conditions caused a massive blanket of dust from Australia Outback to spread eastward across Queensland and New South Wales. This image was acquired on September 22, 2009 by NASA Terra spacecraft.
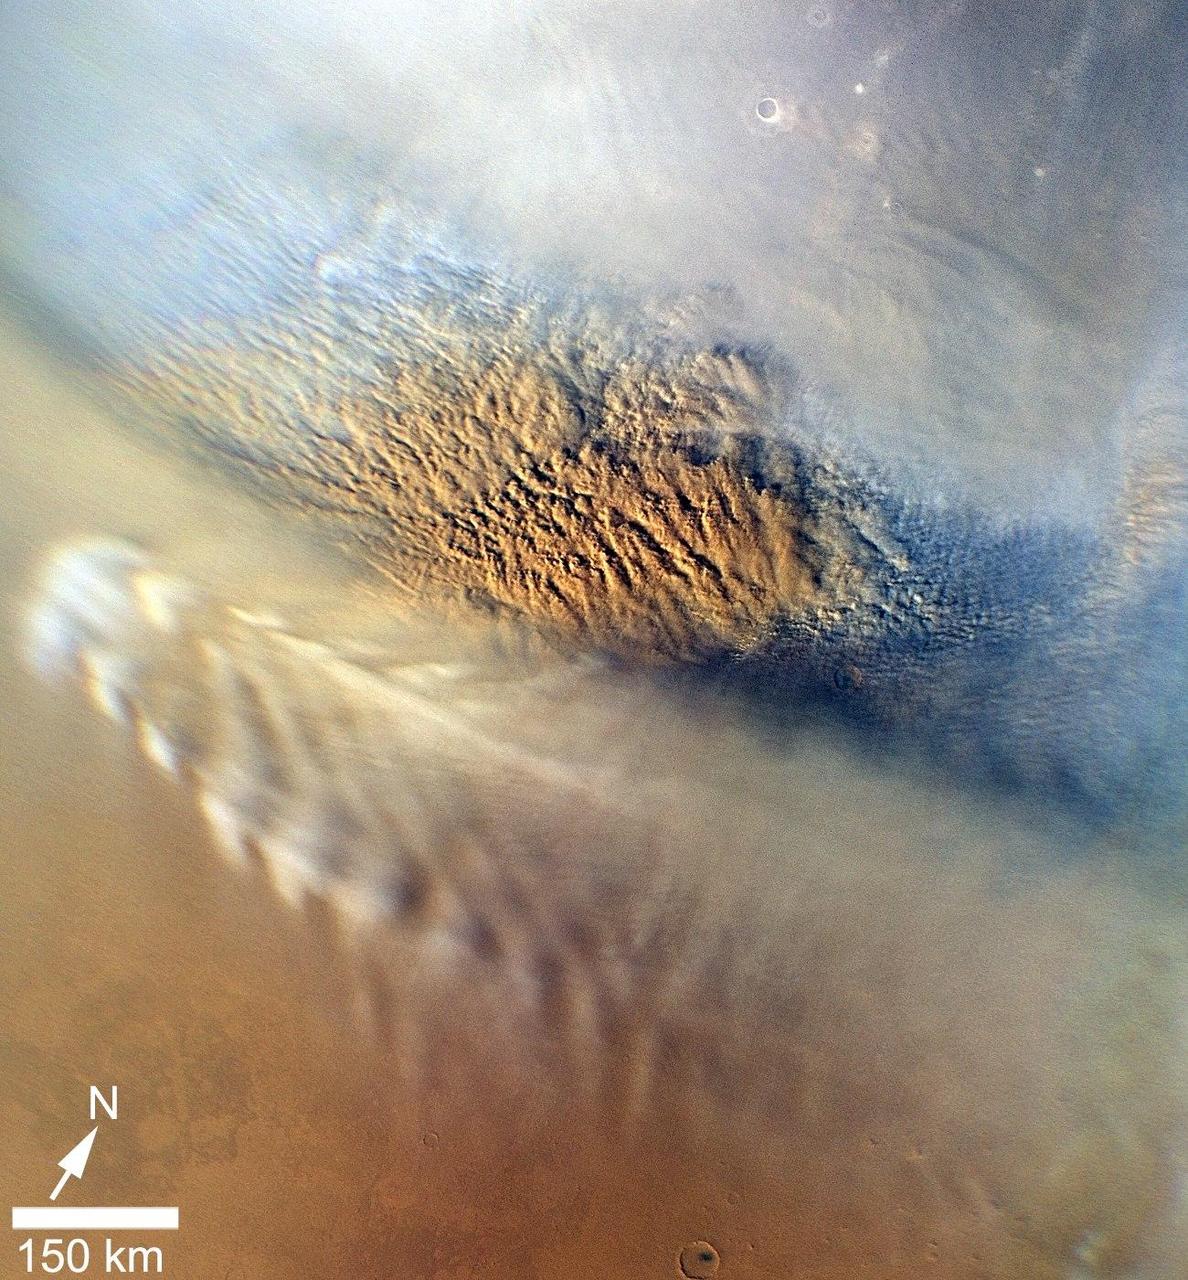
The THEMIS VIS camera contains 5 filters. The data from different filters can be combined in multiple ways to create a false color image. These false color images may reveal subtle variations of the surface not easily identified in a single band image. This VIS image shows the cloud tops of a large storm over Utopia Planitia. The clouds are composed mainly of dust and completely hide the surface. Orbit Number: 60143 Latitude: 56.7602 Longitude: 95.2069 Instrument: VIS Captured: 2015-07-05 22:51 https://photojournal.jpl.nasa.gov/catalog/PIA22679
iss056e151163 (Aug. 18, 2018) --- Earth's limb and dust storms in the Sahara are pictured as the International Space Station orbited nearly 252 miles above the African country of Mali.
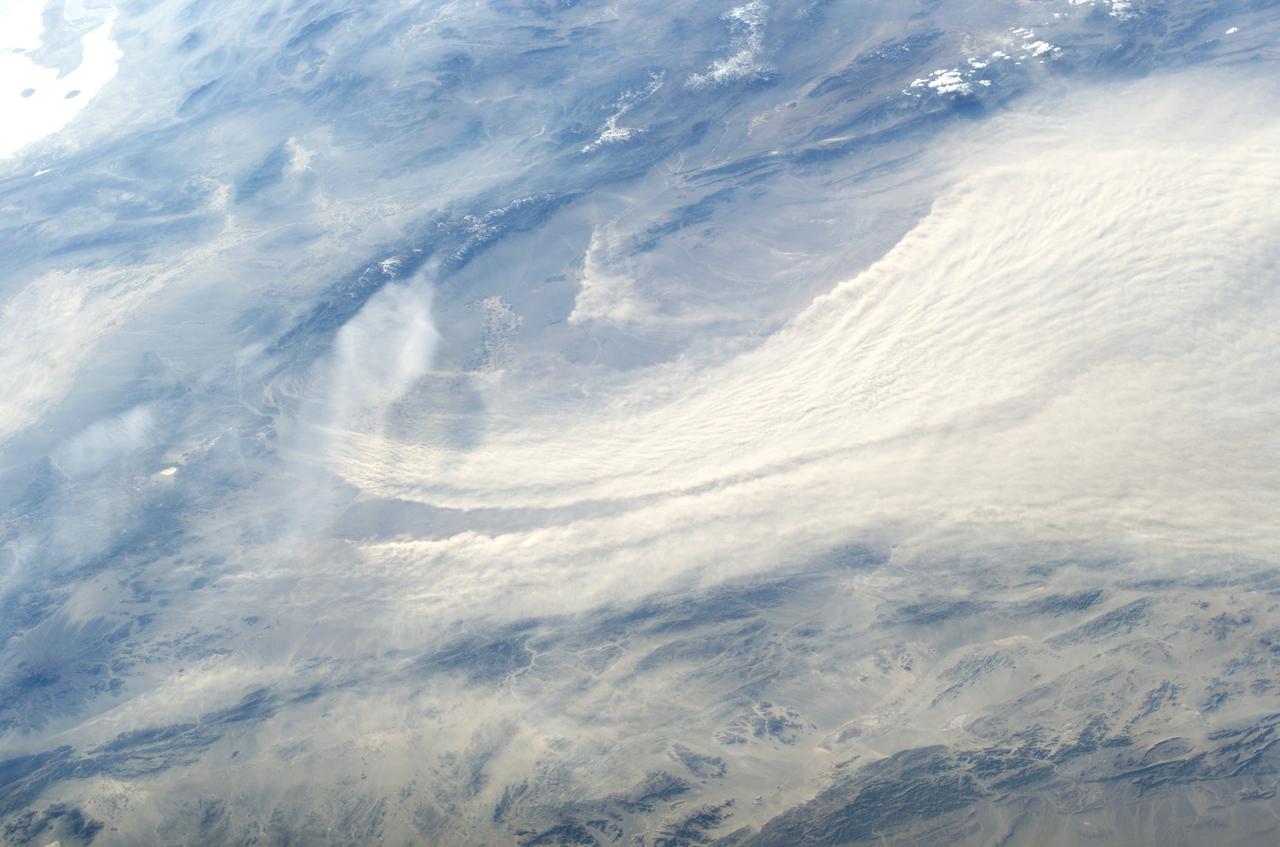
Earth Observation taken during a day pass by the Expedition 40 crew aboard the International Space Station (ISS). Folder lists this as: Sahara dust storm over Atlantic.
Earth Observation taken during a day pass by the Expedition 40 crew aboard the International Space Station (ISS). Folder lists this as: Sahara dust storm over Atlantic.
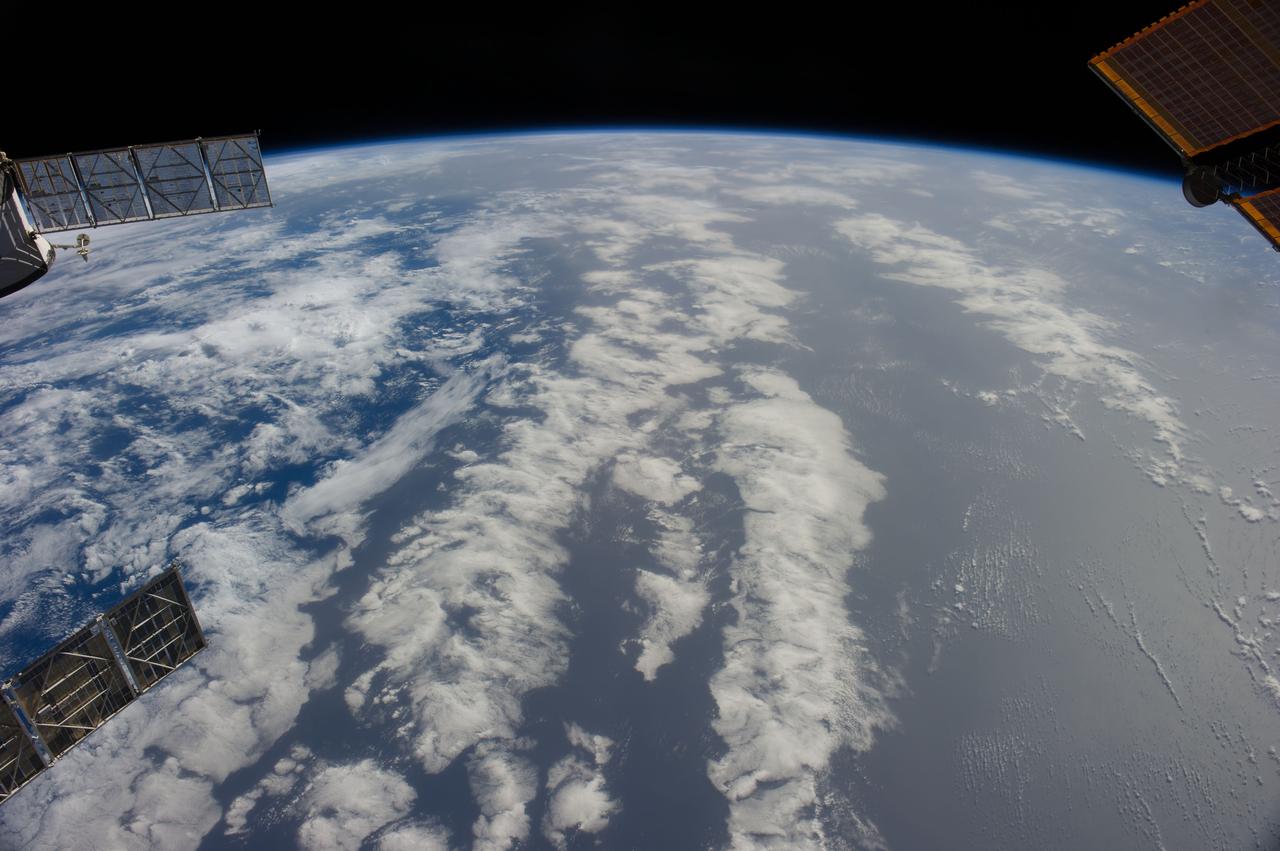
Earth Observation taken during a day pass by the Expedition 40 crew aboard the International Space Station (ISS). Folder lists this as: Sahara dust storm over Atlantic.
ISS008-E-16328 (15 February 2004) --- A major dust storm in the Kerman Desert, just east of the city of Bam in Southeastern Iran, was featured in this image photographed by an Expedition 8 crewmember onboard the International Space Station (ISS).
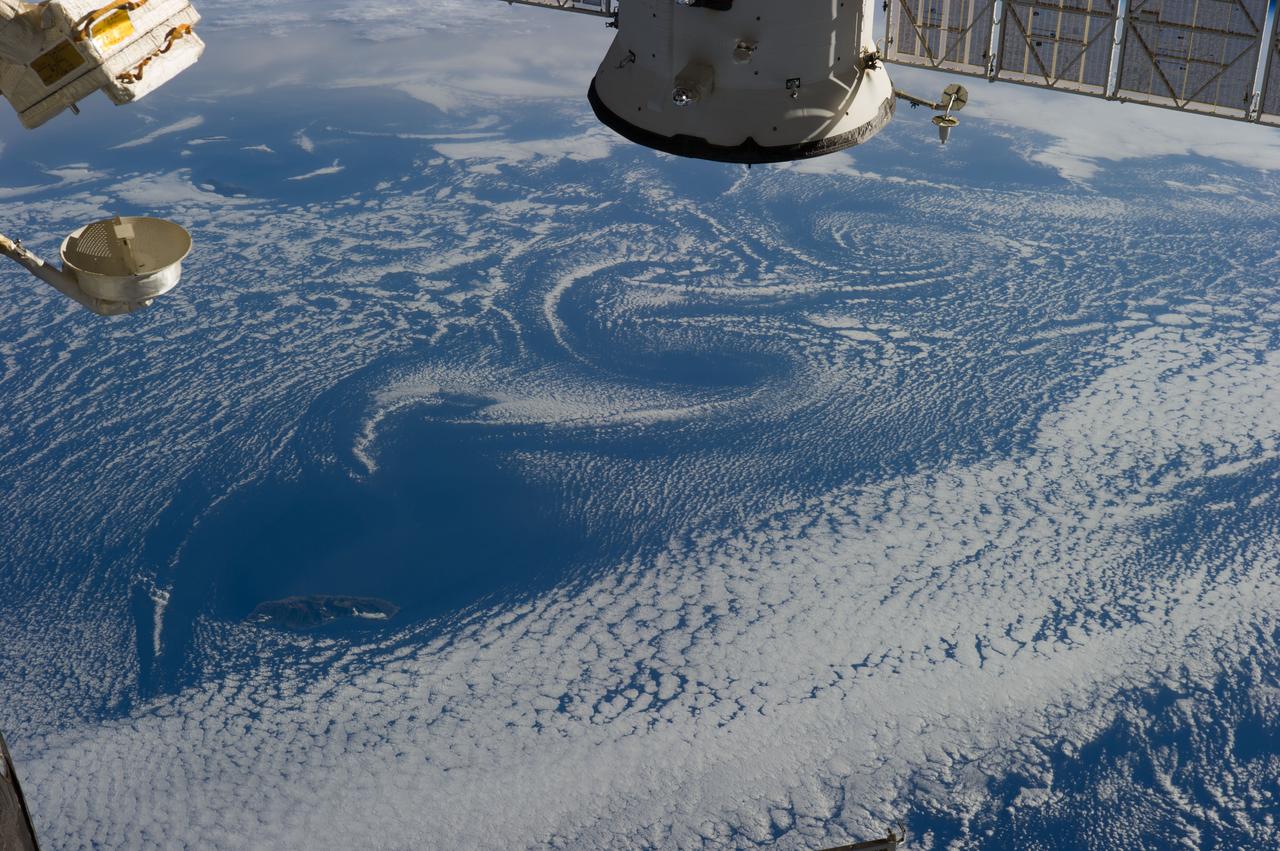
Earth Observation taken during a day pass by the Expedition 40 crew aboard the International Space Station (ISS). Folder lists this as: Sahara dust storm over Atlantic.
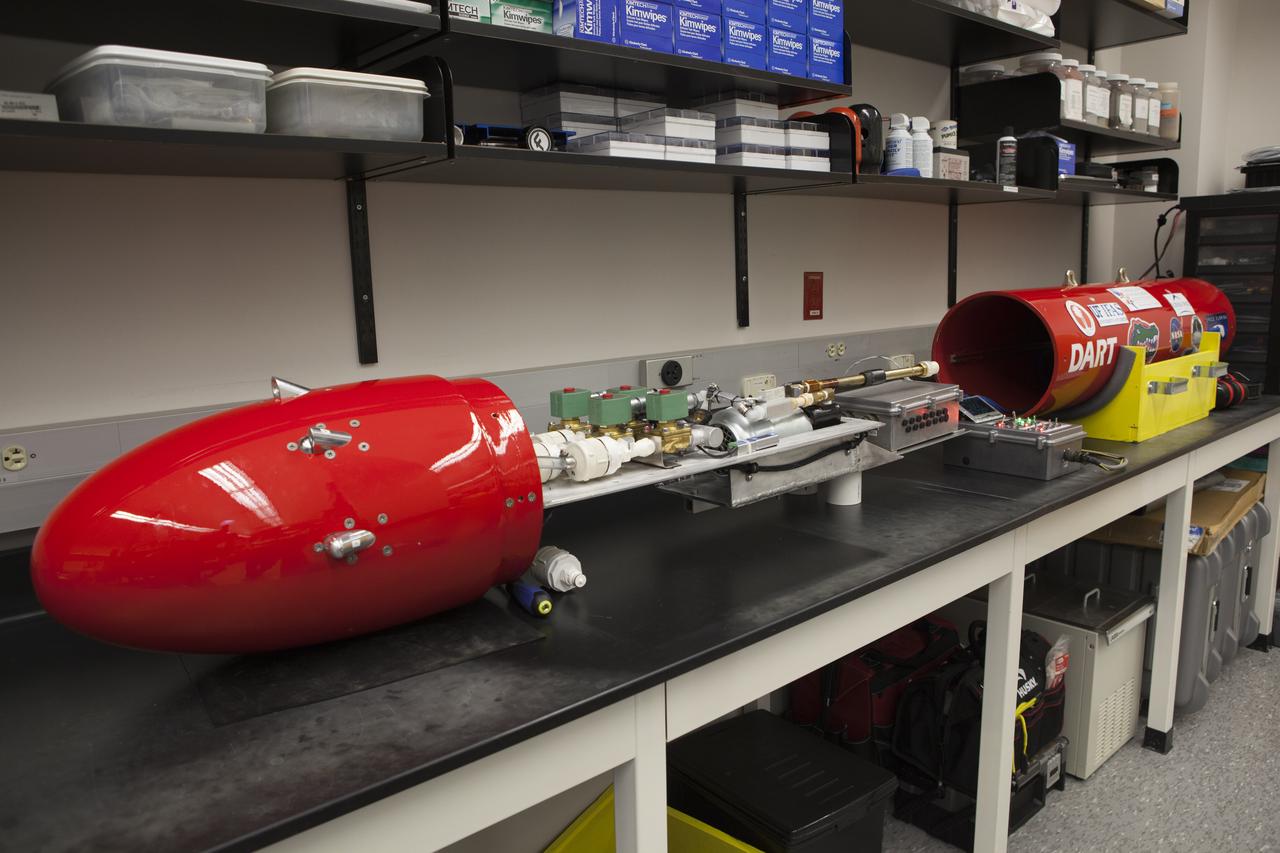
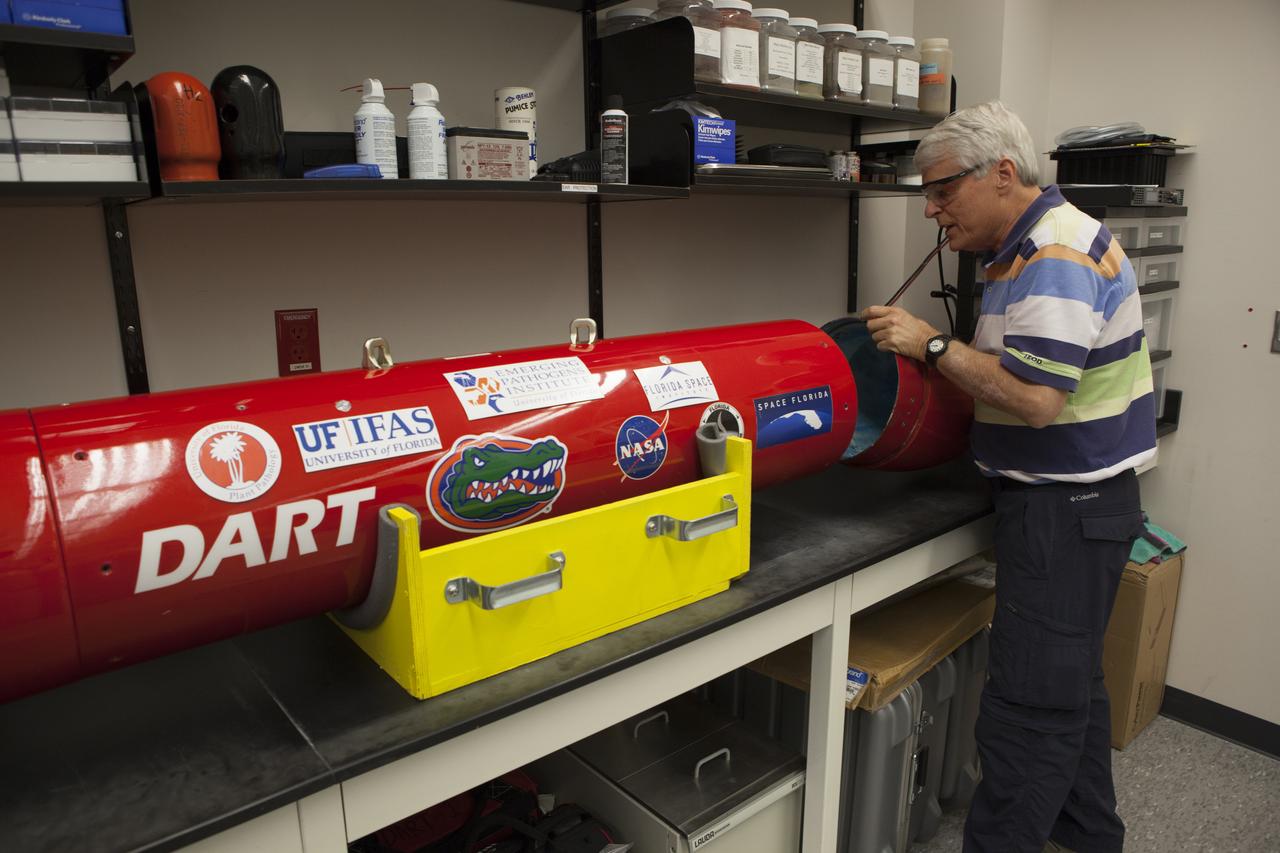
The Dust Atmospheric Recovery Technology, or DART, spacecraft is being assembled in a laboratory inside the Space Life Sciences Lab at NASA’s Kennedy Space Center in Florida. DART will characterize the dust loading and microbial diversity in the atmosphere over Florida during summer months with a special emphasis on their interactions during an African dust storm. DART will be used to collect atmospheric aerosols and suspended microbial cells over Florida and Kennedy. Results will help predict the risks of excessive microbial contamination adhering to spacecraft surfaces.
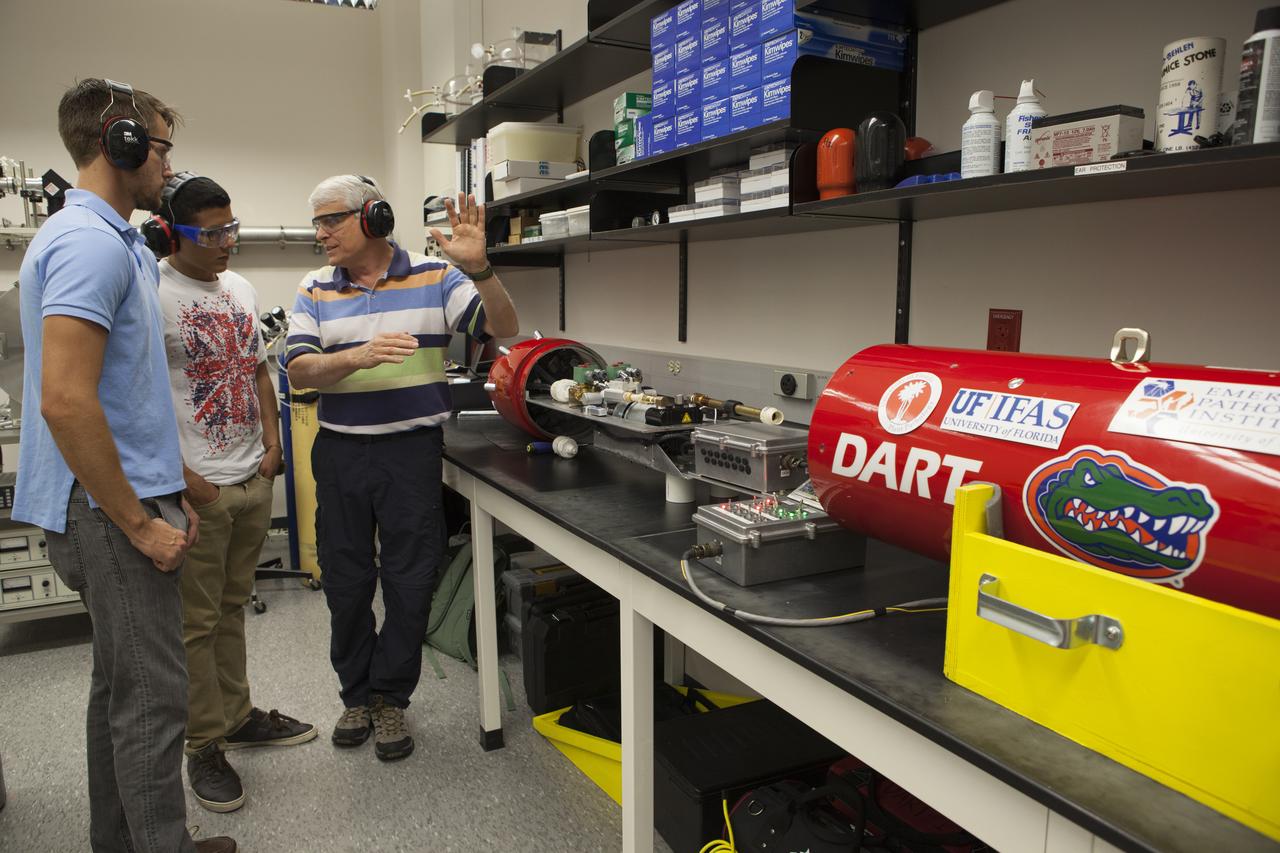
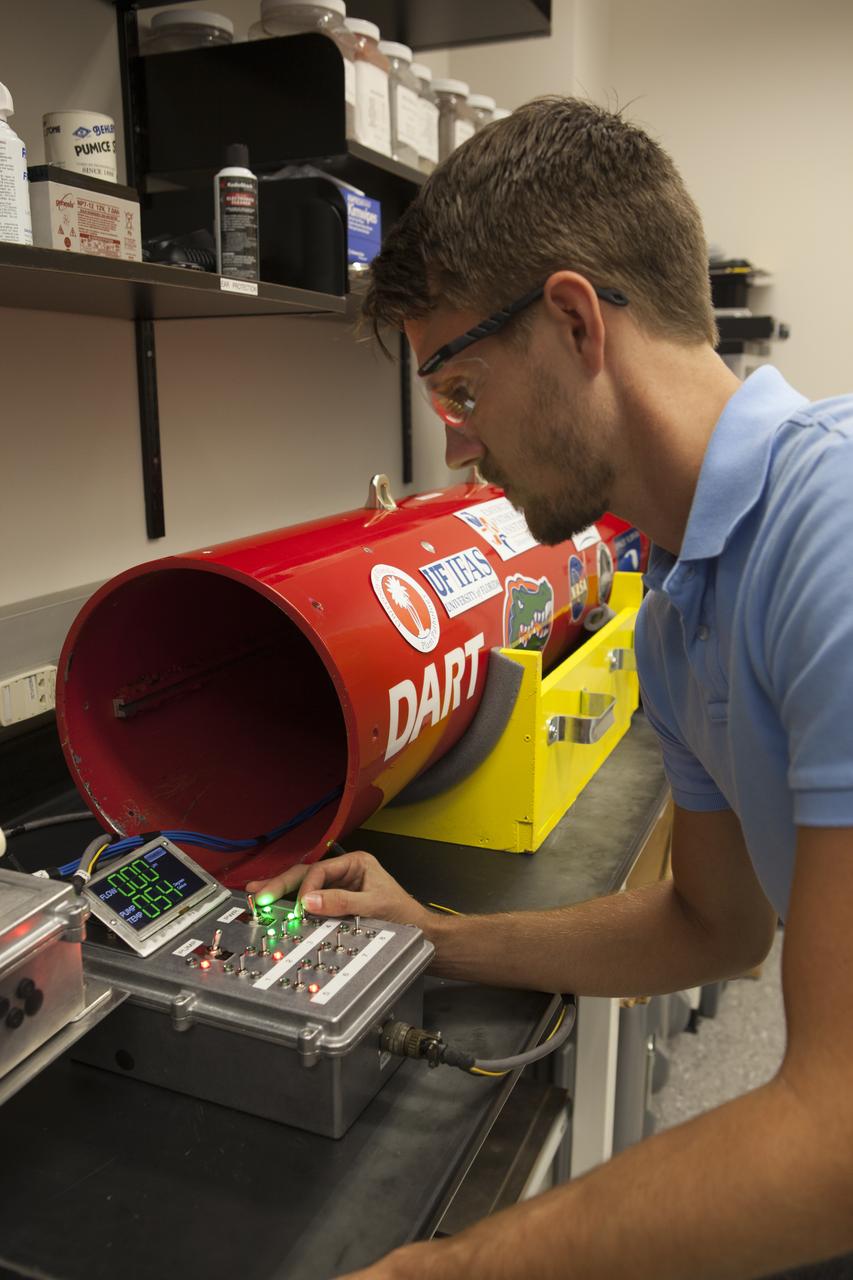
Researchers at NASA’s Kennedy Space Center in Florida check readings on the Dust Atmospheric Recovery Technology, or DART, spacecraft inside a laboratory at the Space Life Sciences Lab. DART will characterize the dust loading and microbial diversity in the atmosphere over Florida during summer months with a special emphasis on their interactions during an African dust storm. DART will be used to collect atmospheric aerosols and suspended microbial cells over Florida and Kennedy. Results will help predict the risks of excessive microbial contamination adhering to spacecraft surfaces.
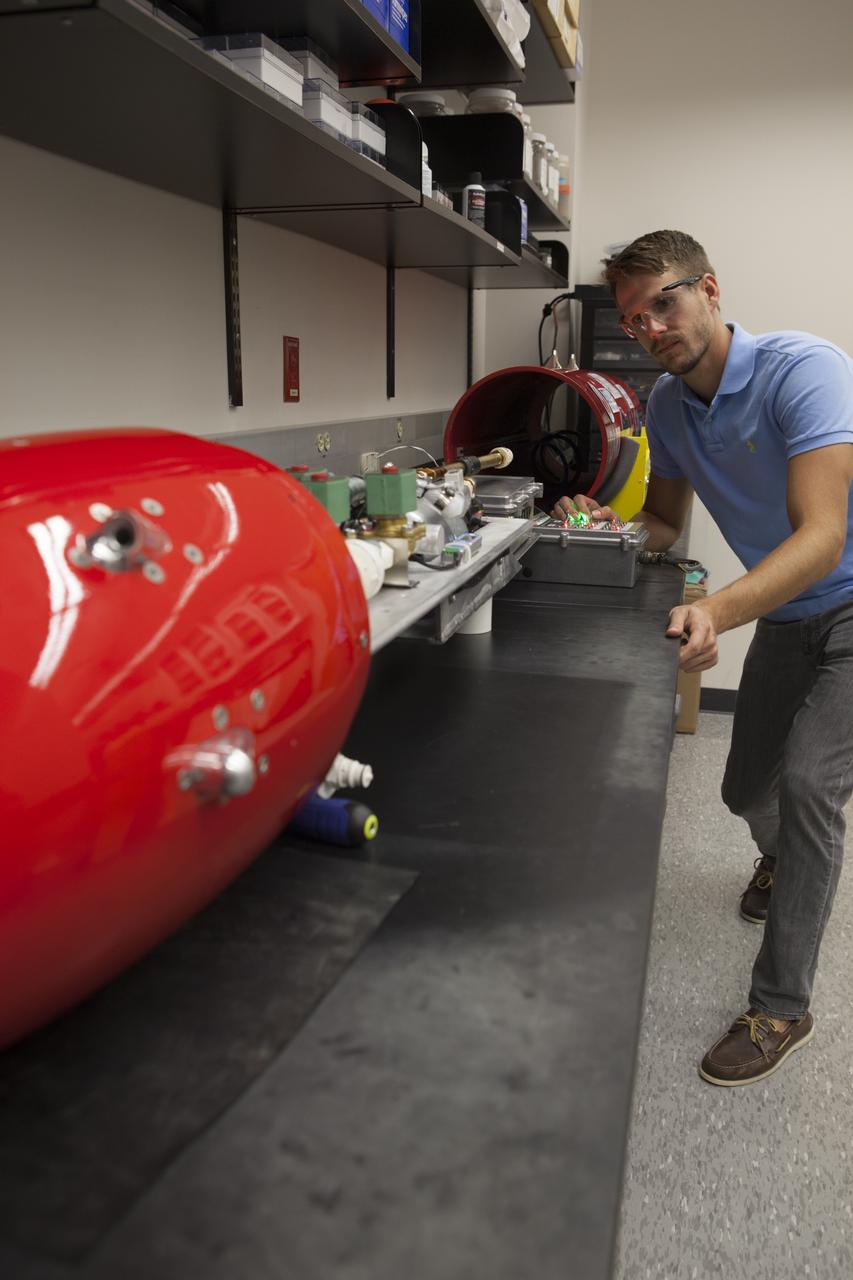
A researcher at NASA’s Kennedy Space Center in Florida checks a reading on the Dust Atmospheric Recovery Technology, or DART, spacecraft inside a laboratory at the Space Life Sciences Lab. DART will characterize the dust loading and microbial diversity in the atmosphere over Florida during summer months with a special emphasis on their interactions during an African dust storm. DART will be used to collect atmospheric aerosols and suspended microbial cells over Florida and Kennedy. Results will help predict the risks of excessive microbial contamination adhering to spacecraft surfaces.
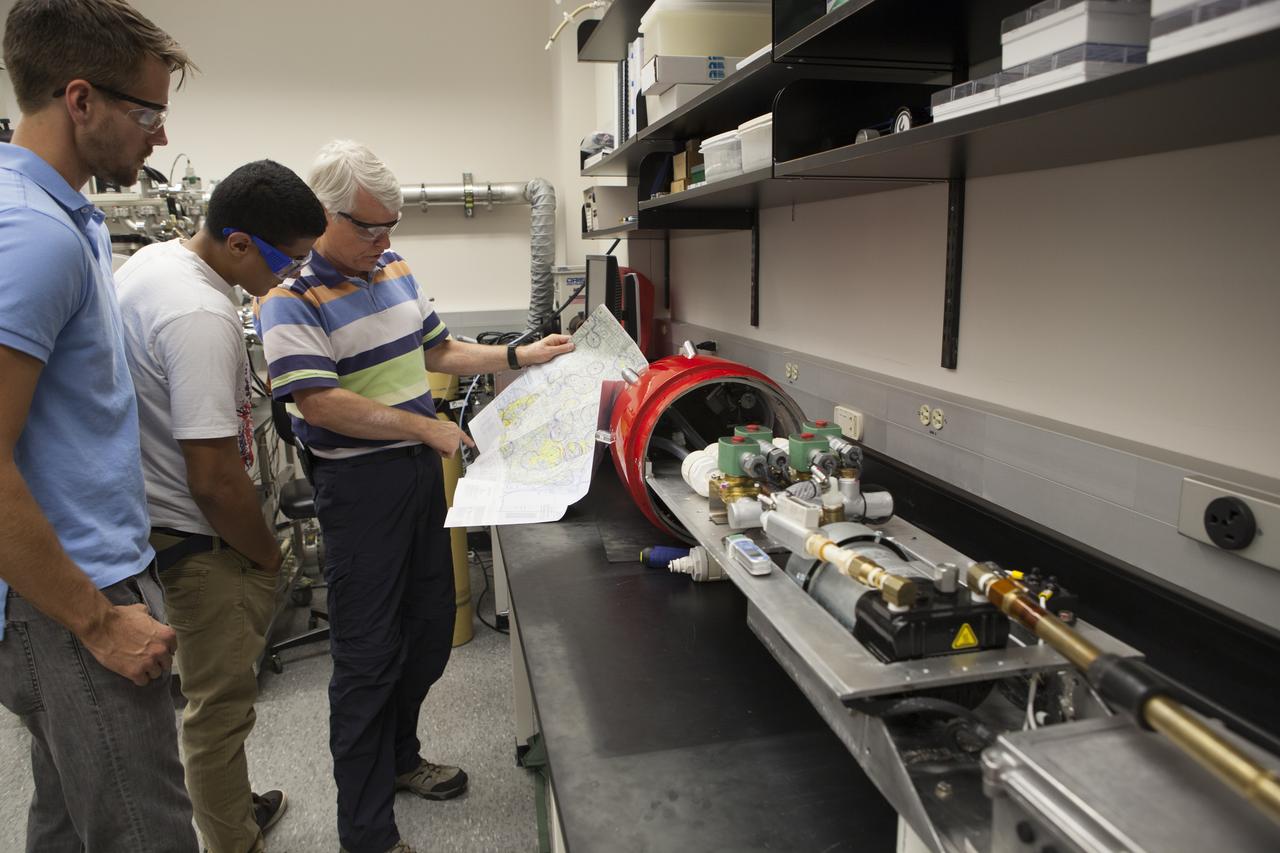
Researchers at NASA’s Kennedy Space Center in Florida check readings on the Dust Atmospheric Recovery Technology, or DART, spacecraft inside a laboratory at the Space Life Sciences Lab. DART will characterize the dust loading and microbial diversity in the atmosphere over Florida during summer months with a special emphasis on their interactions during an African dust storm. DART will be used to collect atmospheric aerosols and suspended microbial cells over Florida and Kennedy. Results will help predict the risks of excessive microbial contamination adhering to spacecraft surfaces.
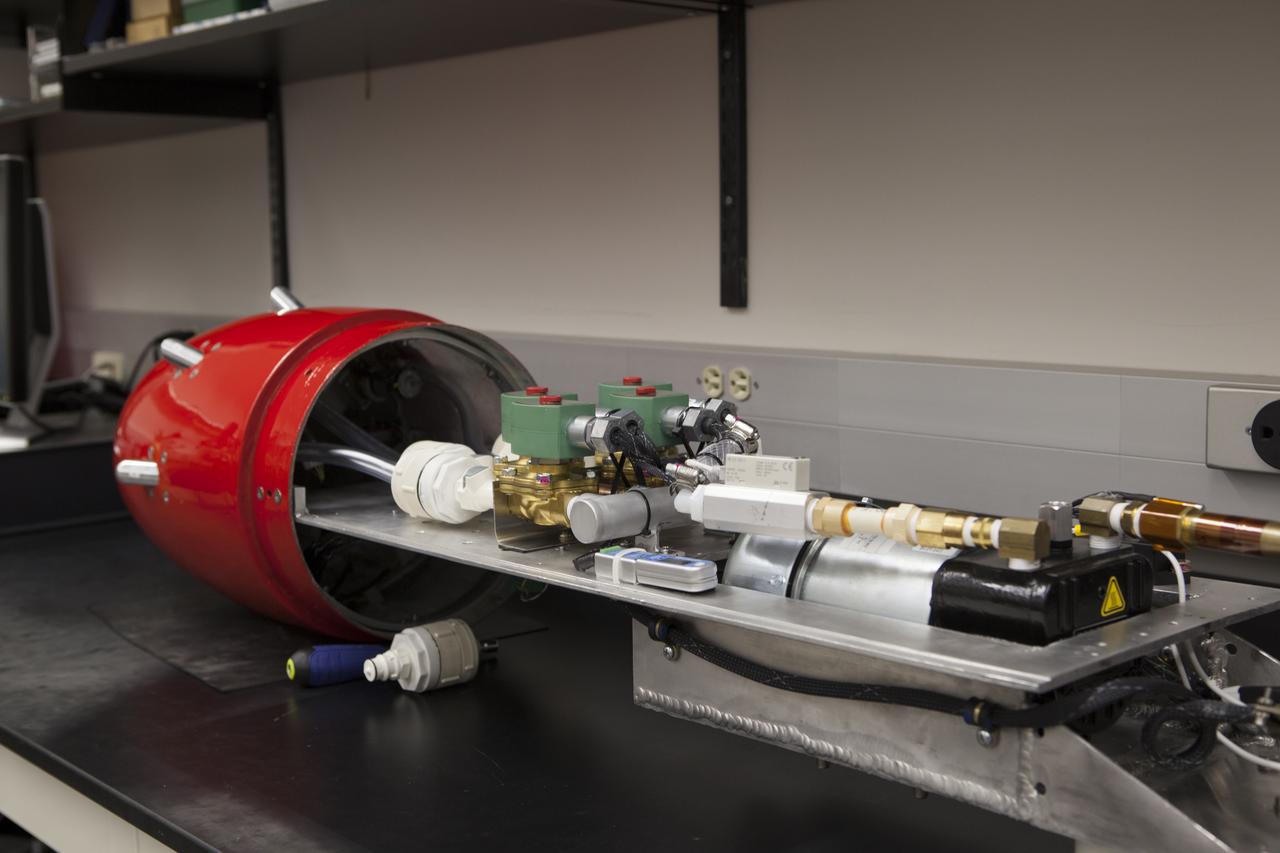
The Dust Atmospheric Recovery Technology, or DART, spacecraft is being assembled in a laboratory inside the Space Life Sciences Lab at NASA’s Kennedy Space Center in Florida. DART will characterize the dust loading and microbial diversity in the atmosphere over Florida during summer months with a special emphasis on their interactions during an African dust storm. DART will be used to collect atmospheric aerosols and suspended microbial cells over Florida and Kennedy. Results will help predict the risks of excessive microbial contamination adhering to spacecraft surfaces.
A researcher at NASA’s Kennedy Space Center in Florida checks a reading on the Dust Atmospheric Recovery Technology, or DART, spacecraft inside a laboratory at the Space Life Sciences Lab. DART will characterize the dust loading and microbial diversity in the atmosphere over Florida during summer months with a special emphasis on their interactions during an African dust storm. DART will be used to collect atmospheric aerosols and suspended microbial cells over Florida and Kennedy. Results will help predict the risks of excessive microbial contamination adhering to spacecraft surfaces.
A researcher from the University of Florida in Gainesville, checks the Dust Atmospheric Recovery Technology, or DART, spacecraft in a laboratory inside the Space Life Sciences Lab at NASA’s Kennedy Space Center in Florida. DART will characterize the dust loading and microbial diversity in the atmosphere over Florida during summer months with a special emphasis on their interactions during an African dust storm. DART will be used to collect atmospheric aerosols and suspended microbial cells over Florida and Kennedy. Results will help predict the risks of excessive microbial contamination adhering to spacecraft surfaces.
This image shows the southern high-latitudes region of Mars from March 19 through April 14, 2009, a period when regional dust storms occurred along the retreating edge of carbon-dioxide frost in the seasonal south polar cap. Compared with a full-hemisphere view (see PIA11987), this view shows more details of where the dust clouds formed and how they moved around the planet. The movie combines hundreds of images from the Mars Color Imager (MARCI) camera on NASA's Mars Reconnaissance Orbiter. In viewing the movie, it helps to understand some of the artifacts produced by the nature of MARCI images when seen in animation. MARCI acquires images in swaths from pole-to-pole during the dayside portion of each orbit. The camera can cover the entire planet in just over 12 orbits, and takes about 1 day to accumulate this coverage. The indiviual swaths are assembled into a mosaic, and that mosaic is shown here wrapped onto a sphere. The blurry portions of the mosaic, seen to be "pinwheeling" around the planet in the movie, are the portions of adjacent images viewing obliquely through the hazy atmosphsere. Portions with sharper-looking details are the central part of an image, viewing more directly downward through less atmosphere than the obliquely viewed portions. MARCI has a 180-degree field of view, and Mars fills about 78 percent of that field of view when the camera is pointed down at the planet. However, the Mars Reconnaissance Orbiter often is pointed to one side or the other off its orbital track in order to acquire targeted observations by the higher-resolution imaging systems on the spacecraft. When such rolls exceed about 20 degrees, gaps occur in the mosaic of MARCI swaths. Also, dark gaps appear when data are missing, either because of irrecoverable data drops, or because not all the data have yet been transmitted from the spacecraft. It isn't easy to see the actual dust motion in the atmosphere in these images, owing to the apparent motion of these artifacts. However, by concentrating on specific surface features (craters, prominent ice deposits, etc.) and looking for the brownish clouds of dust, it is possible to see where the storms start and how they move around the planet. In additon to tracking the storms, it is also interesting to watch how the seasonal cap shrinks from the beginning to the end of the animation. This shrinkage results from subliming of the carbon-dioxide frost from the surface as the frost absorbs southern hemisphere mid-spring sunlight. The temperature contrast between the warm sunlit ground just north of the cap's edge and the cold carbon-dioxide frost generates strong winds, enhanced by the excess carbon dioxide subliming off the cap. These winds create the conditions that lead to the dust storms. http://photojournal.jpl.nasa.gov/catalog/PIA11988
HiRISE commonly takes images of recent craters on Mars, which are usually found by the MRO Context Camera where they disturb surface dust. An impact site in this area was first imaged in December 2017. A year and a half later, the scene looks totally different! Dust has eroded from the surface, probably due to the planet-encircling dust storm from 2018. The dark spots around the fresh craters have vanished because they only affected the dust that has since disappeared. See if you can find the craters in the new image by comparing with the old one. https://photojournal.jpl.nasa.gov/catalog/PIA23233
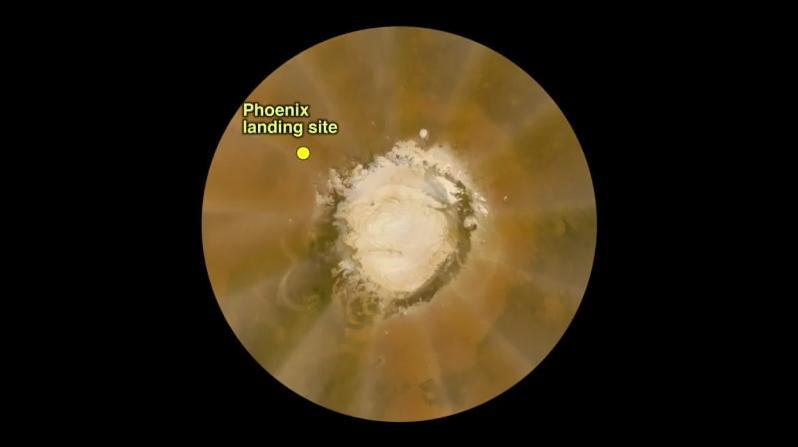
Scientists were anticipating clear skies when NASA Phoenix Mars Lander arrives on the north polar plains of the Red Planet Sunday, May 25, 2008.
On March 2, 2003, NASA Terra spacecraft saw near-surface winds carrying a large amount of Saharan dust aloft and transported the material westward over the Atlantic Ocean.
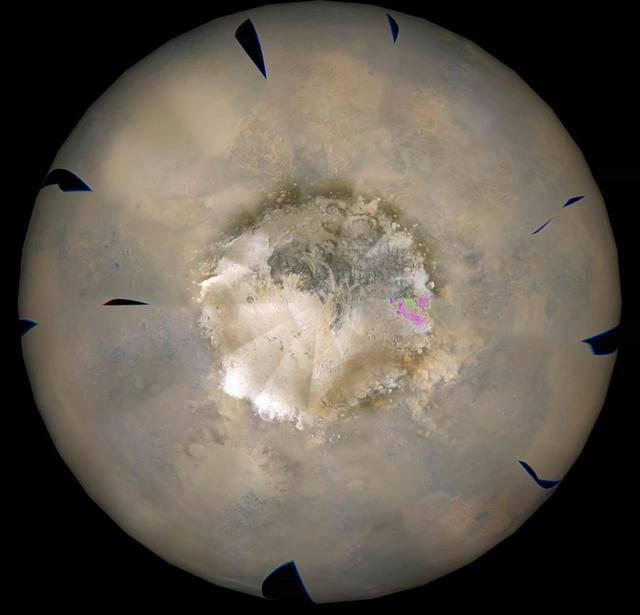
This image is from a movie from NASA Mars Reconnaissance Orbiter showing the southern high-latitudes region of Mars from Mar. 19-Apr. 14, 2009, a period when regional dust storms occurred along the retreating edge of carbon-dioxide frost in the seasonal south polar cap. The movie combines hundreds of images from the Mars Color Imager (MARCI) camera on NASA's Mars Reconnaissance Orbiter. In viewing the movie, it helps to understand some of the artifacts produced by the nature of MARCI images when seen in animation. MARCI acquires images in swaths from pole-to-pole during the dayside portion of each orbit. The camera can cover the entire planet in just over 12 orbits, and takes about 1 day to accumulate this coverage. The indiviual swaths are assembled into a mosaic, and that mosaic is shown here wrapped onto a sphere. The blurry portions of the mosaic, seen to be "pinwheeling" around the planet in the movie, are the portions of adjacent images viewing obliquely through the hazy atmosphsere. Portions with sharper-looking details are the central part of an image, viewing more directly downward through less atmosphere than the obliquely viewed portions. MARCI has a 180-degree field of view, and Mars fills about 78 percent of that field of view when the camera is pointed down at the planet. However, the Mars Reconnaissance Orbiter often is pointed to one side or the other off its orbital track in order to acquire targeted observations by the higher-resolution imaging systems on the spacecraft. When such rolls exceed about 20 degrees, gaps occur in the mosaic of MARCI swaths. Also, dark gaps appear when data are missing, either because of irrecoverable data drops, or because not all the data have yet been transmitted from the spacecraft. It isn't easy to see the actual dust motion in the atmosphere in these images, owing to the apparent motion of these artifacts. However, by concentrating on specific surface features (craters, prominent ice deposits, etc.) and looking for the brownish clouds of dust, it is possible to see where the storms start and how they move around the planet. In additon to tracking the storms, it is also interesting to watch how the seasonal cap shrinks from the beginning to the end of the animation. This shrinkage results from subliming of the carbon-dioxide frost from the surface as the frost absorbs southern hemisphere mid-spring sunlight. The temperature contrast between the warm sunlit ground just north of the cap's edge and the cold carbon-dioxide frost generates strong winds, enhanced by the excess carbon dioxide subliming off the cap. These winds create the conditions that lead to the dust storms. http://photojournal.jpl.nasa.gov/catalog/PIA11987
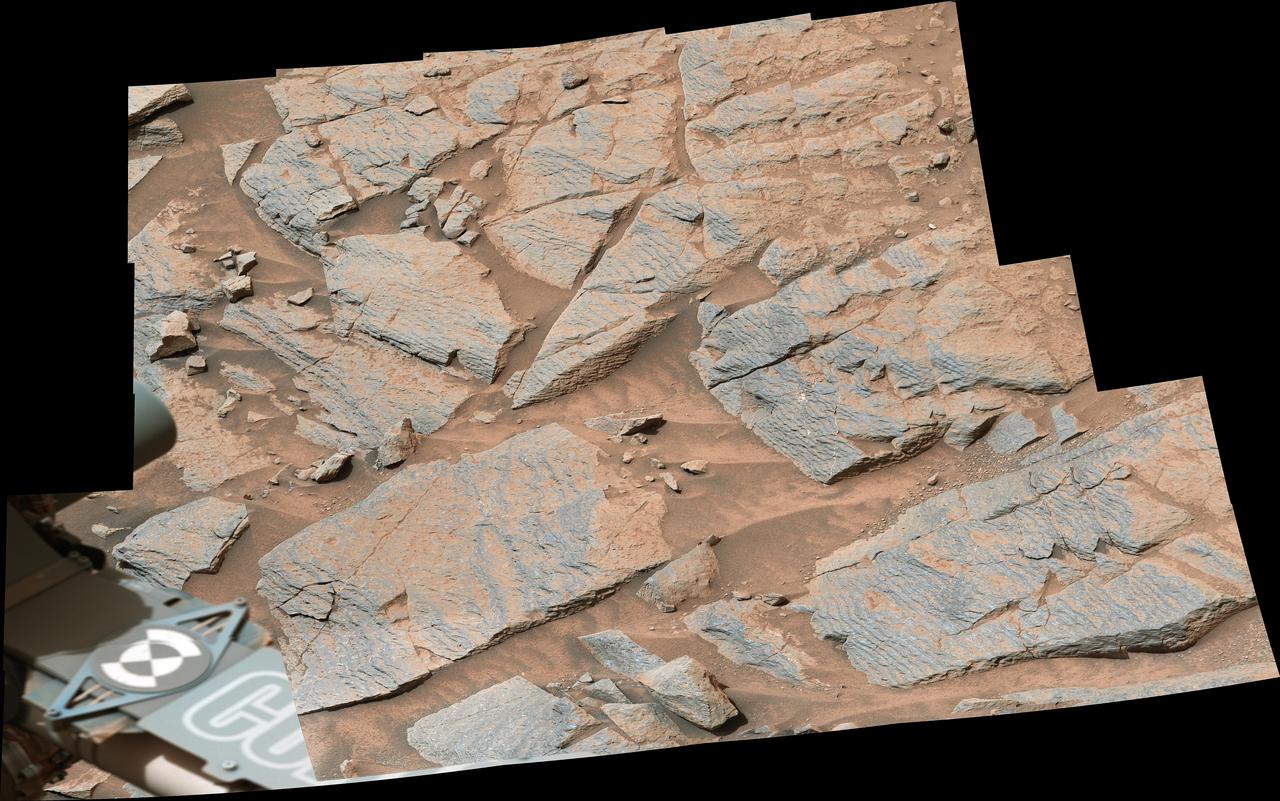
NASA's Curiosity Mars rover captured this image of rhythmic rock layers with a repetitive pattern in their spacing and thickness. The pattern might have been caused by weather or climate cycles occurring while the sediment layers were being deposited, such as dust storms happening at regular intervals in the ancient past. This mosaic is made up of 17 individual images captured in the "Marker Band" area by Curiosity's Mastcam on Nov. 7, 2022, the 3,646th Martian day, or sol, of the mission. The mosaic was captured by Mastcam's 34-millimeter-focal-length camera. https://photojournal.jpl.nasa.gov/catalog/PIA25734
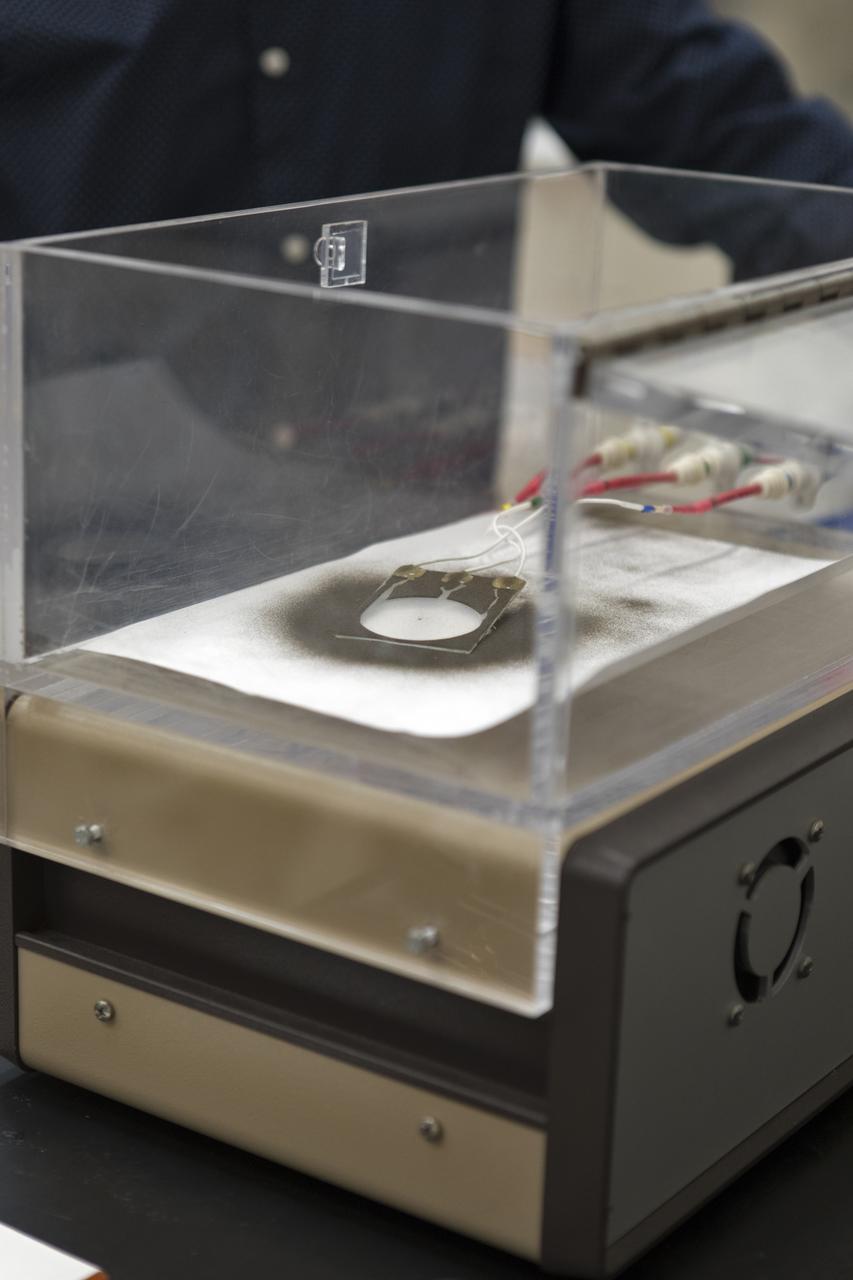
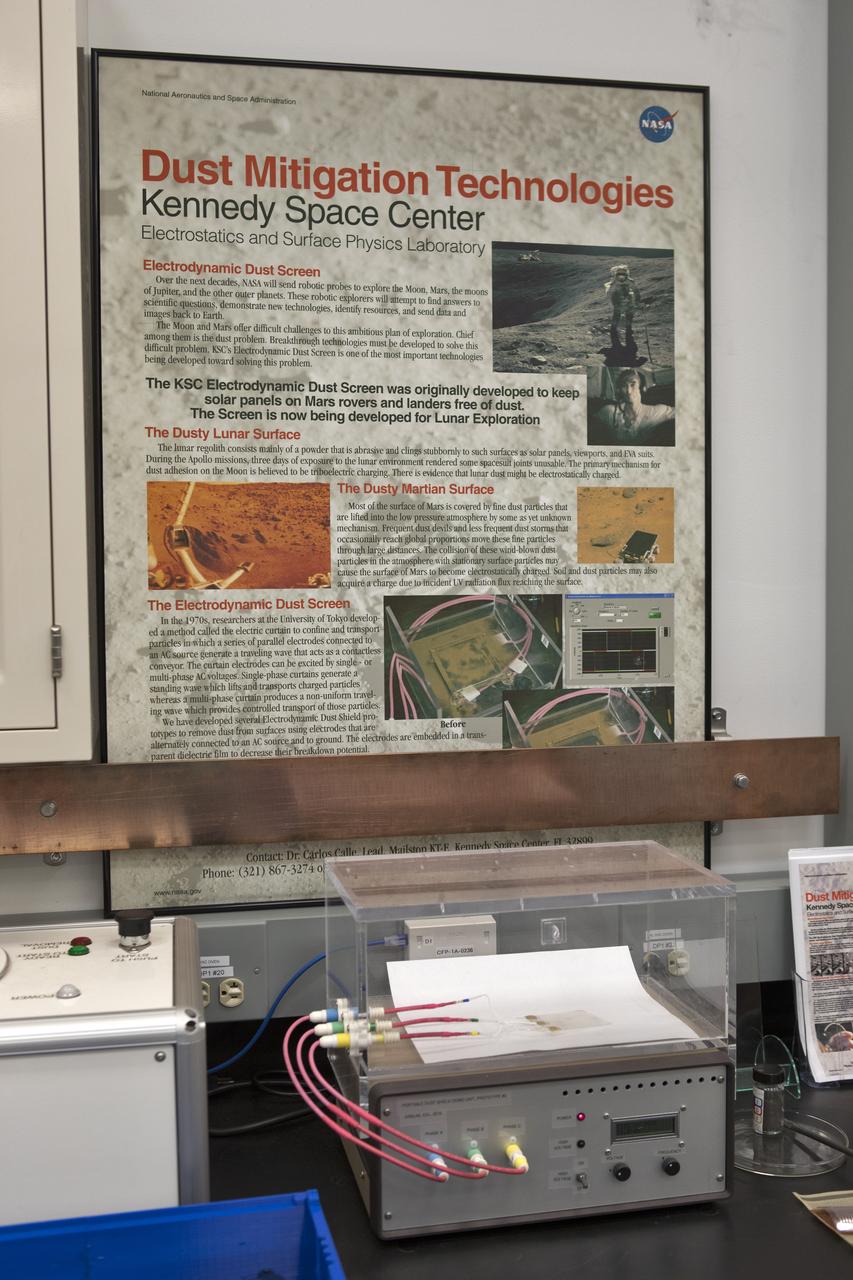
In the Electrostatics and Surface Physics Laboratory at NASA's Kennedy Space Center in Florida on Thursday, July 19, 2018, an experiment is underway in which an Electrostatic Dust Shield was been covered with dust similar to that which may be encountered by astronauts exploring the Moon or Mars. After activation, the device shook off the dust. Scientists are developing the dust shield to help mitigate the problem of dust on equipment, astronauts' space suits and helmet visors. The device is slated for analysis aboard International Space Station in the spring of 2019 to verify the effects of the space environment.
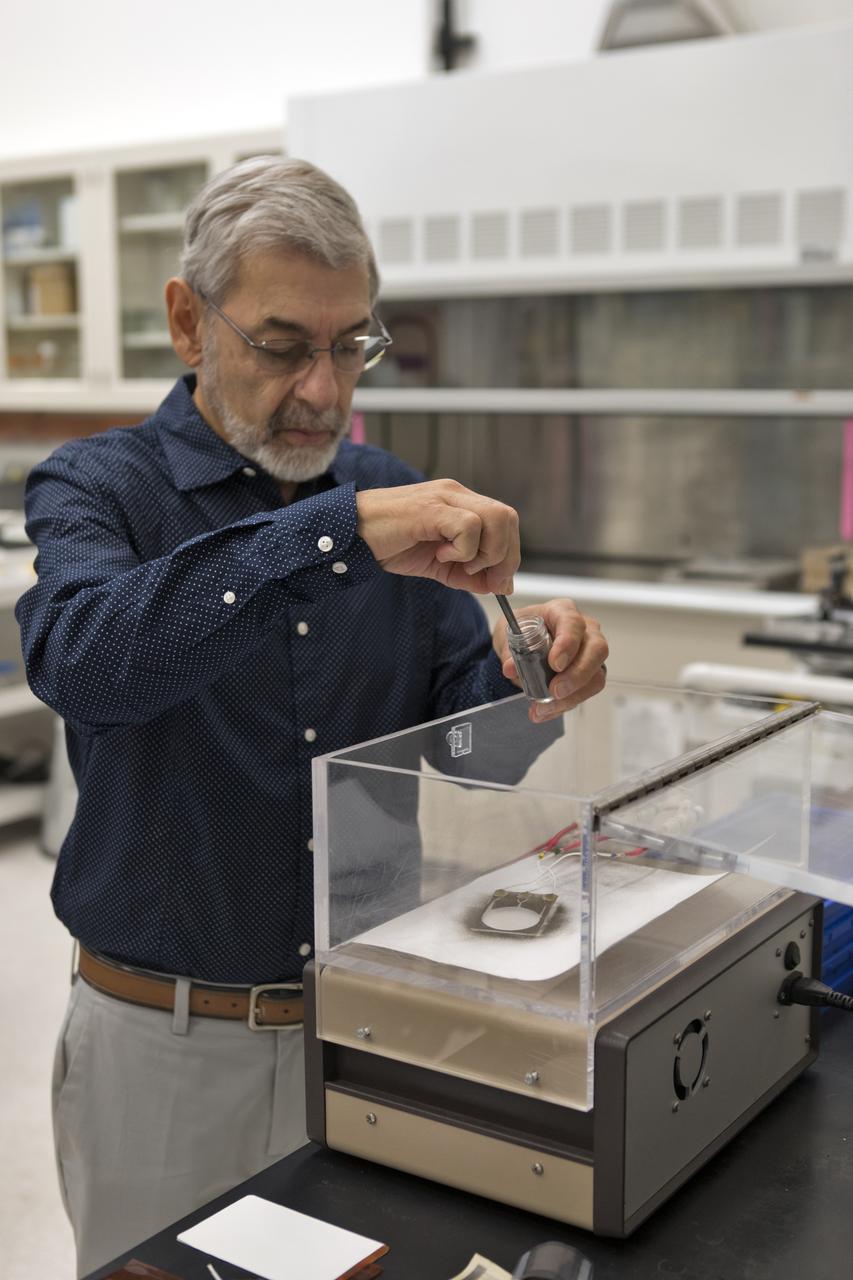
Dr. Carlos Calle, lead scientist in the Electrostatics and Surface Physics Laboratory at NASA's Kennedy Space Center in Florida, prepares an Electrostatic Dust Shield for testing on Thursday, July 19, 2018. Scientists are developing the Electrostatic Dust Shield to help mitigate the problem of dust on equipment, astronauts' space suits and helmet visors of astronauts exploring the Moon or Mars. The device is slated for analysis aboard International Space Station in the spring of 2019 to verify the effects of the space environment.
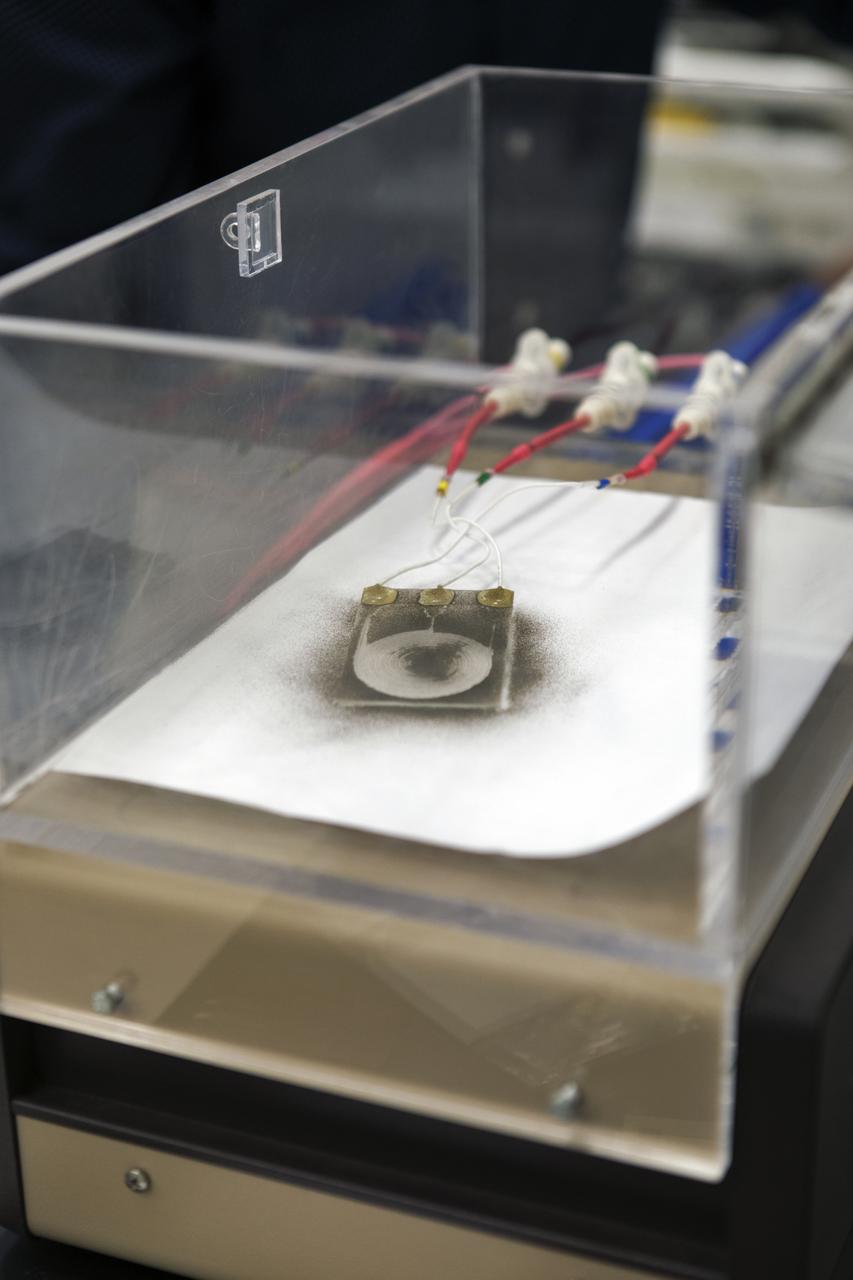
In the Electrostatics and Surface Physics Laboratory at NASA's Kennedy Space Center in Florida on Thursday, July 19, 2018, an experiment is underway in which an Electrostatic Dust Shield has been covered with dust similar to that which may be encountered by astronauts exploring the Moon or Mars. When activated, the device shakes off the dust. Scientists are developing the dust shield to help mitigate the problem of dust on equipment, astronauts' space suits and helmet visors. The device is slated for analysis aboard International Space Station in the spring of 2019 to verify the effects of the space environment.
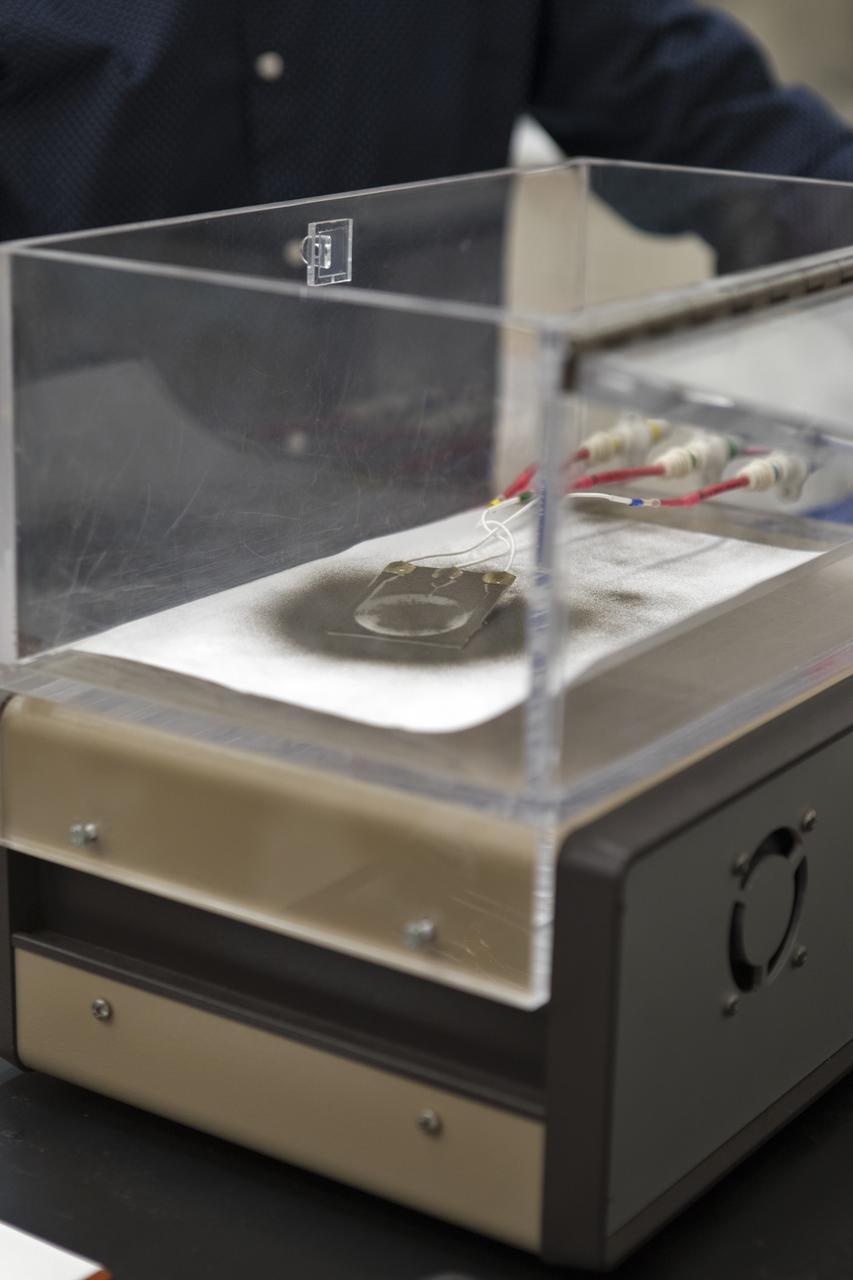
In the Electrostatics and Surface Physics Laboratory at NASA's Kennedy Space Center in Florida on Thursday, July 19, 2018, an experiment is underway in which an Electrostatic Dust Shield was been covered with dust similar to that which may be encountered by astronauts exploring the Moon or Mars. When activated, the device shook off the dust. Scientists are developing the dust shield to help mitigate the problem of dust on equipment, astronauts' space suits and helmet visors. The device is slated for analysis aboard International Space Station in the spring of 2019 to verify the effects of the space environment.
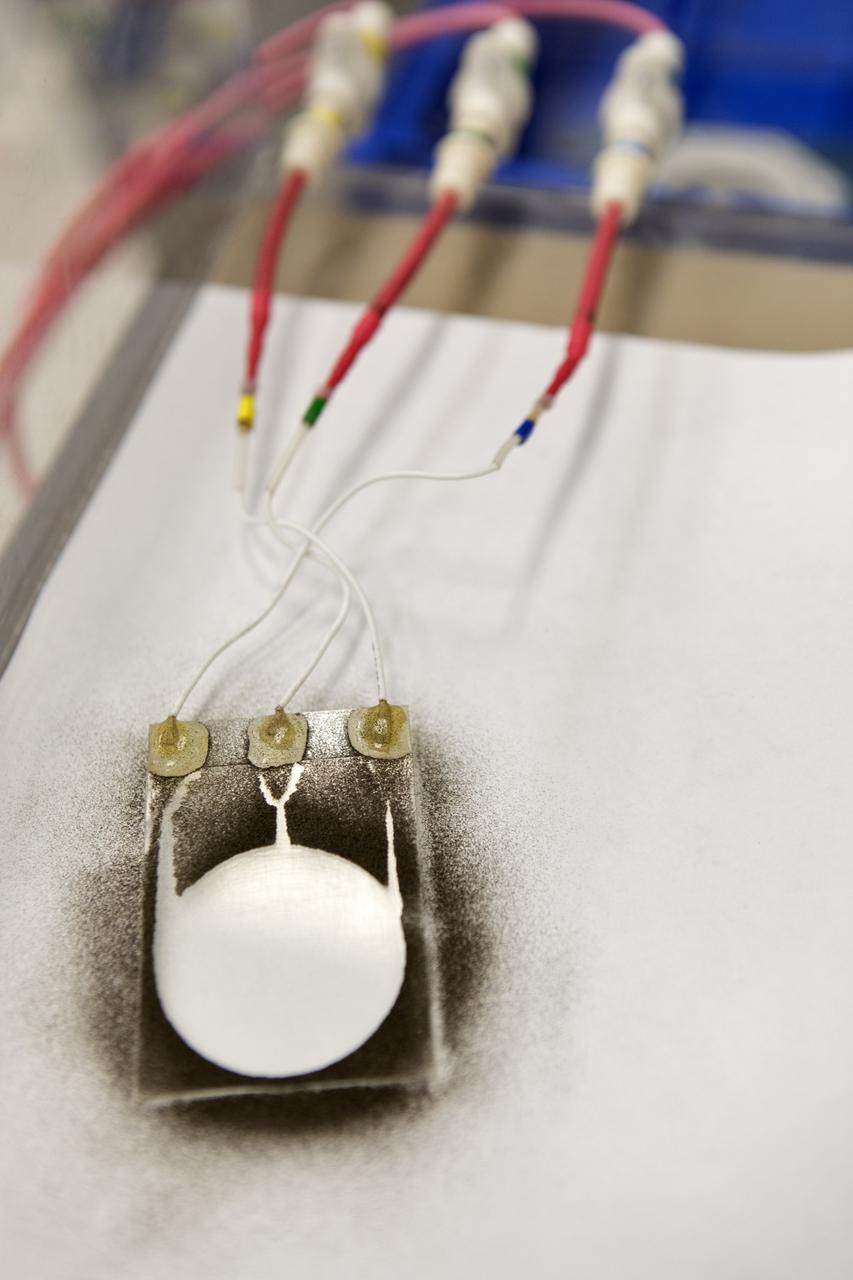
In the Electrostatics and Surface Physics Laboratory at NASA's Kennedy Space Center in Florida on Thursday, July 19, 2018, an experiment is underway in which an Electrostatic Dust Shield was been covered with dust similar to that which may be encountered by astronauts exploring the Moon or Mars. When activated, the device shook off the dust. Scientists are developing the dust shield to help mitigate the problem of dust on equipment, astronauts' space suits and helmet visors. The device is slated for analysis aboard International Space Station in the spring of 2019 to verify the effects of the space environment.
In the Electrostatics and Surface Physics Laboratory at NASA's Kennedy Space Center in Florida, an Electrostatic Dust Shield is prepared for testing on Thursday, July 19, 2018. Scientists are developing the Electrostatic Dust Shield to help mitigate the problem of dust on equipment, space suits and helmet visors of astronauts exploring the Moon or Mars. The device is being prepared for analysis aboard International Space Station in the spring of 2019 to verify the effects of the space environment.

On Thursday, July 19, 2018, Dr. Carlos Calle, lead scientist in the Electrostatics and Surface Physics Laboratory at NASA's Kennedy Space Center in Florida, shows an Electrostatic Dust Shield that had been covered with dust similar to that which may be encountered by astronauts exploring the Moon or Mars. When activated, the device shook off the dust. Scientists are developing the dust shield to help mitigate the problem of dust on equipment, astronauts' space suits and helmet visors. The device is slated for analysis aboard International Space Station in the spring of 2019 to verify the effects of the space environment.
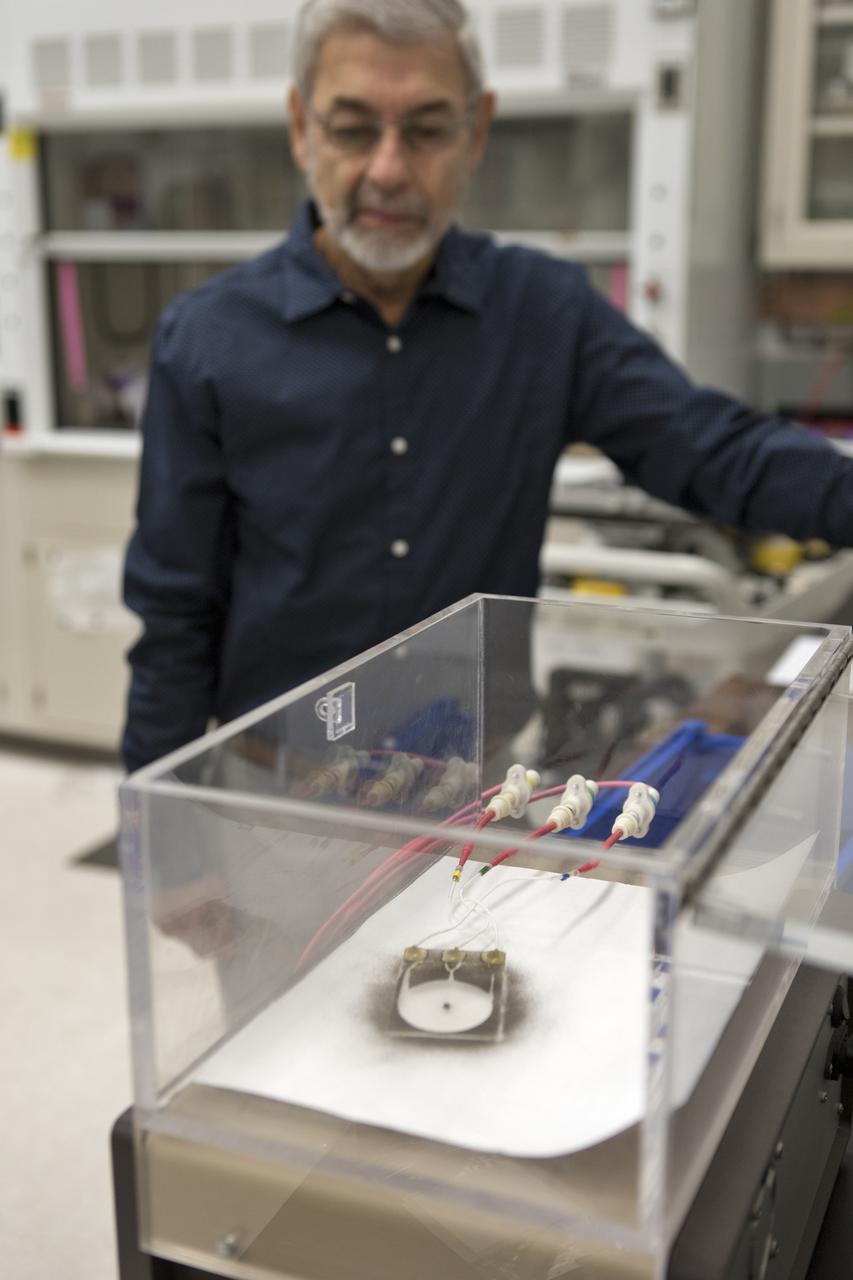
On Thursday, July 19, 2018, Dr. Carlos Calle, lead scientist in the Electrostatics and Surface Physics Laboratory at NASA's Kennedy Space Center in Florida, activates an experiment in which an Electrostatic Dust Shield has been covered with dust similar to that which may be encountered by astronauts exploring the Moon or Mars. When activated, the device shakes off the dust. Scientists are developing the dust shield to help mitigate the problem of dust on equipment, astronauts' space suits and helmet visors. The device is slated for analysis aboard International Space Station in the spring of 2019 to verify the effects of the space environment.