
Dynamic Mars

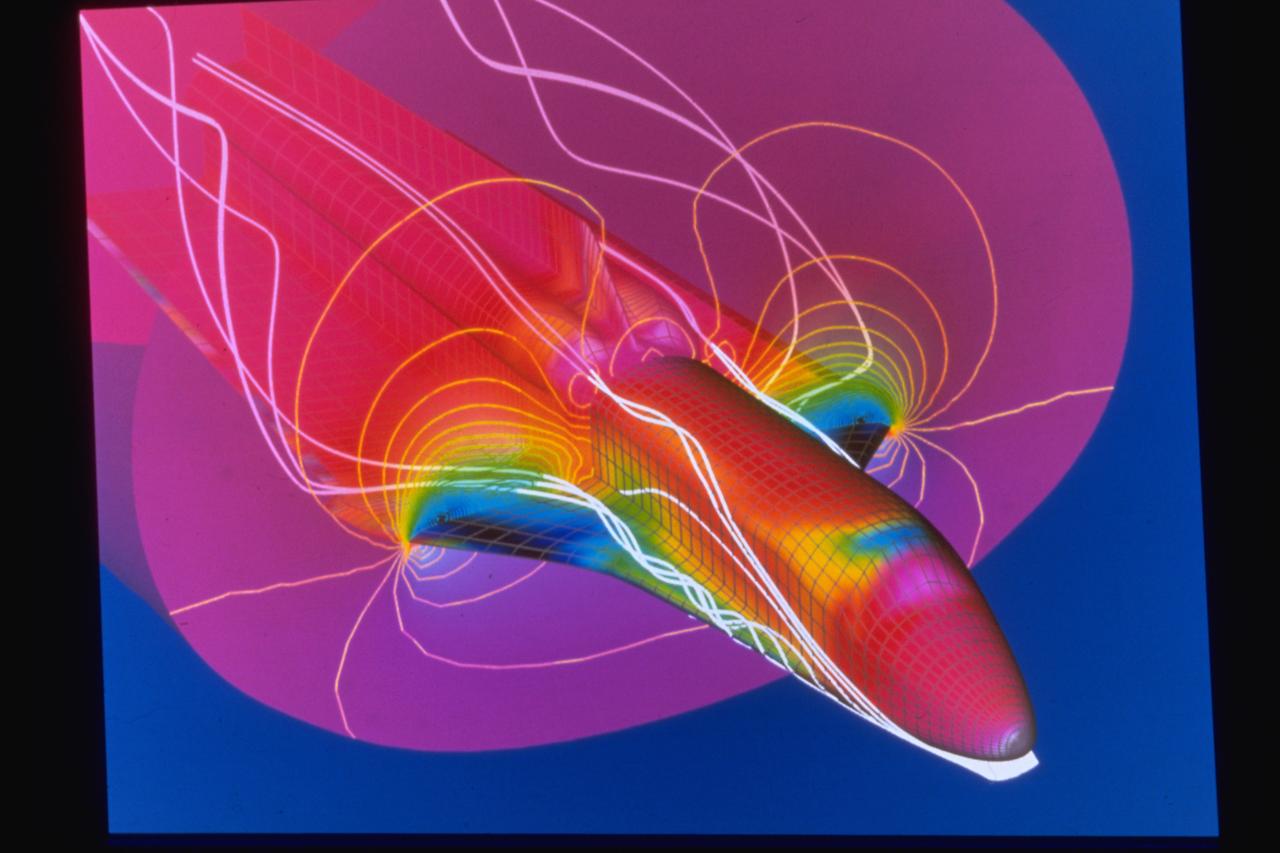
PROPULSION FLOW DYNAMICS

PROPULSION FLOW DYNAMICS

PROPULSION FLOW DYNAMICS
PROPULSION FLOW DYNAMICS

PROPULSION FLOW DYNAMICS
PROPULSION FLOW DYNAMICS
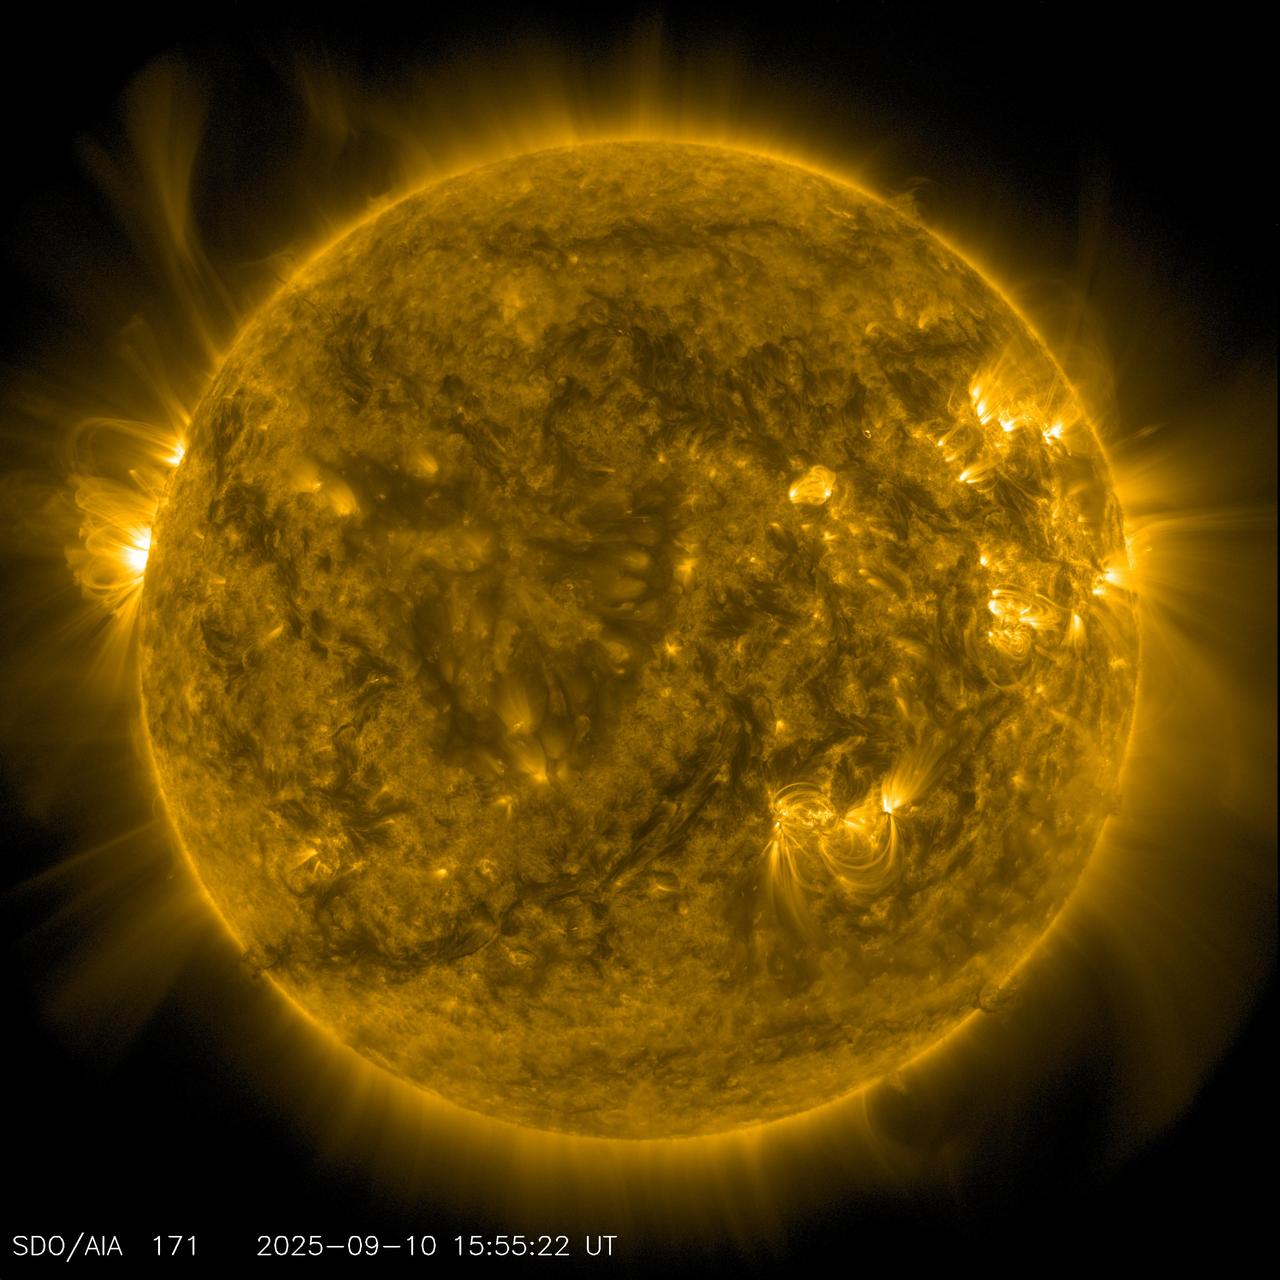
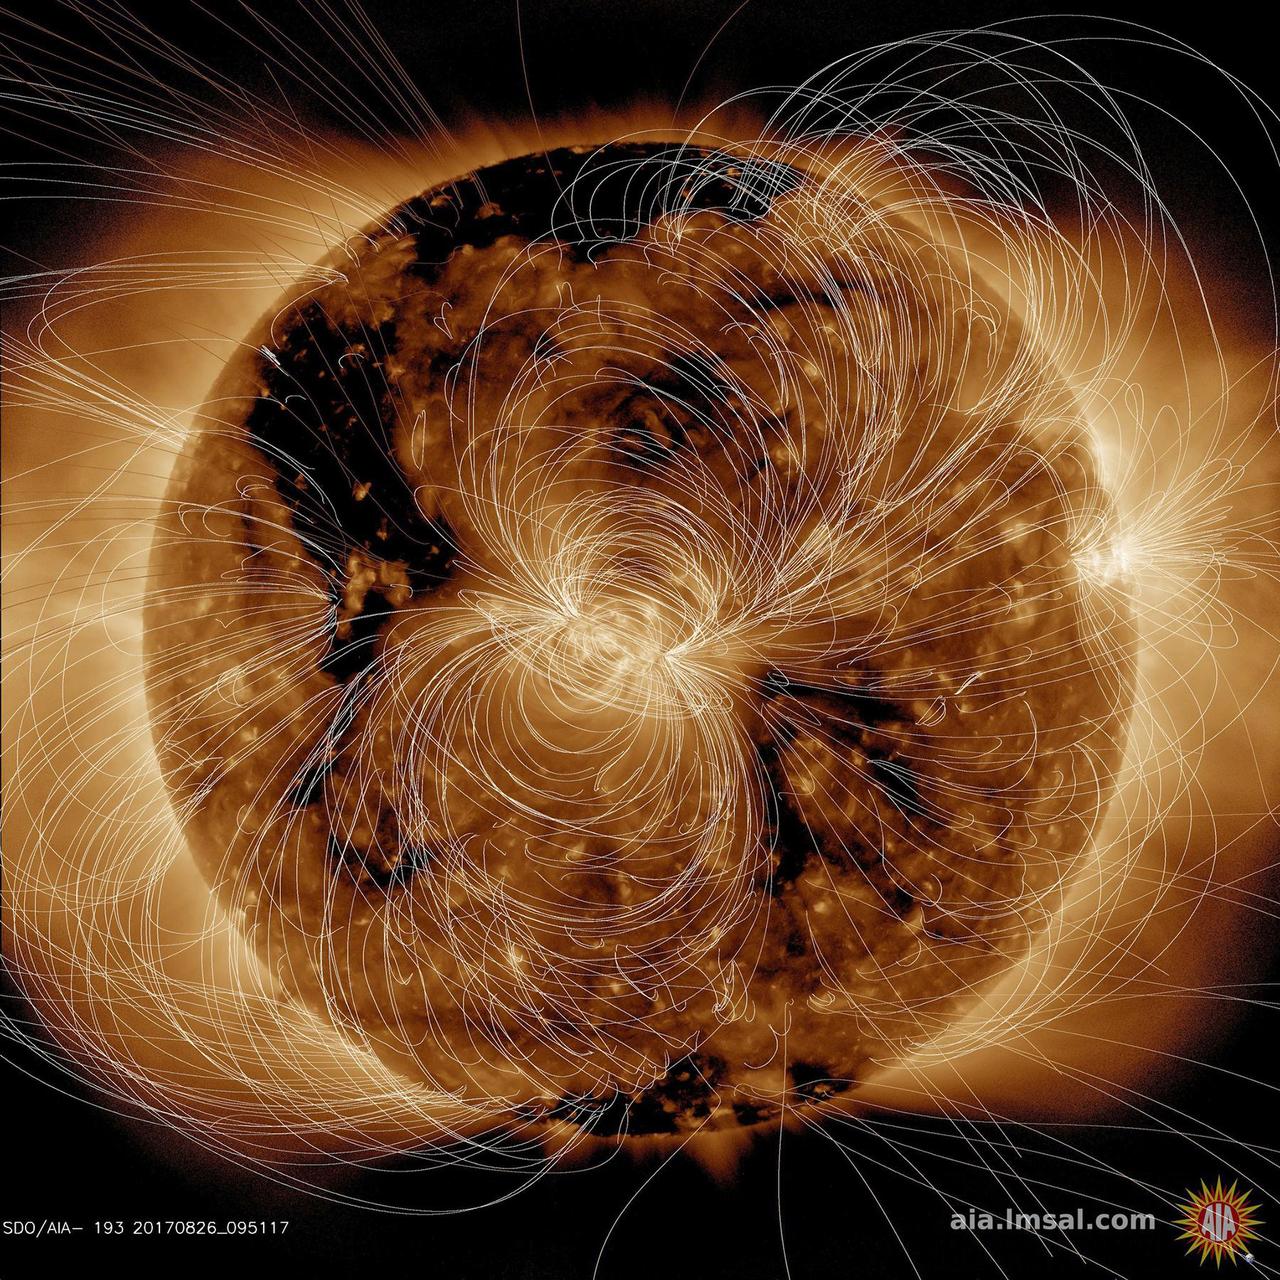
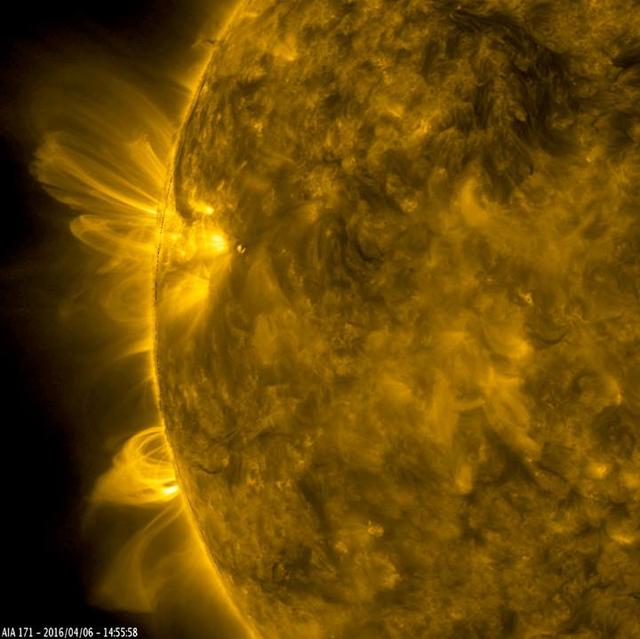
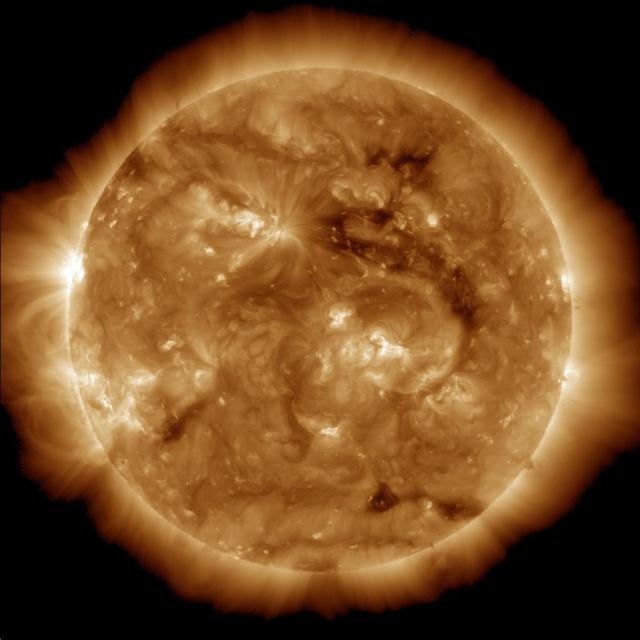
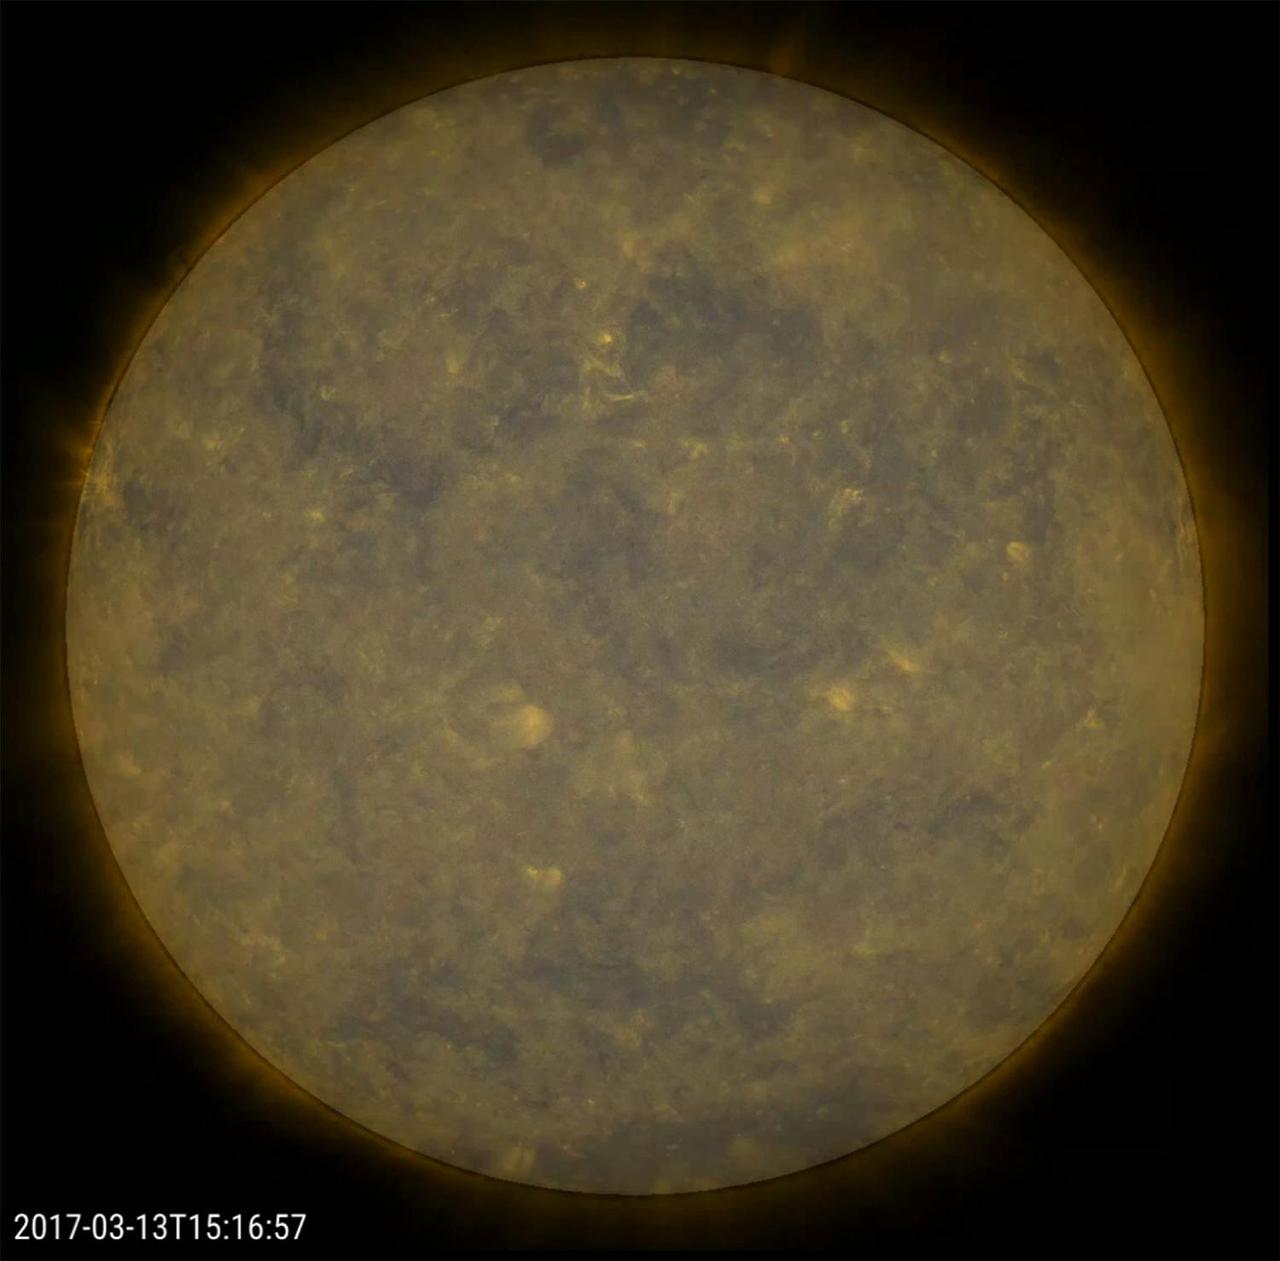
On Sept. 10, 2025, NASA's Solar Dynamics Observatory captured this image of the Sun. SDO is managed by NASA's Goddard Space Flight Center, Greenbelt, Maryland, for NASA's Science Mission Directorate in Washington. Its Atmosphere Imaging Assembly was built by the Lockheed Martin Solar Astrophysics Laboratory in Palo Alto, California. https://photojournal.jpl.nasa.gov/catalog/PIA26681
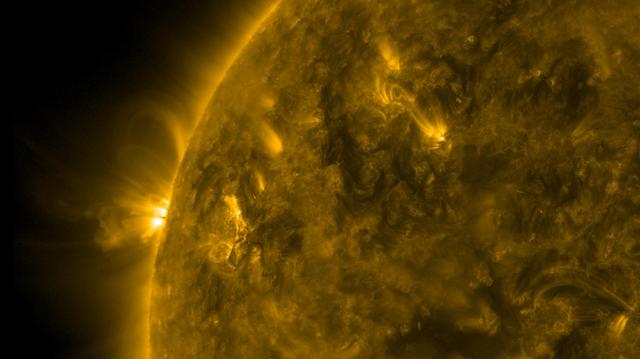
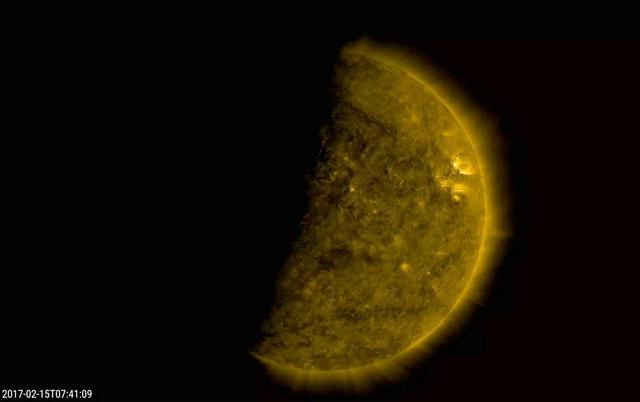
As an active region rotated into view, NASA Solar Dynamics Observatory was able to observe well-defined magnetic loops gyrating above the sun between Mar, 23-24, 2017. These loops appear because charged particles spinning along the magnetic field lines above this active region are made visible in this wavelength of extreme ultraviolet light. The video clip covers about a day and a half of activity. Movies are available at https://photojournal.jpl.nasa.gov/catalog/PIA21583
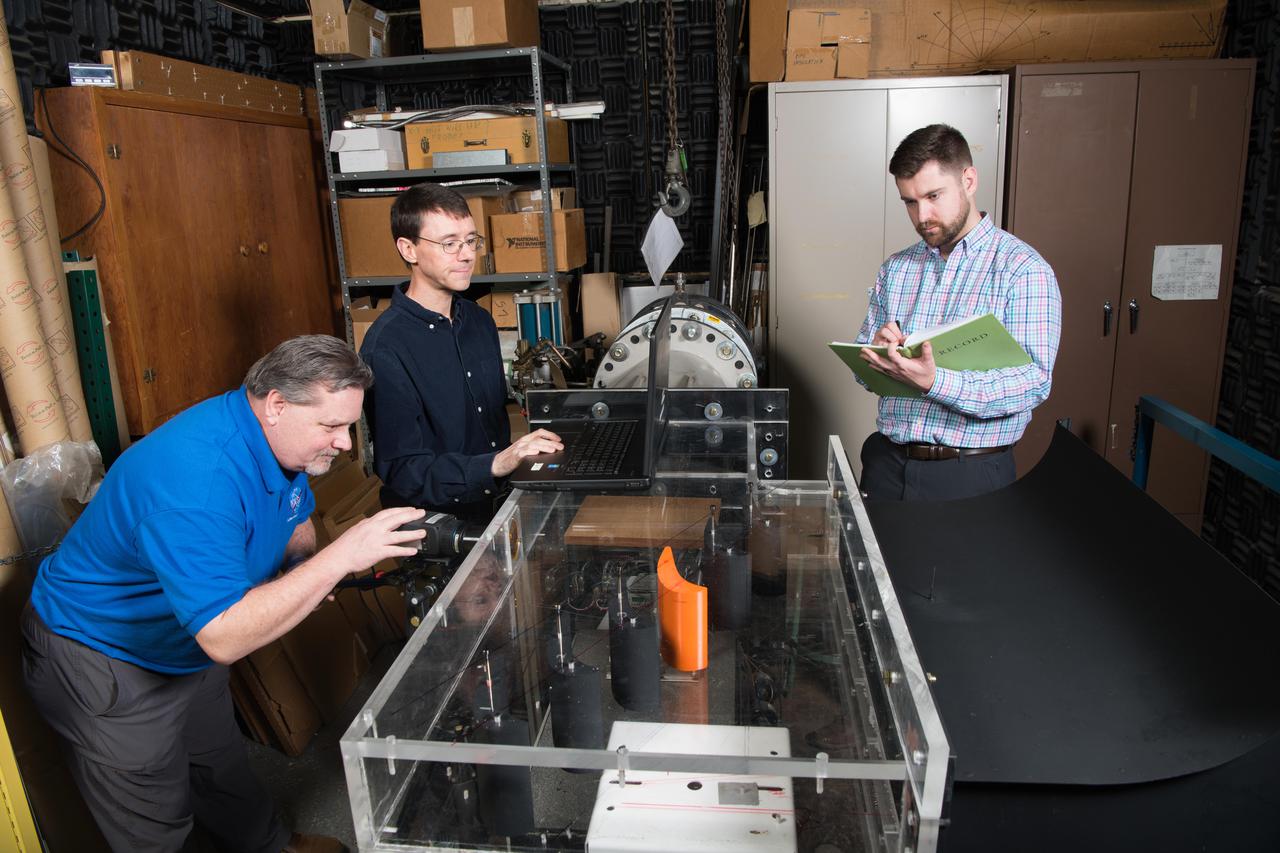
PROPULSION FLOW DYNAMICS
A Dynamic Spirit Site
F Ring Dynamism
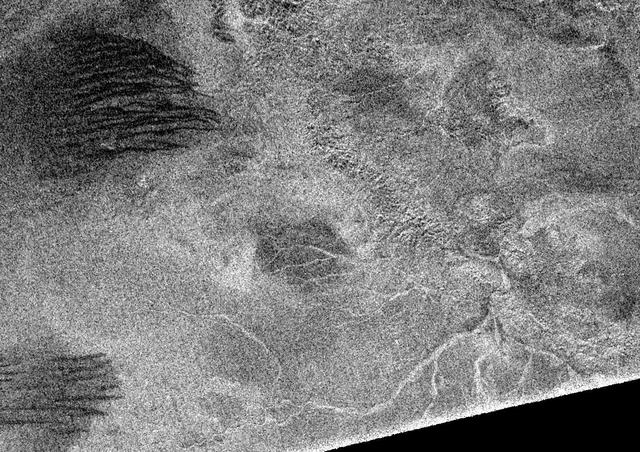
Titan, a Geologically Dynamic World
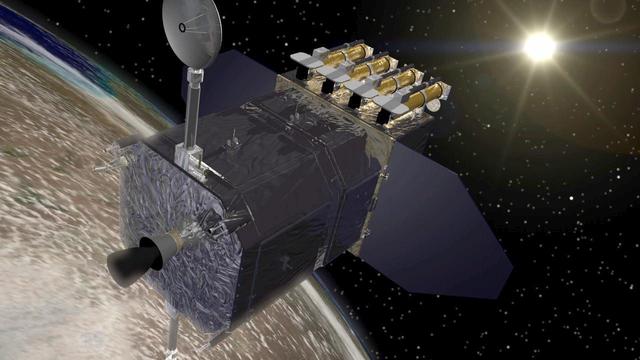
The Solar Dynamics Observatory SDO spacecraft, shown above the Earth as it faces toward the Sun. SDO is designed to study the influence of the Sun on the Earth and the inner solar system by studying the solar atmosphere. http://photojournal.jpl.nasa.gov/catalog/PIA18169

Madhulika Guhathakurta, SDO Program Scientist, speaks during a briefing to discuss the upcoming launch of NASA's Solar Dynamic Observatory, or SDO, Thursday, Jan. 21, 2010, at NASA Headquarters in Washington. The mission is to study the Sun and its dynamic behavior. Photo Credit: (NASA/Paul E. Alers)

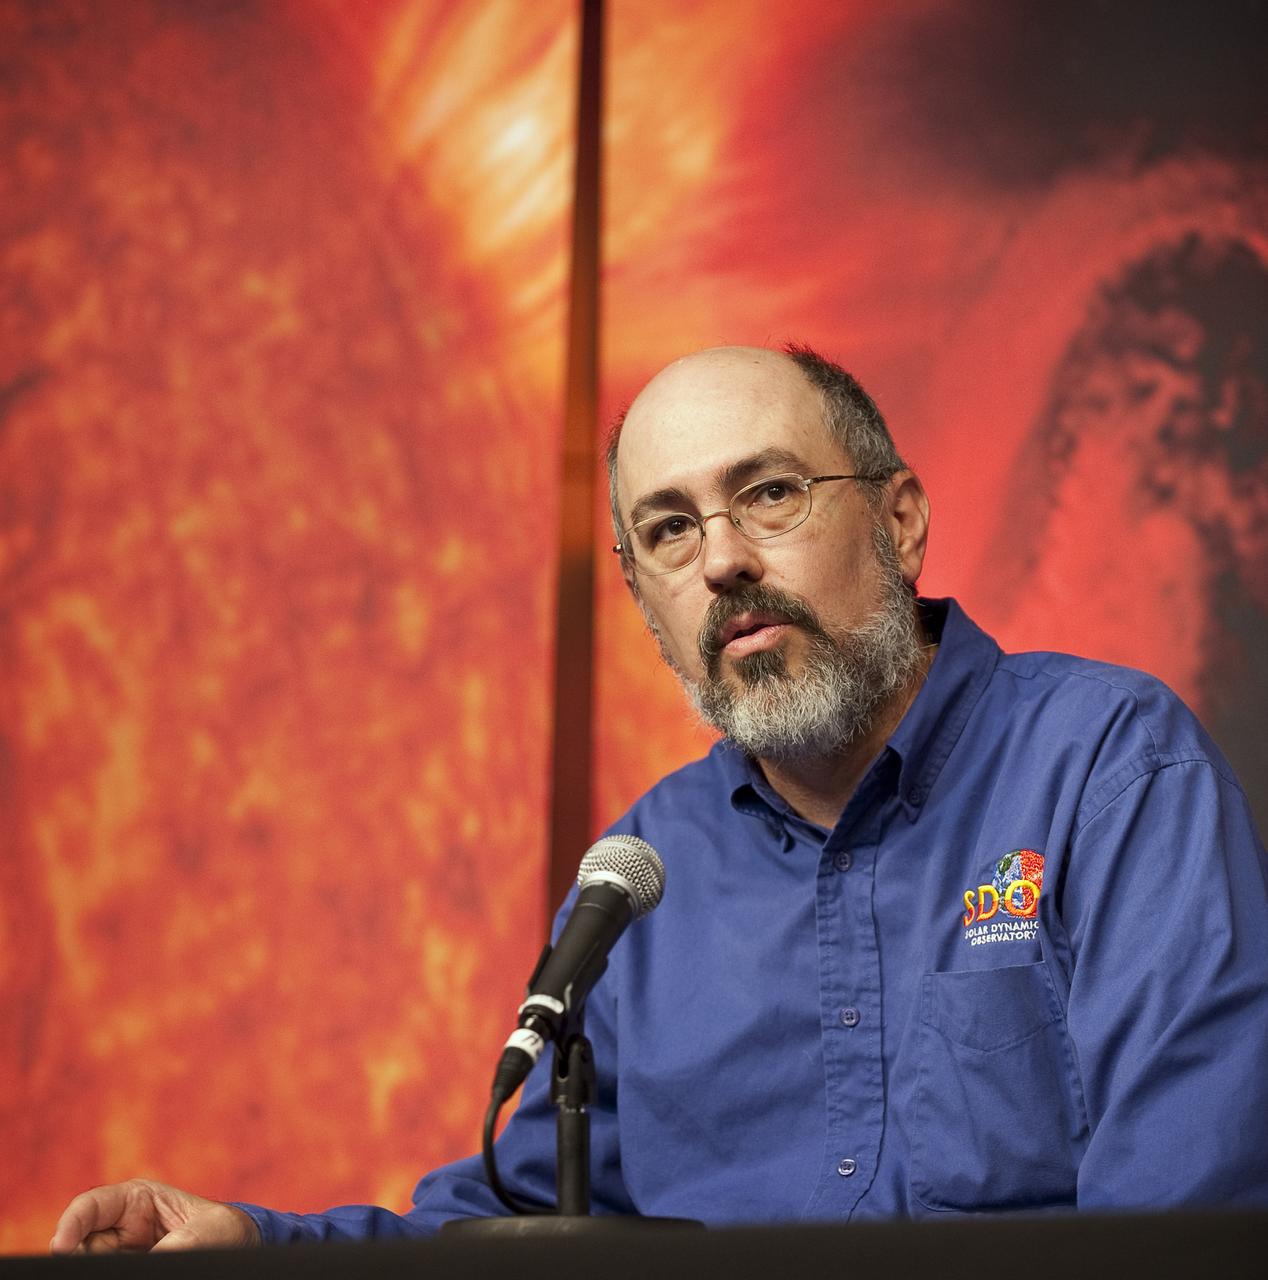
Richard Fisher, Heliophysics Division Director at NASA Headquarters, speaks during a briefing to discuss the upcoming launch of NASA's Solar Dynamic Observatory, or SDO, Thursday, Jan. 21, 2010, at NASA Headquarters in Washington. The mission is to study the Sun and its dynamic behavior. Photo Credit: (NASA/Paul E. Alers)

F-111B Fighter, Variable Sweep wings, wings swept forward, landing gear down. Slat experiments. The General Dynamics/Grumman F-111B was a long-range carrier-based interceptor aircraft that was planned to be a follow-on to the F-4 Phantom II. The F-111B was developed in the 1960s by General Dynamics in conjunction with Grumman for the United States Navy (USN) as part of the joint Tactical Fighter Experimental (TFX) with the United States Air Force (USAF) to produce a common fighter for the services that could perform a variety of missions.
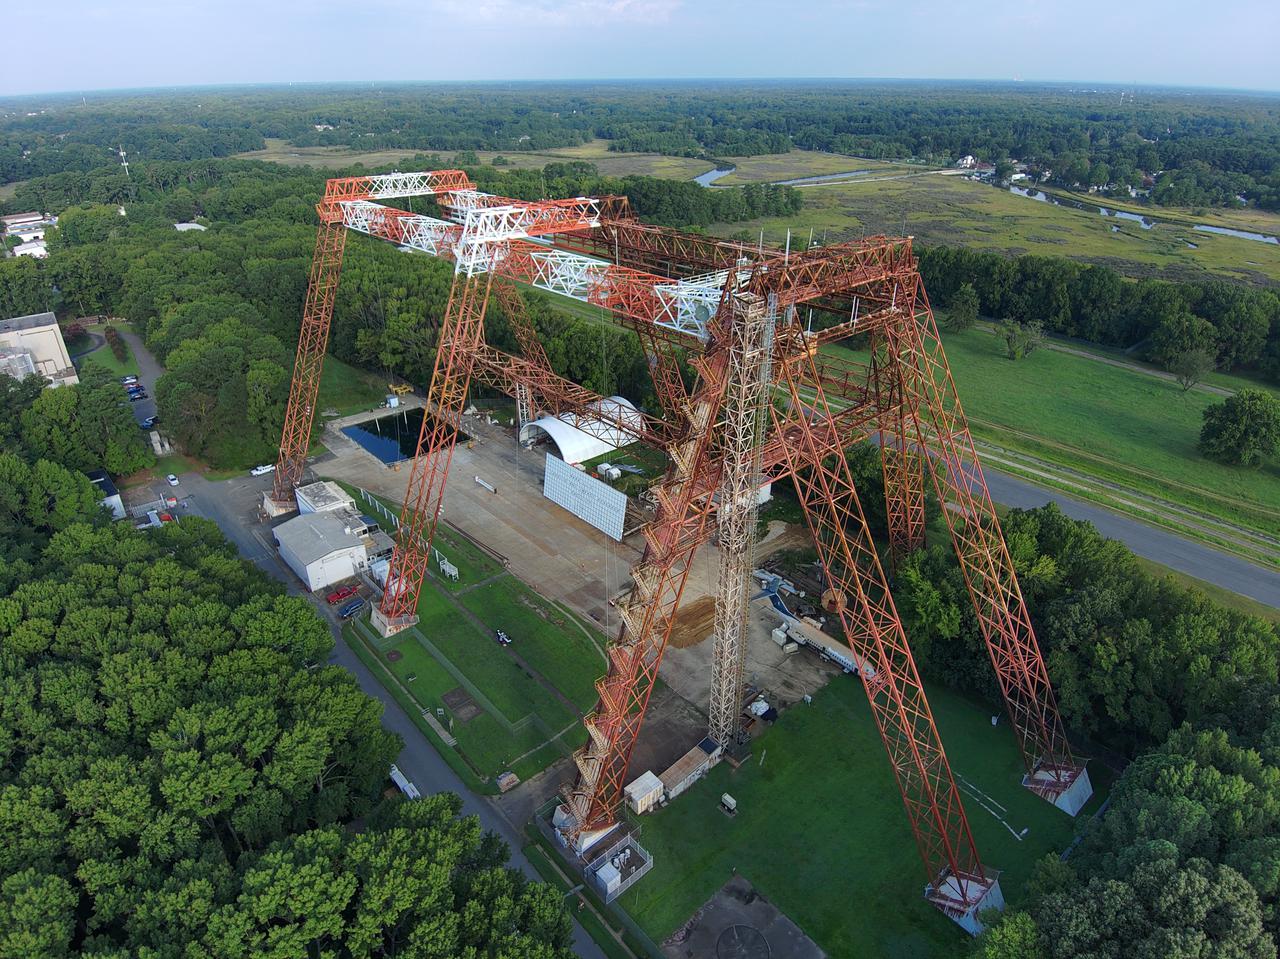
Langley’s historic Impact Dynamics Facility for full-scale aircraft crash testing stands on the western corner of the NASA Langley campus. In its original configuration, the “gantry” was used to train the Mercury 7

Richard Fisher, Heliophysics Division Director at NASA Headquarters, left, speaks during a briefing to discuss the upcoming launch of NASA's Solar Dynamic Observatory, or SDO, Thursday, Jan. 21, 2010, as Madhulika Guhathakurta, SDO Program Scientist looks on at NASA Headquarters in Washington. The mission is to study the Sun and its dynamic behavior. Photo Credit: (NASA/Paul E. Alers)

Dynamically tunable structural colors based on asymmetric Fabry-Perot cavities
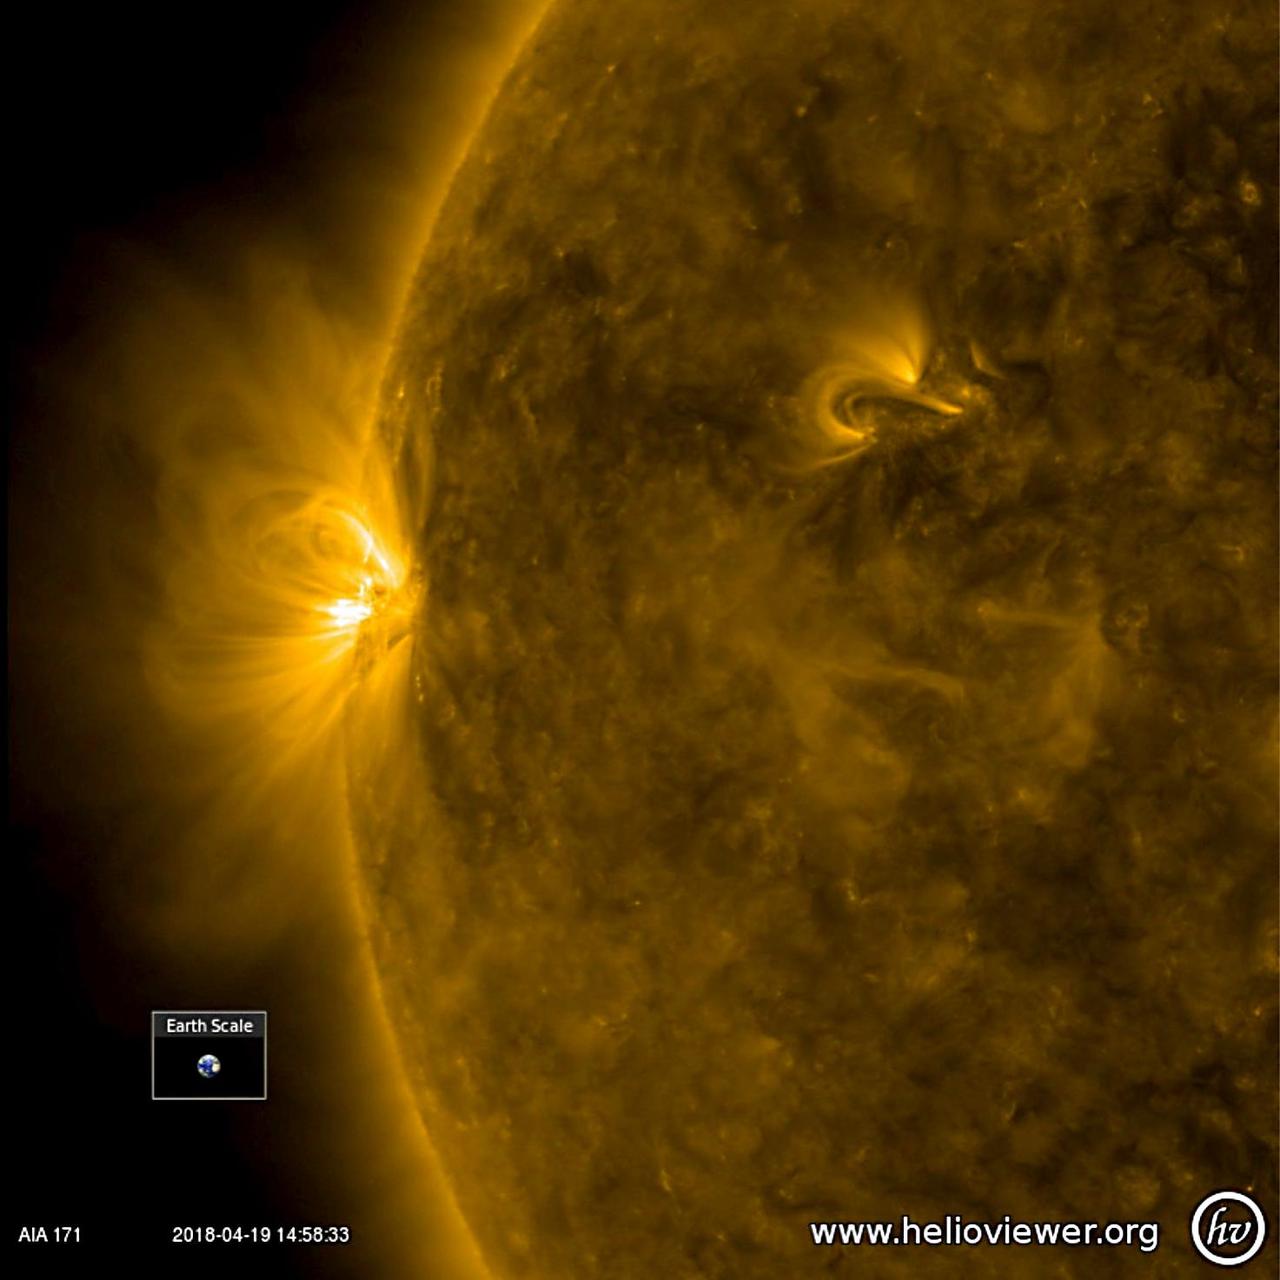
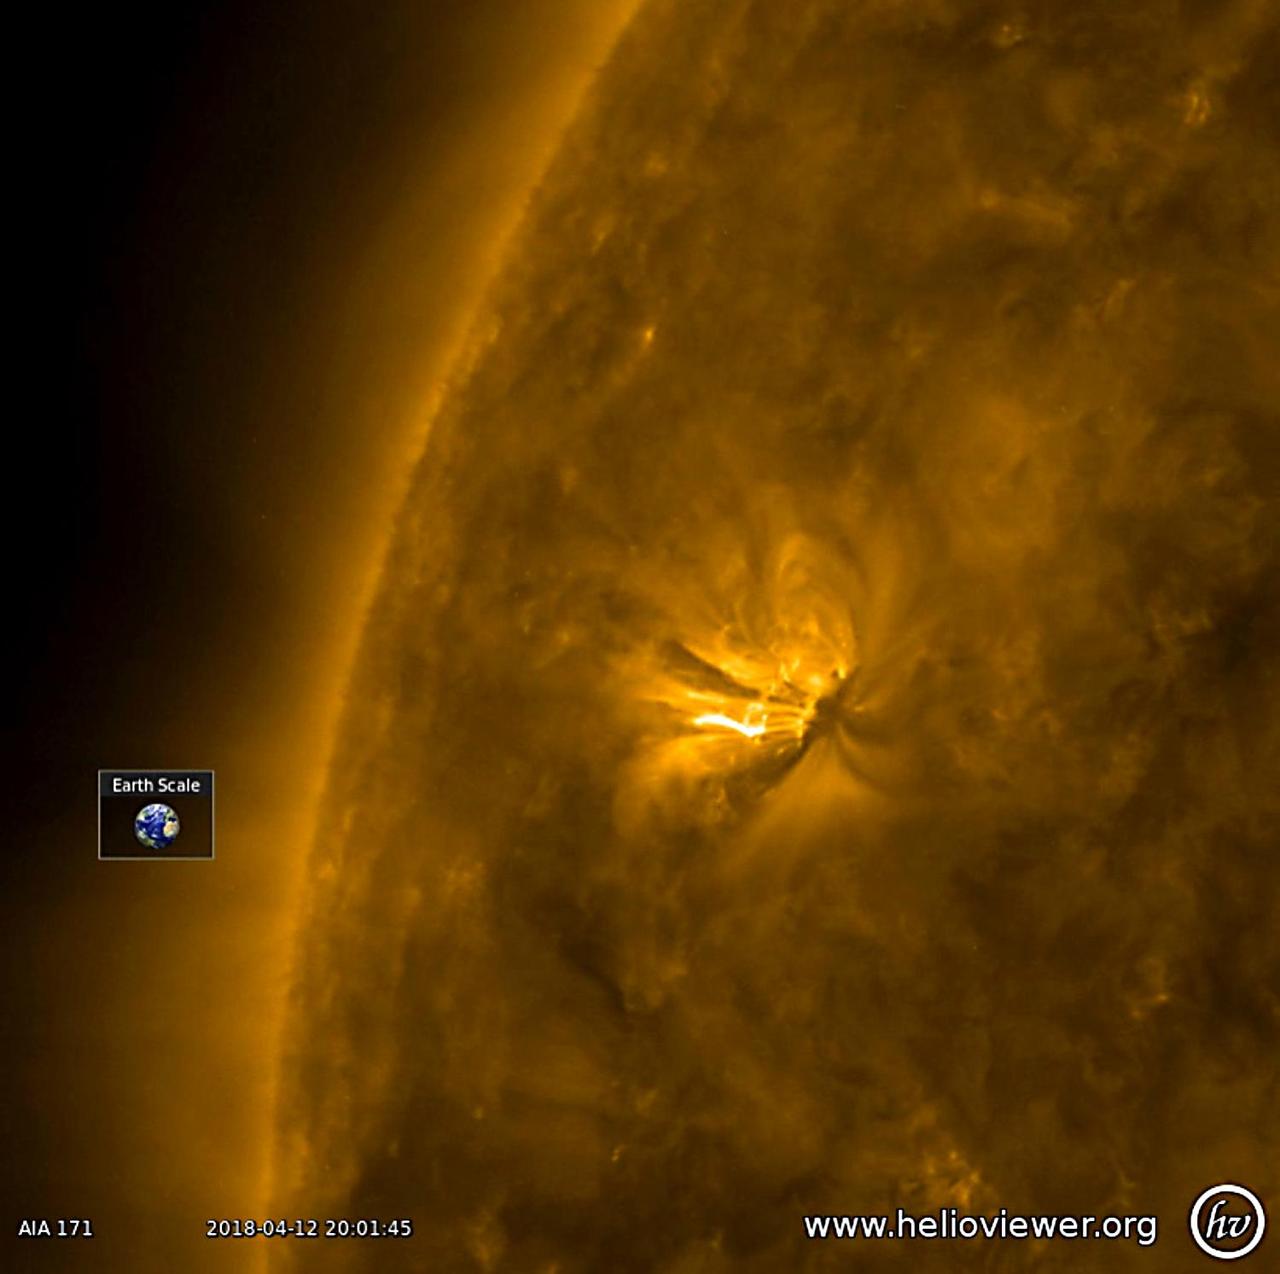
The sun featured just one, rather small active region over the past few days, but it developed rapidly and sported a lot of magnetic activity in just one day (Apr. 11-12, 2018). The activity was observed in a wavelength of extreme ultraviolet light. The loops and twisting arches above it are evidence of magnetic forces tangling with each other. The video clip was produced using Helioviewer software. Movies are available at https://photojournal.jpl.nasa.gov/catalog/PIA06676
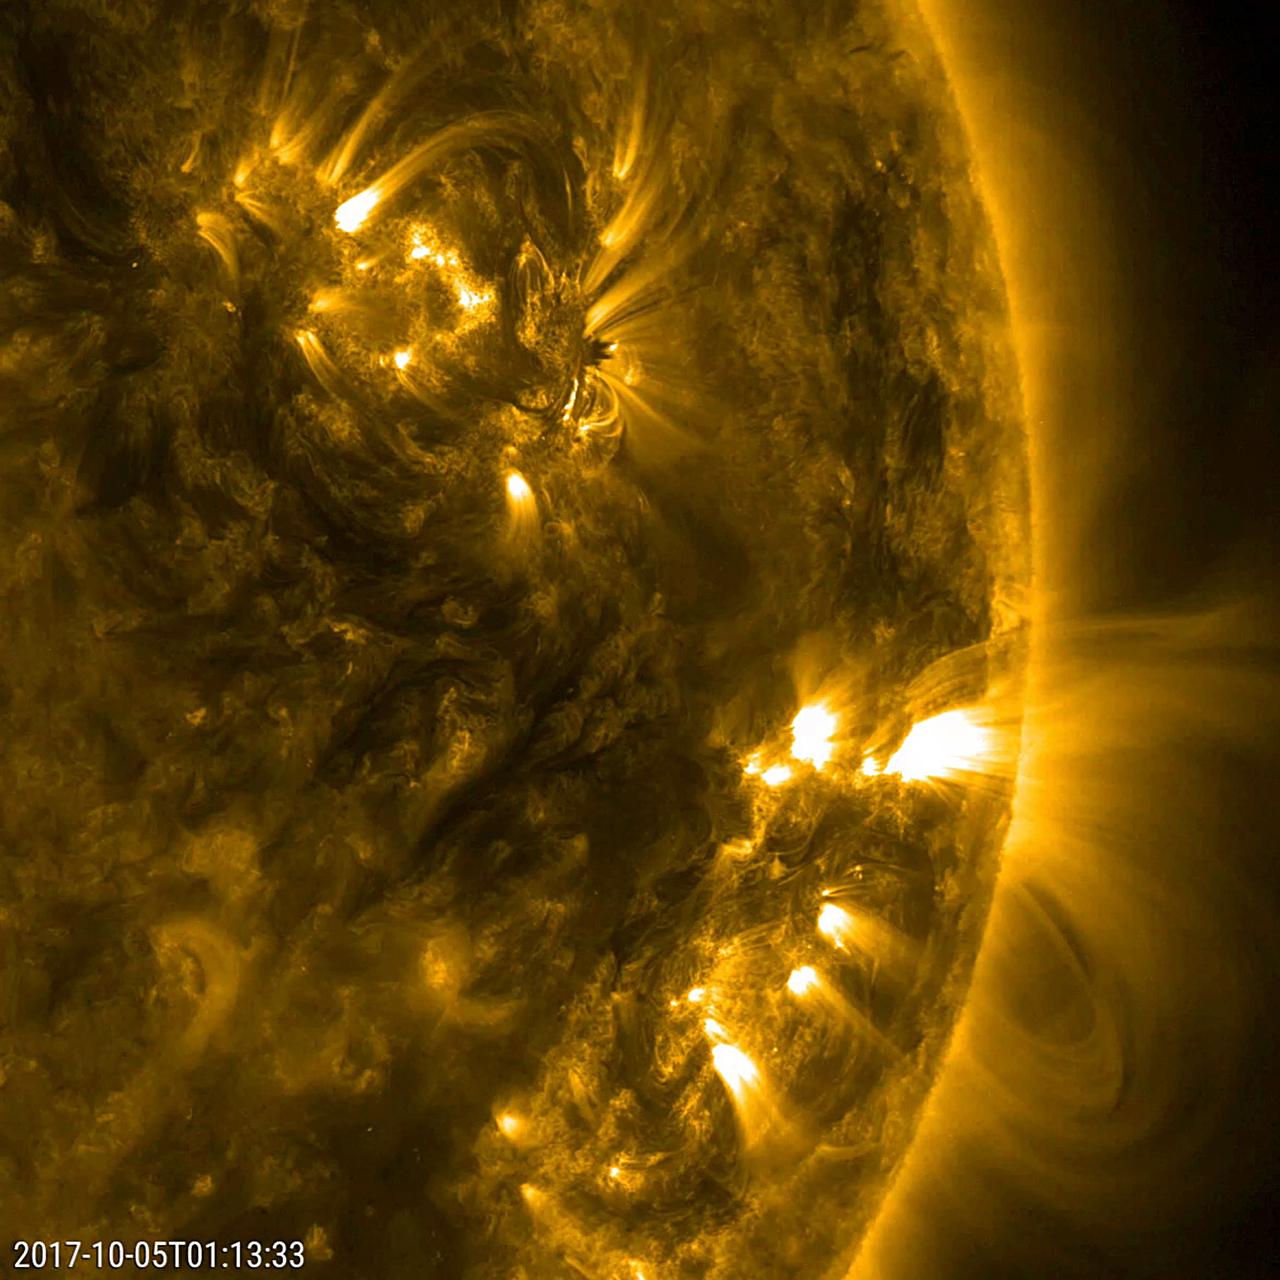
This close-up video clip shows a pair of active regions (the brighter areas) move and change as they rotate with the sun over just a 17-hour period (Oct. 4-5, 2017). They were observed in a wavelength of extreme ultraviolet light that reveals plasma heated to over a million degrees. The arches above the regions consist of charge particles spinning along and revealing magnetic field lines. Each one shows a few minor bursts of material none of them were serious. Animations are available at https://photojournal.jpl.nasa.gov/catalog/PIA22039
Dynamically tunable structural colors based on asymmetric Fabry-Perot cavities

Federica Polverari, post doctorate researcher at the Jet Propulsion Laboratory, in front of NASA's Beechcraft B-200 Super King Air, N801NA, in N248 in support of NASA’s Sub-Mesoscale Ocean Dynamics Experiment, or S-MODE, mission.
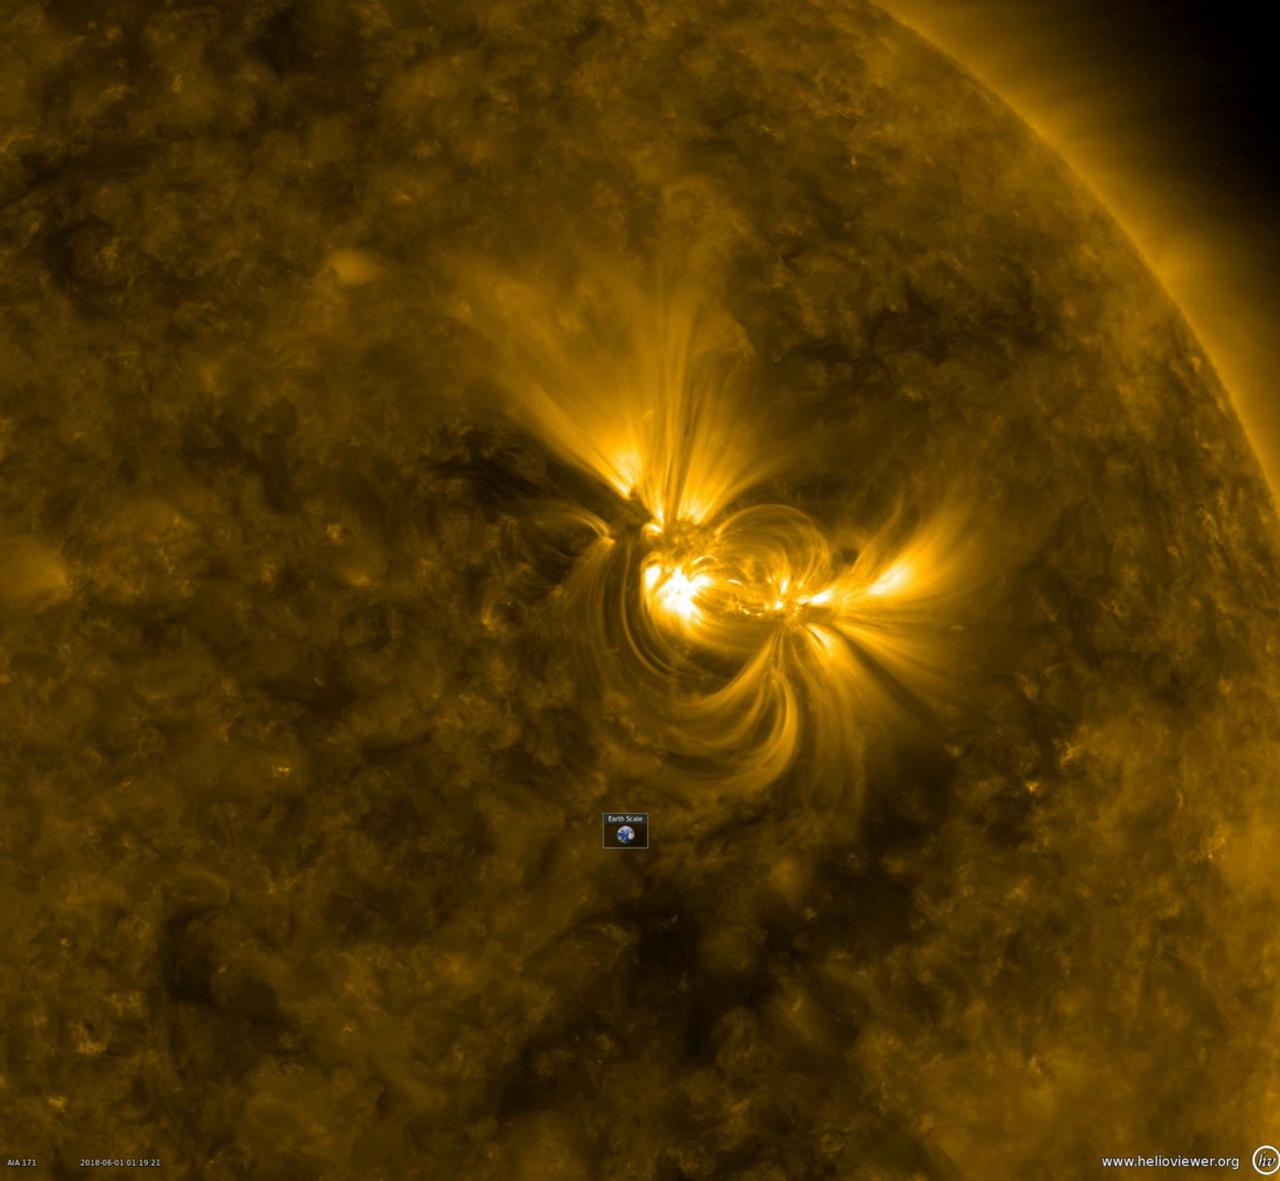
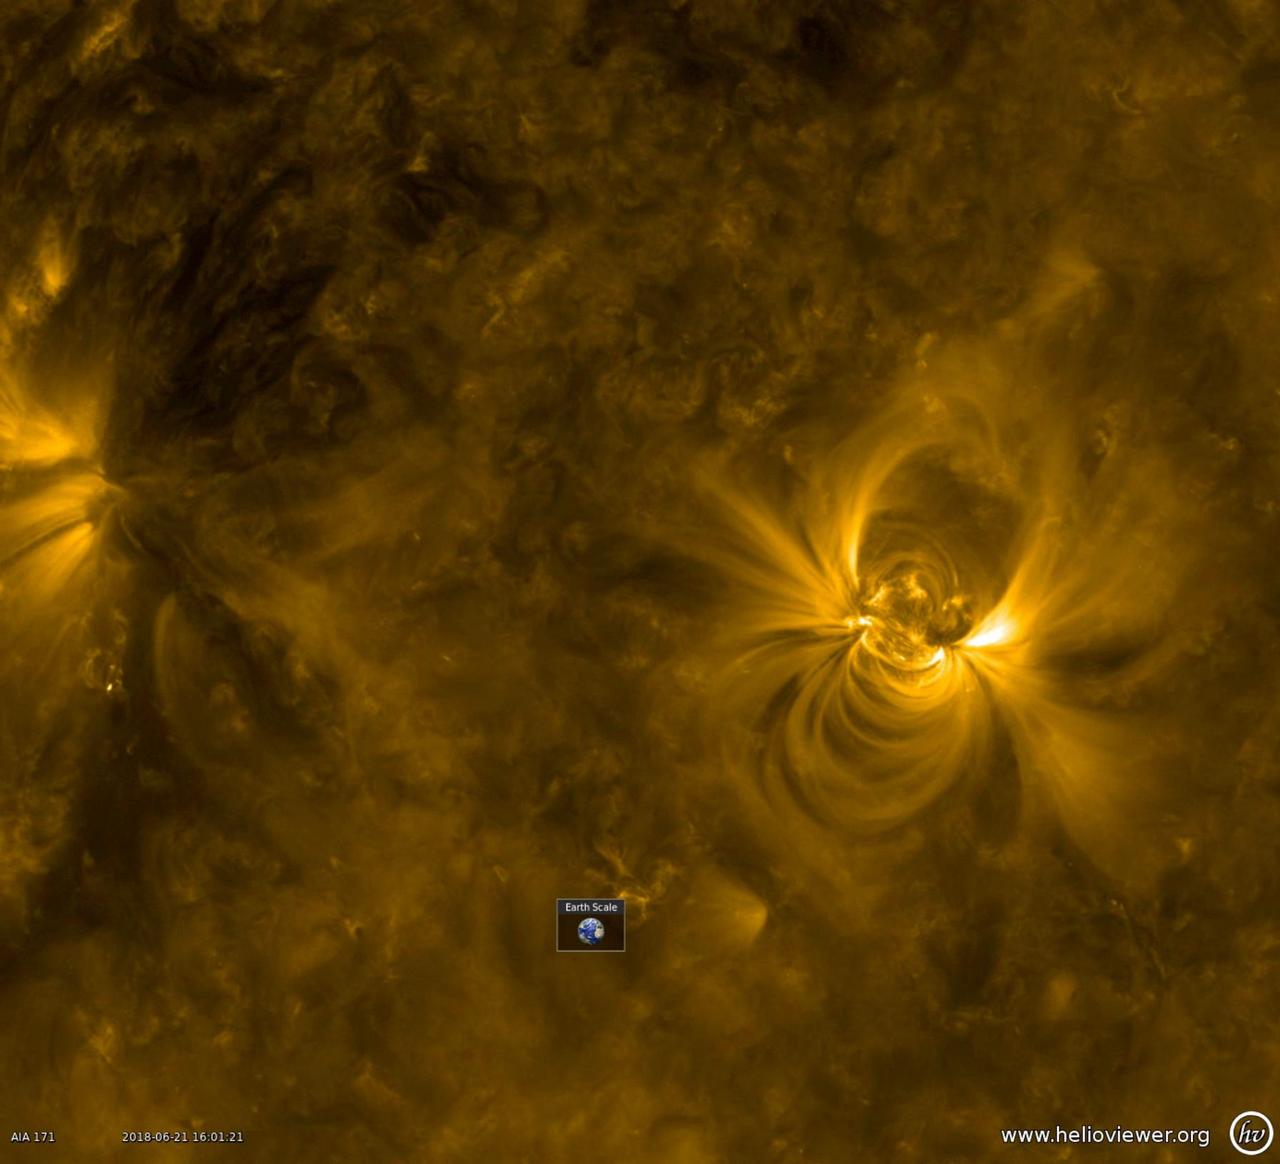
This close-up from a video clip taken May 30-June 1, 2018 shows a large active region in extreme ultraviolet light as the bright magnetic field lines above it shift and twist. Note the Earth scale below the active region: the longest loops extend about 10 times the diameter of Earth. When the magnetic field lines get themselves tangled up enough, they can erupt with a solar storm. Videos are available at https://photojournal.jpl.nasa.gov/catalog/PIA22475
Dean Pesnell, SDO project scientist, Goddard Space Flight Center in Greenbelt, Md. speaks during a briefing to discuss recent images from NASA's Solar Dynamics Observatory, or SDO, Wednesday, April 21, 2010, at the Newseum in Washington. Photo Credit: (NASA/Carla Cioffi)

Dan Weishaar, crew chief for the Ames Aircraft Management Office, prepares to deploy NASA's Beechcraft B-200 Super King Air, N801NA, from N248 in support of NASA’s Sub-Mesoscale Ocean Dynamics Experiment, or S-MODE, mission.
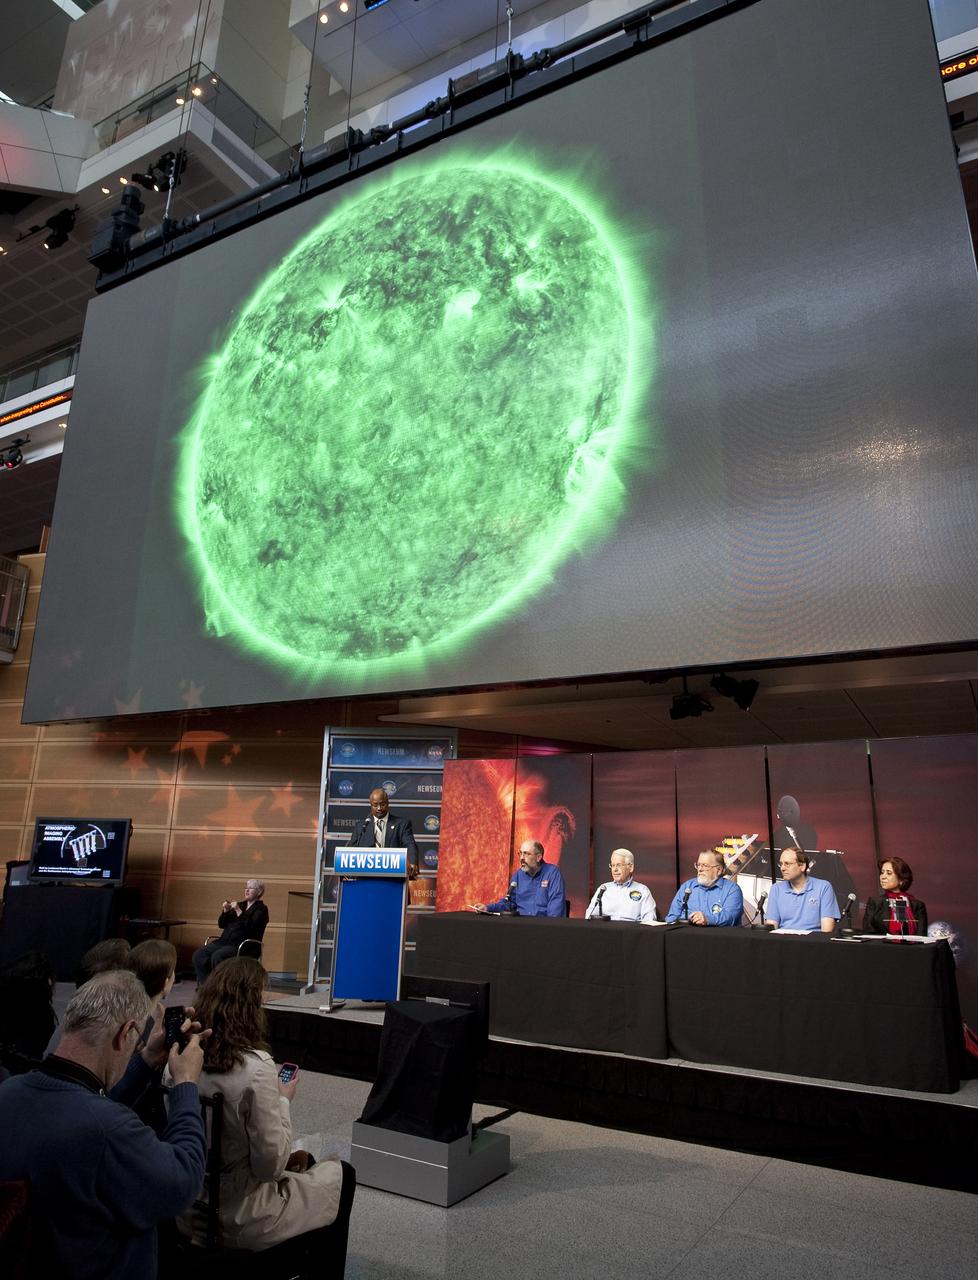
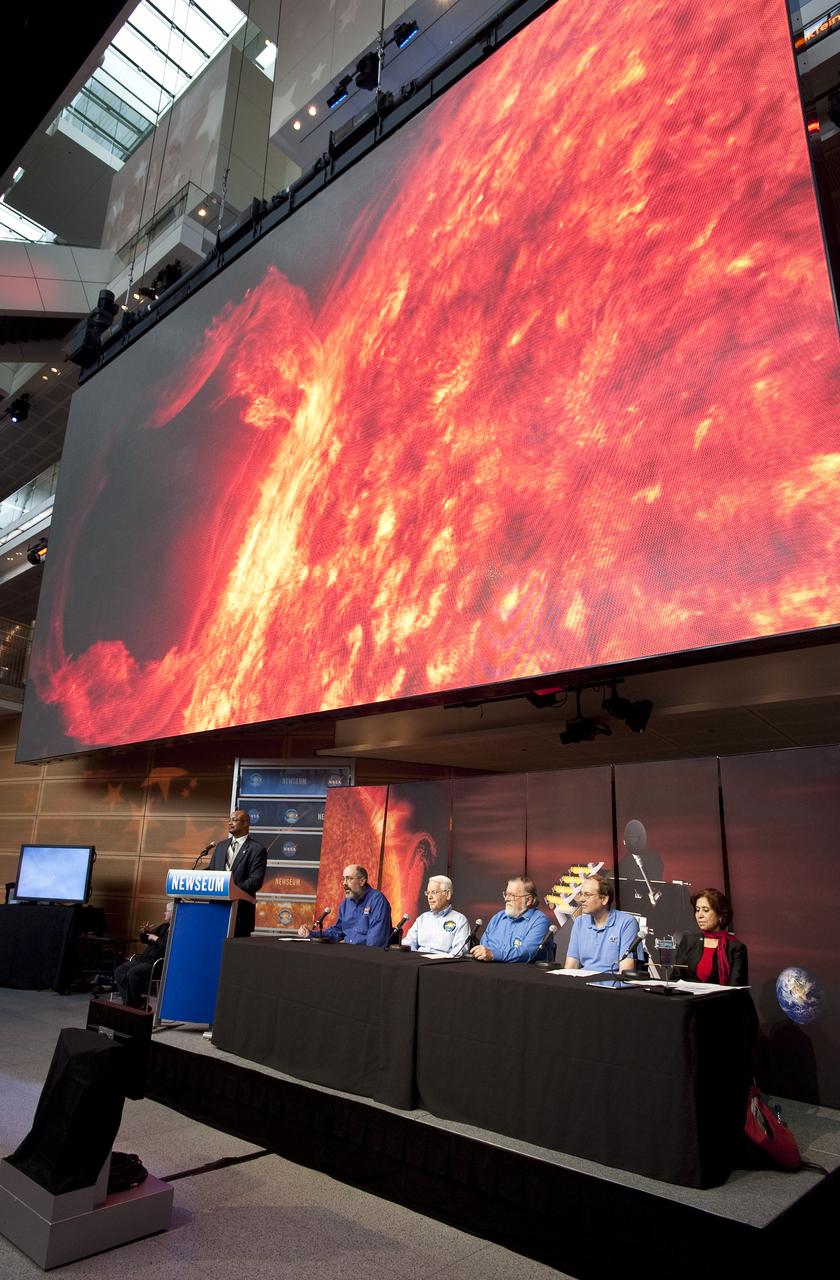
![Scientists presented the first images from NASA's Solar Dynamics Observatory [SDO] during a special "first light" press conference, Wednesday, April 21 2010, at held at the Newseum in Washington DC.](https://images-assets.nasa.gov/image/GSFC_20171208_Archive_e002078/GSFC_20171208_Archive_e002078~medium.jpg)
Scientists presented the first images from NASA's Solar Dynamics Observatory [SDO] during a special "first light" press conference, Wednesday, April 21 2010, at held at the Newseum in Washington DC.

Madhulika Guhathakurta, SDO Program Scientist at NASA Headquarters in Washington, speaks during a briefing to discuss recent images from NASA's Solar Dynamics Observatory, or SDO, Wednesday, April 21, 2010, at the Newseum in Washington. Launched on Feb. 11, 2010, SDO is the most advanced spacecraft ever designed to study the sun. During its five-year mission, it will examine the sun's magnetic field and also provide a better understanding of the role the sun plays in Earth's atmospheric chemistry and climate. Photo Credit: (NASA/Carla Cioffi)
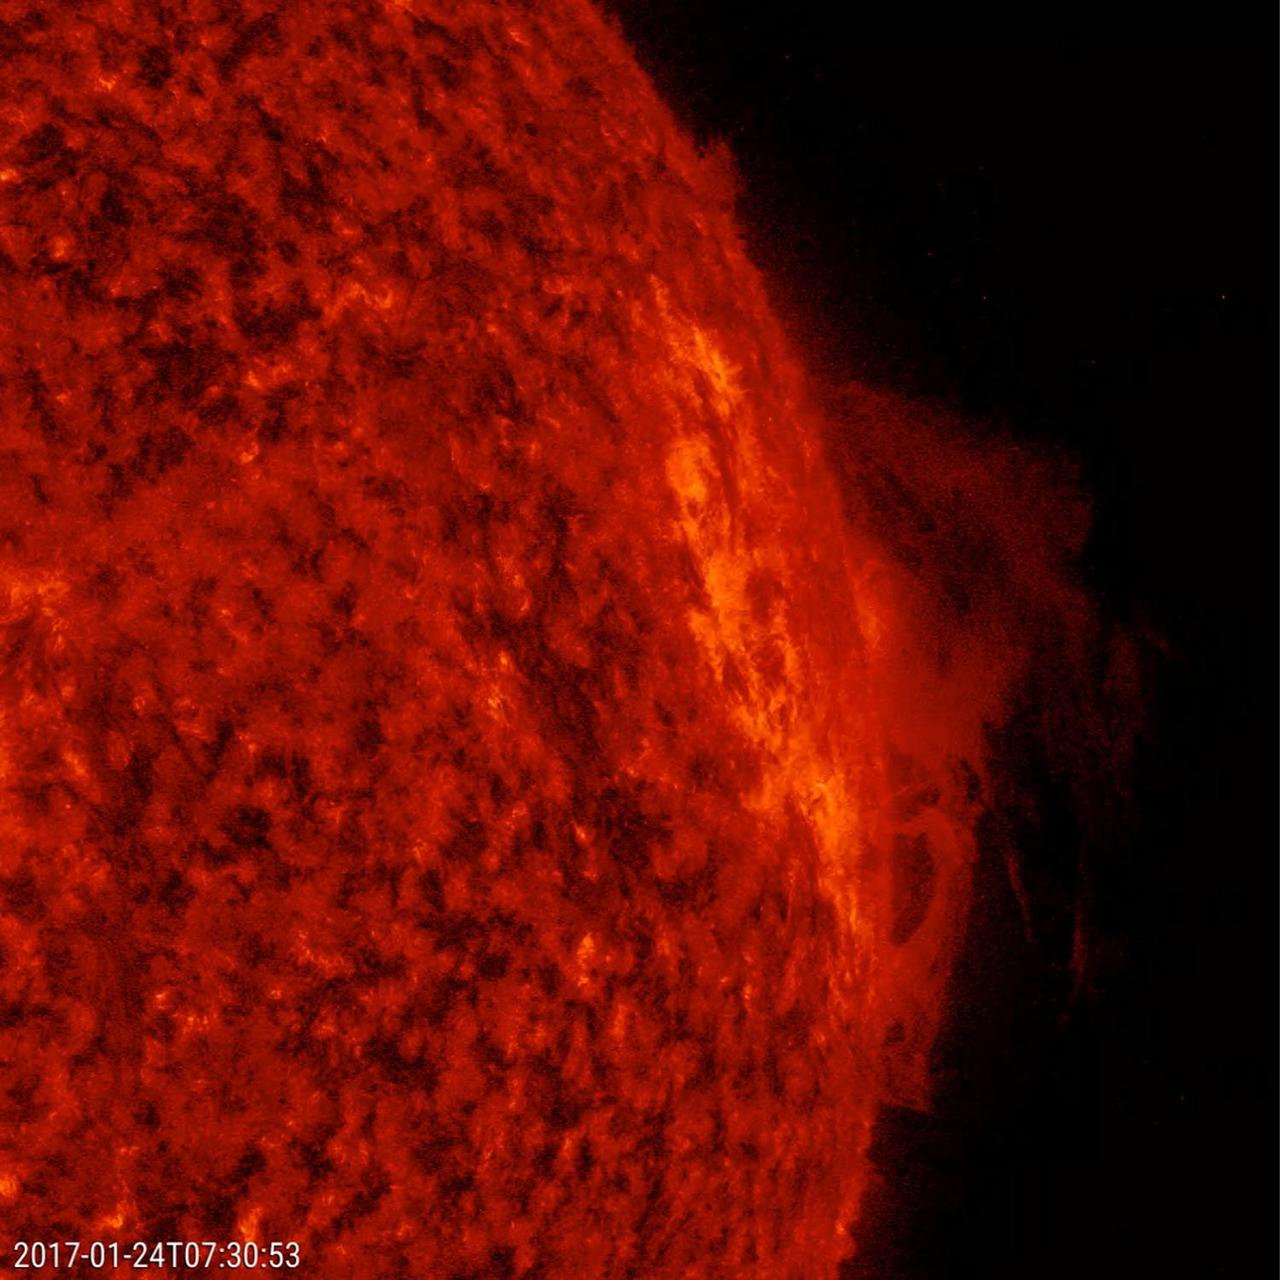
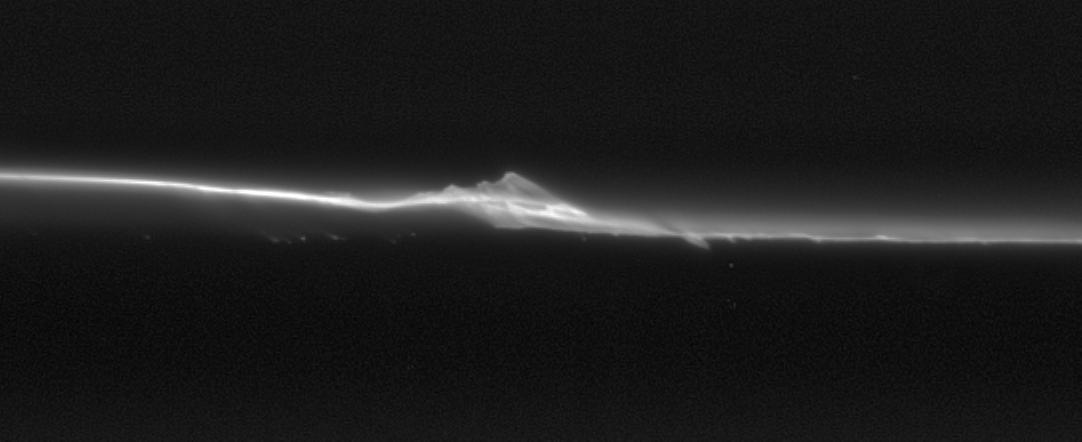
On Jan. 23-24, 2017, NASA Solar Dynamics Observatory watched as a solar prominence rose up along the edge of the sun and twisted and churned for about two days before falling apart. The dynamic action was generated by competing magnetic forces. The images were taken in a wavelength extreme ultraviolet light that observes activity close to the solar surface, perfect for capturing prominences, which are notoriously unstable clouds of plasma suspended above the sun. Movies are available at http://photojournal.jpl.nasa.gov/catalog/PIA11237
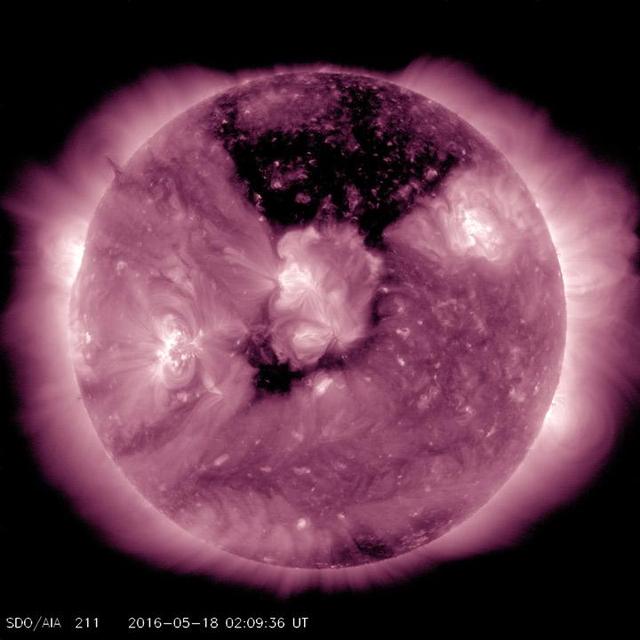
A substantial coronal hole had rotated so that it temporarily faced right towards Earth May, 17-19, 2016. This coronal hole area is the dark area at the top center of this image from NASA Solar Dynamics Observatory.
A large, dark coronal hole at the bottom of the Sun has been the most dominant feature this week Jan. 29, 2014 as seen by NASA GSFC Solar Dynamics Observatory.
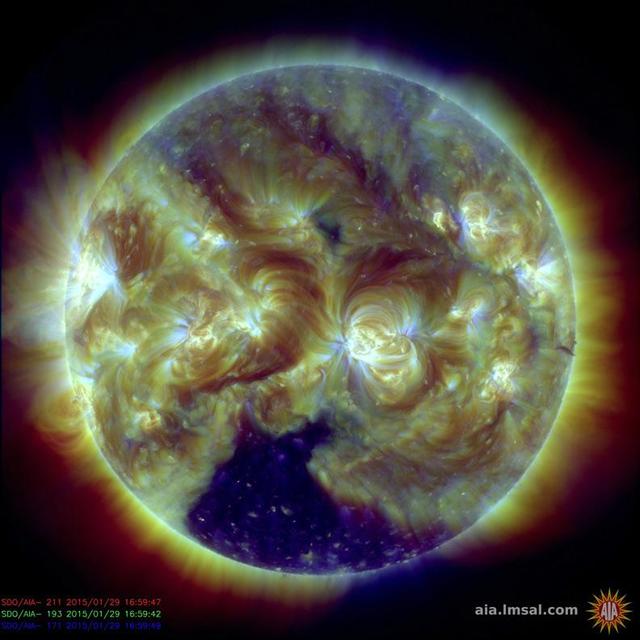
The magnetic field lines of three active regions in close proximity to one another interacted with each other over two and a half days Feb. 8-10, 2016. This image is from NASA Solar Dynamics Observatory.
L65-5505 In the Gas Dynamics Laboratory, completed in 1951, researchers explored basic aerodynamic, heating and fluid-mechanical problems in the speed range from Mach 1.5 to Mach 8.0. Photograph published in Engineer in Charge: A History of the Langley Aeronautical Laboratory, 1917-1958 by James R. Hansen. Page 348.
NASA's Solar Dynamics Observatory (SDO) scientists use their computer models to generate a view of the sun's magnetic field (Aug. 10, 2018). We took the opportunity to compare an extreme ultraviolet view of the sun with the same image showing the superimposed field lines. The bright active region right at the central area of the sun clearly shows a concentration of field lines, as well as the small active region at the sun's right edge, but to a lesser extent. Magnetism drives the dynamic activity near the sun's surface. Movies are available at https://photojournal.jpl.nasa.gov/catalog/PIA22662
A close-up view of one day in the life of a rather small active region shows the agitation and dynamism of its magnetic field (Dec. 21, 2016). This wavelength of extreme ultraviolet light reveals particles as they spin along the cascading arches of magnetic field lines above the active region. Some darker plasma rises up and spins around at the edge of the sun near the end of the video clip also being pulled by unseen magnetic forces. Movies are available at http://photojournal.jpl.nasa.gov/catalog/PIA15032
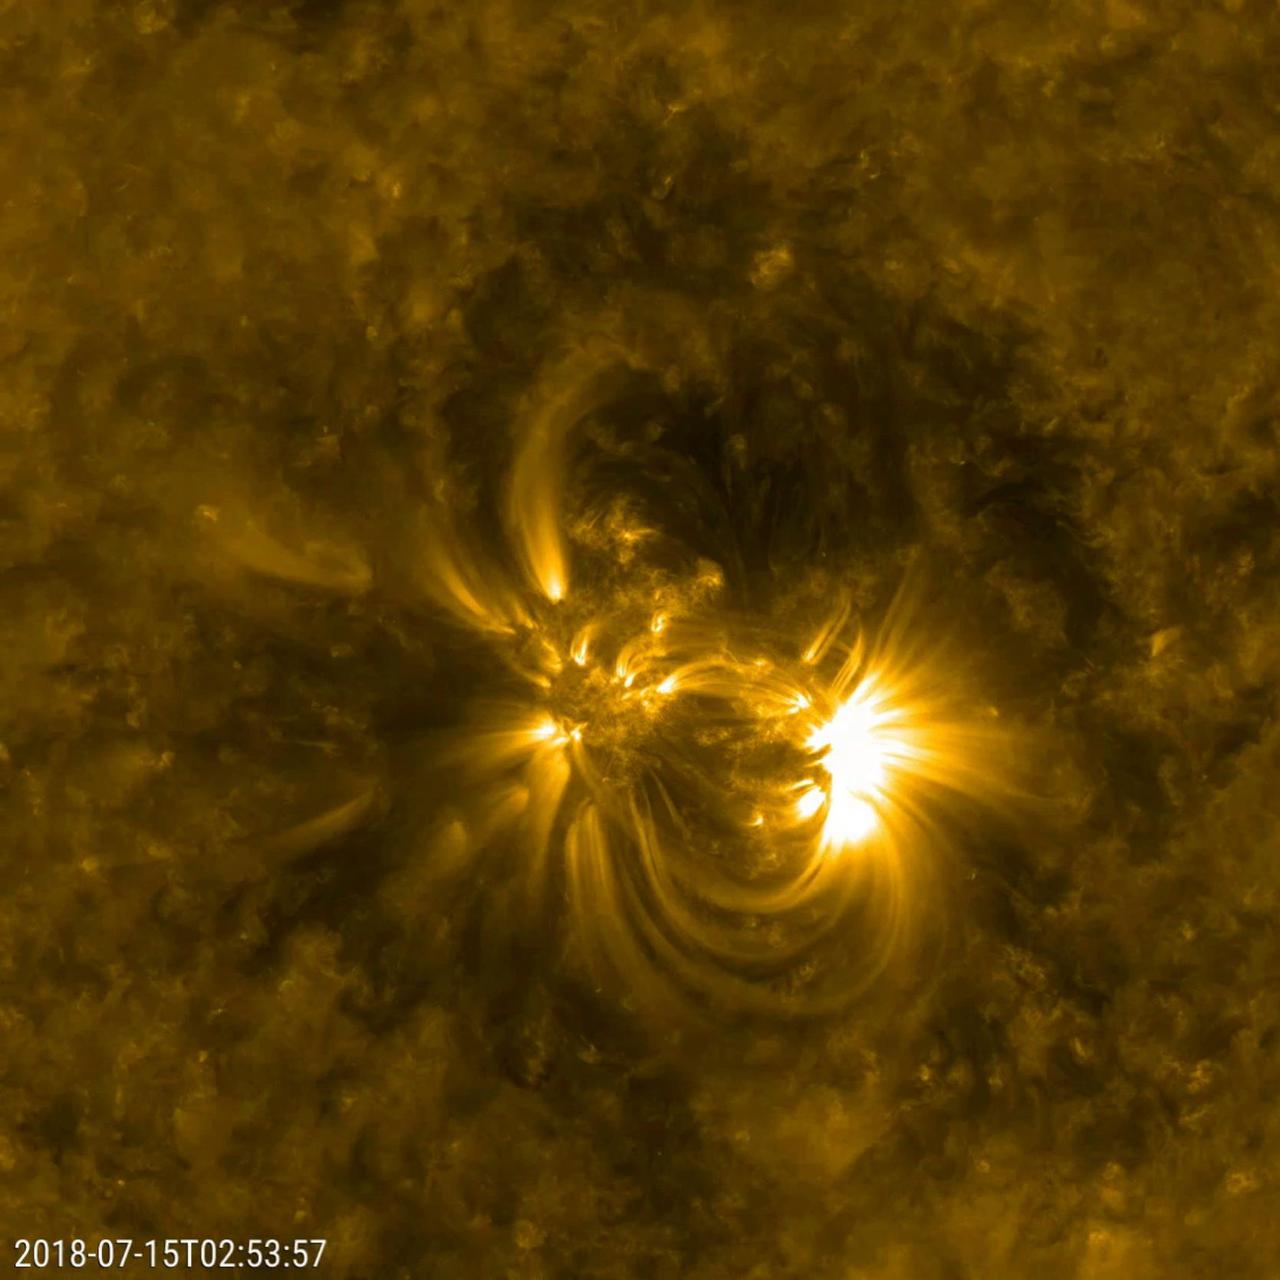
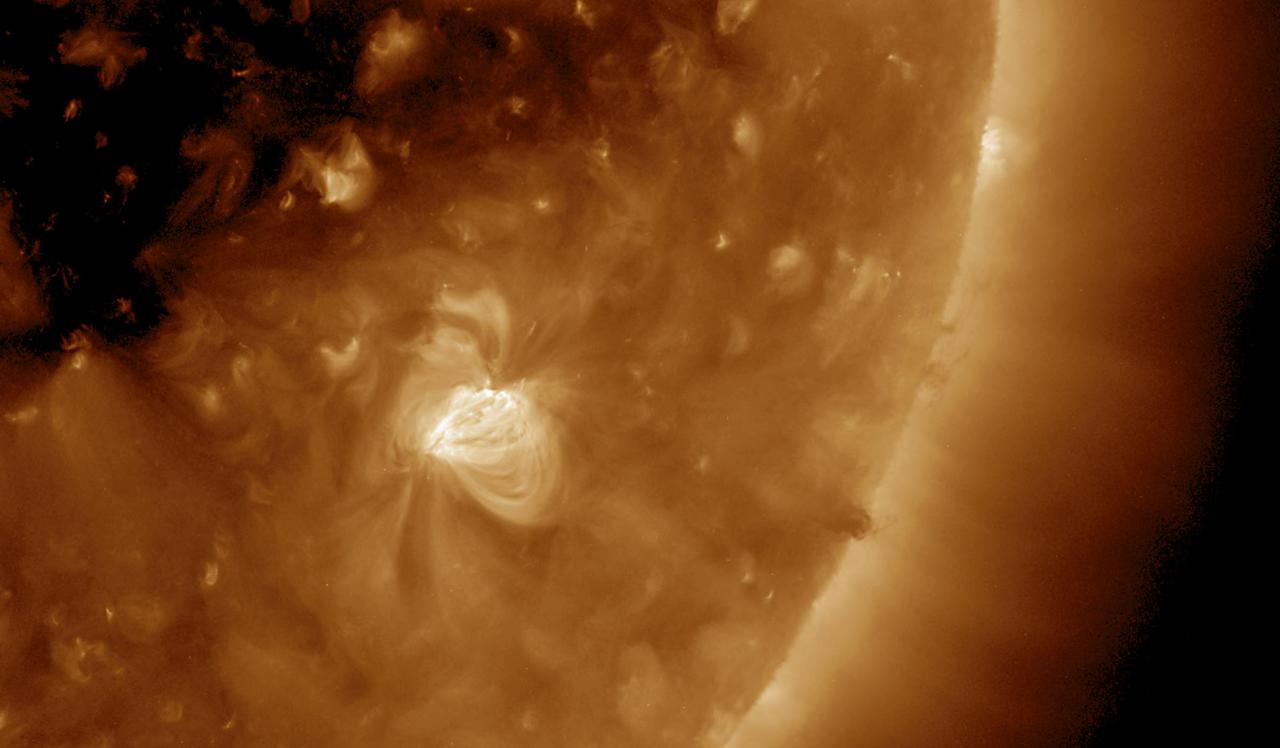
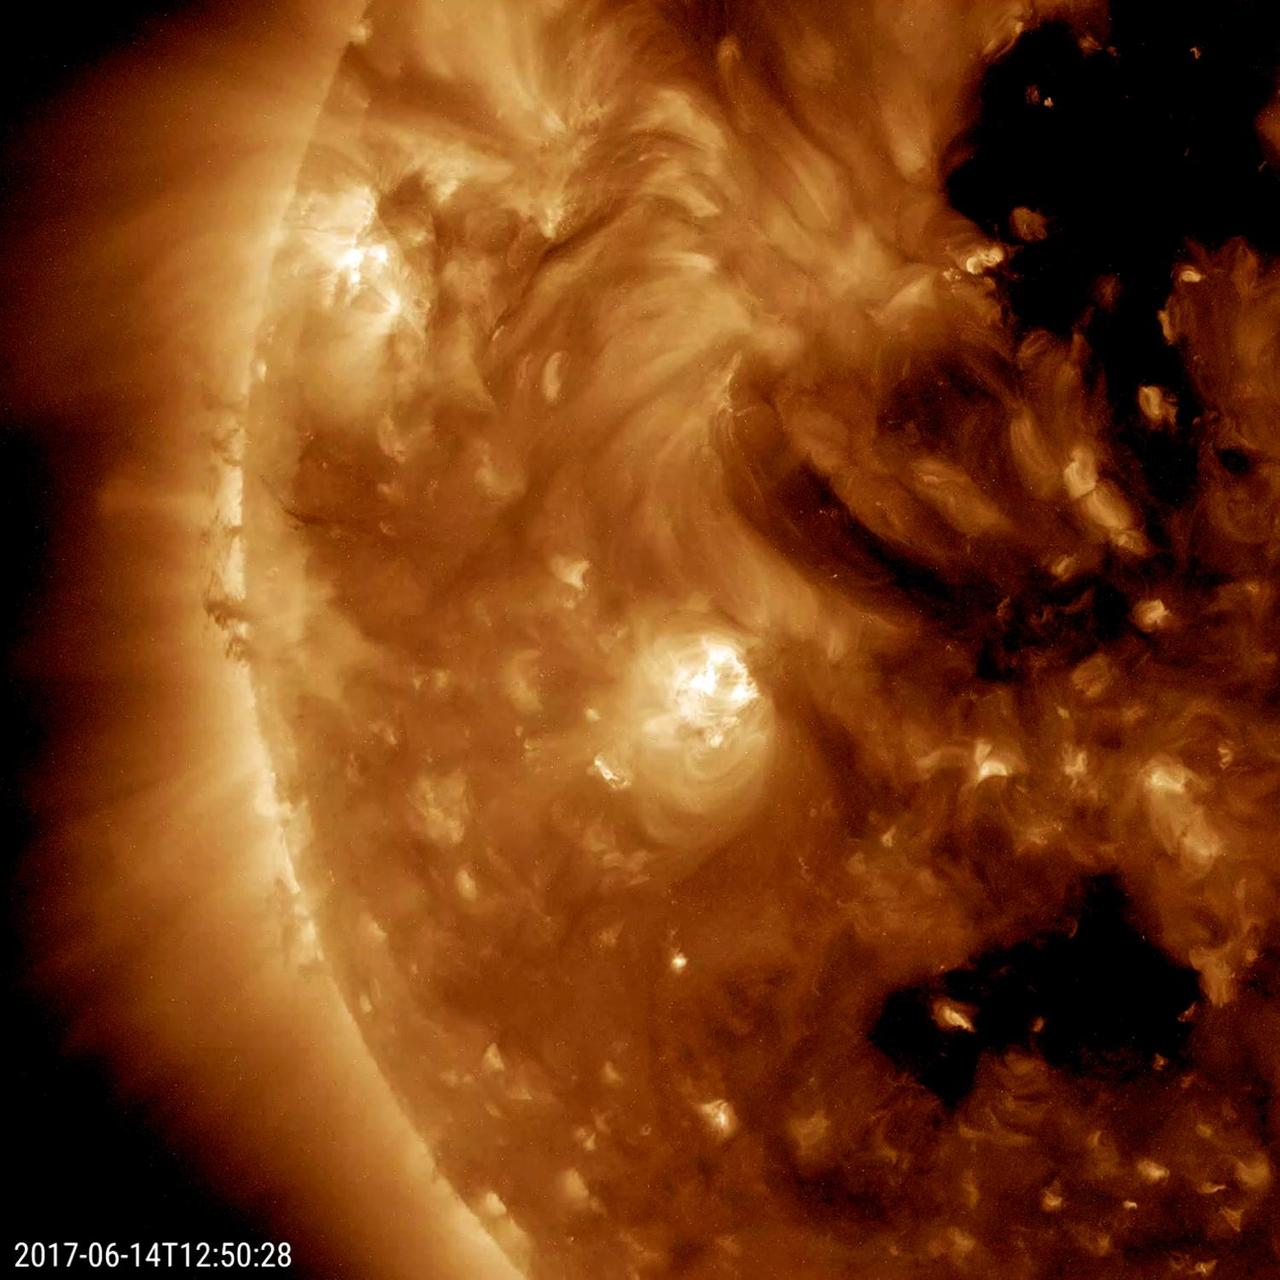
NASA's Solar Dynamics Observatory (SDO) zoomed in to watch close-up the dynamics of this single active region on the sun over a two-day period (July 14-16, 2018). The loops SDO observed in extreme ultraviolet light are illuminated by charged particles spinning along the magnetic field lines above an active region. Active regions are magnetically intense areas that are pushed up to the surface of the sun from below. These regions are often the sources of large eruptions that cause solar storms, though no large eruptions seem to have occurred during this period. To give a sense of scale, these loops are rising up many times the diameter of Earth. Movies are available at https://photojournal.jpl.nasa.gov/catalog/PIA22645

The Sun's rotation brought a new active region into view, revealing the dynamic arches and twisting streams of its magnetic field (Oct. 10-11, 2018). A new active region is becoming more of a rare sight, as the Sun is currently approaching solar minimum -- the point of the 11-year solar cycle when activity is most reduced. The video clip, showing images taken in a wavelength of extreme ultraviolet light covers 33 hours and consists of over 500 frames (i.e., one frame selected every 4 minutes). Animations are available at https://photojournal.jpl.nasa.gov/catalog/PIA18139
![Scientists presented the first images from NASA's Solar Dynamics Observatory [SDO] during a special "first light" press conference, Wednesday, April 21 2010, at held at the Newseum in Washington DC. Here, scientists are showing an animation from Walt Feimer, lead animator for the Heliophysics team. Credit: NASA/GSFC](https://images-assets.nasa.gov/image/GSFC_20171208_Archive_e002083/GSFC_20171208_Archive_e002083~medium.jpg)
Scientists presented the first images from NASA's Solar Dynamics Observatory [SDO] during a special "first light" press conference, Wednesday, April 21 2010, at held at the Newseum in Washington DC. Here, scientists are showing an animation from Walt Feimer, lead animator for the Heliophysics team. Credit: NASA/GSFC
![Scientists presented the first images from NASA's Solar Dynamics Observatory [SDO] during a special "first light" press conference, Wednesday, April 21 2010, at held at the Newseum in Washington DC. Credit: NASA/GSFC](https://images-assets.nasa.gov/image/GSFC_20171208_Archive_e002169/GSFC_20171208_Archive_e002169~medium.jpg)
Scientists presented the first images from NASA's Solar Dynamics Observatory [SDO] during a special "first light" press conference, Wednesday, April 21 2010, at held at the Newseum in Washington DC. Credit: NASA/GSFC

Philip H. Scherrer (left) principal investigator, Helioseismic and Magnetic Imager instrument, Stanford University in Palo Alto, speaks during a briefing to discuss recent images from NASA's Solar Dynamics Observatory, or SDO, while colleagues Tom Woods, principal investigator, Extreme Ultraviolet Variability Experiment instrument, Laboratory for Atmospheric and Space Physics, University of Colorado in Boulder and Madhulika Guhathakurta, SDO program scientist, NASA Headquarters (right) look on Wednesday, April 21, 2010, at the Newseum in Washington. Photo Credit: (NASA/Carla Cioffi)
A good-sized active region with bright, towering arches began to rotate into view (Apr. 18-19, 2018). The arches consist of charged particles spiraling along magnetic field lines revealed in this wavelength of extreme ultraviolet light. They rise up above the sun's surface many times the size of Earth. The video covers just 16 hours of activity. We will keep our eyes on this region to see if it has the kind of dynamism to produce solar storms. Videos are available at https://photojournal.jpl.nasa.gov/catalog/PIA22430
This still image from an animation from NASA GSFC Solar Dynamics Observatory shows arches of magnetic field lines towered over the edge of the Sun as a pair of active regions began to rotate into view Apr. 5-6, 2016.
NASA Solar Dynamics Observatory shows a long coronal hole has rotated so that was temporarily facing right towards Earth Mar. 23-25, 2016. Coronal holes appear dark when viewed in some wavelengths of extreme ultraviolet light.
This still image from an animation from NASA GSFC Solar Dynamics Observatory shows dark strands of plasma hovering above the Sun surface beginning to interact with each other in a form of tug of war over two and a half days June 28-30, 2015.
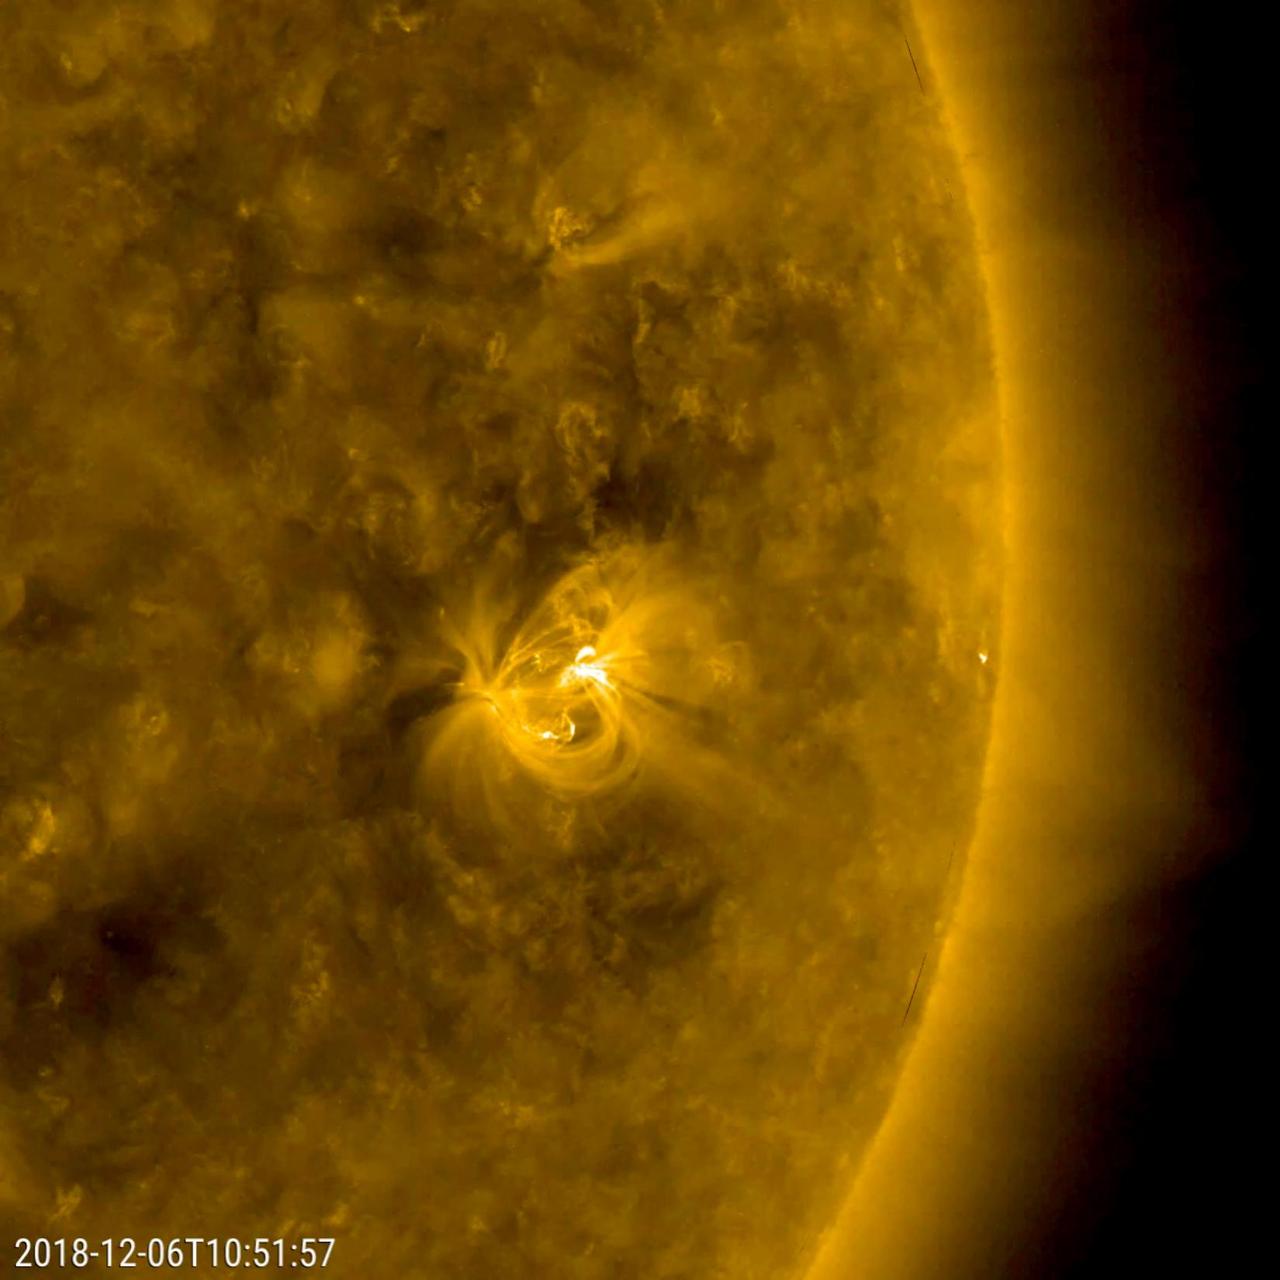
The only active region observed this week appeared on Dec. 5, 2018 and grew into an average size display of dynamic activity (Dec. 6-7, 2018). As viewed in a wavelength of extreme ultraviolet light, the region presented numerous magnetic loops of charged particles, rapidly changing their shapes and directions. As the sun is approaching its minimum level of activity in its 11 year solar cycle, we expect to see fewer and fewer active regions for quite a while. However, this active region is in the southern hemisphere of the Sun and has the North magnetic pole in the lead, so it is a sunspot of Solar Cycle 24. Movies available at https://photojournal.jpl.nasa.gov/catalog/PIA21211

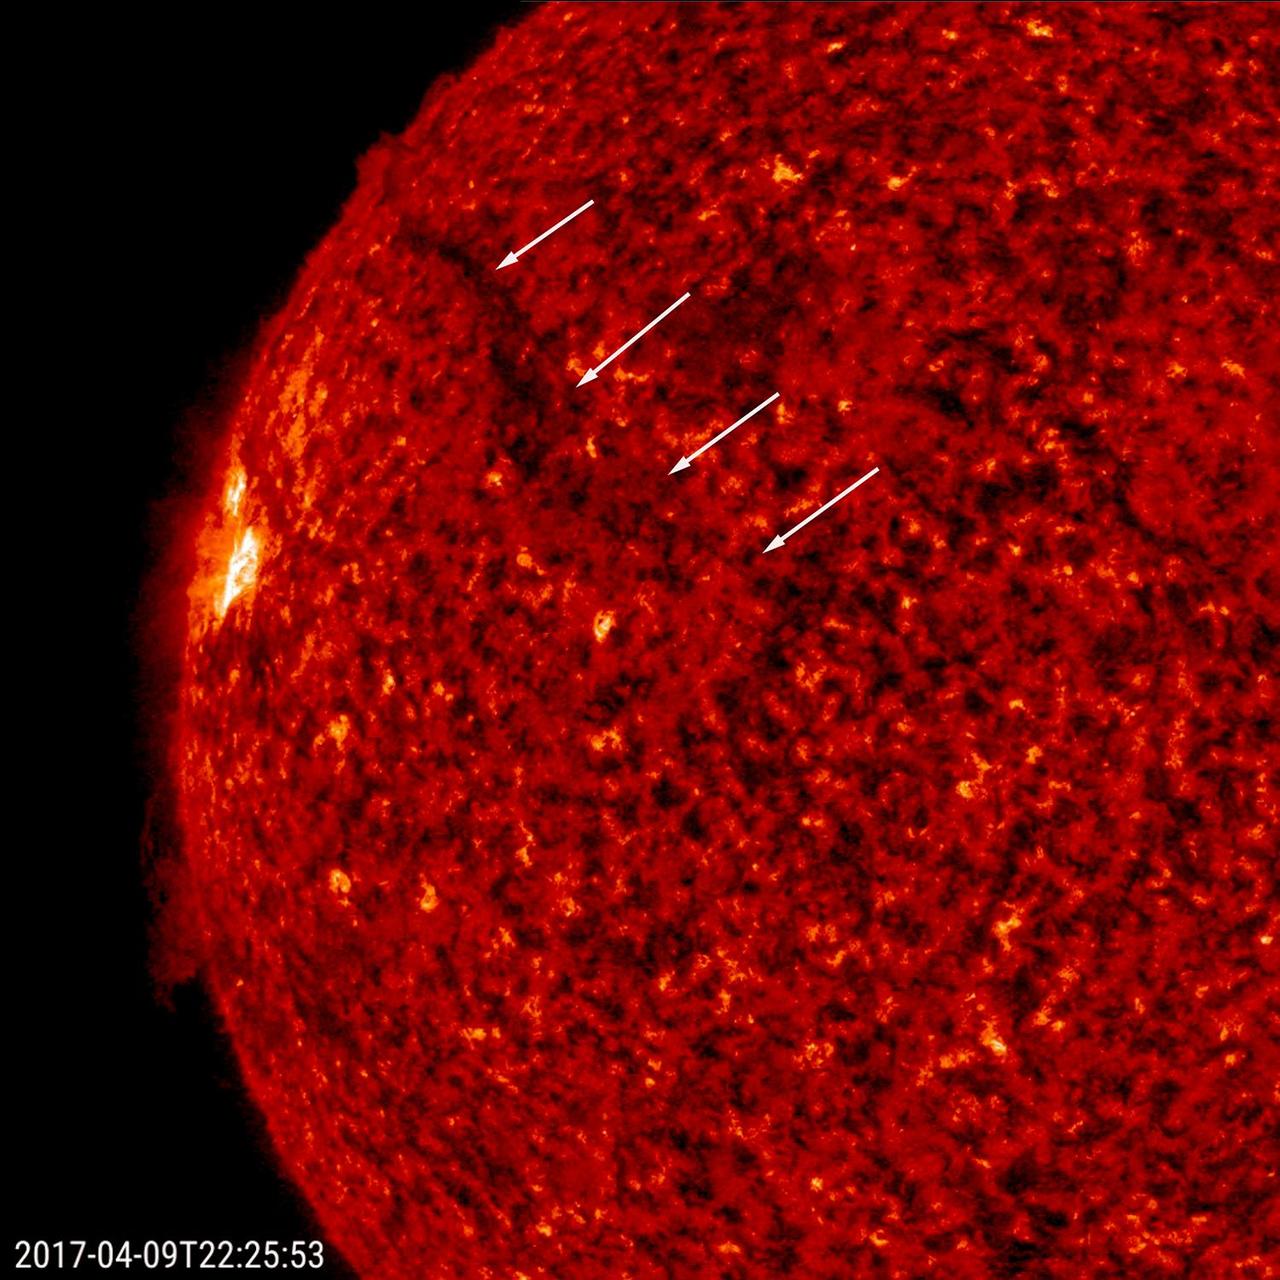
Several small sunspots appeared this week, giving NASA Solar Dynamics Observatory a chance to illustrate their sources Mar. 2, 2017. The first image is a magnetogram or magnetic image of the sun's surface. The MDI instrument can observe where positive and negative particles are moving toward or away from strong magnetic areas. These active regions have stronger magnetic fields and appear as strongly black or white. The yellow image shows the surface in filtered light, and there the same active regions appear as dark, cooler splotches called sunspots. Higher up in the sun's atmosphere, the golden image (in extreme ultraviolet light) shows arches of light above the active regions, which are charged particles spinning along magnetic field lines. Note that they all align very well with each other. Magnetic forces are the dynamic drivers here in these regions of the sun. Movies are available at http://photojournal.jpl.nasa.gov/catalog/PIA21557
Computational Fluid Dynamics look at Space Shuttle flow
Single-Spool Turbine Facility

The magnetic field lines between a pair of active regions formed a beautiful set of swaying arches rising up above them Apr. 24-26, 2017, as seen by NASA Solar Dynamics Observatory. The connection between opposing poles of polarity is visible in exquisite detail in this wavelength of extreme ultraviolet light. What we are really seeing are charged particles spinning along the magnetic field lines. Other field lines are traced as they reach out in other directions as well. Videos can be seen at https://photojournal.jpl.nasa.gov/catalog/PIA21604

Tom Woods, (second from right), principal investigator, Extreme Ultraviolet Variability Experiment instrument, Laboratory for Atmospheric and Space Physics, University of Colorado in Boulder speaks during a briefing to discuss recent images from NASA's Solar Dynamics Observatory, or SDO, Wednesday, April 21, 2010, at the Newseum in Washington. Photo Credit: (NASA/Carla Cioffi)
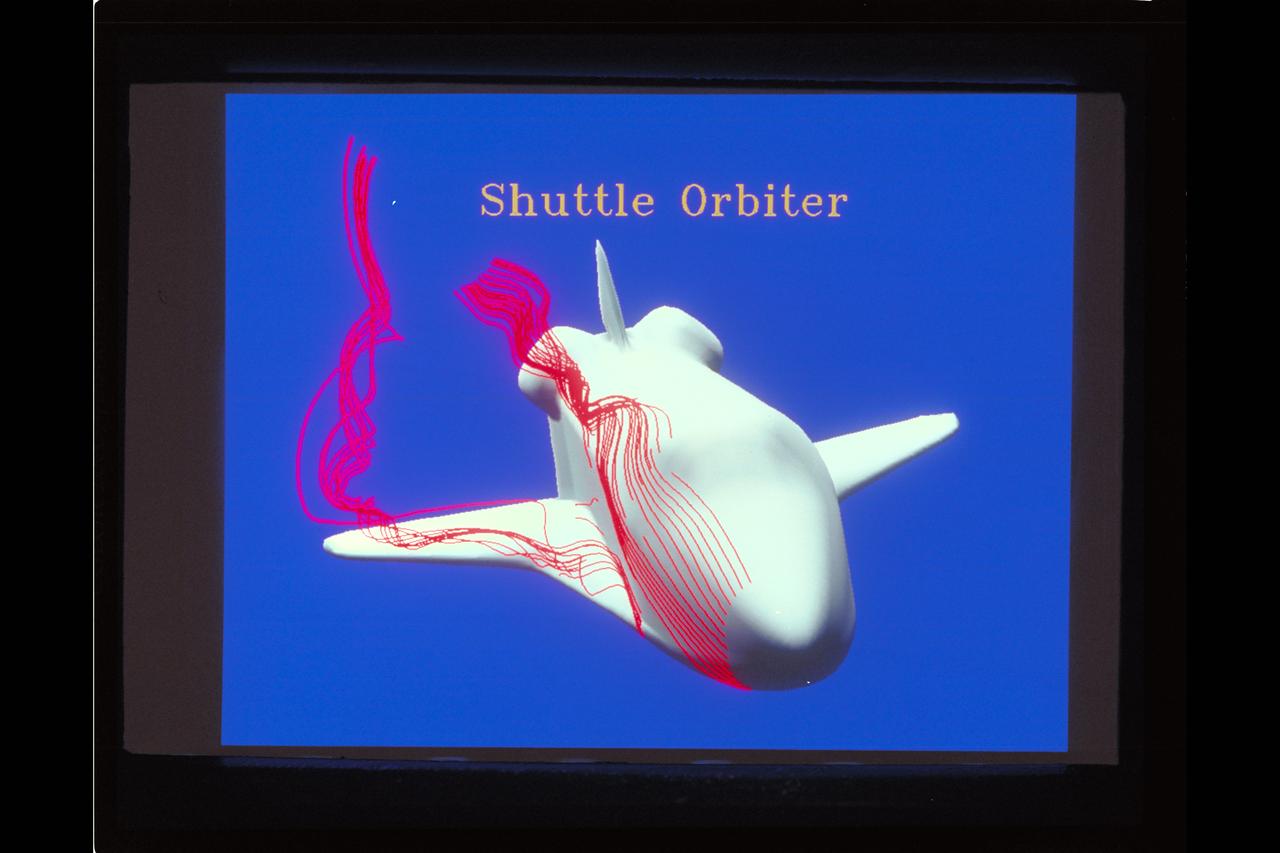
Computational Fluid Dynamics (CFD) Space Shuttle flow field
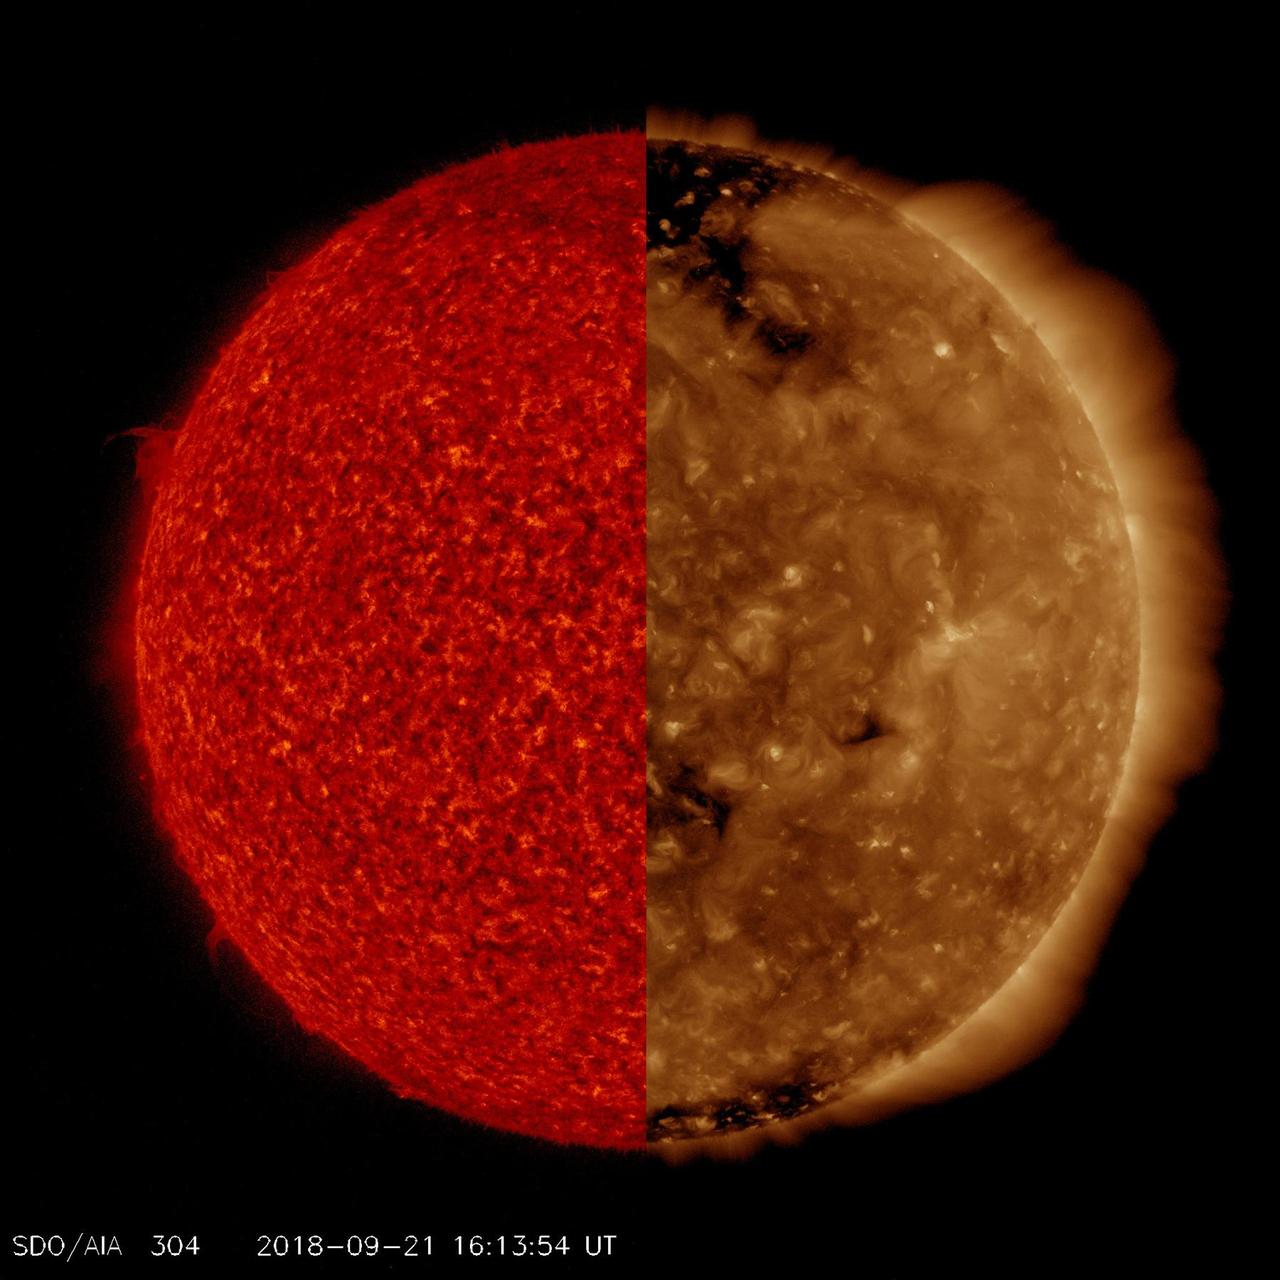
NASA's Solar Dynamics Observatory observes the Sun in ten different wavelengths because each wavelength reveals different solar features. Here, we have selected two images taken at virtually the same time but in different wavelengths of extreme ultraviolet light. The red tinted image, which captures material not far above the Sun's surface, is especially good for revealing details along the edge of the Sun, like the small prominence at the ten o'clock position. The brown tinted image clearly shows two large coronal holes (darker areas) as well as some faint magnetic field lines and hints of solar activity (lighter areas), neither of which are apparent in the red image. This activity is occurring somewhat higher in the Sun's corona. In a way it is like peeling away the layers of an onion, a little at a time. Animations are available at https://photojournal.jpl.nasa.gov/catalog/PIA22724
A new active region appeared on June 19th, quickly growing in size over two days (June 20-22, 2018). Active regions are areas of enhanced magnetic activity on the Sun's surface, generating the huge loops and dynamic surges observed here. Charged particles spinning along the field lines above the active region are illuminated in this wavelength of extreme ultraviolet light. The superimposed Earth icon gives a sense of just how large these loops are. Movies are available at https://photojournal.jpl.nasa.gov/catalog/PIA22582
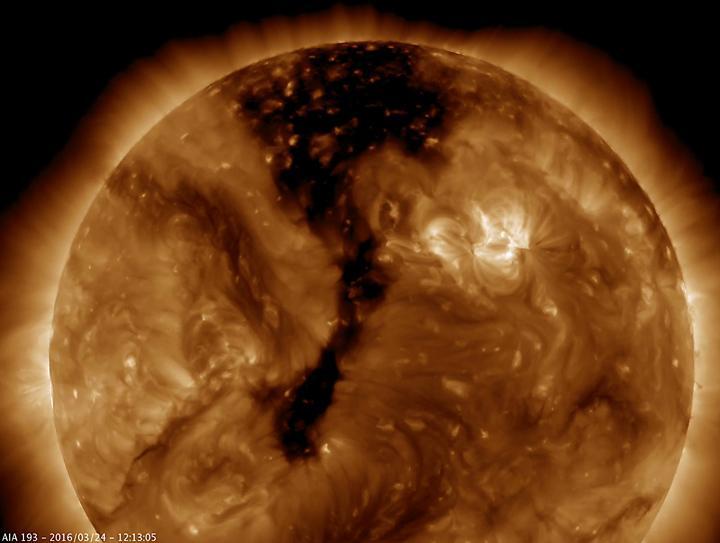
The dark region seen on the face of the sun at the end of March 2013 is a coronal hole just above and to the right of the middle of the picture, which is a source of fast solar wind leaving the sun in this image from NASA Solar Dynamic Observatory.
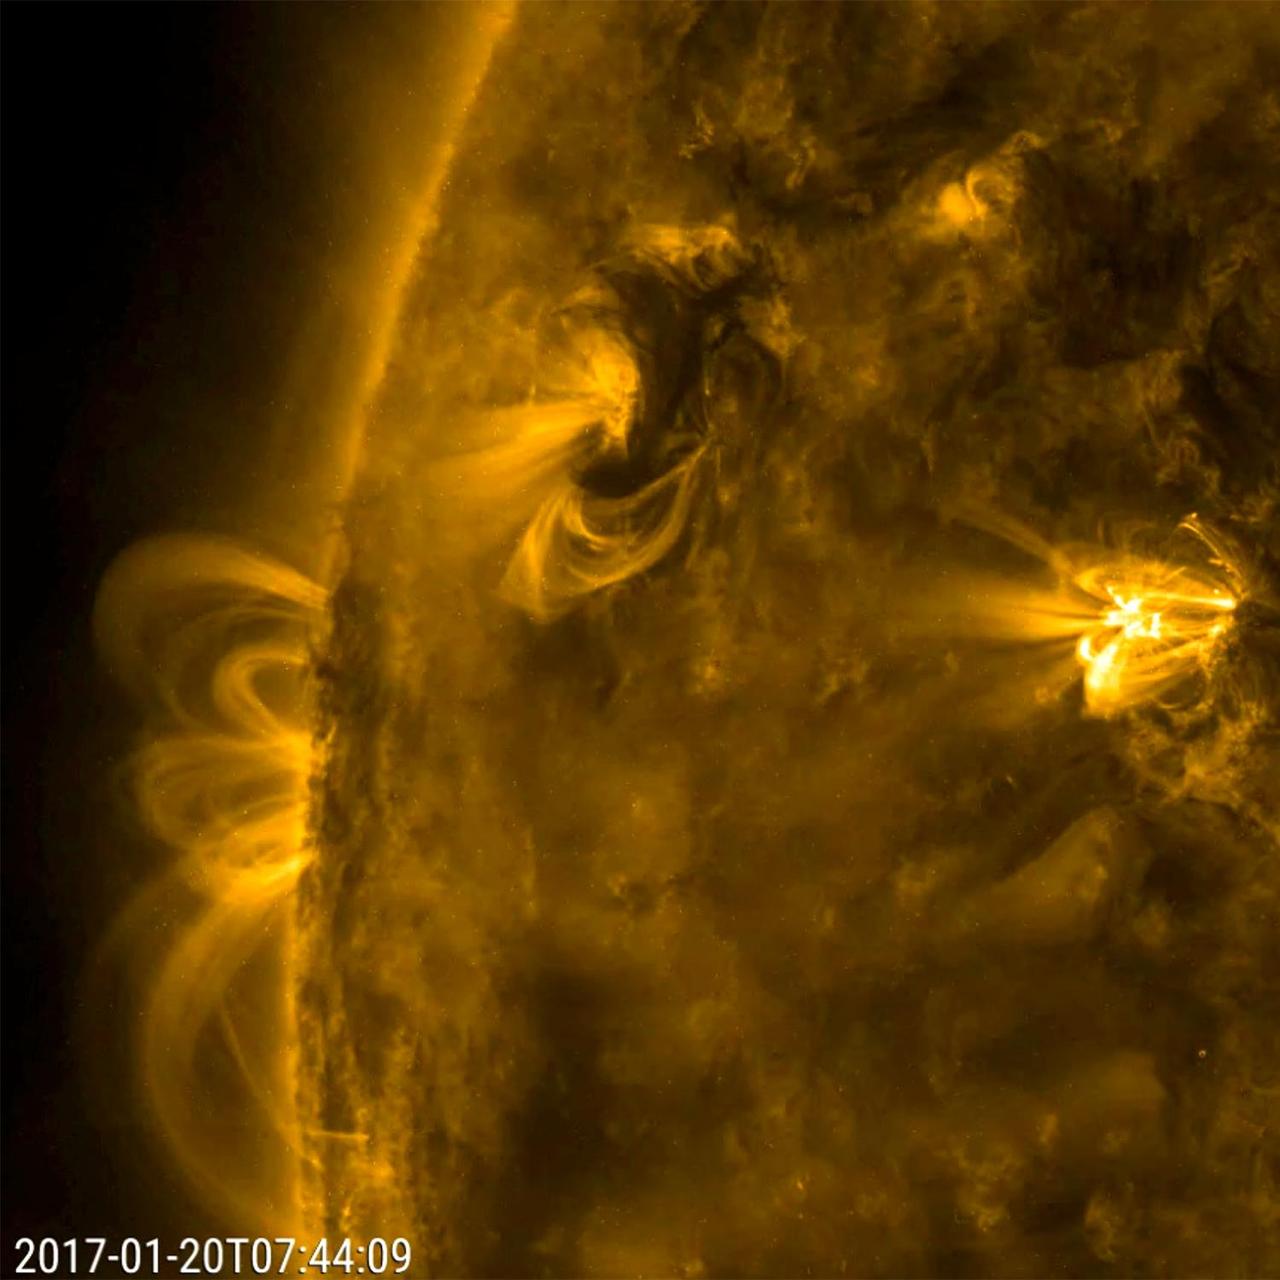
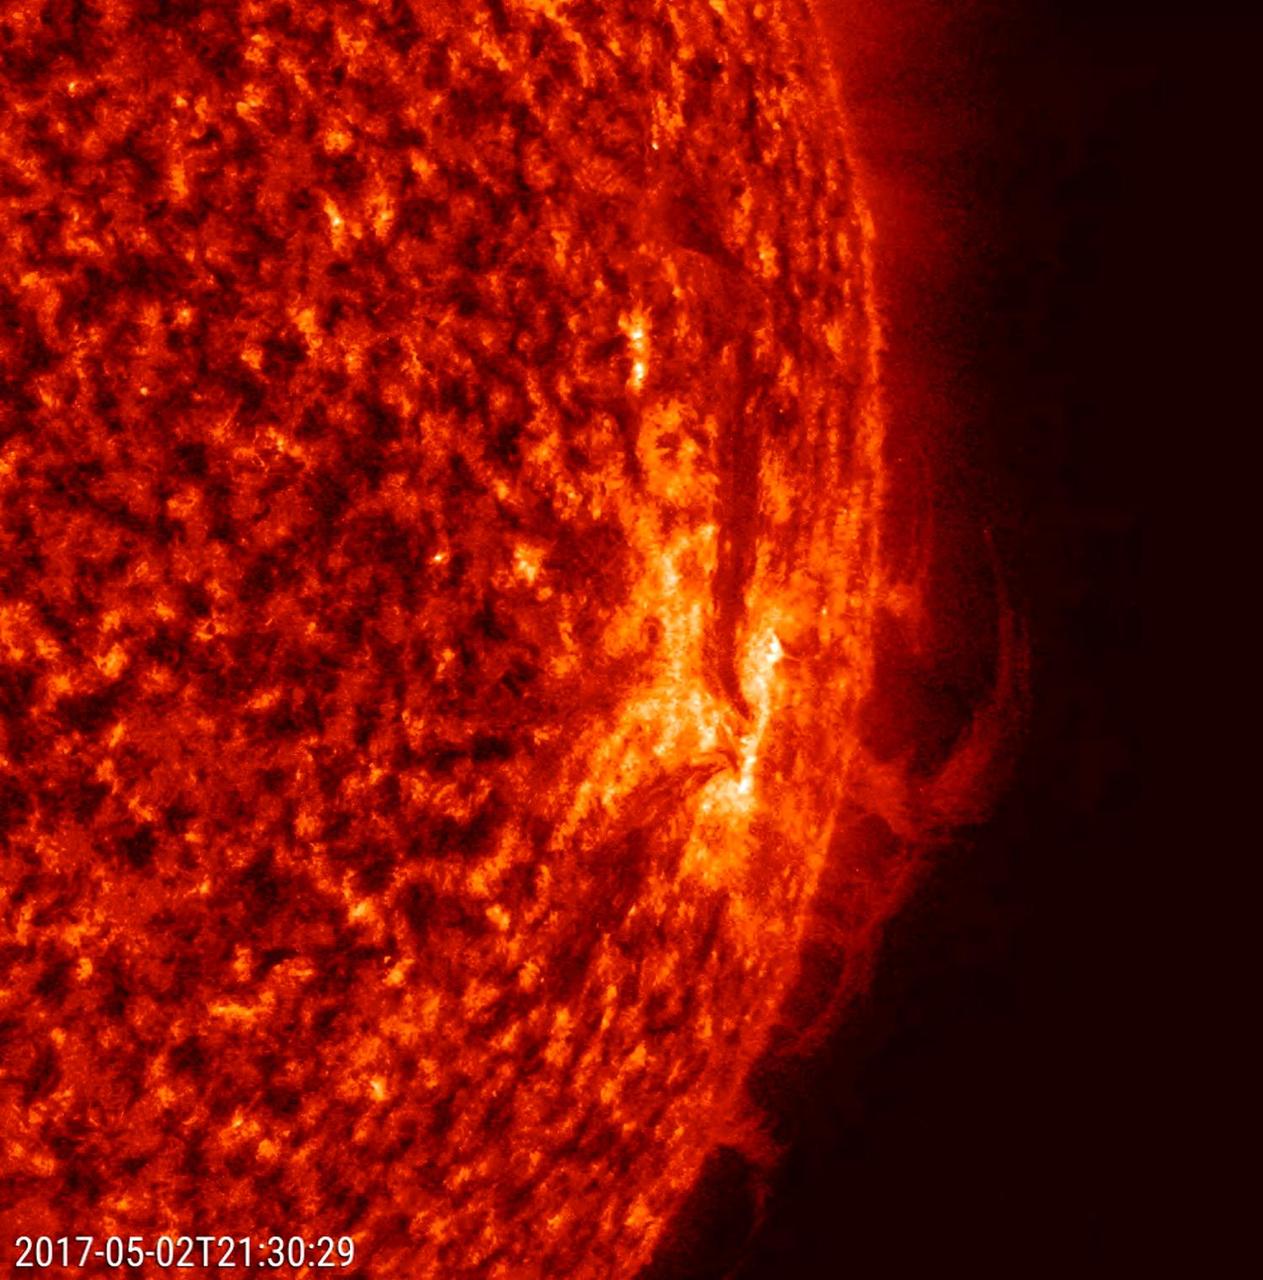
On Jan. 20, 2017, NASA Solar Dynamics Observatory captured a small area of the sun highlighted three active region. Over half a day this active region sent dark swirls of plasma and bright magnetic arches twisting and turning above it. All the activity in the three areas was driven by competing magnetic forces. The dynamic action was observed in a wavelength of extreme ultraviolet light. Movies are available at http://photojournal.jpl.nasa.gov/catalog/PIA11703
Three substantial coronal holes rotated across the face of the Sun the week of Sept. 8-10, 2015 as seen by NASA Solar Dynamics Observatory. Coronal holes are areas where the Sun magnetic field is open and a source of streaming solar wind. They appear darker in extreme ultraviolet light because there is less material in the hole areas being imaged in this specific wavelength of light. It is a little unusual to have three coronal holes at the same time, but neither is it a rare occurrence. http://photojournal.jpl.nasa.gov/catalog/PIA19950
This still image from an animation from NASA GSFC Solar Dynamics Observatory shows a single plume of plasma, many times taller than the diameter of Earth, spewing streams of particles for over two days Aug. 17-19, 2015 before breaking apart. At times, its shape resembled the Eiffel Tower. Other lesser plumes and streams of particles can be seen dancing above the solar surface as well. The action was observed in a wavelength of extreme ultraviolet light. http://photojournal.jpl.nasa.gov/catalog/PIA19875
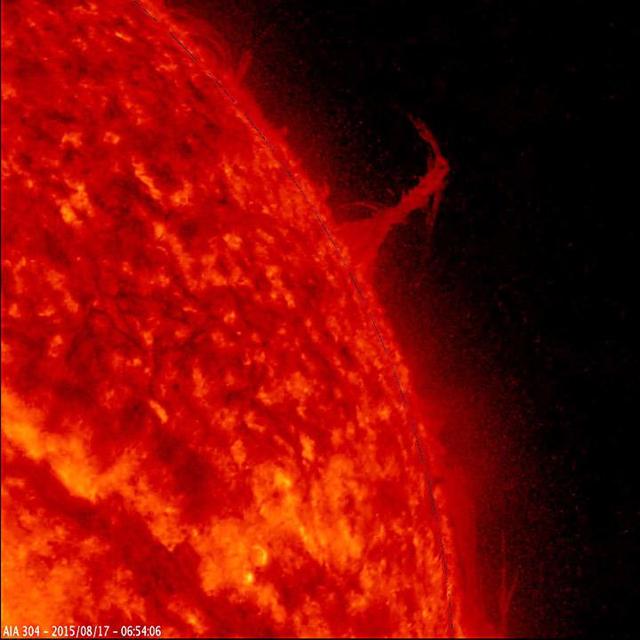
A dark, elongated filament rose up and broke to the lower left and out from the sun seen by NASA Solar Dynamics Observatory, Apr.9-10, 2017. Filaments are cooler clouds of plasma tethered above the sun surface by magnetic forces. They are notoriously unstable and tend not to last more than a few days before they collapse into the sun or break away into space. A video, taken in extreme ultraviolet light, covers about nine hours of activity. Videos are available at https://photojournal.jpl.nasa.gov/catalog/PIA21592
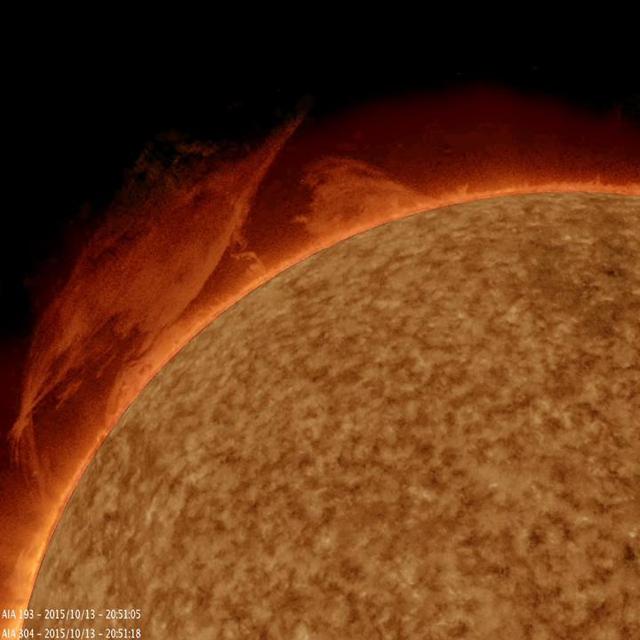
A mass of plasma gathered itself into a twisting mass, spun around for a bit, then rose up and broke apart over a 10-hour period Oct. 13, 2015 as observed by NASA Solar Dynamics Observatory. The image and video were produced with a combination of two wavelengths of extreme ultraviolet light. Prominences are unstable clouds of gas tethered above the surface of the Sun by magnetic forces. Much of the jittering and odd jumping motions above the surface were artifacts caused by brightening and contrast changes used to bring out the detail and structure of the prominence. http://photojournal.jpl.nasa.gov/catalog/PIA20008
Several short stalks of cooler, darker plasma spun and twisted as they interacted with each other at the sun's edge (June 14-15, 2017). The row of strands, which together form a prominence, were being pulled back and forth by magnetic forces. The dynamic action was observed for just over one day. Also noteworthy is the rapid development of a bright active region in the upper right about halfway through the clip. Movies are available at https://photojournal.jpl.nasa.gov/catalog/PIA21761
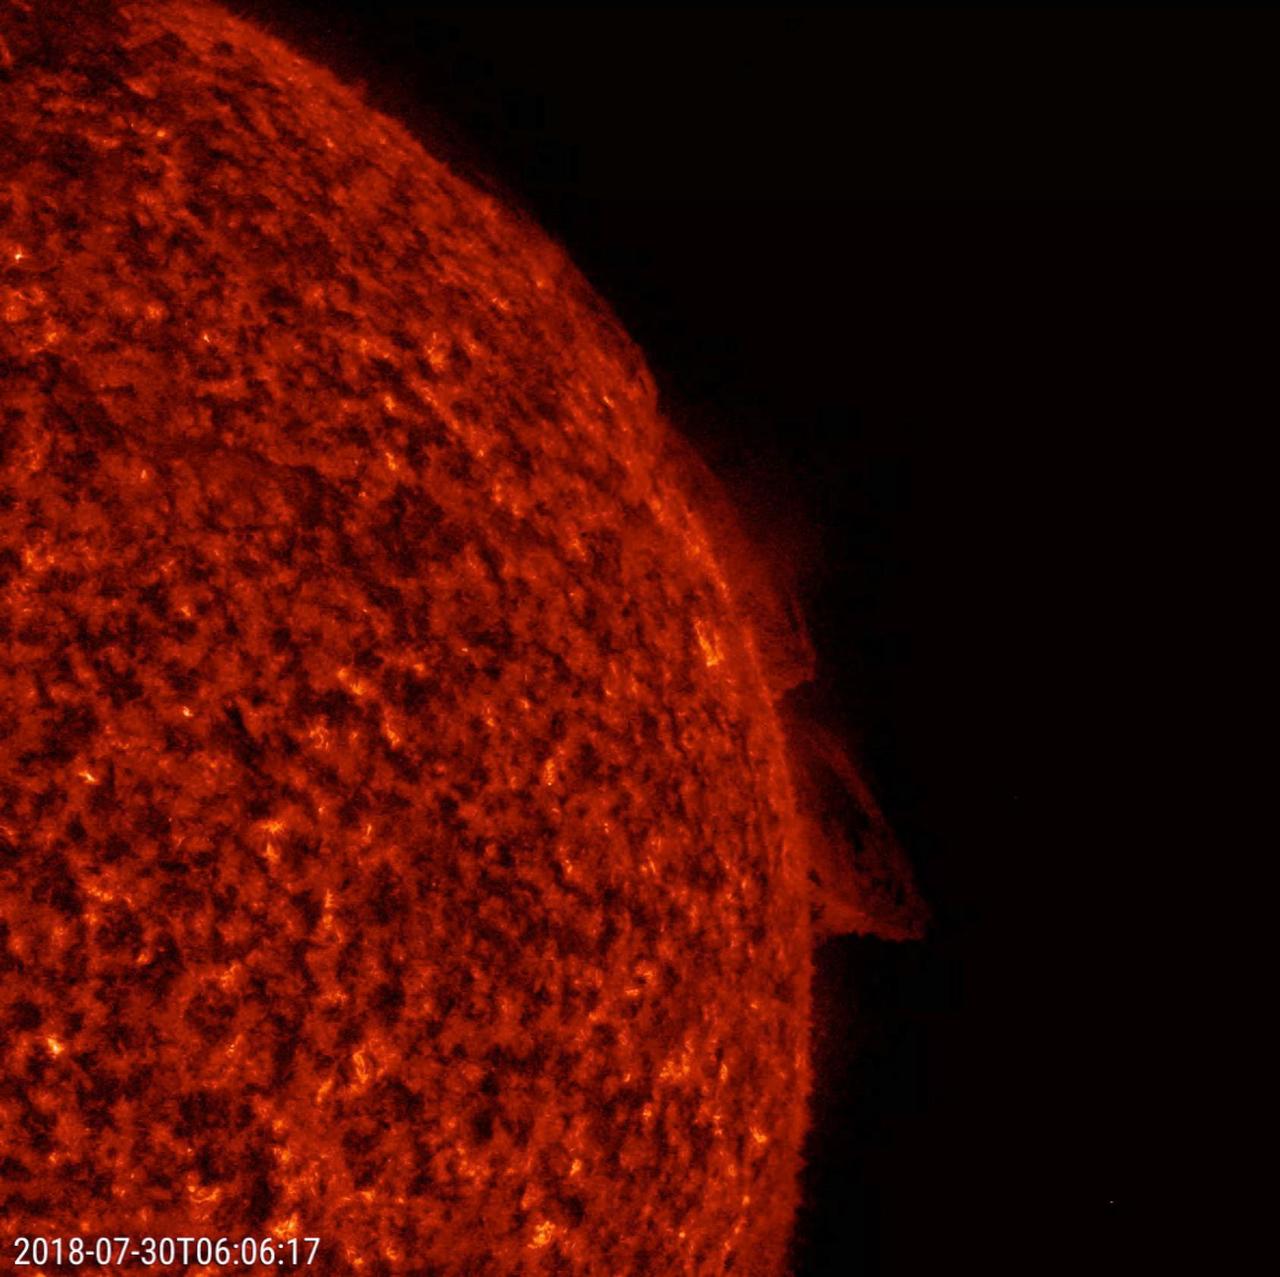
NASA's Solar Dynamics Observatory (SDO) observes two relatively small prominences above the Sun's surface twisted and streamed charged particles over a 20-hour period (July 30-31, 2018), shown here in a wavelength of extreme ultraviolet light. Prominences are large, bright features anchored to the Sun's photosphere but extending outward into its hot outer atmosphere, called the corona. Scientists are still researching how and why prominences are formed. Movies are available at https://photojournal.jpl.nasa.gov/catalog/PIA22661
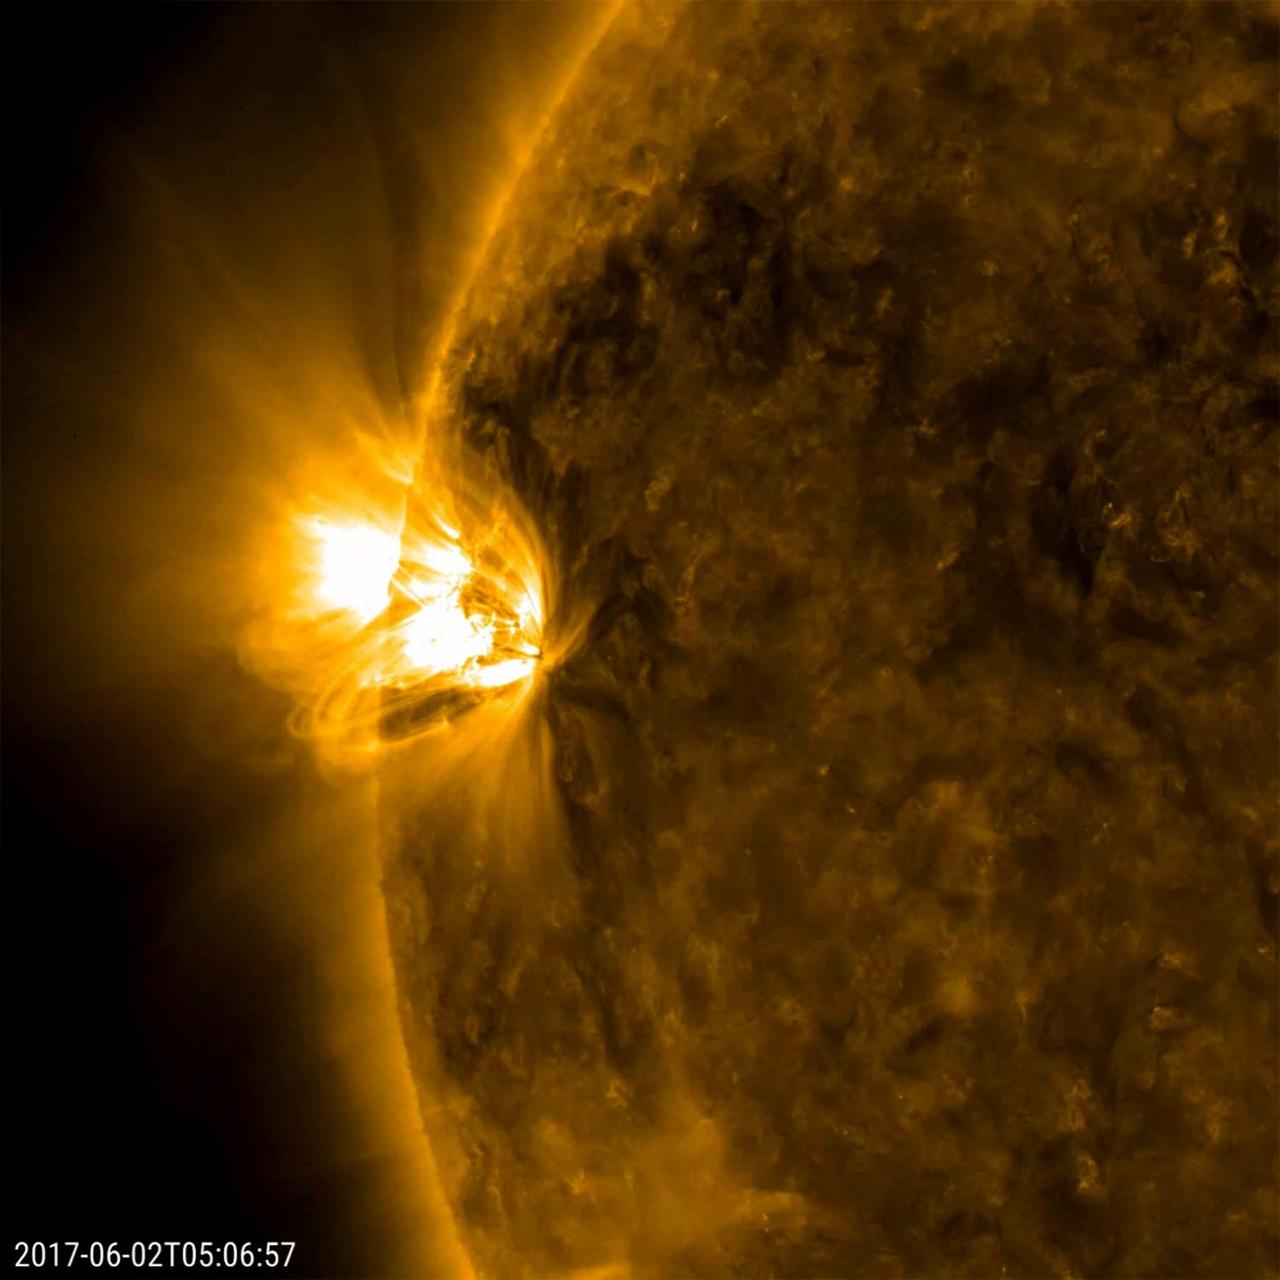
A pair of relatively small (but frenetic) active regions rotated into view, spouting off numerous small flares and sweeping loops of plasma (May 31-June 2, 2017). At first, only the one active region was observed, but mid-way though the video clip a second one behind the first can be picked out. The dynamic regions were easily the most remarkable areas on the sun during this 42-hour period. The images were taken in a wavelength of extreme ultraviolet light. Movies are available at https://photojournal.jpl.nasa.gov/catalog/PIA21756

Dr. Paul Kutler, Computational Fluid Dynamics, at IBM terminal - developing ways to better predict the flow of air at high speeds around aerodynamic bodies.

This still image from an animation from NASA GSFC Solar Dynamics Observatory shows magnetically charged particles forming a nicely symmetrical arch at the edge of the Sun as they followed the magnetic field lines of an active region Aug.4-5, 2015. Before long the arch begins to fade, but a fainter and taller arch appears for a time in the same place. Note that several other bright active regions display similar kinds of loops above them. These images of ionized iron at about one million degrees were taken in a wavelength of extreme ultraviolet light. The video covers about 30 hours of activity. http://photojournal.jpl.nasa.gov/catalog/PIA19874
Scientists involved in NASA's Solar Dynamics Observatory (SDO) mission attend a press conference to discuss recent images captured by the SDO spacecraft Wednesday, April 21, 2010, at the Newseum in Washington. Pictured right to left are: Madhulika Guhathakurta, SDO program scientist, NASA Headquarters in Washington; Tom Woods, principal investigator, Extreme Ultraviolet Variability Experiment instrument, Laboratory for Atmospheric and Space Physics, University of Colorado in Boulder; Philip H. Scherrer, principal investigator, Helioseismic and Magnetic Imager instrument, Stanford University in Palo Alto; Alan Title, principal investigator, Atmospheric Imaging Assembly instrument, Lockheed Martin Solar and Astrophysics Laboratory in Palo Alto and Dean Pesnell, SDO project scientist, Goddard Space Flight Center in Greenbelt, Md. Photo Credit: (NASA/Carla Cioffi)
Scientists involved in NASA's Solar Dynamics Observatory (SDO) mission attend a press conference to discuss recent images captured by the SDO spacecraft Wednesday, April 21, 2010, at the Newseum in Washington. On Feb. 11, 2010, NASA launched the SDO spacecraft, which is the most advanced spacecraft ever designed to study the sun. Seated left to right are: Dean Pesnell, SDO project scientist, Goddard Space Flight Center in Greenbelt, Md.; Alan Title, principal investigator, Atmospheric Imaging Assembly instrument, Lockheed Martin Solar and Astrophysics Laboratory in Palo Alto; Philip H. Scherrer, principal investigator, Helioseismic and Magnetic Imager instrument, Stanford University in Palo Alto; Tom Woods, principal investigator, Extreme Ultraviolet Variability Experiment Instrument, Laboratory for Atmospheric and Space Physics, University of Colorado in Boulder and Madhulika Guhathakurta, SDO program scientist, NASA Headquarters in Washington. Photo Credit: (NASA/Carla Cioffi)

Madhulika Guhathakurta, far right, SDO Program Scientist at NASA Headquarters in Washington, speaks during a briefing to discuss recent images from NASA's Solar Dynamics Observatory, or SDO, Wednesday, April 21, 2010, at the Newseum in Washington. Pictured from left of Dr. Guhathakurta's are: Tom Woods, principal investigator, Extreme Ultraviolet Variability Experiment instrument, Laboratory for Atmospheric and Space Physics, University of Colorado in Boulder; Philip H. Scherrer, principal investigator, Helioseismic and Magnetic Imager instrument, Stanford University in Palo Alto; Alan Title, principal investigator, Atmospheric Imaging Assembly instrument, Lockheed Martin Solar and Astrophysics Laboratory in Palo Alto and Dean Pesnell, SDO project scientist, Goddard Space Flight Center in Greenbelt, Md. Photo Credit: (NASA/Carla Cioffi)
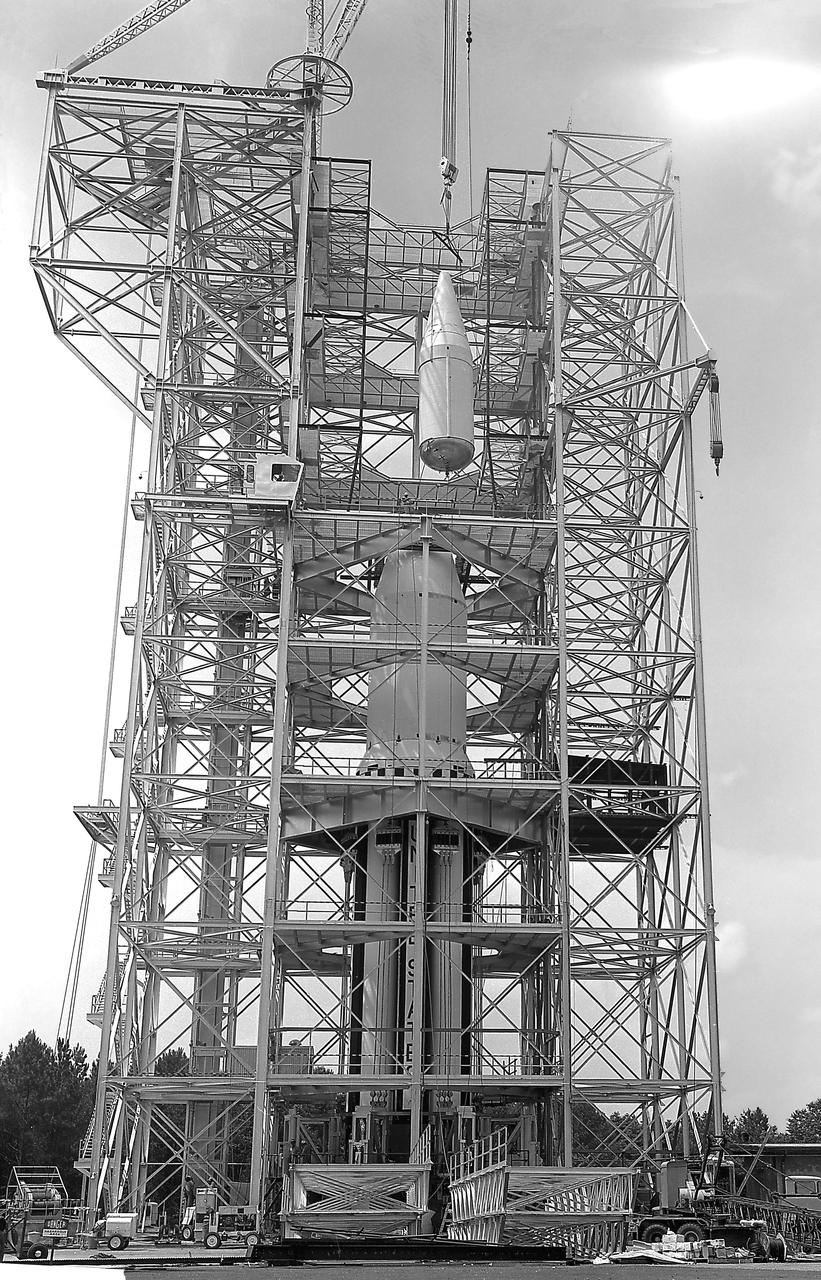
This image depicts the Saturn I launch vehicle placed in the dynamic test stand at the Marshall Space Flight Center (MSFC). A dummy booster was moved to the dynamic test stand early in June, and, for the first time, vertically mated with dummy S-I and S-IV stages. The assembled vehicle was readied for dynamic testing to investigate the integrity of the support structure.

A prominence at the sun's edge shifted and slithered back and forth over a one-day period (Nov. 29-30, 2017). Prominences are strands of charged particles suspended above the sun's surface that are pulled and tugged by magnetic forces. This kind of close-up also shows the kind of dynamic activity taking place all over the sun's surface. The bright area further down from the prominence is an active region, an area of intense tangles of magnetic forces. Towards the end of the clip, it blasts out a small stream of plasma (captured in the still). The images were taken in a wavelength of extreme ultraviolet light. Movies are available at https://photojournal.jpl.nasa.gov/catalog/PIA22123
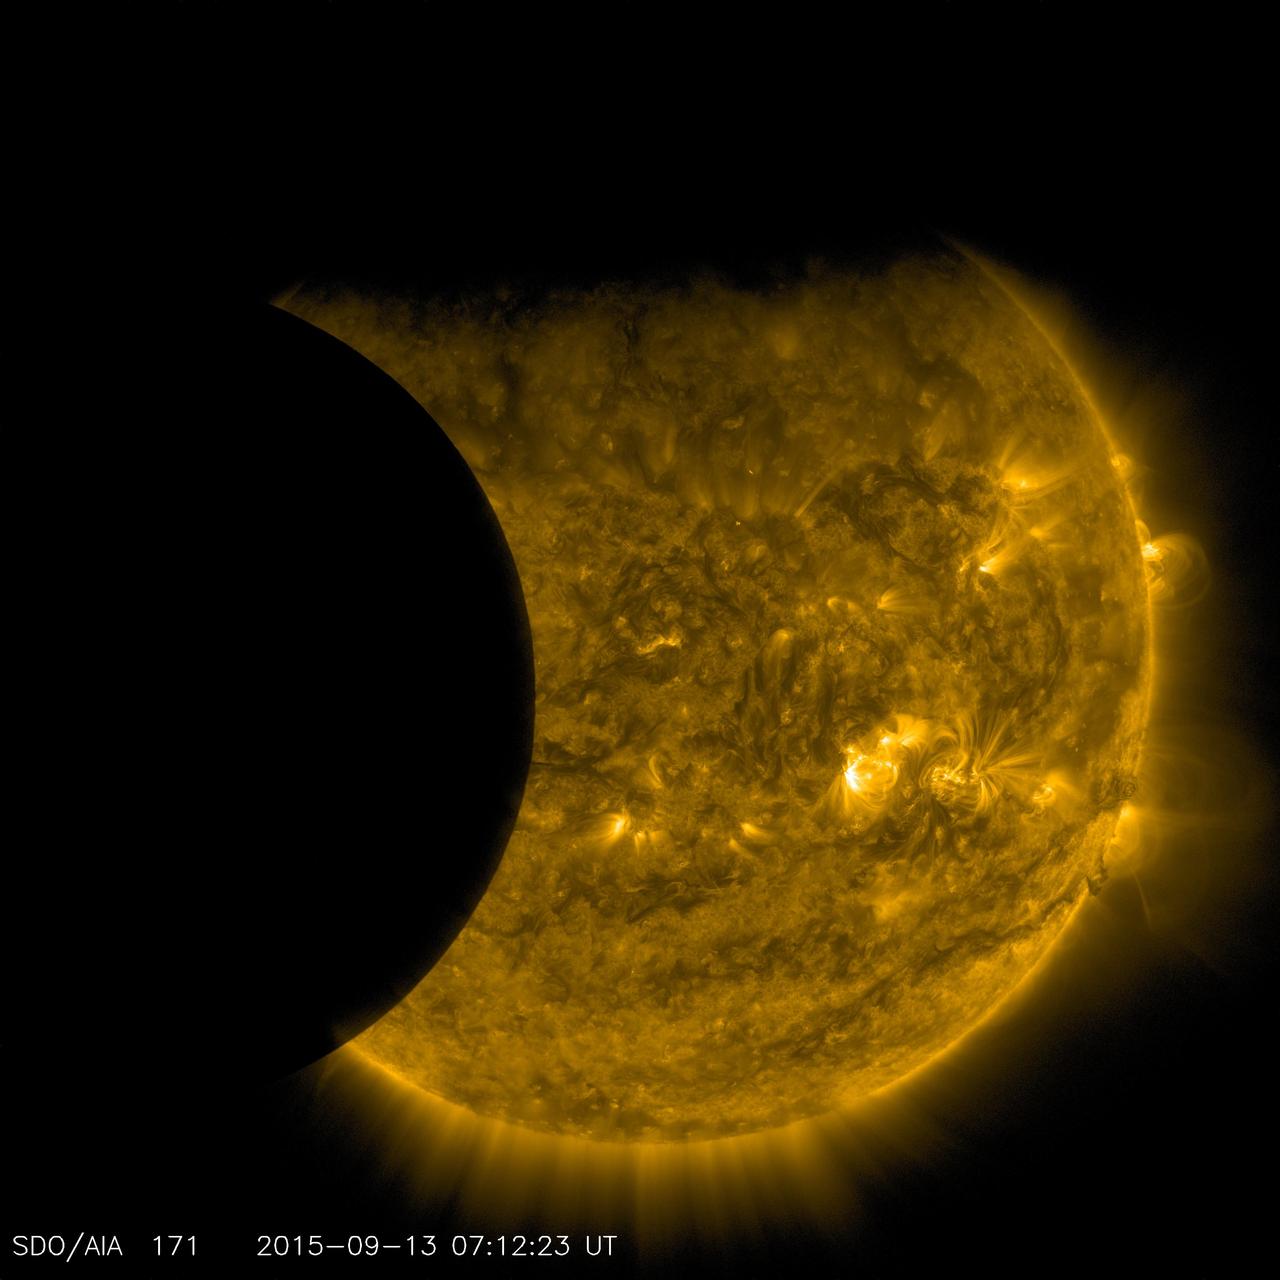
Several times a day for a few days the Earth completely blocked the Sun for about an hour due to NASA's Solar Dynamics Observatory's orbital path (Feb. 15, 2017). The edge of the Earth is not crisp, but kind of fuzzy due to Earth's atmosphere. This frame from a video shows the ending of one such eclipse over -- just seven minutes. The sun is shown in a wavelength of extreme ultraviolet light. These eclipses re-occur about every six months. The Moon blocks SDO's view of the sun on occasion as well. Movies are available at http://photojournal.jpl.nasa.gov/catalog/PIA21461
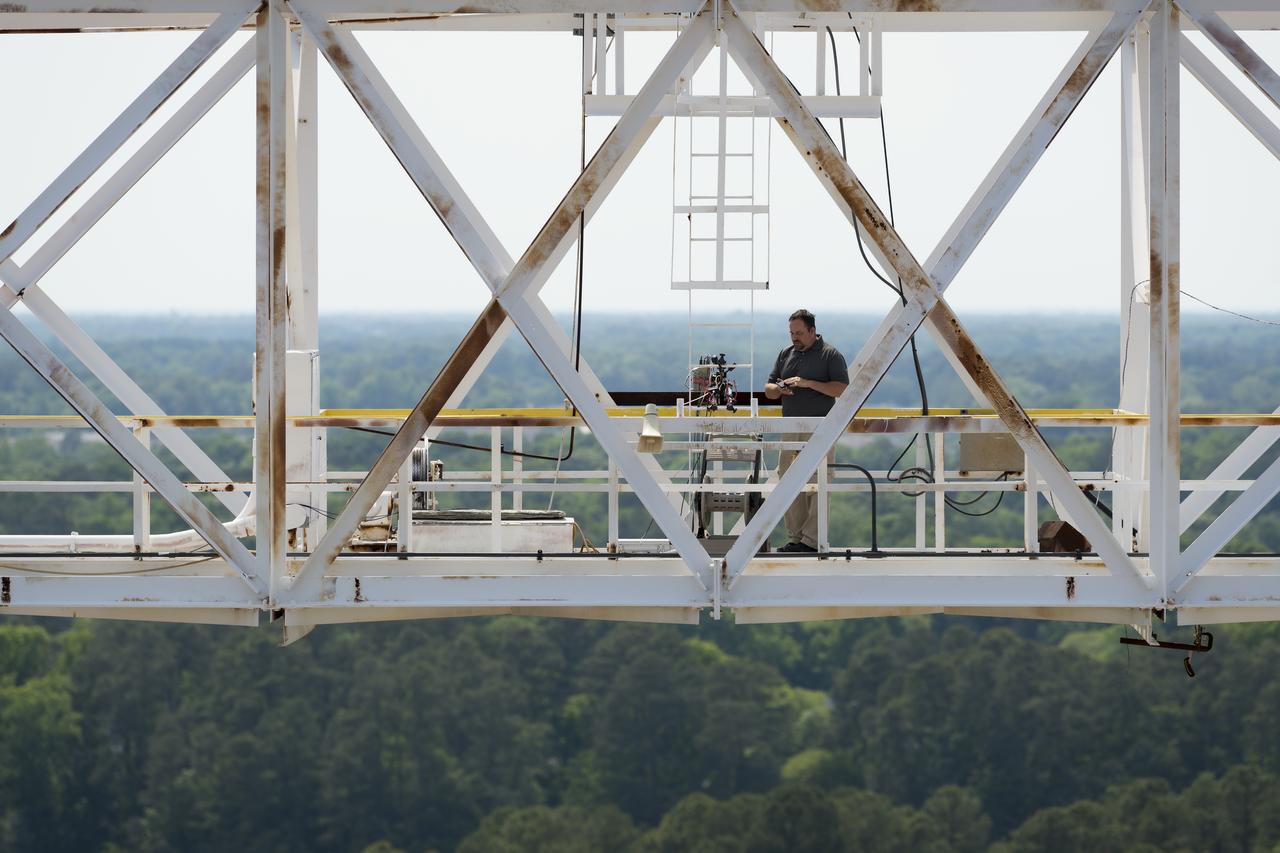
Images from Orion Structural Test Article (STA) vertical water impact testing (WIT) Swing Test 4, Photographer Harlen Capen at the top of the Impact Dynamics Facility or Gantry as it is know at NASA Langley Research Center.
iss062e141213 (4/11/2020) --- A view of the FSL Soft Matter Dynamics - FOAM sample cell in the Columbus module aboard the International Space Station (ISS). FSL Soft Matter Dynamics - Hydrodynamics of Wet Foams (Foam Coarsening) aims to study aqueous and non-aqueous foams in the microgravity environment of the ISS.

iss062e141209 (4/11/2020) --- A view of the FSL Soft Matter Dynamics - FOAM sample cell in the Columbus module aboard the International Space Station (ISS). FSL Soft Matter Dynamics - Hydrodynamics of Wet Foams (Foam Coarsening) aims to study aqueous and non-aqueous foams in the microgravity environment of the ISS.
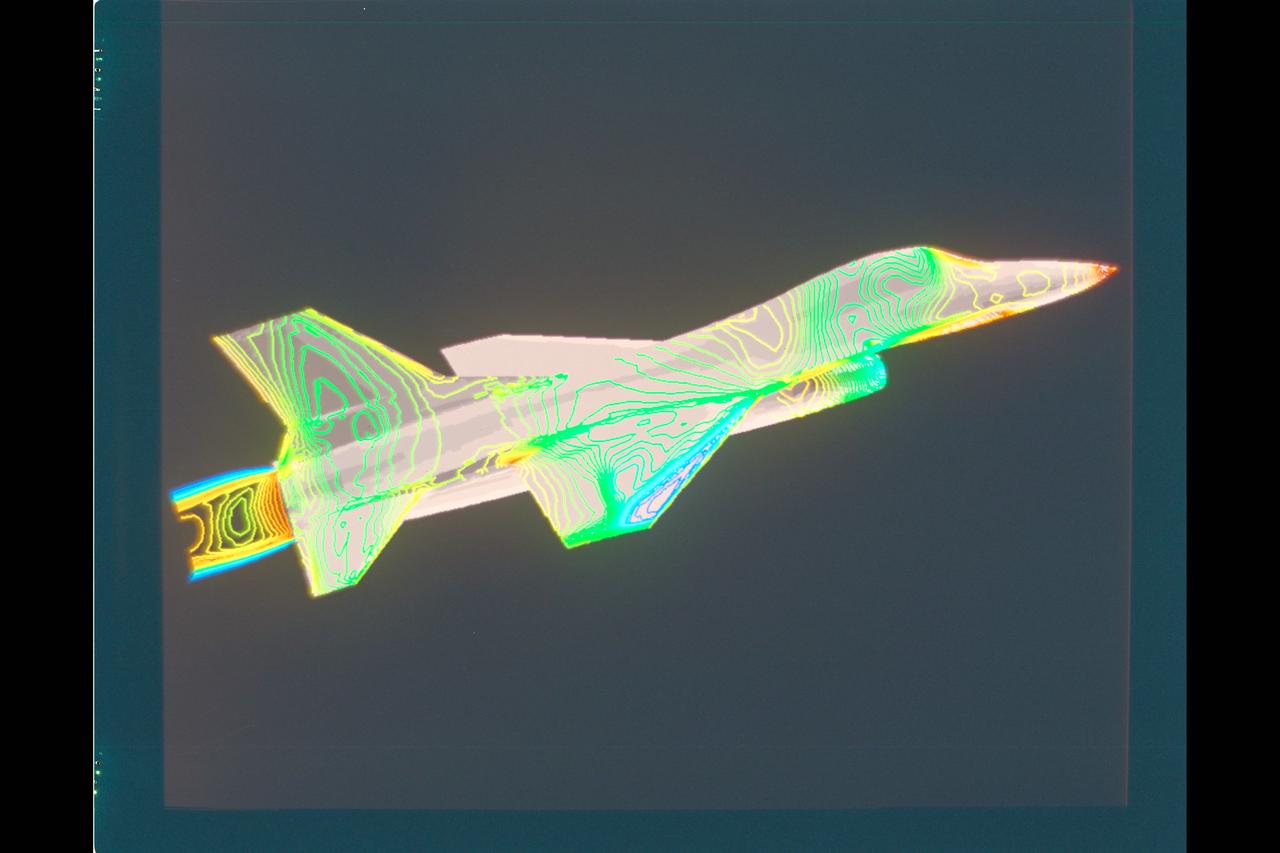
Computational Fluid Dynamics (CFD) F-16A flow field grid
NASA Solar Dynamics Observatory sees the sun has been virtually spotless, as in no sunspots, a 11-day spotless stretch not seen since the last solar minimum many years ago. Movies are available at https://photojournal.jpl.nasa.gov/catalog/PIA21582
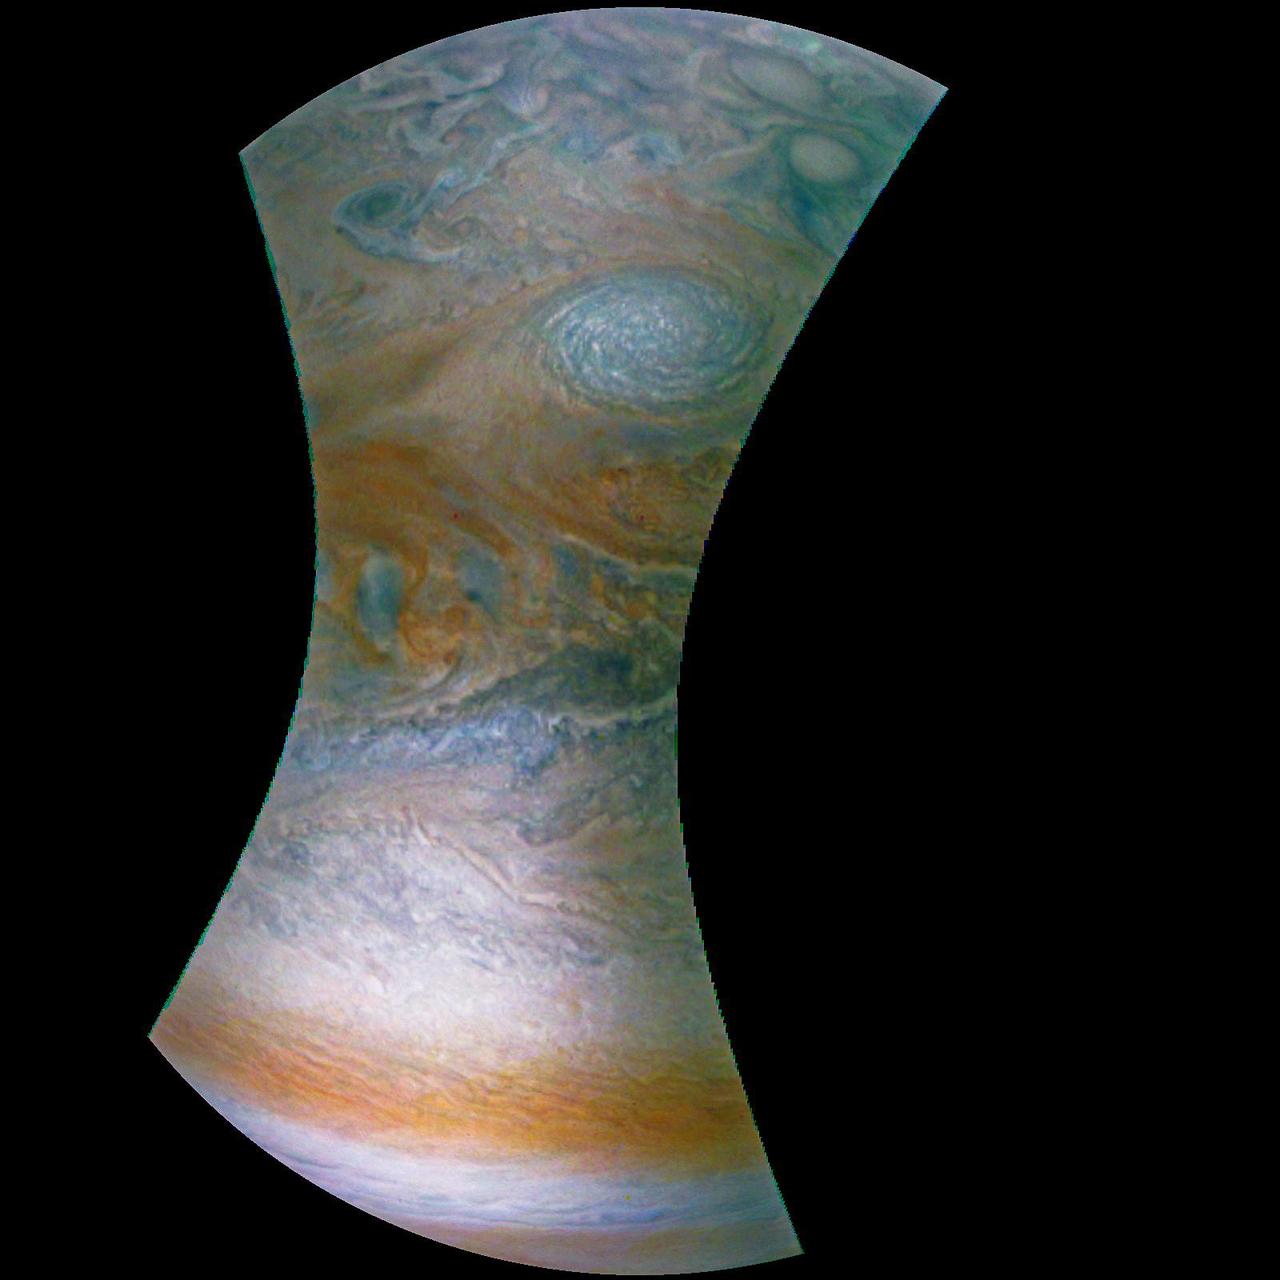
This image captures the dynamic nature of Jupiter's northern temperate belt. The view reveals a white, oval-shaped anticyclonic storm called WS-4. NASA's Juno spacecraft took this color-enhanced image on April 1 at 2:38 a.m. PST (5:38 a.m. EST) during its 12th close flyby of the gas giant planet. At the time, the spacecraft was 4,087 miles (6,577 kilometers) from the tops of Jupiter's clouds at 35.6 degrees north latitude. This image was created by citizen scientist Emma Walimaki using data from the JunoCam imager on NASA's Juno spacecraft. https://photojournal.jpl.nasa.gov/catalog/PIA22420 . - Enhanced image by Emma Walimaki based on images provided courtesy of NASA/JPL-Caltech/SwRI/MSSS
NASA's Solar Dynamics Observatory (SDO) saw both the Moon (upper right) and the Earth (upper left) partially block the sun (Sept. 1, 2016 at 7:33 UT). Just before this image was taken, the Earth totally blocked the sun for a while. SDO orbits 22,000 miles above the Earth in a highly elliptical orbit that sometimes puts the Moon or Earth in front of the sun. The sun image was taken in a wavelength of extreme ultraviolet light. Only once before have both been there at the same time. Note that the edge of the moon is quite crisp because it has no atmosphere. Movies are available at the Photojournal. http://photojournal.jpl.nasa.gov/catalog/PIA21028
Strands of plasma at the sun edge shifted and twisted back and forth over a 22-hour period, May 2-3, 2017. In this close-up from NASA Solar Dynamics Observatory, the strands are being manipulated by strong magnetic forces associated with active region. This kind of activity is not at all uncommon, but best viewed in profile. The images were taken in a wavelength of extreme ultraviolet light. To give a sense of scale, the strands hover above the sun more than several times the size of Earth. Movies are available at https://photojournal.jpl.nasa.gov/catalog/PIA21632
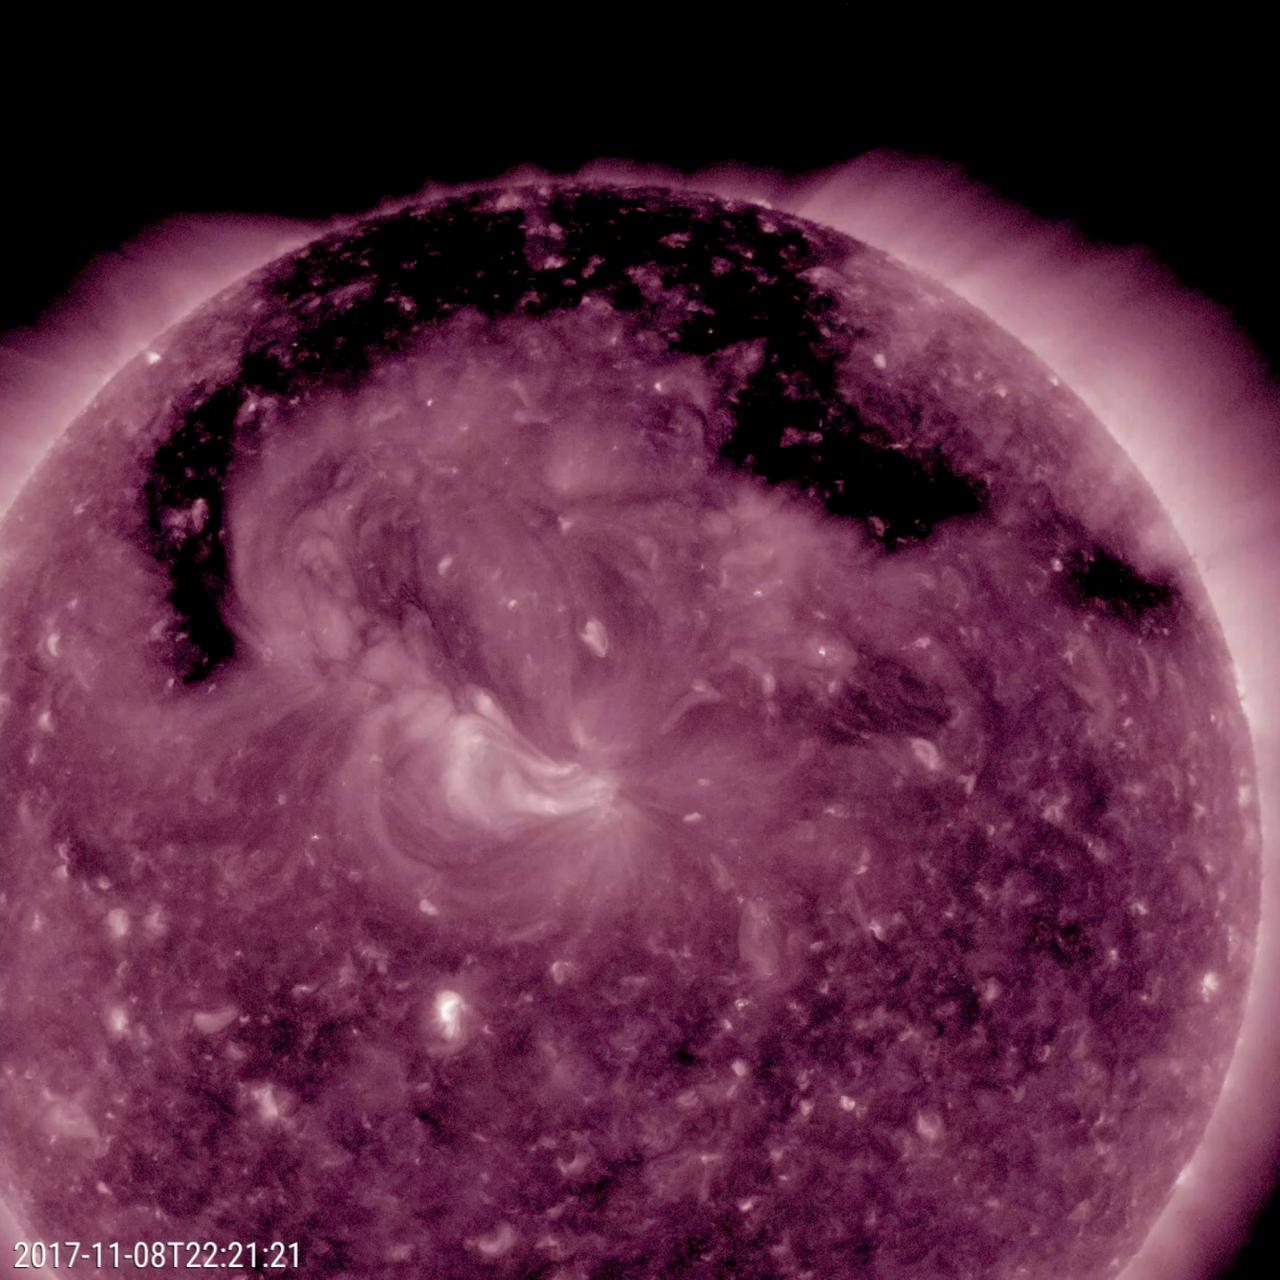
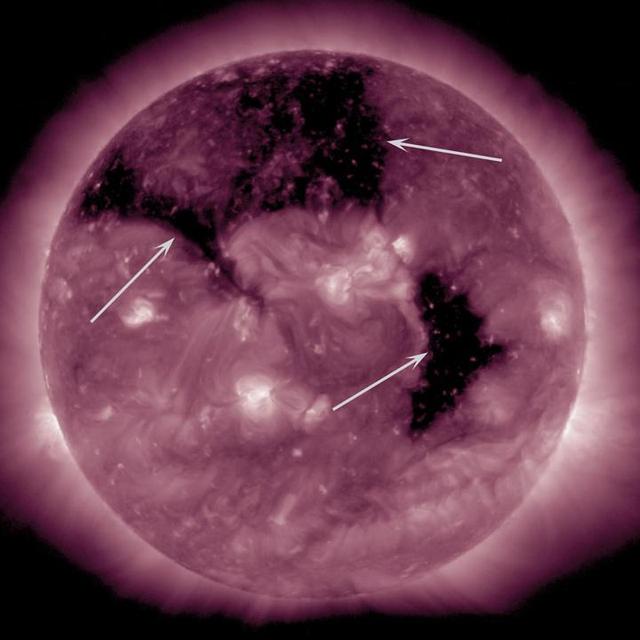
This image from NASA's Solar Dynamics Observatory shows a broad coronal hole was the dominant feature this week on the sun (Nov. 7-9, 2017). It was easily recognizable as the dark expanse across the top of the sun and extending down in each side. Coronal holes are magnetically open areas on the sun that allow high-speed solar wind to gush out into space. They always appear darker in extreme ultraviolet. This one was likely the source of bright aurora that shimmered for numerous observers, with some reaching down even to Nebraska. Movies are available at https://photojournal.jpl.nasa.gov/catalog/PIA22113
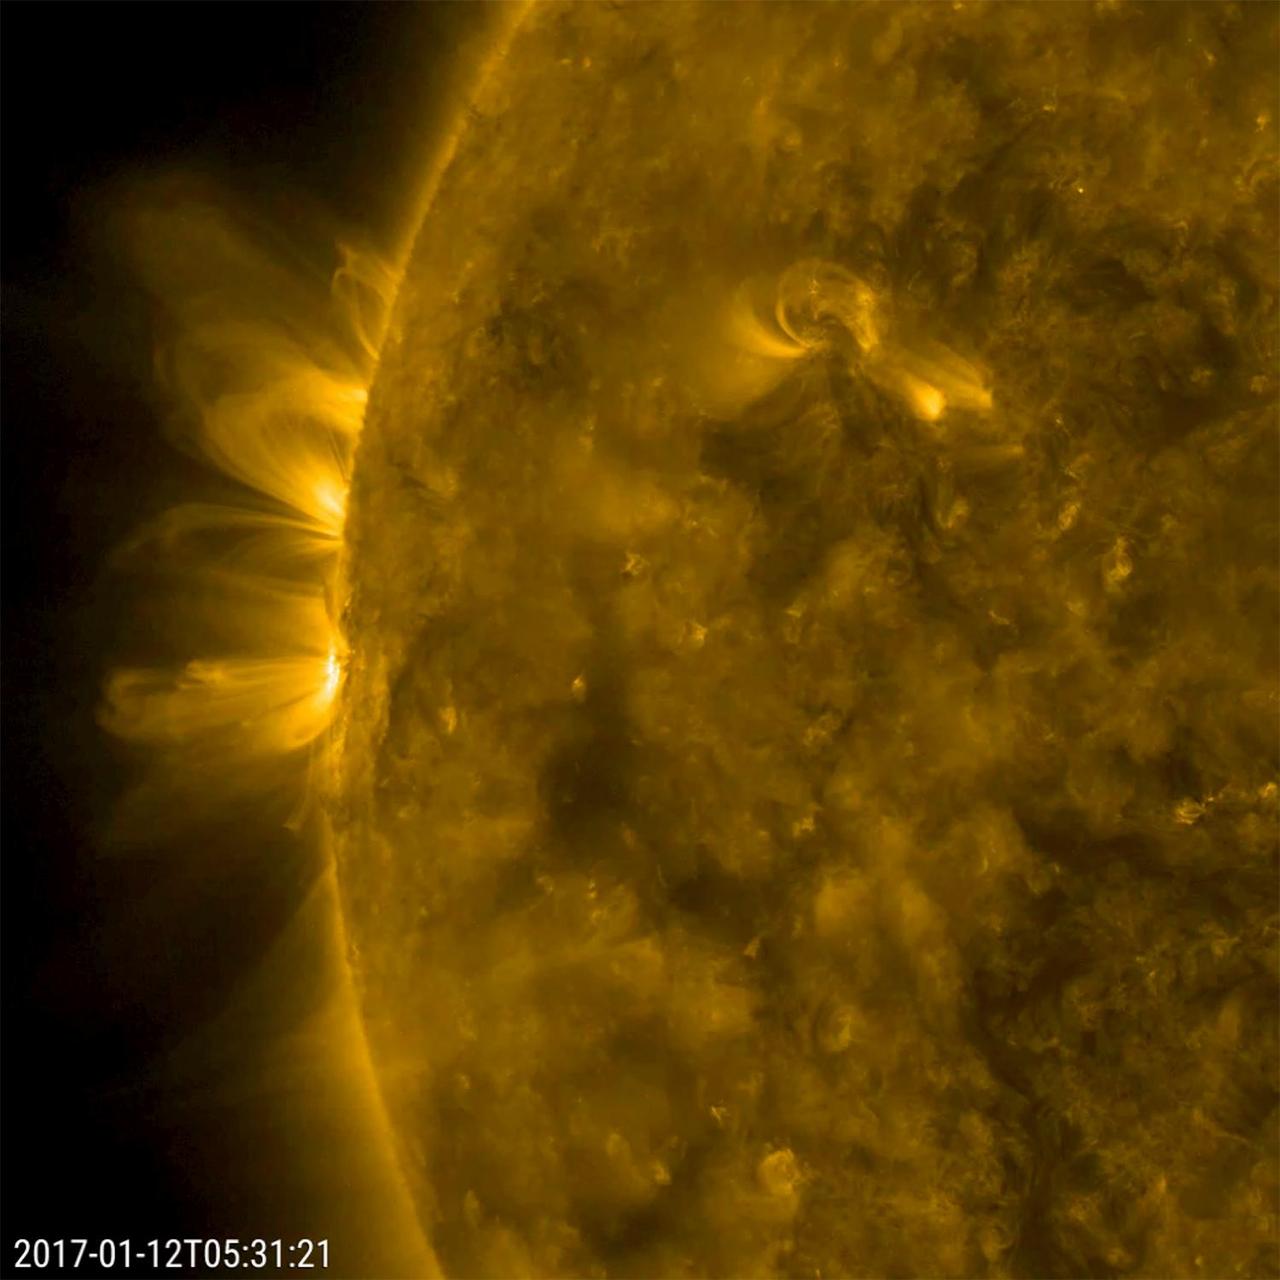
Magnetic arcs of plasma that spiraled above two active regions held their shape fairly well over 18 hours (Jan. 11-12, 2017). The charged plasma is being controlled the magnetic field lines of the active regions. The field lines become clearly visible when viewed in this wavelength of extreme ultraviolet light. Often the arches bend and twist more dynamically than the relatively stable ones seen here. Movies are available at http://photojournal.jpl.nasa.gov/catalog/PIA12327

(NESC) NASA Engineering and Safety Center Orion Heat Shield Carrier Structure: Titanium Orthogrid heat shield sub-component dynamic test article : person in the photo Jim Jeans (Background: Mike Kirsch, James Ainsworth)

(NESC) NASA Engineering and Safety Center Orion Heat Shield Carrier Structure: Titanium Orthogrid heat shield sub-component dynamic test article : person in the photo Jim Jeans

(NESC) NASA Engineering and Safety Center Orion Heat Shield Carrier Structure: Titanium Orthogrid heat shield sub-component dynamic test article :person in the photo James Ainsworth
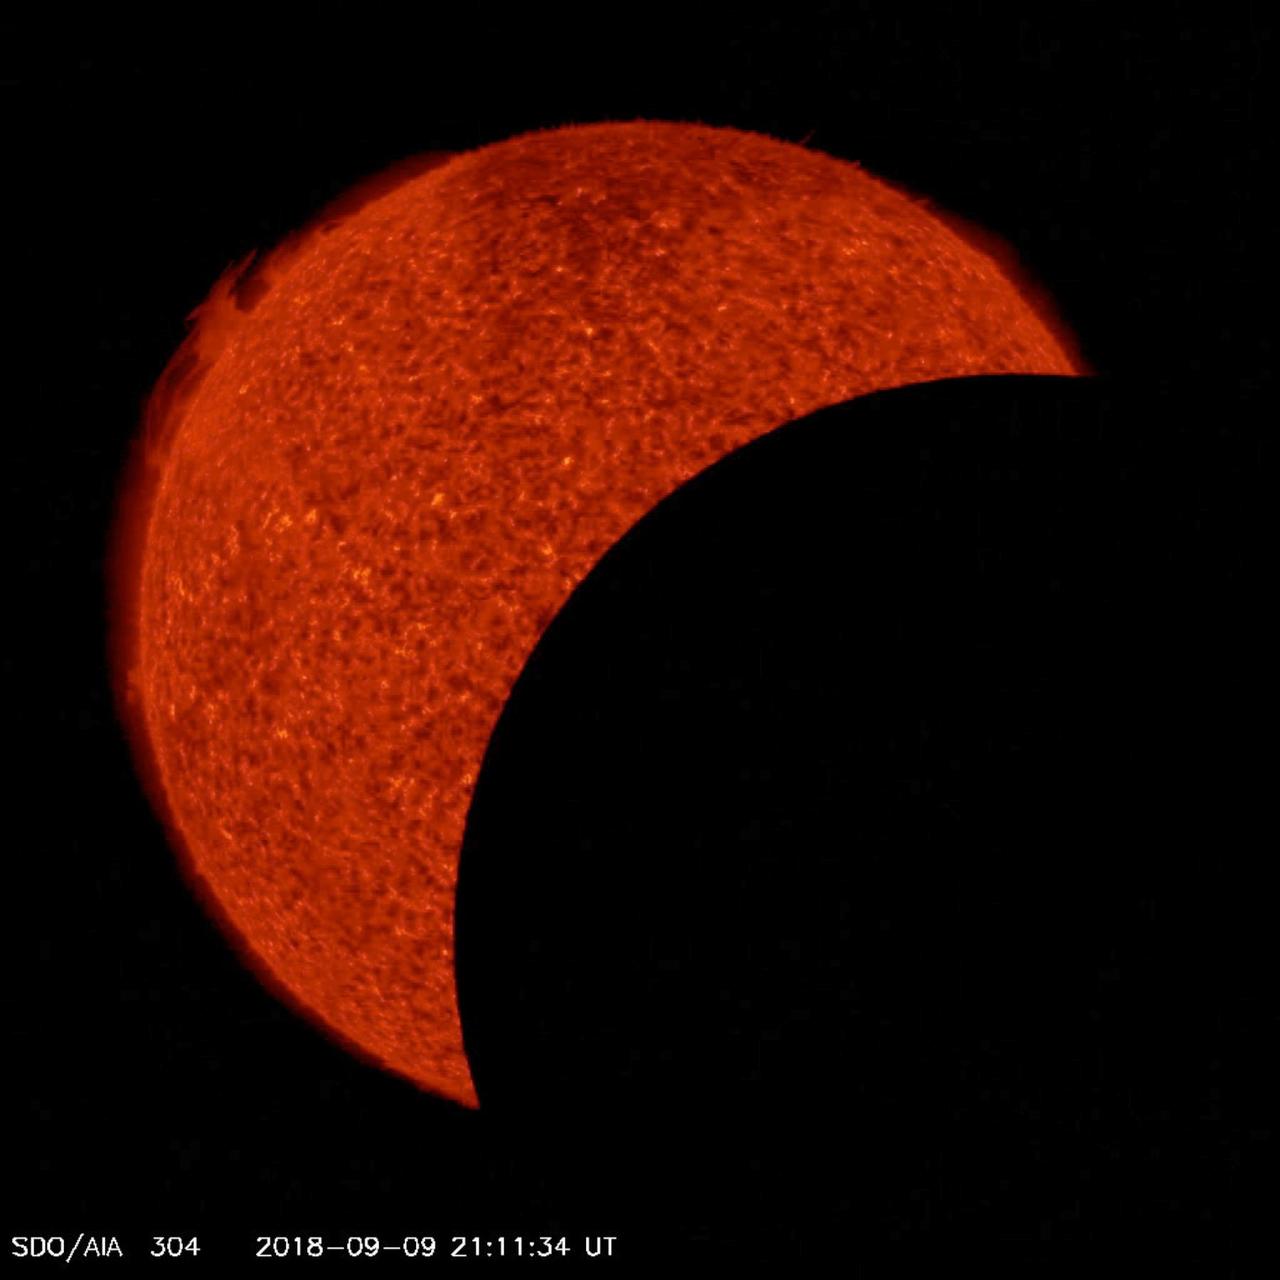
In just about seven hours, NASA's Solar Dynamics Observatory spacecraft saw the moon transit the Sun two times (Sept. 9-10, 2018). Transits occur when an object passes between a larger body and the viewer. The first transit lasted about an hour and covered 92 percent of the Sun at its peak. The second transit lasted about 50 minutes and covered just 34 percent of the Sun at its peak. The Moon appears to go in one direction in the first transit and the opposite direction in the second. This is because the SDO spacecraft orbits around Earth, moving in the same direction as the Moon but faster. On the first transit it catches up with and passes the Moon. As SDO swings back around the far side of Earth, it encounters the Moon again from the far side of Earth, where it appears to travel in the opposite direction. The images were taken in a wavelength of extreme ultraviolet light. None of this was visible from Earth. Movies are available at https://photojournal.jpl.nasa.gov/catalog/PIA22723
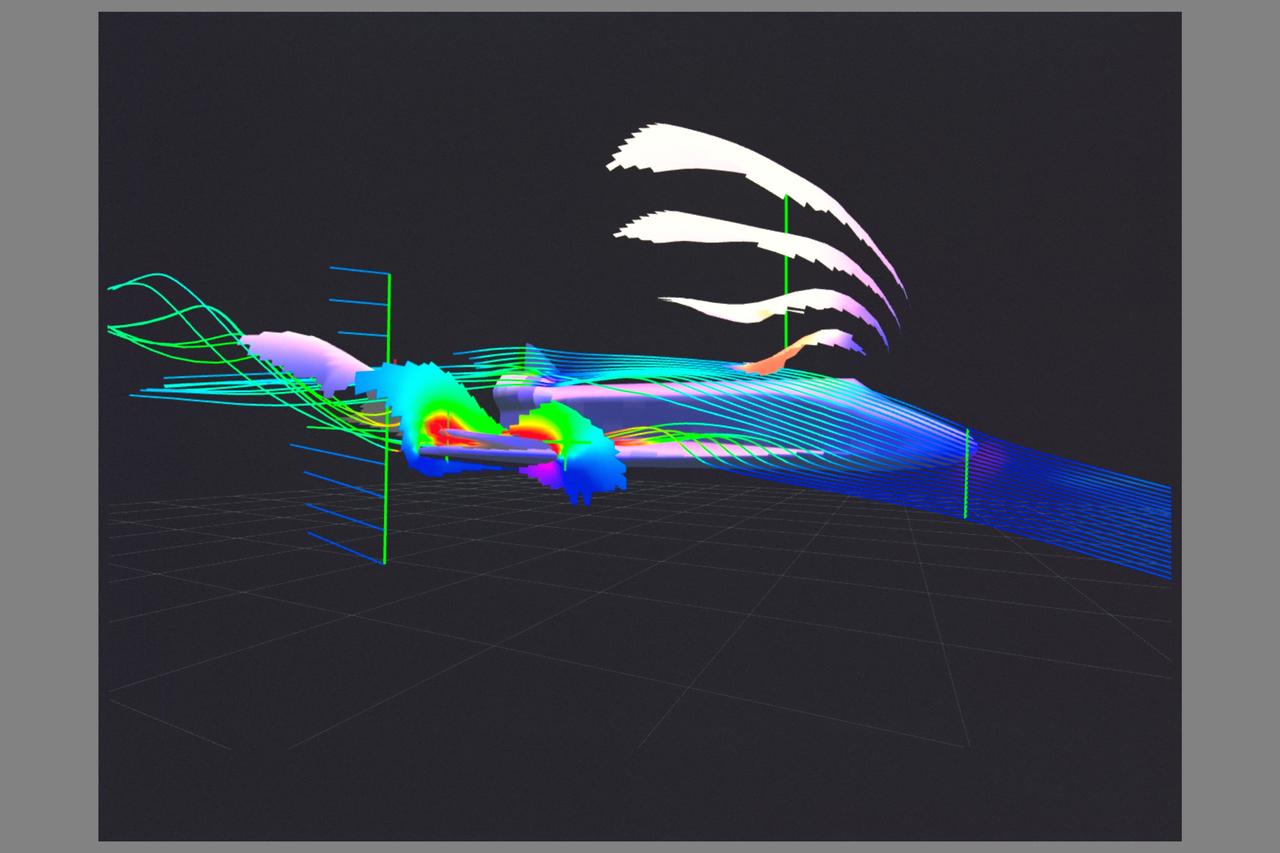
Computational Fluid Dynamics (CFD) image of Space Shuttle Pressure Flow using Virtual Wind Tunnel

Computational Fluid Dynamics (CFD) image of Space Shuttle Pressure Flow using Virtual Wind Tunnel

Alan Title, second from left, principal investigator, Atmospheric Imaging Assembly instrument, Lockheed Martin Solar and Astrophysics Laboratory in Palo Alto, speaks during a briefing to discuss recent images from NASA's Solar Dynamics Observatory, or SDO, Wednesday, April 21, 2010, at the Newseum in Washington. Launched on Feb. 11, 2010, SDO is the most advanced spacecraft ever designed to study the sun. During its five-year mission, it will examine the sun's magnetic field and also provide a better understanding of the role the sun plays in Earth's atmospheric chemistry and climate. Pictured from left to right: Dean Pesnell, SDO project scientist, Goddard Space Flight Center in Greenbelt, Md., Alan Title, Philip H. Scherrer, principal investigator, Helioseismic and Magnetic Imager instrument, Stanford University in Palo Alto, Tom Woods, principal investigator, Extreme Ultraviolet Variability Experiment instrument, Laboratory for Atmospheric and Space Physics, University of Colorado in Boulder and Madhulika Guhathakurta, SDO program scientist, NASA Headquarters in Washington. Photo Credit: (NASA/Carla Cioffi)
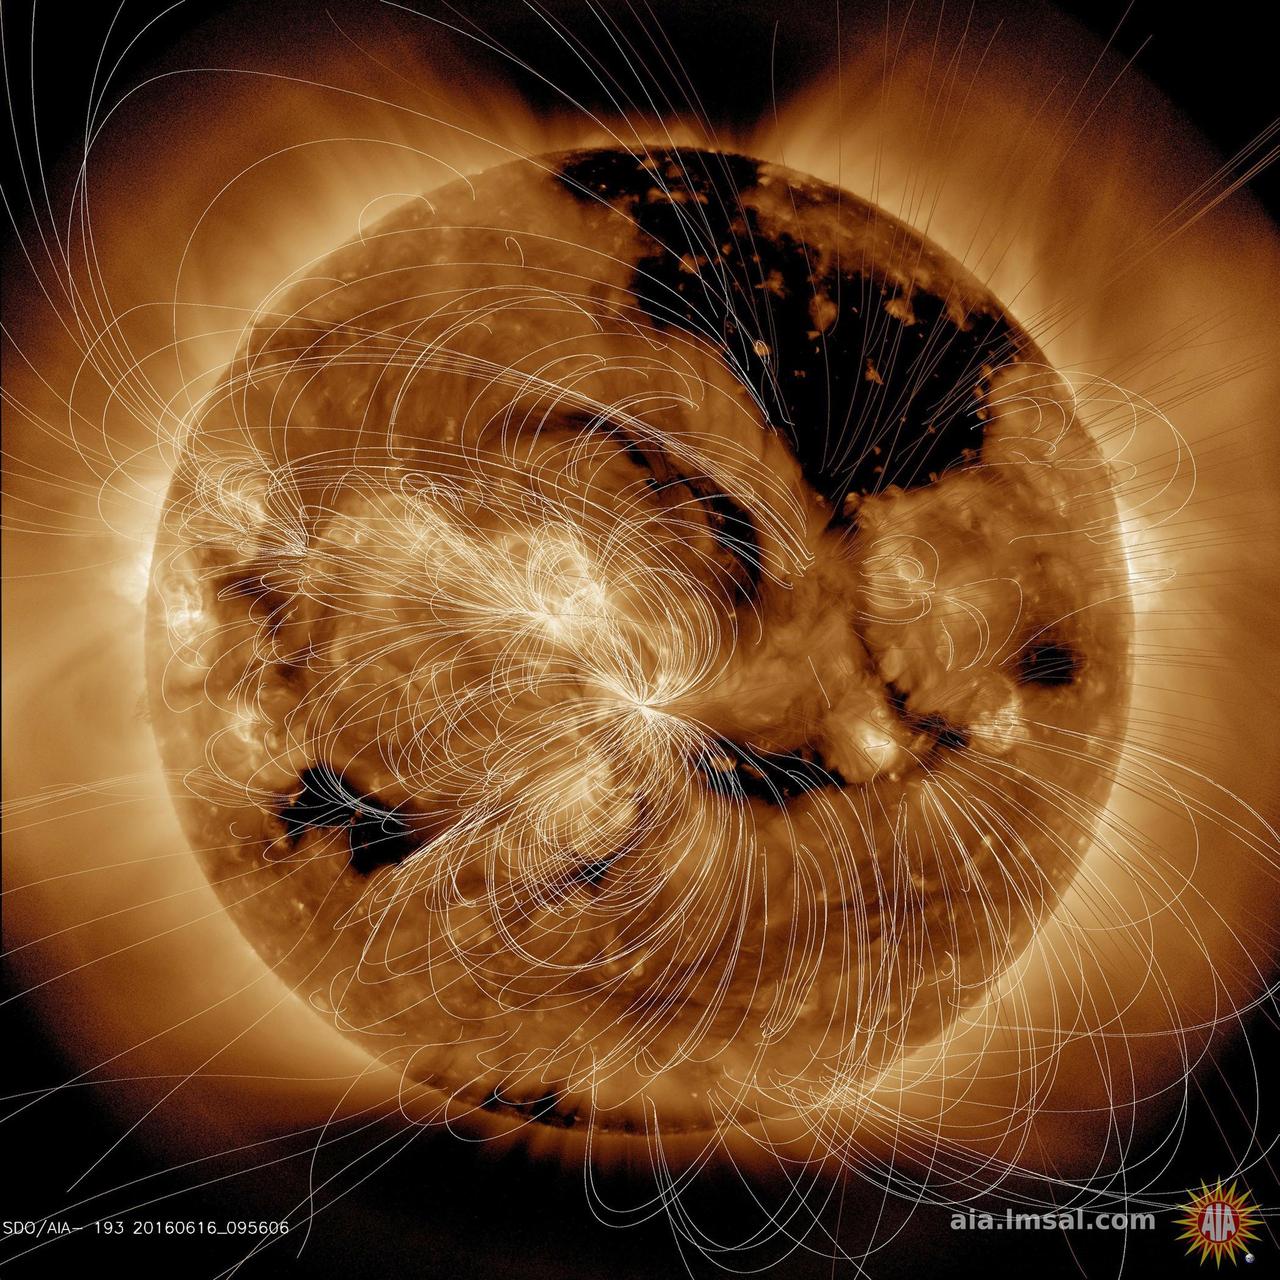
Each day NASA solar scientists produce overlays (in white lines) that show their estimation of how the magnetic field lines above the sun are configured (June16, 2016). In the video clip we show the sun in a wavelength of extreme ultraviolet light, then reveal the magnetic field line configuration in the same wavelength. Notice how the lines are tightly bundled near the lighter-toned active regions, which are magnetically intense regions. The magnetic lines from the darker areas, called coronal holes, open out into space and the extended lines show that. Our magnetically active sun is a dynamic body that changes all the time. Movie are also available at the Photojournal. http://photojournal.jpl.nasa.gov/catalog/PIA20881
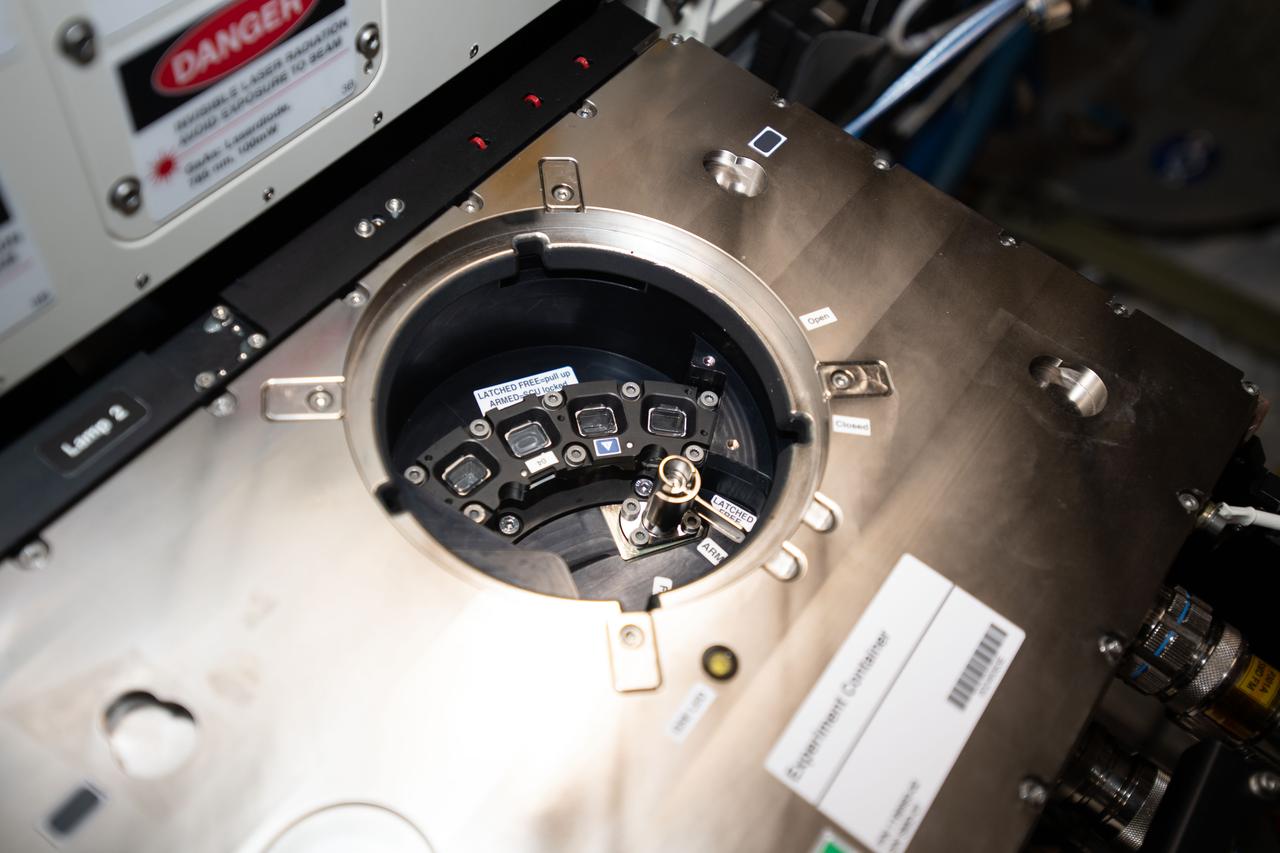
iss062e141221 (4/11/2020) --- A view of the sample cell inside the Soft Matter Dynamics (SMD) Experiment Container of the Fluid Science Laboratory (FSL) in the Columbus module aboard the International Space Station (ISS). FSL Soft Matter Dynamics - Hydrodynamics of Wet Foams (Foam Coarsening) aims to study aqueous and non-aqueous foams in the microgravity environment of the ISS.

Giant, bright coronal loops trace out the magnetic field lines above an active region from June 4-6, 2018. The wavelength of extreme ultraviolet light shown here is emitted by ionized iron travelling along the field lines, super-heated to approximately 1 million degrees K. Coronal loops were not seen in this level of detail until the Solar Dynamics Observatory was launched in 2010 and came online, giving solar scientists new data with which to study the Sun and its processes. Videos are available at https://photojournal.jpl.nasa.gov/catalog/PIA22508
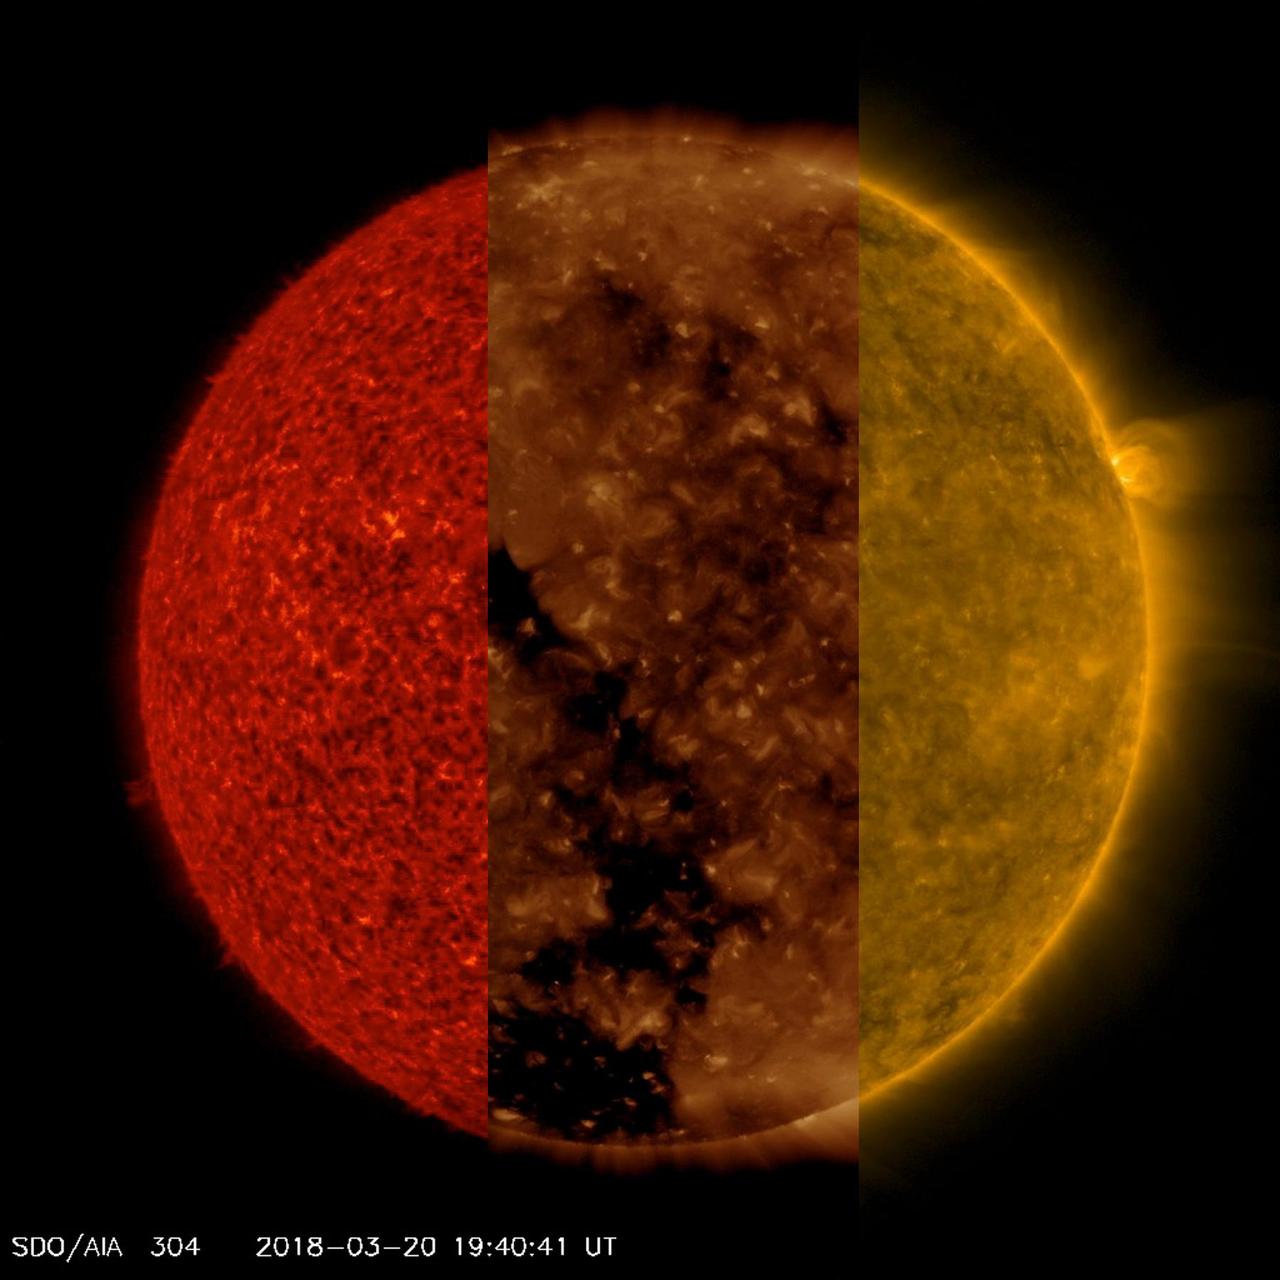
NASA's Solar Dynamics Observatory ran together three sequences of the sun taken in three different extreme ultraviolet wavelengths to better illustrate how different features that appear in one sequence are difficult if not impossible to see in the others (Mar. 20-21, 2018). In the red sequence (304 Angstroms), we can see very small spicules and some small prominences at the sun's edge, which are not easy to see in the other two sequences. In the second clip (193 Angstroms), we can readily observe the large and dark coronal hole, though it is difficult to make out in the others. In the third clip (171 wavelengths), we can see strands of plasma waving above the surface, especially above the one small, but bright, active region near the right edge. And these are just three of the 10 extreme ultraviolet wavelengths in which SDO images the sun every 12 seconds every day. That's a lot of data and a lot of science. Movies are available at https://photojournal.jpl.nasa.gov/catalog/PIA22360
On Sept. 13, 2015, as NASA's Solar Dynamics Observatory, or SDO, kept up its constant watch on the sun, its view was photobombed not once, but twice. Just as the moon came into SDO's field of view on a path to cross the sun, Earth entered the picture, blocking SDO's view completely. When SDO's orbit finally emerged from behind Earth, the moon was just completing its journey across the sun's face. Though SDO sees dozens of Earth eclipses and several lunar transits each year, this is the first time ever that the two have coincided. SDO's orbit usually gives us unobstructed views of the sun, but Earth's revolution around the sun means that SDO's orbit passes behind Earth twice each year, for two to three weeks at a time. During these phases, Earth blocks SDO's view of the sun for anywhere from a few minutes to over an hour once each day. Earth's outline looks fuzzy, while the moon's is crystal-clear. This is because-while the planet itself completely blocks the sun's light-Earth's atmosphere is an incomplete barrier, blocking different amounts of light at different altitudes. However, the moon has no atmosphere, so during the transit we can see the crisp edges of the moon's horizon. http://photojournal.jpl.nasa.gov/catalog/PIA19949
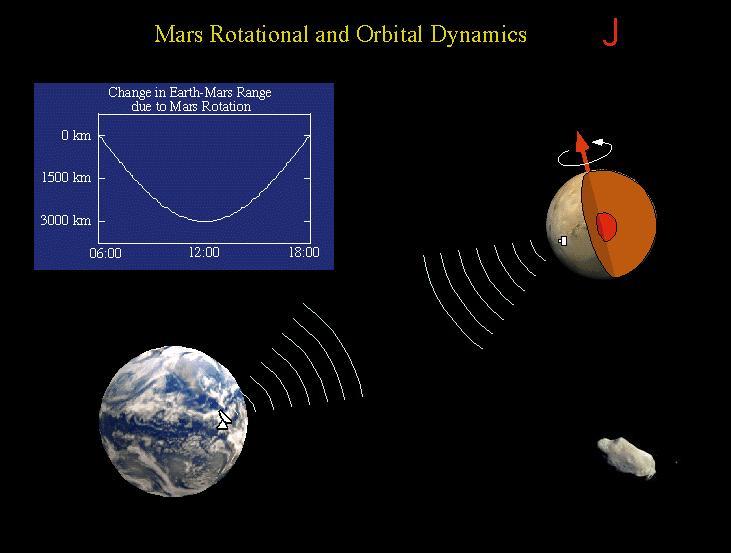
The Rotation and Orbit Dynamics experiment is based on measuring the Doppler range to Pathfinder using the radio link. Mars rotation about it's pole causes a signature in the data with a daily minimum when the lander is closest to the Earth. Changes in the daily signature reveal information about the planetary interior, through its effect on Mars' precession and nutation. The signature also is sensitive to variations in Mars' rotation rate as the mass of the atmosphere increases and decreases as the polar caps are formed in winter and evaporate in spring. Long term signatures in the range to the lander are caused by asteroids perturbing Mars' orbit. Analysis of these perturbations allows the determination of the masses of asteroids. Sojourner spent 83 days of a planned seven-day mission exploring the Martian terrain, acquiring images, and taking chemical, atmospheric and other measurements. The final data transmission received from Pathfinder was at 10:23 UTC on September 27, 1997. Although mission managers tried to restore full communications during the following five months, the successful mission was terminated on March 10, 1998. http://photojournal.jpl.nasa.gov/catalog/PIA00975
The Shuttle Orbiter Enterprise is removed from Marshall Space Flight Center's Dynamic Test Stand following its first Mated Vertical Ground Vibration test (MVGVT). The tests marked the first time ever that the entire shuttle complement (including Orbiter, external tank, and solid rocket boosters) were mated vertically.
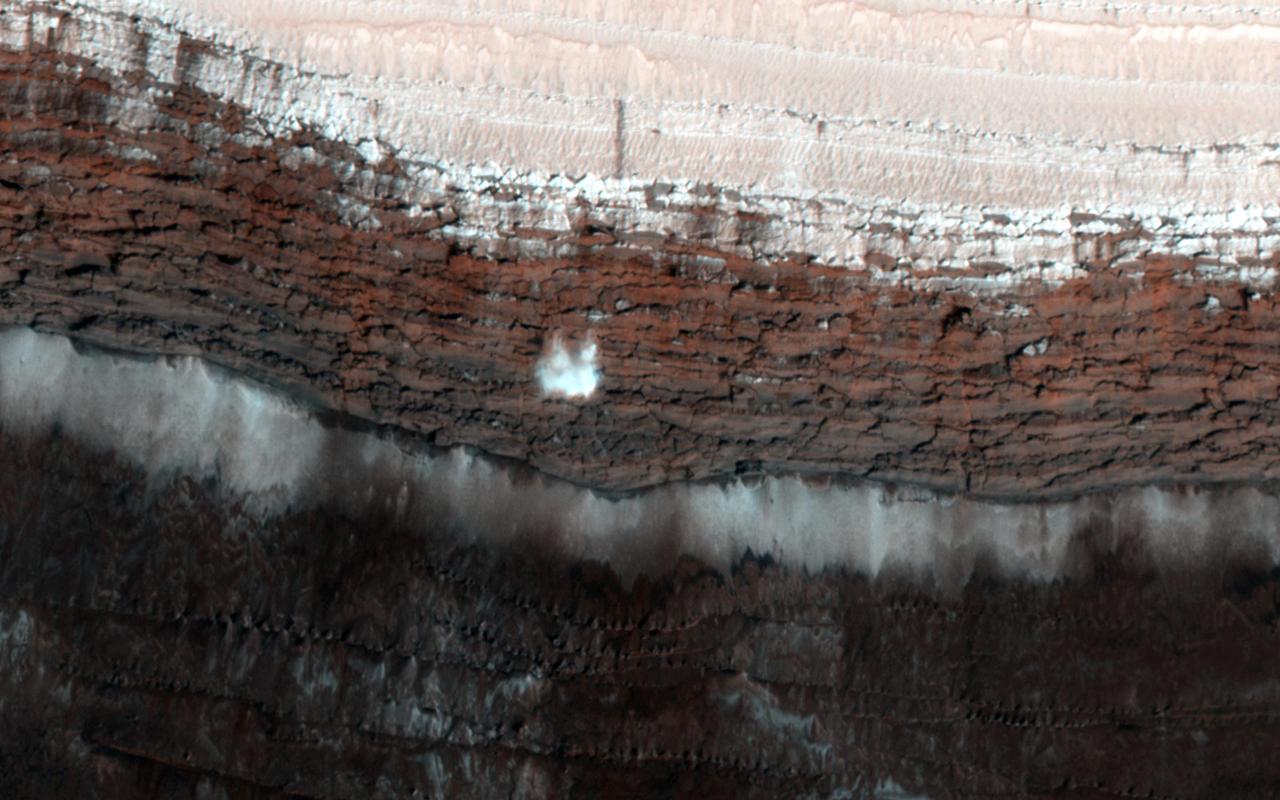
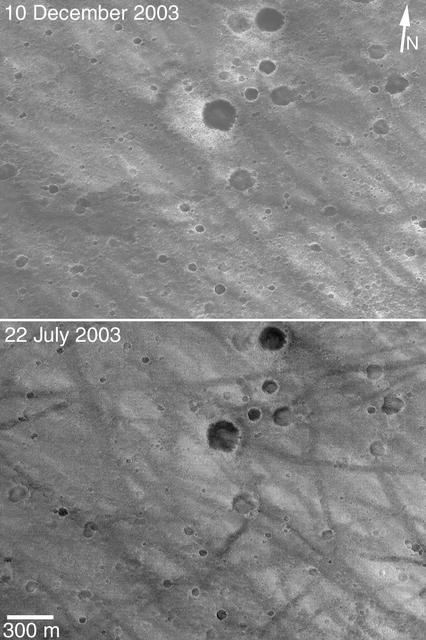
This image from NASA Mars Reconnaissance Orbiter spacecraft shows a channel system flowing to the southwest toward the huge Hellas impact basin. Click on the image for larger version The scarp at the edge of the North Polar layered deposits of Mars is the site of the most frequent frost avalanches seen by HiRISE. At this season, northern spring, frost avalanches are common and HiRISE monitors the scarp to learn more about the timing and frequency of the avalanches, and their relationship to the evolution of frost on the flat ground above and below the scarp. This picture managed to capture a small avalanche in progress, right in the color strip. See if you can spot it in the browse image, and then click on the cutout to see it at full resolution. The small white cloud in front of the brick red cliff is likely carbon dioxide frost dislodged from the layers above, caught in the act of cascading down the cliff. It is larger than it looks, more than 20 meters across, and (based on previous examples) it will likely kick up clouds of dust when it hits the ground. The avalanches tend to take place at a season when the North Polar region is warming, suggesting that the avalanches may be triggered by thermal expansion. The avalanches remind us, along with active sand dunes, dust devils, slope streaks and recurring slope lineae, that Mars is an active and dynamic planet. http://photojournal.jpl.nasa.gov/catalog/PIA19961

Marshall Space Flight Center (MSFC) workers hoist a dynamic test version of the S-IVB stage, the Saturn IB launch vehicle's second stage, into the Center's Dynamic Test Stand on January 18, 1965. MSFC Test Laboratory persornel assembled a complete Saturn IB to test the launch vehicle's structural soundness. Developed by the MSFC as an interim vehicle in MSFC's "building block" approach to the Saturn rocket development, the Saturn IB utilized Saturn I technology to further develop and refine the larger boosters and the Apollo spacecraft capabilities required for the manned lunar missions.
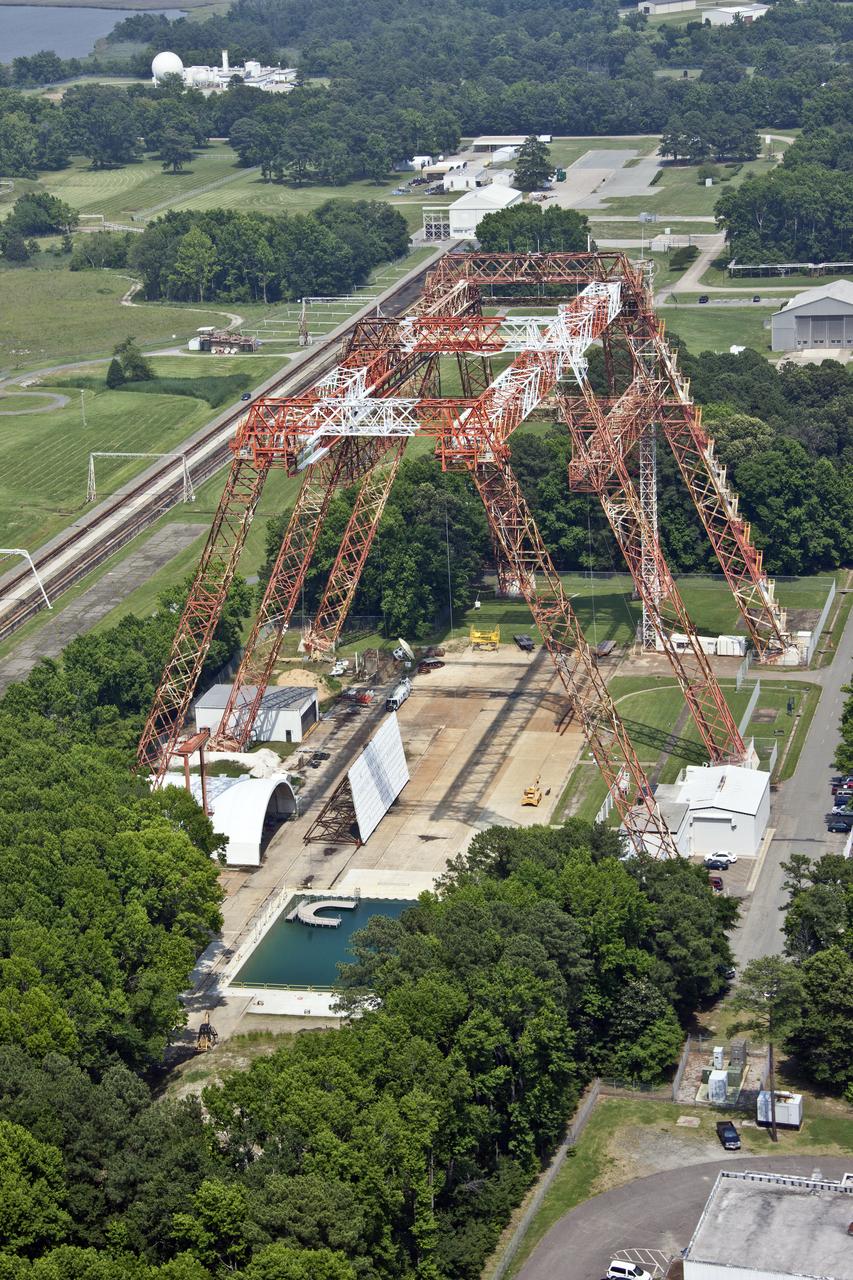
Aerial of NASA Langley's Gantry and slashdown pool also known as Impact Dynamic Faciltiy
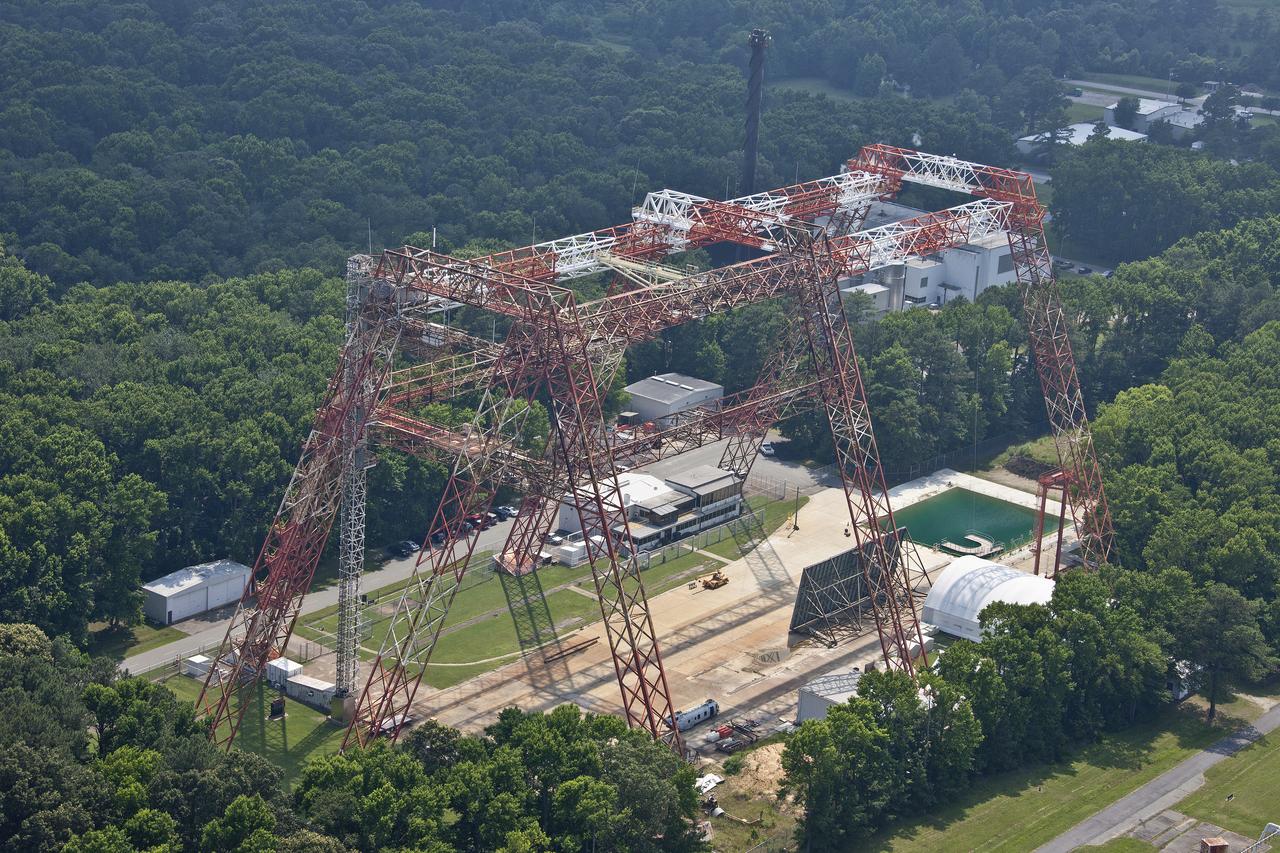
Aerial of NASA Langley's Gantry and slashdown pool also known as Impact Dynamic Faciltiy
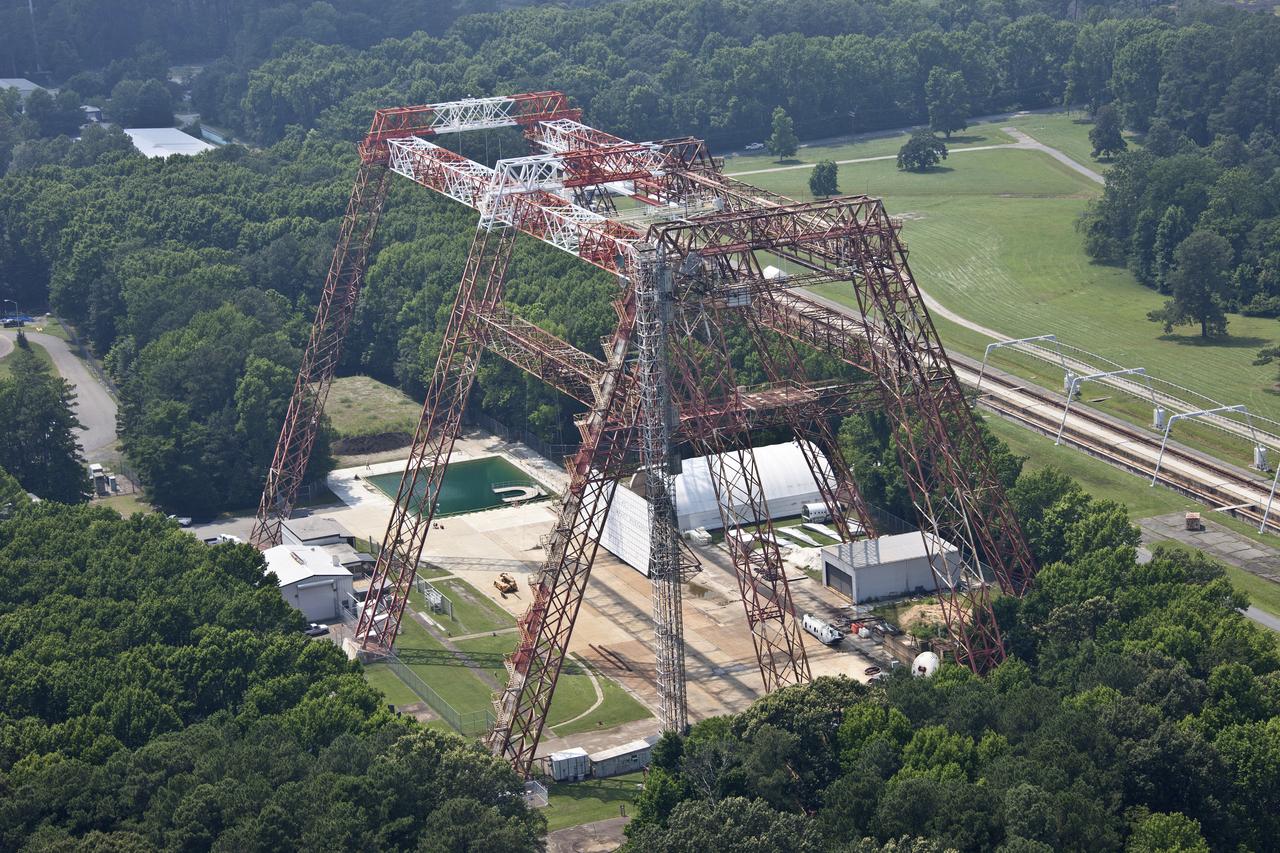
Aerial of NASA Langley's Gantry and slashdown pool also known as Impact Dynamic Faciltiy