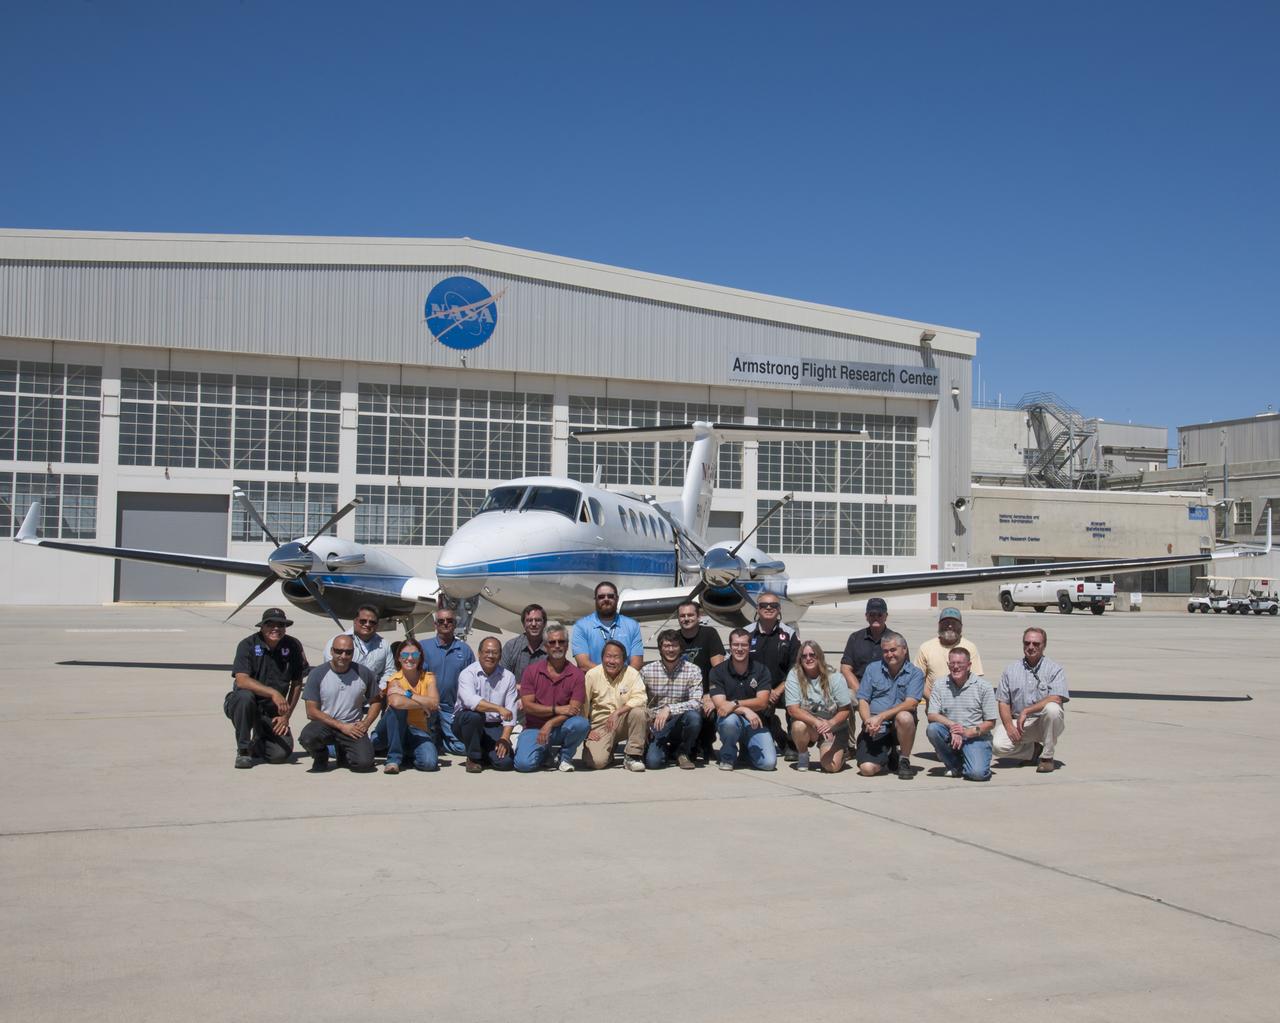
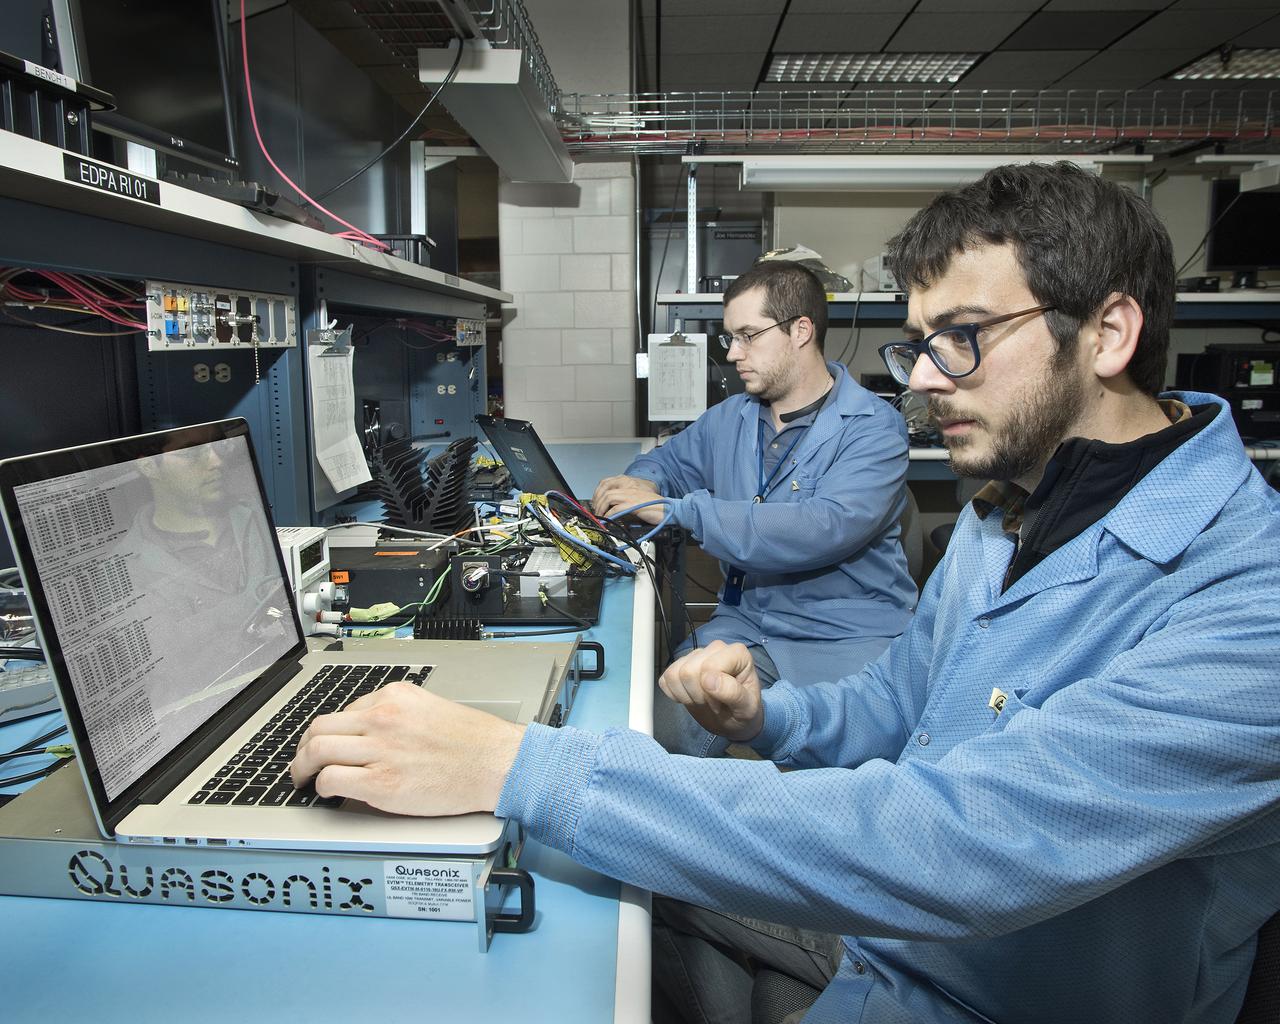
The Advanced Data Acquisition and Telemetry System team includes front row from left Mario Soto, Sam Habbal, Tiffany Titas, RIchard Hang, Randy Torres, Thang Quach, Otto Schnarr, Matthew Waldersen, Karen Estes, Andy Olvera, Stanley Wertenberger and Rick Cordes. In the second row from left are John Atherly, Doug Boston, Tom Horn, Brady Rennie, Chris Birkinbine, Jim McNally, Martin Munday and Tony Lorek.
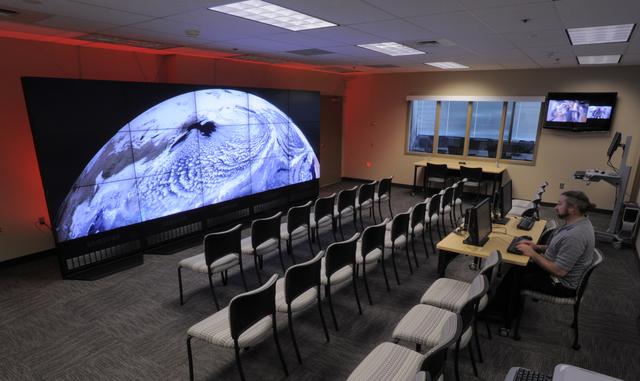
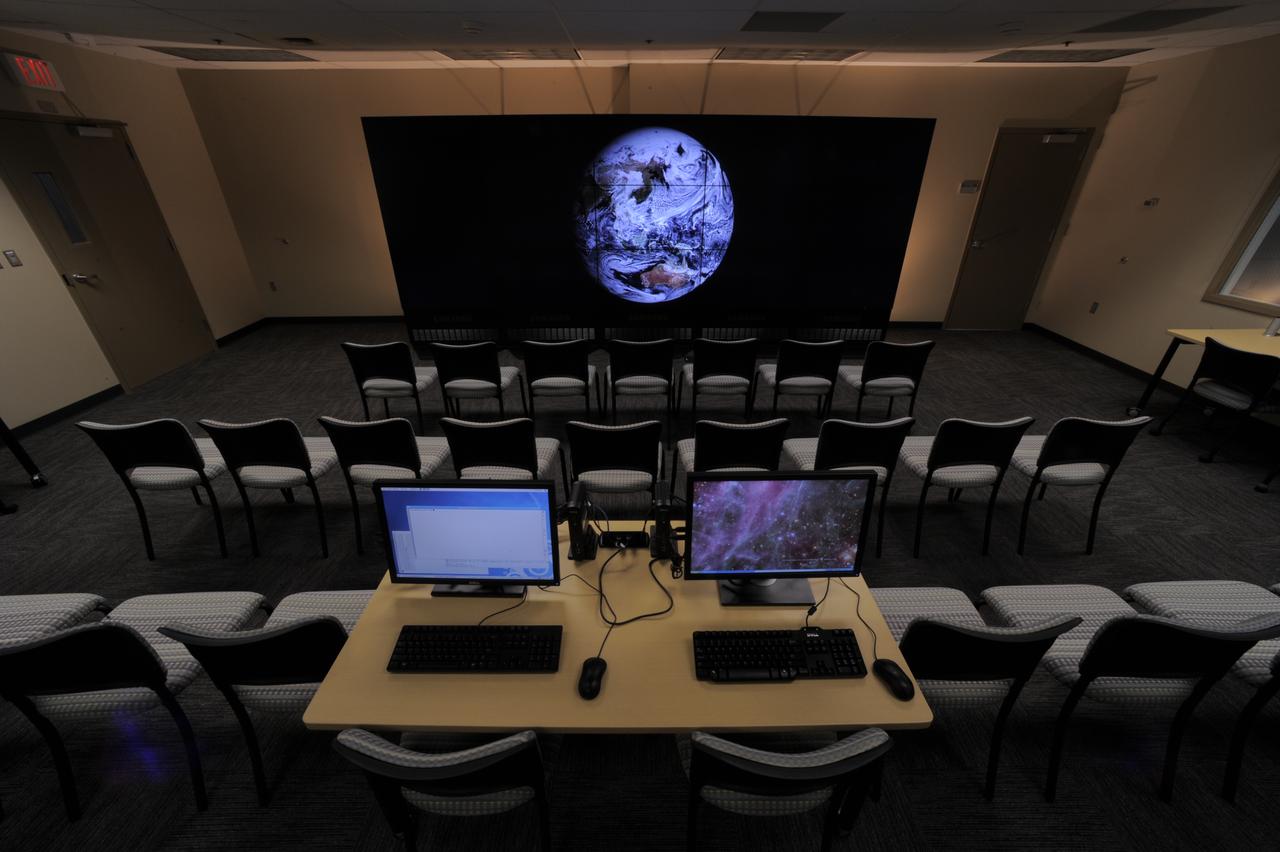
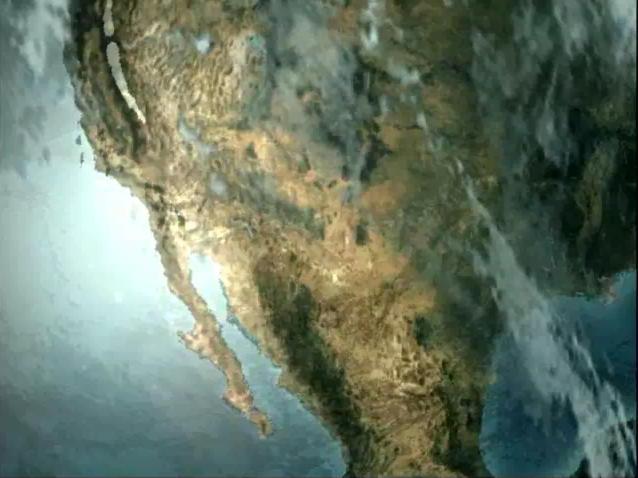
The NASA Center for Climate Simulation (NCCS) Data Exploration Theater features a 17- by 6-foot multi-screen visualization wall for engaging visitors and scientists with high-definition movies of simulation results. Here, the wall displays a 3.5-kilometer-resolution global simulation that captures numerous cloud types at groundbreaking fidelity. Credit: NASA/Pat Izzo To learn more about NCCS go to: <a href="http://www.nasa.gov/topics/earth/features/climate-sim-center.html" rel="nofollow">www.nasa.gov/topics/earth/features/climate-sim-center.html</a> NASA Goddard Space Flight Center is home to the nation's largest organization of combined scientists, engineers and technologists that build spacecraft, instruments and new technology to study the Earth, the sun, our solar system, and the universe.
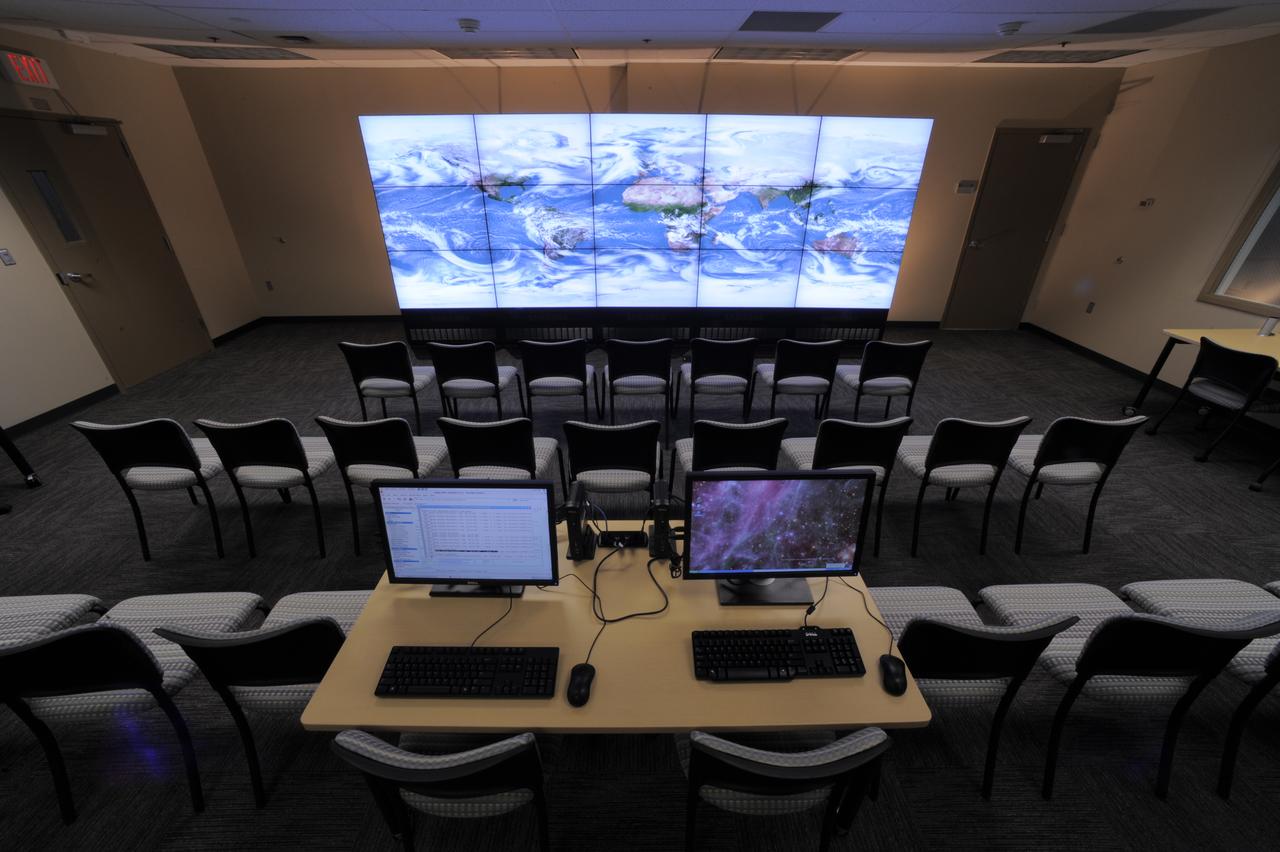
The NASA Center for Climate Simulation (NCCS) Data Exploration Theater features a 17- by 6-foot multi-screen visualization wall for engaging visitors and scientists with high-definition movies of simulation results. Here, the wall displays a 5-kilometer-resolution global simulation that captures numerous cloud types at groundbreaking fidelity. Credit: NASA/Pat Izzo To learn more about NCCS go to: <a href="http://www.nasa.gov/topics/earth/features/climate-sim-center.html" rel="nofollow">www.nasa.gov/topics/earth/features/climate-sim-center.html</a> NASA Goddard Space Flight Center is home to the nation's largest organization of combined scientists, engineers and technologists that build spacecraft, instruments and new technology to study the Earth, the sun, our solar system, and the universe.
The NASA Center for Climate Simulation (NCCS) Data Exploration Theater features a 17- by 6-foot multi-screen visualization wall for engaging visitors and scientists with high-definition movies of simulation results. Here, the wall displays a 3.5-kilometer-resolution global simulation that captures numerous cloud types at groundbreaking fidelity. Credit: NASA/Pat Izzo To learn more about NCCS go to: <a href="http://www.nasa.gov/topics/earth/features/climate-sim-center.html" rel="nofollow">www.nasa.gov/topics/earth/features/climate-sim-center.html</a> NASA Goddard Space Flight Center is home to the nation's largest organization of combined scientists, engineers and technologists that build spacecraft, instruments and new technology to study the Earth, the sun, our solar system, and the universe.
The NASA Center for Climate Simulation (NCCS) Data Exploration Theater features a 17- by 6-foot multi-screen visualization wall for engaging visitors and scientists with high-definition movies of simulation results. Here, the wall displays a 5-kilometer-resolution global simulation that captures numerous cloud types at groundbreaking fidelity. Credit: NASA/Pat Izzo To learn more about NCCS go to: <a href="http://www.nasa.gov/topics/earth/features/climate-sim-center.html" rel="nofollow">www.nasa.gov/topics/earth/features/climate-sim-center.html</a> NASA Goddard Space Flight Center is home to the nation's largest organization of combined scientists, engineers and technologists that build spacecraft, instruments and new technology to study the Earth, the sun, our solar system, and the universe.

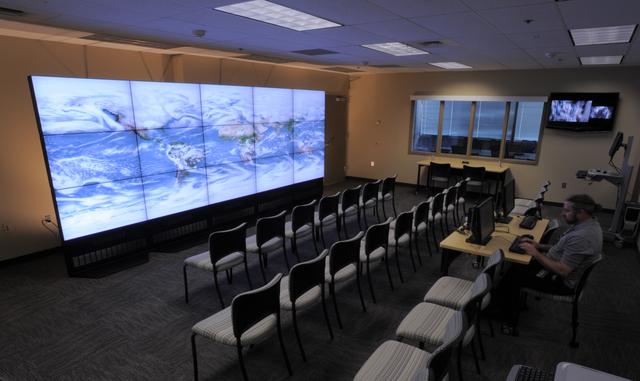
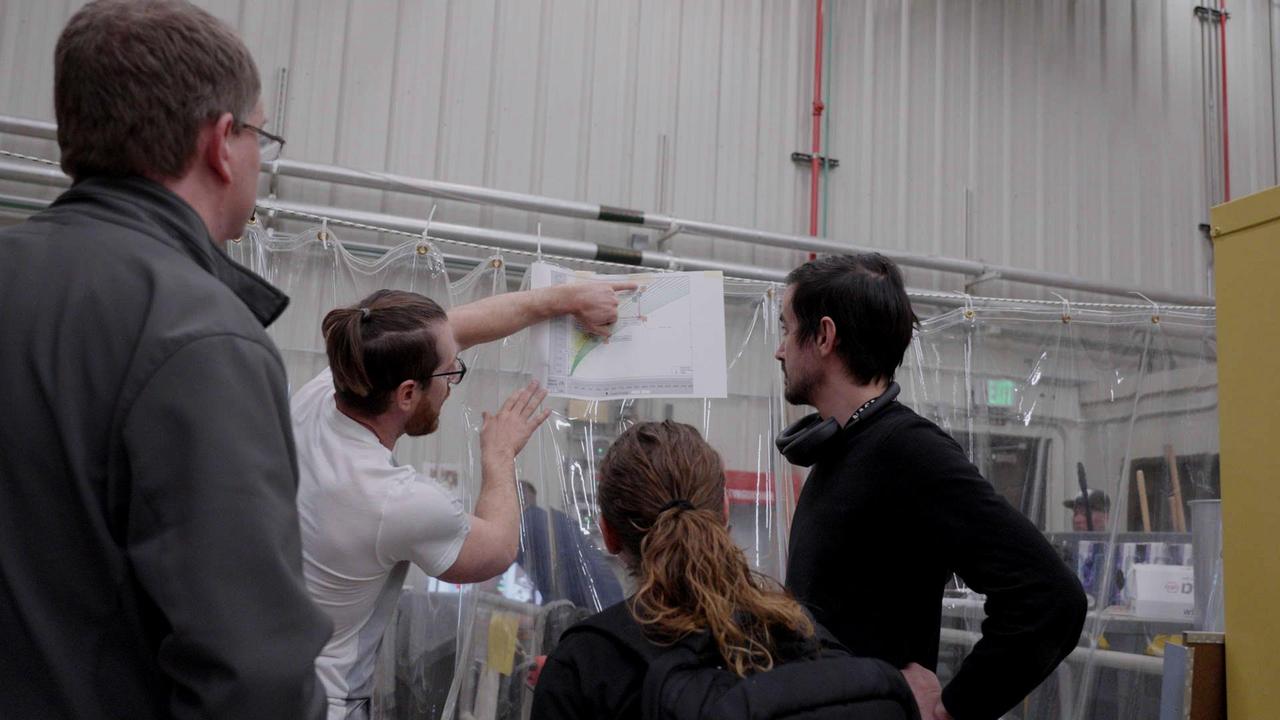
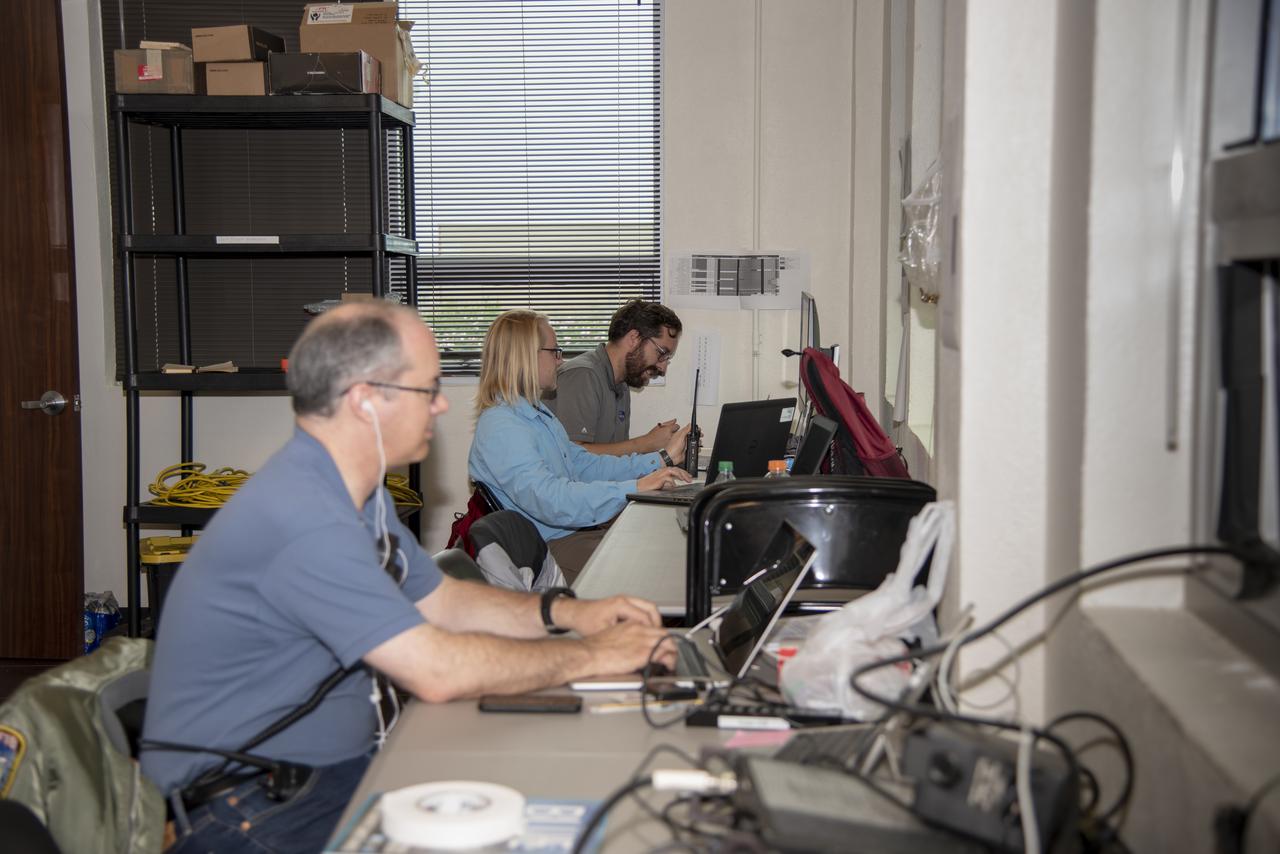
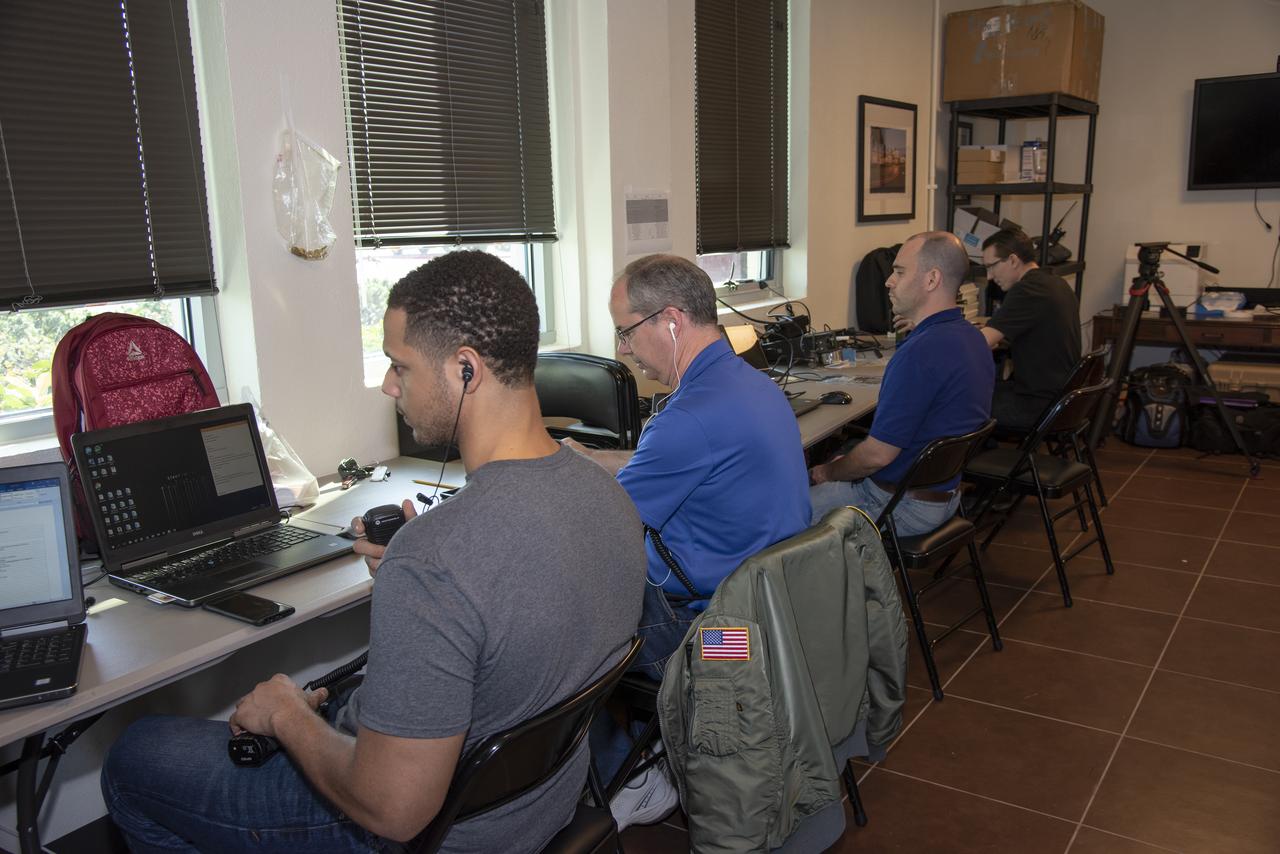
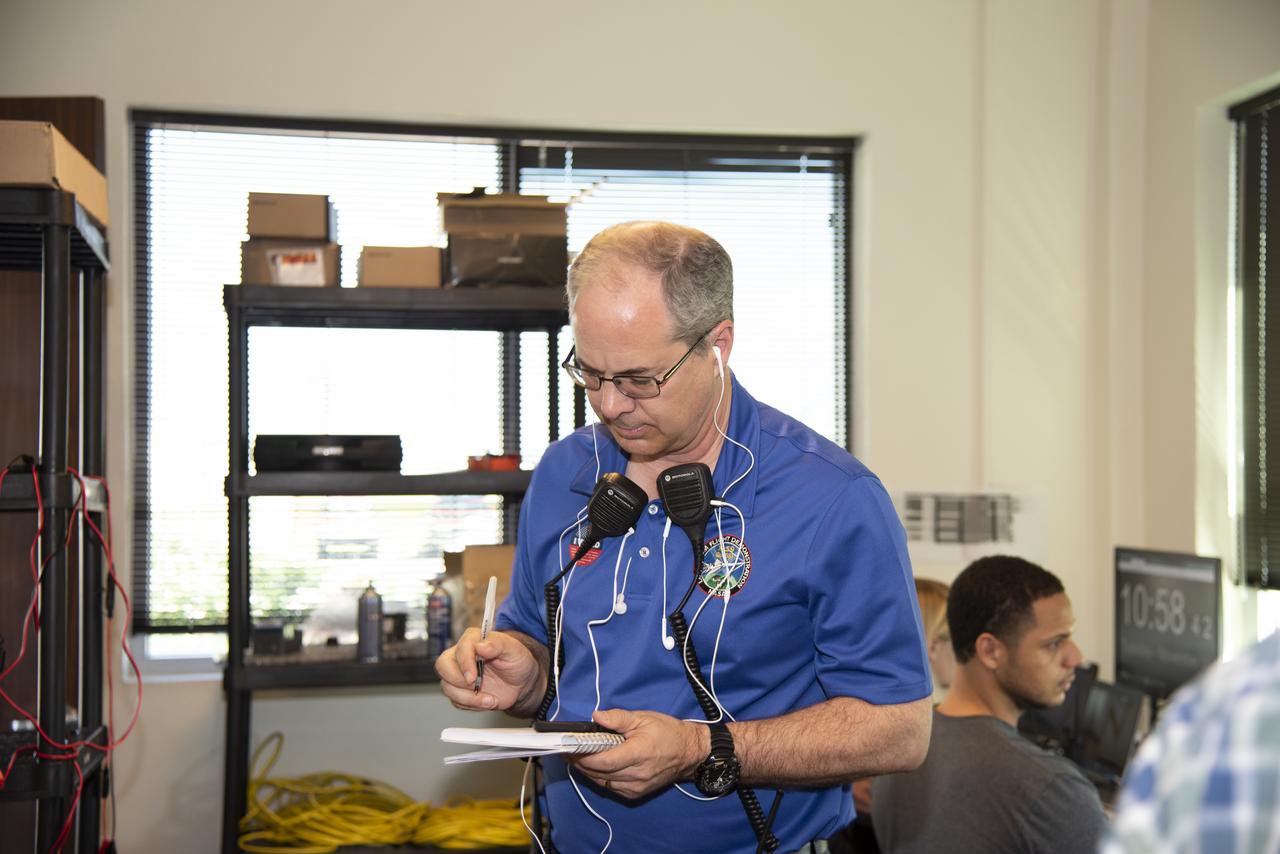
Otto Schnarr and Matthew Waldersen check out the Advanced Data Acquisition and Telemetry System in an Armstrong laboratory.
Otto Schnarr, front, and Matthew Waldersen check out the Advanced Data Acquisition and Telemetry System in an Armstrong laboratory.
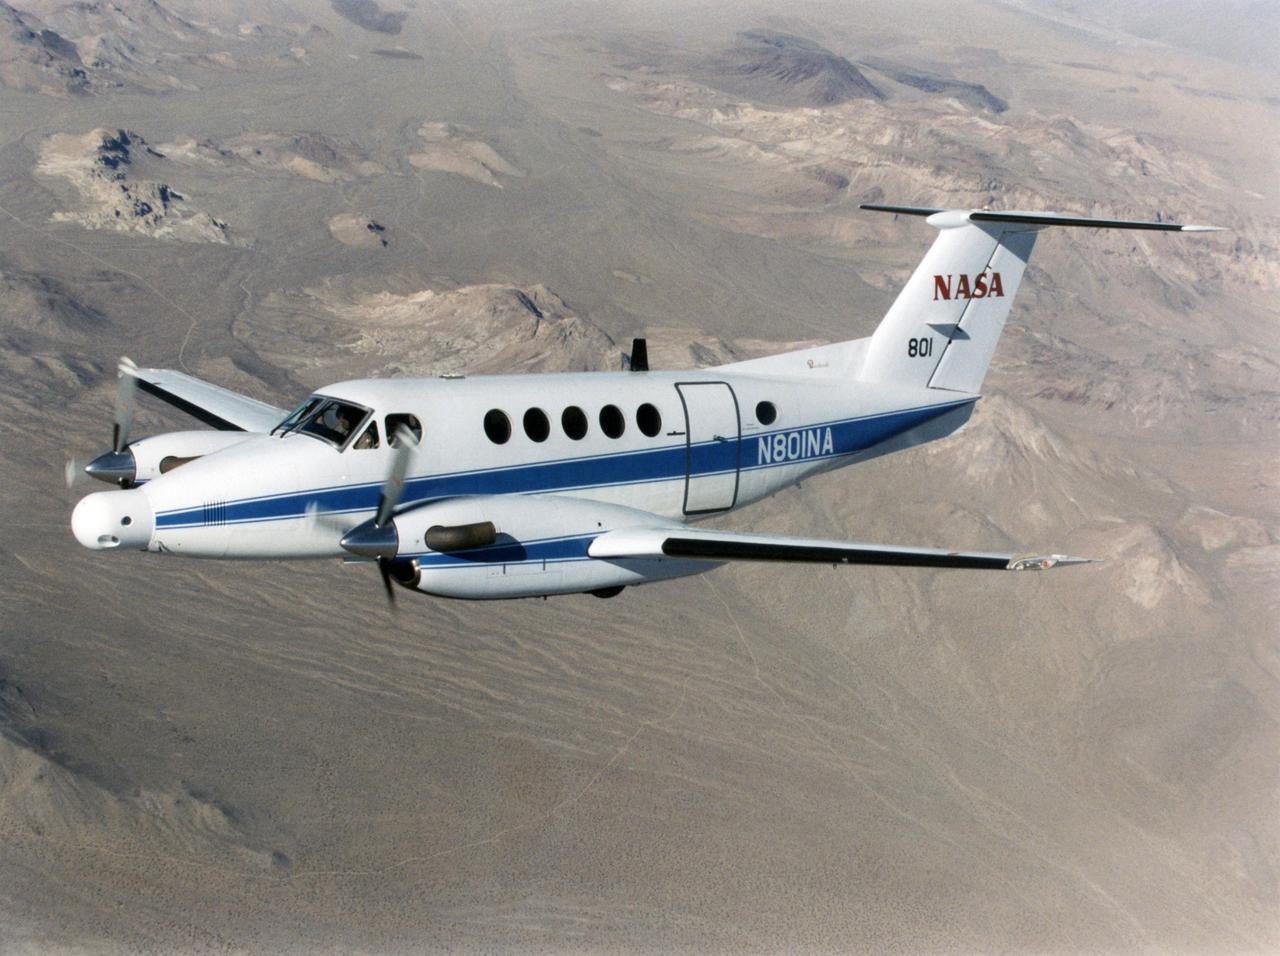
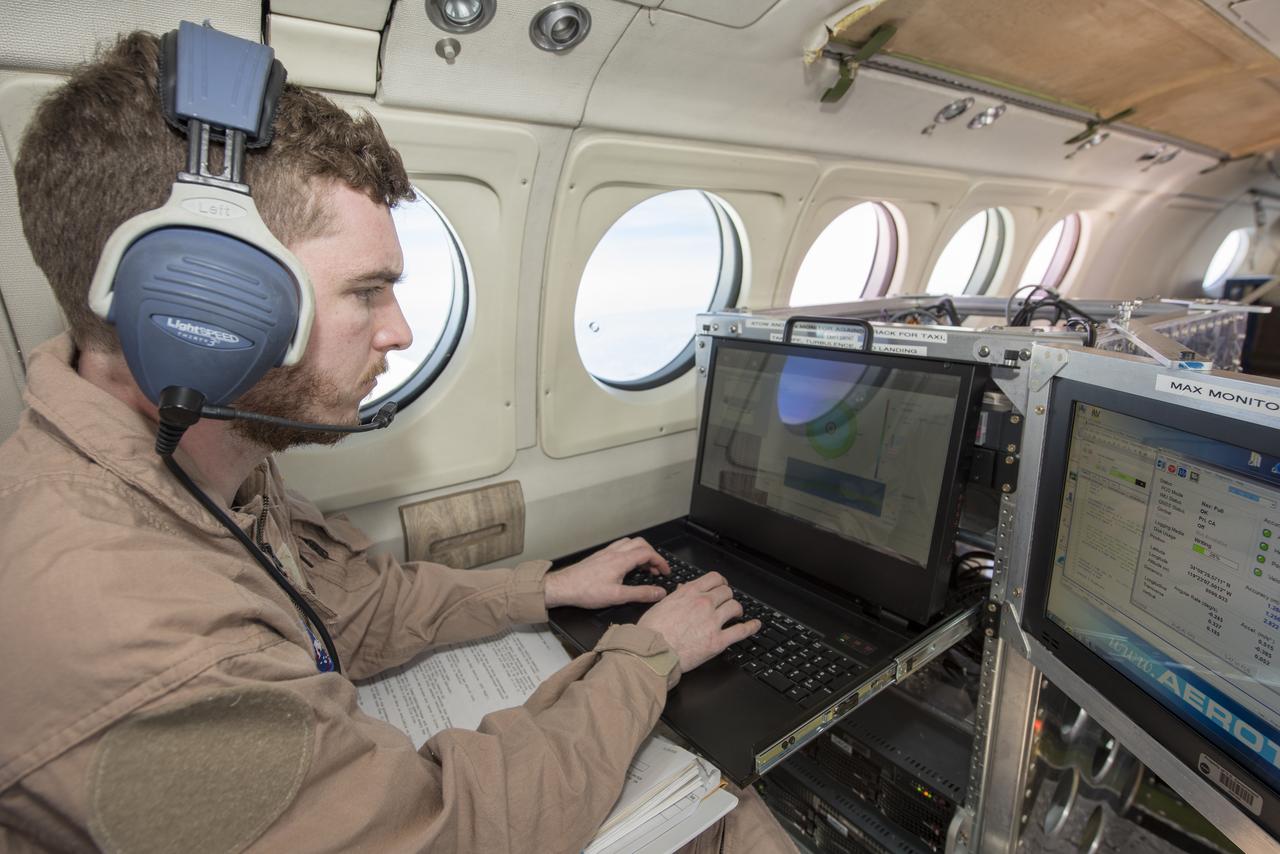
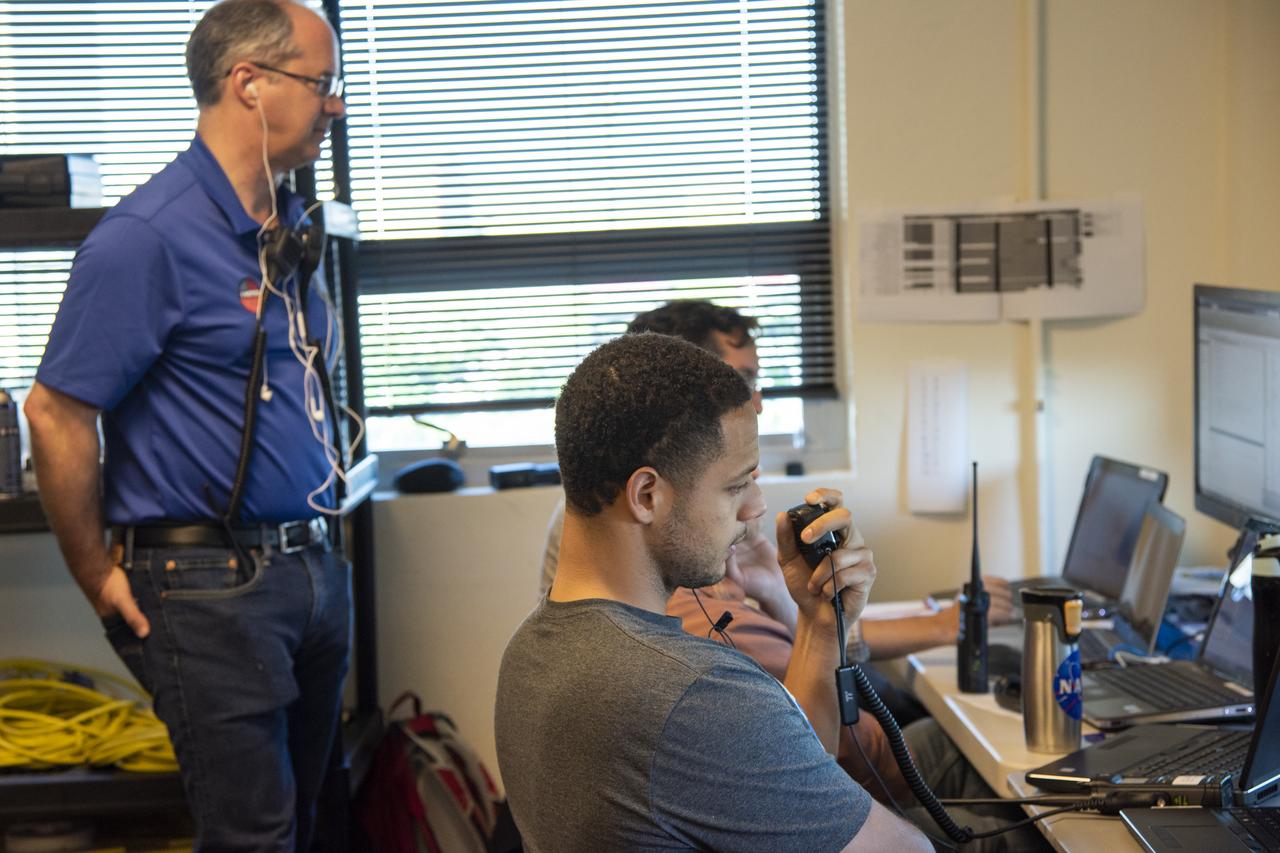
A NASA King Air successfully tested the Advanced Data Acquisition and Telemetry System during a recent series of three research flights.
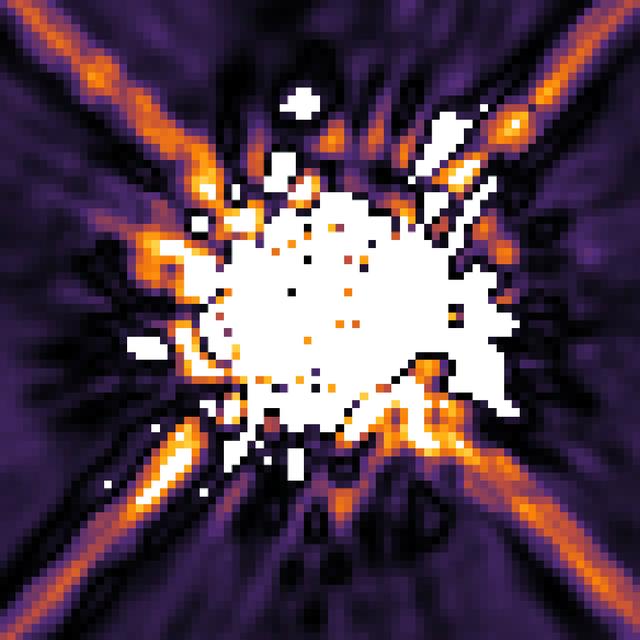
Stellar Data on Plume
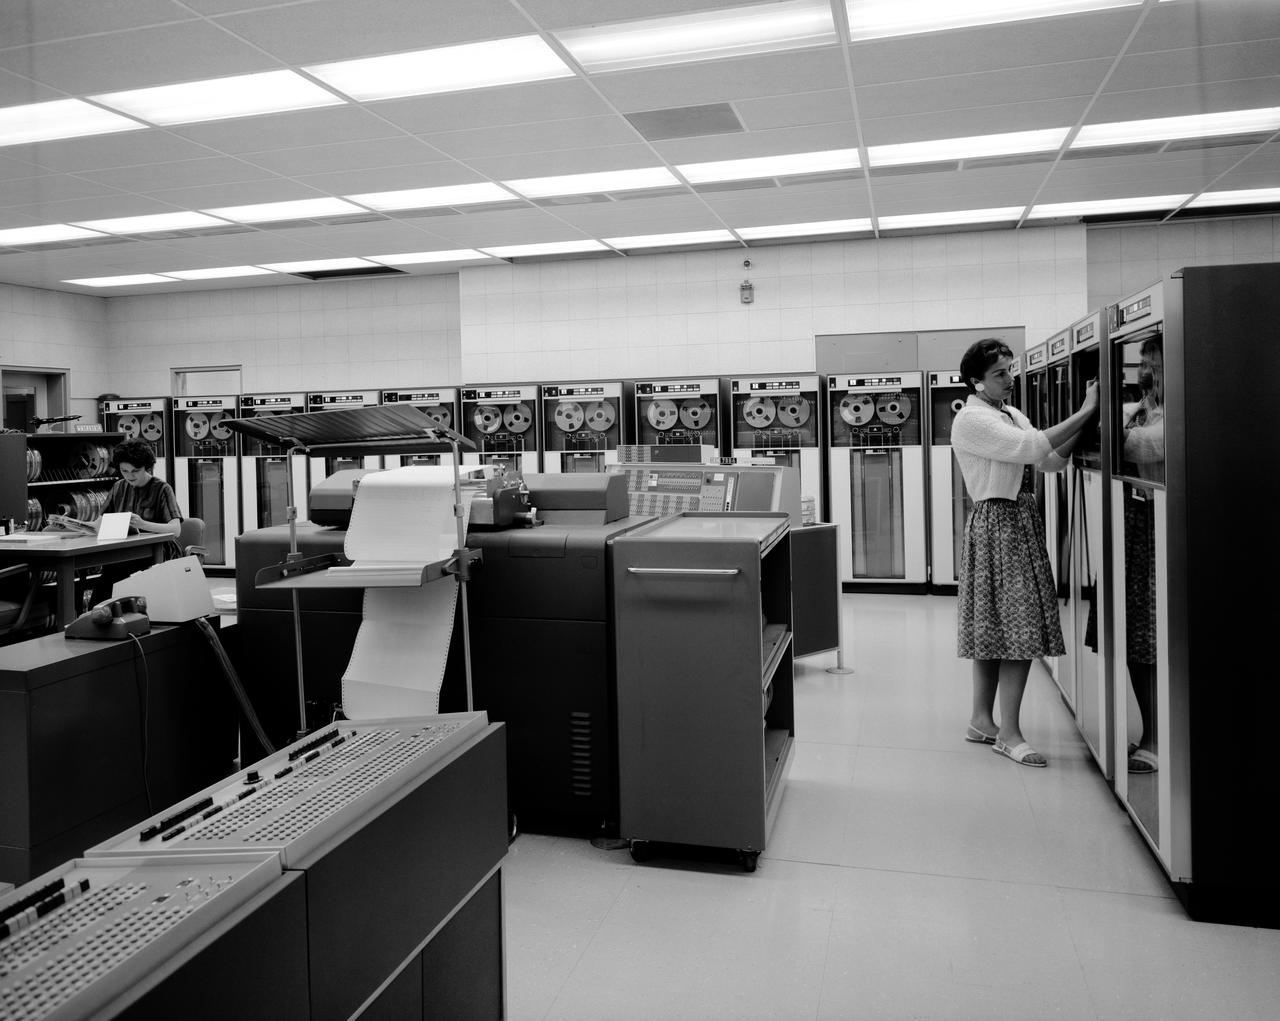
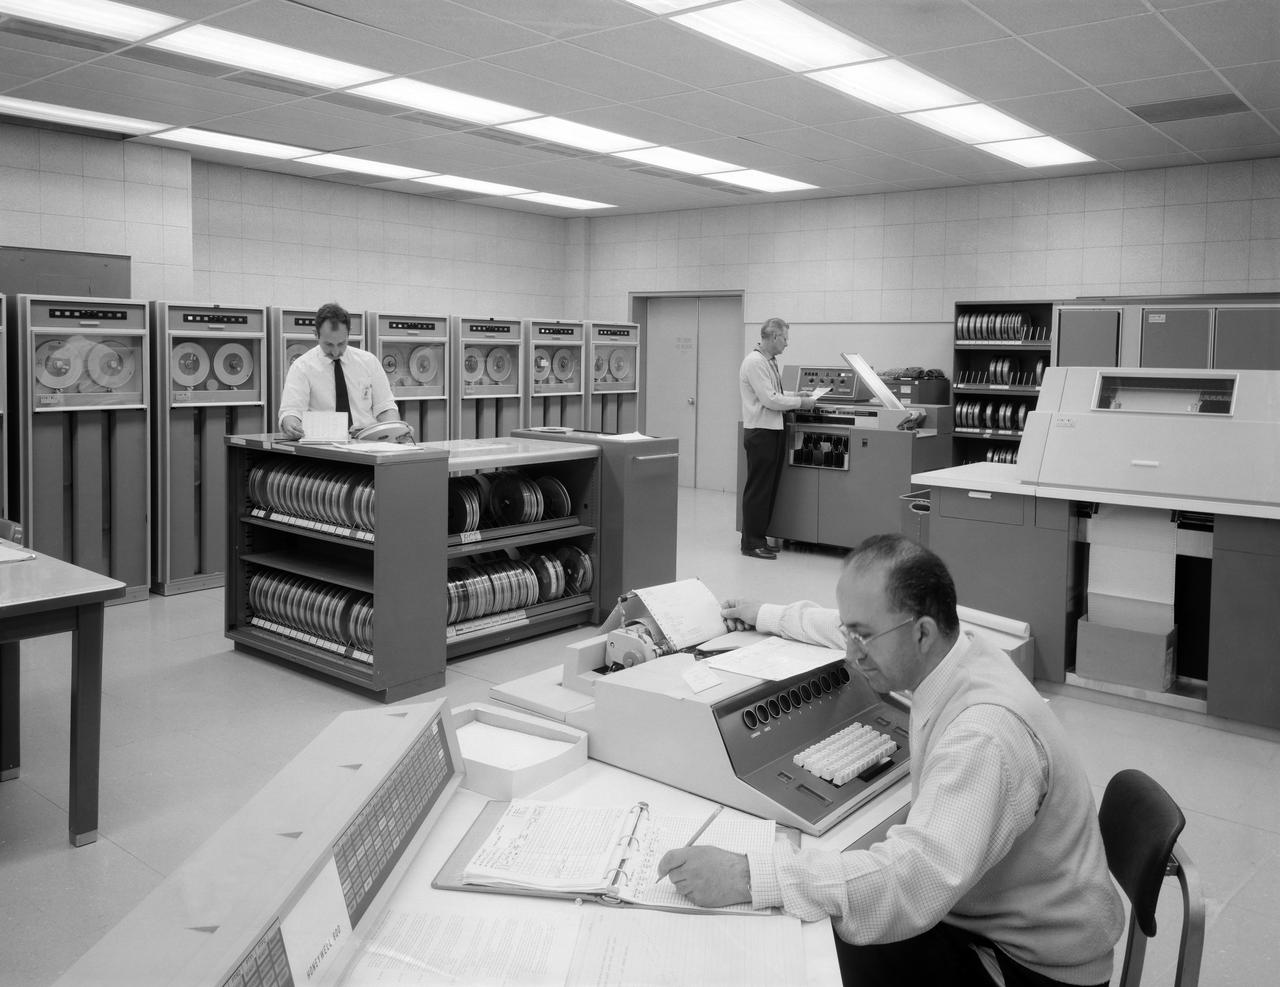
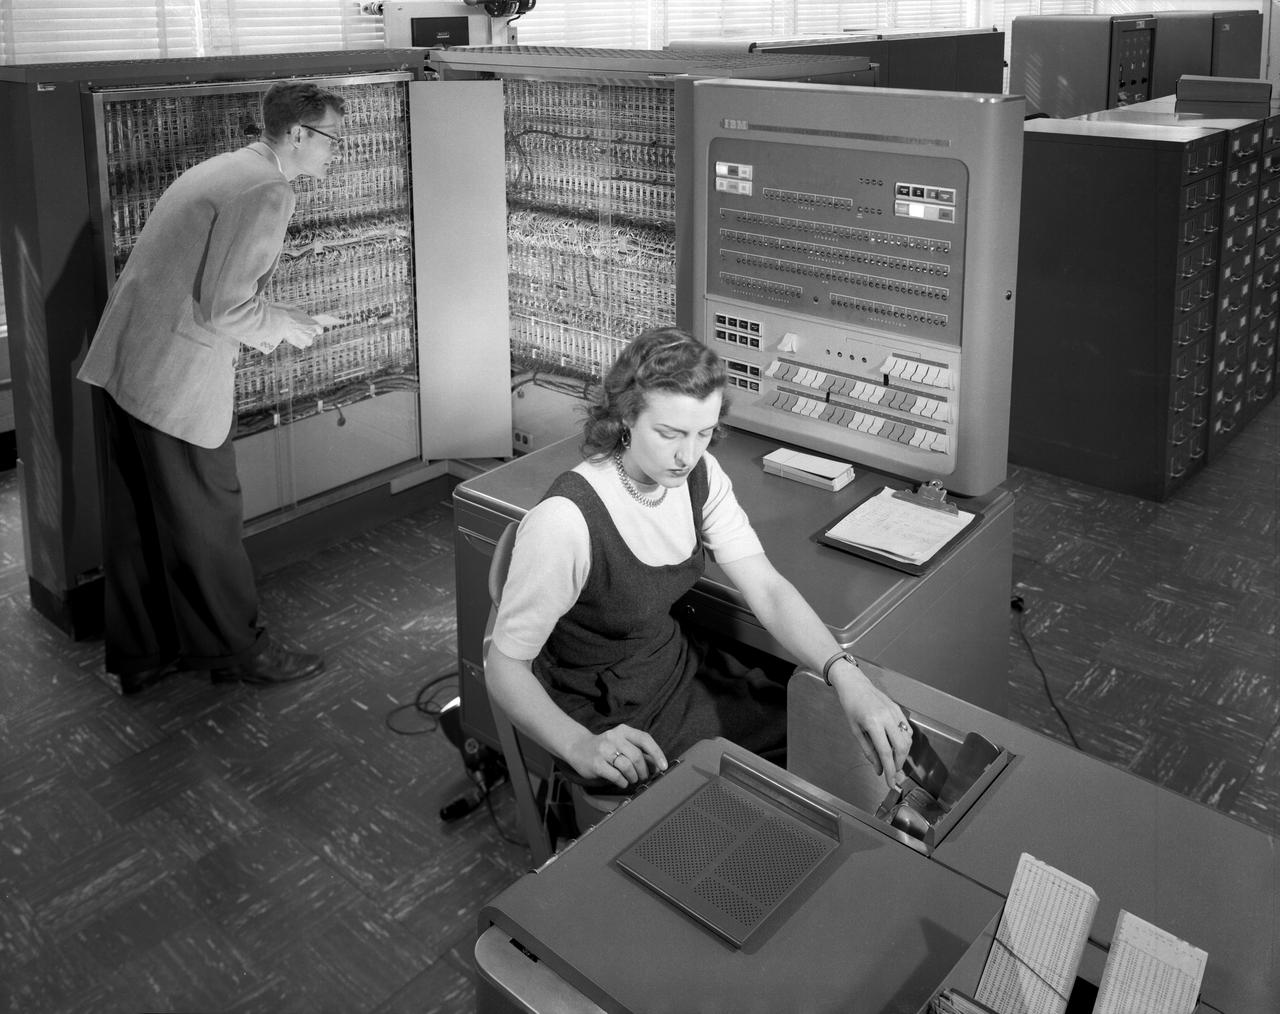
IBM 1401 Data Processing System, at NASA's Ames Research Center.
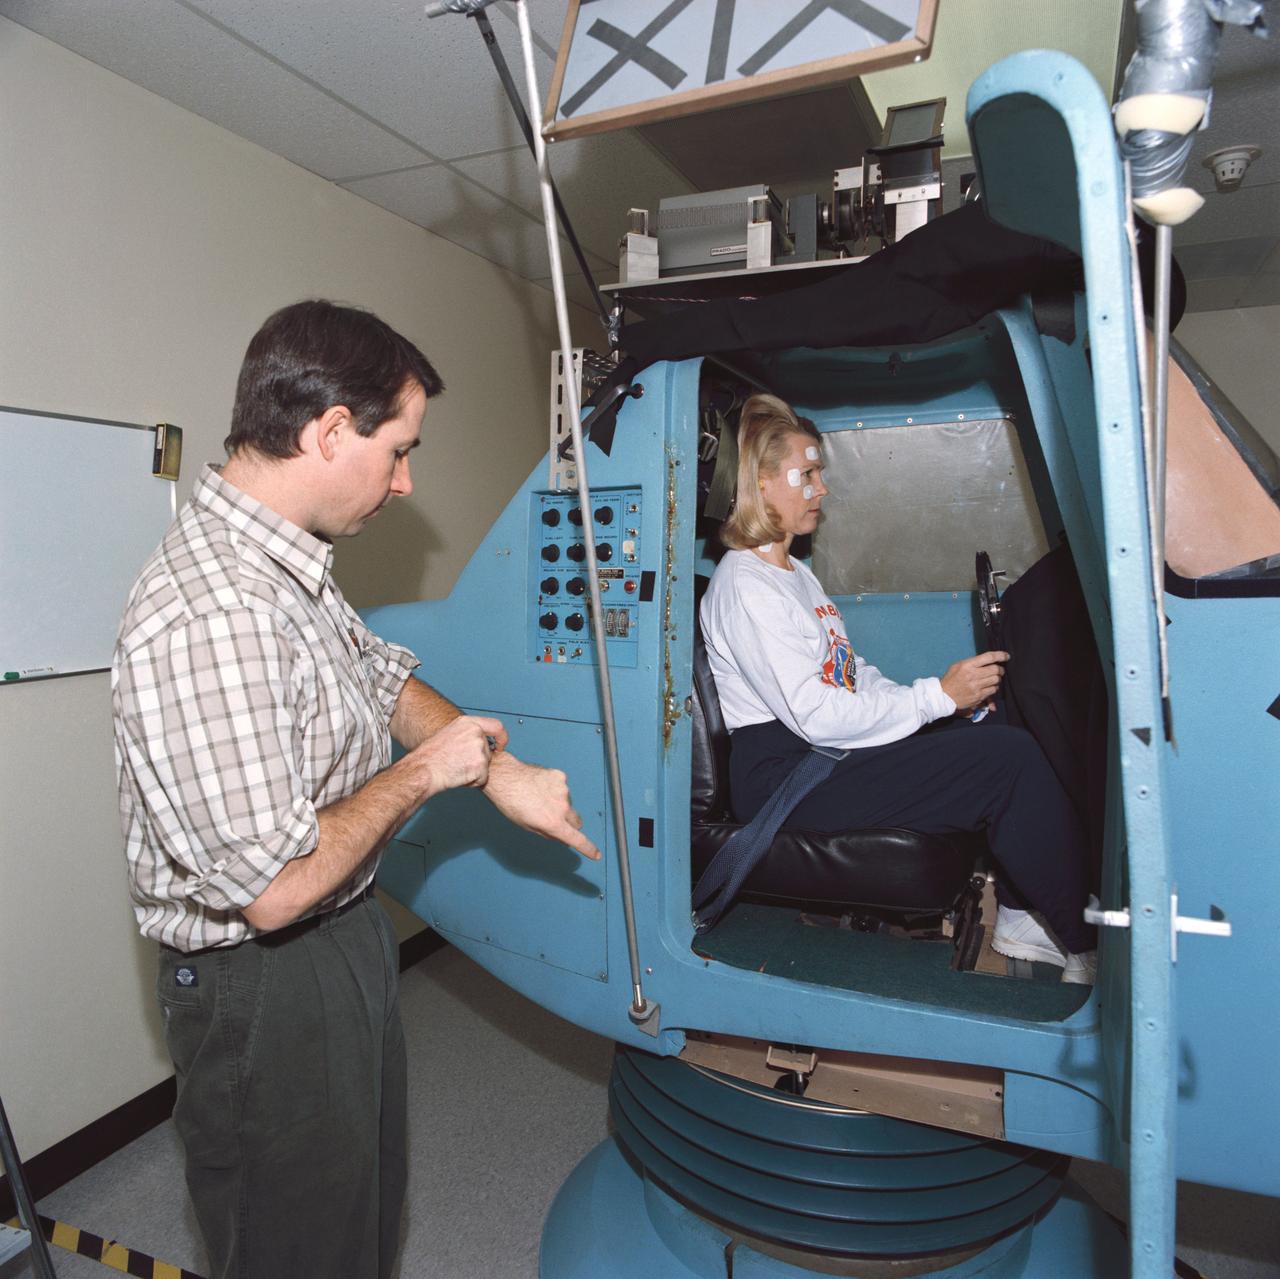
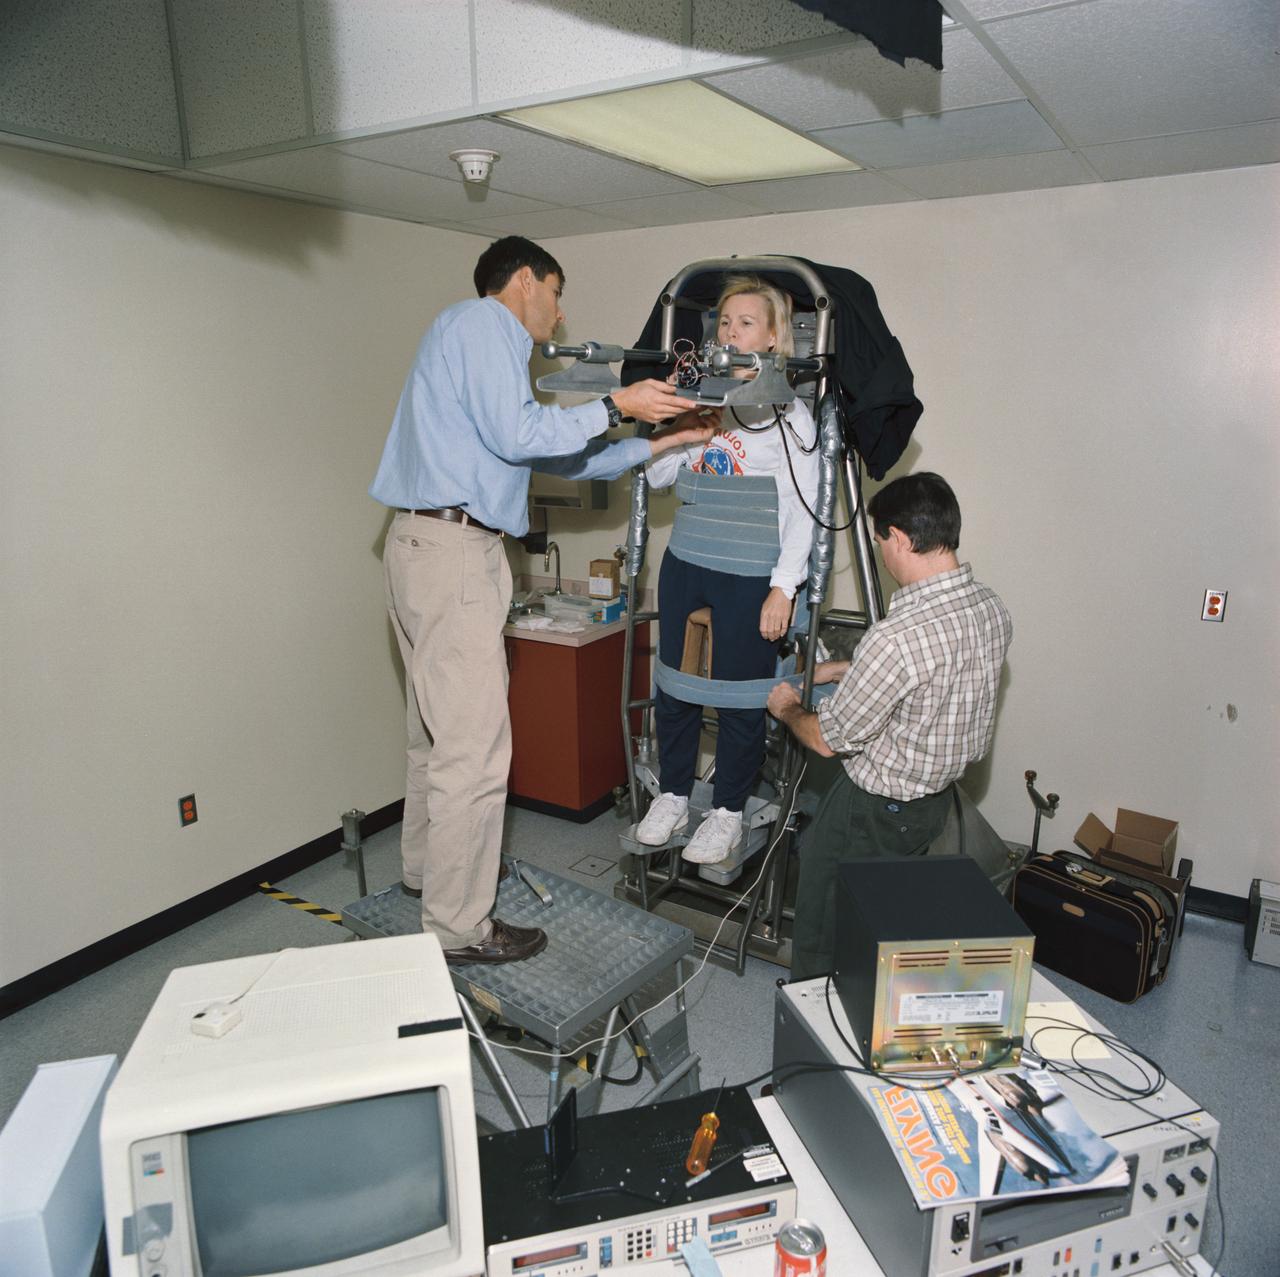
S93-45373 (29 Sept 1993) --- Astronaut Rhea Seddon, STS-58 payload commander, is in a piloting simulator as part of a pre-flight data collection project for neurovestibular functions. The seven Spacelab Life Sciences (SLS-2) crew members devoted a full day to miscellaneous biomedical data collection in preparation for next month's two week mission aboard Columbia.
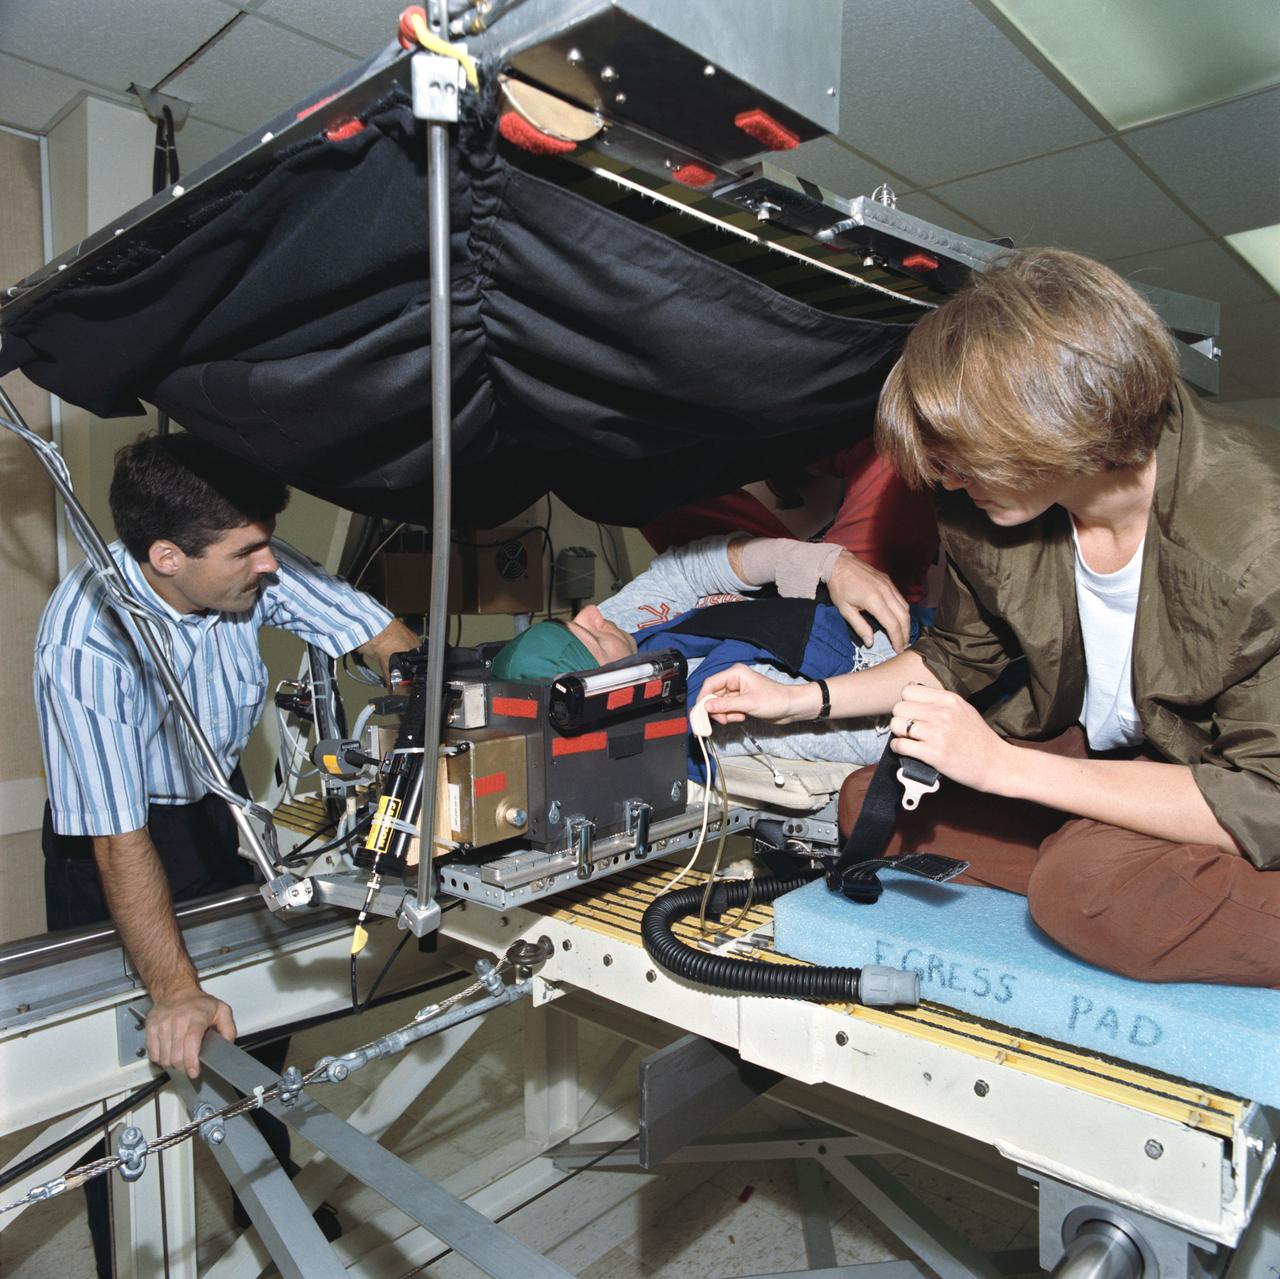
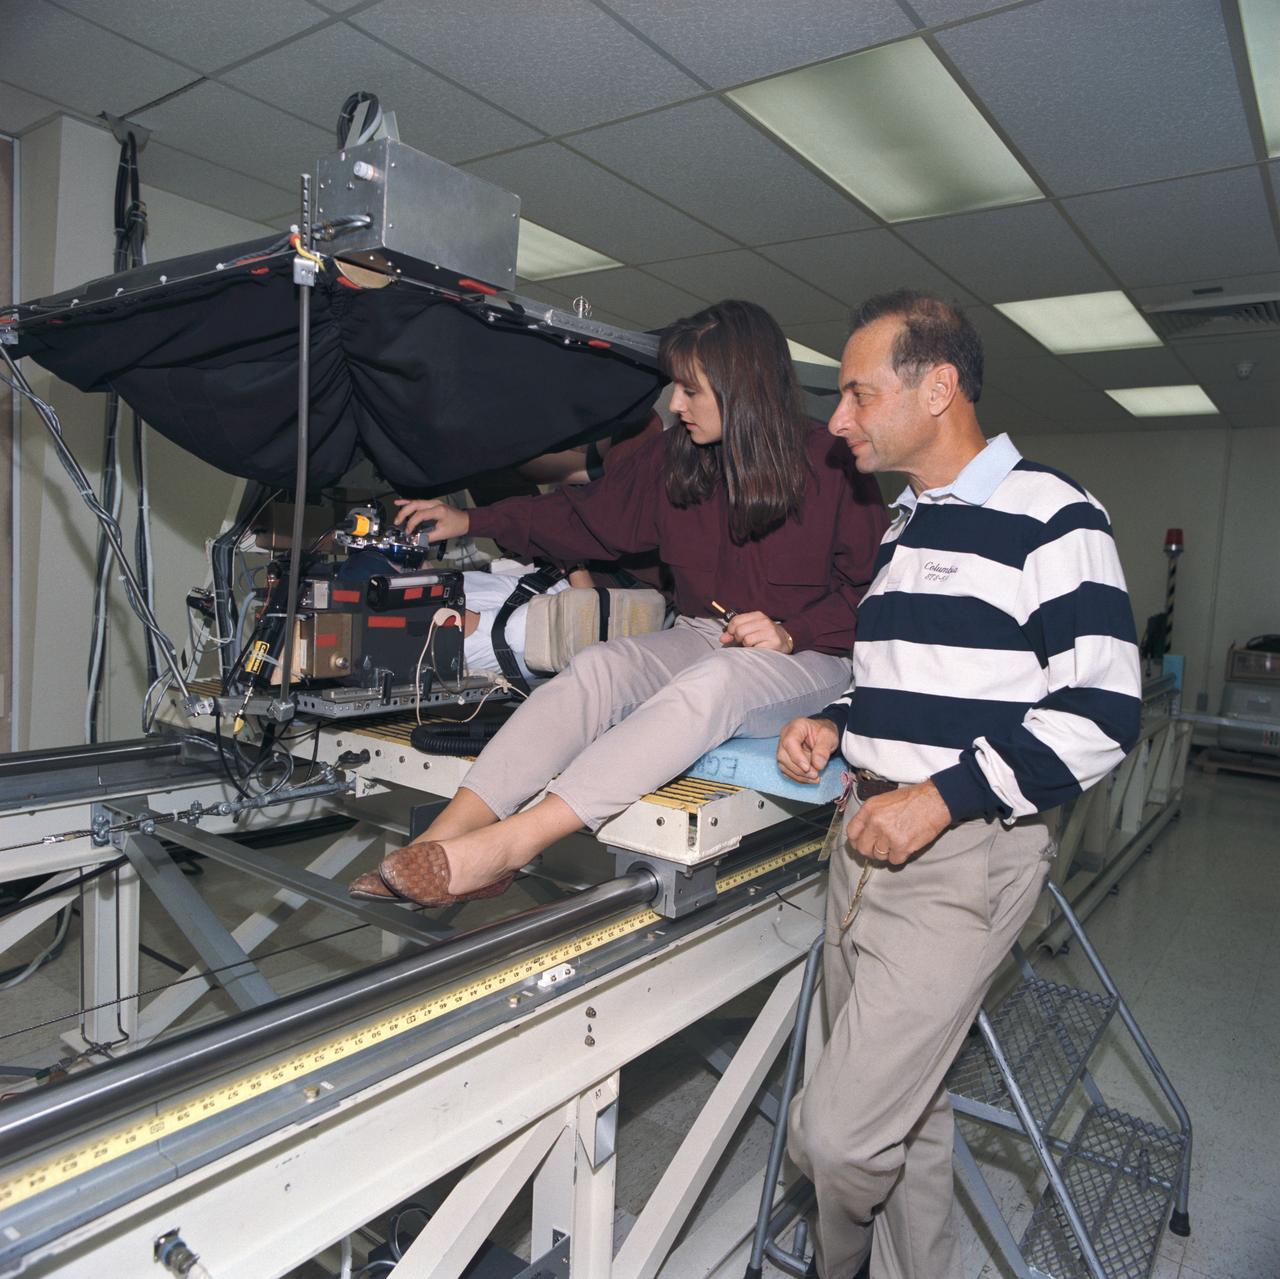
S93-45363 (29 Sept 1993) --- Payload specialist Martin J. Fettman, in an oscillating sled device, participates in a data collection project for neurovestibular functions. The seven Spacelab Life Sciences (SLS-2) crewmembers devoted a full day to miscellaneous biomedical data collection in preparation for next month's two week mission aboard Columbia.
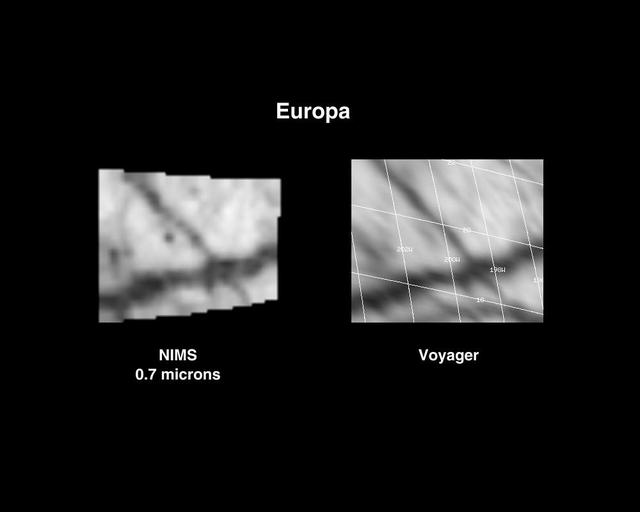
Europa 6th Orbit NIMS Data
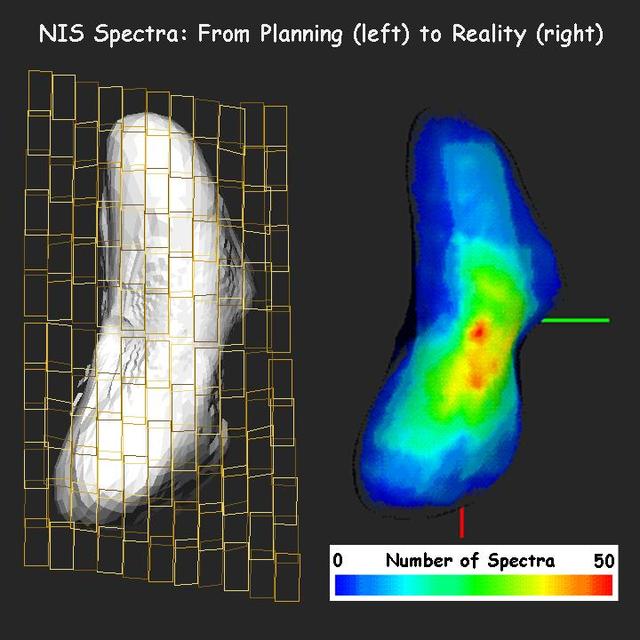
NEAR: From Planning to Data Analysis
Equipment: Data Processing and Data Reduction at the NASA Ames Research Center, EMC. IBM 7090 Data Processing System.
IBM 1401 Data Processing System at NASA Ames Research Center.

The greens and blues of the ocean color from NASA satellite data have provided new insights into how climate and ecosystem processes affect the growth cycles of phytoplankton—microscopic aquatic plants important for fish populations and Earth’s carbon cycle. At the bottom of the ocean’s food chain, phytoplankton account for roughly half of the net photosynthesis on Earth. Their photosynthesis consumes carbon dioxide and plays a key role in transferring carbon from the atmosphere to the ocean. Unlike the plant ecosystems on land, the amount of phytoplankton in the ocean is always followed closely by the abundance of organisms that eat phytoplankton, creating a perpetual dance between predators and prey. This new analysis shows how tiny imbalances in this predator-prey relationship, caused by environmental variability, give rise to massive phytoplankton blooms, having huge impacts on ocean productivity, fisheries and carbon cycling. The study was released Thursday, Sept. 25, in the journal Nature Climate Change. “The continuous year-in and year-out measurements provided by NASA’s ocean color satellites have dramatically changed our understanding of phytoplankton dynamics on the Earth,” said Mike Behrenfeld, author of the study and phytoplankton ecologist at Oregon State University, Corvallis, Oregon. “What we now see is a closely linked system of phytoplankton cell division and consumption lying at the heart of the plant’s annual cycle.” Behrenfeld calls this close predator-prey relationship the “Dance of the Plankton.” This view is different from previous perspectives that have simply focused on environmental resources used by phytoplankton to grow, such as nutrients and light. The new view is important because it reveals that tiny imbalances can greatly impact Earth’s ecology. Read more: <a href="http://1.usa.gov/ZkVMHG" rel="nofollow">1.usa.gov/ZkVMHG</a> Credit: NASA's Goddard Space Flight Center, Norman Kuring; USGS <b><a href="http://www.nasa.gov/audience/formedia/features/MP_Photo_Guidelines.html" rel="nofollow">NASA image use policy.</a></b> <b><a href="http://www.nasa.gov/centers/goddard/home/index.html" rel="nofollow">NASA Goddard Space Flight Center</a></b> enables NASA’s mission through four scientific endeavors: Earth Science, Heliophysics, Solar System Exploration, and Astrophysics. Goddard plays a leading role in NASA’s accomplishments by contributing compelling scientific knowledge to advance the Agency’s mission. <b>Follow us on <a href="http://twitter.com/NASAGoddardPix" rel="nofollow">Twitter</a></b> <b>Like us on <a href="http://www.facebook.com/pages/Greenbelt-MD/NASA-Goddard/395013845897?ref=tsd" rel="nofollow">Facebook</a></b> <b>Find us on <a href="http://instagram.com/nasagoddard?vm=grid" rel="nofollow">Instagram</a></b>
S93-45314 (29 Sept 1993) --- Payload specialist Martin J. Fettman, in an oscillating sled device, participates in a data collection project for neurovestibular functions. The seven Spacelab Life Sciences (SLS-2) crewmembers devoted a full day to miscellaneous biomedical data collection in preparation for next month's two week mission aboard Columbia.
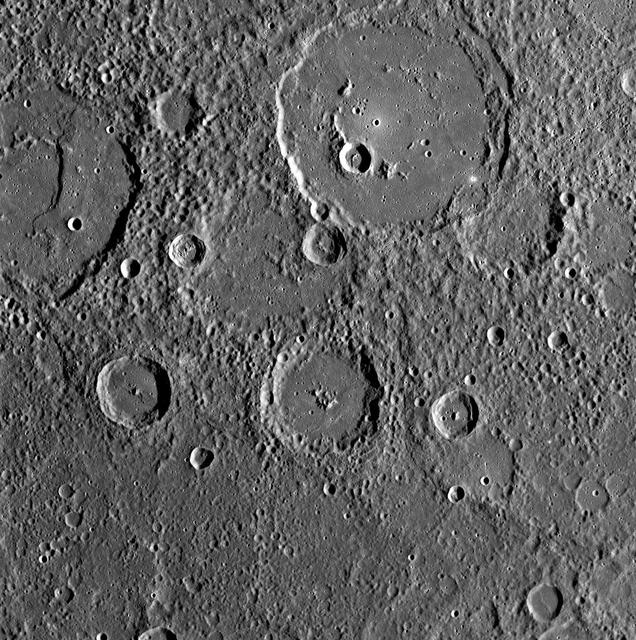
MESSENGER Gathers Unprecedented Data about Mercury Surface

Uruk Sulcus Mosaic - Galileo over Voyager Data
First Data from Mars Climate Sounder

Galileo Regio Mosaic - Galileo over Voyager Data
Water Ice Data Exploration WIDE Tool
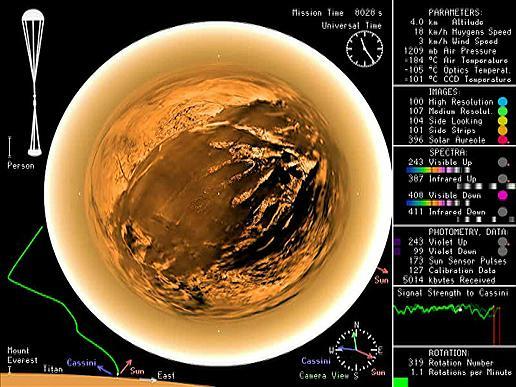
Titan Descent Data Movie with Bells and Whistles
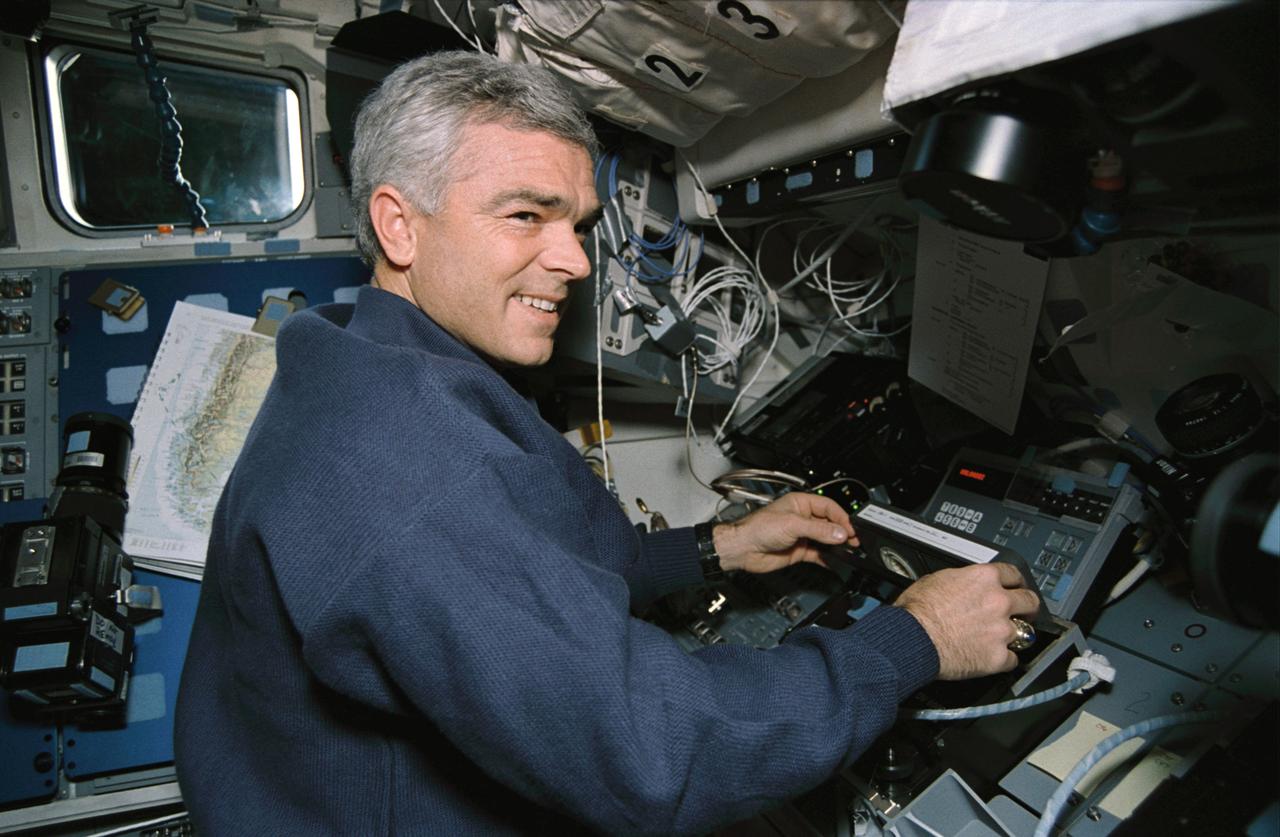
STS059-09-012 (9-20 April 1994) --- On the Space Shuttle Endeavour's aft flight deck, astronaut Michael R. (Rich) Clifford, mission specialist, inserts a tape in the payload high rate recorder. Three of these state-of-the-art recorders captured four times the amount of data that could be radioed to the ground. The 183 tapes, each containing 40 megabytes of data, will be turned into images over the next year, and analyzed over the next decade. Clifford was joined in space by five other NASA astronauts for a week and a half of support to the Space Radar Laboratory (SRL-1)/STS-59 mission.

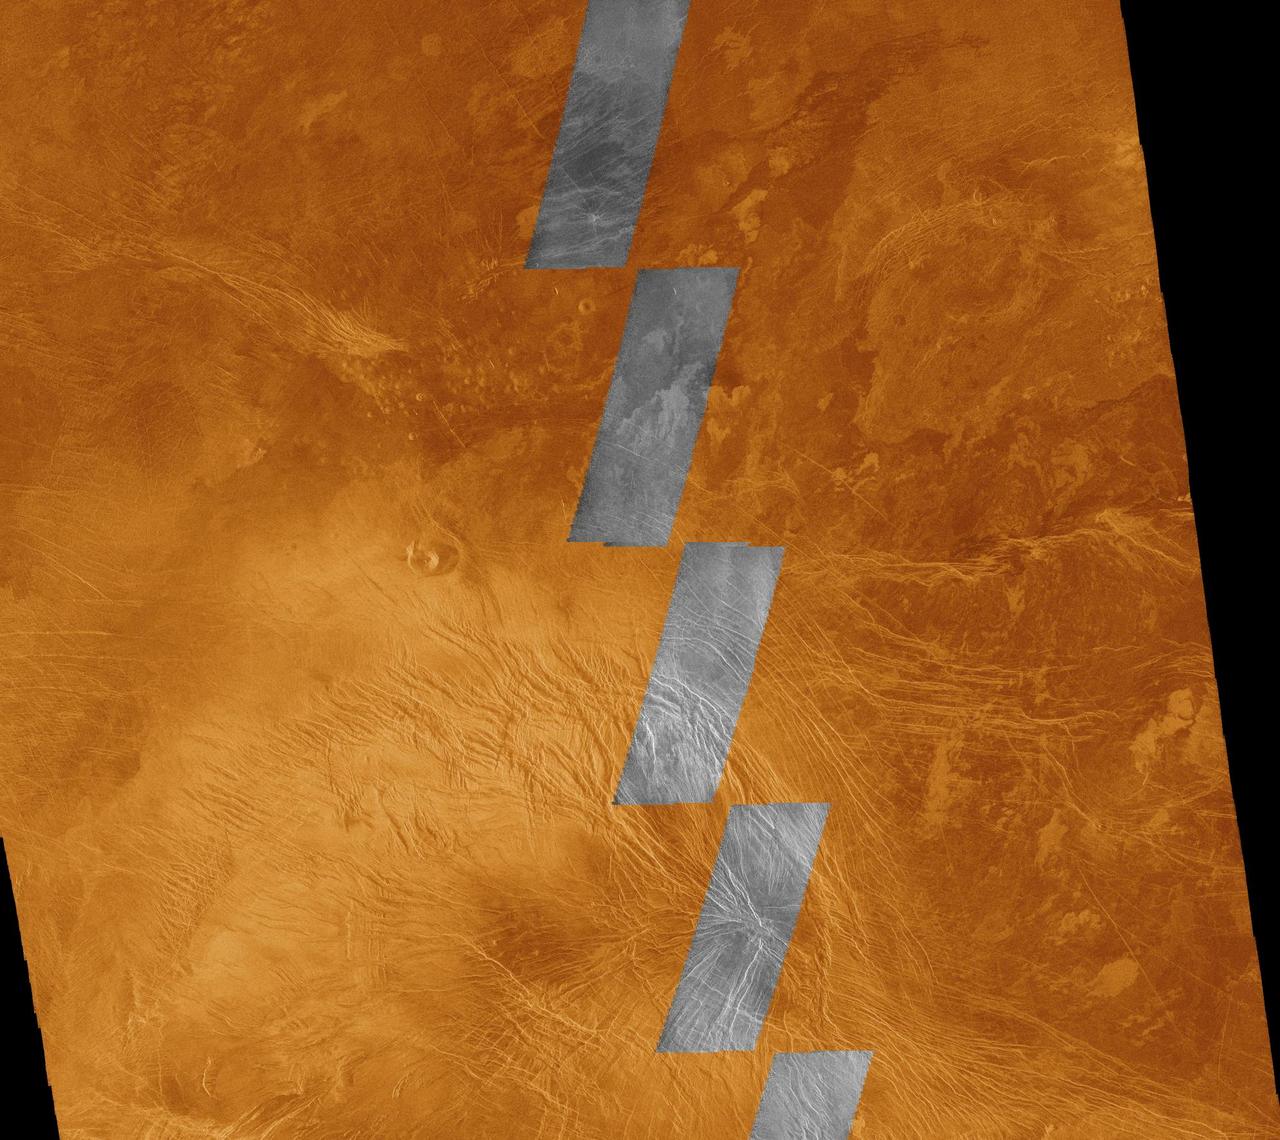
This global view of Venus, centered at 270 degrees east longitude, is a compilation of data from several sources. Magellan synthetic aperature radar mosaics from the first cycle of Magellan mapping are mapped onto a computer-simulated globe to create the image. Data gaps are filled with Pioneer-Venus orbiter data, or a constant mid-range value. Simulated color is used to enhance small-scale structure. The simulated hues are based on color images recorded by the Soviet Venera 13 and 14 spacecraft. The image was produced at the Jet Propulsion Laboratory (JPL) Multimission Image Processing Laboratory and is a single frame from a video released at the JPL news conference, 10-29-91. View provided by JPL with alternate number P-39225 MGN81.
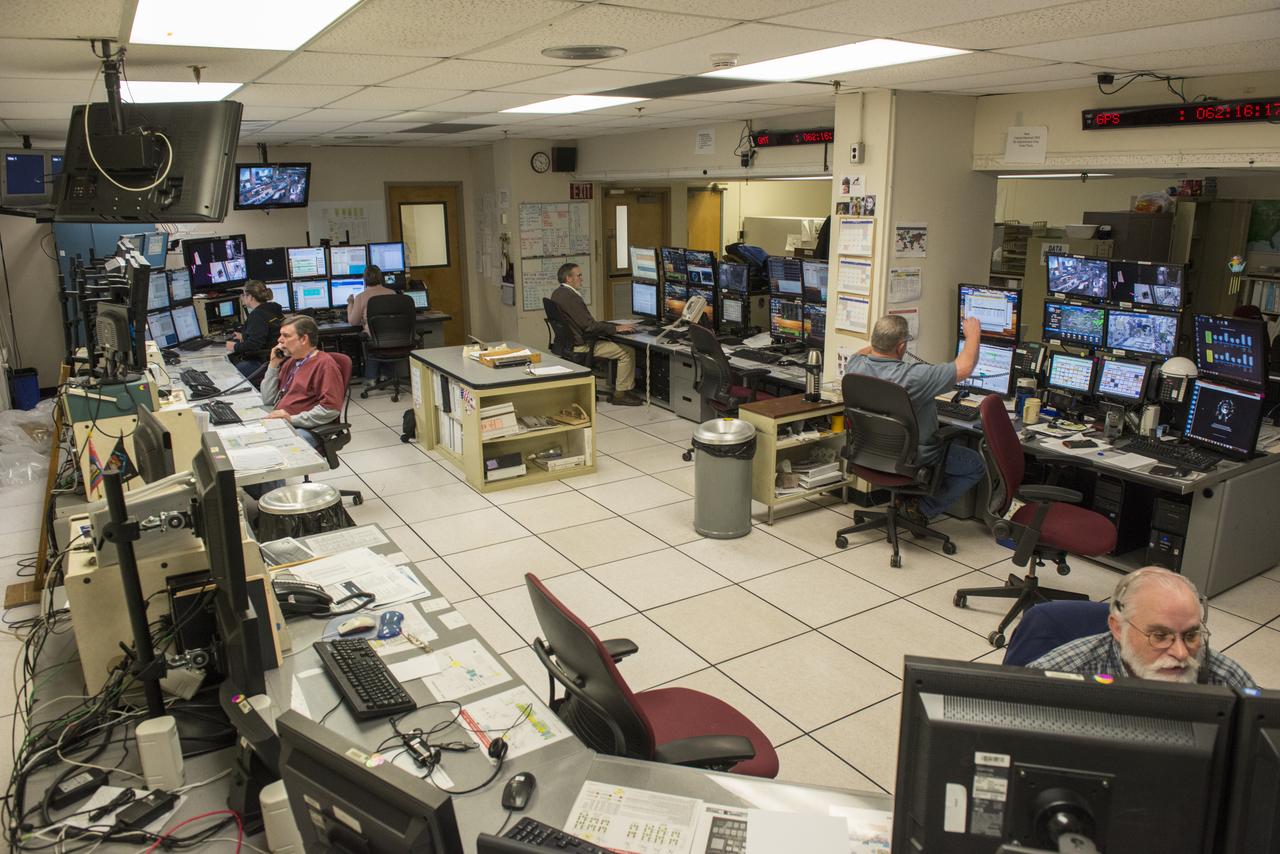
DATA OPERATIONS CONTROL ROOM TEAM MEMBERS TAKE ALL SCIENCE DATA FROM THE INTERNATIONAL SPACE STATION, AND DISTRIBUTE IT TO THE PAYLOAD OPERATIONS INTEGRATION CENTER AND SCIENTISTS ALL OVER THE WORLD WHO HAVE EXPERIMENTS ON THE ORBITING LABORATORY.
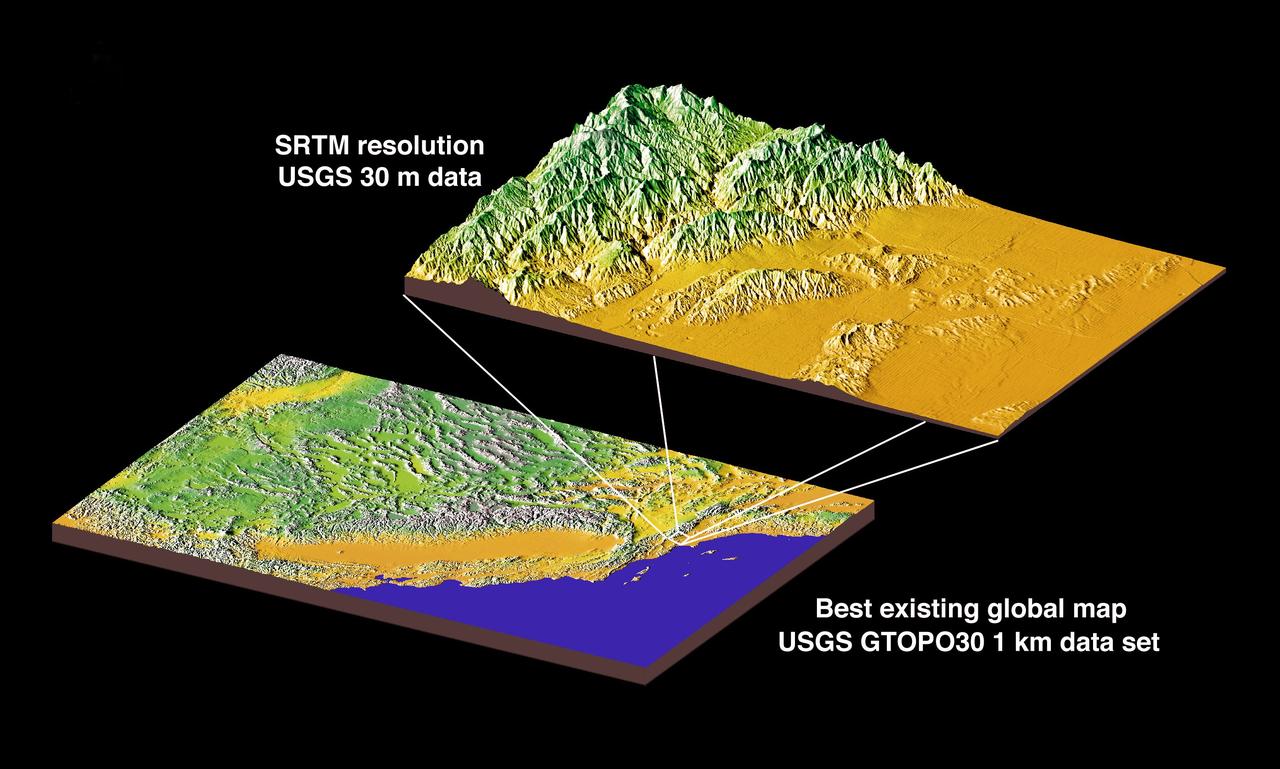
JSC2000E01552 (January 2000) --- This chart compares currently available global map data with the data which will be provided by SRTM during STS-99. The area depicted is the California coast. The SRTM mission will have approximately 1,000 scheduled data takes (every time Endeavour is over land). Data acquisition will be conducted in excess of 80 hours. The recording rate for data will be 180 Mbits/sec for C-band, 90 Mbits/sec for X-band. Total raw radar data will be approximately 9.8 terabytes (15,000 CDs). The mission will utilize some 300 high-density tapes (each tape records 30 min. of C-band, or 60 min. of X-band data).
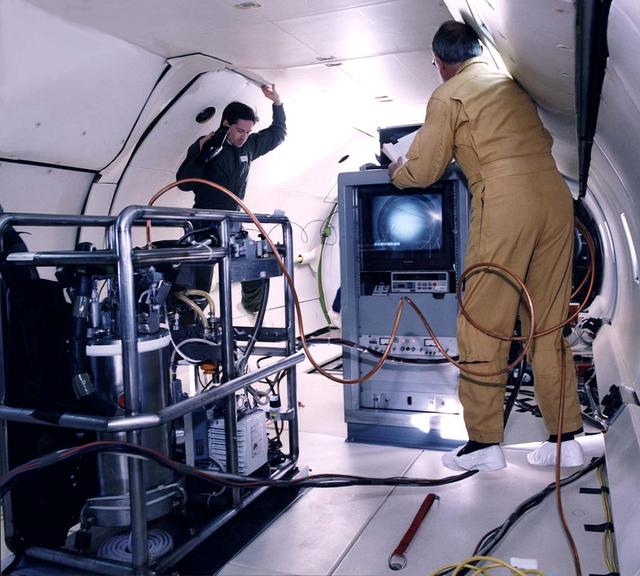
Ted Brunzie and Peter Mason observe the float package and the data rack aboard the DC-9 reduced gravity aircraft. The float package contains a cryostat, a video camera, a pump and accelerometers. The data rack displays and record the video signal from the float package on tape and stores acceleration and temperature measurements on disk.
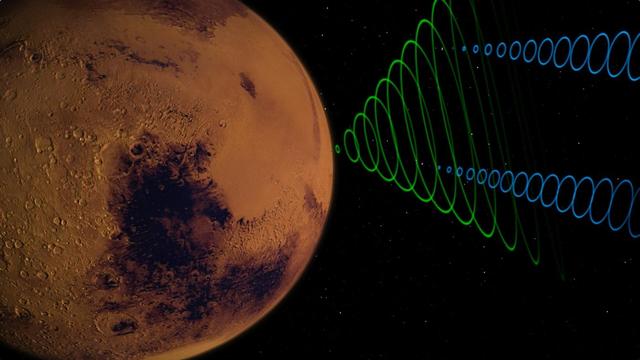
This image depicts the MarCO CubeSats relaying data (blue) from NASA's InSight lander (green) as InSight enters the Martian atmosphere. Animation available at https://photojournal.jpl.nasa.gov/catalog/PIA22738
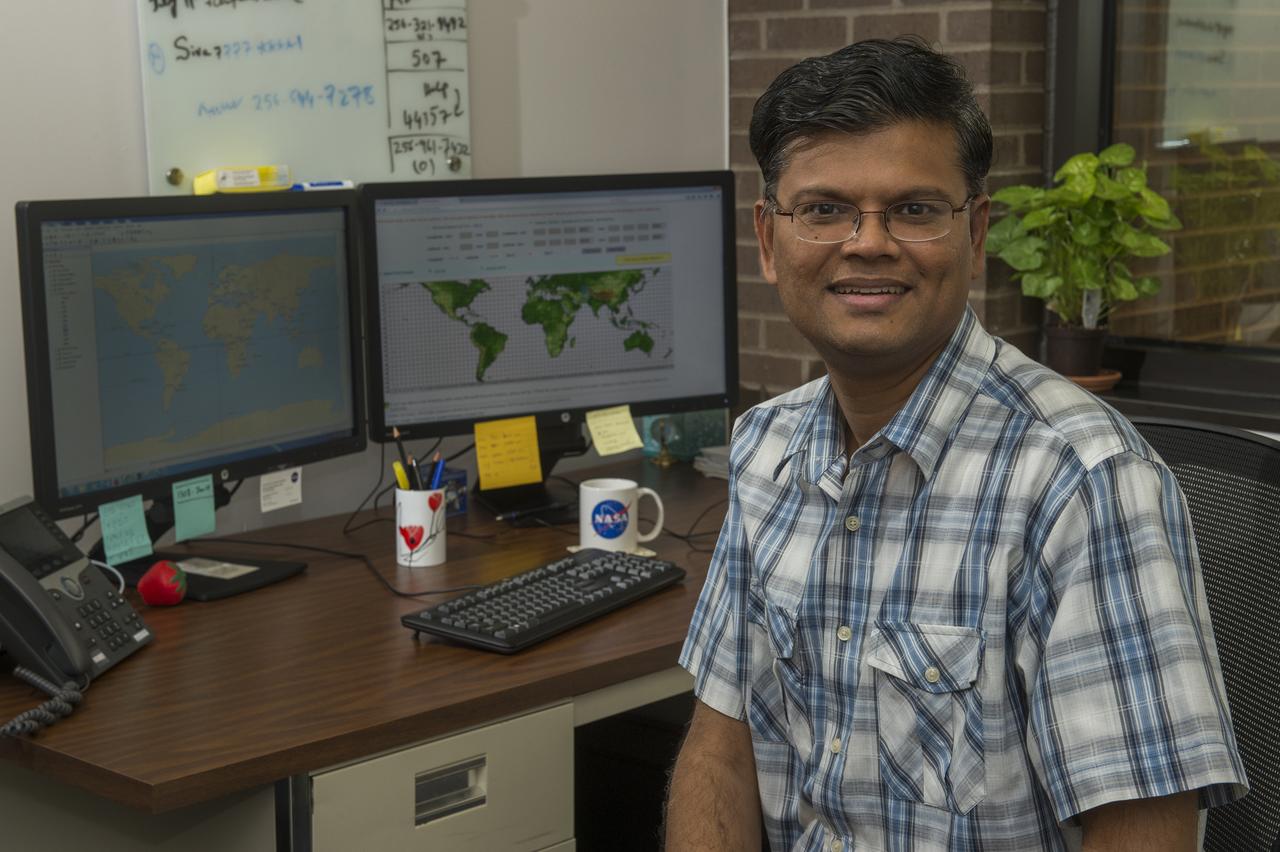
KRISHNA VADREVU ANALYZING LANDSAT AND DIGITAL ELEVATION DATA FOR FIRE HAZARD MAPPING STUDIES
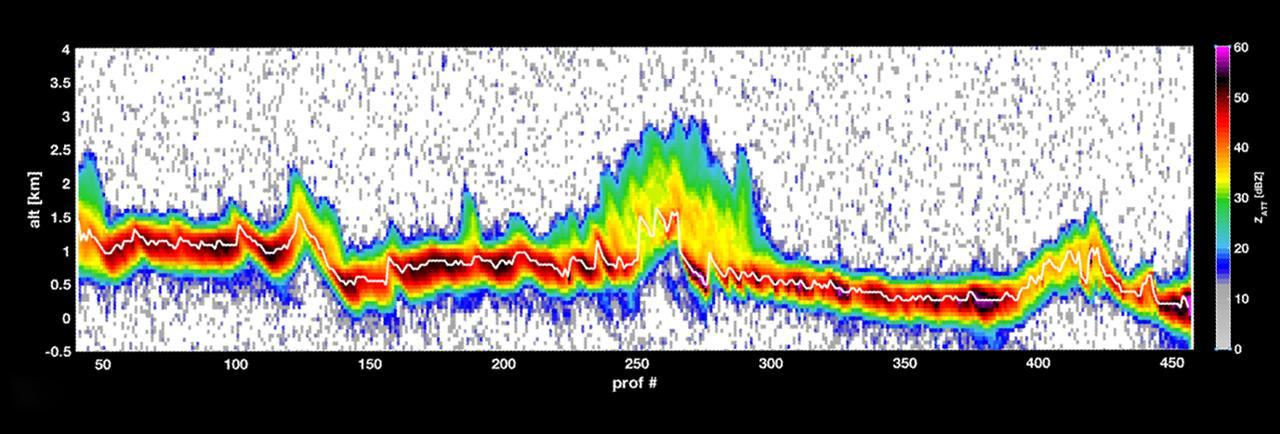
The first data from RainCube, a tiny weather satellite. RainCube is a prototype for a possible fleet of future small satellite missions that can track precipitation from space. RainCube "sees" objects by using radar, much as a bat uses sonar. The satellite's umbrella -- like antenna sends out chirps, or specialized radar signals, that bounce off raindrops, bringing back a picture of what the inside of the storm looks like. This graph shows a storm over the mountains in Mexico in late August 2018, as measured by RainCube's radar. The data shows a vertical snapshot of the storm -- the bright white line shows the ground, while the bright colors around it show the intensity of the rainfall, as well as the more reflective areas of the terrain. Brighter colors, like yellow or red, show areas of higher reflectivity, e.g. heavier rain. https://photojournal.jpl.nasa.gov/catalog/PIA22654
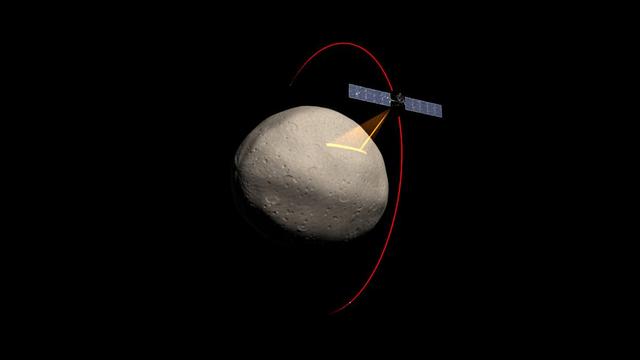
Artist concept of the Dawn spacecraft gathering spectral data from Vesta.
The Atmospheric Infrared Sounder AIRS onboard NASA Aqua satellite collects data and creates a temperature profile, September, 2008.
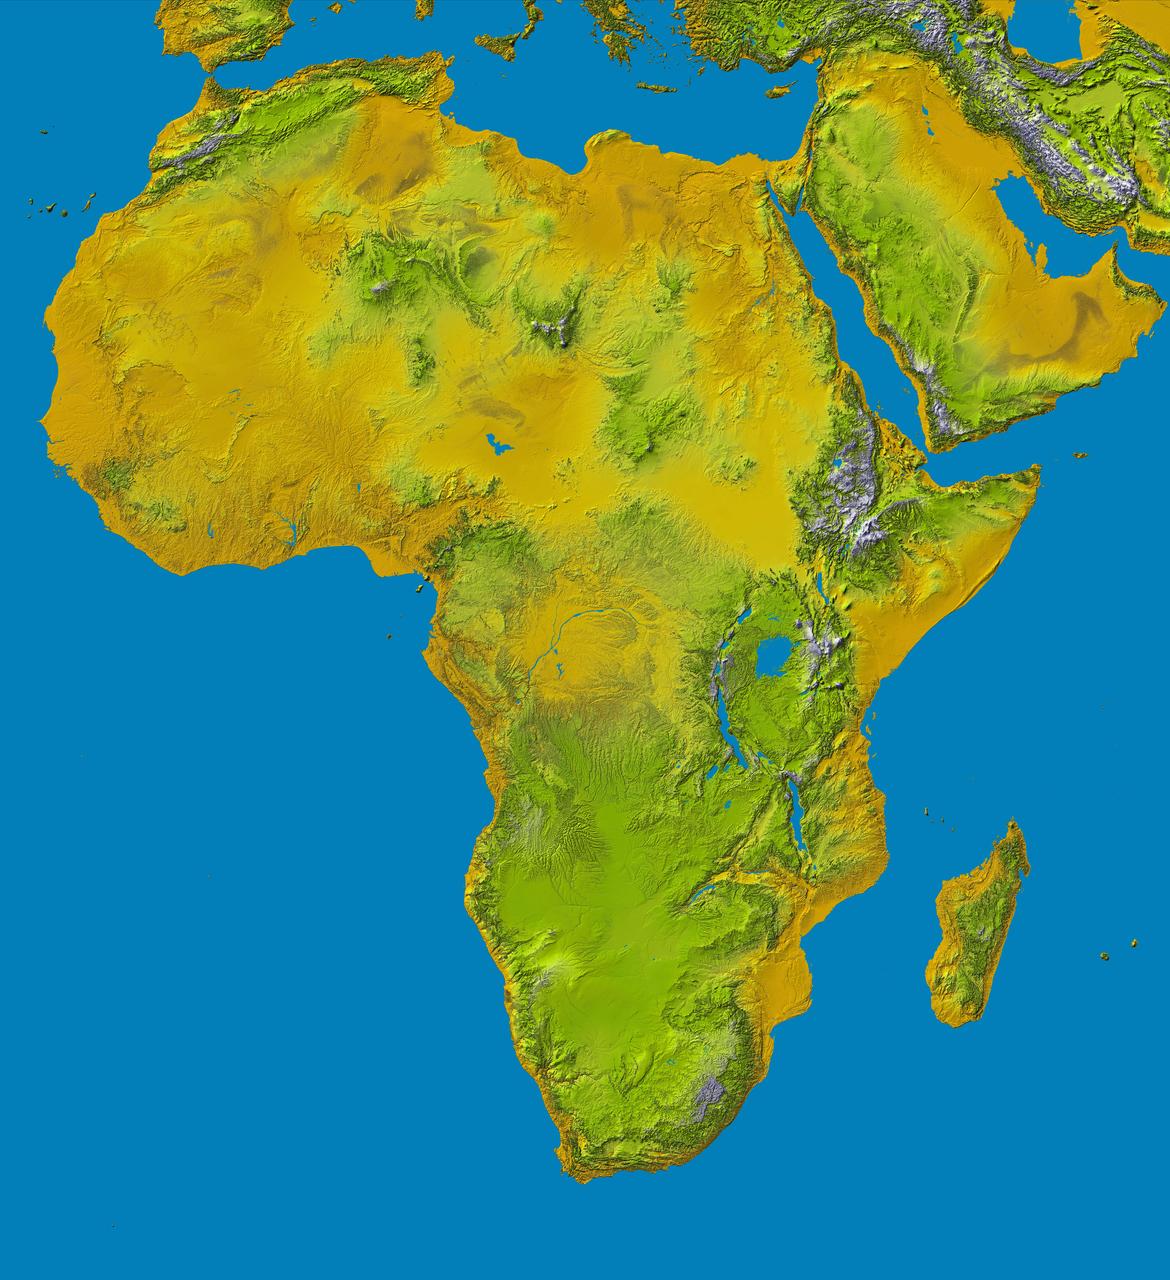
Elevation data at the highest possible resolution from NASA SRTM mission in February 2000 are being released for the first time for most of the African continent. This color shaded relief image shows the extent of SRTM digital elevation data for Africa.
Honeywell H-800 Data Processing System at Ames Research Center
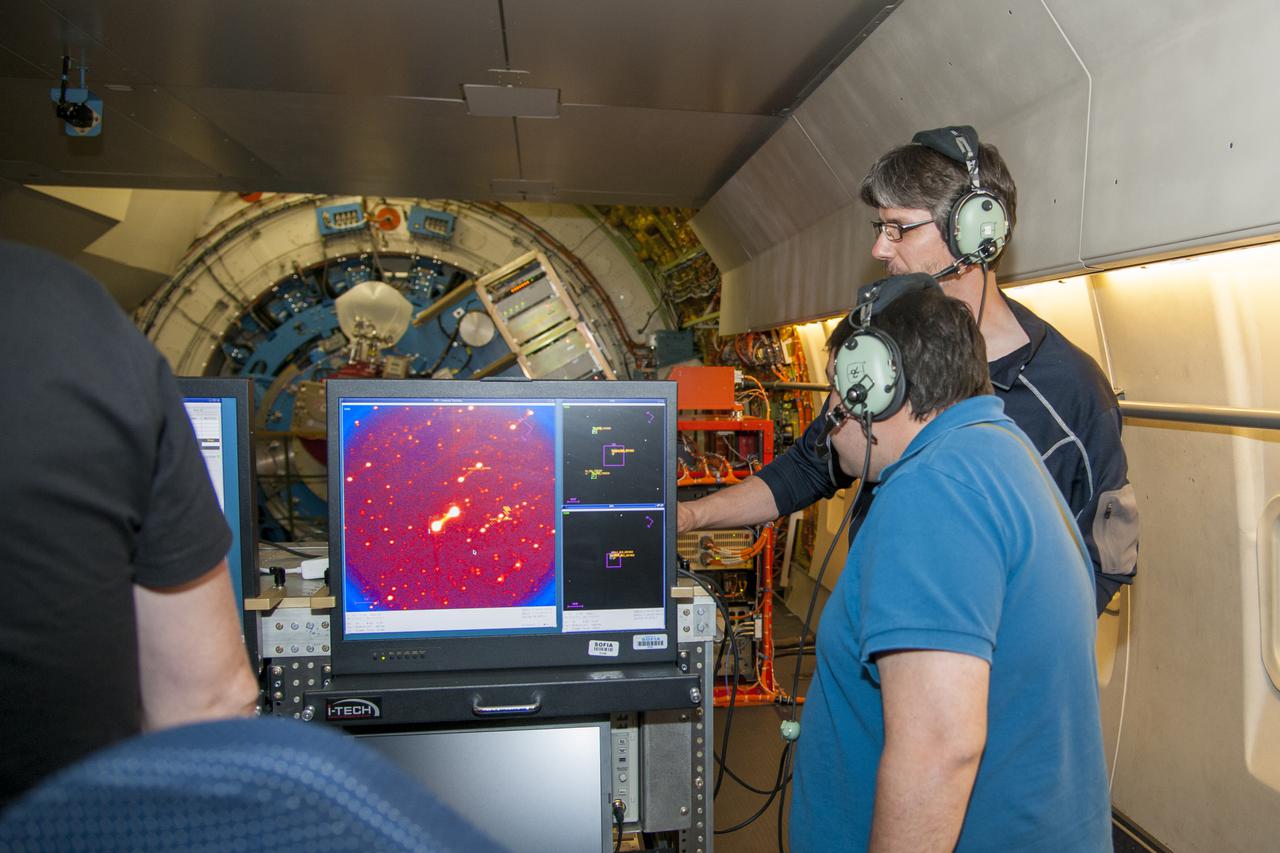
Astronomers smile while looking at data from SOFIA’s telescope.
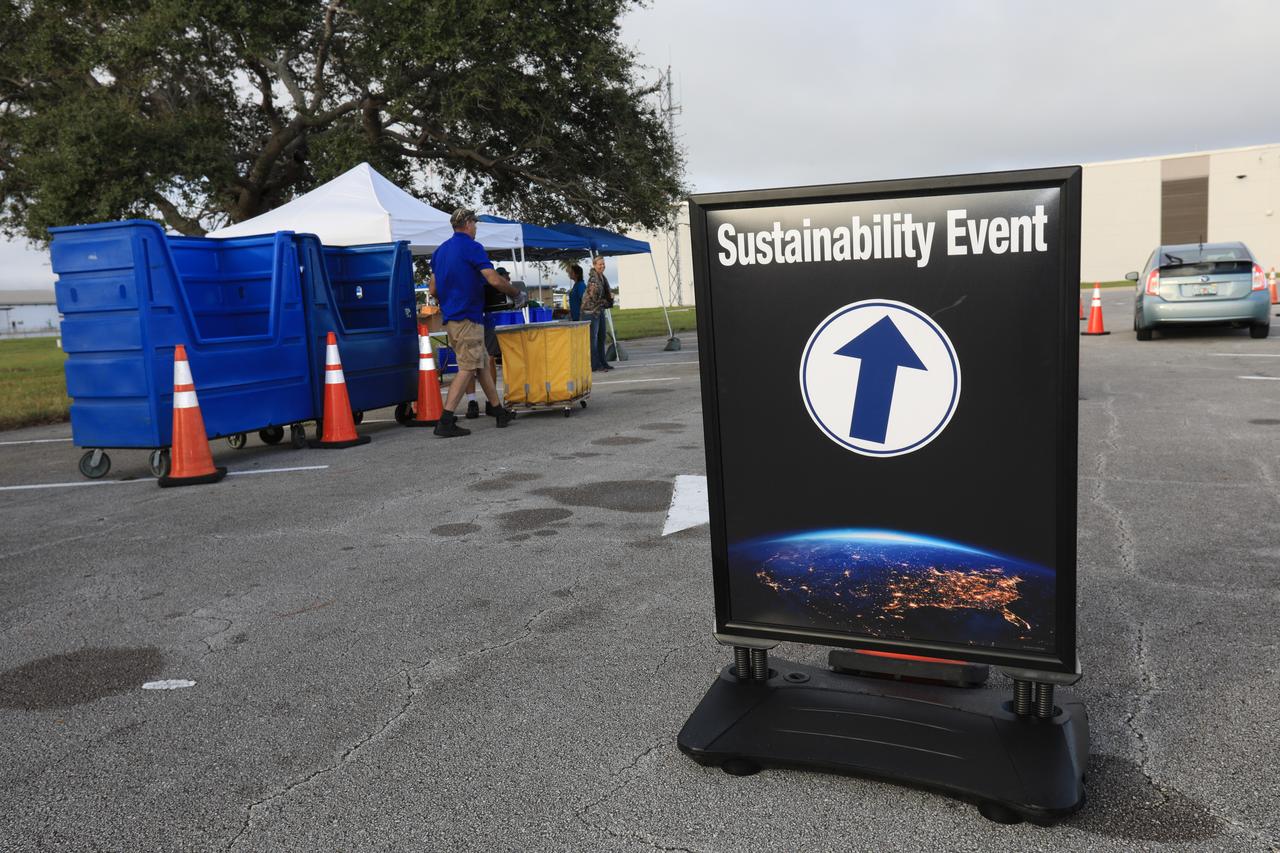
In the parking lot of the Data Center at NASA's Kennedy Space Center in Florida, employees turn in used household material for recycling as part of America Recycles Day (ARD) led by the center's Sustainability organization. The annual event is a nationally recognized initiative dedicated to promoting recycling in the United States. This year, KSC is partnered with Goodwill Industries and several other local organizations to receive donation material from employees such as gently used household items, personal electronic waste, greeting cards and serviceable eyeglasses.
This image compares NASA Magellan data acquired in August 1990 during the initial test of the radar system black and white insets with data acquired by the spacecraft in April 1991 color background. The area is in the southern hemisphere of Venus. http://photojournal.jpl.nasa.gov/catalog/PIA00220
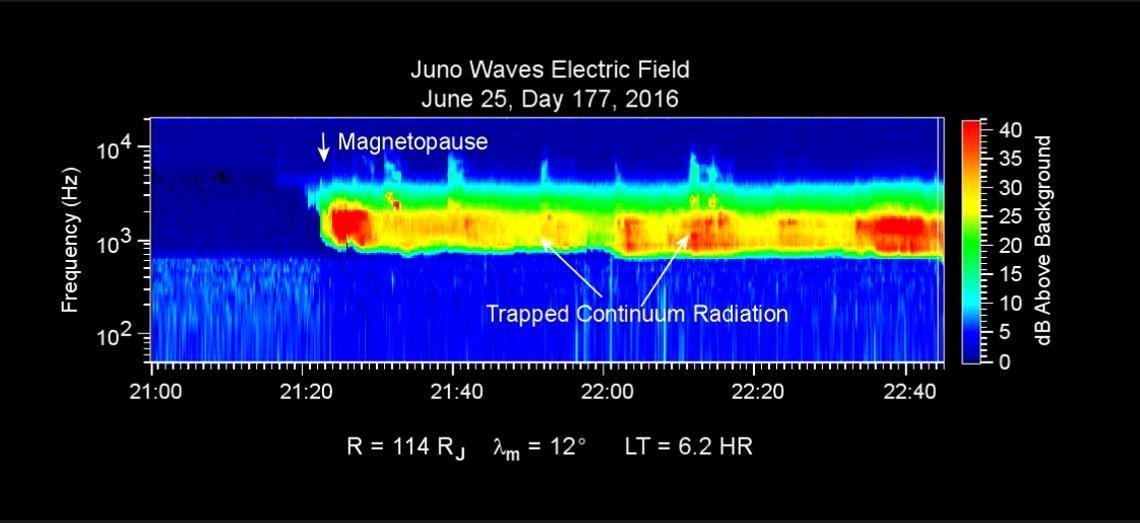
This chart presents data that the Waves investigation on NASA's Juno spacecraft recorded as the spacecraft crossed the bow shock just outside of Jupiter's magnetosphere on June 24, 2016, while approaching Jupiter. Audio accompanies the animation, with volume and pitch correlated to the amplitude and frequency of the recorded waves. The graph is a frequency-time spectrogram with color coding to indicate wave amplitudes as a function of wave frequency (vertical axis, in hertz) and time (horizontal axis, with a total elapsed time of two hours). During the hour before Juno reached the bow shock, the Waves instrument was detecting mainly plasma oscillations just below 10,000 hertz (10 kilohertz). The frequency of these oscillations is related to the local density of electrons; the data yield an estimate of approximately one electron per cubic centimeter (about 16 per cubic inch) in this region just outside Jupiter's bow shock. The broadband burst of noise marked "Bow Shock" is the region of turbulence where the supersonic solar wind is heated and slowed by encountering the Jovian magnetosphere. The shock is analogous to a sonic boom generated in Earth's atmosphere by a supersonic aircraft. The region after the shock is called the magnetosheath. The vertical bar to the right of the chart indicates the color coding of wave amplitude, in decibels (dB) above the background level detected by the Waves instrument. Each step of 10 decibels marks a tenfold increase in wave power. When Juno collected these data, the distance from the spacecraft to Jupiter was about 5.56 million miles (8.95 million kilometers), indicated on the chart as 128 times the radius of Jupiter. Jupiter's magnetic field is tilted about 10 degrees from the planet's axis of rotation. The note of 22 degrees on the chart indicates that at the time these data were recorded, the spacecraft was 22 degrees north of the magnetic-field equator. The "LT" notation is local time on Jupiter at the longitude of the planet directly below the spacecraft, with a value of 6.2 indicating approximately dawn. http://photojournal.jpl.nasa.gov/catalog/PIA20753
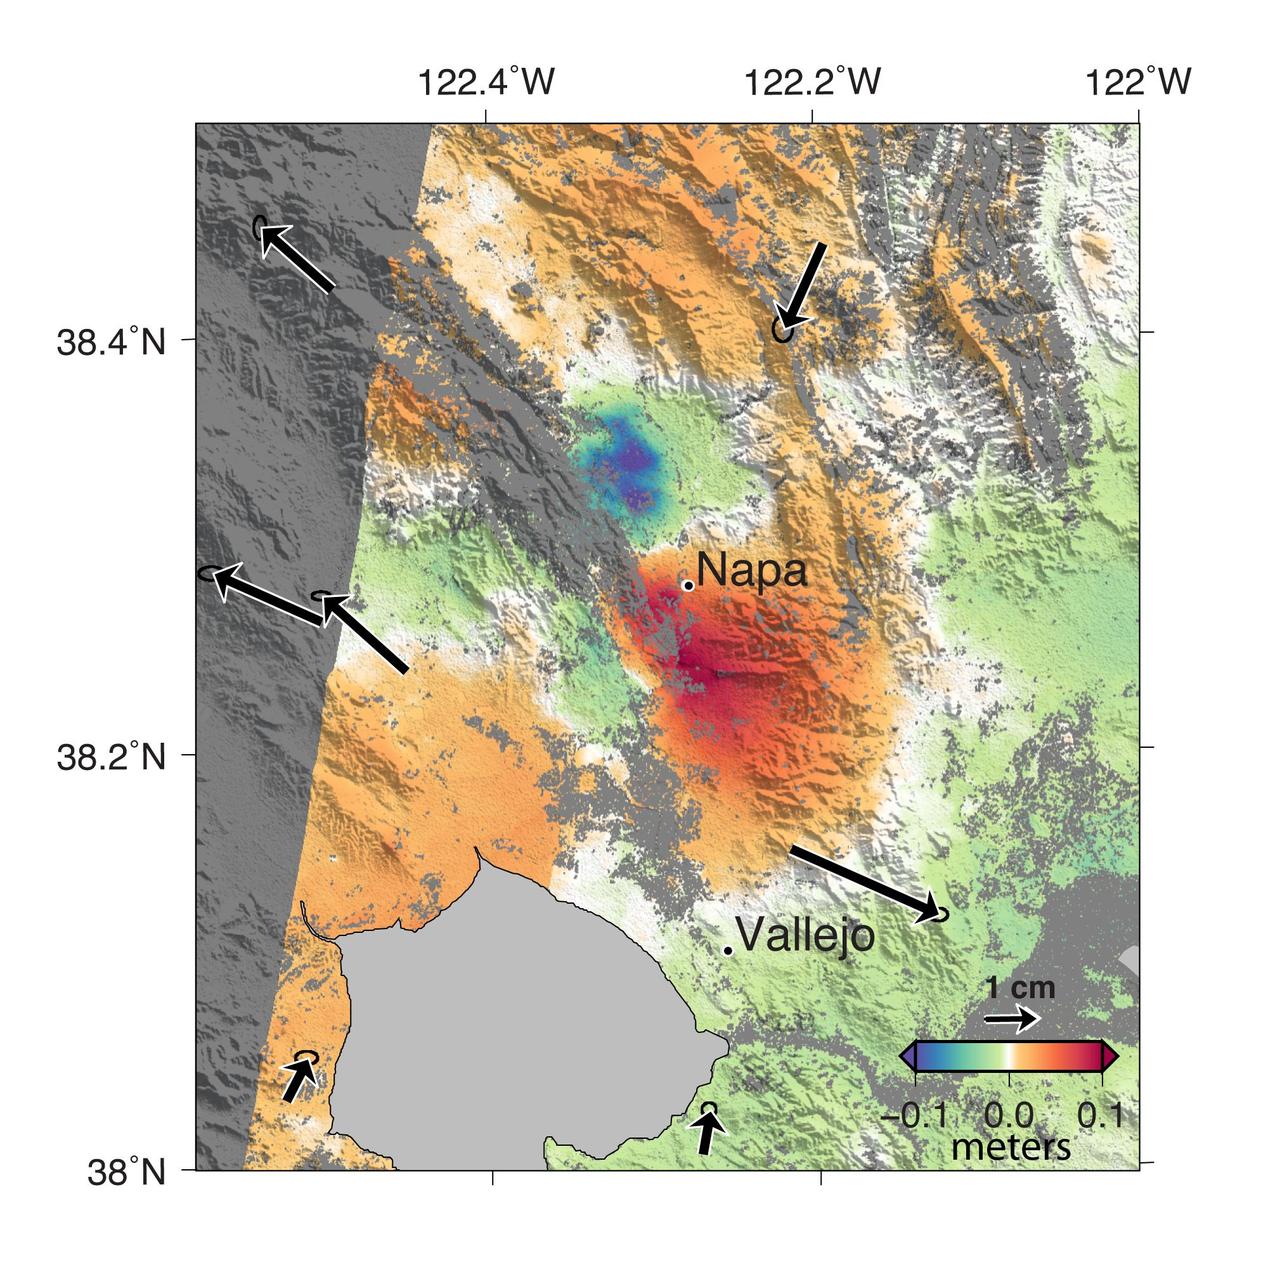
A magnitude 6.0 earthquake struck southern Napa county northeast of San Francisco, California, on Aug. 24, 2014. NASA satellite data reveal ground defomation.

Computers' at work in 16ft wind tunnel - calculating test data
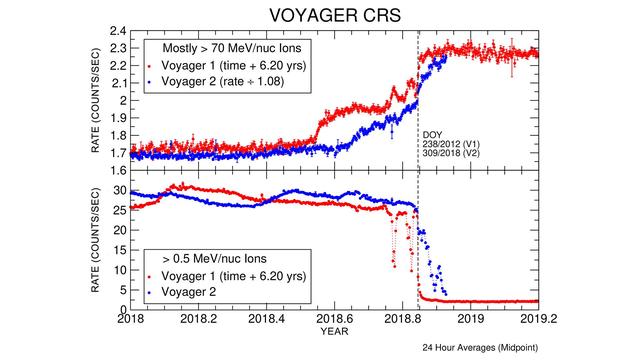
These graphs compare data from identical instruments onboard NASA's Voyager 1 and Voyager 2 spacecraft as they each exited the heliosphere. Voyager 1 exited in 2012, and Voyager 2 exited in 2018. The cosmic ray subsystem (CRS) measures the rate of energetic particles hitting the radiation detector on the instrument. The top graph shows high energy particles (called cosmic rays) that originate outside the heliosphere. The CRS instruments on both spacecraft observed similar, but not identical, increases in the cosmic ray rate as they both crossed the heliopause (the outer edge of the heliosphere). The lower graph shows slightly lower energy particles that originate inside the heliosphere. Both spacecraft detected a similar but not identical decrease in these lower energy particles when they crossed the heliopause and immediately after. https://photojournal.jpl.nasa.gov/catalog/PIA22916
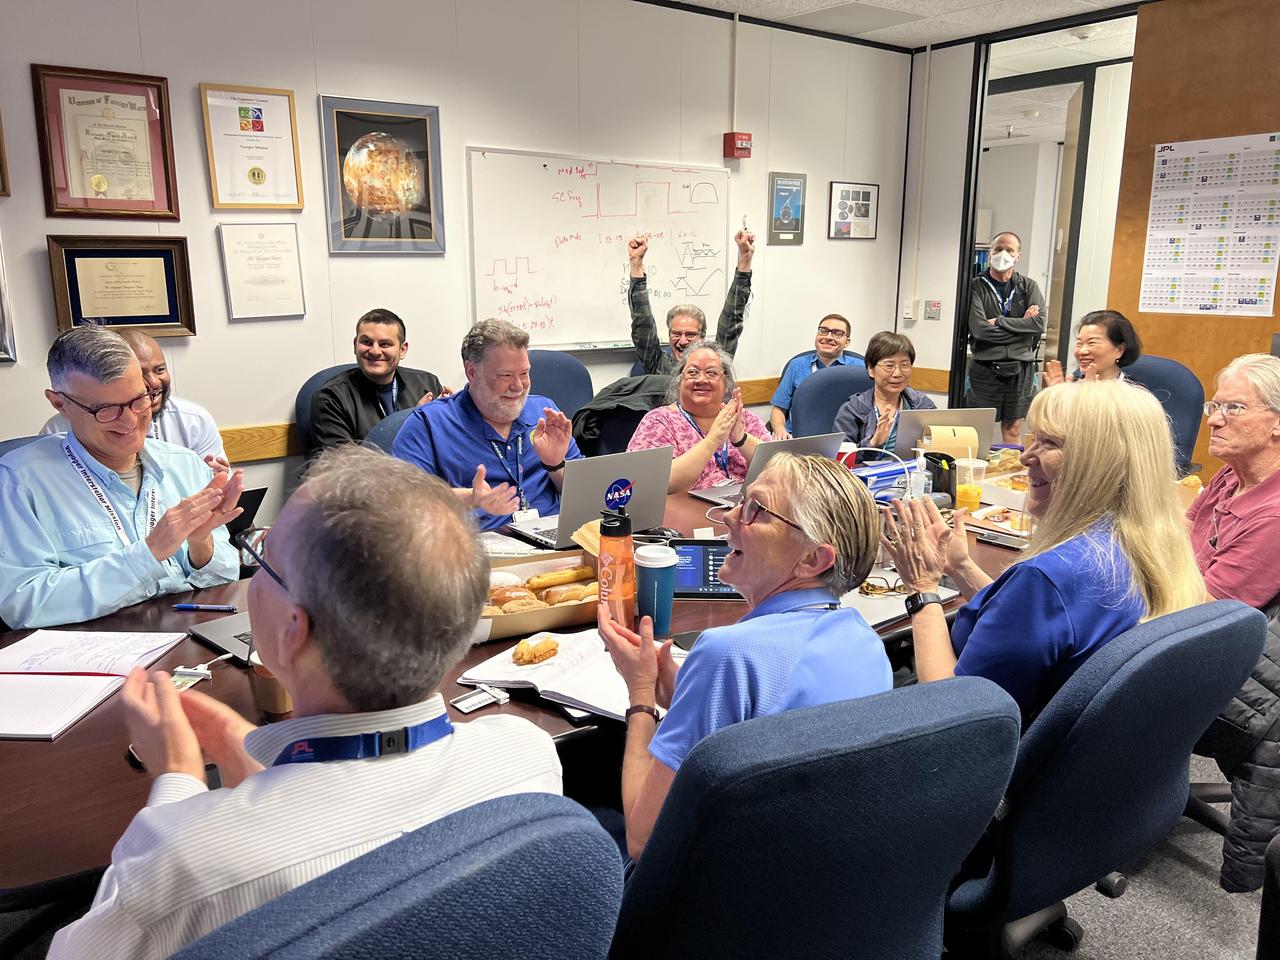
In a conference room at NASA's Jet Propulsion Laboratory in Southern California, members of the Voyager mission team gathered April 20, 2024, to find out if an issue on Voyager 1 had been partially resolved. Just after 6:40 a.m., a cheer went up around the room as the group heard back from the spacecraft: It was returning engineering data for the first time since November 2023. Nearly two full days earlier, the team had sent a series of commands to move a section of software code used by the flight data subsystem (FDS) computer to a new location. The physical location where the code was previously stored has been damaged, causing the mission to go five months without receiving science or engineering data. But the commands were a success, and the team received data about the health and status of the spacecraft, prompting celebration. The commands were sent on April 18, 2024. Due to Voyager 1's distance from Earth – over 15 billion miles or 24 billion kilometers – a radio signal takes about 22 ½ hours to travel to the spacecraft, and 22 ½ hours to return to Earth. https://photojournal.jpl.nasa.gov/catalog/PIA26275
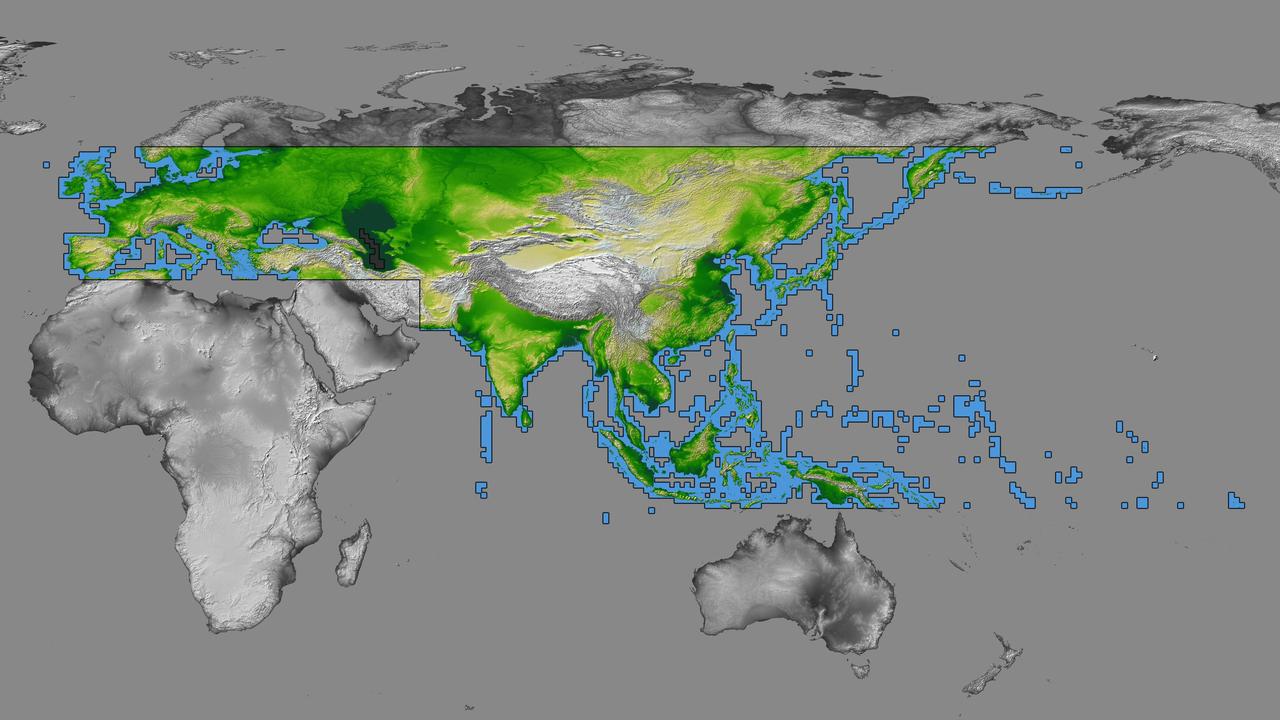
inal Caption Released with Image: The colored regions of this map show the extent of digital elevation data recently released by the Shuttle Radar Topography Mission (SRTM). This release includes data for most of Europe and Asia plus numerous islands in the Indian and Pacific Oceans. SRTM flew on board the Space Shuttle Endeavour in February 2000 and used an interferometric radar system to map the topography of Earth's landmass between latitudes 56 degrees south and 60 degrees north. The data were processed into geographic "tiles," each of which represents one by one degree of latitude and longitude. A degree of latitude measures 111 kilometers (69 miles) north-south, and a degree of longitude measures 111 kilometers or less east-west, decreasing away from the equator. The data are being released to the public on a continent-by-continent basis. This Eurasia segment includes 5,940 tiles, more than a third of the total data set. Previous releases covered North America and South America. Forthcoming releases will include Africa-Arabia and Australia plus an "Islands" release for those islands not included in the continental releases. Together these data releases constitute the world's first high-resolution, near-global elevation model. The resolution of the publicly released data is three arcseconds (1/1,200 of a degree of latitude and longitude), which is about 90 meters (295 feet). European coverage in the current data release stretches eastward from the British Isles and the Iberian Peninsula in the west, across the Alps and Carpathian Mountains, as well as the Northern European Plain, to the Ural and Caucasus Mountains bordering Asia. The Asian coverage includes a great diversity of landforms, including the Tibetan Plateau, Tarin Basin, Mongolian Plateau, and the mountains surrounding Lake Baikal, the world's deepest lake. Mt. Everest in the Himalayas, at 8,848 meters (29,029 feet) is the world's highest mountain. From India's Deccan Plateau, to Southeast Asia, coastal China, and Korea, various landforms place constraints upon land use planning for a great population. Volcanoes in the East Indies, the Philippines, Japan, and the Kamchatka Peninsula form the western part of the "Ring of Fire" around the Pacific Ocean. Many of these regions were previously very poorly mapped due to persistent cloud cover or the inaccessibility of the terrain. Digital elevation data, such as provided by SRTM, are particularly in high demand by scientists studying earthquakes, volcanism, and erosion patterns for use in mapping and modeling hazards to human habitation. But the shape of Earth's surface affects nearly every natural process and human endeavor that occurs there, so elevation data are used in a wide range of applications. In this index map color-coding is directly related to topographic height, with green at the lower elevations, rising through yellow and tan, to white at the highest elevations. The large, very dark green feature in western Asia is the Caspian Sea, which is below sea level. Blue areas on the map represent water within the mapped tiles, each of which includes shorelines or islands. http://photojournal.jpl.nasa.gov/catalog/PIA03398
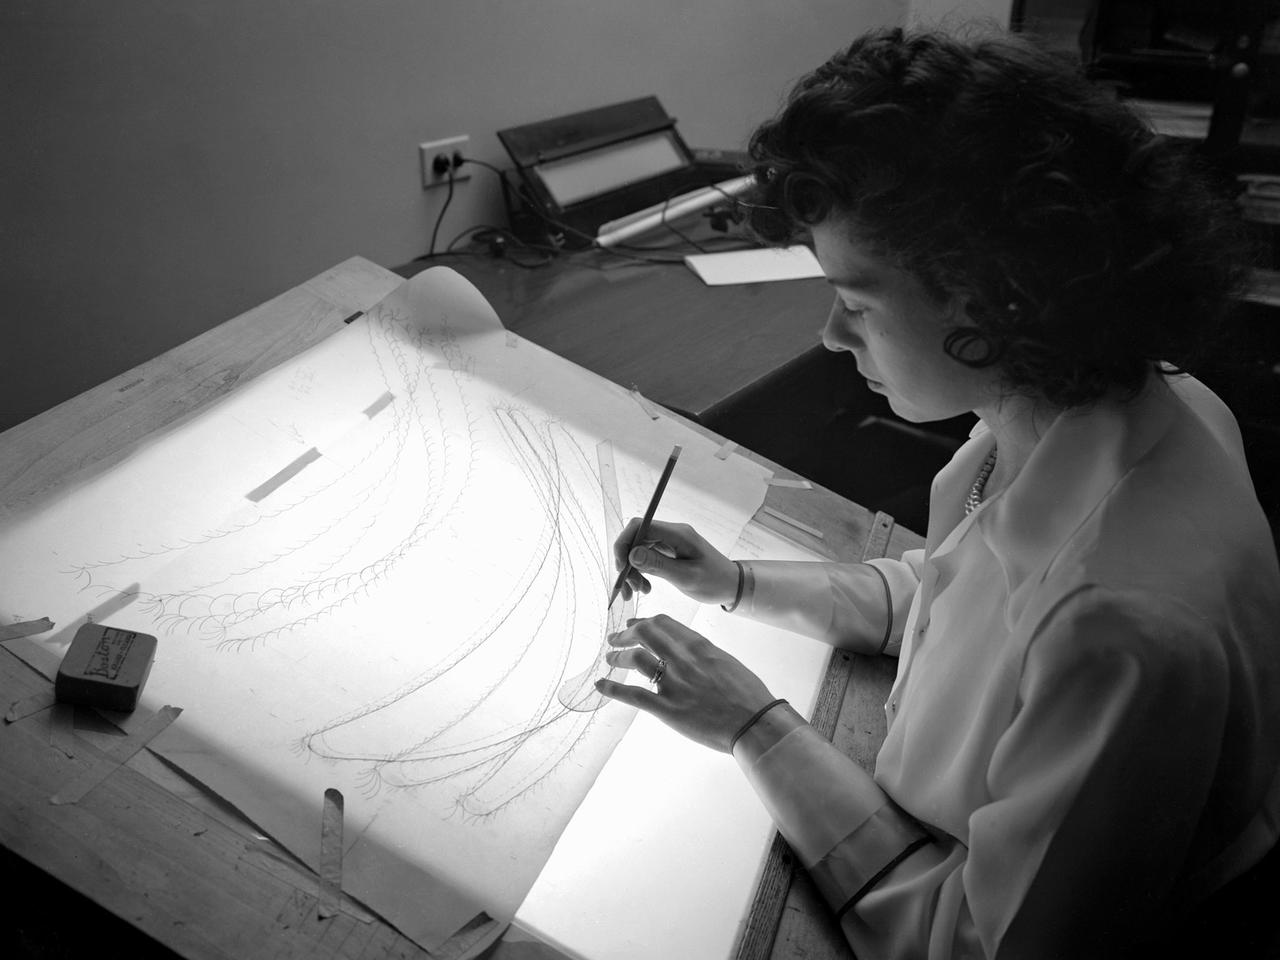
A female computer plotting compressor data in the Engine Research Building at the NACA’s Lewis Flight Propulsion Laboratory. The Computing Section was introduced during World War II to relieve short-handed research engineers of some of the tedious data-taking work. The computers made the initial computations and plotted the data graphically. The researcher then analyzed the data and either summarized the findings in a report or made modifications or ran the test again. With the introduction of mechanical computer systems in the 1950s the female computers learned how to encode the punch cards. As the data processing capabilities increased, fewer female computers were needed. Many left on their own to start families, while others earned mathematical degrees and moved into advanced positions.
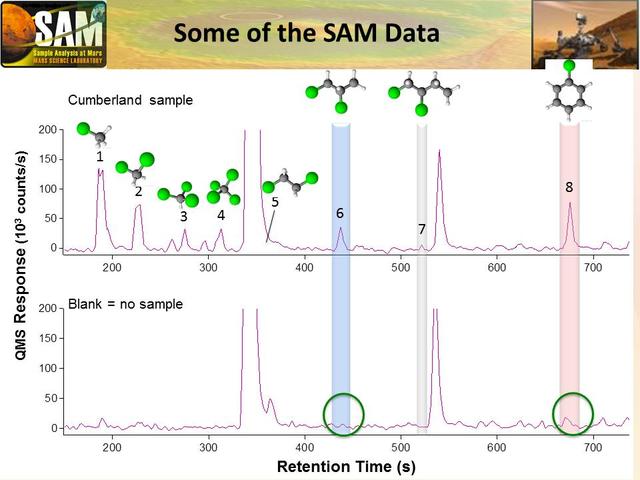
Data graphed here are examples from the Sample Analysis at Mars SAM laboratory detection of Martian organics in a sample of powder that the drill on NASA Curiosity Mars rover collected from a rock target called Cumberland.
From left, Wayne Arrington, a Boeing Company technician, and Steve Presti, a mechanical technician at NASA's Marshall Space Flight Center in Huntsville, Ala., install Developmental Flight Instrumentation Data Acquisition Units in Marshall's Systems Integration and Test Facility. The units are part of NASA's Space Launch System (SLS) core stage avionics, which will guide the biggest, most powerful rocket in history to deep space missions. When completed, the core stage will be more than 200 feet tall and store cryogenic liquid hydrogen and liquid oxygen that will feed the vehicle's RS-25 engines. The hardware, software and operating systems for the SLS are arranged in flight configuration in the facility for testing. The new Data Acquisition Units will monitor vehicle behavior in flight -- like acceleration, thermal environments, shock and vibration. That data will then be used to validate previous ground tests and analyses models that were used in the development of the SLS vehicle.

View of Expedition 53 crewmember's Personal Flight Data Filer (FDF) item- US Flag- Floating. Image was released by astronaut on social media.
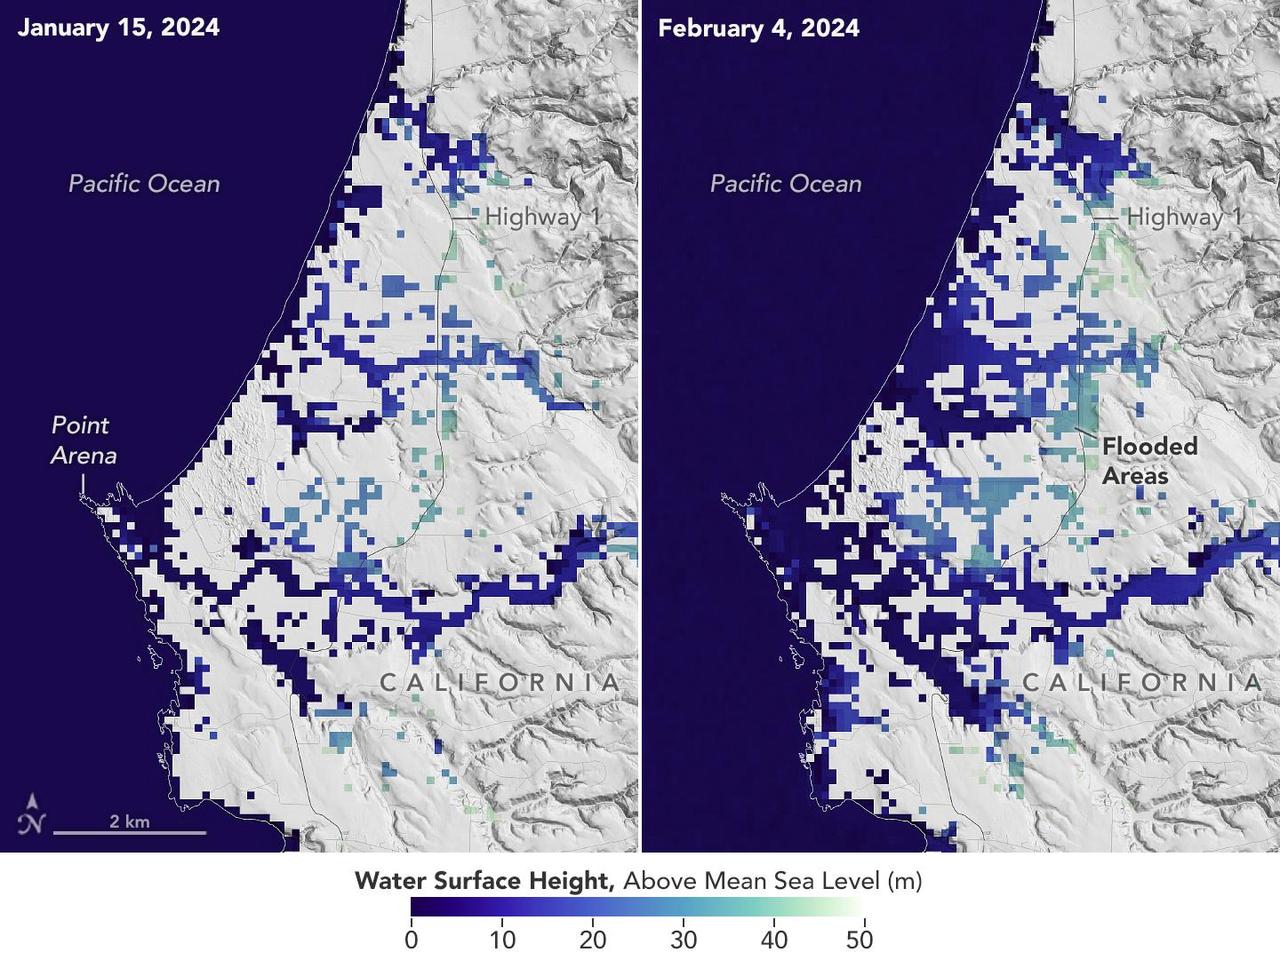
A series of atmospheric rivers drenched California in February 2024, with record amounts of rainfall and hurricane-force winds sweeping across parts of the state. The Surface Water and Ocean Topography (SWOT) mission captured data on coastal flooding near the community of Manchester, roughly 105 miles (169 kilometers) north of San Francisco. The satellite is a collaboration between NASA and the French space agency, CNES (Centre National d'Études Spatiales). The image shows the area on Jan. 15, 2024, before the rain and snow from atmospheric rivers hit California, and then again on Feb. 4, 2024, after the first in a series of storms soaked the state. Water heights are shown in shades of green and blue, with lighter hues indicating the highest levels relative to mean sea level. (Data for inland areas includes the height of the floodwaters plus the ground elevation beneath it.) Each pixel in the image represents an area that is 330 feet by 330 feet (100 meters by 100 meters). Since December 2022, SWOT has been measuring the height of nearly all water on Earth's surface, developing one of the most detailed, comprehensive views yet of the planet's oceans and freshwater lakes and rivers. Not only can the satellite detect the extent of the water on Earth's surface, as other satellites can, but SWOT can also provide water level data. The mission science team made the measurements using the Ka-band Radar Interferometer (KaRIn) instrument. With two antennas spread 33 feet (10 meters) apart on a boom, KaRIn produces a pair of data swaths as it circles the globe, bouncing radar pulses off water surfaces to collect surface-height measurements. Launched from Vandenberg Space Force Base in central California, SWOT is now in its operations phase, collecting data that will be used for research and other purposes. https://photojournal.jpl.nasa.gov/catalog/PIA26182
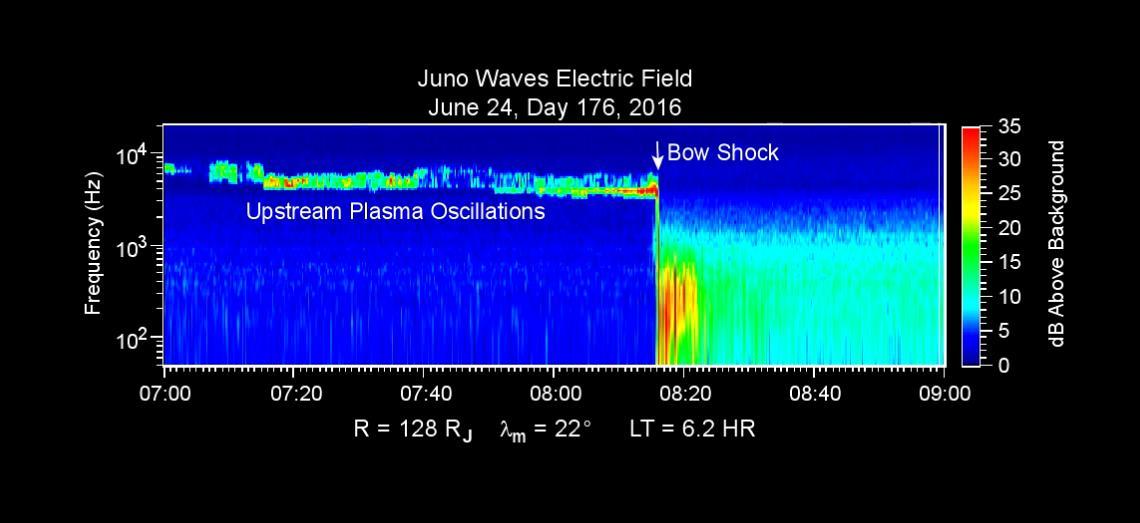
This chart presents data that the Waves investigation on NASA's Juno spacecraft recorded as the spacecraft crossed the bow shock just outside of Jupiter's magnetosphere on June 24, 2016, while approaching Jupiter. Audio accompanies the animation, with volume and pitch correlated to the amplitude and frequency of the recorded waves. The graph is a frequency-time spectrogram with color coding to indicate wave amplitudes as a function of wave frequency (vertical axis, in hertz) and time (horizontal axis, with a total elapsed time of two hours). During the hour before Juno reached the bow shock, the Waves instrument was detecting mainly plasma oscillations just below 10,000 hertz (10 kilohertz). The frequency of these oscillations is related to the local density of electrons; the data yield an estimate of approximately one electron per cubic centimeter (about 16 per cubic inch) in this region just outside Jupiter's bow shock. The broadband burst of noise marked "Bow Shock" is the region of turbulence where the supersonic solar wind is heated and slowed by encountering the Jovian magnetosphere. The shock is analogous to a sonic boom generated in Earth's atmosphere by a supersonic aircraft. The region after the shock is called the magnetosheath. The vertical bar to the right of the chart indicates the color coding of wave amplitude, in decibels (dB) above the background level detected by the Waves instrument. Each step of 10 decibels marks a tenfold increase in wave power. When Juno collected these data, the distance from the spacecraft to Jupiter was about 5.56 million miles (8.95 million kilometers), indicated on the chart as 128 times the radius of Jupiter. Jupiter's magnetic field is tilted about 10 degrees from the planet's axis of rotation. The note of 22 degrees on the chart indicates that at the time these data were recorded, the spacecraft was 22 degrees north of the magnetic-field equator. The "LT" notation is local time on Jupiter at the longitude of the planet directly below the spacecraft, with a value of 6.2 indicating approximately dawn. http://photojournal.jpl.nasa.gov/catalog/PIA20753
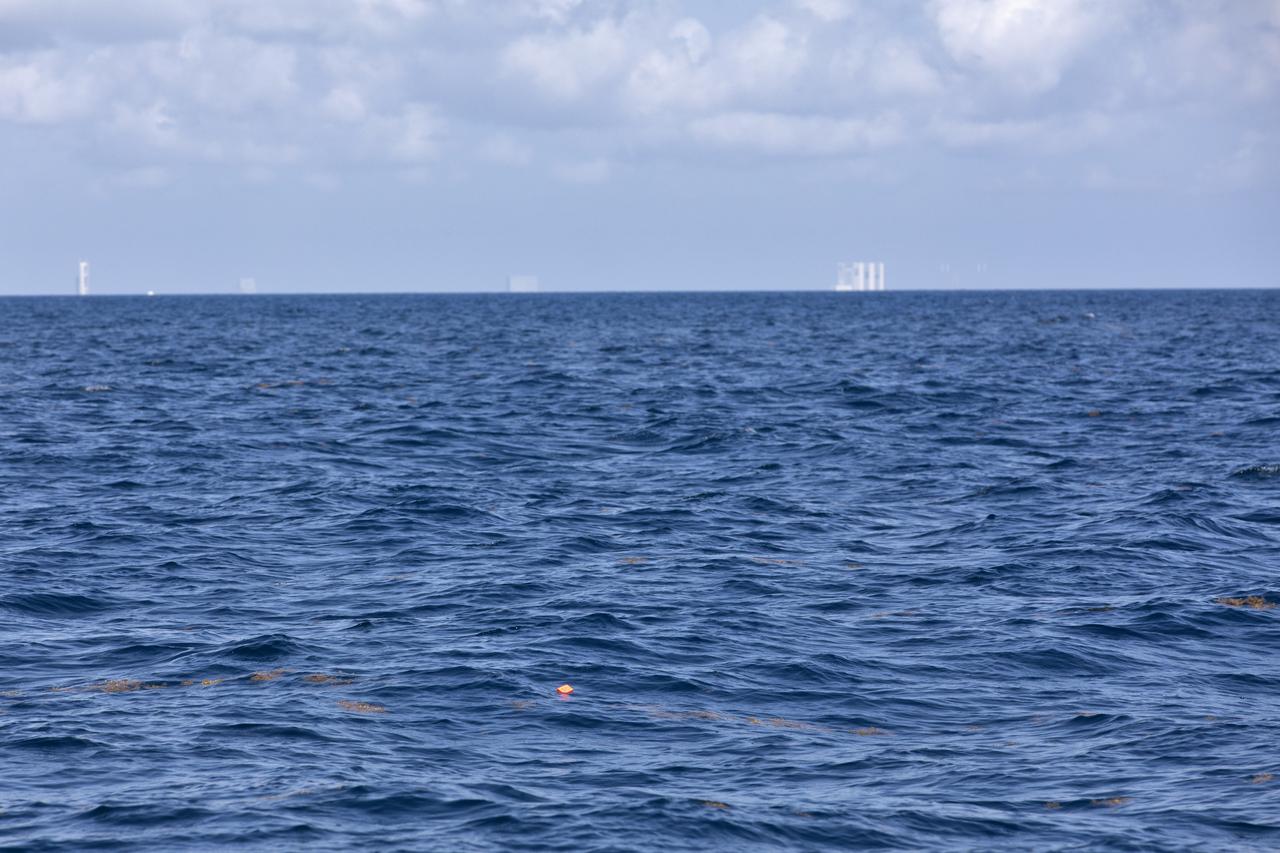
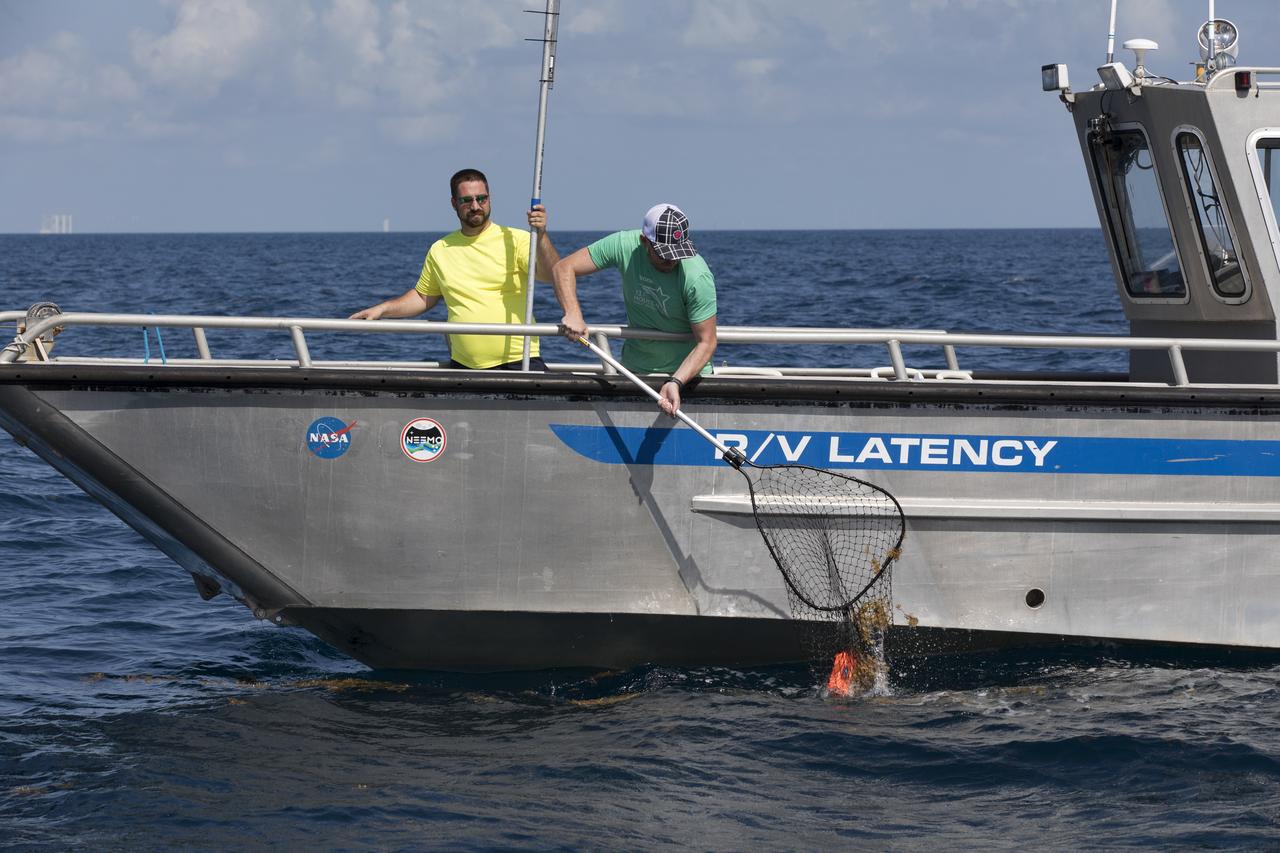
Members of the Ascent Abort-2 (AA-2) Flight Test team perform a drop test of data recording devices about 10 miles off the coast of NASA’s Kennedy Space Center in Florida on Wednesday, Aug. 8, 2018. These devices, called Ejectable Data Recorders (EDRs), were tossed out of a helicopter hovering 5,000 feet over the Atlantic Ocean and retrieved by recovery boats. The AA-2 Flight Test team is evaluating how the systems in the devices react to elements encountered from the sky to the ocean. In April 2019, the EDRs will eject from the Orion test article during a scheduled test of the spacecraft’s Launch Abort System (LAS).
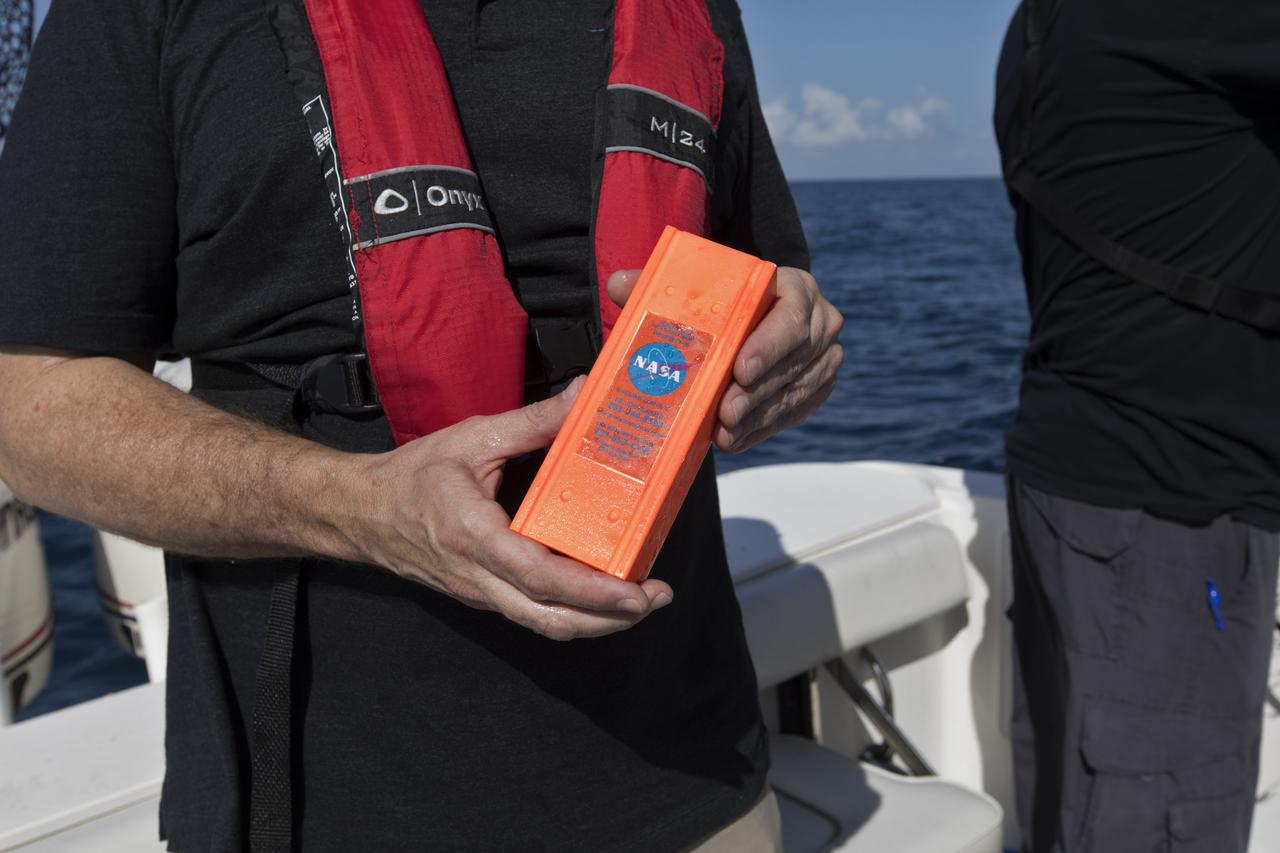
Members of the Ascent Abort-2 (AA-2) Flight Test team perform a drop test of data recording devices about 10 miles off the coast of NASA’s Kennedy Space Center in Florida on Wednesday, Aug. 8, 2018. These devices, called Ejectable Data Recorders (EDRs), were tossed out of a helicopter hovering 5,000 feet over the Atlantic Ocean and retrieved by recovery boats. The AA-2 Flight Test team is evaluating how the systems in the devices react to elements encountered from the sky to the ocean. In April 2019, the EDRs will eject from the Orion test article during a scheduled test of the spacecraft’s Launch Abort System (LAS).
Members of the Ascent Abort-2 (AA-2) Flight Test team perform a drop test of data recording devices about 10 miles off the coast of NASA’s Kennedy Space Center in Florida on Wednesday, Aug. 8, 2018. These devices, called Ejectable Data Recorders (EDRs), were tossed out of a helicopter hovering 5,000 feet over the Atlantic Ocean and retrieved by recovery boats. The AA-2 Flight Test team is evaluating how the systems in the devices react to elements encountered from the sky to the ocean. In April 2019, the EDRs will eject from the Orion test article during a scheduled test of the spacecraft’s Launch Abort System (LAS).
Members of the Ascent Abort-2 (AA-2) Flight Test team perform a drop test of data recording devices about 10 miles off the coast of NASA’s Kennedy Space Center in Florida on Wednesday, Aug. 8, 2018. These devices, called Ejectable Data Recorders (EDRs), were tossed out of a helicopter hovering 5,000 feet over the Atlantic Ocean and retrieved by recovery boats. The AA-2 Flight Test team is evaluating how the systems in the devices react to elements encountered from the sky to the ocean. In April 2019, the EDRs will eject from the Orion test article during a scheduled test of the spacecraft’s Launch Abort System (LAS).
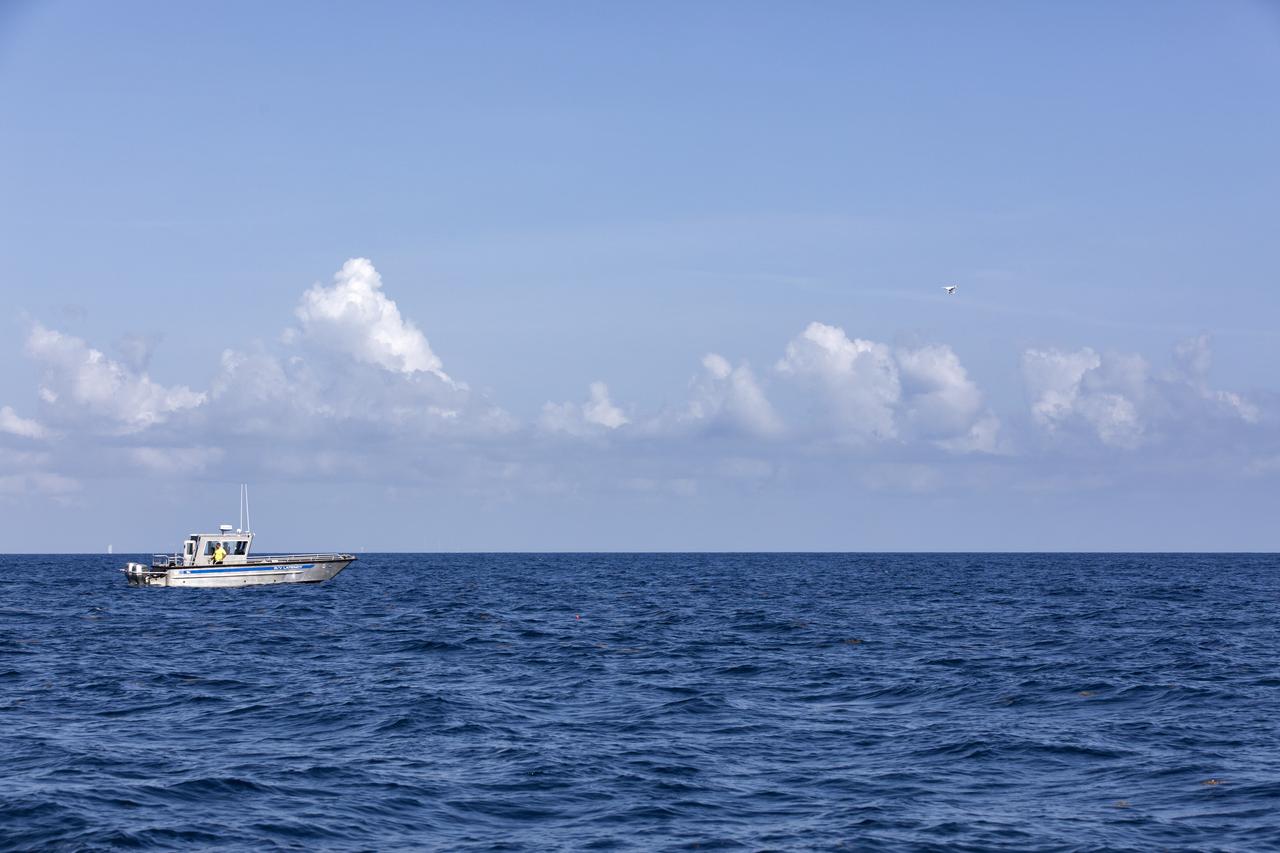
Members of the Ascent Abort-2 (AA-2) Flight Test team perform a drop test of data recording devices about 10 miles off the coast of NASA’s Kennedy Space Center in Florida on Wednesday, Aug. 8, 2018. These devices, called Ejectable Data Recorders (EDRs), were tossed out of a helicopter hovering 5,000 feet over the Atlantic Ocean and retrieved by recovery boats. The AA-2 Flight Test team is evaluating how the systems in the devices react to elements encountered from the sky to the ocean. In April 2019, the EDRs will eject from the Orion test article during a scheduled test of the spacecraft’s Launch Abort System (LAS).

Members of the Ascent Abort-2 (AA-2) Flight Test team perform a drop test of data recording devices about 10 miles off the coast of NASA’s Kennedy Space Center in Florida on Wednesday, Aug. 8, 2018. These devices, called Ejectable Data Recorders (EDRs), were tossed out of a helicopter hovering 5,000 feet over the Atlantic Ocean and retrieved by recovery boats. The AA-2 Flight Test team is evaluating how the systems in the devices react to elements encountered from the sky to the ocean. In April 2019, the EDRs will eject from the Orion test article during a scheduled test of the spacecraft’s Launch Abort System (LAS).

Members of the Ascent Abort-2 (AA-2) Flight Test team perform a drop test of data recording devices about 10 miles off the coast of NASA’s Kennedy Space Center in Florida on Wednesday, Aug. 8, 2018. These devices, called Ejectable Data Recorders (EDRs), were tossed out of a helicopter hovering 5,000 feet over the Atlantic Ocean and retrieved by recovery boats. The AA-2 Flight Test team is evaluating how the systems in the devices react to elements encountered from the sky to the ocean. In April 2019, the EDRs will eject from the Orion test article during a scheduled test of the spacecraft’s Launch Abort System (LAS).
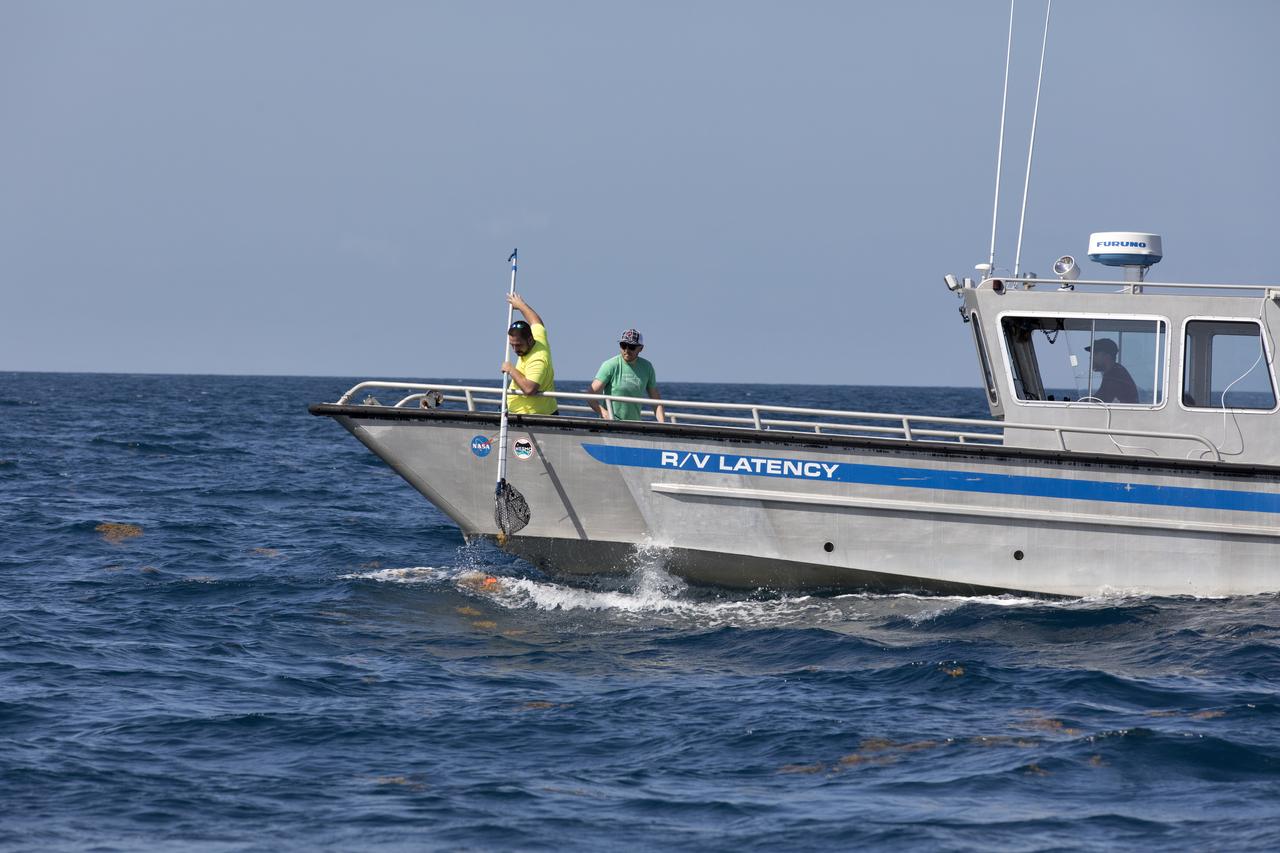
Members of the Ascent Abort-2 (AA-2) Flight Test team perform a drop test of data recording devices about 10 miles off the coast of NASA’s Kennedy Space Center in Florida on Wednesday, Aug. 8, 2018. These devices, called Ejectable Data Recorders (EDRs), were tossed out of a helicopter hovering 5,000 feet over the Atlantic Ocean and retrieved by recovery boats. The AA-2 Flight Test team is evaluating how the systems in the devices react to elements encountered from the sky to the ocean. In April 2019, the EDRs will eject from the Orion test article during a scheduled test of the spacecraft’s Launch Abort System (LAS).
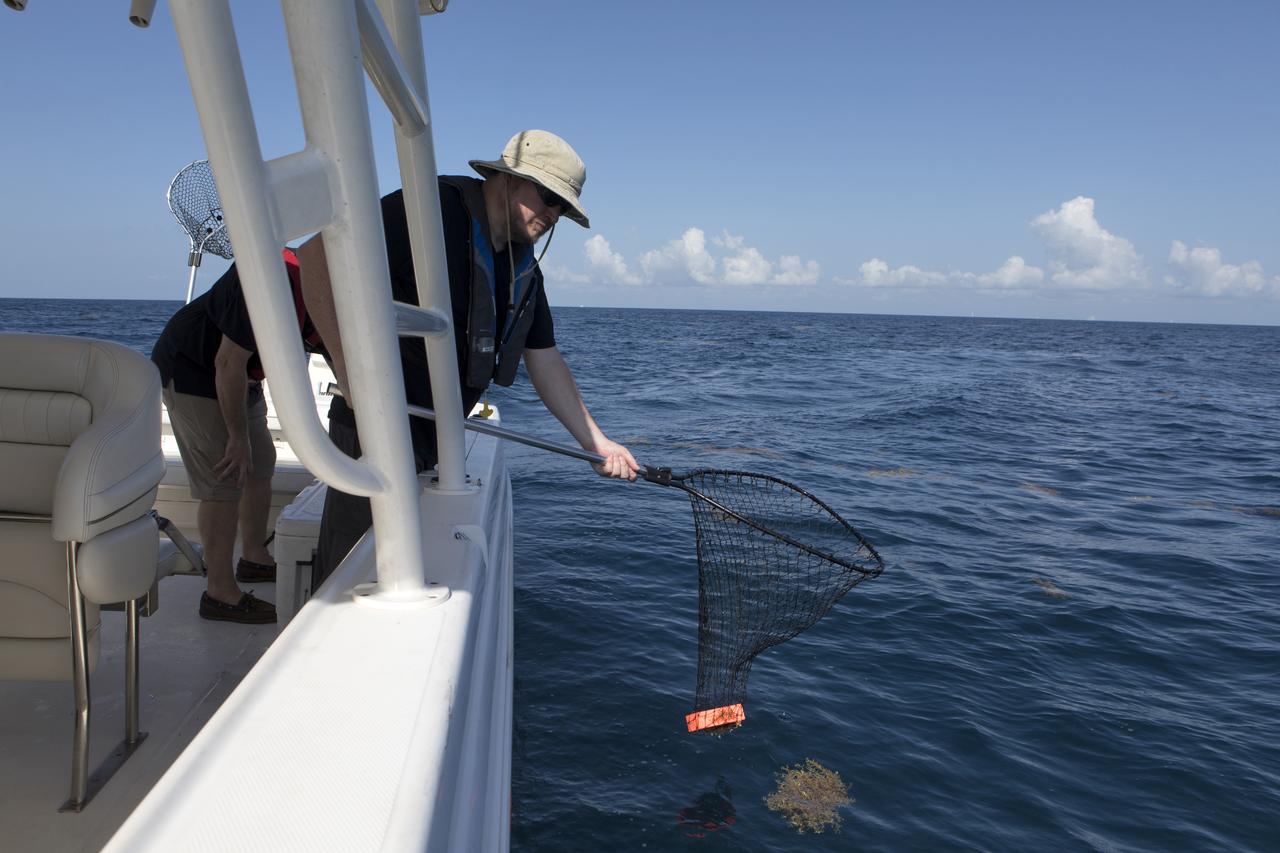
Members of the Ascent Abort-2 (AA-2) Flight Test team perform a drop test of data recording devices about 10 miles off the coast of NASA’s Kennedy Space Center in Florida on Wednesday, Aug. 8, 2018. These devices, called Ejectable Data Recorders (EDRs), were tossed out of a helicopter hovering 5,000 feet over the Atlantic Ocean and retrieved by recovery boats. The AA-2 Flight Test team is evaluating how the systems in the devices react to elements encountered from the sky to the ocean. In April 2019, the EDRs will eject from the Orion test article during a scheduled test of the spacecraft’s Launch Abort System (LAS).
Members of the Ascent Abort-2 (AA-2) Flight Test team perform a drop test of data recording devices about 10 miles off the coast of NASA’s Kennedy Space Center in Florida on Wednesday, Aug. 8, 2018. These devices, called Ejectable Data Recorders (EDRs), were tossed out of a helicopter hovering 5,000 feet over the Atlantic Ocean and retrieved by recovery boats. The AA-2 Flight Test team is evaluating how the systems in the devices react to elements encountered from the sky to the ocean. In April 2019, the EDRs will eject from the Orion test article during a scheduled test of the spacecraft’s Launch Abort System (LAS).
Radar operator Alexander Winteer monitors incoming wind data from the DopplerScatt radar instrument during a science flight off the California Coast on March 5, 2018.
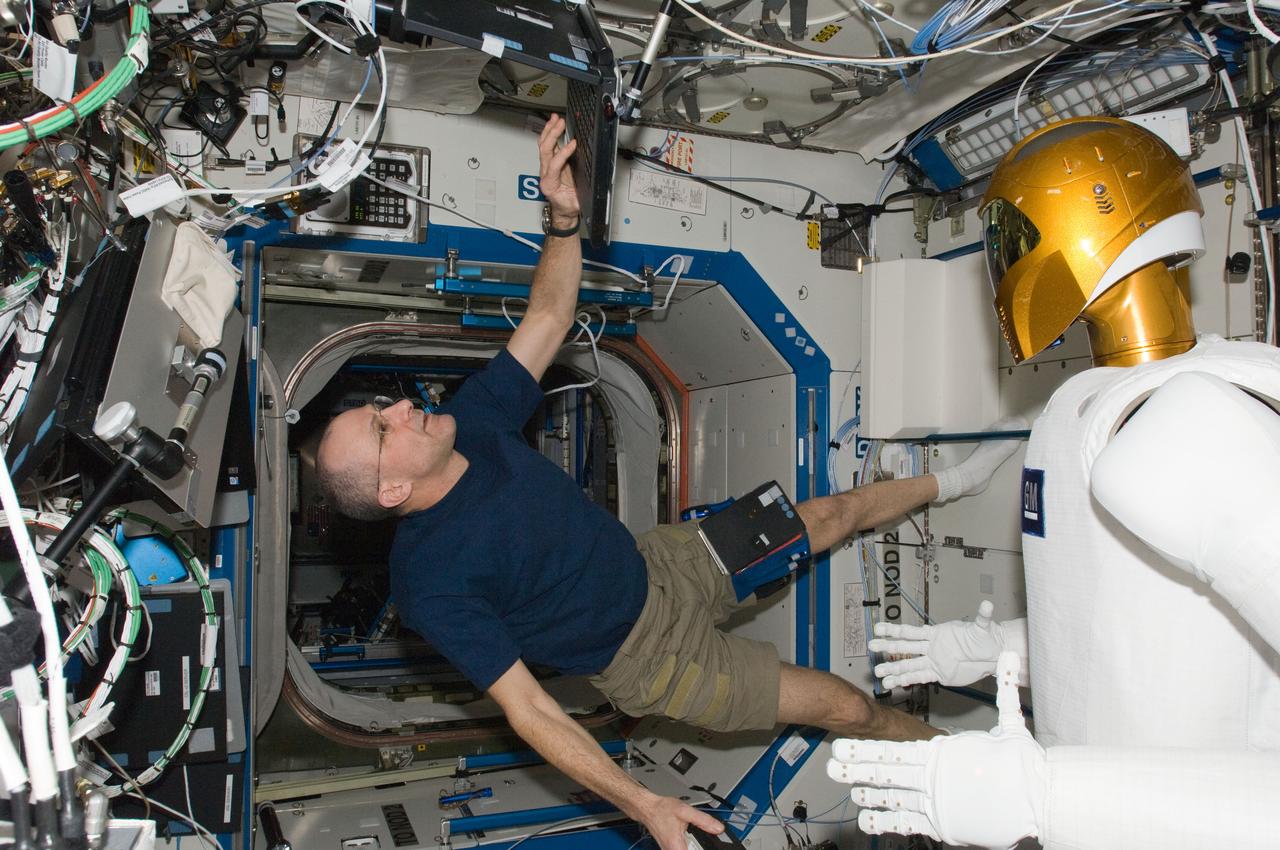
ISS030-E-142862 (13 March 2012) --- NASA astronaut Don Pettit, Expedition 30 flight engineer, enters data in a computer while working with Robonaut 2 humanoid robot in the Destiny laboratory of the International Space Station.
Matt Berry, left, and Chris Jennison examine incoming data on NASA’s DC-8 airborne science aircraft. The 62-year-old ex-airliner is one of seven DC-8s still flying.
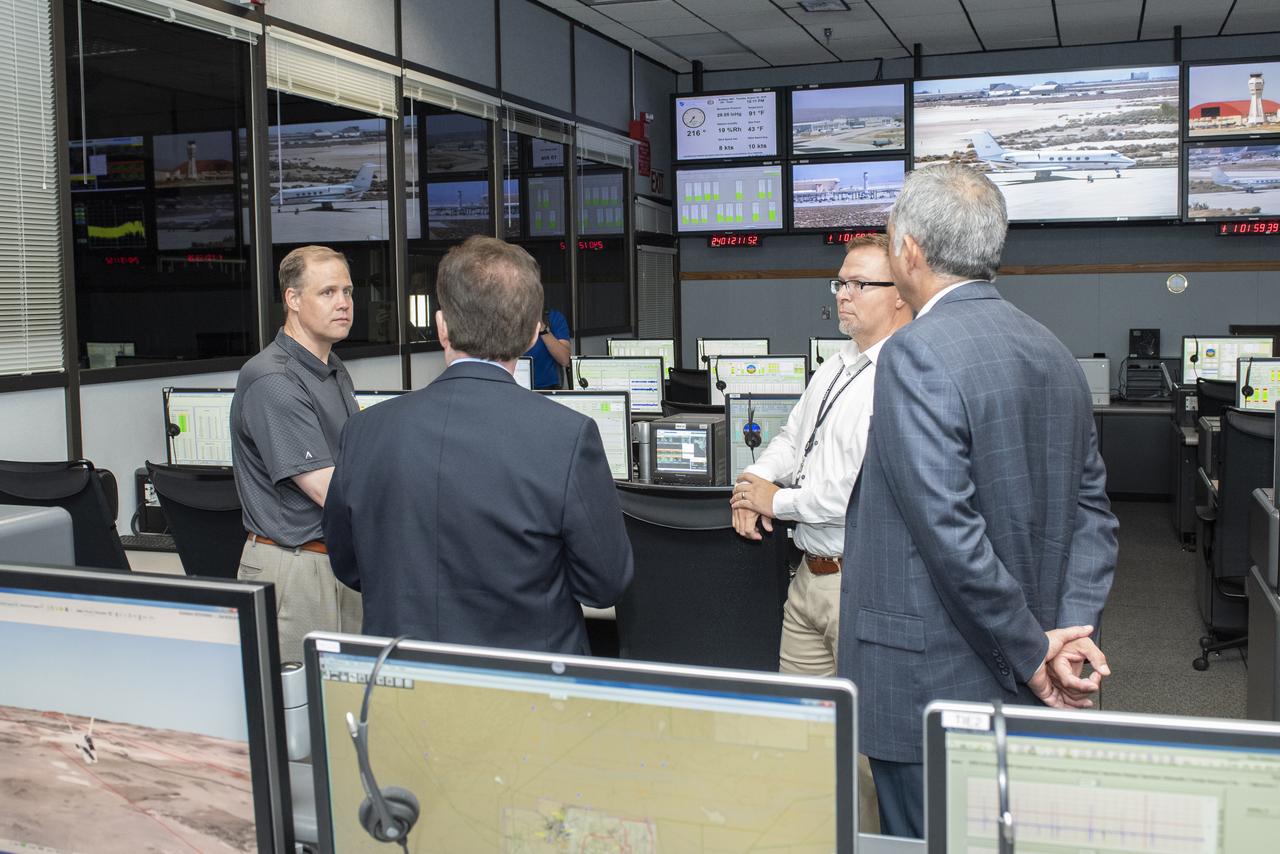
NASA Administrator Bridenstine learns about the many uses for mission control rooms for flight research projects such as monitoring the flights for safety, gathering data and talking to the pilot and project researcher.

The data captured here is one of the outputs of a September 2023 test conducted at NASA's Jet Propulsion Laboratory of a state-of-the-art imaging spectrometer instrument, which will measure the greenhouse gases methane and carbon dioxide from space. The instrument successfully detected the presence of methane (dark blue line near the top of the rainbow band), a greenhouse gas, in a sample cylinder. The rainbow band shown on a screen here is a measure of the intensity of a spectrum of light. Blue is low intensity and red is high intensity. Designed and built by JPL, imaging spectrometer will be part of an effort led by the nonprofit Carbon Mapper organization to collect data on greenhouse gas point-source emissions. The information will help locate and quantify "super-emitters" – the small percentage of individual sources responsible for a significant fraction of methane and carbon dioxide emissions around the world. https://photojournal.jpl.nasa.gov/catalog/PIA26096
S93-45376 (29 Sept 1993) --- Astronaut Rhea Seddon, STS-58 payload commander, participates in data collection for neurovestibular functions. The data collection process was in preparation for the Spacelab Life Sciences (SLS-2) flight scheduled for next month.
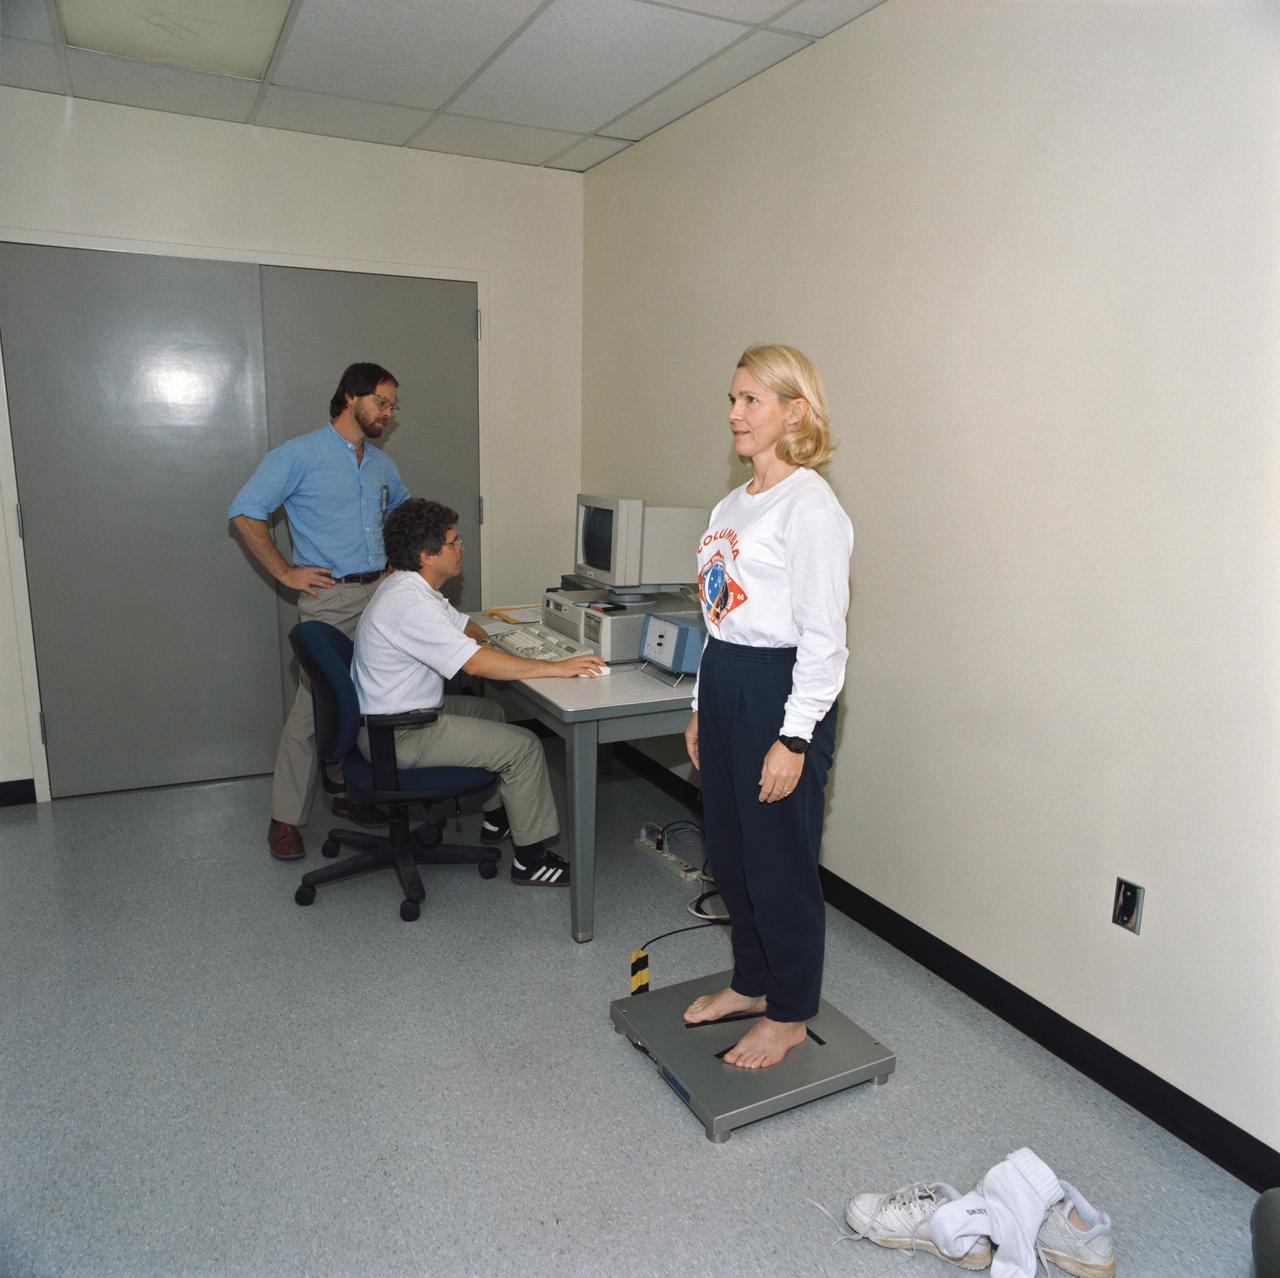
S93-45367 (29 Sept 1993) --- Astronaut Rhea Seddon, STS-58 payload commander, participates in biomedical data collection. The seven member crew spent an entire day recording important pre-flight data in preparation for the two week Spacelab Life Sciences (SLS-2) mission, scheduled for next month.
An in-flight photo of the NASA F-15A used to carry a 10 degree cone to collect aerodynamic data to calibrate the data from wind tunnels. Acting as chase for the flight was a NASA T-38 aircraft.

Computers' at work in 16ft wind tunnel - calculating test data
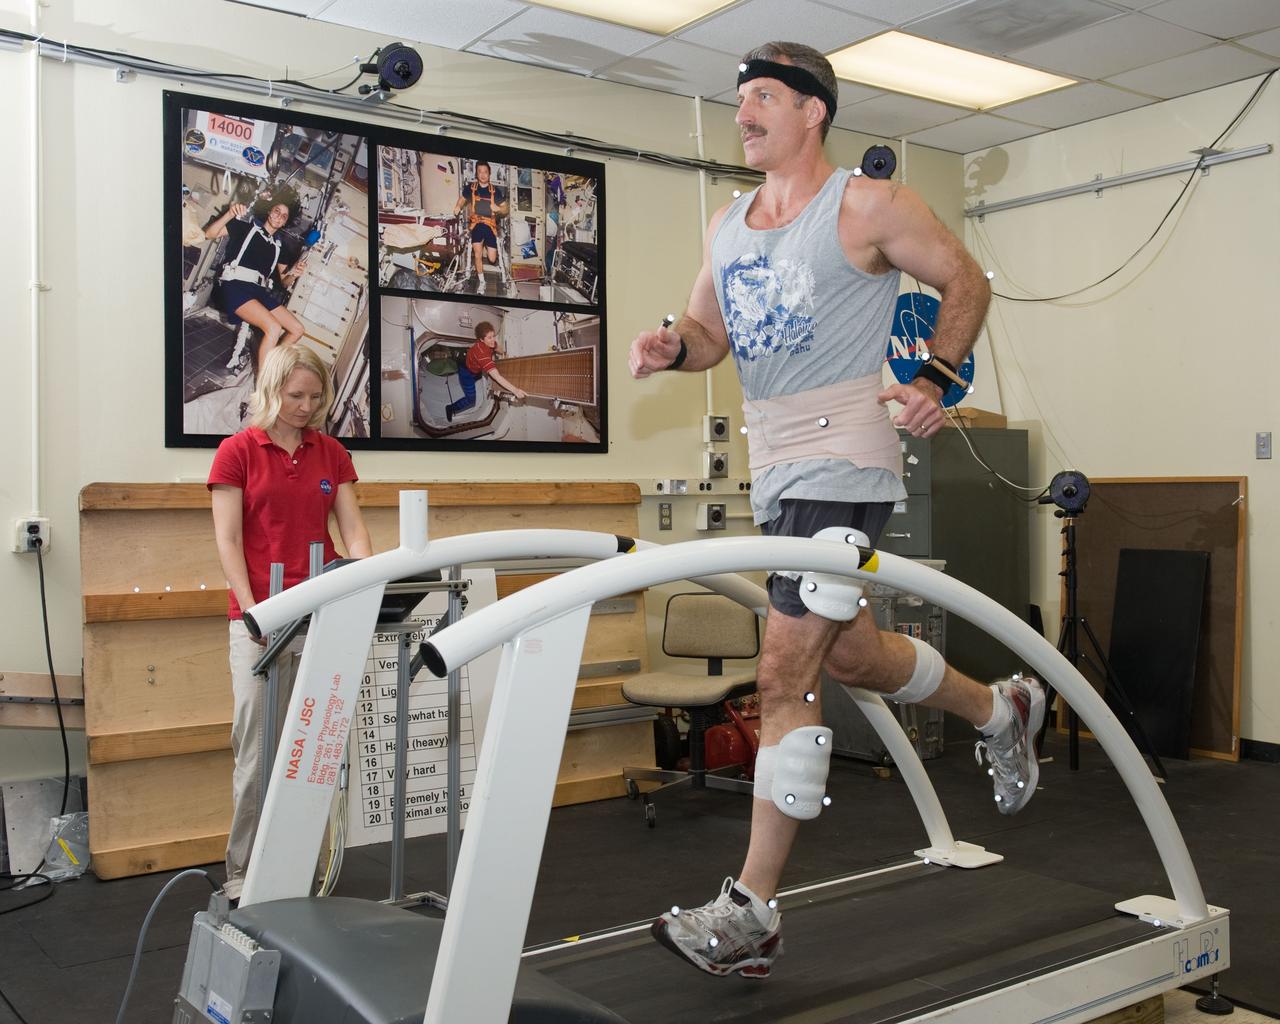
PHOTO DATE: 5-12-11 LOCATION: Building 261 - Room 138 SUBJECT: Expedition 29 Preflight Training with Dan Burbank during Treadmill Kinematics Baseline Data Collection. WORK ORDER: 2011-1214 PHOTOGRAPHER: Lauren Harnett
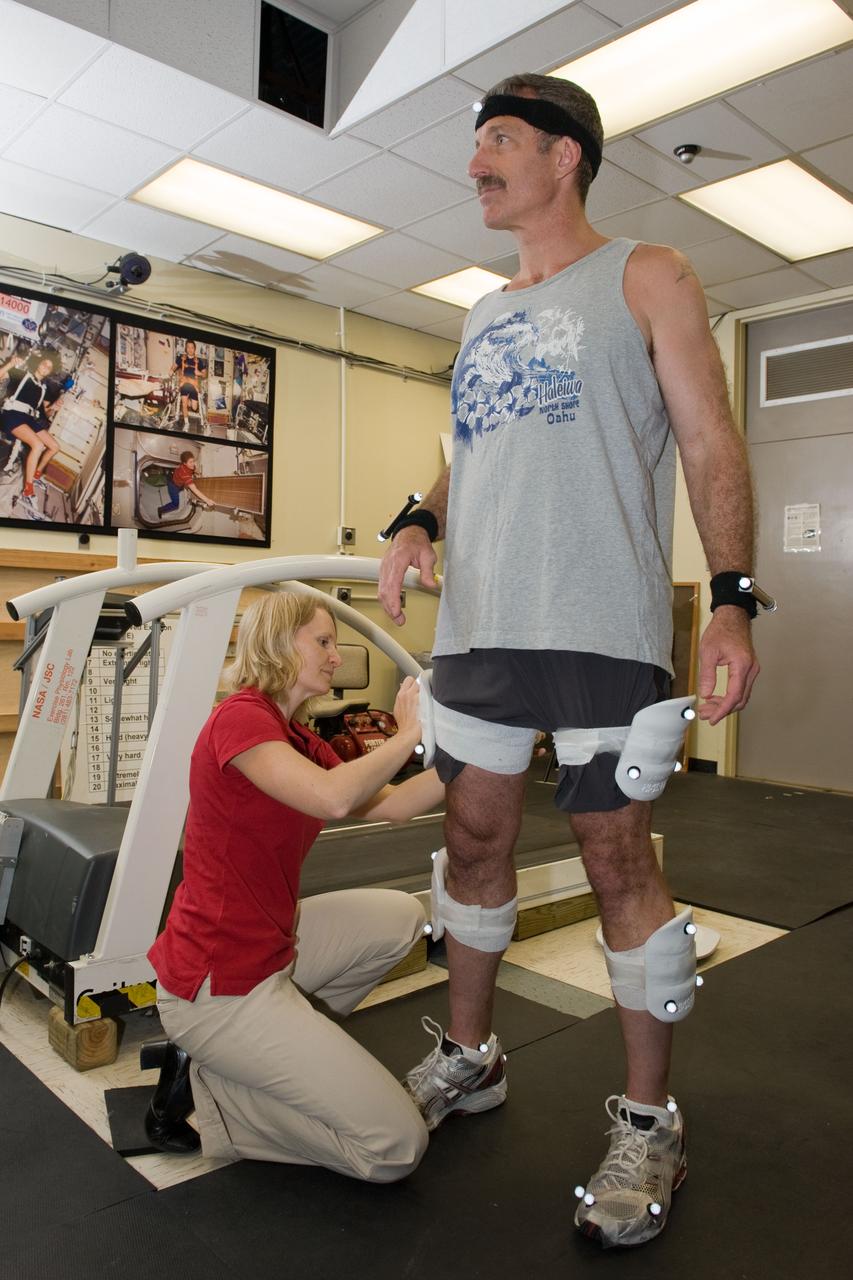
PHOTO DATE: 5-12-11 LOCATION: Building 261 - Room 138 SUBJECT: Expedition 29 Preflight Training with Dan Burbank during Treadmill Kinematics Baseline Data Collection. WORK ORDER: 2011-1214 PHOTOGRAPHER: Lauren Harnett
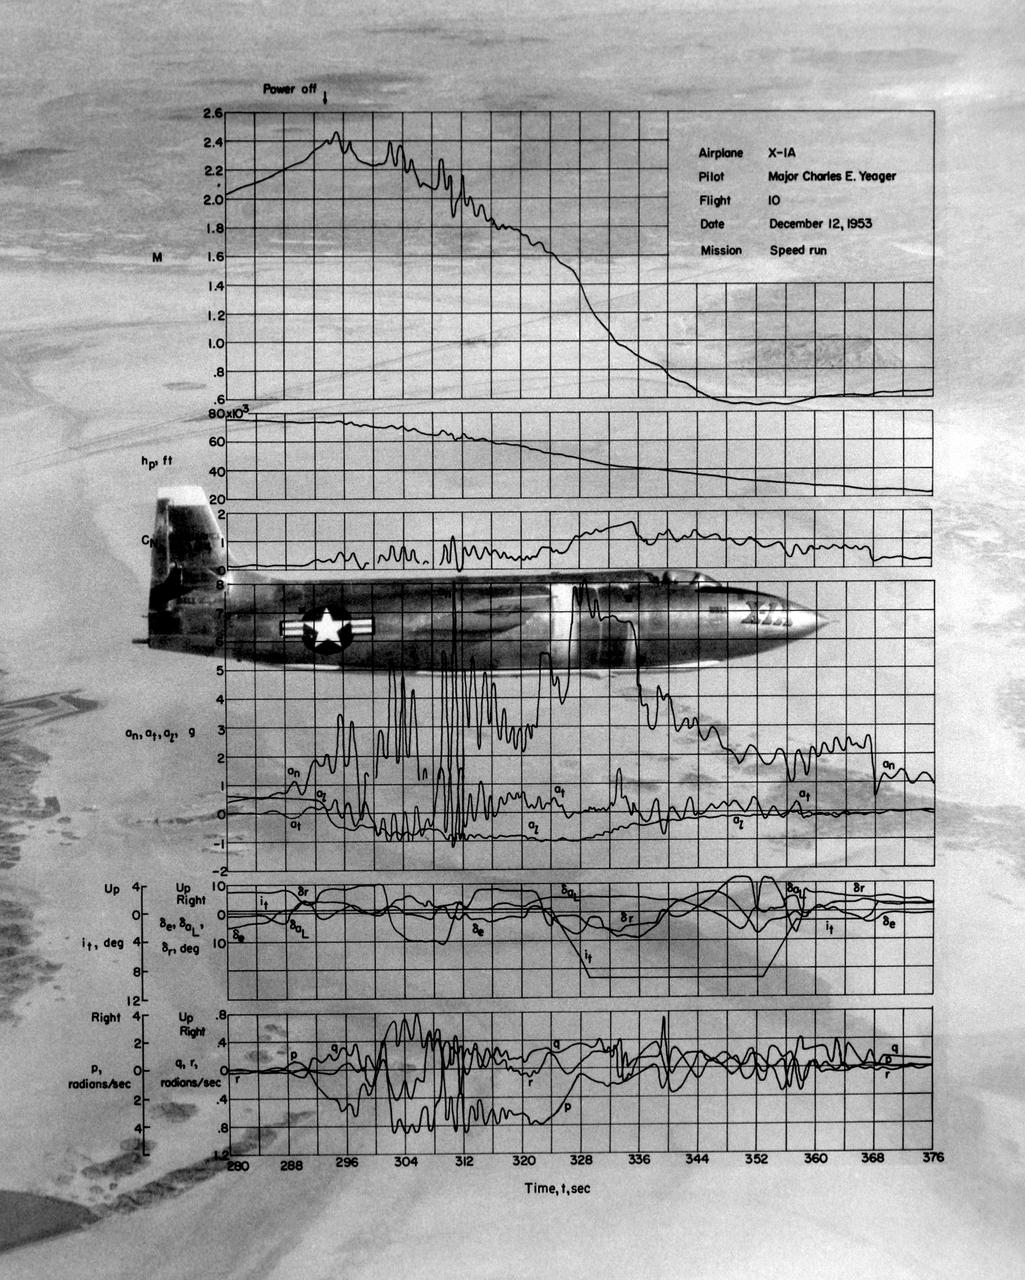
This photo of the X-1A includes graphs of the flight data from Maj. Charles E. Yeager's Mach 2.44 flight on December 12, 1953. (This was only a few days short of the 50th anniversary of the Wright brothers' first powered flight.) After reaching Mach 2.44, then the highest speed ever reached by a piloted aircraft, the X-1A tumbled completely out of control. The motions were so violent that Yeager cracked the plastic canopy with his helmet. He finally recovered from a inverted spin and landed on Rogers Dry Lakebed. Among the data shown are Mach number and altitude (the two top graphs). The speed and altitude changes due to the tumble are visible as jagged lines. The third graph from the bottom shows the G-forces on the airplane. During the tumble, these twice reached 8 Gs or 8 times the normal pull of gravity at sea level. (At these G forces, a 200-pound human would, in effect, weigh 1,600 pounds if a scale were placed under him in the direction of the force vector.) Producing these graphs was a slow, difficult process. The raw data from on-board instrumentation recorded on oscillograph film. Human computers then reduced the data and recorded it on data sheets, correcting for such factors as temperature and instrument errors. They used adding machines or slide rules for their calculations, pocket calculators being 20 years in the future.
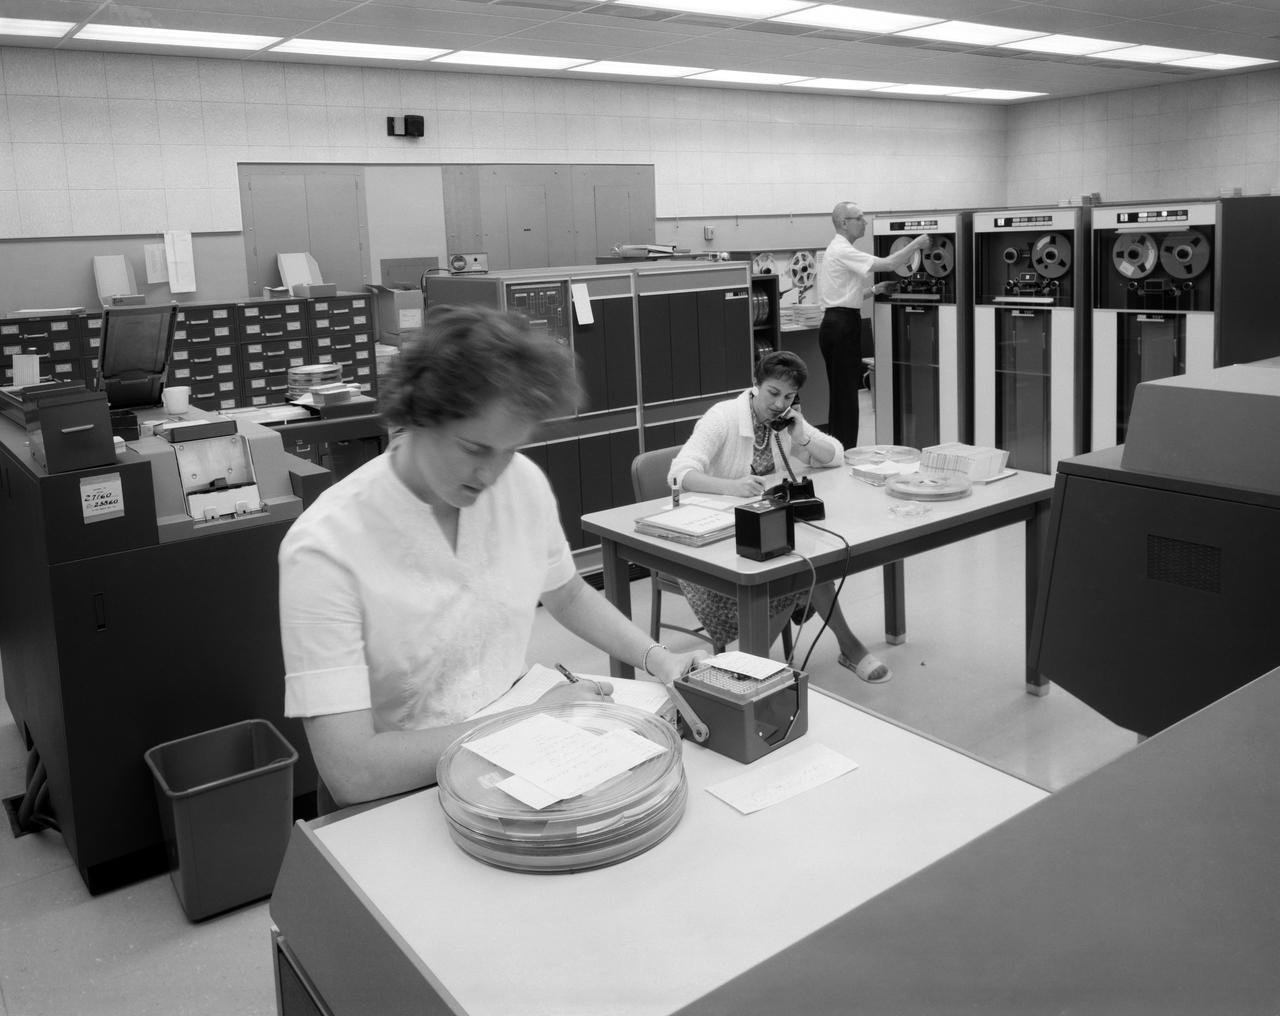
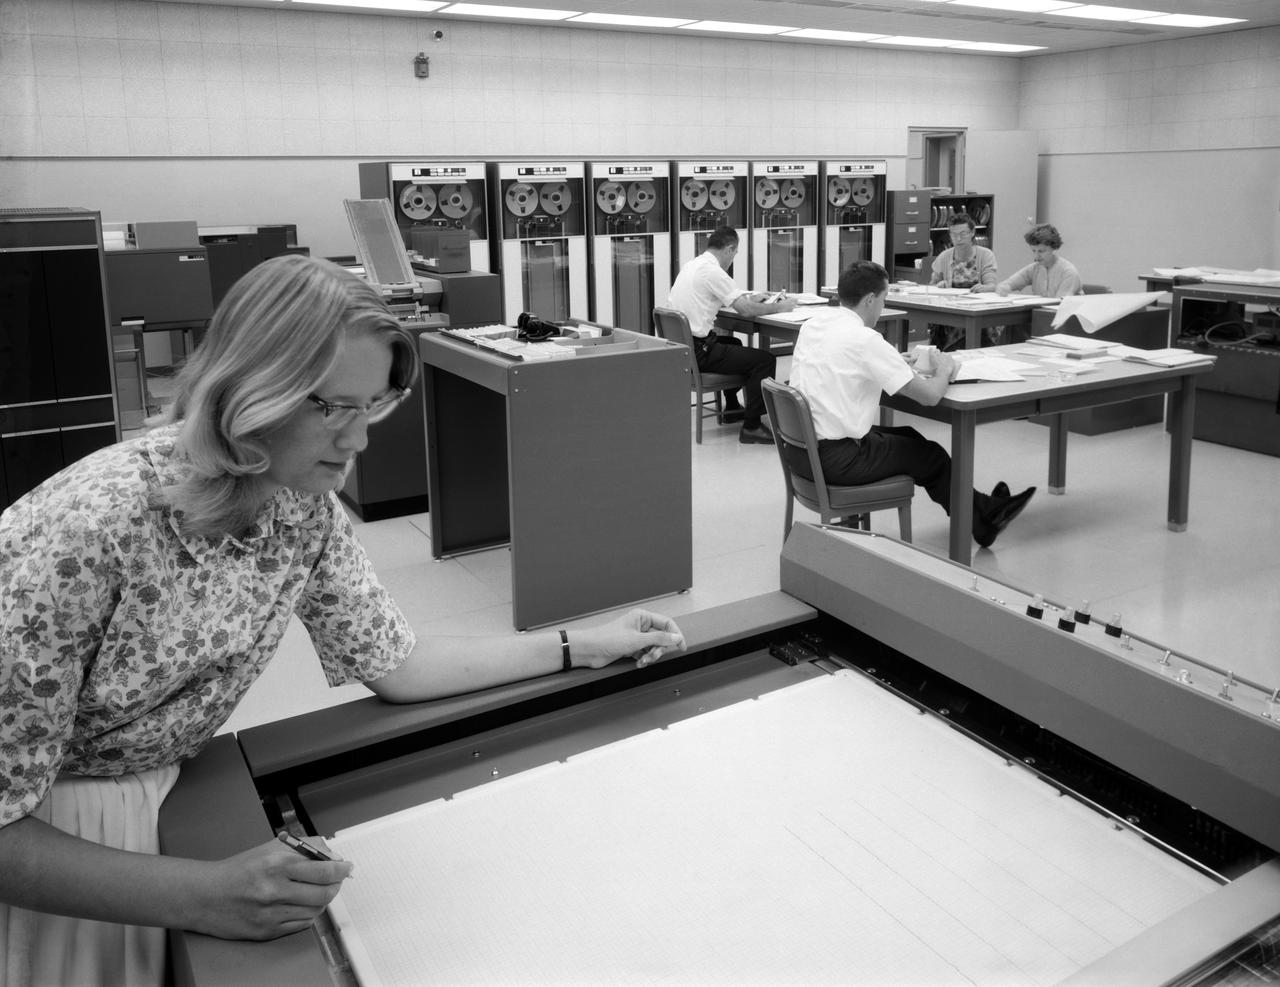
L57-989: Man and woman shown working with IBM type T04 electronic data processing machine.
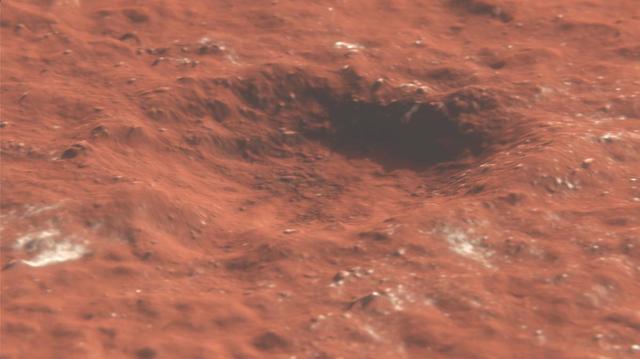
This animation depicts a flyover of a meteoroid impact crater on Mars that's surrounded by boulder-size chunks of ice. The animation was created using data from the High-Resolution Imaging Science Experiment (HiRISE) camera aboard NASA's Mars Reconnaissance Orbiter. The impact occurred on Dec. 24, 2021. Movie available at https://photojournal.jpl.nasa.gov/catalog/PIA25586
NASA image release Oct. 6, 2011 This is an image of the star HR 8799 taken by Hubble's Near Infrared Camera and Multi-Object Spectrometer (NICMOS) in 1998. A mask within the camera (coronagraph) blocks most of the light from the star. In addition, software has been used to digitally subtract more starlight. Nevertheless, scattered light from HR 8799 dominates the image, obscuring the faint planets. Object Name: HR 8799 Image Type: Astronomical Credit: NASA, ESA, and R. Soummer (STScI) To read more go to: <a href="http://www.nasa.gov/mission_pages/hubble/science/elusive-planets.html" rel="nofollow">www.nasa.gov/mission_pages/hubble/science/elusive-planets...</a> <b><a href="http://www.nasa.gov/audience/formedia/features/MP_Photo_Guidelines.html" rel="nofollow">NASA image use policy.</a></b> <b><a href="http://www.nasa.gov/centers/goddard/home/index.html" rel="nofollow">NASA Goddard Space Flight Center</a></b> enables NASA’s mission through four scientific endeavors: Earth Science, Heliophysics, Solar System Exploration, and Astrophysics. Goddard plays a leading role in NASA’s accomplishments by contributing compelling scientific knowledge to advance the Agency’s mission. <b>Follow us on <a href="http://twitter.com/NASA_GoddardPix" rel="nofollow">Twitter</a></b> <b>Like us on <a href="http://www.facebook.com/pages/Greenbelt-MD/NASA-Goddard/395013845897?ref=tsd" rel="nofollow">Facebook</a></b> <b>Find us on <a href="http://instagrid.me/nasagoddard/?vm=grid" rel="nofollow">Instagram</a></b>
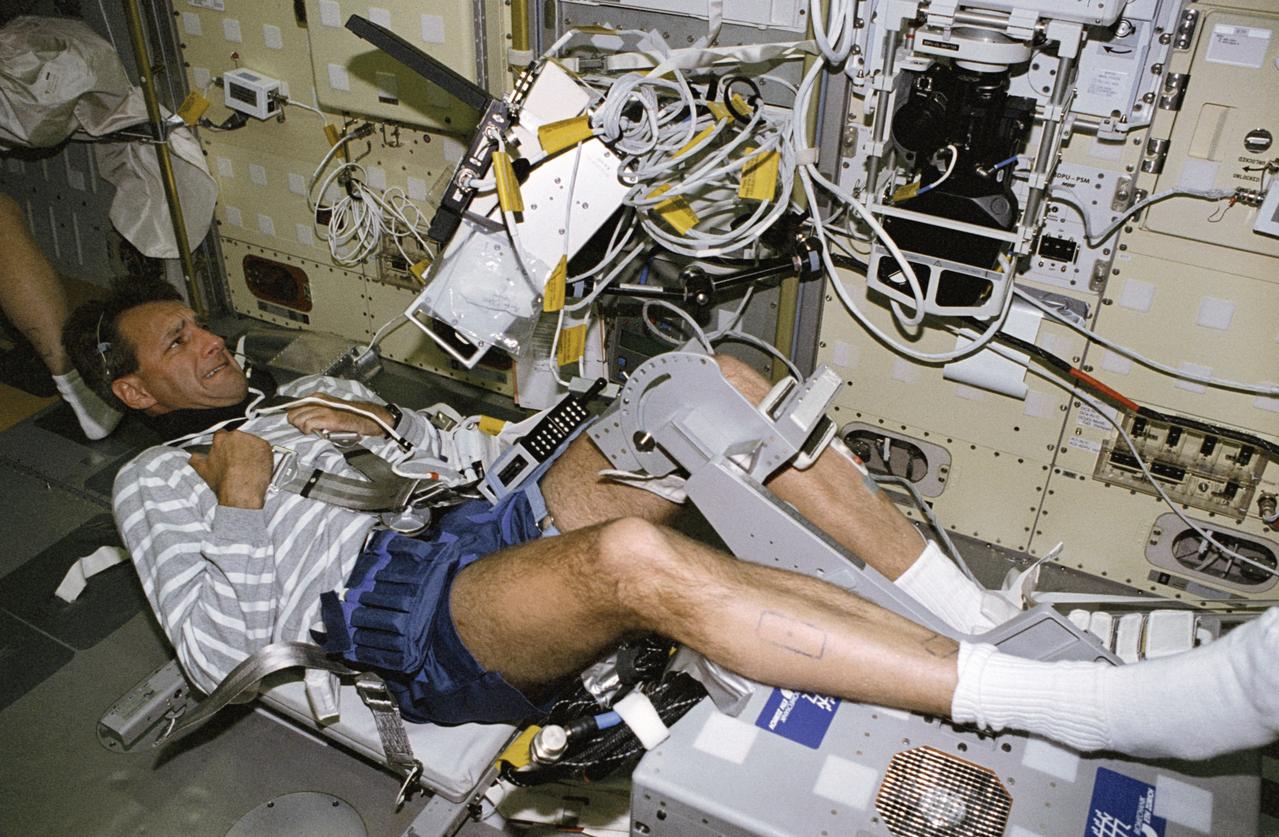
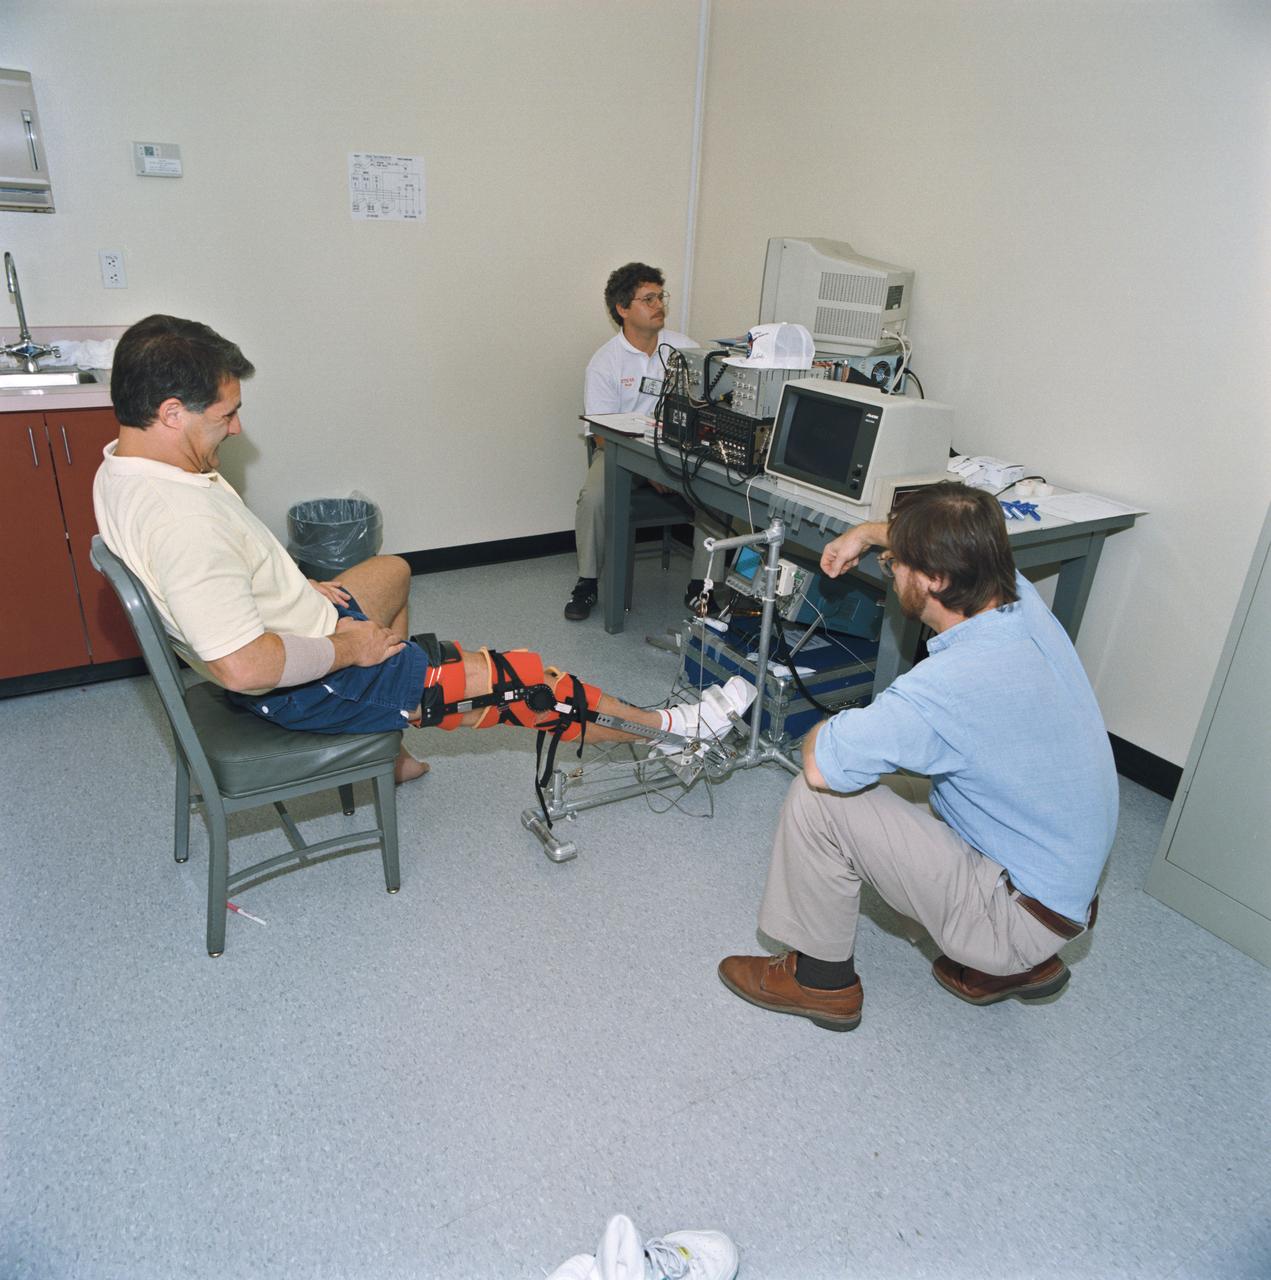
STS078-430-009 (20 June-7 July 1996) --- Astronaut Richard M. Linnehan, mission specialist, performs a test on his leg using the Torque Velocity Dynamometer (TVD). Dr. Thirsk was measuring changes in muscle forces of the leg in this particular view. The TVD hardware is also used to measure arm muscle forces and velocity at the bicep and tricep areas. Crewmembers for the mission performed all experiment protocols prior to flight to develop a baseline and will also perform post-flight tests to complete the analysis. Additionally, muscle biopsies were taken before the flight and will be conducted after the flight.
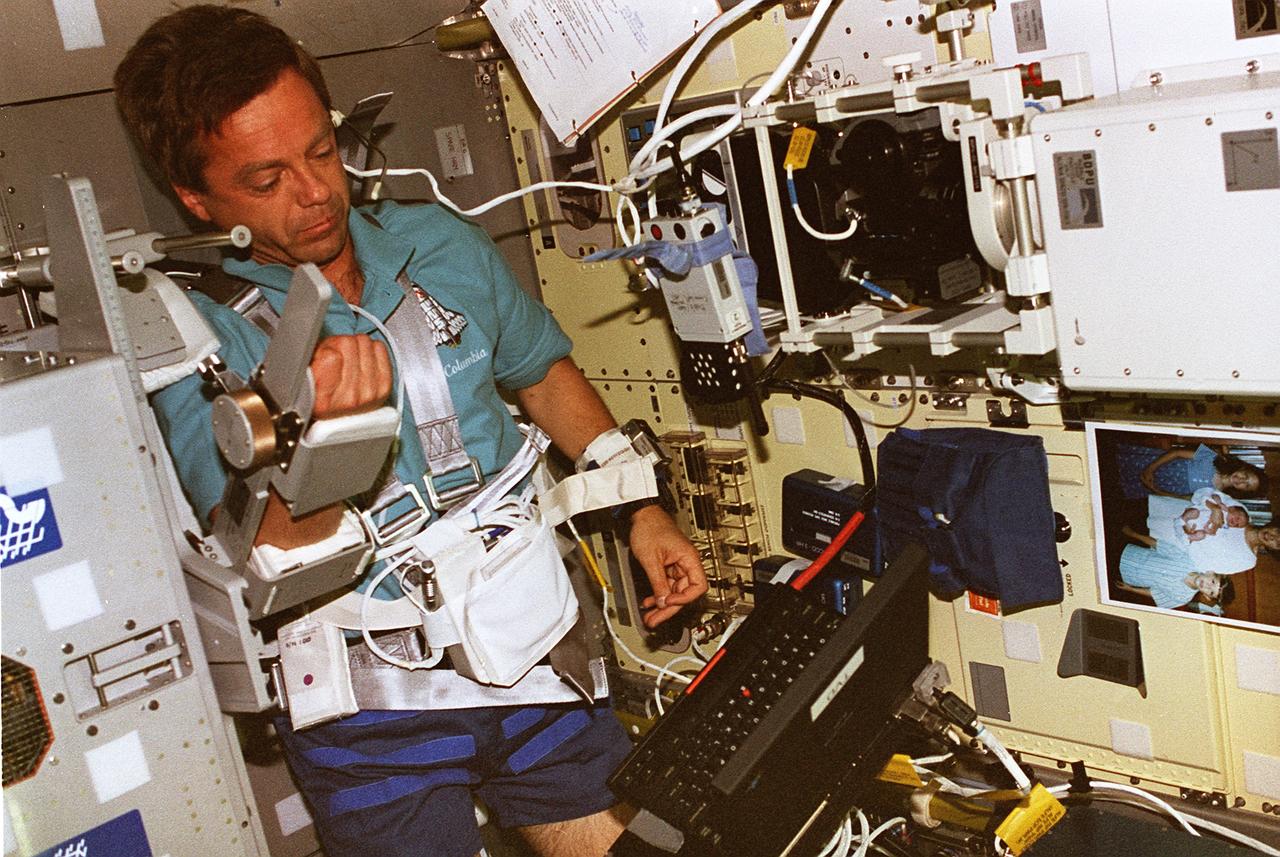
STS078-304-018 (20 June - 7 July 1996) --- Payload specialist Robert B. Thirsk, representing the Canadian Space Agency (CSA), performs a test on his arm using the Torque Velocity Dynamometer (TVD). Dr. Thirsk was measuring changes in muscle forces of the bicep and tricep in this particular view. The TVD hardware is also used to measure leg muscle forces and velocity at the ankle and elbow joints. Crew members for the mission performed all experiment protocols prior to flight to develop a baseline and will also perform post-flight tests to complete the analysis. Additionally, muscle biopsies were taken before the flight and will be conducted after the flight.
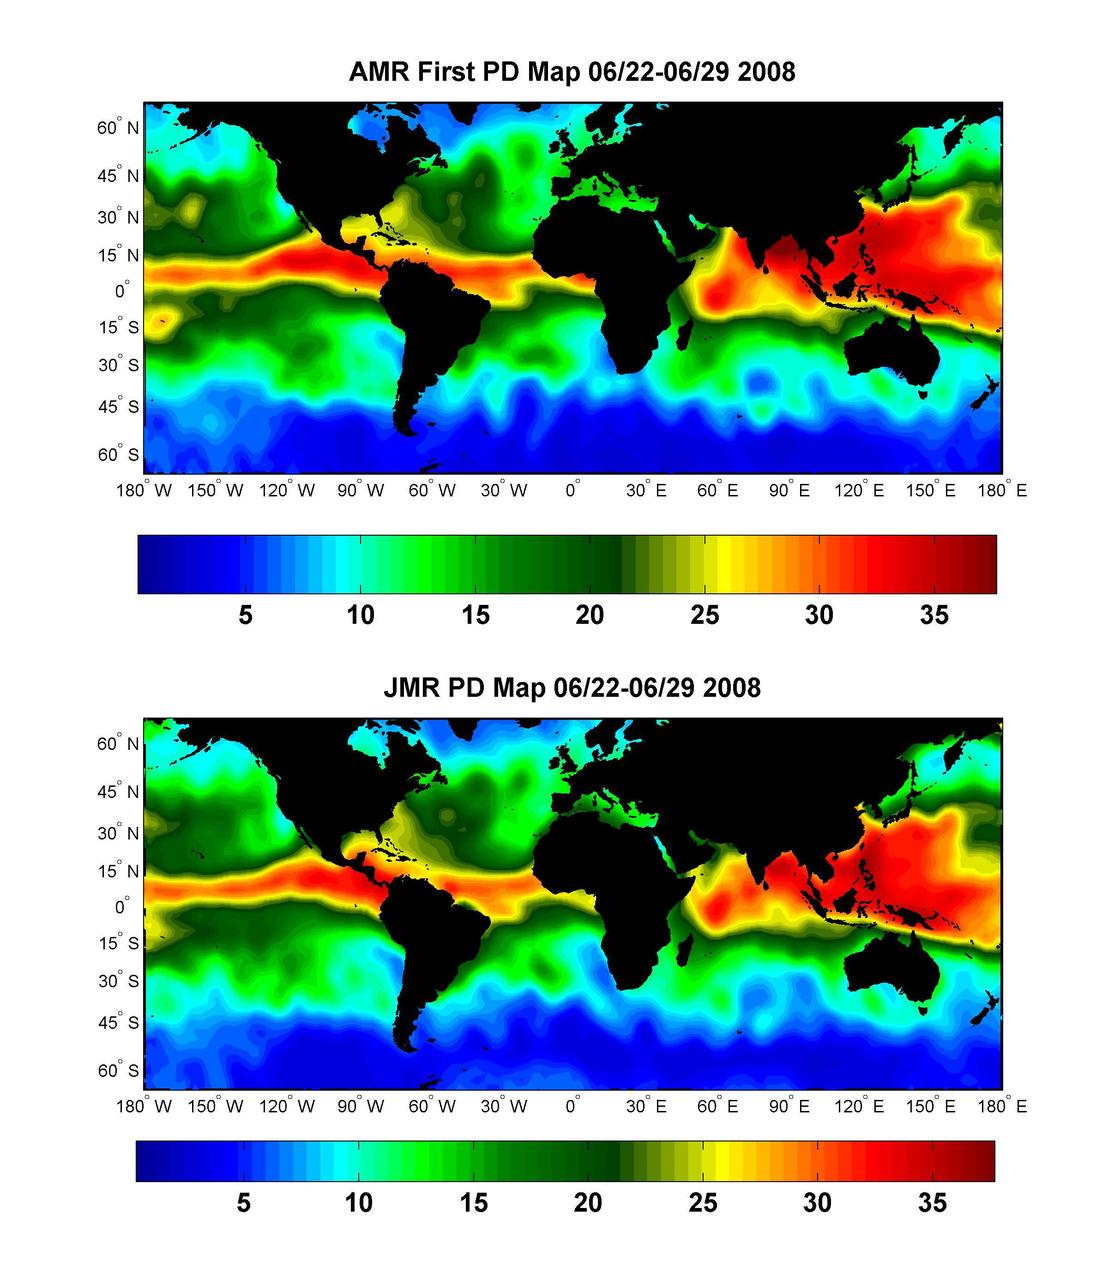
Global Views of Atmospheric Water Vapor:<br />First Data from OSTM/Jason-2 Advanced Microwave Radiometer
Patrick DeGrosse and fellow engineers at NASA's Jet Propulsion Laboratory review data from a recent test of a full-size footpad for a future Mars lander. The 16-inch-diameter (40-centimeter-diameter) footpad was plunged into a test bed filled with 10,000 pounds (4,536 kilograms) of simulated Martian soil in order to see how deep it would sink – too far, and the lander's belly could scrape against the ground during touchdown, damaging it. The Sample Retrieval Lander, which would be central to NASA's Mars Sample Return campaign, is estimated to weigh as much as 5,016 pounds (2,275 kilograms). It would be the heaviest spacecraft ever to land on the Red Planet. In order to understand how energy would be absorbed during the landing of such a massive spacecraft, JPL engineers have been conducting these footpad drop tests. Mars Sample Return will revolutionize our understanding of Mars by bringing scientifically selected samples to Earth for study using the most sophisticated instrumentation around the world. NASA's planned Mars Sample Return (MSR) campaign would fulfill one of the highest priority solar system exploration goals identified by the National Academies of Sciences, Engineering and Medicine in the past three decadal surveys. This strategic partnership with the ESA (European Space Agency) features the first mission to return samples from another planet, including the first launch from the surface of another planet. The samples being collected by NASA's Perseverance rover during its exploration of an ancient river delta are thought to be the best opportunity to reveal the early evolution of Mars, including the potential for ancient life. https://photojournal.jpl.nasa.gov/catalog/PIA25826
S93-45365 (29 Sept 1993) --- Payload specialist Martin J. Fettman, in an oscillating sled device in upper left, participates in a data collection project for neurovestibular functions. His responses to the sled's movements are recorded by a team of monitors in the foreground. The seven Spacelab Life Sciences (SLS-2) crew members devoted a full day to miscellaneous biomedical data collection in preparation for next month's two week mission aboard Columbia.
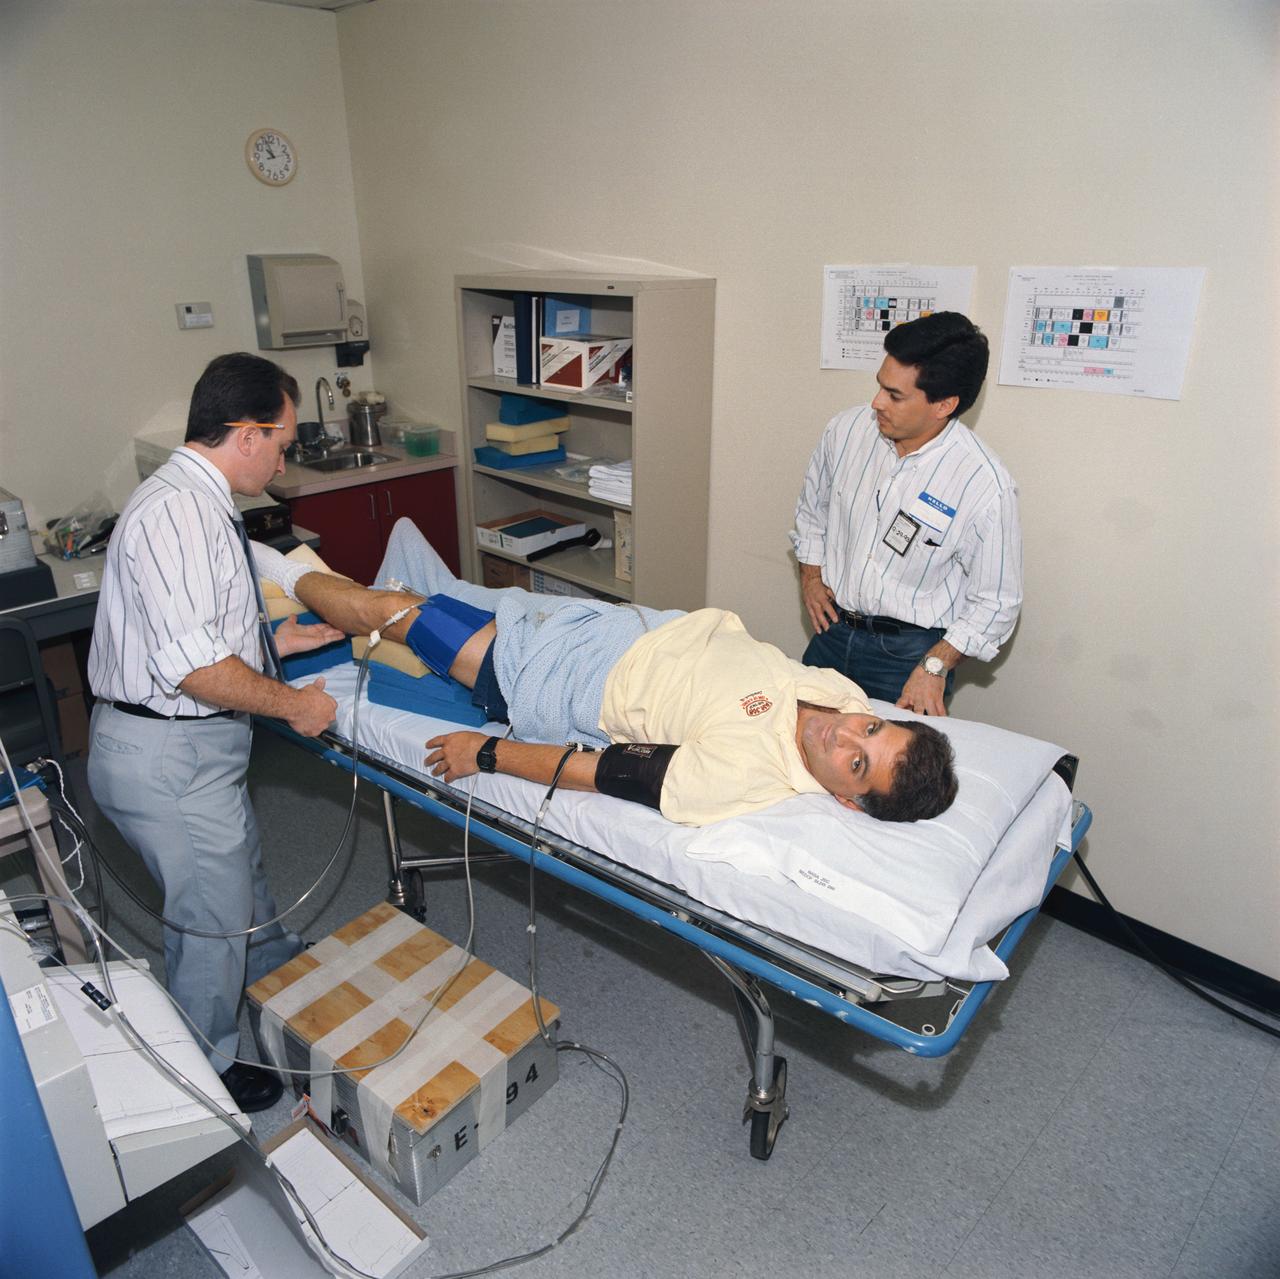
S93-45375 (29 Sept 1993) --- Astronaut David A. Wolf, STS-58 mission specialist, has blood drawn from his leg for volume measuring. The blood draw was part of the cardiovascular function data collection in preparation for the Spacelab Life Sciences (SLS-2) mission. The seven Spacelab Life Sciences crewmembers devoted a full day to miscellaneous biomedical data collection in preparation for next month's two week mission aboard Columbia.
S93-45368 (29 Sept 1993) --- Payload specialist Martin J. Fettman (face obscured), in an oscillating sled device, participates in a data collection project for neurovestibular functions. Assisting the test are Dr. Laurence Young, alternate payload specialist, and an unidentified MIT student. The seven Spacelab Life Sciences (SLS-2) crew members devoted a full day to miscellaneous biomedical data collection in preparation for next month's two week mission aboard Columbia.
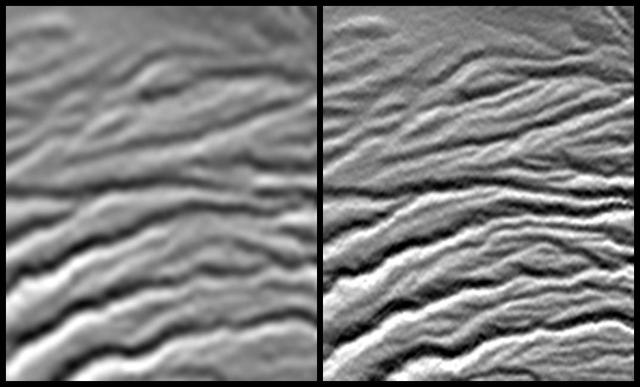
A site in the Crater Highlands of Tanzania reveals the difference between NASA Shuttle Radar Topography Mission SRTM digital elevation model data as originally released in 2004 left and as now released at full resolution in 2014 right.
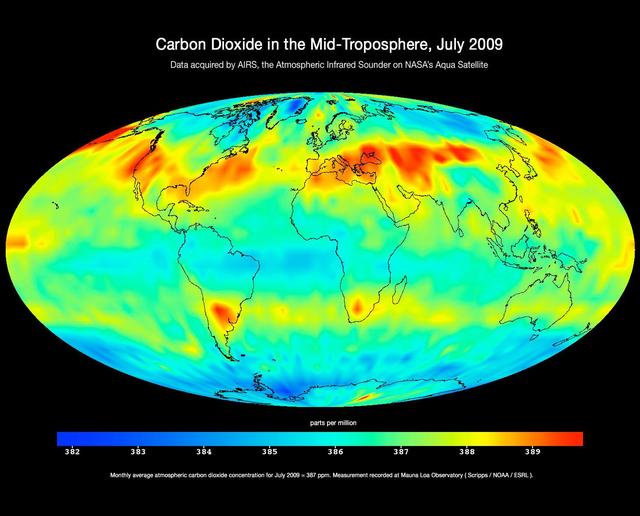
Created with data acquired by JPL Atmospheric Infrared Sounder instrument during July 2009 this image shows large-scale patterns of carbon dioxide concentrations that are transported around Earth by the general circulation of the atmosphere.
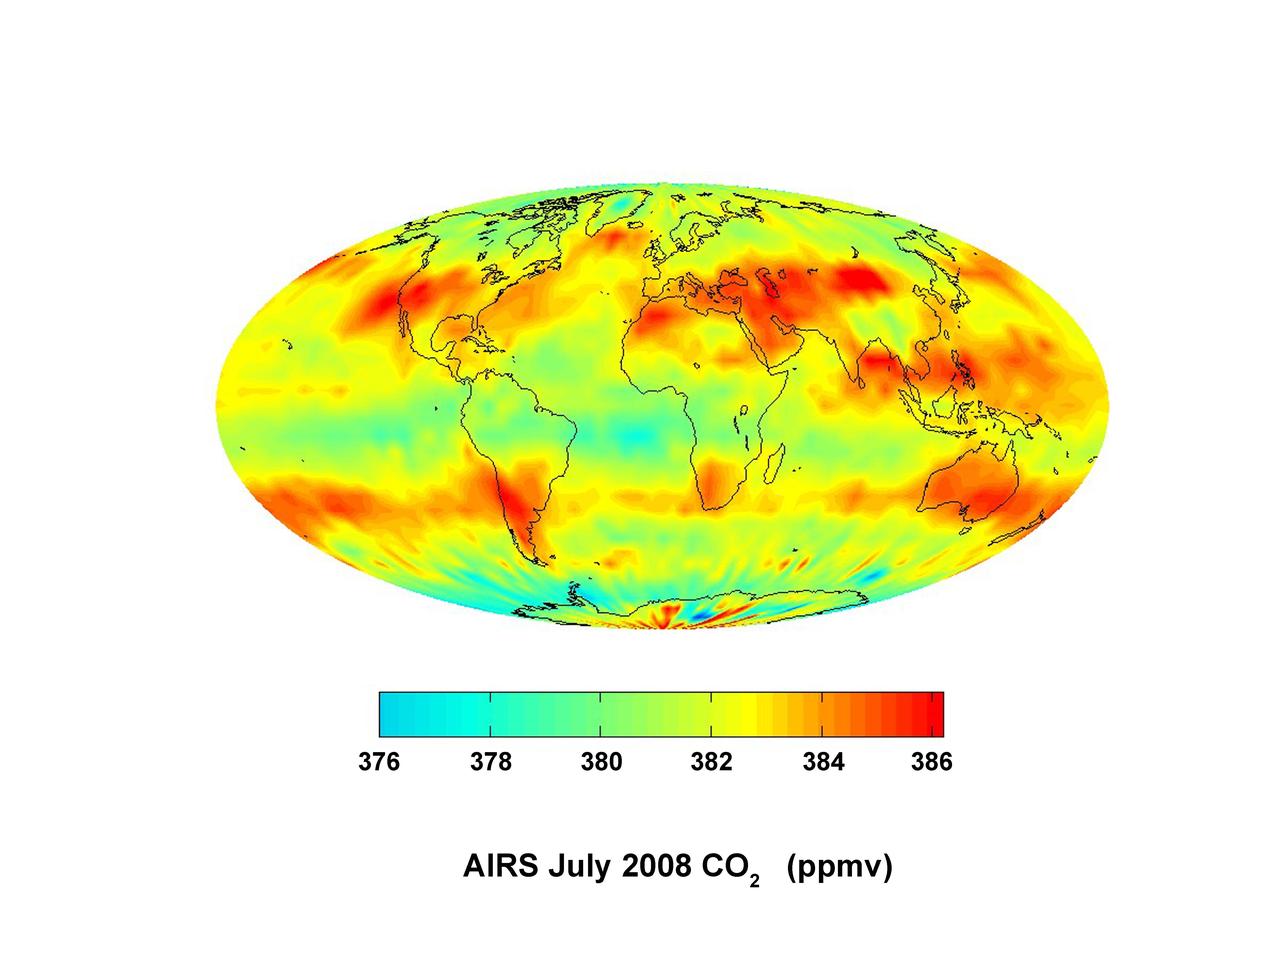
This image was created with data acquired by JPLa Atmospheric Infrared Sounder during July 2008. The image shows large scale patterns of carbon dioxide concentrations that are transported around the Earth by the general circulation of the atmosphere.
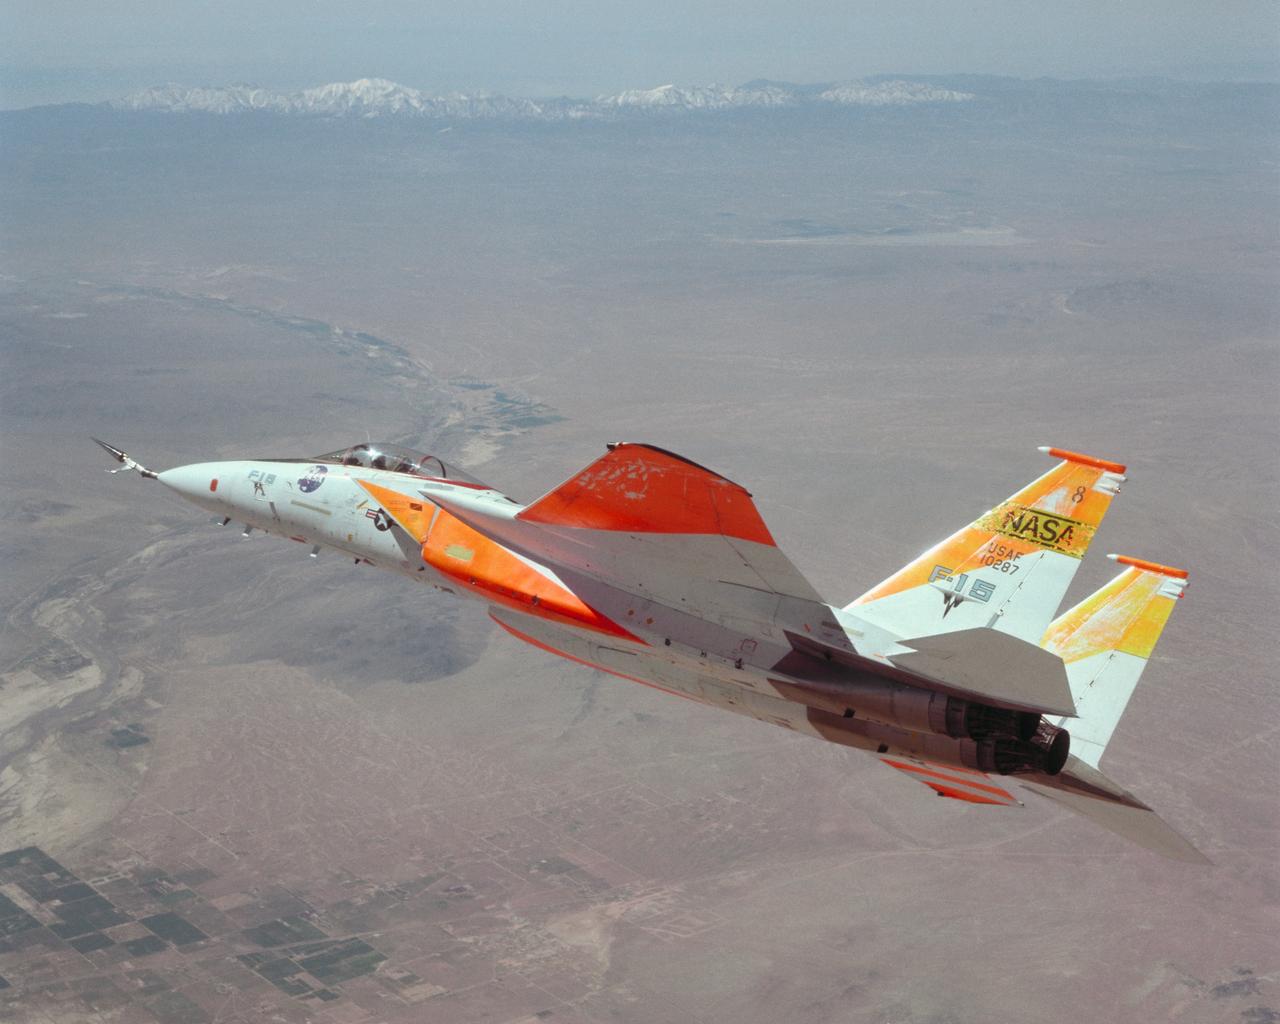
An in-flight photo of the NASA F-15A with a 10 degree cone to collect aerodynamic information to calibrate data from wind tunnels.
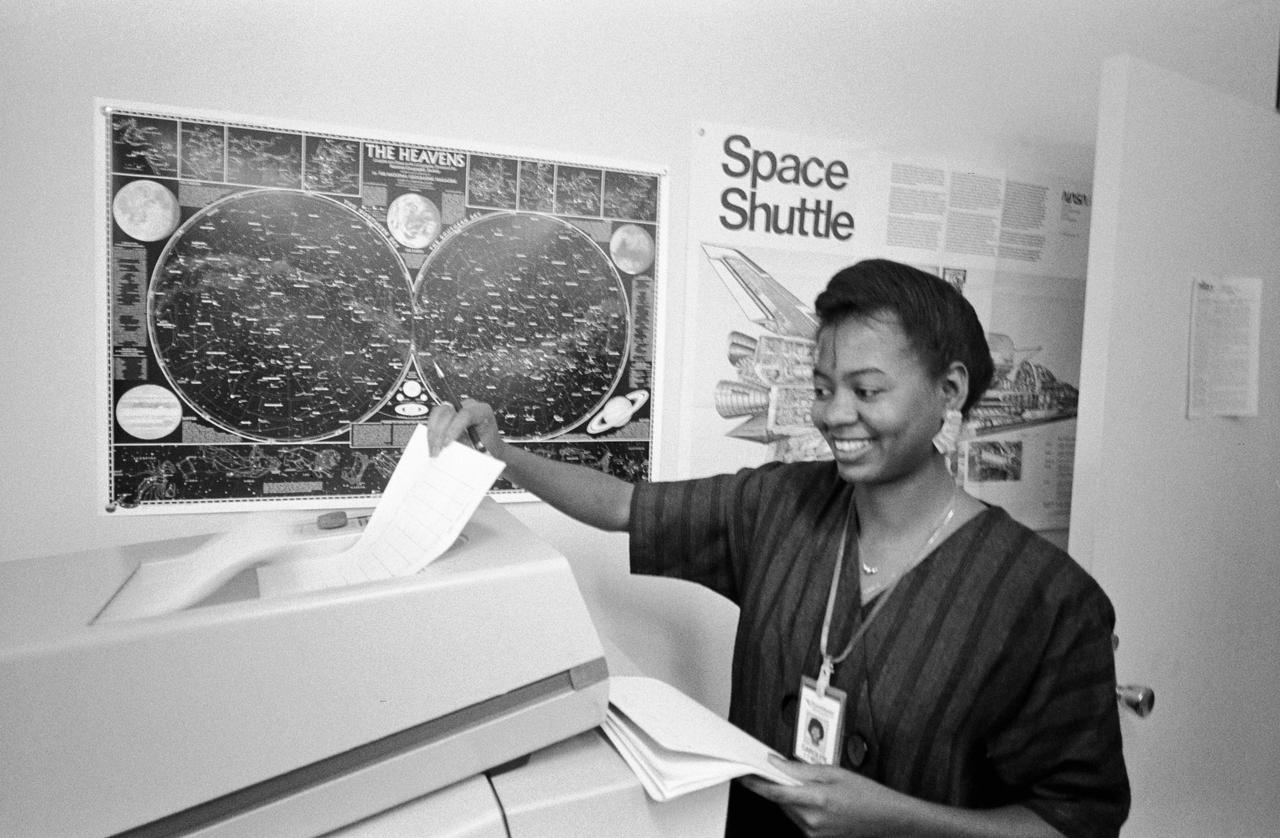
S86-30338 (4 April 1986) --- Carolyn Watson of Lockheed recieves a hard copy print-out of data from the MADS recorder as it is being sent form the termainal in JSC's central data office
S93-45364 (29 Sept 1993) --- Astronaut David A. Wolf, mission specialist, participates in pre-flight data collection for the cardiovascular experiments scheduled to fly aboard Columbia for the Spacelab Life Sciences (SLS-2) mission.
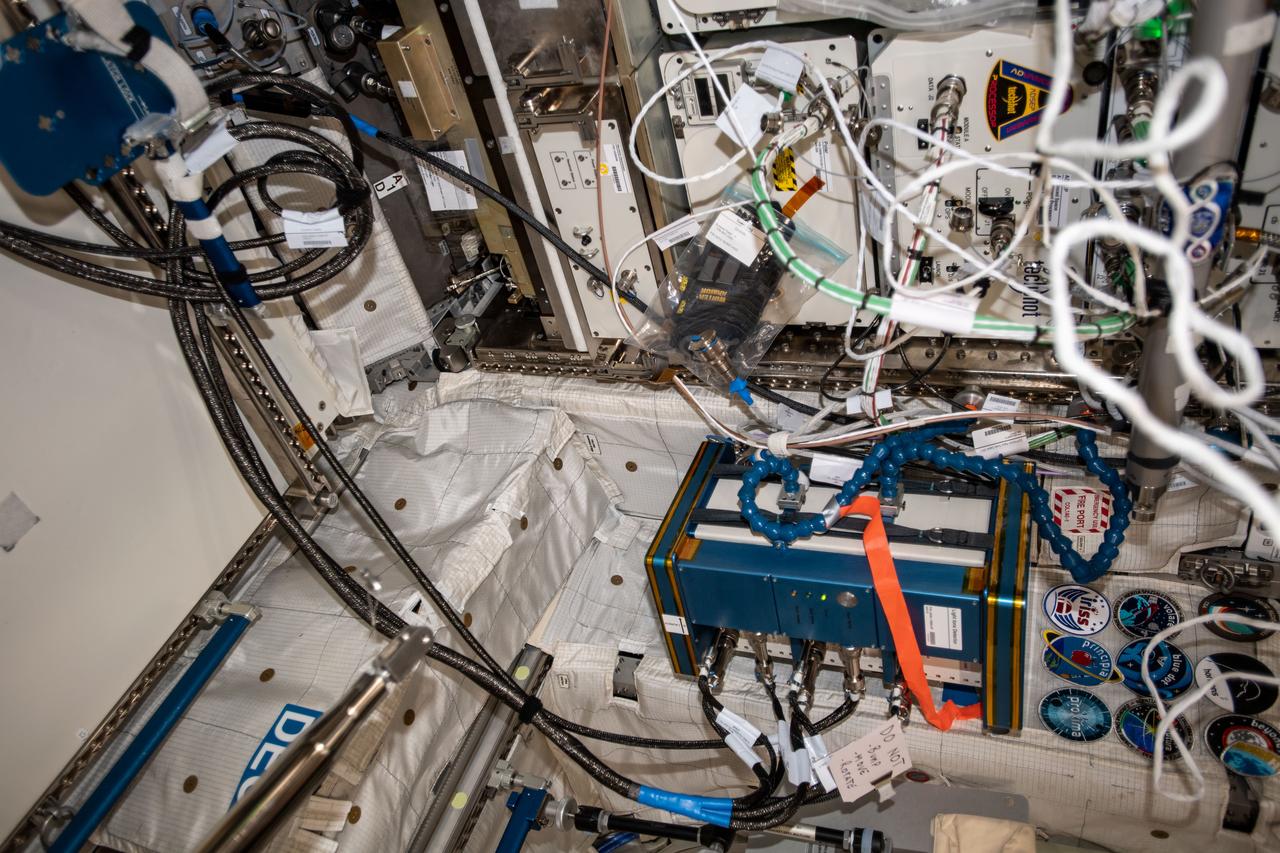
iss062e075413 (3/4/2020) --- A view taken aboard the International space Station (ISS) during the LIDAL Data Acquisition Unit (DAU) move. LIDAL supports ALTEA by helping to provide real-time environmental radiation measurements and monitoring, radiation risk assessment, and radiation models validation aboard the International Space Station. This system could also be of use aboard future manned spacecraft on future exploration missions to the Moon, Mars, and beyond.

STS095-E-5227 (4 Nov. 1998) --- Astronaut Steven W. Lindsey, STS-95 pilot, has done a 180-degree change of posture from earlier frame as he inputs data on a laptop in Spacehab aboard the Space Shuttle Discovery. The photo was taken with an electronic still camera (ESC) at 03:07:52 GMT, Nov. 4.
This image from NASA’s James Webb Space Telescope, containing nearly 800,000 galaxies, is overlaid with a map of dark matter, represented in blue. Brighter blue areas indicate a higher density of dark matter. Researchers used Webb data to find the dark matter — which is invisible — via its gravitational influence on regular matter. The area of sky shown here is 0.54 square degrees (about 2½ times the size of the full Moon) and located in the constellation Sextans. Webb’s Near-Infrared Camera (NIRCam) peered at this region for a total of about 255 hours. Dark matter doesn’t emit, reflect, absorb, or even block light, and is therefore not visible to the human eye or traditional telescopes. But it does interact with the universe through gravity, and large clumps or clusters of dark matter have enough mass to curve space itself. Light traveling to Earth from distant galaxies becomes slightly distorted as it passes through the curved fabric of spacetime. In some cases, the warping is significant enough that it is apparent to the naked eye, almost as if the galaxy were being viewed through a warped windowpane, an effect called strong gravitational lensing. In the case of the dark matter map shown here, scientists inferred dark matter’s distribution by relying instead on an effect called weak gravitational lensing, which leads to much more subtle distortions of the light from thousands of galaxies. The dark matter in this area of sky was also mapped in 2007 using data from NASA’s Hubble Space Telescope. The Webb map contains about 10 times more galaxies than do maps of the area made by ground-based observatories and twice as many as Hubble’s map. It reveals new clumps of dark matter and captures a higher-resolution view compared to the Hubble map. Both the Hubble and Webb dark matter maps are part of a project called the Cosmic Evolution Survey (COSMOS). The full COSMOS “field” is 2 square degrees (about 10 times the size of the full Moon) and has been imaged by at least 15 telescopes in space and on the ground. Observing the same region with many different telescopes allows scientists to combine complementary views to understand how galaxies grow and how dark matter influences their evolution. Only Webb and Hubble data have been used to map dark matter in the region. To refine measurements of the distance to many galaxies for the map, the team used Webb’s Mid-Infrared Instrument (MIRI), designed and managed through launch by the agency’s Jet Propulsion Laboratory, along with other space- and ground-based telescopes. The wavelengths that MIRI detects also make it adept at detecting galaxies obscured by cosmic dust clouds. The James Webb Space Telescope is solving mysteries in our solar system, looking beyond to distant worlds around other stars, and probing the mysterious structures and origins of our universe and our place in it. Webb is an international program led by NASA with its partners, ESA (European Space Agency) and CSA (Canadian Space Agency). Webb’s MIRI was developed through a 50-50 partnership between NASA and ESA. A division of Caltech in Pasadena, California, JPL led the U.S. contribution to MIRI. JPL also led development of MIRI’s cryocooler, done in collaboration with Northrop Grumman in Redondo Beach, California, and NASA’s Goddard Space Flight Center in Greenbelt, Maryland. To learn more about Webb, visit: https://science.nasa.gov/webb
While NASA’s F/A-18 goes supersonic off the coast, a team of researchers monitor the flight and operate multiple sound monitor stations around Galveston and its surrounding area. This allows NASA to obtain accurate sound level data, which gets matched to community response data.
While NASA's F/A-18 goes supersonic off the coast, a team of researchers monitor the flight and operate multiple sound monitor stations around Galveston and its surrounding area. This allows NASA to obtain accurate sound level data, which gets matched to community response data.
While NASA's F/A-18 goes supersonic off the coast, a team of researchers monitor the flight and operate multiple sound monitor stations around Galveston and its surrounding area. This allows NASA to obtain accurate sound level data, which gets matched to community response data.
While NASA's F/A-18 goes supersonic off the coast, a team of researchers monitor the flight and operate multiple sound monitor stations around Galveston and its surrounding area. This allows NASA to obtain accurate sound level data, which gets matched to community response data.
While NASA’s F/A-18 goes supersonic off the coast, a team of researchers monitor the flight and operate multiple sound monitor stations around Galveston and its surrounding area. This allows NASA to obtain accurate sound level data, which gets matched to community response data.
While NASA’s F/A-18 goes supersonic off the coast, a team of researchers monitor the flight and operate multiple sound monitor stations around Galveston and its surrounding area. This allows NASA to obtain accurate sound level data, which gets matched to community response data.