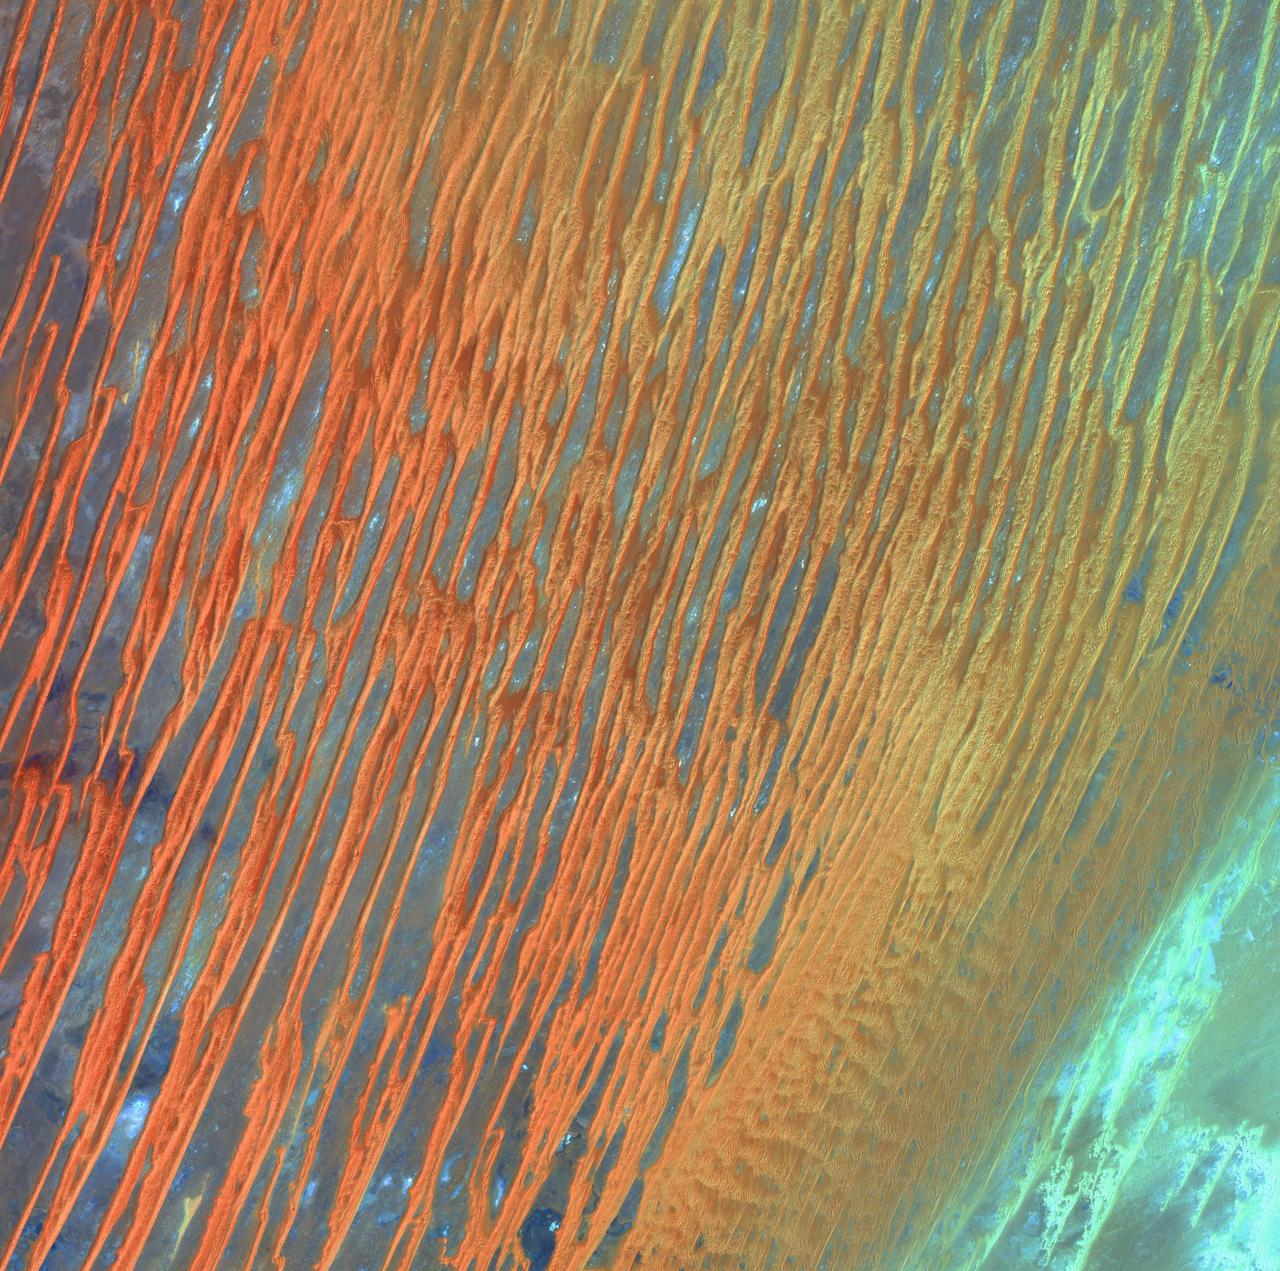
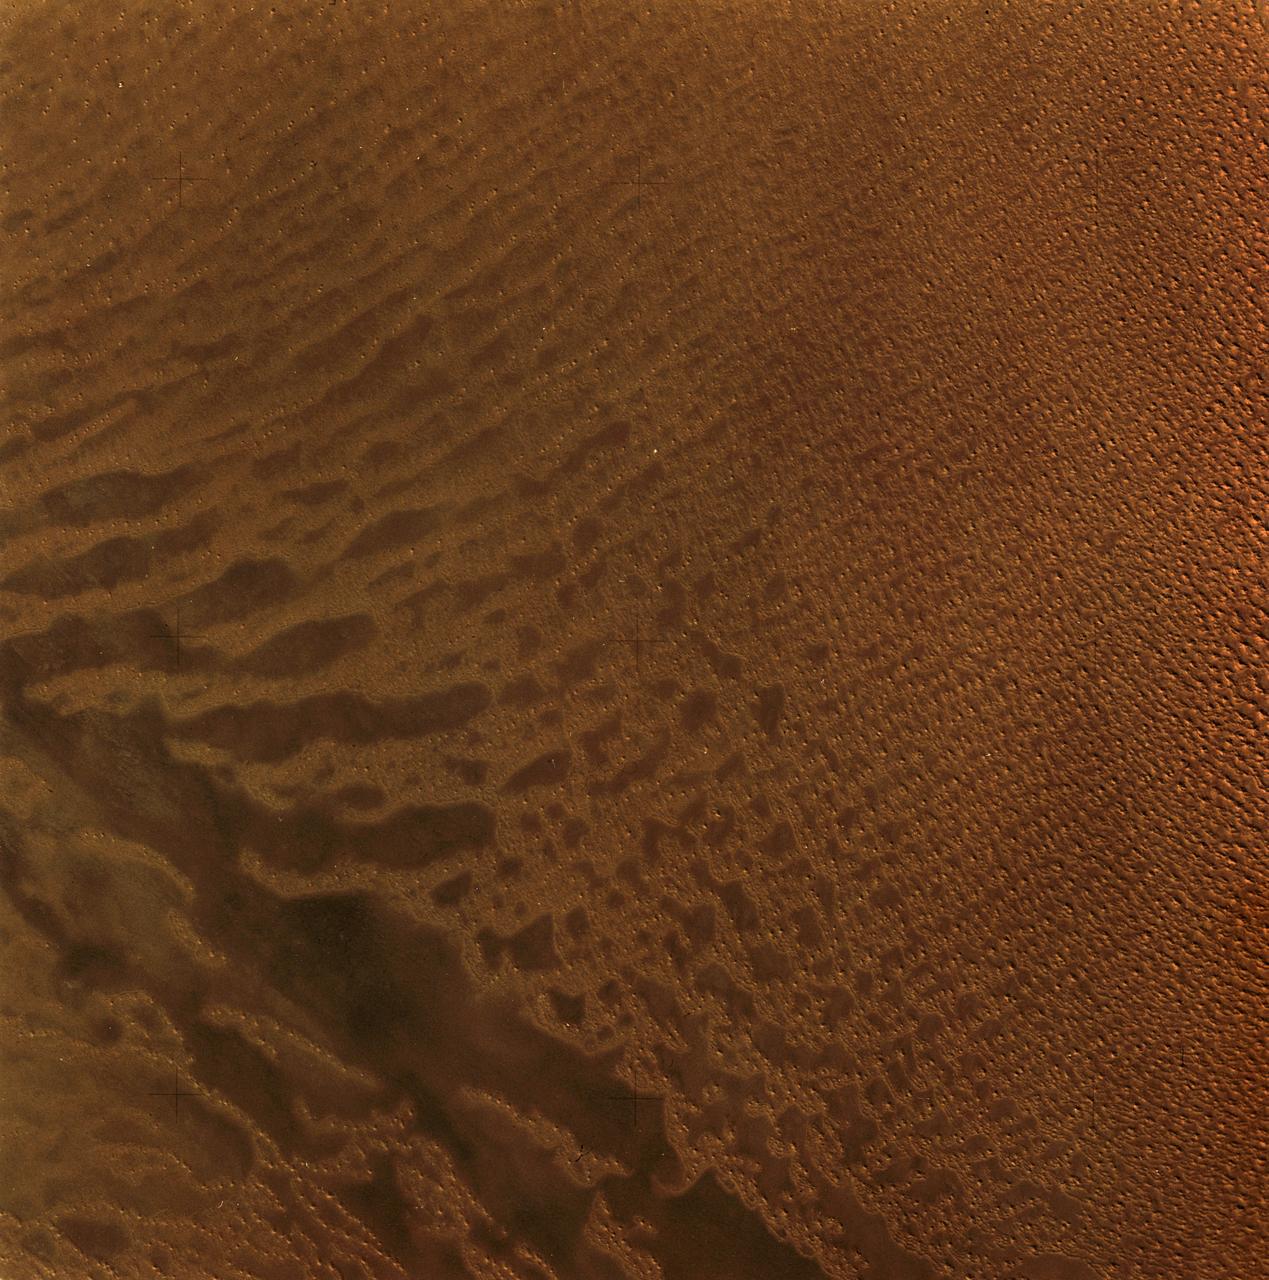
Desert Patterns - April 13th, 2003 Description: Seen through the "eyes" of a satellite sensor, ribbons of Saharan sand dunes seem to glow in sunset colors. These patterned stripes are part of Erg Chech, a desolate sand sea in southwestern Algeria, Africa, where the prevailing winds create an endlessly shifting collage of large, linear sand dunes. The term "erg" is derived from an Arabic word for a field of sand dunes. Credit: USGS/NASA/Landsat 7 To learn more about the Landsat satellite go to: <a href="http://landsat.gsfc.nasa.gov/" rel="nofollow">landsat.gsfc.nasa.gov/</a> <b><a href="http://www.nasa.gov/centers/goddard/home/index.html" rel="nofollow">NASA Goddard Space Flight Center</a></b> enables NASA’s mission through four scientific endeavors: Earth Science, Heliophysics, Solar System Exploration, and Astrophysics. Goddard plays a leading role in NASA’s accomplishments by contributing compelling scientific knowledge to advance the Agency’s mission. <b>Follow us on <a href="http://twitter.com/NASA_GoddardPix" rel="nofollow">Twitter</a></b> <b>Join us on <a href="http://www.facebook.com/pages/Greenbelt-MD/NASA-Goddard/395013845897?ref=tsd" rel="nofollow">Facebook</a></b>
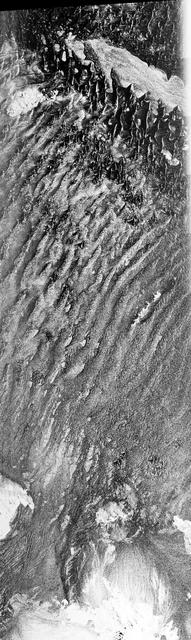
Bright, arc-shaped limestone hills and complex, branching drainage patterns dominate this three-frequency space radar image of a desert area in the north central plain of Oman.
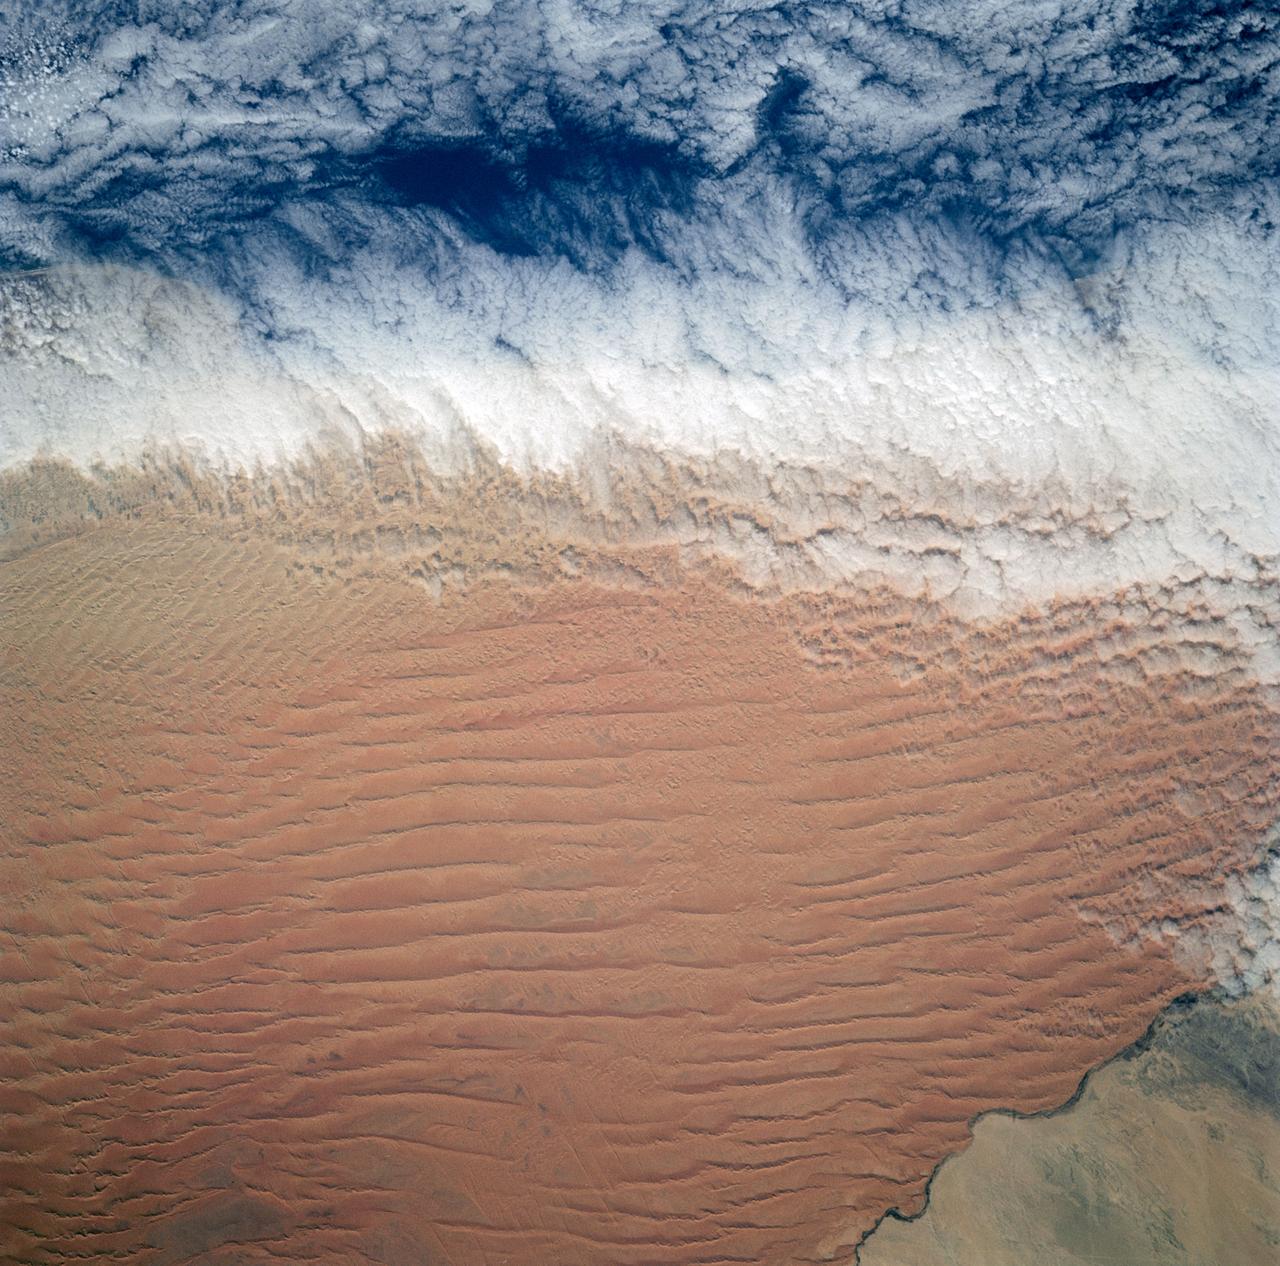
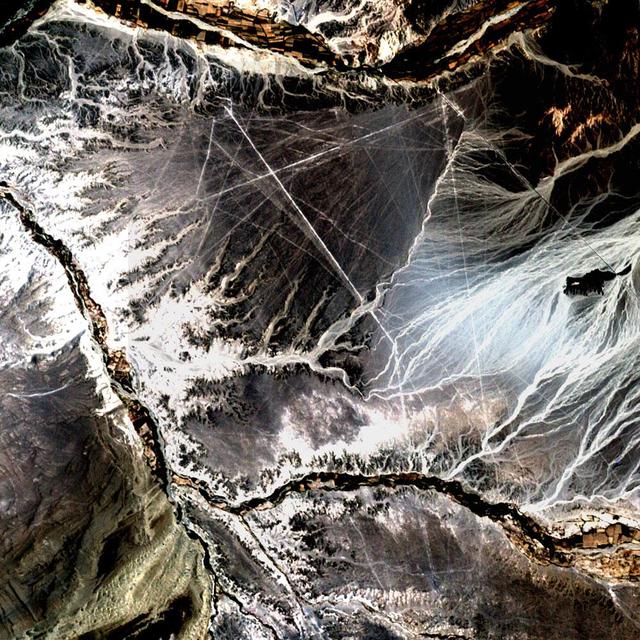
Fog is the only source of moisture for desert dwelling animals and plants living in the Namib Desert sand dune field, Namibia (23.5N, 15.0E). Coastal stratus clouds provide most of the life supporting moisture as fog droplets in this arid land where the usual annual rainfall is less than a quarter of an inch for decades at a time. In this view, the stratus clouds over the coast conform to the dune pattern proving that the fog is in ground contact.
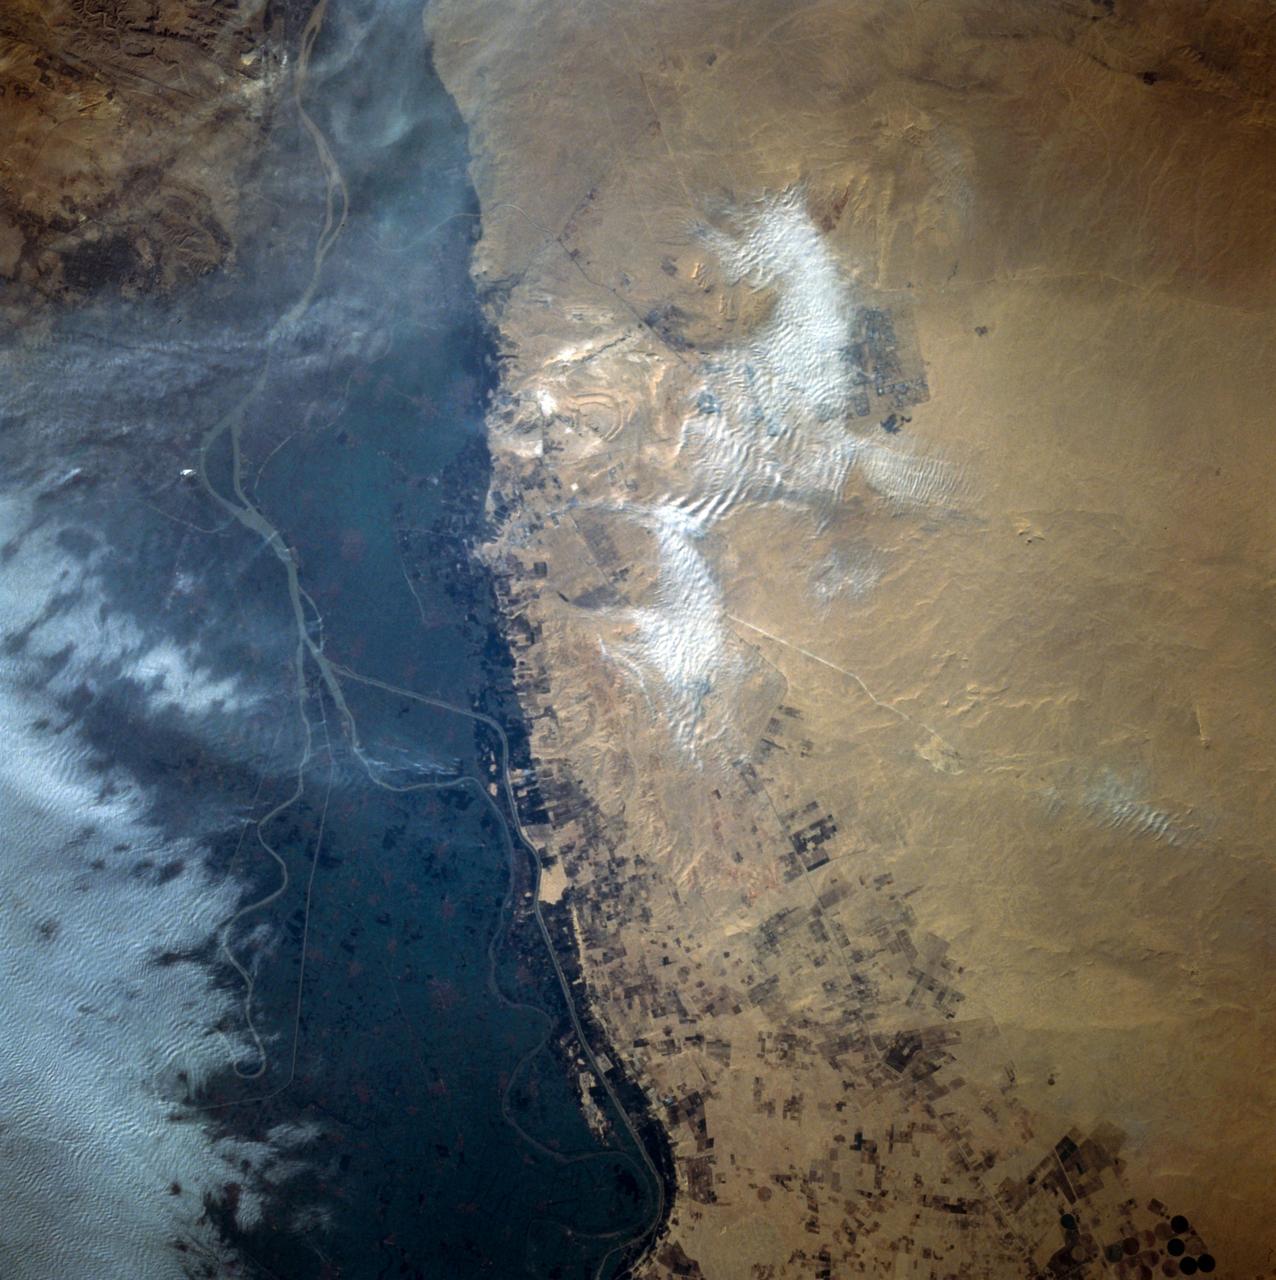
This close-up view of the intensively cultivated Nile River flood plain near Cairo presents a sharp color contrast to the virtually non-vegetated, sandy desert, located to the west of the vegetated area. Some rectangular cultivated field patterns, as well as circular center pivot irrigation patterns, can be observed northwest of the Nile River flood plain. The world famous Giza Pyramids are located near the center of this photography (see highly reflective sand surfaces).
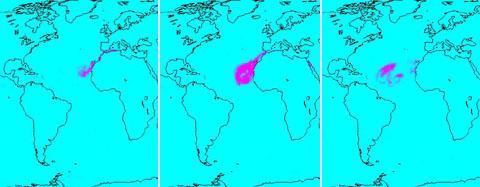
In July of 2005, a continent-sized cloud of hot air and dust originating from the Sahara Desert crossed the Atlantic Ocean and headed towards Florida and the Caribbean, captured by the Atmospheric Infrared Sounder onboard NASA Aqua satellite. A Saharan Air Layer, or SAL, forms when dry air and dust rise from Africa's west coast and ride the trade winds above the Atlantic Ocean. These dust clouds are not uncommon, especially during the months of July and August. They start when weather patterns called tropical waves pick up dust from the desert in North Africa, carry it a couple of miles into the atmosphere and drift westward. http://photojournal.jpl.nasa.gov/catalog/PIA00448
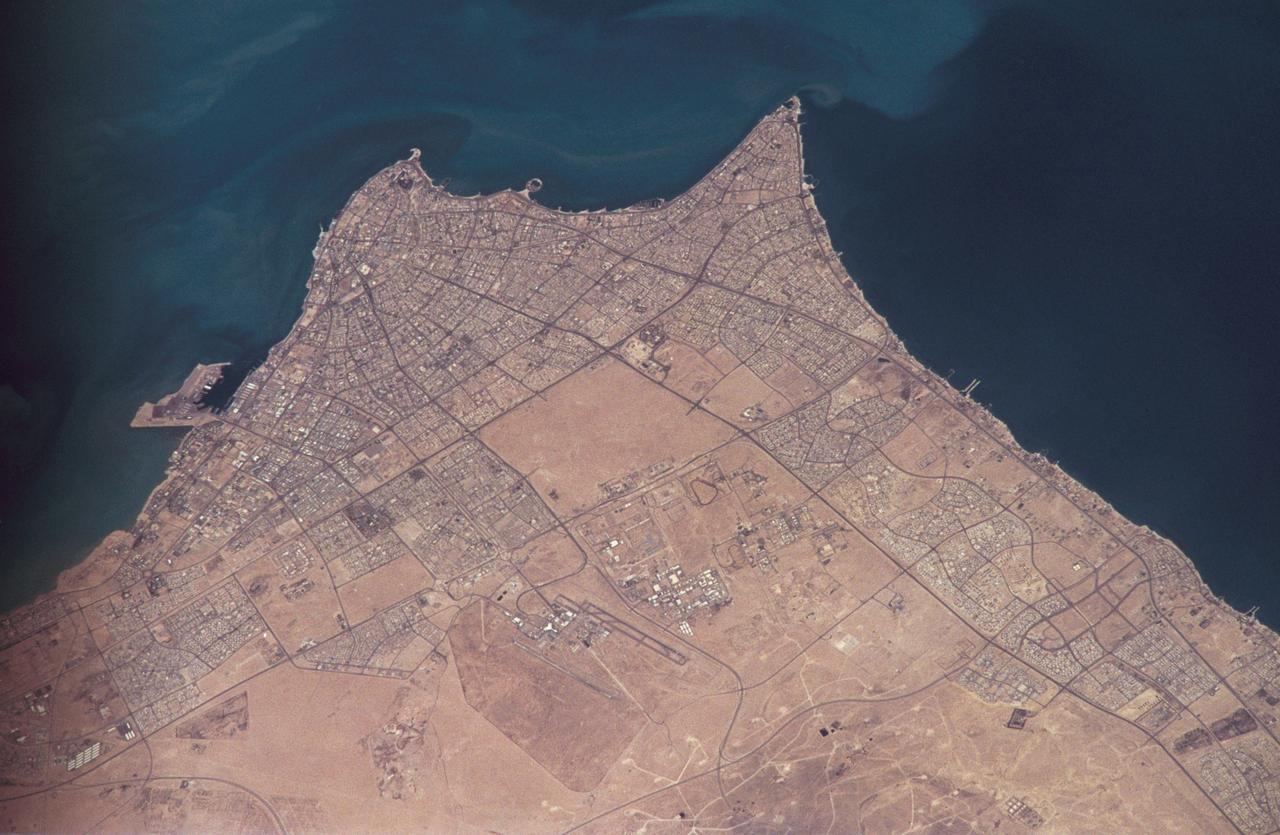
STS059-306-034 (9-20 April 1994) --- The radiating transportation pattern of this 20th-Century urban plan is nicely displayed in this high-resolution photograph. Light-toned spots in the desert mark oil well sites; along the south edge of the scene, some dark residue remains from the fires set during the recent Gulf War. Blown sand has nearly hidden the soot and thick oil that were deposited on the surface. Nikon photograph, 300mm lens.
ISS038-E-047388 (14 Feb. 2014) --- As the International Space Station passed over the deserts of central Iran, including Kavir, one of the Expedition 38 crew members used a digital camera equipped with a 200mm lens to record this image featuring an unusual pattern of numerous parallel lines and sweeping curves. The lack of soil and vegetation allows the geological structure of the rocks to appear quite clearly. According to geologists, the patterns result from the gentle folding of numerous, thin, light and dark layers of rock. Later erosion by wind and water, say the scientists, cut a flat surface across the folds, not only exposing hundreds of layers but also showing the shapes of the folds. The dark water of a lake (image center) occupies a depression in a more easily eroded, S-shaped layer of rock. The irregular light-toned patch just left of the lake is a sand sheet thin enough to allow the underlying rock layers to be detected. A small river snakes across the bottom of the image. In this desert landscape there are no fields or roads to give a sense of scale. In fact, the image width represents a distance of 65 kilometers.
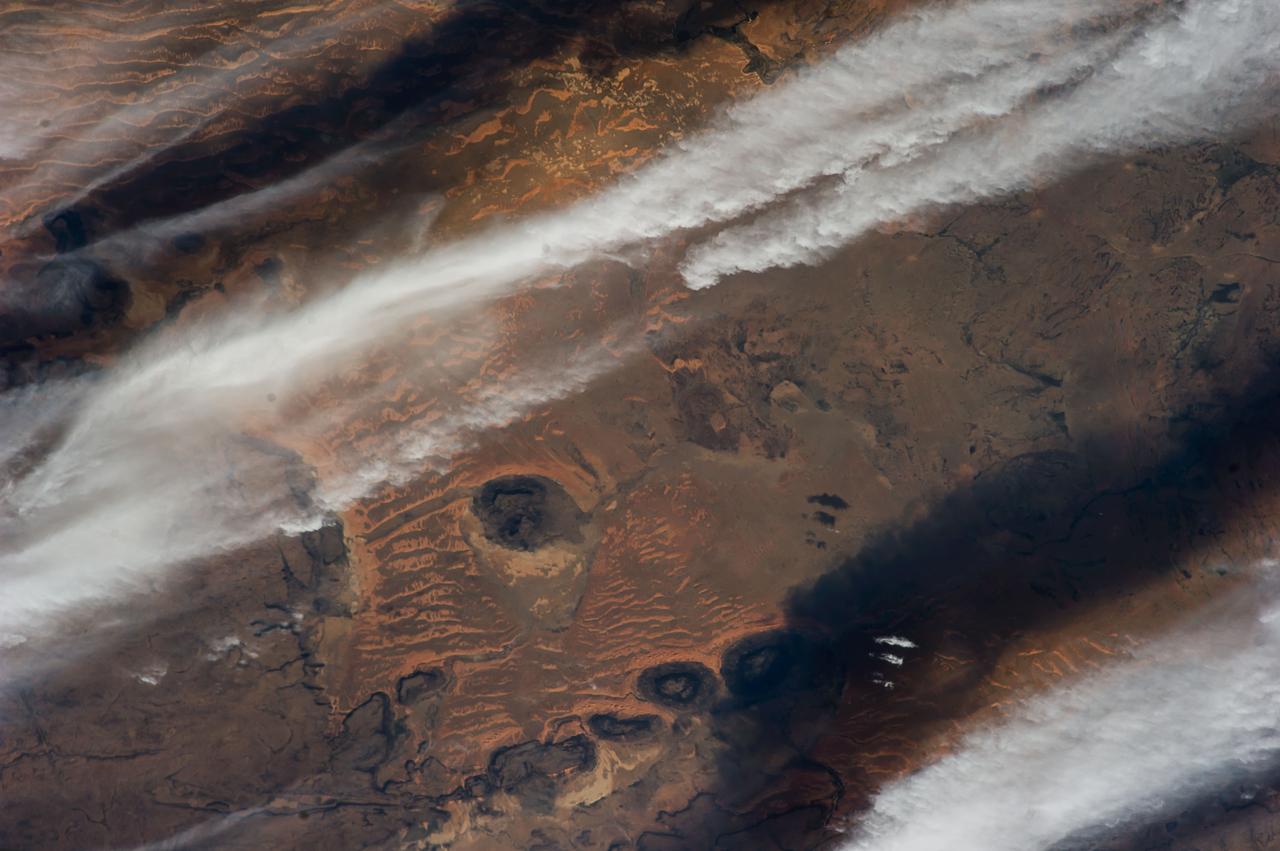
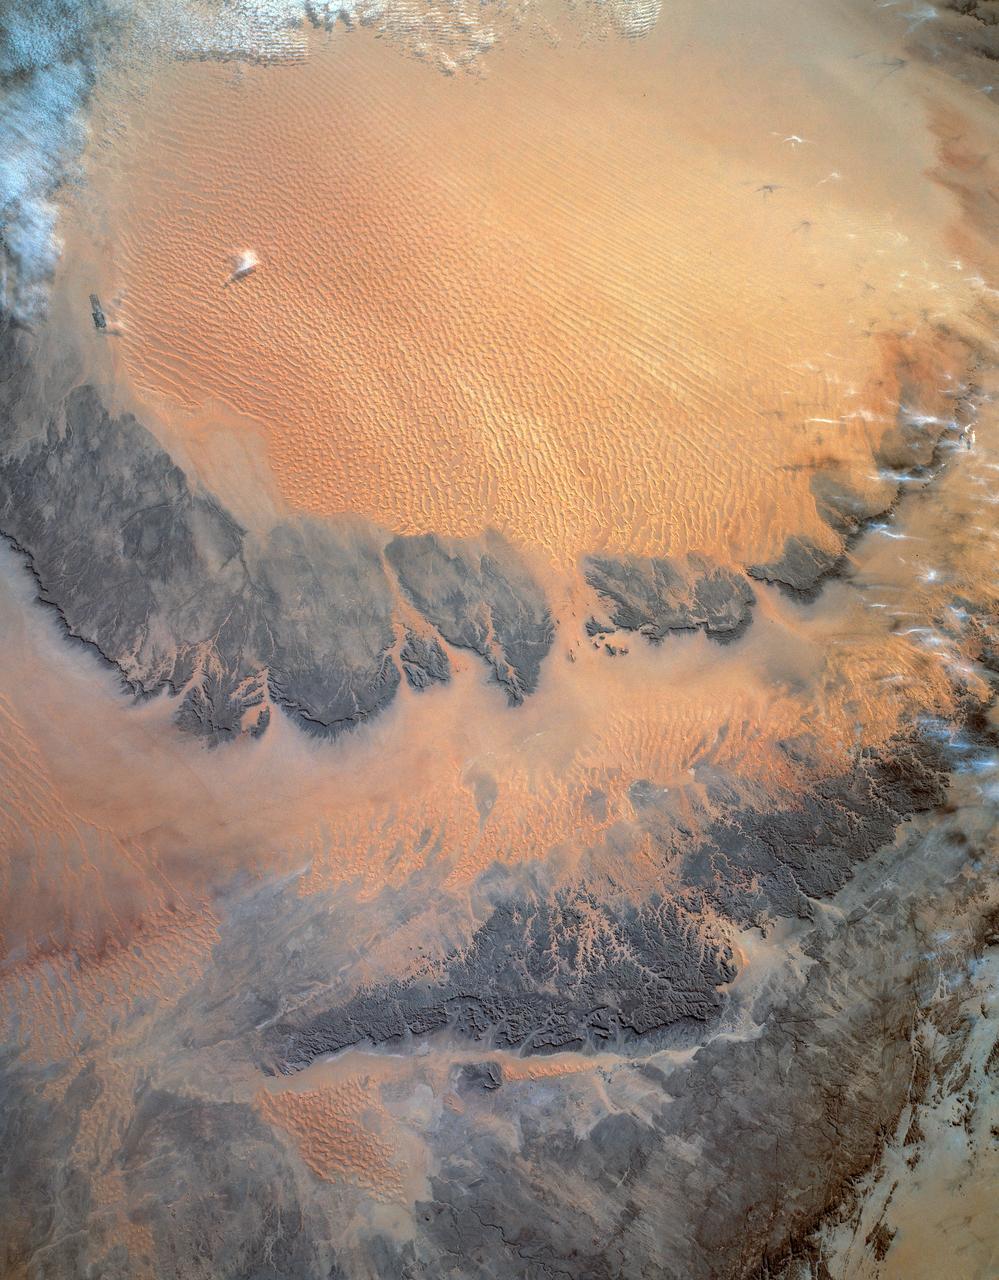
ISS038-E-026862 (8 Jan. 2014) --- The Western Sahara Desert is featured in this image photographed by an Expedition 38 crew member on the International Space Station. The infrequent cloud bands over southern Mauritania were photographed with an oblique look angle so that the dark cloud shadows are also a prominent part of the view. Beneath the cloud the Aouker plateau of dark sedimentary rocks appears as a ragged, near-vertical escarpment at top right. Isolated remnants of the plateau appear as dark mesas (flat-topped hills) across the top and near the center of the image. The escarpment is about 250 meters high, with a field of orange-colored dunes at the base (upper right). Prevailing winds in this part of the Sahara Desert blow from the northeast. The wavy dunes are aligned transverse to these winds. The sand that makes the dunes is blown in from a zone immediately upwind (just out of the bottom of the image) where dry river beds and dry lakes provide large quantities of mobile sand for the wind to transport. This pattern is typical in the western Sahara Desert, where plateau surfaces are mostly dune free and dune fields are located in the surrounding lowlands where the larger rivers deposit quantities of sandy sediment on the few occasions when they flow-sometimes only once in decades.
This is a C-band, VV polarization radar image of the Namib desert in southern Namibia, near the coast of South West Africa. The image is centered at about 25 degrees South latitude, 15.5 degrees East longitude. This image was one of the first acquired by the Spaceborne Imaging Radar-C/X-Band Synthetic Aperture Radar (SIR-C/X-SAR) when it was taken on orbit 4 from the shuttle Endeavour on April 9, 1994. The area shown is approximately 78 kilometers by 20 kilometers. The dominant features in the image are complex sand dune patterns formed by the prevailing winds in this part of the Namib desert. The Namib desert is an extremely dry area formed largely because of the influence of the cold Benguela ocean current that flows northward along the coast of Namibia. The bright areas at the bottom of the image are exposed outcrops of Precambrian rocks. This extremely barren area is a region rich in diamonds that through the centuries have washed down from the mountains. The town of Luderitz is located just to the south of the area shown. http://photojournal.jpl.nasa.gov/catalog/PIA01720
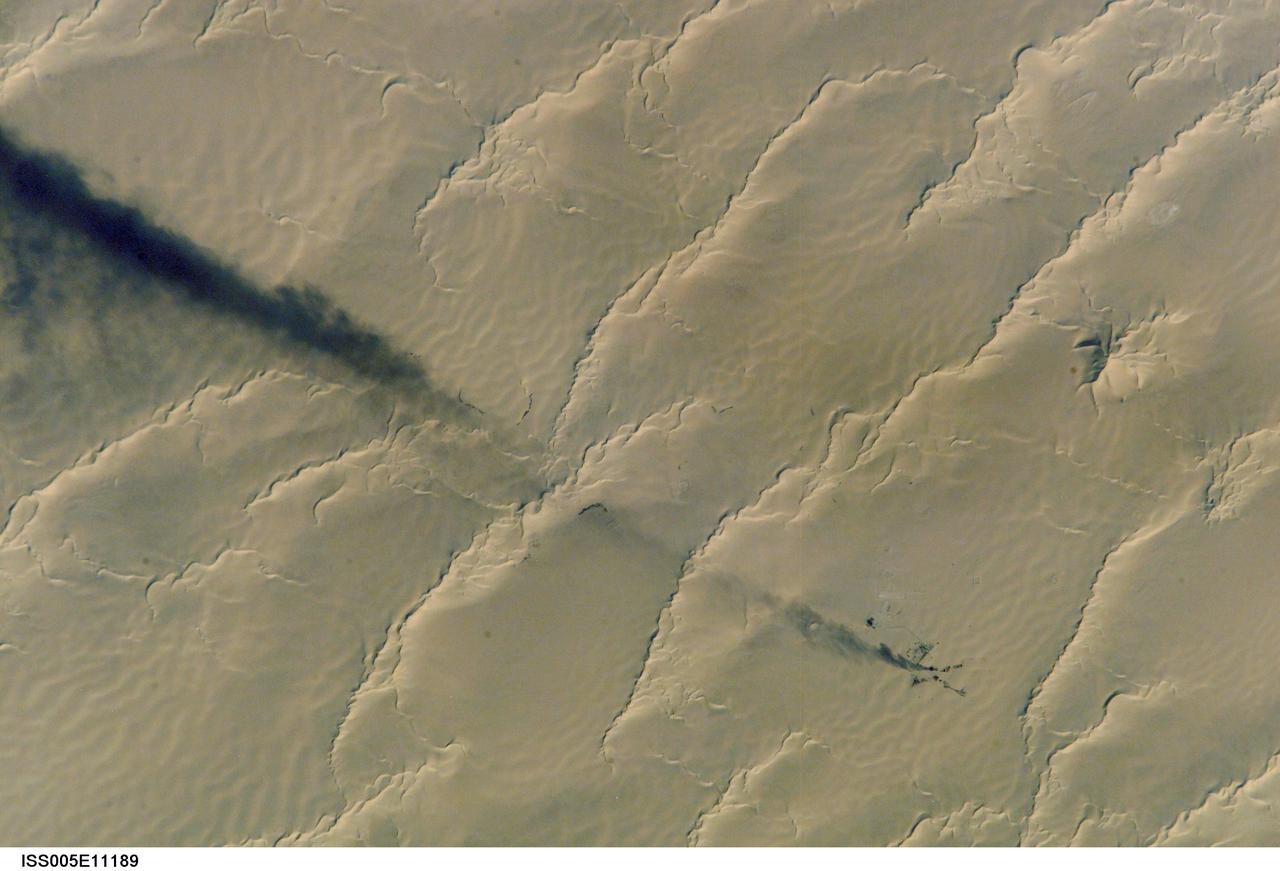
ISS005-E-11189 (25 August 2002) --- Calanscio Sand Sea, Libya is featured in this digital image photographed by an Expedition 5 crewmember on the International Space Station (ISS). A plume of black smoke blowing westward is silhouetted against yellow linear dunes in the great sand sea of northeast Libya. Smoke from flares at remote well heads is commonly seen by astronauts flying over the Sahara Desert. NASA scientists studying the Station imagery had the following observations about the image. The plume dispersal pattern visible at the left edge of the image may be due to upper-level winds or gravitational settling of heavier particulates. The regular pattern of linear dunes is generated by two major winds: the dominant north wind (north is towards the top right) determines the orientation of the sand dunes. Gentler easterly winds, as were blowing when this view was taken, make the dunes asymmetric, with a gentle windward (west) slope and an over steeped downwind slope. Some over steepened slopes even cast shadows in the early morning light. One mound of sand (top right), due north of the well head, does not fit the pattern of linear dunes. This type is known as a star dune.
STS054-152-189 (13-19 Jan. 1993) --- This near-vertical color photograph shows the very diverse landscape that is part of the great Sahara Desert of north Africa. Specifically, the vast expanse of sand dunes, located in the extreme southwestern corner of Libya, is known as the Murzuk Sand Sea. Close inspection of this photograph shows the agricultural village of Murzuk as evidenced by the numerous center pivot irrigation patterns at the edge of the Murzuk Sand Sea. The very rugged, dissected terrain to the west of this sand sea is the eastern tip of the Tassili N'ajjer Mountains and the Tadrart Plateau that are in neighboring Algeria. Several smaller areas of sand dunes are interspersed between the major areas of rock outcrops. The photograph was taken with a Linhof camera.
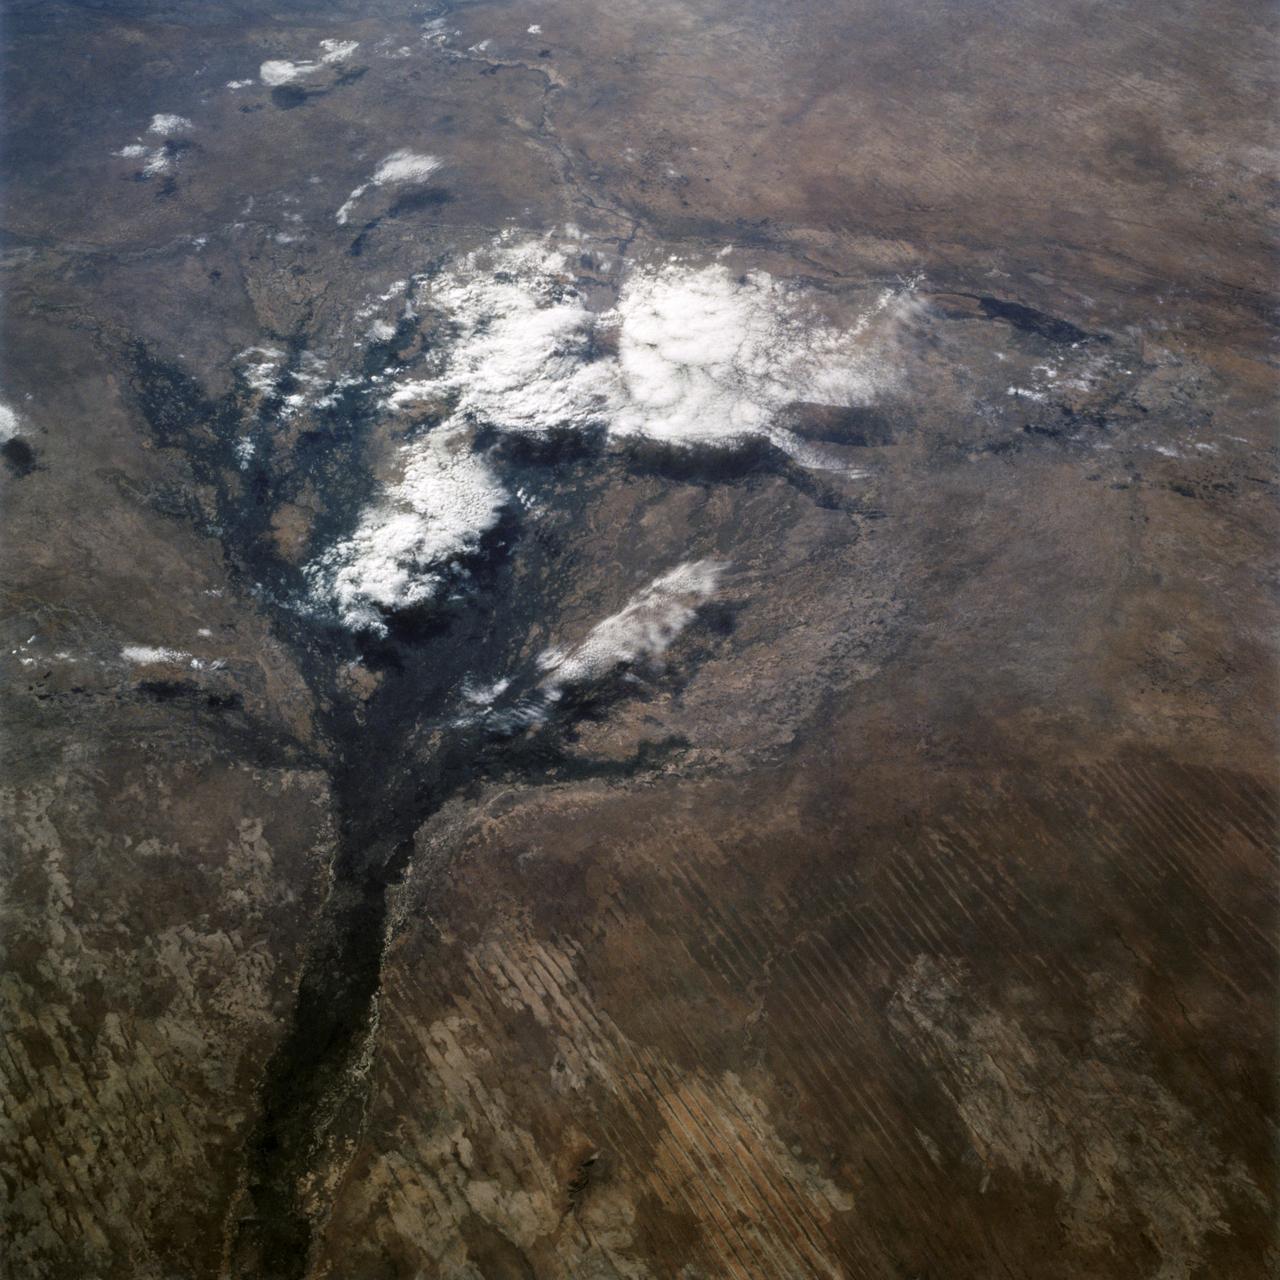
STS066-122-091 (3-14 Nov. 1994) --- This November 1994 view looking south-southeast shows clouds over the Okavango Delta area of northern Botswana. The Okavango is one of the wilder, less spoiled regions of Africa. The area still supports great herds of wild animals such as elephant, zebra and the cape buffalo. Despite conservation efforts from the stable government of Botswana, delta habitats are pressured. The Okavango River (lower left of view) brings water from the high, wet plateaus of Angola into the Kalahari Desert, and enormous inland basin. As a result of a series of small faults (upper center of the view) related to the African Rift System, the river is dammed up in the form of swampy inland delta. Here, water is consumed by evaporation, infiltration, and the swamp forests. Late summer floods take six months to slowly penetrate the 160 kilometer (95 miles) to the other end of the Delta. The visual patterns of the area are strongly linear: straight sand dunes occur in many places and can be seen across the bottom portion of the photograph. Numerous brush-fire scars produce a complex, straight-edged pattern over much of the lower portion of this view. Lake Ngami (upper right of view) was once permanently full as late as the middle 1800's. Changes in the climate of the area over the last 100 years has changed the size and shape of the inland delta.
Acquisition Date: November 10, 2002 In the desert of southwest Peru, between the Andes Mountains and the Peruvian coast, lies a plateau with huge geometric patterns and spirals, animal figures including a monkey, a spider, and an 'owl man,' and thousands of perfectly straight lines. The last of these was drawn about a thousand years ago. Known as the Nazca lines, the drawings have mystified scientists since they were first discovered in the 1920s. Pictured here is all that can be seen of these lines by Landsat 7's 15 meter pan band, which has been used to sharpen the 30 meter Bands 3, 2, and 1. Credit: NASA/GSFC/Landsat/USGS To learn more about Landsat and to see the orginal high res file go to: <a href="http://landsat.usgs.gov/gallery_view.php?category=greenflag&thesort=mainTitle" rel="nofollow">landsat.usgs.gov/gallery_view.php?category=greenflag&...</a>

AS09-26A-3781A (11 March 1969) --- Colored infrared photograph of the mouth of the Colorado River in northern Baja California and Sonora, Mexico, as seen from Apollo 9 spacecraft during its 121st revolution of Earth. Photographed from an altitude of 130 nautical miles, at 16:14 GMT, on March 11, 1969. Color infrared film is designed to render healthy green foliage as tones of red, such as the red checker-board patterns in the irrigated farm lands along the Colorado River. Red hues of vegetation can be seen in the valleys and on the slopes of the San Pedro Martia and Juarez Mountains, at left. White ribbon-like salt lakes near the river mouth and the wide expanse of sand dunes in the Great Desert, at right, are evidence of the arid climate. Light colors of silt bands in the waters of the Gulf of California reflect currents and water depths. The town of San Felipe is on the Gulf coast at lower left.

ISS017-E-013789 (19 Aug. 2008) --- Desert erosion in Libya is featured in this image photographed by an Expedition 17 crewmember on the International Space Station. This detailed view (covering 13 kilometers) shows the classic patterns of an erosional desert landscape located 300 kilometers south of Libya's Mediterranean coast. Widespread indented patterns are low escarpments and stream terraces generated by stream erosion -- on those few occasions in any decade when enough rain falls for streams to flow. The only areas with active sediment deposition are the stream beds which appear in this image as sinuous zones with a distinct component of black minerals, resulting in a darker coloration than adjacent low escarpments. Sediment is transported into the area from a volcanic landscape immediately upstream to the west. Other stream-generated features are several relict stream banks, one of which even shows both of the original parallel banks. According to scientists, the ancient stream banks are preserved from erosion by various hardening cements (mainly calcium carbonate and gypsum) introduced by the streams when they were active, probably during wetter climates in the past two million years. Relict stream courses show prior positions of streams, and also provide Earth analogs for similar features on Mars. The lack of vegetation is the first indication of the great aridity of the region, but sand dunes also appear as sinuous lines oriented perpendicular to the dominant northeasterly wind direction (transverse dunes). Assuming the dominant wind direction remains the same, these transverse dunes are expected to move further to the southwest over time. Some of the dunes cross the river courses, showing how seldom the river flows.
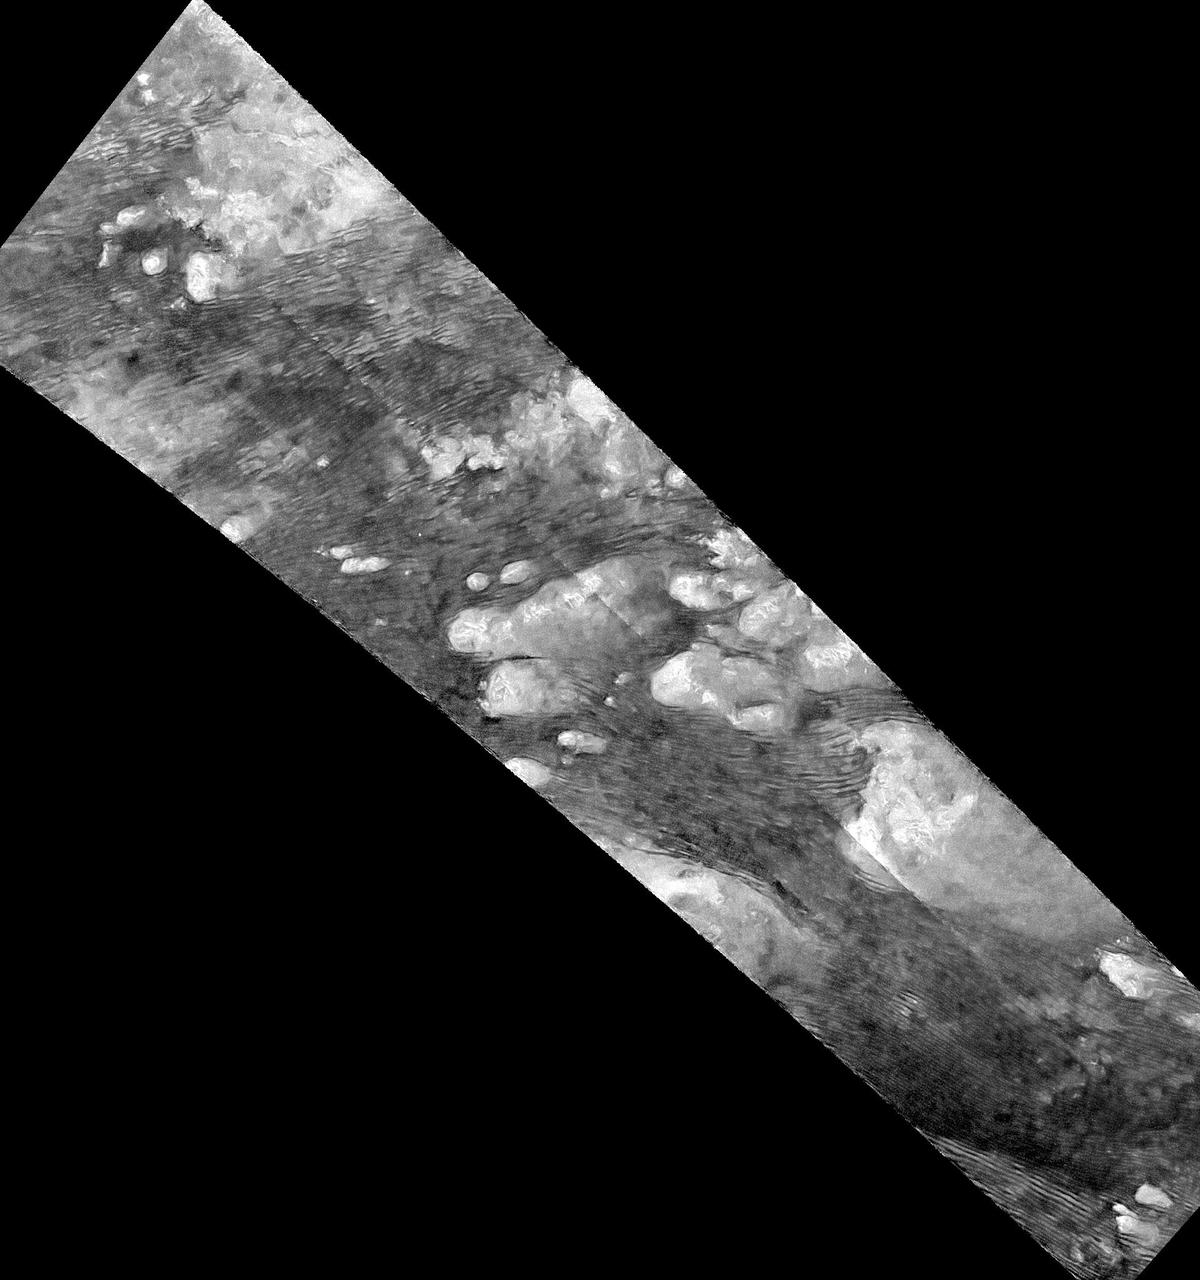
This radar image of the Shangri-La Sand Sea on Titan from NASA's Cassini spacecraft shows hundreds of sand dunes are visible as dark lines snaking across the surface. These dunes display patterns of undulation and divergence around elevated mountains (which appear bright to the radar), thereby showing the direction of wind and sand transport on the surface. Sands being carried from left to right (west to east) cannot surmount the tallest obstacles; instead, they are directed through chutes and canyons between the tall features, evident in thin, blade-like, isolated dunes between bright some features. Once sands have passed around the obstacles, they resume their downwind course, at first collecting into small, patchy dunes and then organizing into larger, more pervasive linear forms, before being halted once again by obstacles. These patterns reveal the effects not only of wind -- perhaps even modern winds if the dunes are actively moving today -- but also the effects of underlying bedrock and surrounding topography. Dunes across the solar system aid in our understanding of underlying topography, winds and climate, past and present. Similar patterns can be seen in dunes of the Great Sandy Desert in Australia, where dunes undulate broadly across the uneven terrain and are halted at the margins of sand-trapping lakes. The dune orientations correlate generally with the direction of current trade winds, and reveal that winds must have been similar back when the dunes formed, during the Pleistocene glacial and interglacial periods. The image was taken by the Cassini Synthetic Aperture radar (SAR) on July 25, 2016 during the mission's 122nd targeted Titan encounter. The image has been modified by the denoising method described in A. Lucas, JGR:Planets (2014). http://photojournal.jpl.nasa.gov/catalog/PIA20711
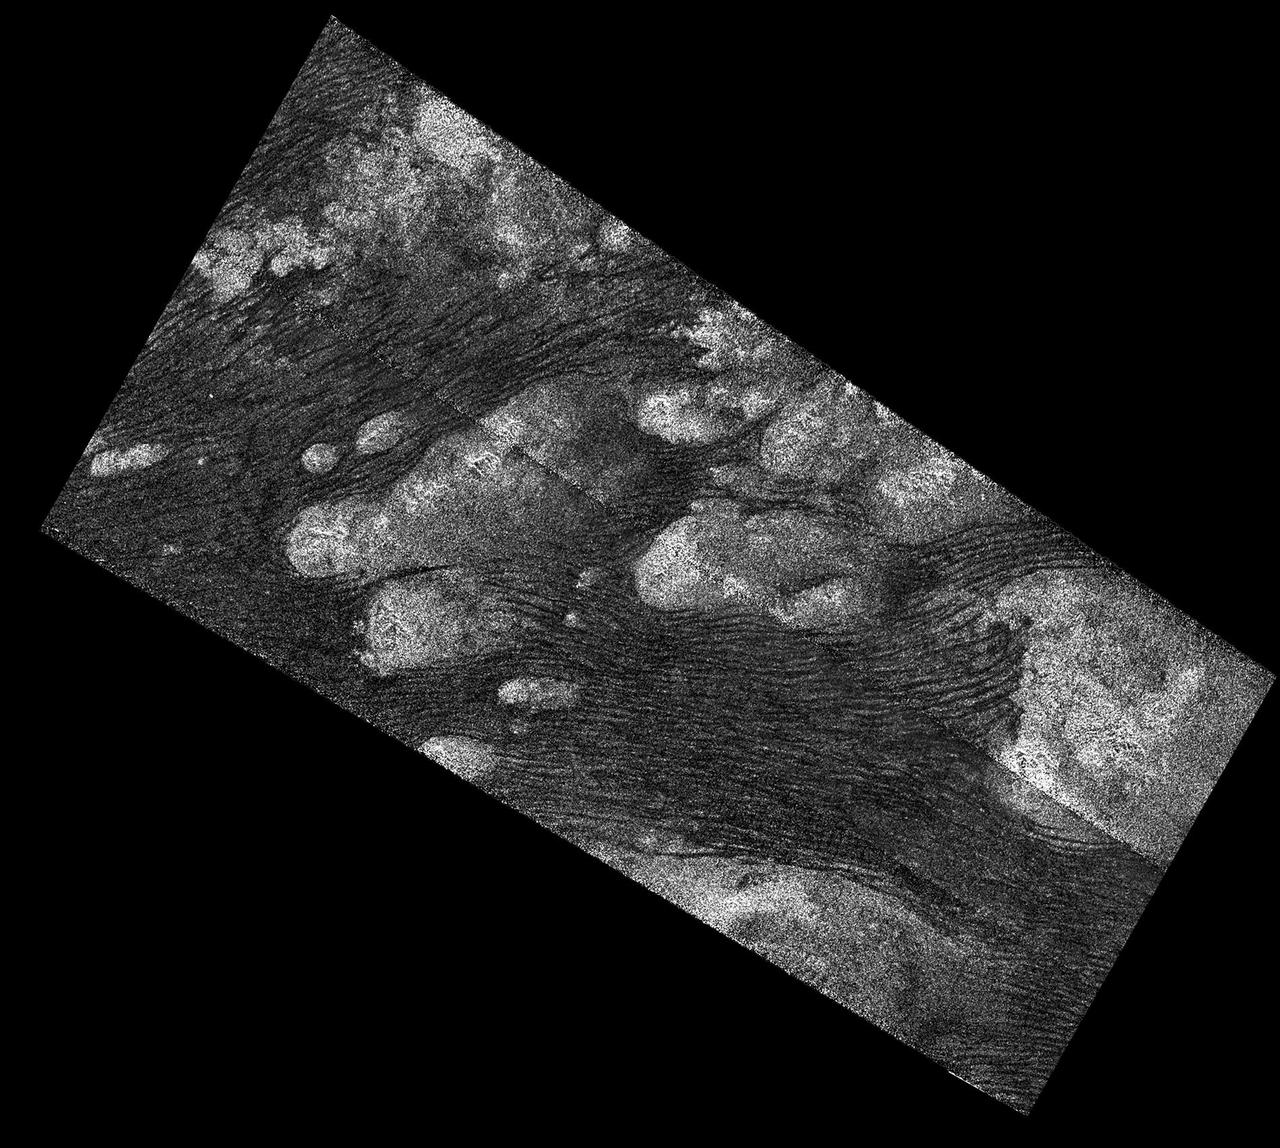
The Shangri-La Sand Sea on Titan is shown in this image from the Synthetic Aperture radar (SAR) on NASA's Cassini spacecraft. Hundreds of sand dunes are visible as dark lines snaking across the surface. These dunes display patterns of undulation and divergence around elevated mountains (which appear bright to the radar), thereby showing the direction of wind and sand transport on the surface. Sands being carried from left to right (west to east) cannot surmount the tallest obstacles; instead, they are directed through chutes and canyons between the tall features, evident in thin, blade-like, isolated dunes between bright some features. Once sands have passed around the obstacles, they resume their downwind course, at first collecting into small, patchy dunes and then organizing into larger, more pervasive linear forms, before being halted once again by obstacles. These patterns reveal the effects not only of wind -- perhaps even modern winds if the dunes are actively moving today -- but also the effects of underlying bedrock and surrounding topography. Dunes across the solar system aid in our understanding of underlying topography, winds and climate, past and present. Similar patterns can be seen in dunes of the Great Sandy Desert in Australia, where dunes undulate broadly across the uneven terrain and are halted at the margins of sand-trapping lakes. The dune orientations correlate generally with the direction of current trade winds, and reveal that winds must have been similar back when the dunes formed, during the Pleistocene glacial and interglacial periods. An annotated version of this radar image is also available.at the Photojournal. North on Titan is up in the image. Radar illuminates the scene from upper right at a 27-degree incidence angle. http://photojournal.jpl.nasa.gov/catalog/PIA20710
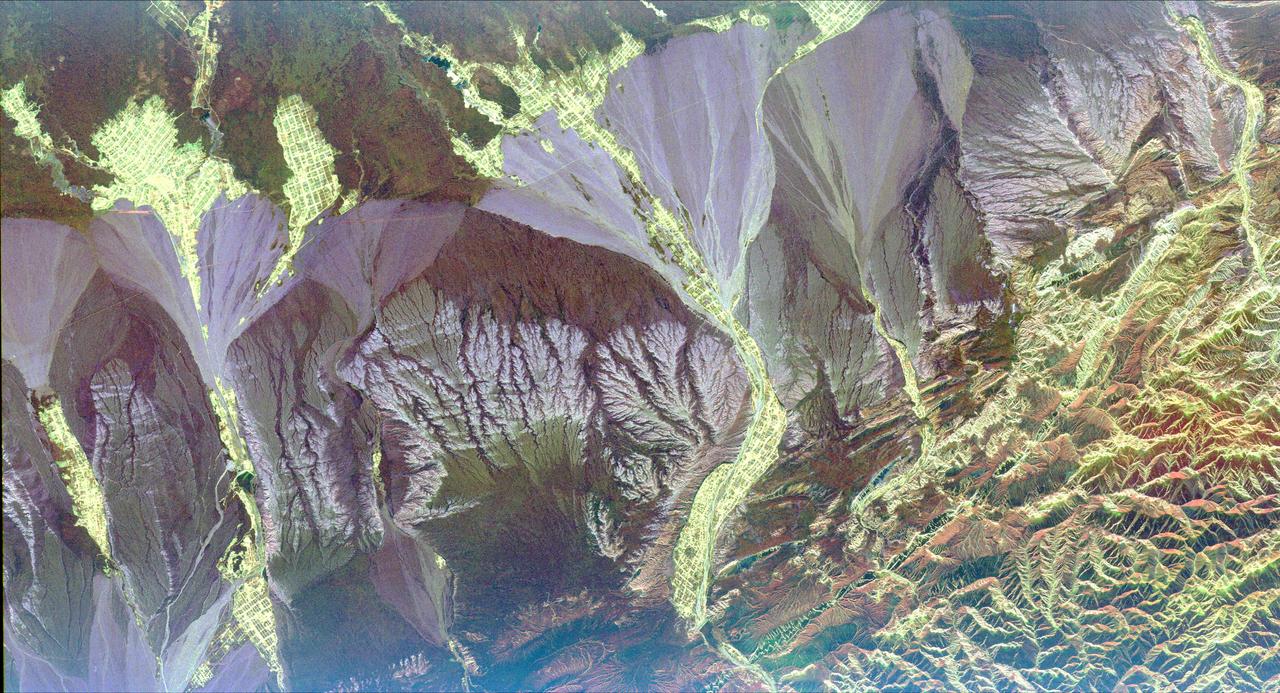
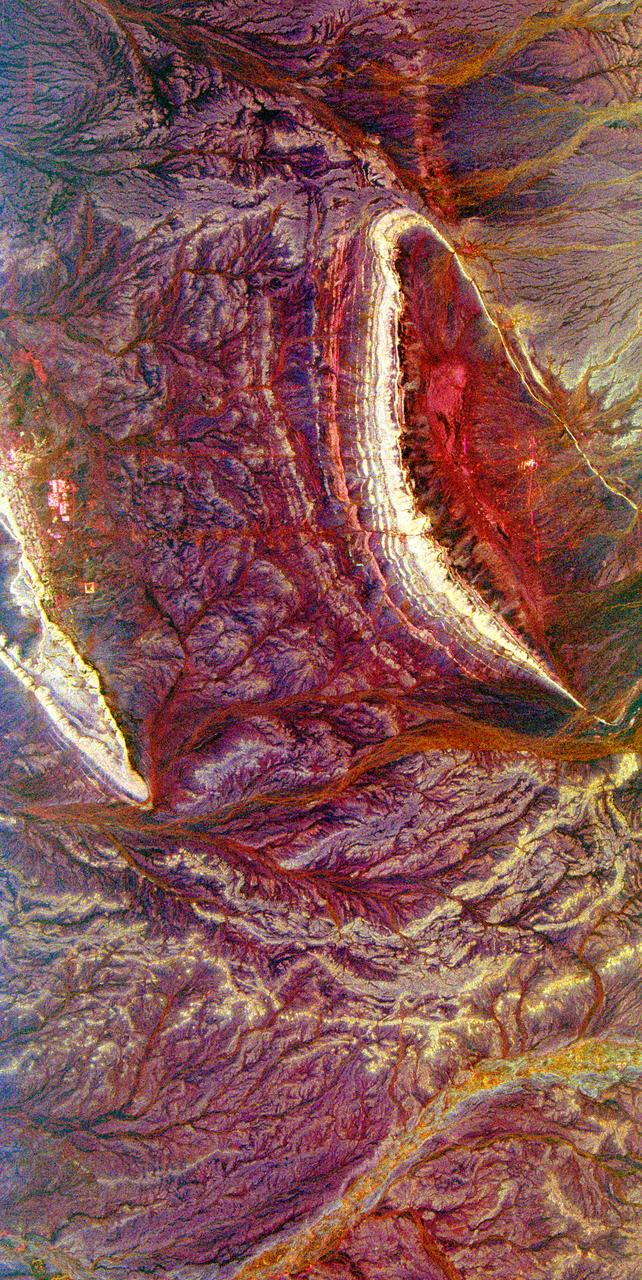
This radar image is centered near the small town of Pishan in northwest China, about 280 km (174 miles) southeast of the city of Kashgar along the ancient Silk Route in the Taklamakan desert of the Xinjiang Province. Geologists are using this radar image as a map to study past climate changes and tectonics of the area. The irregular lavender branching patterns in the center of the image are the remains of ancient alluvial fans, gravel deposits that have accumulated at the base of the mountains during times of wetter climate. The subtle striped pattern cutting across the ancient fans are caused by thrusting of the Kun Lun Mountains north. This motion is caused by the continuing plate-tectonic collision of India with Asia. Modern fans show up as large lavender triangles above the ancient fan deposits. Yellow areas on the modern fans are vegetated oases. The gridded pattern results from the alignment of poplar trees that have been planted as wind breaks. The reservoir at the top of the image is part of a sophisticated irrigation system that supplies water to the oases. This image was acquired by the Spaceborne Imaging Radar-C/X-band Synthetic Aperture Radar (SIR-C/X-SAR) aboard the space shuttle Endeavour in April 1994. This image is centered at 37.4 degrees north latitude, 78.3 degrees east longitude and shows an area approximately 50 km by 100 km (31 miles by 62 miles). The colors are assigned to different frequencies and polarizations of the radar as follows: Red is L-band horizontally transmitted, horizontally received; green is L-band horizontally transmitted, vertically received; and blue is C-band horizontally transmitted and vertically received. SIR-C/X-SAR, a joint mission of the German, Italian, and the United States space agencies, is part of NASA's Mission to Planet Earth. http://photojournal.jpl.nasa.gov/catalog/PIA01796
ISS035-E-009454 (25 March 2013 ) --- One of the Expedition 35 crew members aboard the Earth-orbiting International Space Station used a 400 millimeter lens to photograph this view of the Great Sandy Desert, northwestern Australia on March 25. It bears evidence that much of Australia is arid. In northwest Australia the Great Sandy Desert holds great geological interest as a zone of active sand dune movement; strings of narrow lakes that represent very ancient rivers are also present. While a variety of dune forms can be seen in the region, this photograph features numerous linear dunes (approximately 25 meters high) separated in a roughly regular fashion (0.5?1.5 kilometers), and aligned closely to the winds that generated them?that is, winds blowing from east to west. Where linear dunes converge, dune confluences point downwind. One of the main visual impressions flying over such tropical dune fields ? both from an airplane or from the orbital station outpost?apart from the dune patterns are fire scars where thin vegetation has been burned off the dunes. The result is dunes that appear red from the underlying sand (image top left and top right), and darker areas where the vegetation remains (image lower left and lower right). The white feature visible down the center of the image is Lake Auld, the white color being the result of a cemented combination of fine clayey sediment and salts from evaporation of flood waters that occasionally fill the lake. Wider views of the area show that this lake is part of what is now known to have been a major, ancient river system in northwest Australia, draining northwest to the Indian Ocean. Such sinuous lakes are also known in Australia as ?river lakes.? Scientists point out that the river system is remarkably well preserved considering that the rivers were probably active in the Paleocene Epoch more than 55 million years ago. Australia then lay much further south in a wetter climatic zone. Today?s desert climate results in almost all rivers in the Great Sandy Desert being dry. Linear dunes can be seen entering Lake Auld on the east side. During flooding events, the sand of the dune noses is dispersed, becoming incorporated into the lake floor sediments together with muds and salts. During the long intervening dry periods, sand can blow across the lake floor to build thinner, smaller dunes visible as linear accumulations on the west side of the lake.

ISS029-E-037471 (3 Nov. 2011) --- Egypt?Israel borderlands, northern Sinai Peninsula and northern Negev Desert are featured in this image photographed by an Expedition 29 crew member on the International Space Station. A clearly visible line that marks approximately 50 kilometers of the international border between Egypt and Israel?10-60 kilometers from the Mediterranean Sea to the northwest (not shown)?crosses the center of this photograph from left to right. The reason for the color difference is likely the slightly higher level of grazing by the animal herds of Bedouin herdsmen on the Egyptian side of the border. A major highway also follows the border, making the demarcation more prominent in this recent image taken from the space station. A patch of the Gaza Strip appears under scattered cloud at far right. In the arid to semiarid climate of the region illustrated in the image the natural grass vegetation is sparse at best. Irrigated commercial agriculture in Israel nearest the Mediterranean coast appears as a series of large angular patterns and circular center pivot fields, with darker greens indicating growing crops (right). Smaller plot sizes appear on the Egyptian side of the border at upper right. The image shows how the active sand dunes, which dominate most of the landscape in this view, mark the southern limit of the agriculture.
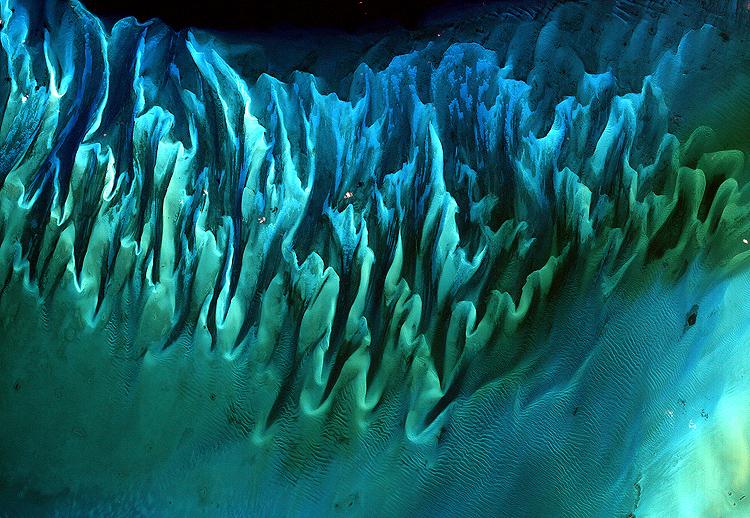
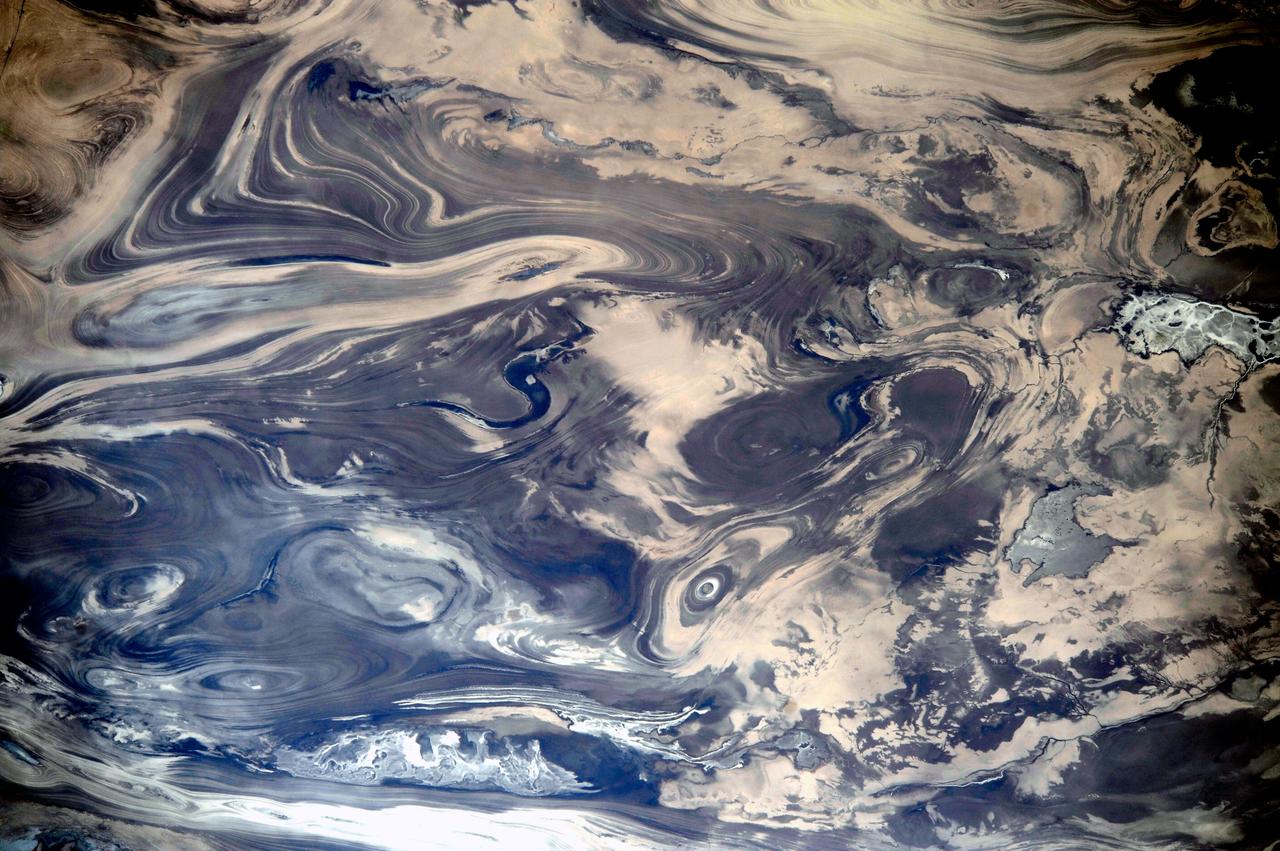
NASA image acquired January 17, 2001 Though the above image may resemble a new age painting straight out of an art gallery in Venice Beach, California, it is in fact a satellite image of the sands and seaweed in the Bahamas. The image was taken by the Enhanced Thematic Mapper plus (ETM+) instrument aboard the Landsat 7 satellite. Tides and ocean currents in the Bahamas sculpted the sand and seaweed beds into these multicolored, fluted patterns in much the same way that winds sculpted the vast sand dunes in the Sahara Desert. Image courtesy Serge Andrefouet, University of South Florida Instrument: Landsat 7 - ETM+ Credit: NASA/GSFC/Landsat <b><a href="http://www.nasa.gov/centers/goddard/home/index.html" rel="nofollow">NASA Goddard Space Flight Center</a></b> enables NASA’s mission through four scientific endeavors: Earth Science, Heliophysics, Solar System Exploration, and Astrophysics. Goddard plays a leading role in NASA’s accomplishments by contributing compelling scientific knowledge to advance the Agency’s mission. <b>Follow us on <a href="http://twitter.com/NASA_GoddardPix" rel="nofollow">Twitter</a></b> <b>Join us on <a href="http://www.facebook.com/pages/Greenbelt-MD/NASA-Goddard/395013845897?ref=tsd" rel="nofollow">Facebook</a></b>
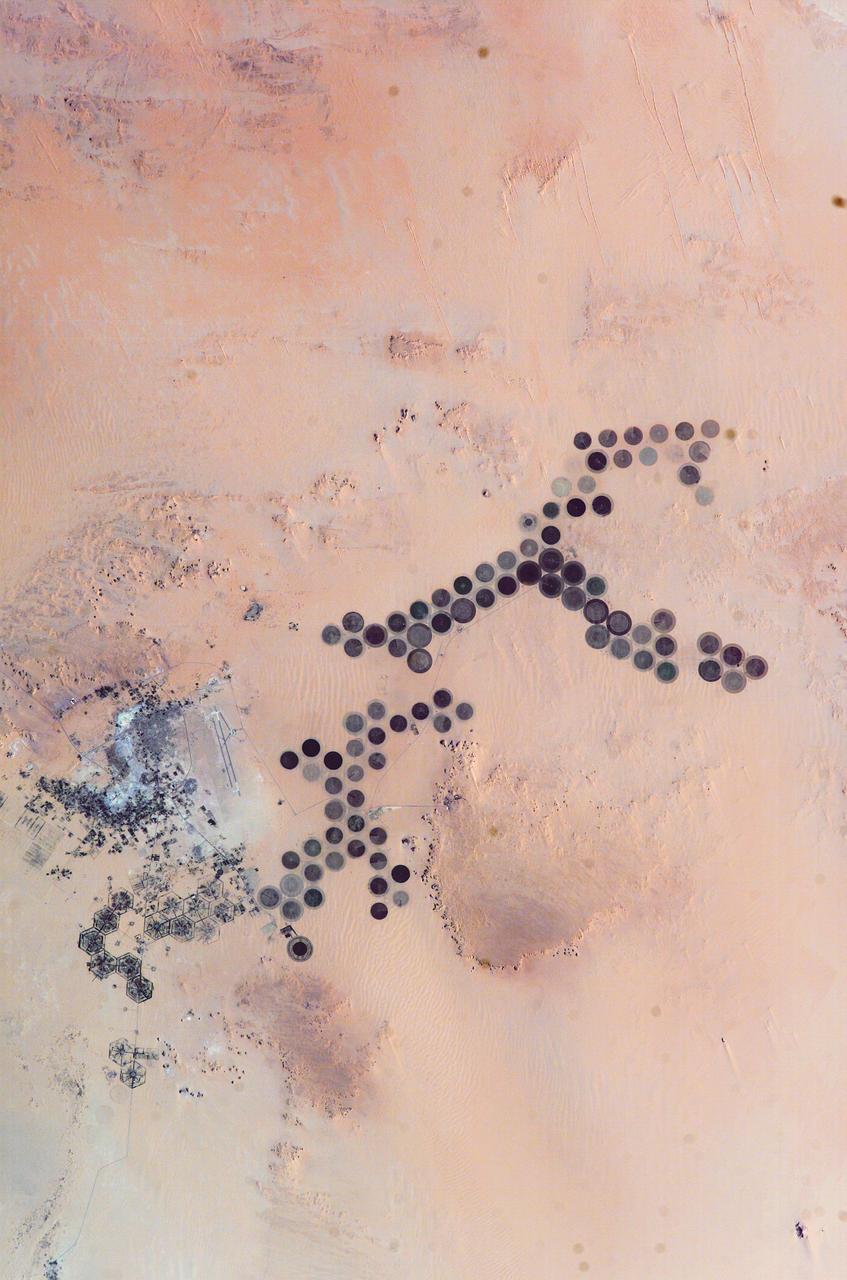
ISS010-E-05266 (28 October 2004) --- The Al Khufrah Oasis is featured in this image photographed by an Expedition 10 crewmember on the International Space Station (ISS). Green circles in the desert frequently indicate tracts of agriculture supported by center-pivot irrigation. The Al Khufrah Oasis in southeastern Libya (near the Egyptian border) is one of Libya’s largest agricultural projects, and is an easy-to-recognize landmark for orbiting crewmembers aboard the Station. The center-pivot irrigation system pumps water under pressure into a gantry or tubular arm from a central source. Anchored by a central pivot, the gantry slowly rotates over the area to be irrigated, thereby producing the circular patterns. Although the field diameters vary, these fields are approximately 0.6 mile (1 kilometer) in diameter. Darker colors indicate fields where such crops as wheat and alfalfa are grown. Lighter colors can indicate a variety of agricultural processes: fields that have been harvested recently; fields that are lying fallow; fields that have just been planted; or fields that have been taken out of production.
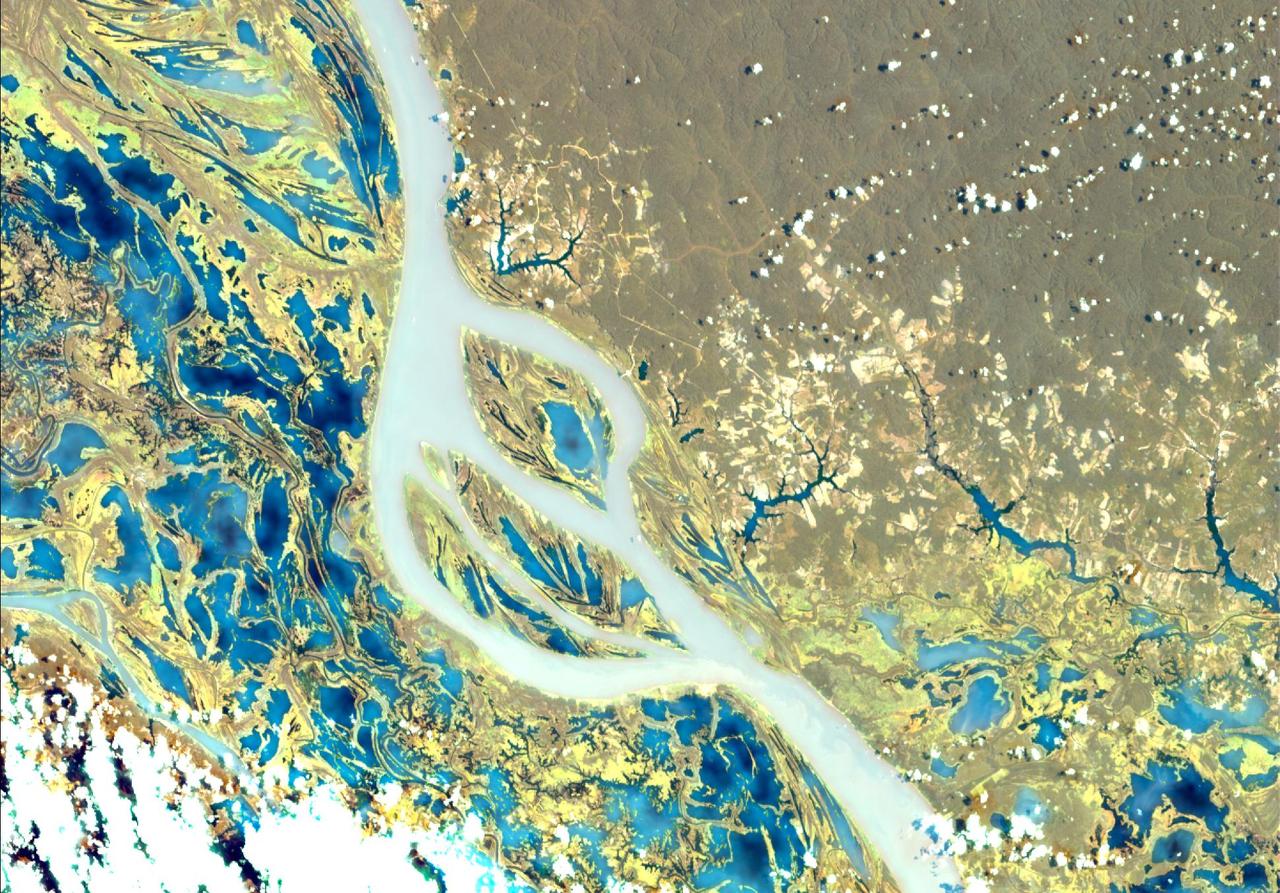
NASA's Earth Surface Mineral Dust Source Investigation (EMIT) collected this hyperspectral image of the Amazon River in the northern Brazilian state of Pará on June 30, 2024. The tan and yellow colors represent vegetated land, while the blue and turquoise hues signify water. Clouds are white. This image is part of a new dataset providing new information on global ecosystem biodiversity. EMIT, installed on the International Space Station in 2022, was originally tasked with mapping minerals over Earth's desert regions to help determine the cooling and heating effects that dust can have on regional and global climate. Since early 2024 the instrument has been on an extended mission in which its data is being used in research on a diverse range of topics including agricultural practices, snow hydrology, wildflower blooming, phytoplankton and carbon dynamics in inland waters, ecosystem biodiversity, and functional traits of forests. Imaging spectrometers like EMIT detect the light reflected from Earth and then separate visible and infrared light into hundreds of wavelength bands. Scientists use patterns of reflection and absorption at different wavelengths to determine the composition of whatever the instrument is observing. EMIT is laying the groundwork for NASA's future Surface Biology and Geology-Visible Shortwave Infrared satellite mission. SBG-VSWIR will cover Earth's land and coasts more frequently than EMIT, with finer spatial resolution. https://photojournal.jpl.nasa.gov/catalog/PIA26417
SL3-34-056 (July-September 1973) --- A near vertical view of an 8,000 square-mile area of the Grand Erg Oriental in east central Algeria as photographed from Earth orbit by one of the six lenses of the Itek-furnished S190-A Multispectral Photographic Facility Experiment in the Multiple Docking Adapter of the Skylab space station. The Grand Erg contains vast areas of sand dunes and sand plains. This photograph illustrates the variety of surface features that are characteristic of the Sahara Desert. The dark areas are relatively sand free, and may contain rock outcrops along which travel is considerably easier. Sand dunes are abundant in this picture, and their size, shape, location and pattern are due to the underlying topography and direction of the prevailing winds. Scientists interested in study of dune fields will be able to use this photograph for detailed analysis of the dune features, especially their characteristics adjacent to the sand-free areas. Federal agencies participating with NASA on the EREP project are the Departments of Agriculture, Commerce, Interior, the Environmental Protection Agency and the Corps of Engineers. All EREP photography is available to the public through the Department of Interior?s Earth Resources Observations Systems Data Center, Sioux Falls, South Dakota, 57198. Photo credit: NASA

ISS005-E-21295 (23 November 2002) --- Fire scars in Australia are featured in this image photographed by an Expedition 5 crewmember on the International Space Station (ISS). Bright orange fire scars show up the underlying dune sand in the Simpson Desert, 300 kilometers east of Alice Springs. The background is an intricate pattern of sand cordons that angles across the view from lower left to upper right. These cordons are now mostly green, showing that they have become generally static--“tied down” since they were formed by a vegetation mat of desert scrub. The fire scars were produced in a recent fire, probably within the last year. According to NASA scientists who are studying the Space Station photography, a time sequence of events can be interpreted. Fires first advanced into the view from the lower left--parallel with the major dune trend and dominant wind direction. Then the wind shifted direction by about 90 degrees so that fires advanced across the dunes in a series of frond-like tendrils. Each frond starts at some point on the earlier fire scar, and sharp tips of the fronds show where the fires burned out naturally at the end of the episode. The scientists added that the sharp edges of the fire scars are due to steady but probably weak southwesterly winds—weaker winds reduced sparking of additional fires in adjacent scrub on either side of the main fire pathways.
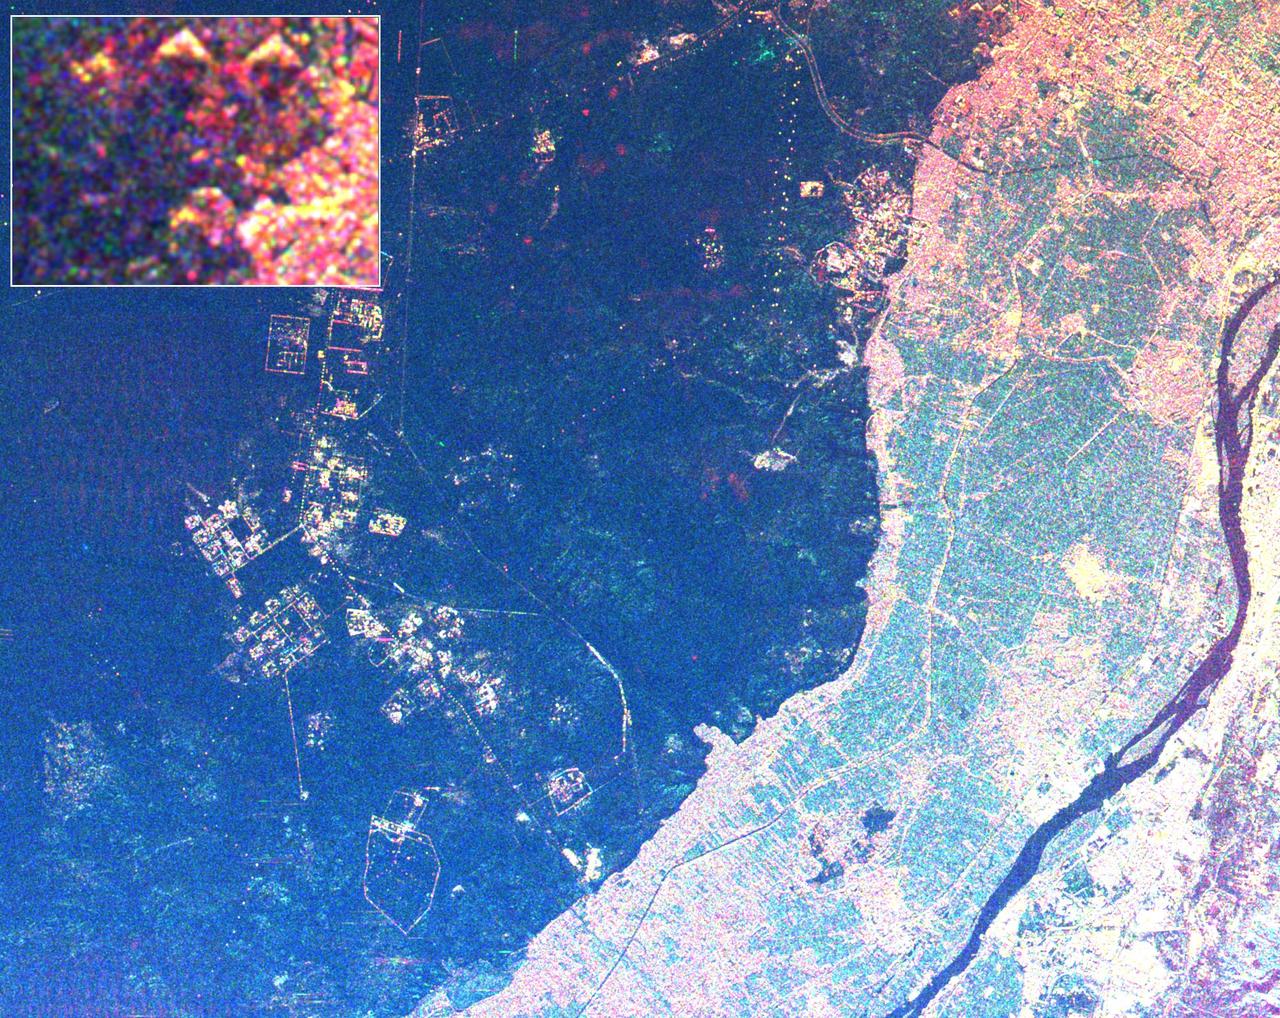
This radar image shows the area west of the Nile River near Cairo, Egypt. The Nile River is the dark band along the right side of the image and it flows approximately due North from the bottom to the right. The boundary between dense urbanization and the desert can be clearly seen between the bright and dark areas in the center of the image. This boundary represents the approximate extent of yearly Nile flooding which played an important part in determining where people lived in ancient Egypt. This land usage pattern persists to this day. The pyramids at Giza appear as three bright triangles aligned with the image top just at the boundary of the urbanized area. They are also shown enlarged in the inset box in the top left of the image. The Great Pyramid of Khufu (Cheops in Greek) is the northern most of the three Giza pyramids. The side-looking radar illuminates the scene from the top, the two sides of the pyramids facing the radar reflect most of the energy back to the antenna and appear radar bright; the two sides away from the radar reflect less energy back and appear dark Two additional pyramids can be seen left of center in the lower portion of the image. The modern development in the desert on the left side of the image is the Sixth of October City, an area of factories and residences started by Anwar Sadat to relieve urban crowding. The image was taken on April 19, 1994 by the Spaceborne Imaging Radar-C/X-Band Synthetic Aperture Radar (SIR-C/X-SAR) aboard the shuttle Endeavour. SIR-C/X-SAR, a joint mission of the German, Italian and the United States space agencies, is part of NASA's Mission to Planet Earth. The image is centered on latitude 29.72 degrees North latitude and 30.83 degrees East longitude. The area shown is approximately 20 kilometers by 30 kilometers. The colors in the image are assigned to different frequencies and polarizations of the radar as follows: red is L-band horizontally transmitted, horizontally received; green is C-band horizontally transmitted, horizontally received; blue is C-band horizontally transmitted, vertically received. http://photojournal.jpl.nasa.gov/catalog/PIA01793
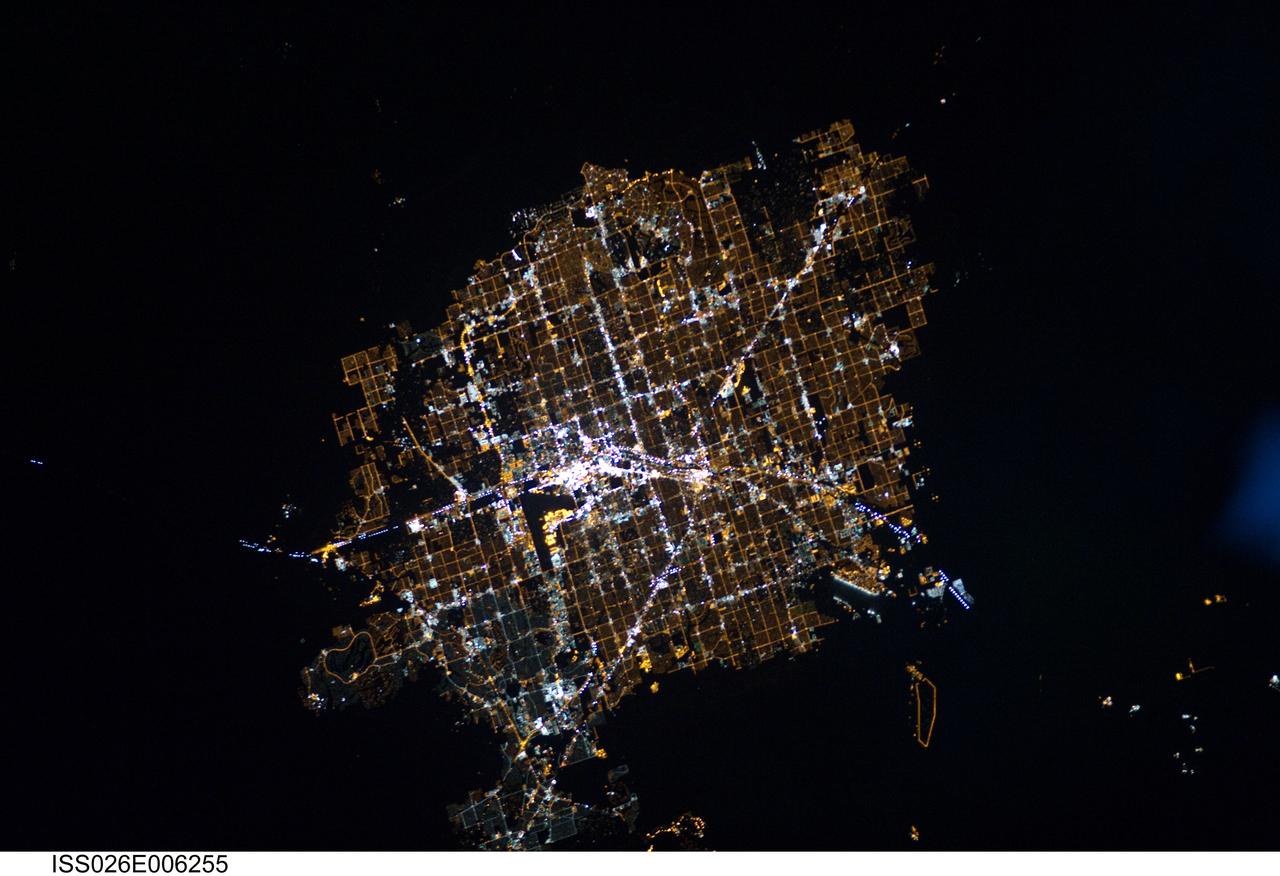
ISS026-E-006255 (30 Nov. 2010) --- This night time image, photographed by an Expedition 26 crew member on the International Space Station, features the Las Vegas, Nevada metropolitan area, located near the southern tip of the state within the Mohave Desert of the southwestern USA. While the city of Las Vegas proper is famous for its casinos and resort hotels – the city bills itself as “the entertainment capital of the world” – the metropolitan area includes several other incorporated cities and unincorporated (not part of a state-recognized municipality) areas. Crew members onboard the ISS observe and photograph numerous metropolitan sites when the areas are illuminated by sunlight, but the extent and pattern of these areas are perhaps best revealed by the city lights at night. The surrounding dark desert presents a stark contrast to the brightly lit, regular street grid of the developed metropolitan area. The Vegas Strip (center) is reputed to be the brightest spot on Earth due to the concentration of lights associated with its hotels and casinos. The tarmac of McCarran International Airport to the south is a dark feature by comparison. The airstrips of Nellis Air Force Base on the northeastern fringe of the metropolitan area are likewise dark compared to the well-lit adjacent streets and neighborhoods. The dark mass of Frenchman Mountain borders the metropolitan area to the east. Acquisition of focused night time images such as this one requires space station crew members to track the target with the handheld camera while the ISS is moving at a speed of more than seven kilometers per second (15,659 miles per hour) relative to Earth’s surface. This was achieved during ISS Expedition Six using a homemade tracking device, but subsequent crews have needed to develop manual tracking skills. These skills, together with advances in digital camera technology, have enabled recent ISS crews to acquire striking night time images of Earth.
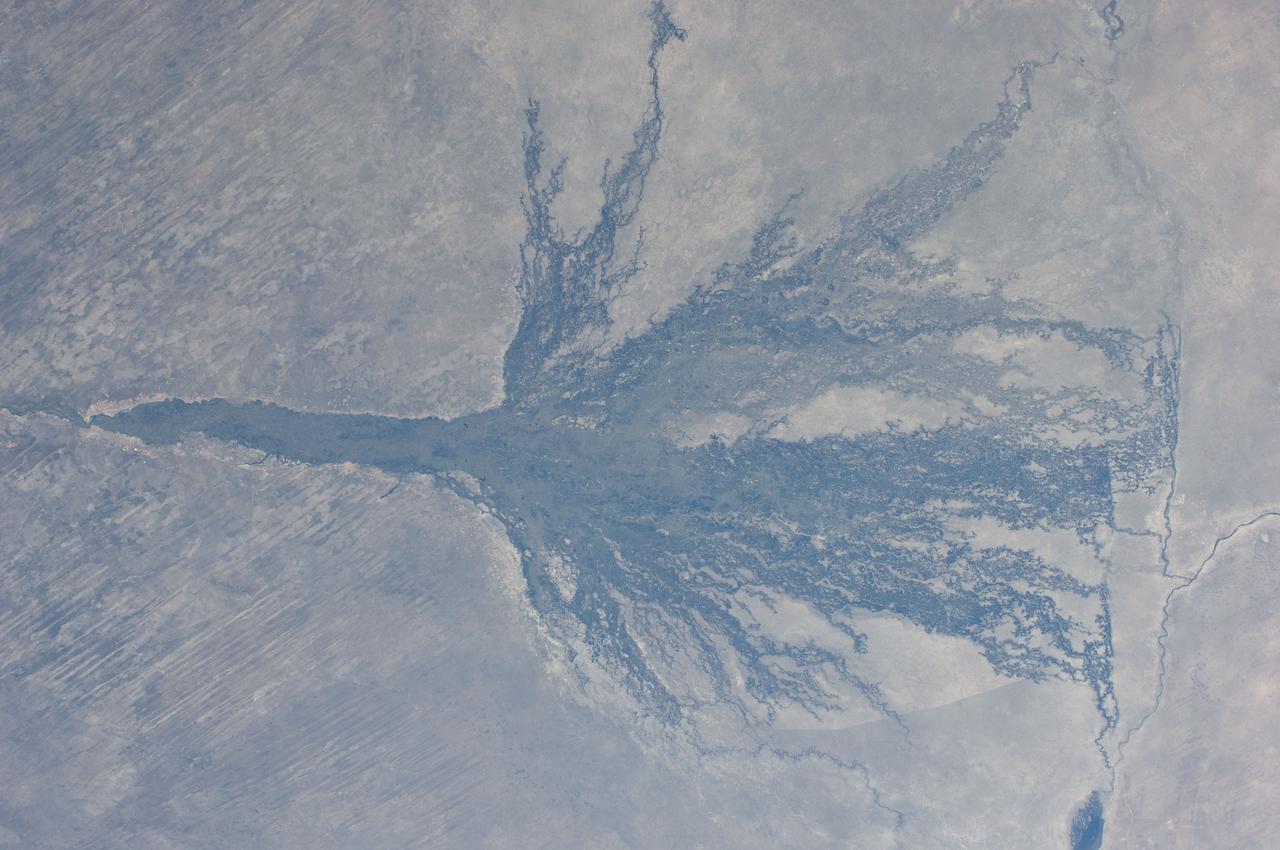
ISS028-E-006830 (2 June 2011) --- Okavango Swamp in Botswana is featured in this image photographed by an Expedition 28 crew member on the International Space Station. This short focal-length photograph shows the entire Okavango ?delta,? a swampland known in Southern Africa as the ?Jewel of the Kalahari Desert?. This enormous pristine wetland of forest, wildlife, and freshwater almost miraculously appears in a desert where surface water is typically non-existent. The water comes from the Okavango River which rises in the high-rainfall zone of southern Angola, hundreds of kilometers to the northwest. The dark green forested floodplain is approximately 10 kilometers wide where it enters the view (left). The Okavango then enters a rift basin which allows the river to spread out, forming the wetland. The width of the rift determines the dimensions of the delta?150 kilometers from apex to the linear downstream margin (right). The apex fault is more difficult to discern, but two fault lines actually define the downstream margin; the fault traces are indicated by linear stream channels and vegetation patterns oriented at nearly right angles to the southeast-trending distributary channels at center. The distributary channels carry sediment from the Okavango River that is deposited within the rift basin. Over time, a fan-shaped morphology of the deposits has developed, leading to characterization of the wetland as the Okavango ?delta?. The drying trend from higher rainfall in the north (left) to less rainfall in central Botswana (right) is shown by the change from the greens of denser savanna vegetation to browns of an open ?thornscrub? savanna. More subtle distinctions appear: the distributary arms of the delta include tall, permanent riverine and seasonal forest (dark green), with grasses and other savanna vegetation (light green) on floodplains?which appear well watered in this image. Linear dunes, emplaced by constant winds from the east during drier climates, appear as straight lines at left. The dunes are 10 meters high and their sands hold enough moisture for some trees to grow on them. Counter-intuitively, the low ?streets? between the dunes are treeless because they are dominated by dense dry white soils known as calcretes.

S73-35082 (July-Sept. 1973) --- A near vertical view of a portion of west Africa ravaged by drought for the past five years is seen in this Skylab 3 Earth Resources Experiments Package S190-B (five-inch Earth terrain camera) photograph taken from the Skylab space station in Earth orbit. The semi-desert scene is in southeastern Niger about 200 nautical miles east-northeast of the capital city of Niamey. A polygonal-shaped area (dark) in the lower right corner of the picture represents a range-management ranch. The dry stream beds trending diagonally across the photograph locally contain some water or vegetation (green). The beds are sources of water through shallow drilling and contain soils suitable for production of crops. The variety of tans, browns and grays are typical desert colors that represent barren rocks and soil or sand-filled ancient stream valleys. Absence of vegetation is the singular feature of the area. Dr. G. Stuckmann of the Geographic Institute, University of Technology, Mannover, Federal Republic of Germany, will use this photograph in the study of the hydrologic regime of the region through analysis of fossil drainage patterns, geological structures and accumulations of surface water. Federal agencies participating with NASA on the EREP project are the Departments of Agriculture, Commerce, Interior, the Environmental Protection Agency and the Corps of Engineers. All EREP photography is available to the public through the Department of Interior?s Earth Resources Observations Systems Data Center, Sioux Falls, South Dakota, 57198. (Alternate number SL3-86-166) Photo credit: NASA

ISS013-E-75141 (2 Sept. 2006) --- Erg Oriental, Algeria is featured in this image photographed by an Expedition 13 crewmember onboard the International Space Station. One of the main interests of rainless regions like the Sahara Desert to landscape science is that the work of flowing water--mainly streams and rivers--becomes less important than the work of wind. According to scientists, over millennia, and if enough sand is available, winds can generate dunes of enormous size, arranged in regular patterns. Long, generally north-south trending linear dunes stretch across much of northeast Algeria covering a vast tract (approximately 140,000 kilometers square) of the Sahara Desert known as the Erg Oriental. Erg means dune sea in Arabic, and the term has been adopted into modern geology. Spanning this image diagonally are a series of two kilometer-wide linear dunes, comprised of red sand, from a point on the southwest margin of the erg (center point 28.9N 4.8W). The dune chains are more than 100 meters high. The "streets" between the dunes are grayer areas free of sand. Linear dune chains are usually generated roughly parallel with the dominant winds. It also seems to be true that linear dunes are built by stronger winds. This detailed view shows that smaller dunes, known as star dunes, are built on top of the linear dunes. By contrast, star dunes seem to form in weak wind regimes, with winds from different directions in each season -- resulting in characteristic "arms" snaking away from a central point. Some scientists therefore think the dunes in this image were generated in two earlier climatic phases, different from that of today. (1) During a phase when winds were stronger and dominantly from one direction (the south), major linear sand masses accumulated. (2) Later, when wind strengths declined, the star dunes formed. Modern features--known as wind streaks--on the edge of the present erg (not shown), younger than either the linear or star dunes, show that present-day sand-moving winds blow from the southwest.
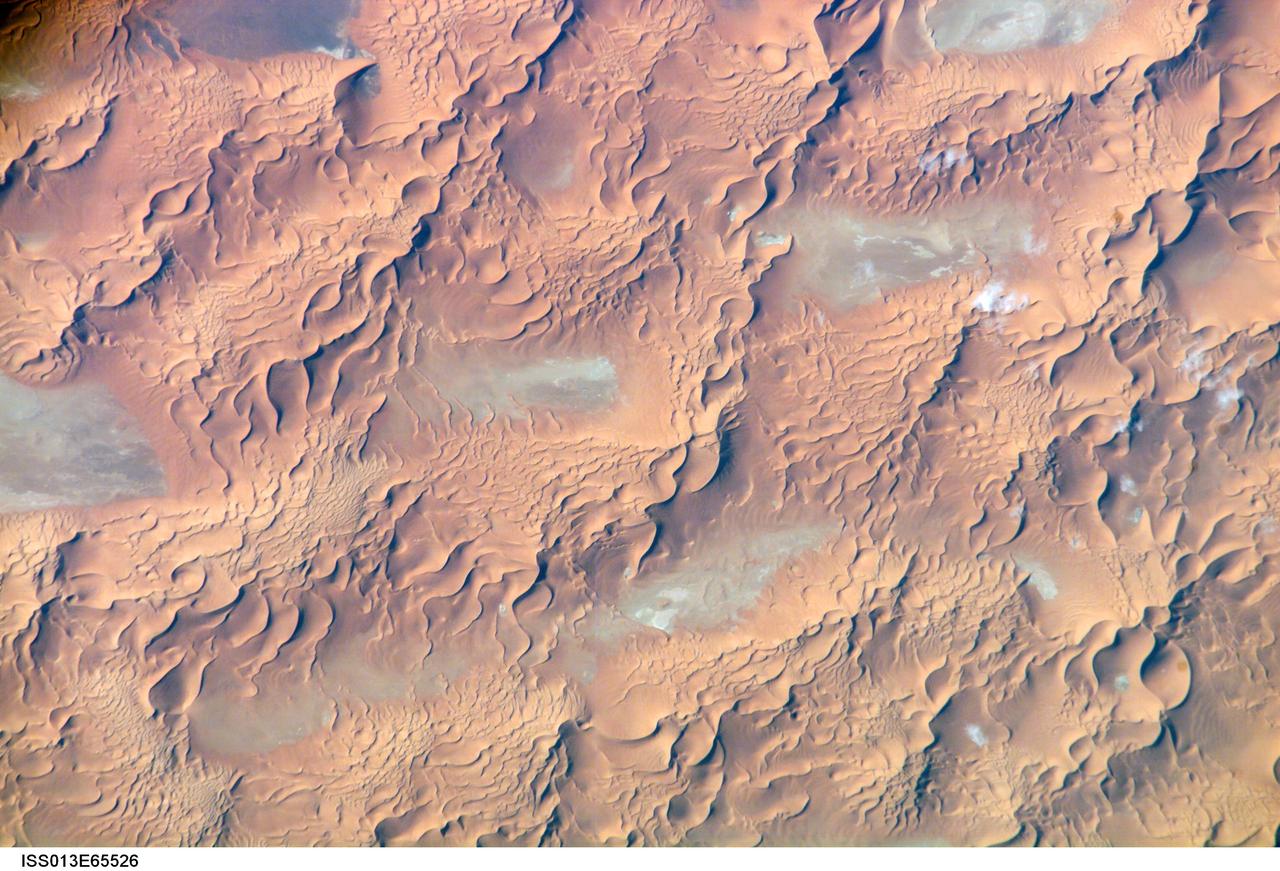
ISS013-E-65526 (8 Aug. 2006) --- Issaouane Dune Sea, Eastern Algeria is featured in this image photographed by an Expedition 13 crewmember on the International Space Station. This view from one of the smaller dune seas in the central Sahara shows the complex but regular patterns produced by winds in deserts where abundant sand is available. Geologists now know that dune seas (also called ergs) comprise at least three orders of dune size. In this image the largest and oldest appear here as chains oriented about 60 degrees apart, that is, one oriented almost north-south, the other southwest-northeast. The "streets" between the dune chains (also called mega-dunes) are swept clean of sand in places, revealing the original surface, with light colored muds and salt derived from very occasional rains. The chains have probably taken hundreds of thousands of years to accumulate, starting when the Sahara began to become significantly dry roughly 2.5 million years ago. Rivers became smaller, failed to reach the sea and deposited their sand load in the desert. Wind did the rest, blowing the sand into aerodynamic dune forms. According to scientists, chain trends coincide with two of the four major trends identified in the Great Eastern Sand Sea immediately to the north. Each trend likely implies a different formative wind direction--attesting to the climate shifts that have occurred since sand began to accumulate in the central Sahara. Smaller dunes are superimposed on the mega-dunes. Sinuous crest lines are the mesoscale (intermediate in size) forms, forming octopus-like crests, especially evident as the arms of star dunes. Whereas the mega-dunes are apparently stationary, studies based on aerial photographs in other parts of the world show that these dune crests move in the course of decades. The smallest dunes appear in patches on the eastern sides of the mega-dunes as a tracery of closely spaced crests. Small dunes move fast and reform quickly as stronger winds shift with the seasons. Sand grains are blown continuously from upwind dunes, across the dune-free flats. Small dunes form when the grains slow down and accumulate at the next large dune. The small dunes ride up and over the backs of the mega- and meso-dunes. Interestingly the crest orientation of the small dunes is different from that of the mesoscale dunes throughout the image. This is a common effect of wind direction shifting locally depending on dune height: the increased friction caused by larger dunes causes formative winds to blow to the left of the (weaker) winds that form the small dunes. The friction effect of larger dunes is to the right in the southern hemisphere, well illustrated on the coast of the Namib Desert.
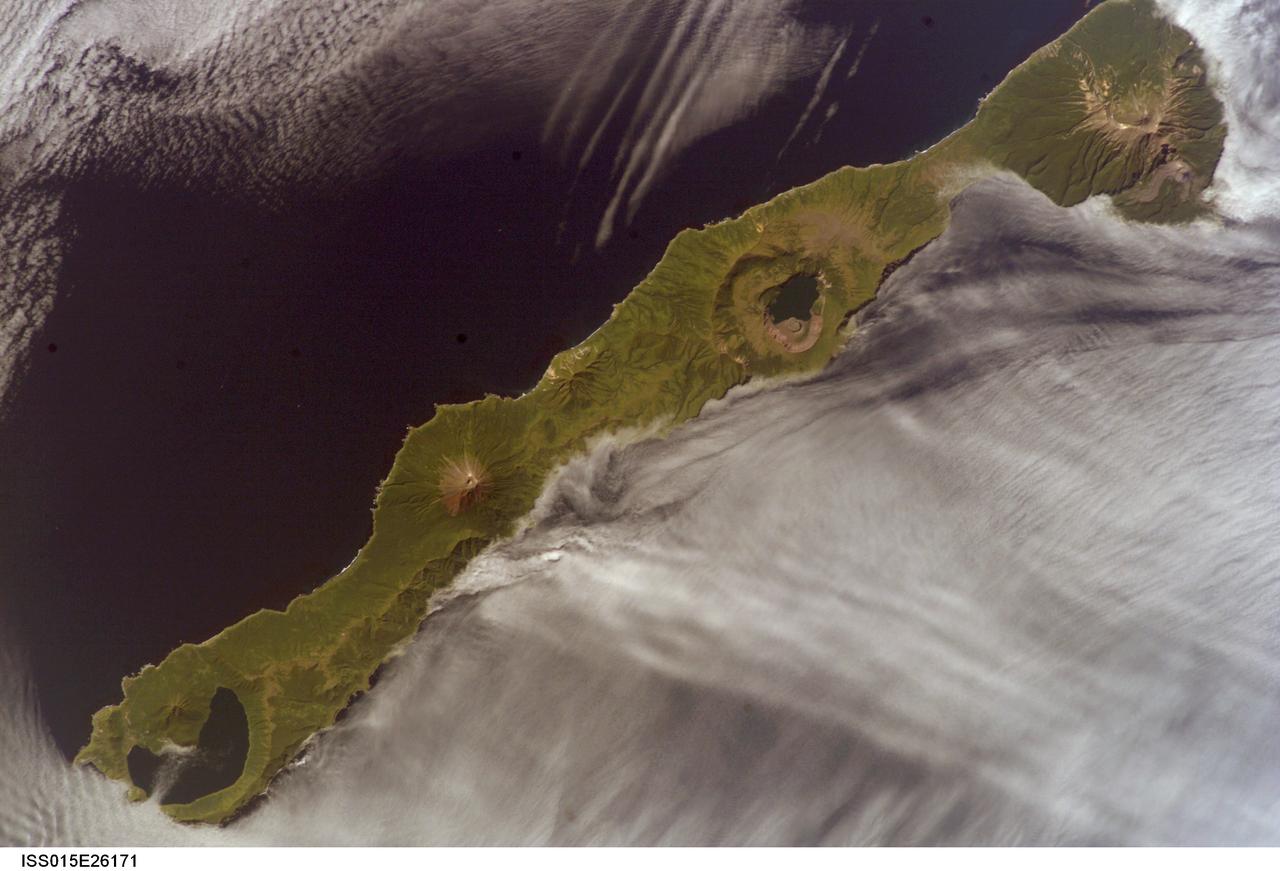
ISS015-E-26171 (1 Sept. 2007) --- Simushir Island, Kuril Archipelago, Russian Far East, is featured in this image photographed by an Expedition 15 crewmember on the International Space Station. Simushir is a deserted, 5-mile-wide volcanic island in the Kuril island chain, half way between northern Japan and the Kamchatka Peninsula of Russia. Four volcanoes - Milne, Prevo, Urataman and Zavaritski - have built cones that are high enough to rise above the altitude of green forest. The remaining remnant of Zavaritski volcano is a caldera -- a structure formed when a volcano collapses into its emptied magma chamber. A small lake fills the innermost of three nested calderas which make up Zavaritski Caldera. The larger caldera of Urataman Volcano is connected to the sea. A defunct Soviet naval base occupies the northern tip of the island next to this caldera. The islands and volcanoes of the Kuril chain are part of the Pacific Rim of Fire, marking the edge of the Pacific tectonic plate. Low stratus clouds approaching from the northwest (from the Sea of Okhotsk--top left) bank up against the northwest side of the island, making complex cloud patterns. A small finger of cloud can be seen entering the northernmost caldera (Urataman) at sea level. When this image was taken, the cloud layer had stopped at the northwest coast of the island, not flowing over even the low points of the island between the volcanoes. The cloud pattern suggests that the air mass flowed up and over the island, descending on the southeast side. This descending motion was enough--under stable atmospheric conditions--to warm up the atmosphere locally so that a cloud-free zone formed on the southeastern, lee side of the island.
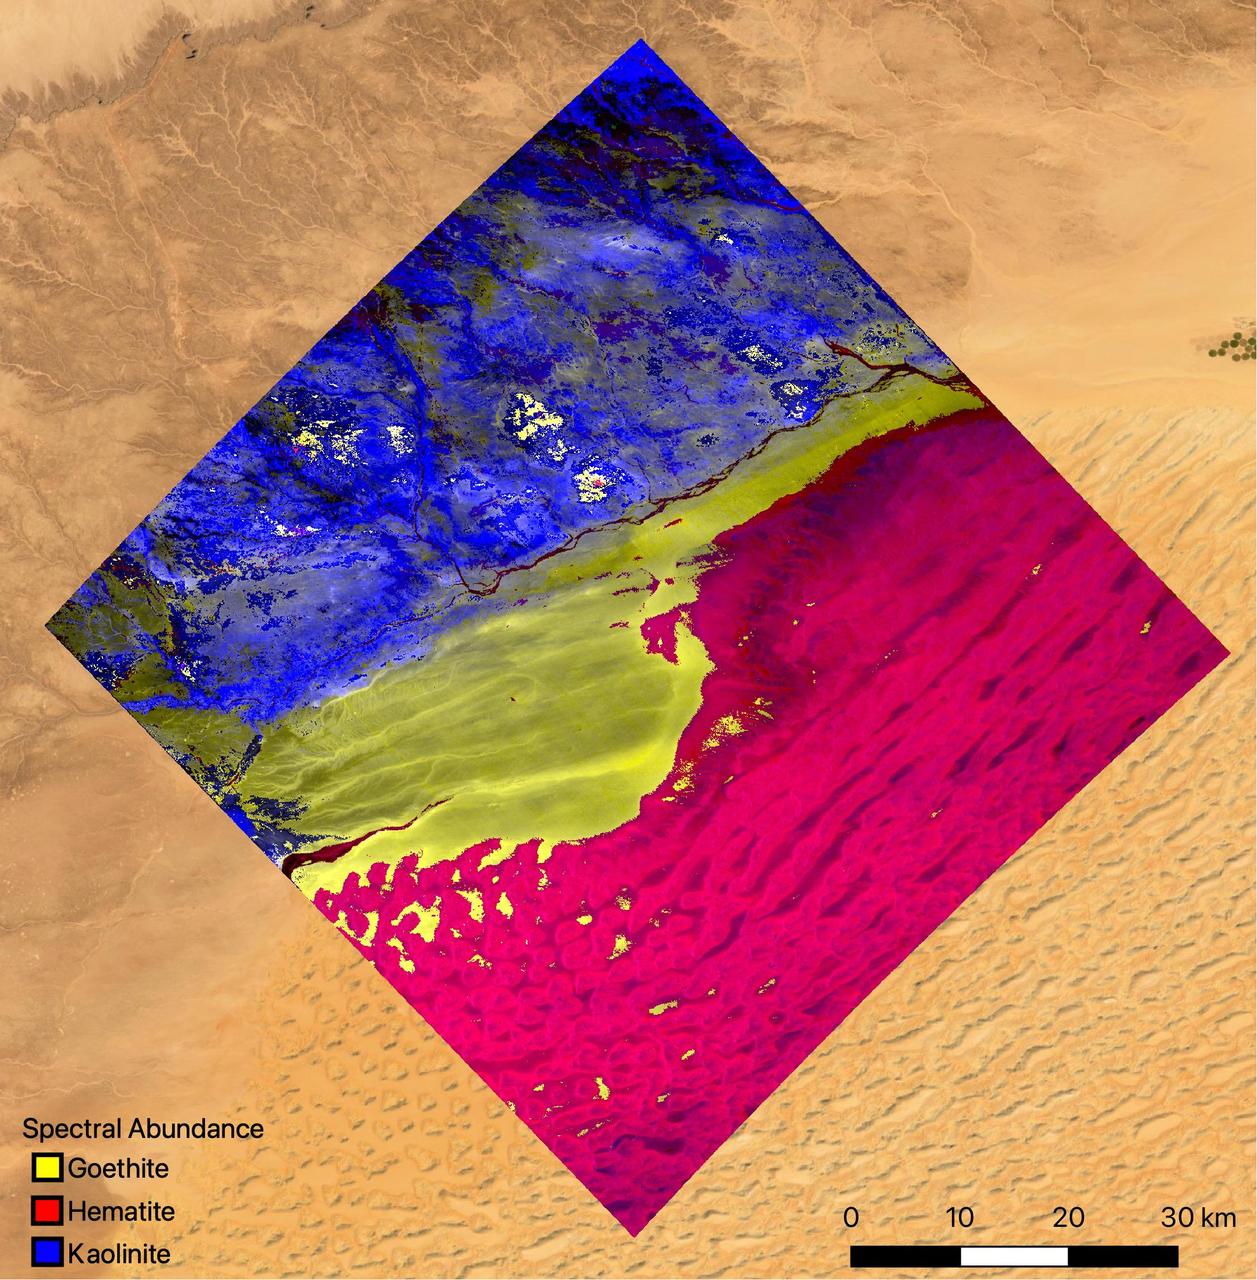
The mineral map shows an area of southwestern Libya in the Sahara Desert observed by NASA's Earth Surface Mineral Dust Source Investigation (EMIT) mission as it maps the world's mineral dust sources, gathering information about surface composition as the instrument, designed at NASA's Jet Propulsion Laboratory in Southern California, orbits aboard the International Space Station. The instrument works by measuring reflected solar energy from Earth across hundreds of wavelengths from the visible to the infrared range of the spectrum. The intensity of the reflected light varies by wavelength based on the material. Scientists are using these patterns, called spectral fingerprints, to identify surface minerals and pinpoint their locations on a map. The map is among the first produced by scientists with EMIT data. Analysis of the patterns indicate that the surface contains kaolinite, a light-colored clay mineral, and goethite and hematite, two varieties of iron oxide, which is darker. When dust from the kaolinite-dominated areas is lofted into the atmosphere, the particles tend to scatter sunlight and reflect it back to space, cooling the air. The opposite effect occurs with airborne particles of iron oxide, which tend to absorb heat and warm the surrounding air. Over the course of its 12-month mission, EMIT will collect measurements of 10 important surface minerals – kaolinite, hematite, goethite, illite, vermiculite, calcite, dolomite, montmorillonite, chlorite, and gypsum – in arid regions between 50-degree south and north latitudes in Africa, Asia, North and South America, and Australia. The data EMIT collects will help scientists better understand the role of airborne dust particles in heating and cooling Earth's atmosphere on global and regional scales. EMIT was developed at NASA's Jet Propulsion Laboratory, which is managed for the agency by Caltech in Pasadena, California. It launched to the space station in July 2022. https://photojournal.jpl.nasa.gov/catalog/PIA25424
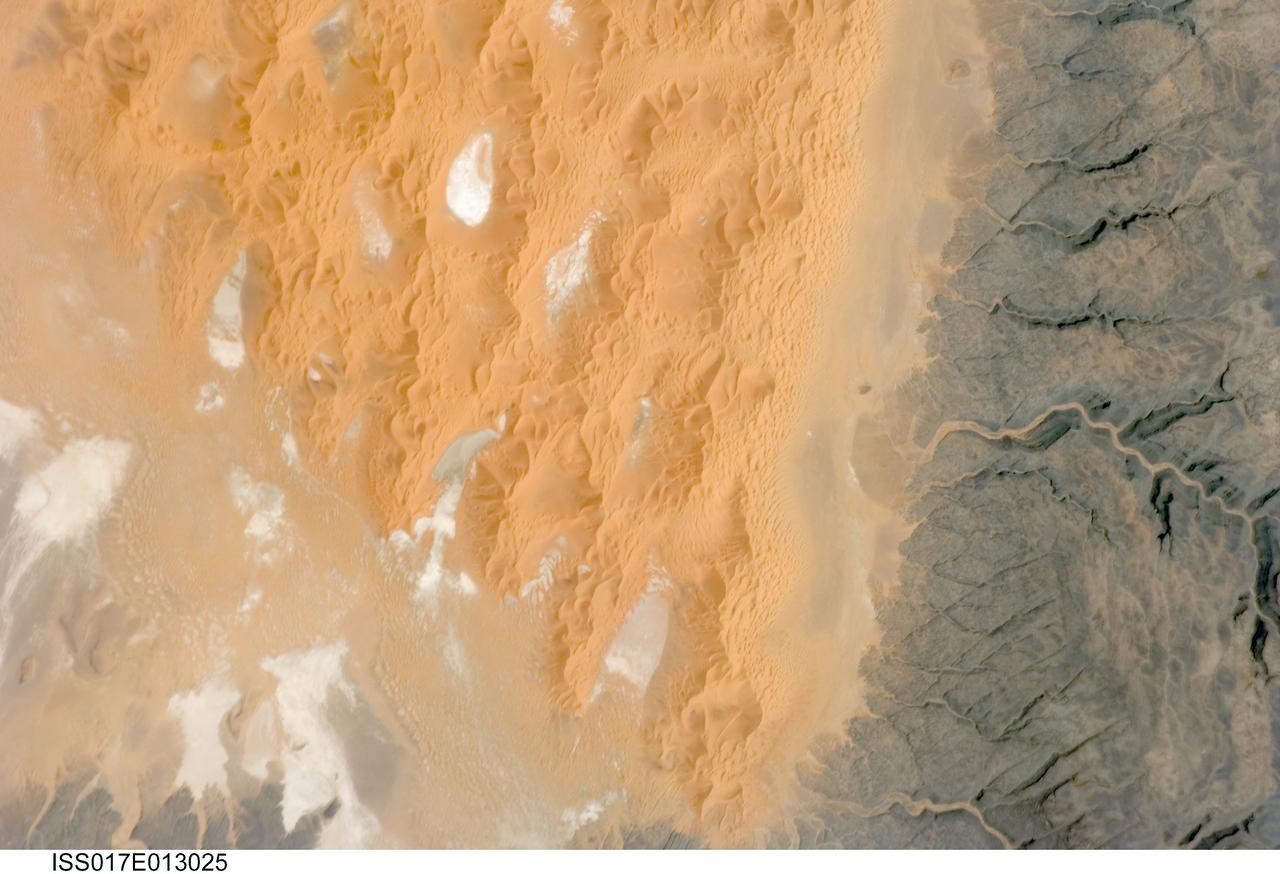
ISS017-E-013025 (12 Aug. 2008) --- The Tifernine Dune Field in Algeria is featured in this image photographed by an Expedition 17 crewmember on the International Space Station. The Tifernine Dune Field is located at the southernmost tip of the Grand Erg Oriental, a "dune sea" that occupies a large portion of the Sahara Desert in eastern Algeria. This view illustrates the interface between the yellow-orange sand dunes of the field and adjacent dark brown consolidated rocks of the Tinrhert Plateau to the south and east (right). NASA scientists point out that three distinct landform types are visible in the image, each providing information about past and present climate in the area. The oldest landform is represented by the rocks of the Tinrhert Plateau, which are characterized by a number of incised channels in the bedrock -- these formed during a wet and cool climate period, most probably by glacial meltwater streams. As the present dry and hot climate that characterizes the Sahara became established, water ceased to flow in these channels, and large amounts of drying sediment (sand, silt, and clay) were eroded and transported by predominantly northeast-southwest winds -- forming large linear dunes that roughly parallel the prevailing wind direction (center). The present climate regime is still hot and dry, but current wind directions are more variable, leading to the formation of star dunes -- recognizable by a starfish-like pattern when seem from above -- that are modifying the older large linear dunes. White to grey regions within the dune field are exposed deposits of silt and clay, together with evaporite minerals (such as halite, or common table salt) formed by evaporation of water that collected in small basins between the dunes.
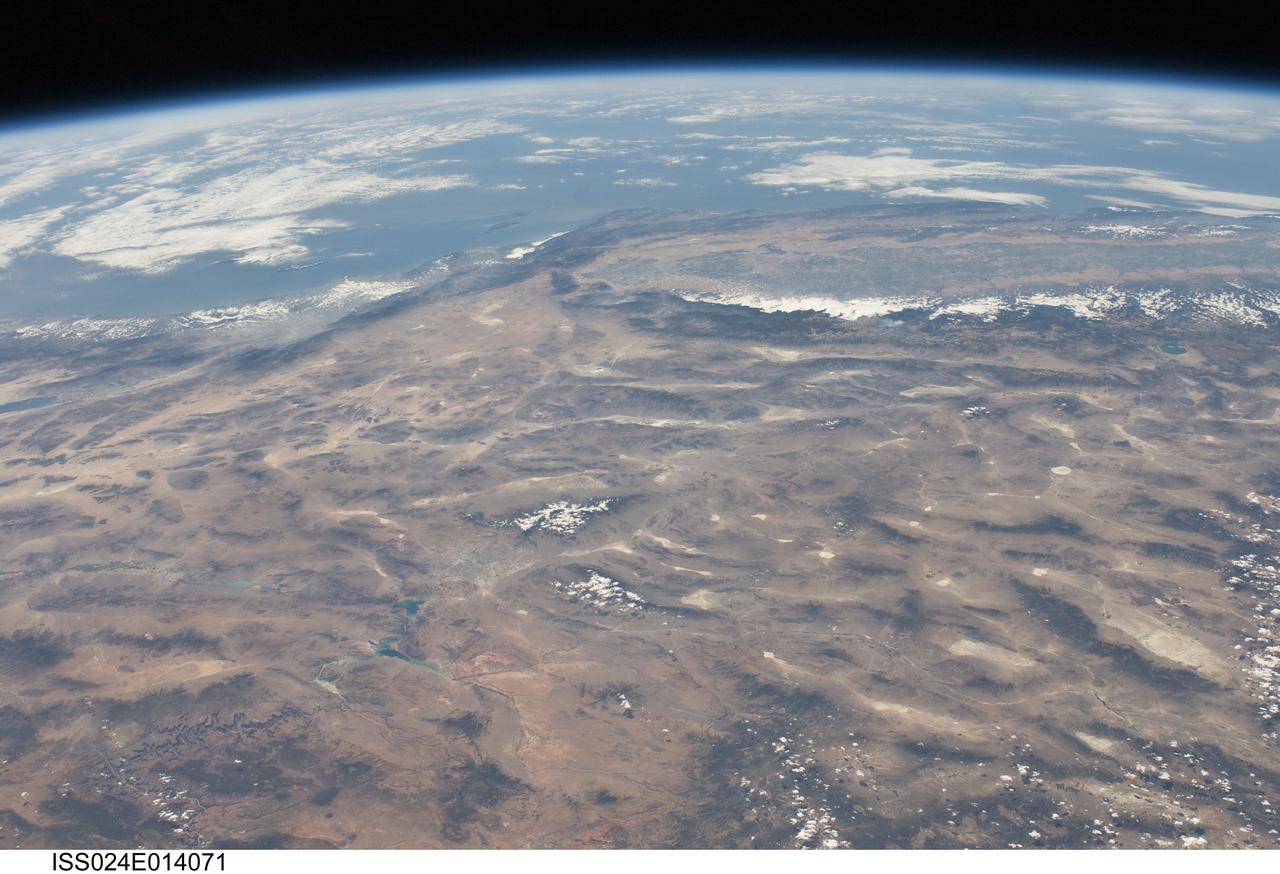
ISS024-E-014071 (9 Sept. 2010) --- This striking panoramic view of the southwestern USA and Pacific Ocean is an oblique image photographed by an Expedition 24 crew member looking outwards at an angle from the International Space Station (ISS). While most unmanned orbital satellites view Earth from a nadir perspective?in other words, collecting data with a ?straight down? viewing geometry?crew members onboard the space station can acquire imagery at a wide range of viewing angles using handheld digital cameras. The ISS nadir point (the point on Earth?s surface directly below the spacecraft) was located in northwestern Arizona, approximately 260 kilometers to the east-southeast, when this image was taken. The image includes parts of the States of Arizona, Nevada, Utah, and California together with a small segment of the Baja California, Mexico coastline at center left. Several landmarks and physiographic features are readily visible. The Las Vegas, NV metropolitan area appears as a gray region adjacent to the Spring Mountains and Sheep Range (both covered by white clouds). The Grand Canyon, located on the Colorado Plateau in Arizona, is visible (lower left) to the east of Las Vegas with the blue waters of Lake Mead in between. The image also includes the Mojave Desert, stretching north from the Salton Sea (left) to the Sierra Nevada mountain range. The Sierra Nevada range is roughly 640 kilometers long (north-south) and forms the boundary between the Central Valley of California and the adjacent Basin and Range. The Basin and Range is so called due to the pattern of long linear valleys separated by parallel linear mountain ranges ? this landscape, formed by extension and thinning of Earth?s crust, is particularly visible at right.
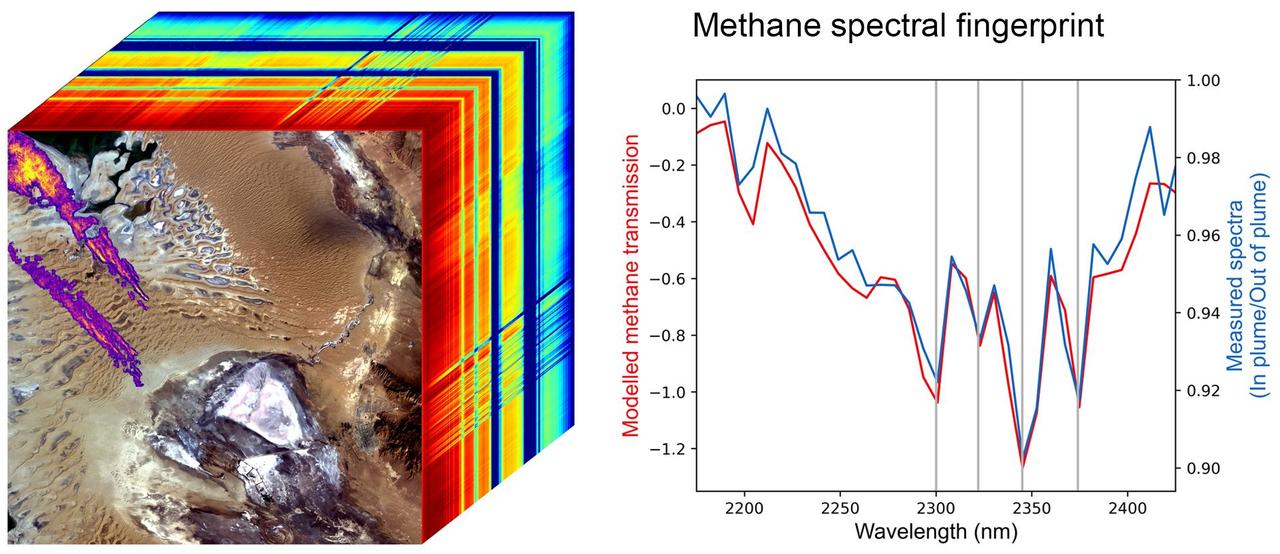
Produced with data from NASA's Earth Surface Mineral Dust Source Investigation (EMIT) mission, this image uses two different ways of displaying methane's unique pattern of absorbed infrared light – called a spectral fingerprint. This potent greenhouse gas is estimated to be 80 times more effective at trapping heat in the atmosphere than carbon dioxide. EMIT uses an imaging spectrometer to detect the spectral fingerprints of various materials on Earth's surface and in its atmosphere. Installed on the International Space Station in July 2022, EMIT was originally intended to map the prevalence of minerals in Earth's arid regions, such as the deserts of Africa, Australia, and the Americas. Scientists verified that EMIT could also detect the spectral fingerprints of methane and carbon dioxide exceptionally well when they were checking the accuracy of the image spectrometer's mineral data. The left panel shows an EMIT data cube that spans an area of Turkmenistan roughly 2,500 square miles (6,400 square kilometers). The rainbow colors extending through the data cube represent the spectral fingerprints from each location within the scene at the front of the cube. The purple, orange, and yellow streaks shown on the satellite image represent multiple methane plumes; the colors correspond to differing concentrations of methane. The line graph on the right displays the methane spectral fingerprint measured by EMIT (blue line). The red line displays the expected spectral fingerprint for methane calculated using an atmospheric simulation. The data for this image was collected by EMIT in August 2022. https://photojournal.jpl.nasa.gov/catalog/PIA25593
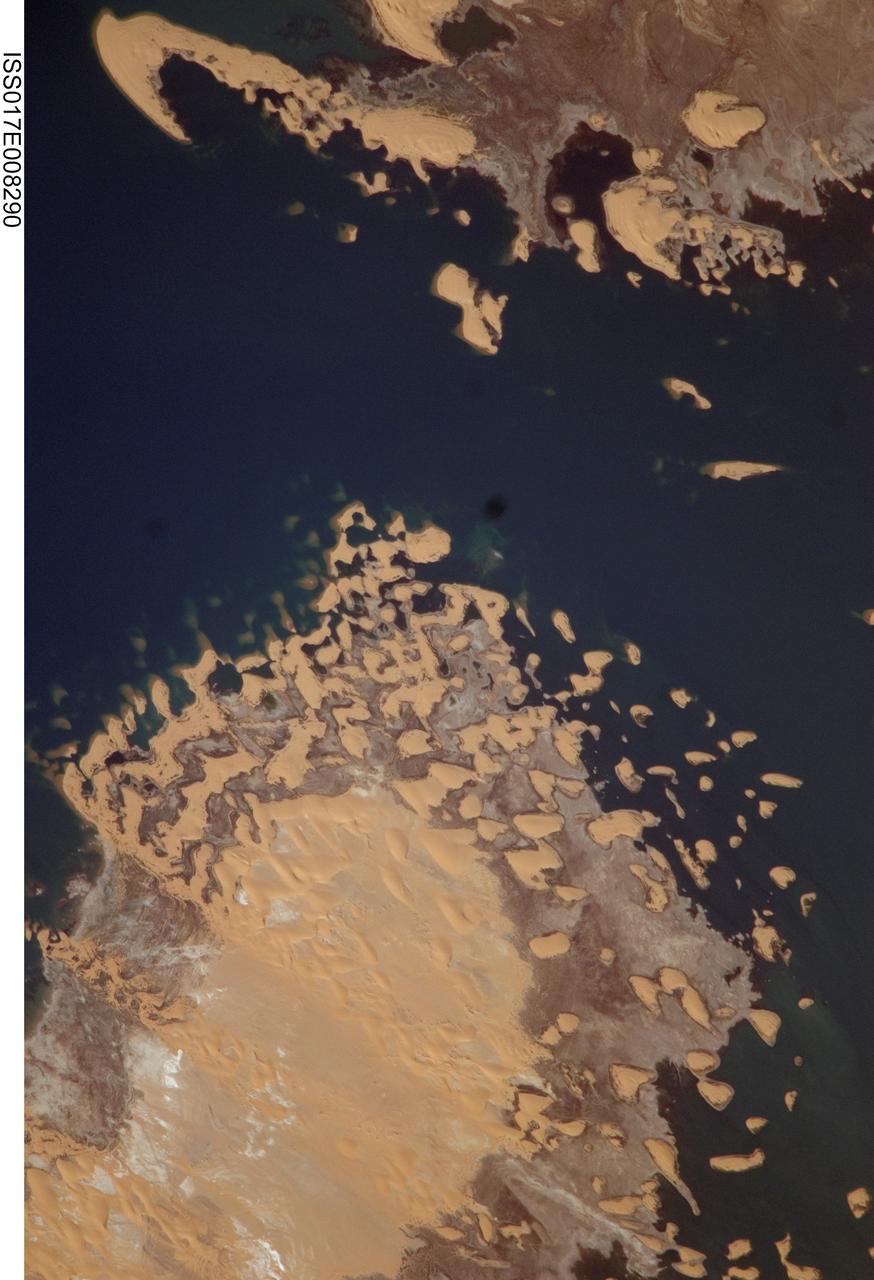
ISS017-E-008290 (31 May 2008) --- Toshka Lakes in southern Egypt are featured in this image photographed by an Expedition 17 crewmember on the International Space Station. In the late 1990s, Egypt's new manmade Toshka Lakes, fed from Lake Nasser via a new canal, grew and spilled into new basins to become four major and two smaller waterbodies extending 120 kilometers across the desert west of the Nile River in southern Egypt. Starting in 2002, astronauts have seen the lakes slowly decline, with the telltale ring of darker, moistened ground showing the previous higher water levels. The rise and fall of Toshka Lakes, and the economic development surrounding the region, are dependent on climate fluctuations and water agreements with upstream countries that, in turn, determine the long-term water flow in the lower Nile. This view, covering a distance of 11.3 kilometers from bottom to top, shows shoreline detail of the third large lake. Lake water appears deep blue to blue-green, and parallel with the shoreline is a wide brown zone which was under water until 2002. Most of the bright yellow sand dunes in the view are re-emerging as the lake level drops, most outlined visibly by thin wet margins. Still-submerged dunes can be seen as small gray blebs offshore (left center). The summit of the biggest horn-shaped dune (top left) was an island more than 5 kilometers off shore in images from 2001. The dune pattern gives a strong sense of dune migration southwards, from top left towards lower right (horns of crescent dunes point in the direction of dune movement). Dominant northerly winds drive the dunes southward, except, of course, when they are under water.
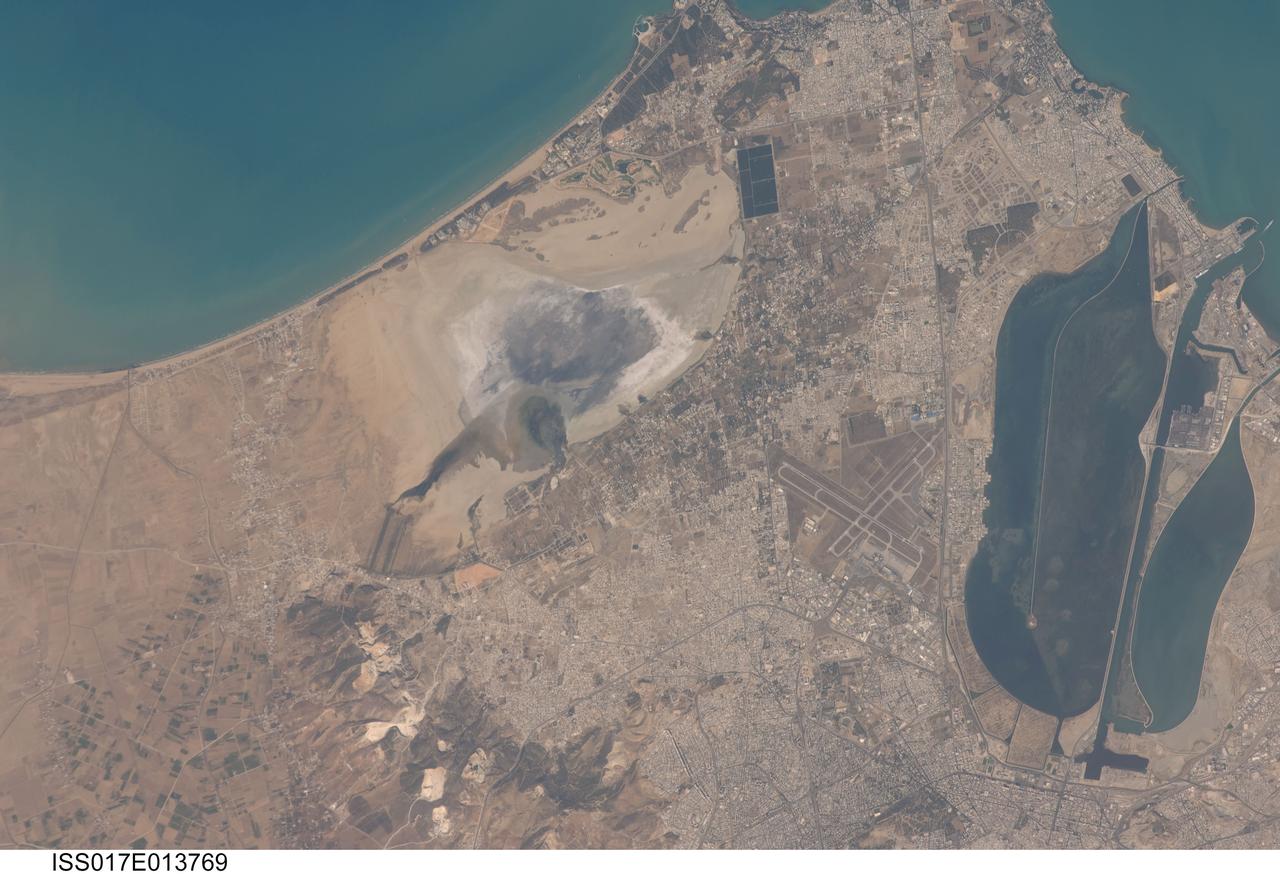
ISS017-E-013769 (19 Aug. 2008) --- Tunis, Tunisia is featured in this image photographed by an Expedition 17 crewmember on the International Space Station. The city of Tunis, capital of Tunisia, is a rapidly modernizing city located along the Mediterranean coast of northern Africa. Sharing much of its history with famous Carthage to the north, Tunis was also destroyed by Rome in approximately 146 BC. Tunis, however, was rebuilt by the Romans and became an important agricultural center. Modern Tunis serves as the administrative center for the whole of Tunisia, and as a commercial hub for trade in the northern part of the country. The urban area of Tunis is located on a flat coastal plain, and is distinguished in this view from the surrounding desert by the pattern of grey to tan buildings and darker street grid. The city is bordered by an evaporating saline lake to the northeast known as Sebkhet Arina (upper left) -- evaporite minerals such as halite (table salt) and gypsum produce the white deposits surrounding the darker lake center where there is more moisture. To the southeast of the city is Lake Tunis, a lagoon that has been significantly altered by human activities -- such as closing off water exchange with the Mediterranean Sea - dating back to Roman times. The general lack of water circulation and input of nutrients from sewage has lead to the establishment of marine worm reefs, and occasional fish kills. The western urban-rural fringe is defined by a range of low hills (lower left); dark green agricultural fields are visible on the western side of these hills.
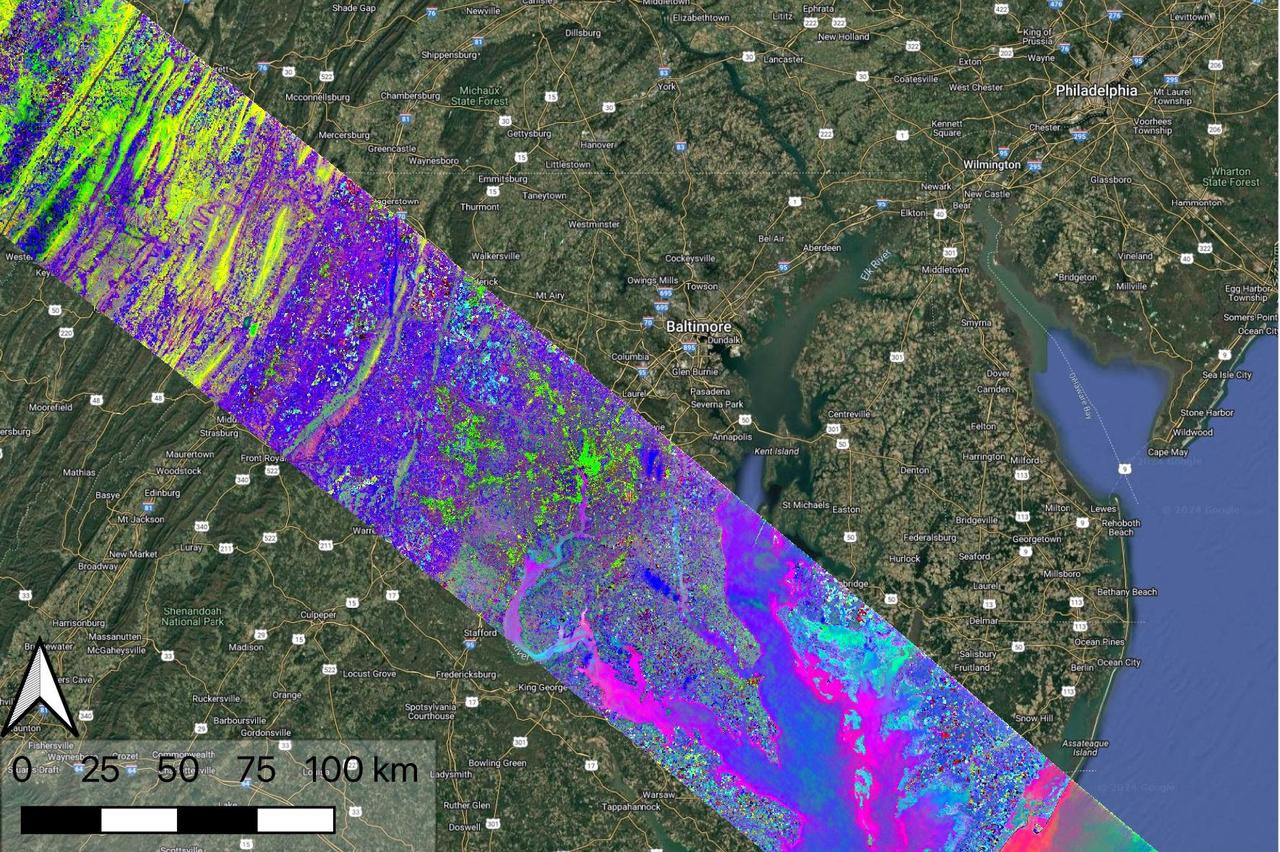
Data collected by NASA's Earth Surface Mineral Dust Source Investigation (EMIT) on April 23, 2024, indicates the location of a variety of planet communites across a swath of the mid-Atlantic United States. Overlain on a Google base map, each color represents a different type of natural biome or agricultural land. Hyperspectral data such as this is being analyzed in a range of NASA-funded research projects looking at the distribution and traits of plant communities, including agricultural crops. EMIT, installed on the International Space Station in 2022, was originally tasked with mapping minerals over Earth's desert regions to help determine the cooling and heating effects that dust can have on regional and global climate. Since early 2024 the instrument has been on an extended mission in which its data is being used in research on a diverse range of topics including agricultural practices, snow hydrology, wildflower blooming, phytoplankton and carbon dynamics in inland waters, ecosystem biodiversity, and functional traits of forests. Imaging spectrometers like EMIT detect the light reflected from Earth and then separate visible and infrared light into hundreds of wavelength bands. Scientists use patterns of reflection and absorption at different wavelengths to determine the composition of whatever the instrument is observing. EMIT is laying the groundwork for NASA's future Surface Biology and Geology-Visible Shortwave Infrared satellite mission. SBG-VSWIR will cover Earth's land and coasts more frequently than EMIT, with finer spatial resolution. https://photojournal.jpl.nasa.gov/catalog/PIA26418
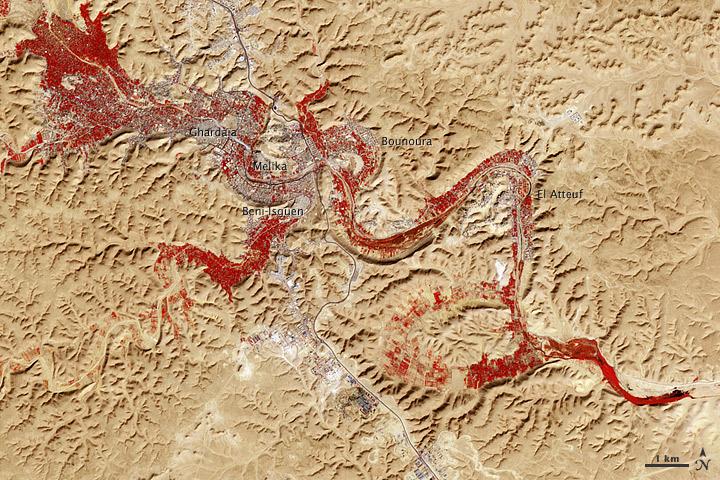
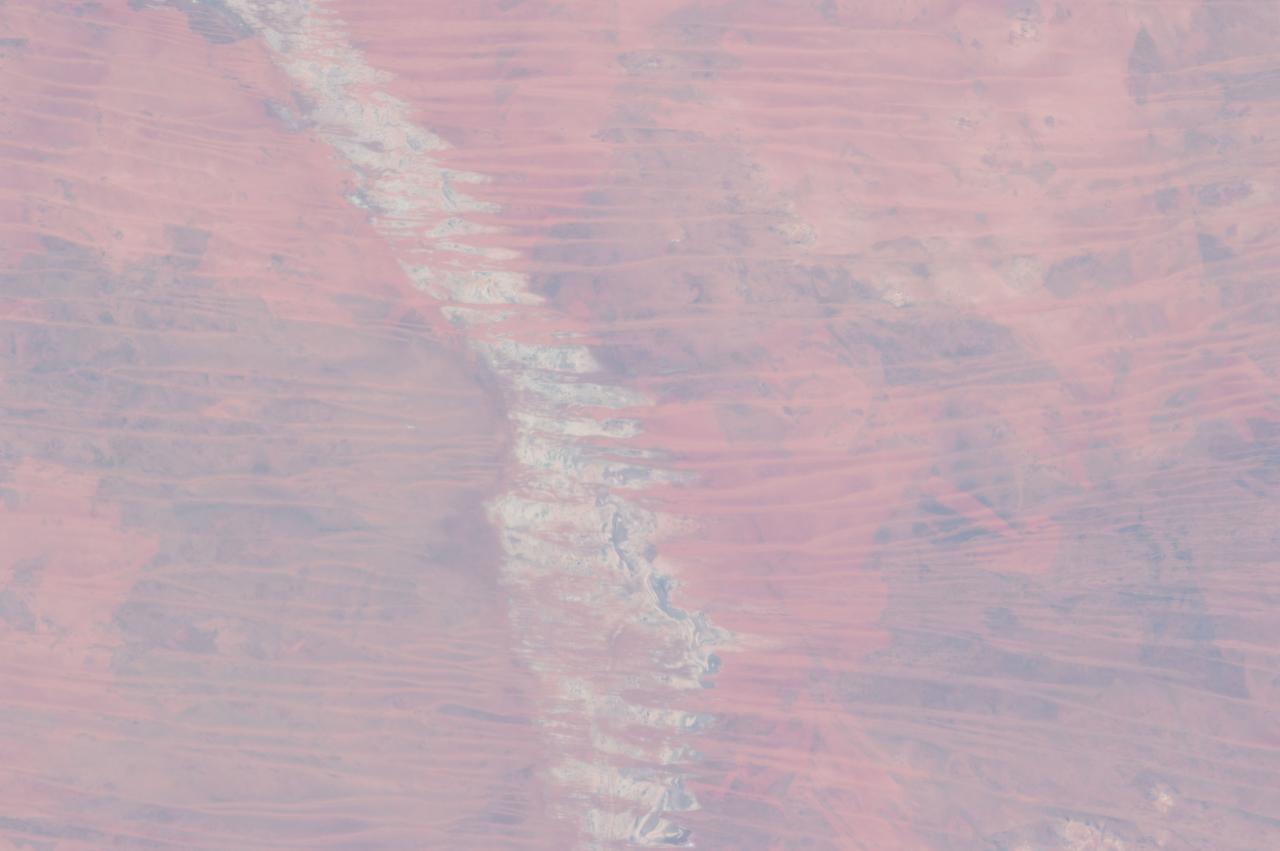
NASA image acquired Feb. 9, 2011 Less than 5 percent of Algeria’s land surface is suitable for growing crops, and most precipitation falls on the Atlas Mountains along the coast. Inland, dust-laden winds blow over rocky plains and sand seas. However, in north central Algeria—off the tip of Grand Erg Occidental and about 450 kilometers (280 miles) south of Algiers—lies a serpentine stretch of vegetation. It is the M’zab Valley, filled with palm groves and dotted with centuries-old settlements. The Advanced Spaceborne Thermal Emission and Reflection Radiometer (ASTER) on NASA’s Terra satellite captured this image of M’zab Valley on February 9, 2011. ASTER combines infrared, red, and green wavelengths of light. Bare rock ranges in color from beige to peach. Buildings and paved surfaces appear gray. Vegetation is red, and brighter shades of red indicate more robust vegetation. This oasis results from water that is otherwise in short supply in the Sahara Desert, thanks to the valley’s approximately 3,000 wells. Chemical analysis of Algerian aquifers, as well studies of topography in Algeria and Tunisia, suggest this region experienced a cooler climate in the late Pleistocene, and potentially heavy monsoon rains earlier in the Holocene. The M’zab region shows evidence of meandering rivers and pinnate drainage patterns. The vegetation lining M’zab Valley highlights this old river valley’s contours. Cool summer temperatures and monsoon rains had long since retreated from the region by eleventh century, but this valley nevertheless supported the establishment of multiple fortified settlements, or ksours. Between 1012 A.D. and 1350 A.D., locals established the ksours of El-Atteuf, Bounoura, Melika, Ghardaïa, and Beni-Isguen. Collectively these cities are now a United Nations Educational, Scientific, and Cultural Organization (UNESCO) World Heritage site. NASA Earth Observatory image by Robert Simmon and Jesse Allen, using data from the GSFC/METI/ERSDAC/JAROS, and U.S./Japan ASTER Science Team. Caption by Michon Scott. Instrument: Terra - ASTER <b>To download the full high res file go <a href="http://earthobservatory.nasa.gov/IOTD/view.php?id=51296" rel="nofollow"> here</a></b>
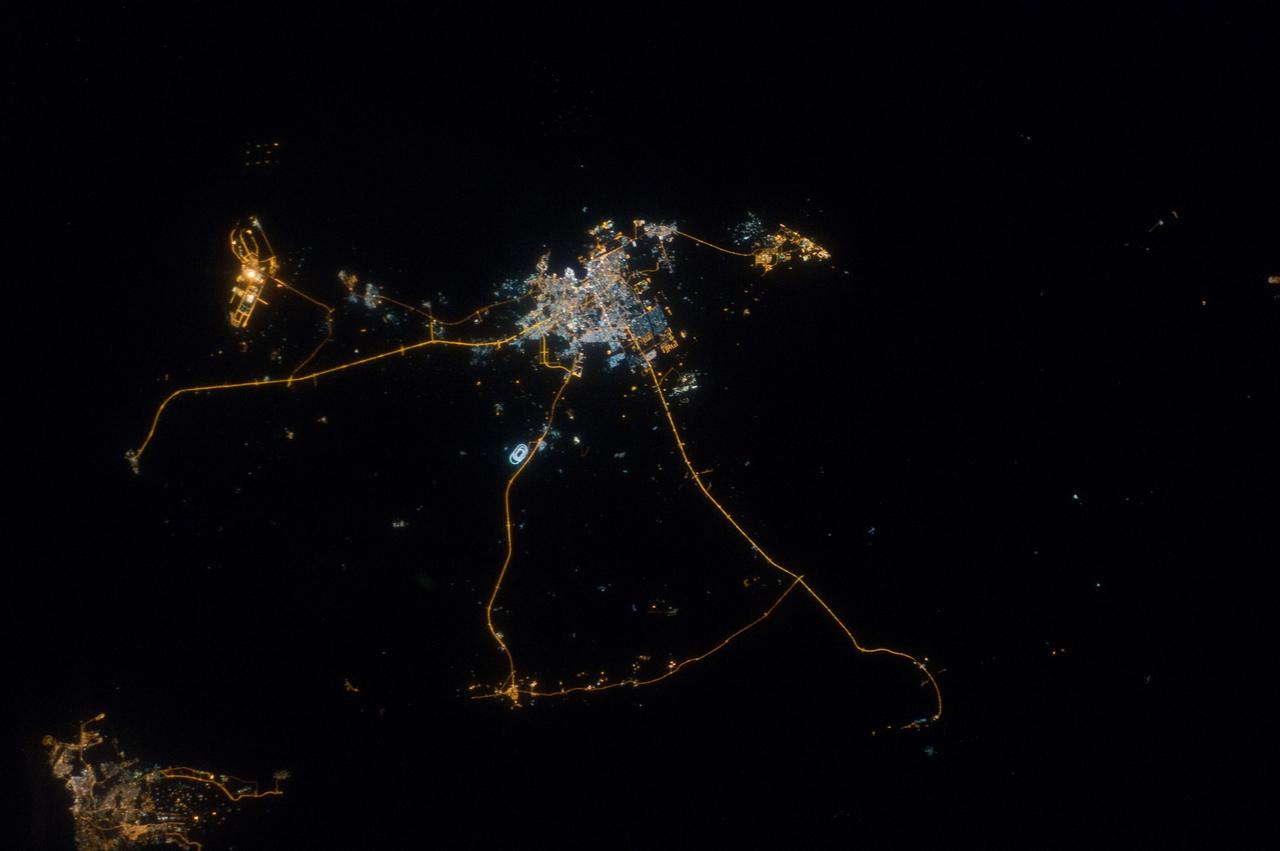
ISS033-E-014856 (13 Oct. 2012) --- A nighttime view of Qatar is featured in this image photographed by an Expedition 33 crew member on the International Space Station. Night lights can be very revealing regarding the distribution of people on the landscape. Here the lights of Qatar show the precise demographic geography of the country. The brightest group at center shows the capital city Doha with the neighboring smaller ports of Ad-Dahira and Umm Sa?id to the north and south, respectively. Even highways and their relative importance can be discerned. Highways are clearly visible leading from the capital west to the Dukhan oil fields, to Saudi Arabia, and to the north of the country--where, judging by the lack of night lights, the population is very low. The relatively low-traffic coast road between the oil fields and the Saudi frontier also stands out. This kind of highly informative human geographic detail is very difficult to discern in daylight images, in which even larger cities, especially in deserts, are hard to see. Almost the entire island nation of Bahrain appears at lower left, with its capital city Manama nearly as bright as the lights of Doha. The difference in light intensity reflects a difference in population?Doha has 1.45 million inhabitants, while the very dense Manama metro area has a population of 1.2 million. While some night views are highly informative about a landscape, they can also be difficult and confusing to identify. Astronauts learn to recognize where they are at night by flying over populated places repeatedly, even though coastlines?one of their best geographic indicators?are generally lost to view because water surfaces and unpopulated land surfaces look the same without illumination (such as from a full moon). Thus the thumb-shaped Qatari peninsula, so well-known in Middle Eastern geography, cannot be discerned at all in this night image. The inset at top right overlays the coastline as seen in daylight onto the night patterns of the image. It shows the Qatari peninsula, with the long arm of the Gulf of Bahrain separating it from Saudi Arabia.

NASA's Earth Surface Mineral Dust Source Investigation (EMIT) detected a cluster of 12 methane plumes on Sept. 1, 2022, in an approximately 150-square-mile (400-square-kilometer) region of southern Uzbekistan. Methane is a potent greenhouse gas about 80 times more effective at trapping heat than carbon dioxide during the time methane spends in the atmosphere, which is typically about a decade. This an area no NASA airborne imaging spectrometers have covered. Whereas EMIT captured the scene in an instant, an airborne campaign might have taken about 65 hours of flight time to cover the same amount of land. The blue shading covers the area captured by EMIT in one "scene," which is 50 miles by 50 miles (80 kilometers by 80 kilometers). The emissions total about 49,734 pounds (22,559 kilograms) per hour. EMIT uses an imaging spectrometer to detect the unique pattern of reflected and absorbed light – called a spectral fingerprint – from various materials on Earth's surface and in its atmosphere. Perched on the International Space Station, EMIT was originally intended to map the prevalence of minerals in Earth's arid regions, such as the deserts of Africa and Australia. Scientists verified that EMIT could also detect methane and carbon dioxide when they were checking the accuracy of the image spectrometer's mineral data. EMIT was selected from the Earth Venture Instrument-4 solicitation under the Earth Science Division of NASA Science Mission Directorate and was developed at NASA's Jet Propulsion Laboratory, which is managed for the agency by Caltech in Pasadena, California. It launched aboard a SpaceX Dragon resupply spacecraft from NASA's Kennedy Space Center in Florida on July 14, 2022. The instrument's data will be delivered to the NASA Land Processes Distributed Active Archive Center (DAAC) for use by other researchers and the public. https://photojournal.jpl.nasa.gov/catalog/PIA26113
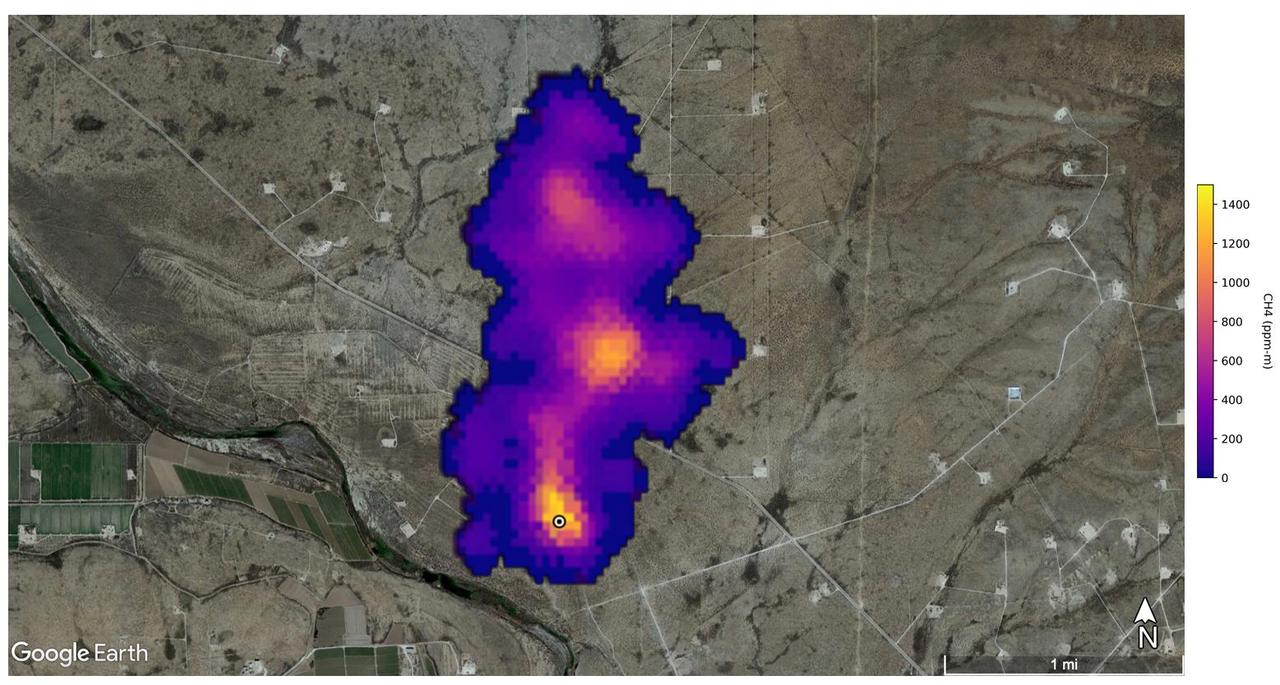
A plume of methane – a potent greenhouse gas about 80 times more effective at trapping heat in the atmosphere than carbon dioxide – is detected flowing from an area southeast of Carlsbad, New Mexico, in an image that uses data from NASA's Earth Surface Mineral Dust Source Investigation (EMIT) mission. The 2-mile (3.3-kilometer) long plume originates in an area known as the Permian Basin, which spans parts of southeastern New Mexico and western Texas and is one of the largest oilfields in the world. EMIT uses an imaging spectrometer to detect the unique pattern of reflected and absorbed light – called a spectral fingerprint – from various materials on Earth's surface and in its atmosphere. Perched on the International Space Station, EMIT was originally intended to map the prevalence of minerals in Earth's arid regions, such as the deserts of Africa and Australia. Scientists verified that EMIT could also detect methane and carbon dioxide when they were checking the accuracy of the image spectrometer's mineral data. The data for these images was collected by EMIT in August 2022. Scientists estimate flow rates of 20.2 tons (18.3 metric tons) per hour at the Permian site, 55.6 tons (50.4 metric tons) per hour in total for the Turkmenistan sources, and 9.4 tons (8.5 metric tons) per hour at the Iran site. While quite large, these emission rates are broadly consistent with previous studies of locations like the Permian Basin, as well as emission source types like landfills. The Turkmenistan example has a similar magnitude to the 2015 Aliso Canyon Blowout. https://photojournal.jpl.nasa.gov/catalog/PIA25592
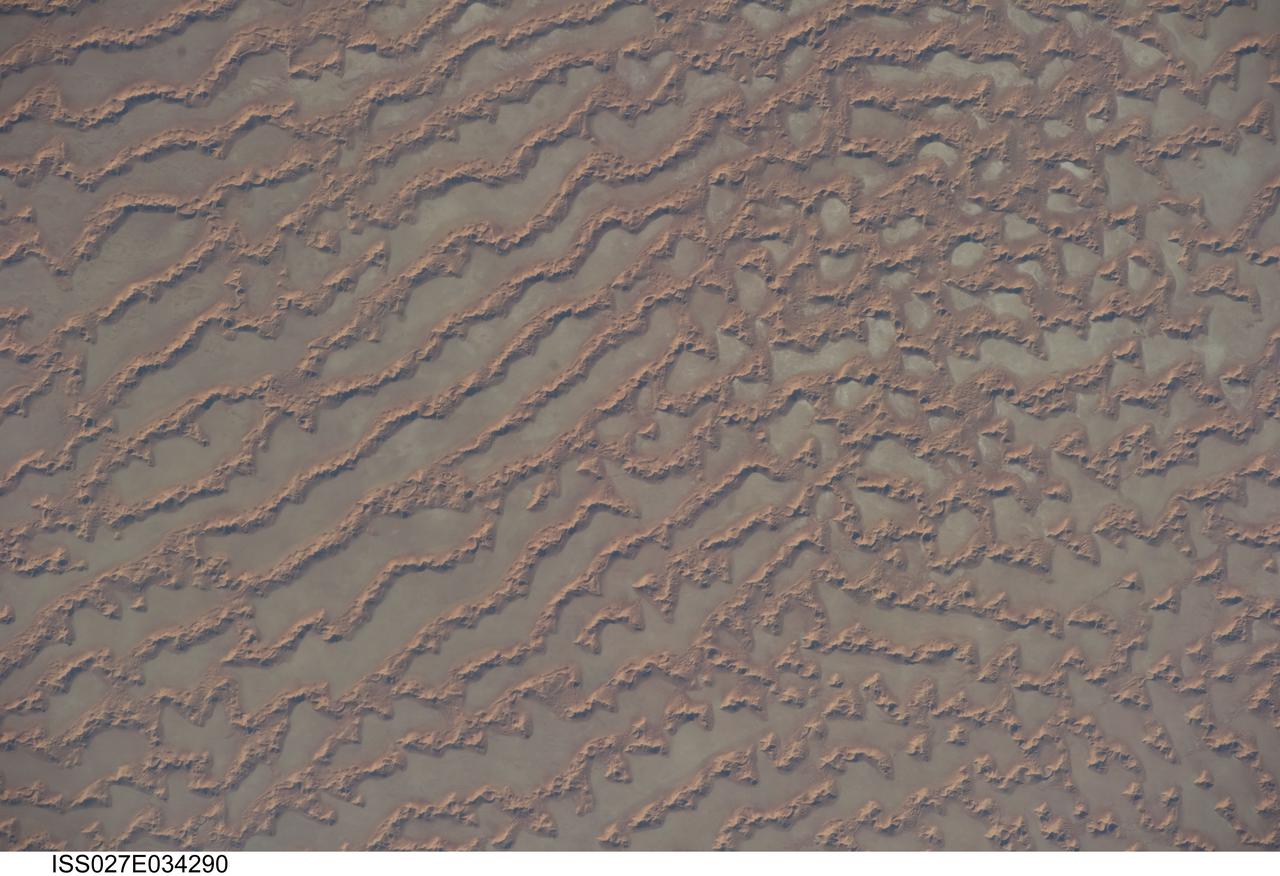
ISS027-E-034290 (16 May 2011) --- Ar Rub al Khali Sand Sea, Arabian Peninsula is featured in this image photographed by an Expedition 27 crew member on the International Space Station. The Ar Rub al Khali, also known as the “Empty Quarter”, is a large region of sand dunes and interdune flats known as a sand sea (or erg). This photograph highlights a part of the Ar Rub al Khali located close to its southeastern margin in the Sultanate of Oman. Reddish-brown, large linear sand dunes alternate with blue-gray interdune salt flats known as sabkhas at left. The major trend of the linear dunes is transverse to northwesterly trade winds that originate in Iraq (known as the Shamal winds). Formation of secondary barchan (crescent-shaped) and star dunes (dune crests in several directions originating from a single point, looking somewhat like a starfish from above) on the linear dunes is supported by southwesterly winds that occur during the monsoon season (Kharif winds). The long linear dunes begin to break up into isolated large star dunes to the northeast and east (right). This is likely a result of both wind pattern interactions and changes in the sand supply to the dunes. The Empty Quarter covers much of the south-central portion of the Arabian Peninsula, and with an area of approximately 660,000 square kilometers it is the largest continuous sand desert on Earth. The Empty Quarter is so called as the dominantly hyperarid climate and difficulty of travel through the dunes has not encouraged permanent settlement within the region. There is geological and archeological evidence to support cooler and wetter past climates in the region together with human settlement. This evidence includes exposed lakebed sediments, scattered stone tools, and the fossils of hippopotamus, water buffalo, and long-horned cattle.

ISS031-E-030783 (11 May 2012) --- Linear dunes in the Great Sand Sea in southwest Egypt are featured in this image photographed by an Expedition 31 crew member on the International Space Station. In southwestern Egypt, deep in the Sahara Desert, the action of wind dominates landscapes today much as it has done for the past several thousand years. Winds blowing from the north have fashioned sands into large dunes, aligned parallel with these winds. The so-called linear dunes?shown here in the Great Sand Sea?are easily seen from space and local maps show that they rise 20?30 meters above the surrounding flat plains. The distance between individual linear dunes is interestingly regular, at 1.5?2.5 kilometers, suggesting some equilibrium exists between the formative wind strength and the sand supply. It is possible that linear dunes may relate to earlier times when winds were stronger than they are today, or sand more plentiful. The dark patch of rock outcrop at upper right sticks up above the surface on which the dunes lie by as much as 150 meters. The north winds have been deflected around this high zone, and smaller secondary linear dunes can be seen along the right side of the image, aligned with local winds that become ever more northeasterly with nearness to the outcrops. A dune-free zone on the protected downwind (south-southeast) side of the outcrop gives a sense of the sand movement (generally from the bottom of the image towards the top). At first glance, the large linear dunes appear to be the major landform in the image; however a complex pattern of even smaller dunes can be seen perched on top of the largest dunes (inset). The sand that comprises many dune fields usually, according to scientists, derives from some larger river not very distant upwind, supplied from the dry river bed (exposed to the wind during dry seasons of low river flow, or regional change to a more arid climate). Inland dune fields thus lie downwind of the source river. A large, unnamed river once flowed to the Mediterranean Sea situated west of the dunes shown in this picture, dumping its sand load 300 kilometers northwest of the area shown. It is likely that this river, the evidence of which is now almost completely obliterated, was the source of the sand in the linear dunes, the scientists say.
![On June 26, 2016, the Moderate Resolution Imaging Spectroradiometer (MODIS) on NASA’s Terra satellite acquired this natural-color image of cloud gravity waves off the coast of Angola and Namibia. “I [regularly] look at this area on Worldview because you quite often have these gravity waves,” said Bastiaan Van Diedenhoven, a researcher for Columbia University and NASA's Goddard Institute for Space Studies interested in cloud formations. “On this day, there was so much going on—so many different waves from different directions—that they really started interfering.” A distinctive criss-cross pattern formed in unbroken stretches hundreds of kilometers long. Similar to a boat’s wake, which forms as the water is pushed upward by the boat and pulled downward again by gravity, these clouds are formed by the rise and fall of colliding air columns. Off of west Africa, dry air coming off the Namib desert—after being cooled by the night—moves out under the balmy, moist air over the ocean and bumps it upwards. As the humid air rises to a higher altitude, the moisture condenses into droplets, forming clouds. Gravity rolls these newly formed clouds into a wave-like shape. When moist air goes up, it cools, and then gravity pushes it down again. As it plummets toward the earth, the moist air is pushed up again by the dry air. Repeated again and again, this process creates gravity waves. Clouds occur at the upward wave motions, while they evaporate at the downward motions. Such waves will often propagate in the morning and early afternoon, said Van Diedenhoven. During the course of the day, the clouds move out to sea and stretch out, as the dry air flowing off the land pushes the moist ocean air westward. NASA Earth Observatory image by Jesse Allen, using data from the Land Atmosphere Near real-time Capability for EOS (LANCE). via @NASAEarth <a href="http://go.nasa.gov/29Btxcy" rel="nofollow">go.nasa.gov/29Btxcy</a> <b><a href="http://go.nasa.gov/29BtHR6" rel="nofollow">NASA image use policy.</a></b> <b><a href="http://go.nasa.gov/29BtDku" rel="nofollow">NASA Goddard Space Flight Center</a></b> enables NASA’s mission through four scientific endeavors: Earth Science, Heliophysics, Solar System Exploration, and Astrophysics. Goddard plays a leading role in NASA’s accomplishments by contributing compelling scientific knowledge to advance the Agency’s mission. <b>Follow us on <a href="http://go.nasa.gov/29BtVrn" rel="nofollow">Twitter</a></b> <b>Like us on <a href="http://go.nasa.gov/29BtygK" rel="nofollow">Facebook</a></b> <b>Find us on <a href="http://go.nasa.gov/29Bu0vu" rel="nofollow">Instagram</a></b>](https://images-assets.nasa.gov/image/GSFC_20171208_Archive_e000269/GSFC_20171208_Archive_e000269~medium.jpg)
On June 26, 2016, the Moderate Resolution Imaging Spectroradiometer (MODIS) on NASA’s Terra satellite acquired this natural-color image of cloud gravity waves off the coast of Angola and Namibia. “I [regularly] look at this area on Worldview because you quite often have these gravity waves,” said Bastiaan Van Diedenhoven, a researcher for Columbia University and NASA's Goddard Institute for Space Studies interested in cloud formations. “On this day, there was so much going on—so many different waves from different directions—that they really started interfering.” A distinctive criss-cross pattern formed in unbroken stretches hundreds of kilometers long. Similar to a boat’s wake, which forms as the water is pushed upward by the boat and pulled downward again by gravity, these clouds are formed by the rise and fall of colliding air columns. Off of west Africa, dry air coming off the Namib desert—after being cooled by the night—moves out under the balmy, moist air over the ocean and bumps it upwards. As the humid air rises to a higher altitude, the moisture condenses into droplets, forming clouds. Gravity rolls these newly formed clouds into a wave-like shape. When moist air goes up, it cools, and then gravity pushes it down again. As it plummets toward the earth, the moist air is pushed up again by the dry air. Repeated again and again, this process creates gravity waves. Clouds occur at the upward wave motions, while they evaporate at the downward motions. Such waves will often propagate in the morning and early afternoon, said Van Diedenhoven. During the course of the day, the clouds move out to sea and stretch out, as the dry air flowing off the land pushes the moist ocean air westward. NASA Earth Observatory image by Jesse Allen, using data from the Land Atmosphere Near real-time Capability for EOS (LANCE). via @NASAEarth <a href="http://go.nasa.gov/29Btxcy" rel="nofollow">go.nasa.gov/29Btxcy</a> <b><a href="http://go.nasa.gov/29BtHR6" rel="nofollow">NASA image use policy.</a></b> <b><a href="http://go.nasa.gov/29BtDku" rel="nofollow">NASA Goddard Space Flight Center</a></b> enables NASA’s mission through four scientific endeavors: Earth Science, Heliophysics, Solar System Exploration, and Astrophysics. Goddard plays a leading role in NASA’s accomplishments by contributing compelling scientific knowledge to advance the Agency’s mission. <b>Follow us on <a href="http://go.nasa.gov/29BtVrn" rel="nofollow">Twitter</a></b> <b>Like us on <a href="http://go.nasa.gov/29BtygK" rel="nofollow">Facebook</a></b> <b>Find us on <a href="http://go.nasa.gov/29Bu0vu" rel="nofollow">Instagram</a></b>

NASA's Lunar Reconnaissance Orbiter (LRO) recently captured a unique view of Earth from the spacecraft's vantage point in orbit around the moon. "The image is simply stunning," said Noah Petro, Deputy Project Scientist for LRO at NASA's Goddard Space Flight Center in Greenbelt, Maryland. "The image of the Earth evokes the famous 'Blue Marble' image taken by Astronaut Harrison Schmitt during Apollo 17, 43 years ago, which also showed Africa prominently in the picture." In this composite image we see Earth appear to rise over the lunar horizon from the viewpoint of the spacecraft, with the center of the Earth just off the coast of Liberia (at 4.04 degrees North, 12.44 degrees West). The large tan area in the upper right is the Sahara Desert, and just beyond is Saudi Arabia. The Atlantic and Pacific coasts of South America are visible to the left. On the moon, we get a glimpse of the crater Compton, which is located just beyond the eastern limb of the moon, on the lunar farside. LRO was launched on June 18, 2009, and has collected a treasure trove of data with its seven powerful instruments, making an invaluable contribution to our knowledge about the moon. LRO experiences 12 earthrises every day; however the spacecraft is almost always busy imaging the lunar surface so only rarely does an opportunity arise such that its camera instrument can capture a view of Earth. Occasionally LRO points off into space to acquire observations of the extremely thin lunar atmosphere and perform instrument calibration measurements. During these movements sometimes Earth (and other planets) pass through the camera's field of view and dramatic images such as the one shown here are acquired. This image was composed from a series of images taken Oct. 12, when LRO was about 83 miles (134 kilometers) above the moon's farside crater Compton. Capturing an image of the Earth and moon with LRO's Lunar Reconnaissance Orbiter Camera (LROC) instrument is a complicated task. First the spacecraft must be rolled to the side (in this case 67 degrees), then the spacecraft slews with the direction of travel to maximize the width of the lunar horizon in LROC's Narrow Angle Camera image. All this takes place while LRO is traveling faster than 3,580 miles per hour (over 1,600 meters per second) relative to the lunar surface below the spacecraft! The high-resolution Narrow Angle Camera (NAC) on LRO takes black-and-white images, while the lower resolution Wide Angle Camera (WAC) takes color images, so you might wonder how we got a high-resolution picture of the Earth in color. Since the spacecraft, Earth, and moon are all in motion, we had to do some special processing to create an image that represents the view of the Earth and moon at one particular time. The final Earth image contains both WAC and NAC information. WAC provides the color, and the NAC provides high-resolution detail. "From the Earth, the daily moonrise and moonset are always inspiring moments," said Mark Robinson of Arizona State University in Tempe, principal investigator for LROC. "However, lunar astronauts will see something very different: viewed from the lunar surface, the Earth never rises or sets. Since the moon is tidally locked, Earth is always in the same spot above the horizon, varying only a small amount with the slight wobble of the moon. The Earth may not move across the 'sky', but the view is not static. Future astronauts will see the continents rotate in and out of view and the ever-changing pattern of clouds will always catch one's eye, at least on the nearside. The Earth is never visible from the farside; imagine a sky with no Earth or moon - what will farside explorers think with no Earth overhead?" NASA's first Earthrise image was taken with the Lunar Orbiter 1 spacecraft in 1966. Perhaps NASA's most iconic Earthrise photo was taken by the crew of the Apollo 8 mission as the spacecraft entered lunar orbit on Christmas Eve Dec. 24, 1968. That evening, the astronauts -- Commander Frank Borman, Command Module Pilot Jim Lovell, and Lunar Module Pilot William Anders -- held a live broadcast from lunar orbit, in which they showed pictures of the Earth and moon as seen from their spacecraft. Said Lovell, "The vast loneliness is awe-inspiring and it makes you realize just what you have back there on Earth." Credit: NASA/Goddard/Arizona State University <b><a href="http://www.nasa.gov/audience/formedia/features/MP_Photo_Guidelines.html" rel="nofollow">NASA image use policy.</a></b> <b><a href="http://www.nasa.gov/centers/goddard/home/index.html" rel="nofollow">NASA Goddard Space Flight Center</a></b> enables NASA’s mission through four scientific endeavors: Earth Science, Heliophysics, Solar System Exploration, and Astrophysics. Goddard plays a leading role in NASA’s accomplishments by contributing compelling scientific knowledge to advance the Agency’s mission. <b>Follow us on <a href="http://twitter.com/NASAGoddardPix" rel="nofollow">Twitter</a></b> <b>Like us on <a href="http://www.facebook.com/pages/Greenbelt-MD/NASA-Goddard/395013845897?ref=tsd" rel="nofollow">Facebook</a></b> <b>Find us on <a href="http://instagrid.me/nasagoddard/?vm=grid" rel="nofollow">Instagram</a></b>