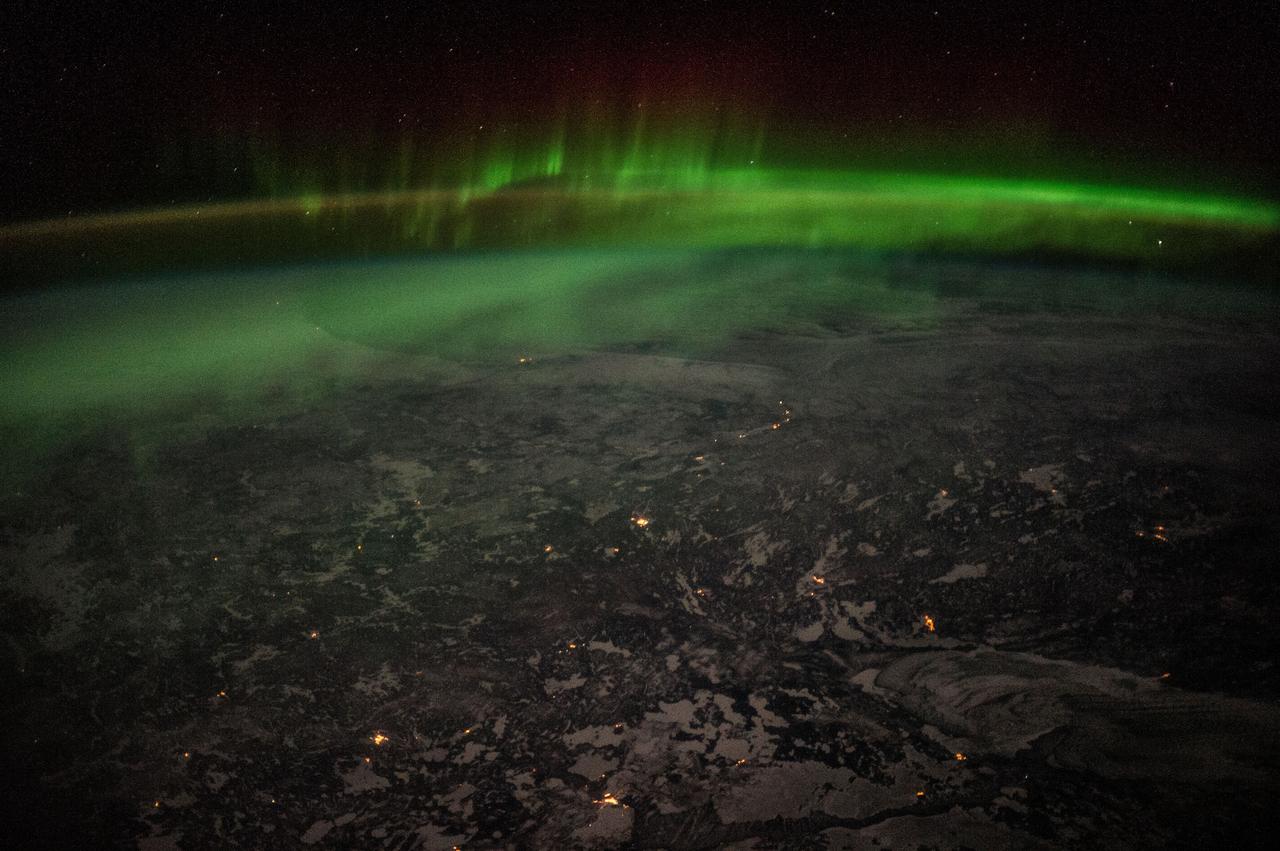
Earth observations taken by Expedition 38 crewmember. Aurora over Canada is visible. Image was released by astronaut on Twitter.
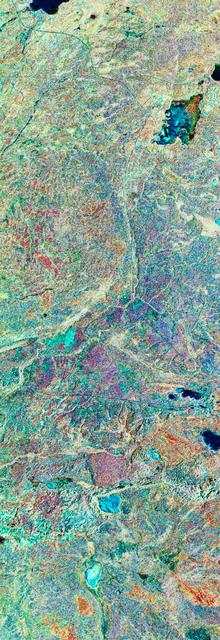
STS059-S-079 (18 April 1994) --- This is a false-color, three frequency image of Prince Albert, Canada, centered at 53.91 north latitude and 104.69 west longitude. It was produced using data from the X-Band, C-Band and L-Band radars that comprise the Spaceborne Imaging Radar-C and X-Band Synthetic Aperture Radar (SIR-C/X-SAR). SIR-C/X-SAR acquired this image on the 20th orbit of the Space Shuttle Endeavour. The area is located 40 kilometers north and 30 kilometers east of the town of Prince Albert in the Saskatchewan province of Canada. The image covers the area east of the Candle Lake, between gravel surface Highways 120 and 106 and west of 106. The area in the middle of the image covers the entire Nipawin (Narrow Hills) provincial park. The look angle of the radar is 30 degrees and the size of the image is approximately 20 by 50 kilometers. The red, green, and blue colors represent L-Band total power, C-Band total power, and XVV respectively. The changes in the intensity of each color are related to various surface conditions such as frozen or thawed forest, fire, deforestation and areas of regrowth. Most of the dark blue areas in the image are the ice covered lakes. The dark area on the top right corner of the image is the White Gull Lake north of the intersection of Highway 120 and 913. The right middle part of the image shows Lake Ispuchaw and Lower Fishing Lake. The deforested areas are shown by light blue in the image. Since most of the logging practice at the Prince Albert area is around the major highways, the deforested areas can be easily detected as small geometrically shaped dark regions along the roads. At the time these data were taken, a major part of the forest was either frozen or undergoing the spring thaw. In such conditions, due to low volume of water in the vegetation, a deeper layer of the canopy is imaged by the radar, revealing valuable information about the type of trees, the amount of vegetation biomass and the condition of the surface. As the frequency increases, the penetration depth in the canopy decreases. Over forest canopies, the X-Band radar contains information about the top of the canopy. Whereas, C-Band and L-Band radar returns show contributions from the crown and trunk areas respectively. The bright areas in the image are dense mixed aspen and old jackpine forests where the return from all three bands is high. The reddish area corresponds to more sparse old jack pine (12 to 17 meters in height and 60 to 75 years old) where the L-Band signal penetrates deeper in the canopy and dominates C-Band and X-Band returns. Comparison of the image with the forest cover map of the area indicates that the three band radar can be used to classify various stands. SIR-C/X-SAR is part of NASA's Mission to Planet Earth (MTPE). SIR-C/X-SAR radars illuminate Earth with microwaves allowing detailed observations at any time, regardless of weather or sunlight conditions. SIR-C/X-SAR uses three microwave wavelengths: L-Band (24 cm), C-Band (6 cm), and X-Band (3 cm). The multi-frequency data will be used by the international scientific community to better understand the global environment and how it is changing. The SIR-C/X-SAR data, complemented by aircraft and ground studies, will give scientists clearer insights into those environmental changes which are caused by nature and those changes which are induced by human activity. SIR-C was developed by NASA's Jet Propulsion Laboratory (JPL). X-SAR was developed by the Dornire and Alenia Spazio Companies for the German Space Agency, Deutsche Agentur fuer Raumfahrtangelegenheiten (DARA), and the Italian Space Agency, Agenzia Spaziale Italiana (ASI). JPL Photo ID: P-43929

STS060-06-037 (3-11 Feb 1994) --- The city lights of Buffalo and Toronto outline the shores of the east end of Lake Erie and the west end of Lake Ontario in this night scene of western New York and southern Ontario. Between the two major cities are the cities of Niagara Falls, New York and Niagara Falls, Canada, which straddle the Niagara River just north of the actual falls. This photograph was taken with a special ASA-1600 film that is normally used for night-time photography of aurora, noctilucent clouds, biomass burning, and city lights.
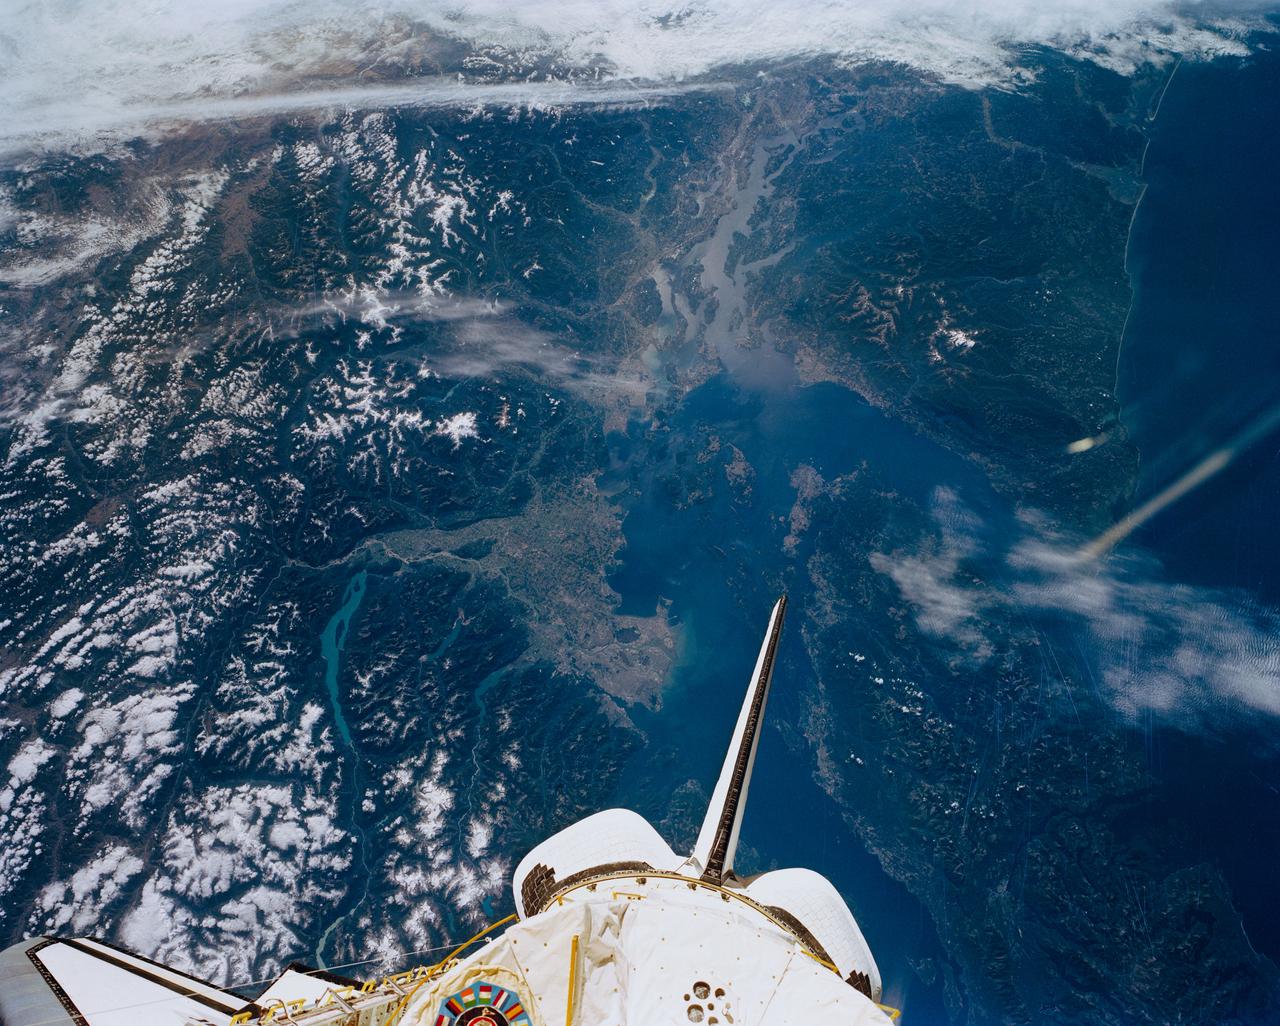
STS047-151-488 (12 - 20 Sept 1992) --- In this large format camera image, the forested Cascade Range appears along the left side; the Pacific Ocean, on the right. The frame was photographed as the Space Shuttle Endeavour flew north to south over Vancouver and Seattle. Many peaks in the Cascades reach altitudes greater than 9,000 feet and remain snowcapped even in mid-summer. The Strait of Juan de Fuca separates the Olympic Peninsula (top right) from Vancouver Island (bottom right). Snowcapped Mt. Olympus (7,965 feet) is one of the wettest places in the continental United States, with rainfall in excess of 120 inches per year. The port cities of Seattle and Tacoma occupy the heavily indented coastline of Puget Sound (top center). They appear as light-colored areas on the left side of the Sound. The angular street pattern of Tacoma is visible at the top of the picture. The international boundary between Canada and the United States of America runs across the middle of the view. The city of Victoria (center) is the light patch on the tip of Vancouver Island. Canada's Fraser River Delta provides flat topography on which the cities of Vancouver, Burnaby, and New Westminster were built. These cities appear as the light-colored area just left of center. The Fraser River can be seen snaking its way out of the mountains at the apex of the delta. Numerous ski resorts dot the slopes of the mountains (bottom left) that rise immediately to the north of Vancouver. In the same area the blue water of Harrison and other, smaller lakes fills some of the valleys that were excavated by glaciers in the "recent" geological past, according to NASA scientists studying the photography. A Linhof camera was used to expose the frame.
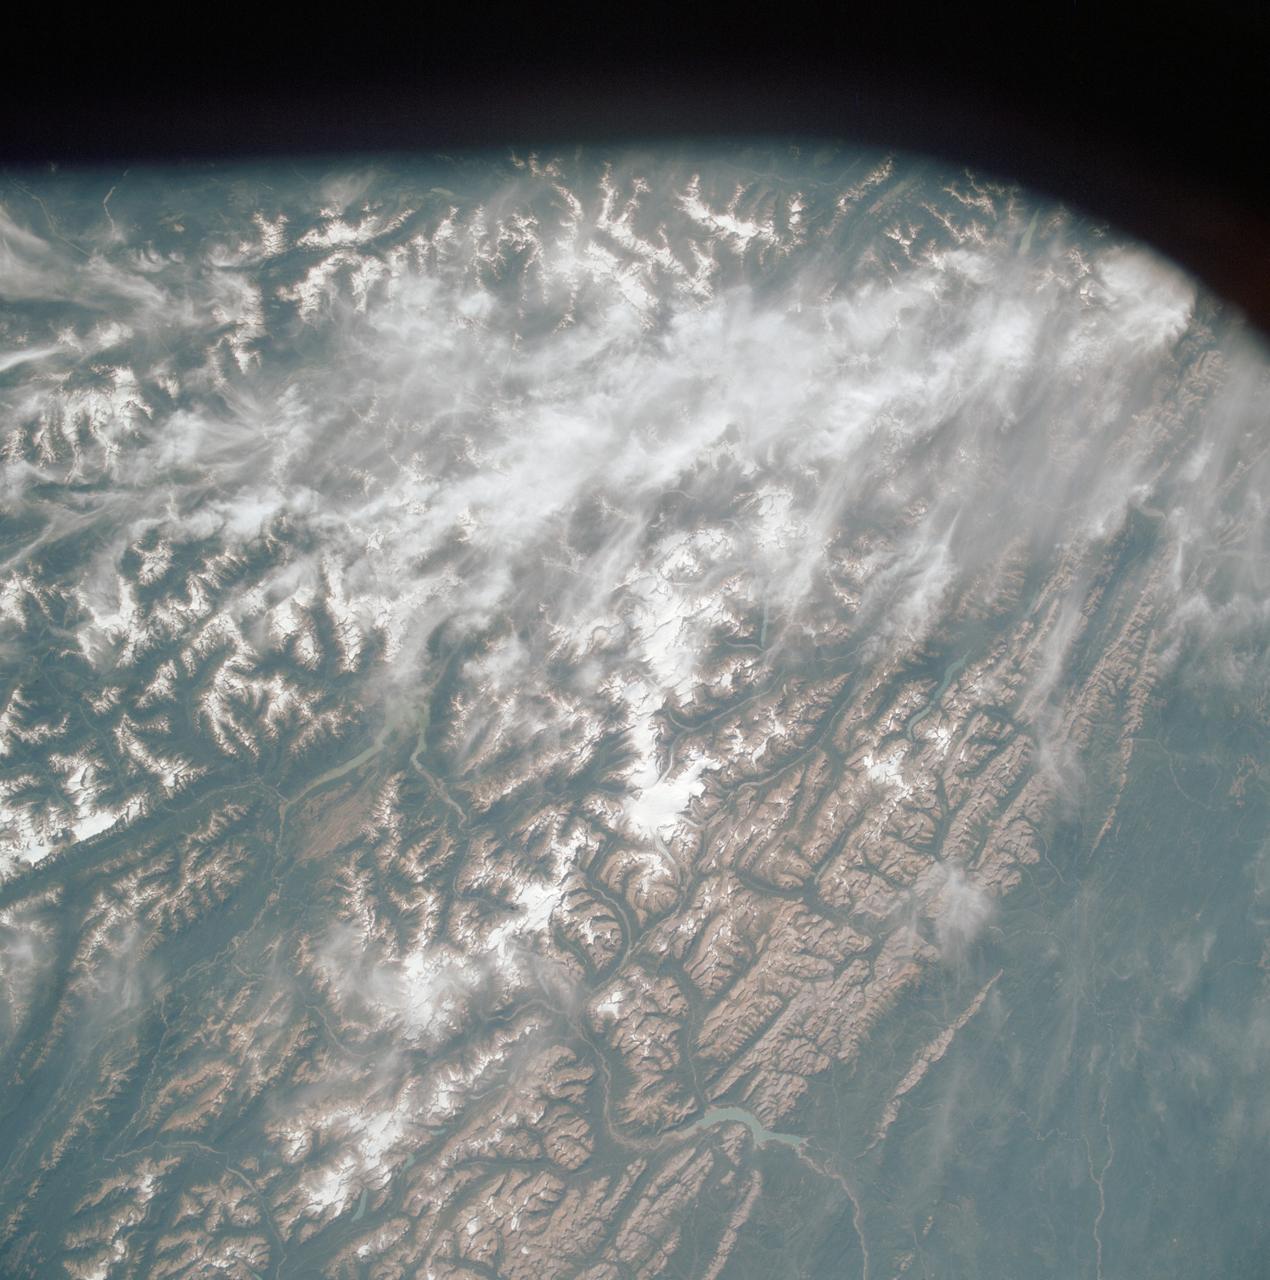
AST-19-1570 (24 July 1975) --- An oblique view of the Rocky Mountains area of British Columbia and Alberta in Canada, as photographed from the Apollo spacecraft in Earth orbit during the joint U.S.-USSR Apollo-Soyuz Test Project mission. This picture was taken at an altitude of 222 kilometers (138 statute miles) with a 70mm Hasselblad camera using medium-speed Ektachrome QX-807 type film.
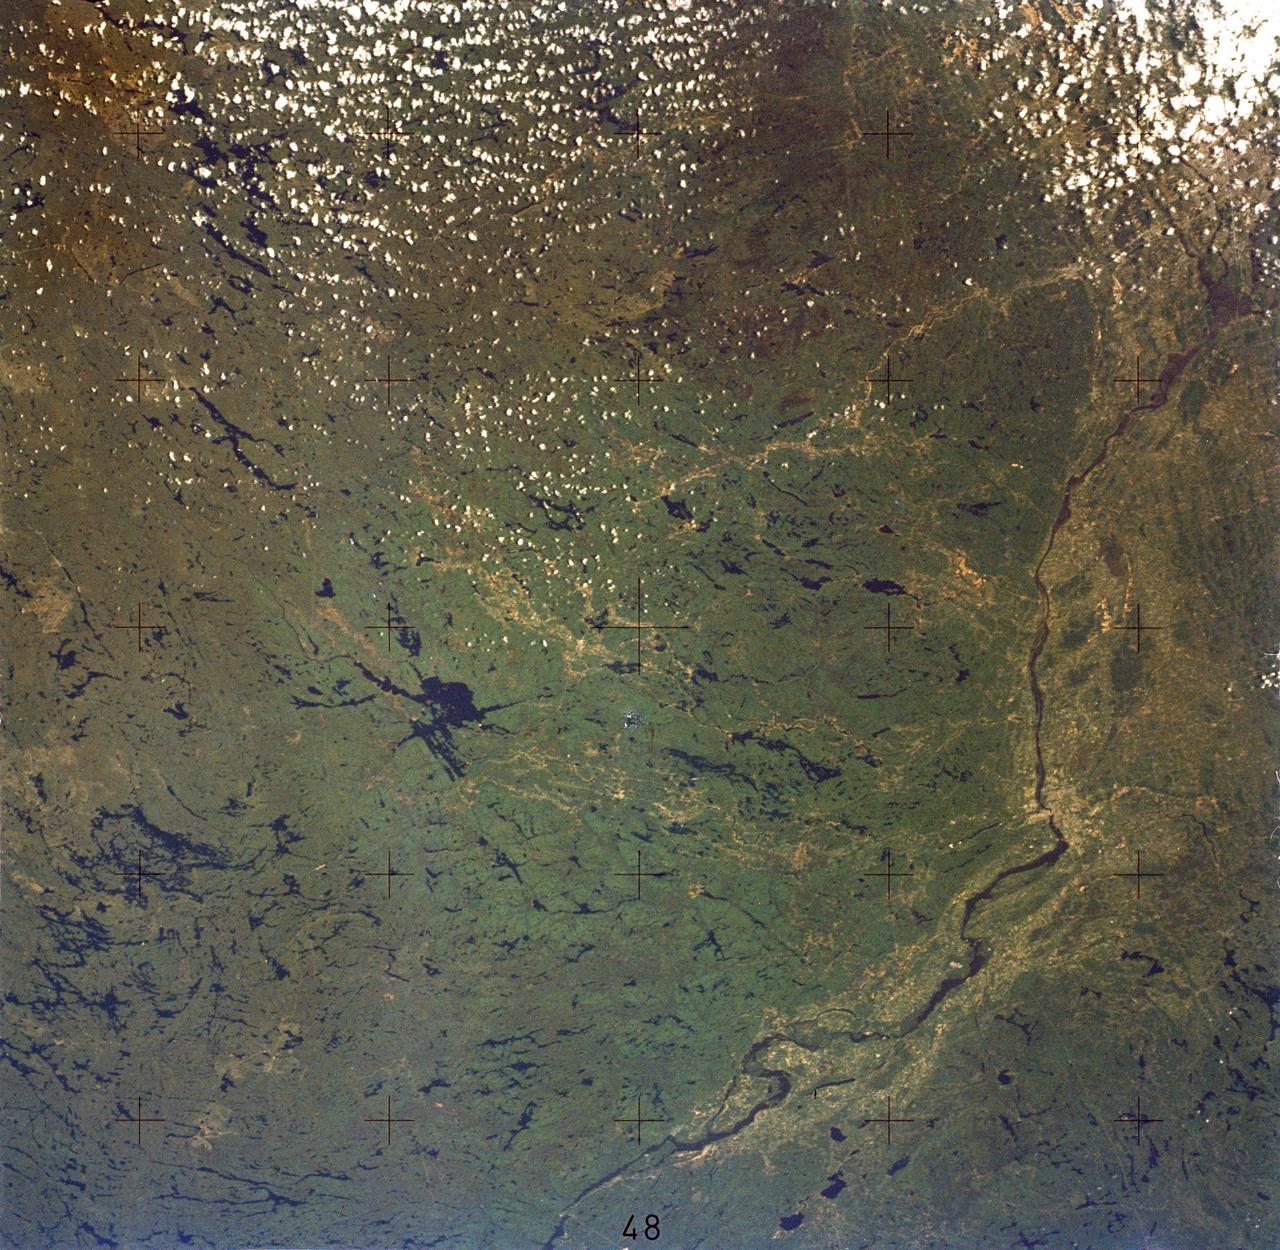
SL2-05-380 (22 June 1973) --- Ottawa, in the province of Ontario, (46.5N, 75.5W) is the capital of Canada and can be seen near the bottom of this scene on the Ottawa River. The region shown lies within the Canadian Shield. The glaciated surface of the land is underlain by lower Precambrian granite and sedimentary rock. Long fractures within these crystalline rocks have, in places, been carved out by glacial action. The resultant depressions are often water filled bogs and lakes. Photo credit: NASA
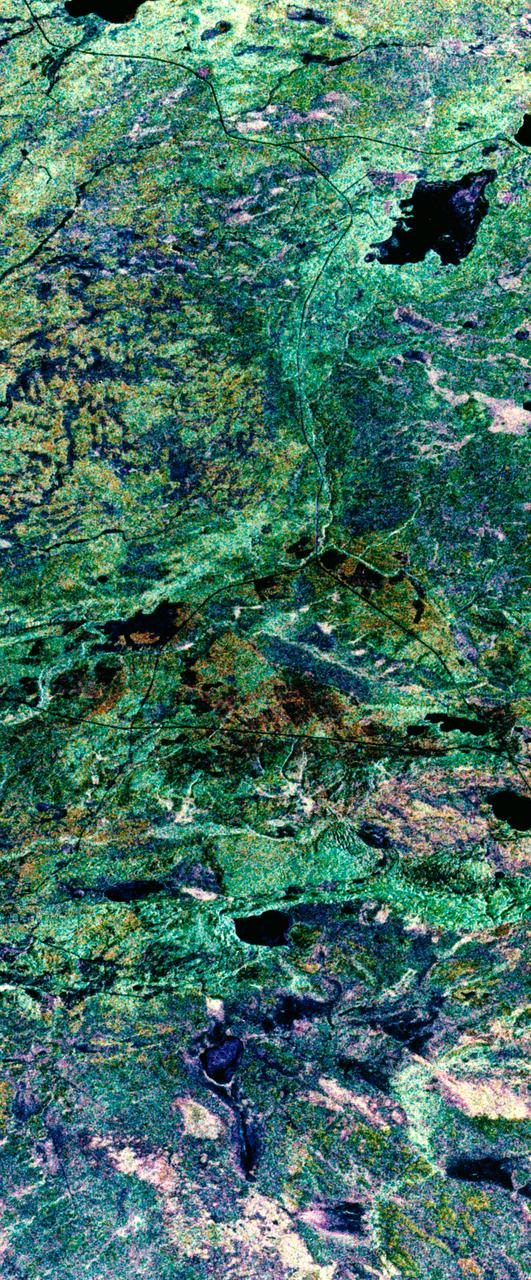
STS059-S-039 (11 April 1994) --- This is a false-color composite of Prince Albert, Canada, centered at 53.91 north latitude and 104.69 west longitude. This image was acquired by the Spaceborne Imaging Radar-C and X-Band Synthetic Aperture Radar (SIR-C/X-SAR) aboard the Space Shuttle Endeavour on its 20th orbit. The area is located 40 kilometers (25 miles) north and 30 kilometers (20 miles) east of the town of Prince Albert in the Saskatchewan province of Canada. The image covers the area east of the Candle Lake, between gravel surface Highways 120 and 106 and west of 106. The area in the middle of the image covers the entire Nipawin (Narrow Hills) provincial park. The look angle of the radar is 30 degrees and the size of the image is approximately 20 kilometers by 50 kilometers (12 by 30 miles). The image was produced by using only the L-Band. The three polarization channels HH, HV and VV are illustrated by red, green and blue respectively. The changes in the intensity of each color are related to various surface conditions such as variations in forest stands, frozen or thawed condition of the surface, disturbances (fire and deforestation), and areas of re-growth. Most of the dark areas in the image are the ice-covered lakes in the region. The dark area on the top right corner of the image is the White Gull Lake north of the intersection of Highway 120 and 913. The right middle part of the image shows Lake Ispuchaw and Lower Fishing Lake. The deforested areas are also shown by dark areas in the image. Since most of the logging practice at the Prince Albert area is around the major highways, the deforested areas can be easily detected as small geometrically shaped dark regions along the roads. At the time of the SIR-C/X-SAR overpass, a major part of the forest is either frozen or undergoing the spring thaw. The L-Band HH shows a high return in the jack pine forest. The reddish areas in the image are old jack pine forest, 12-17 meters (40-55 feet) in height and 60-75 years old. The orange-greenish areas are young jack pine trees, 3-5 meters (10-16 feet) in height and 11-16 years old. The green areas are due to the relative high intensity of the HV channel which is strongly correlated with the amount of biomass. L-Band HV channel shows the biomass variations over the entire region. Most of the green areas, when compared to the forest cover maps are identified as black spruce trees. The dark blue and dark purple colors show recently harvested or re-growth areas respectively. SIR-C/X-SAR is part of NASA's Mission to Planet Earth (MTPE). SIR-C/X-SAR radars illuminate Earth with microwaves allowing detailed observations at any time, regardless of weather or sunlight conditions. SIR-C/X-SAR uses three microwave wavelengths: L-Band (24 cm), C-Band (6 cm), and X-Band (3 cm). The multi-frequency data will be used by the international scientific community to better understand the global environment and how it is changing. The SIR-C/X-SAR data, complemented by aircraft and ground studies, will give scientists clearer insights into those environmental changes which are caused by nature and those changes which are induced by human activity. SIR-C was developed by NASA's Jet Propulsion Laboratory (JPL). X-SAR was developed by the Dornire and Alenia Spazio Companies for the German Space Agency, Deutsche Agentur fuer Raumfahrtangelegenheiten (DARA), and the Italian Space Agency, Agenzia Spaziale Italiana (ASI). JPL Photo ID: P-43886
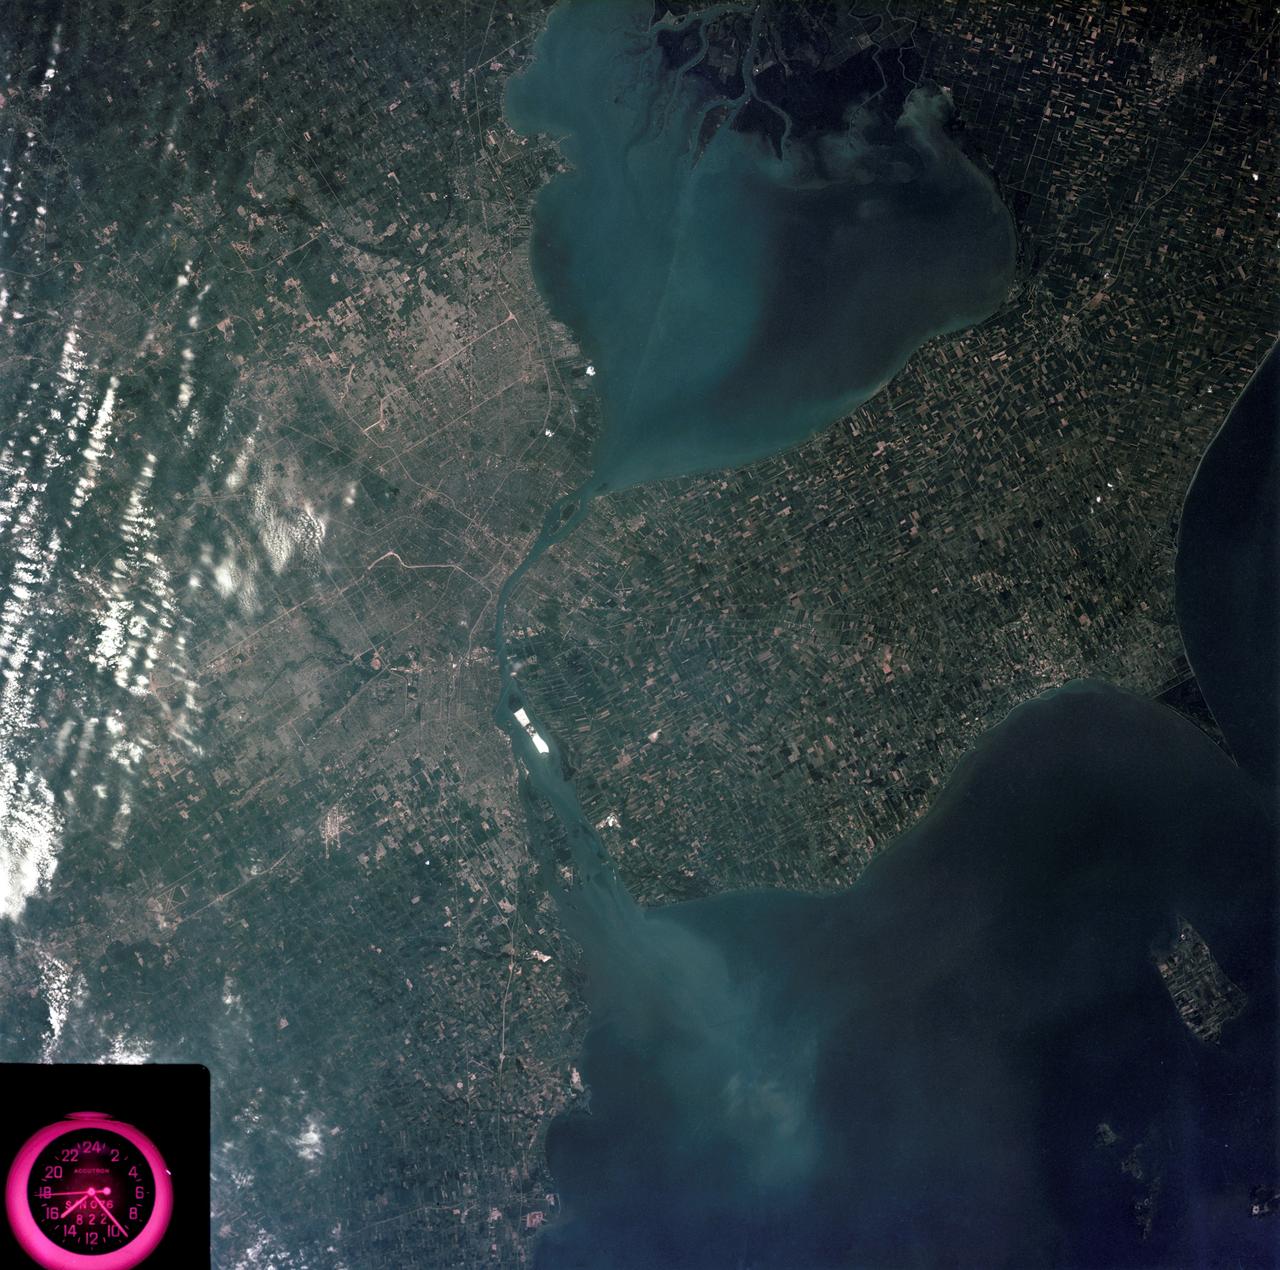
SL3-83-0152 (July-September 1973) --- A near vertical view of the metropolitan Detroit, Michigan area is seen in this Skylab 3 Earth Resources Experiments Package S190-B (five-inch Earth terrain camera) photograph taken from the Skylab space station in Earth orbit. The 25-mile long Detroit River drains the smaller body of water (Lake St. Clair) and flows southwestward separating Detroit from Windsor, Ontario, and empties into Lake Erie. The Detroit River handles a great deal of Great Lakes barge and ship traffic. Major streets and thoroughfares radiating from the city are clearly visible. Fighting Island is the highly reflective, white area located almost in the center of the picture. This high reflectivity is caused by the functional use of the island-disposal ponds for chemical salts. Sedimentation and/or pollution patterns in the area provide interesting visual phenomena for speculation and analysis. Distinct and rather unique cultivated field patterns can be observed south and east of Windsor, Ontario. This is a direct result of an English survey and land tenure system which was utilized when the area was settled. New areas of residential development are fairly easy to differentiate from older, established residential areas. Vegetation and extent of area coverage can be determined. The Oakland County Planning Commission and the Federal Bureau of Outdoor Recreation working closely with Irv Sattinger of the Environmental Research Institute of Michigan (University of Michigan) are presently processing and analyzing photographic and Multispectral scanner data to determine its usefulness for recreation and open space site studies for this area. Photo credit: NASA

jsc2023e030774 (3/30/2023) The ESSENCE team is pictured (left to right): Abel Beyene, Tasnima Huma Awal, Jack Wawrow, Mastafa Awal, Lovejivan Sidhu, Angela Huang, and George Zhu. The Educational Space Science and Engineering CubeSat Experiment Mission (Nanoracks-ESSENCE) investigation observes Arctic ice, permafrost thaw, and forest coverage in Northern Canada from Earth’s orbit after being deployed from the International Space Station. Image courtesy of Nanoracks LLC.
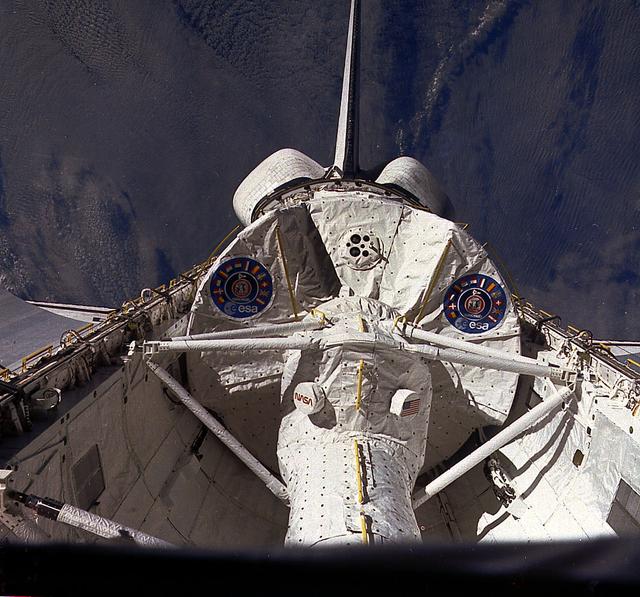
A Space Shuttle mission STS-9 onboard view show's Spacelab-1 (SL-1) module in orbiter Columbia's payload bay. Spacelab-1 was a cooperative venture of NASA and the European Space Agency. Scientists from eleven European nations plus Canada, Japan and the U.S. provided instruments and experimental procedures for over 70 different investigations in five research areas of disciplines: astronomy and solar physics, space plasma physics, atmospheric physics and Earth observations, life sciences and materials science.
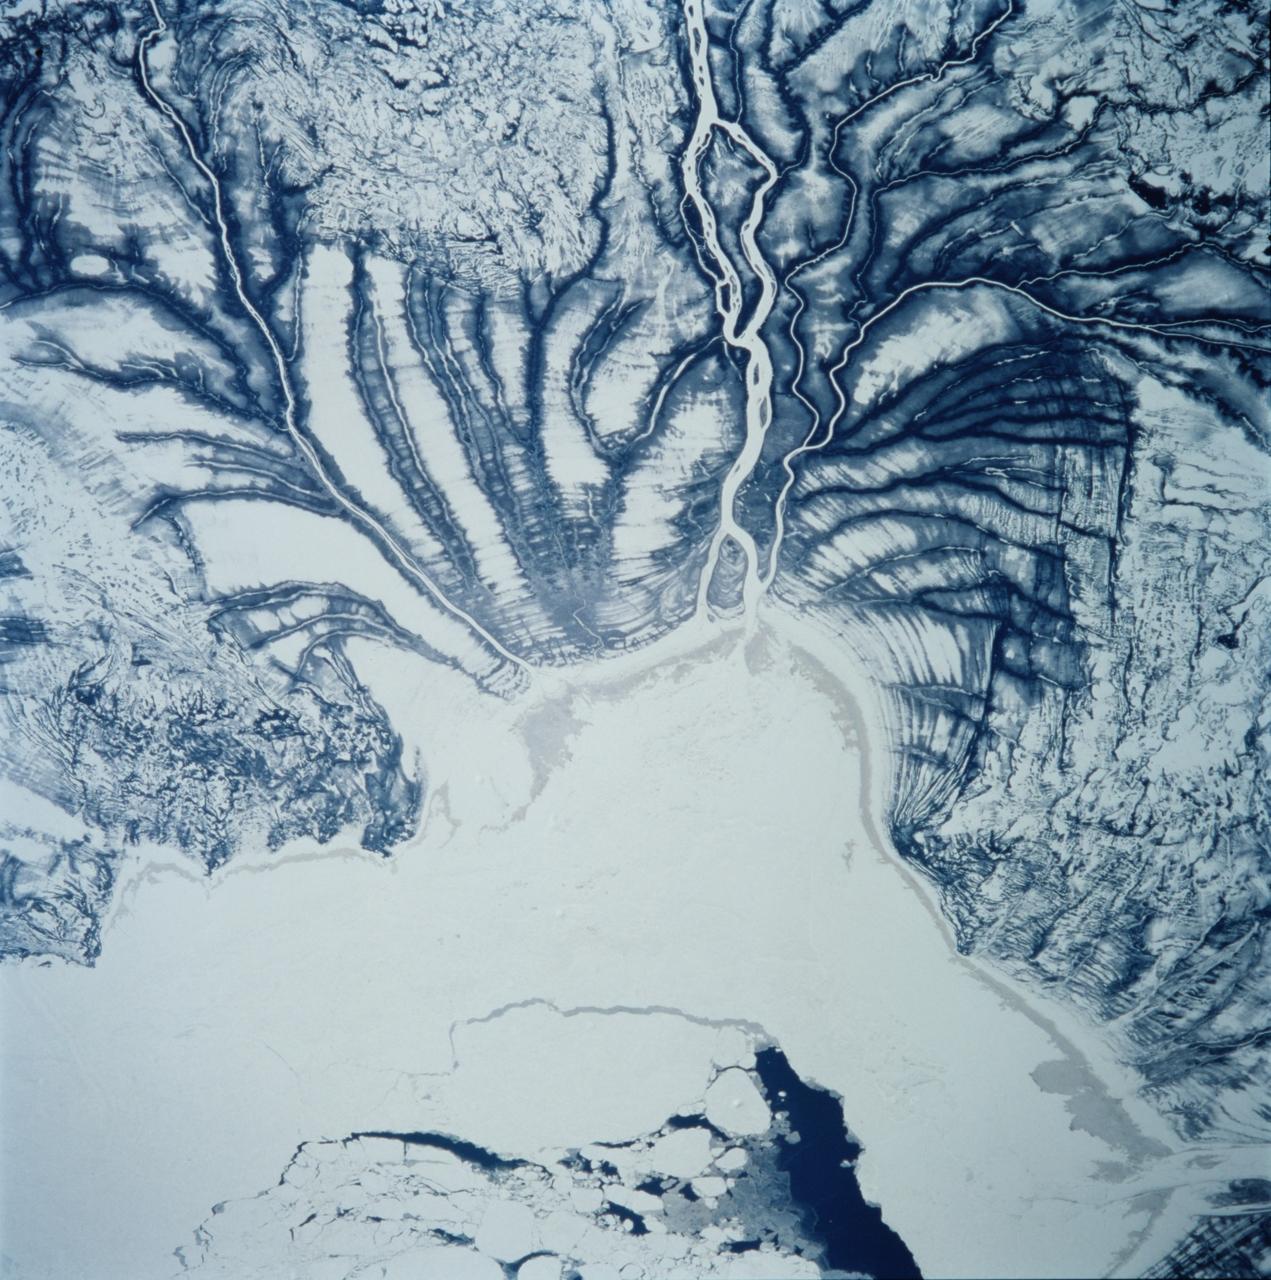
STS099-706-090 (11-22 February 2000) ---One of the astronauts aboard the Space Shuttle Endeavour for the STS-99 mission recorded this 70mm image of Hannah Bay, in the southern part of St. James Bay. The river is the Harricanaw River. Numerous shorelines around Hudson and St. James Bays are distinctive in winter because of snow cover. According to NASA scientists, shorelines were created when the overlying glaciers retreated and the land underneath rebounded causing the Hudson and St. James Bay waters to retreat northward. These ridges are 100 to 200 meters in width and heights can reach up to 7 meters. The land along St. James Bay consists mainly of tidal flats and salt marshes.

STS060-74-054 (3-11 Feb 1994) --- The Wake Shield Facility (WSF) is held in the grasp of Discovery's Remote Manipulator System (RMS). The 70mm image, backdropped against the blackness of space, also shows the SPACEHAB module in the forward cargo area.

VANDENBERG AFB, Calif. -- During a news conference at Vandenberg Air Force Base, Calif. prior to the launch of NASA's Landsat Data Continuity Mission, or LDCM, media representative heard from Rani Gran of NASA Public Affairs, Dr. Jim Irons, LDCM project scientist from NASA's Goddard Space Flight Center, Dr. Thomas Loveland, senior scientist and co-chair of the Landsat Science Team U.S. Geological Survey Earth Resources Observation and Science Center, Kass Green, Landsat scientist and president of Kass Green and Associates, and Dr. Mike Wulder, senior research scientist of the Landsat Science Team Canadian Forest Service, Natural Resources Canada. The Landsat Data Continuity Mission LDCM is the future of Landsat satellites. It will continue to obtain valuable data and imagery to be used in agriculture, education, business, science, and government. The Landsat Program provides repetitive acquisition of high resolution multispectral data of the Earth's surface on a global basis. The data from the Landsat spacecraft constitute the longest record of the Earth's continental surfaces as seen from space. It is a record unmatched in quality, detail, coverage, and value. Liftoff is planned for Feb. 11, 2013 aboard a United Launch Alliance Atlas V rocket. For more information, visit: http:__www.nasa.gov_mission_pages_landsat_main_index.html Photo credit: NASA_Kim Shiflett
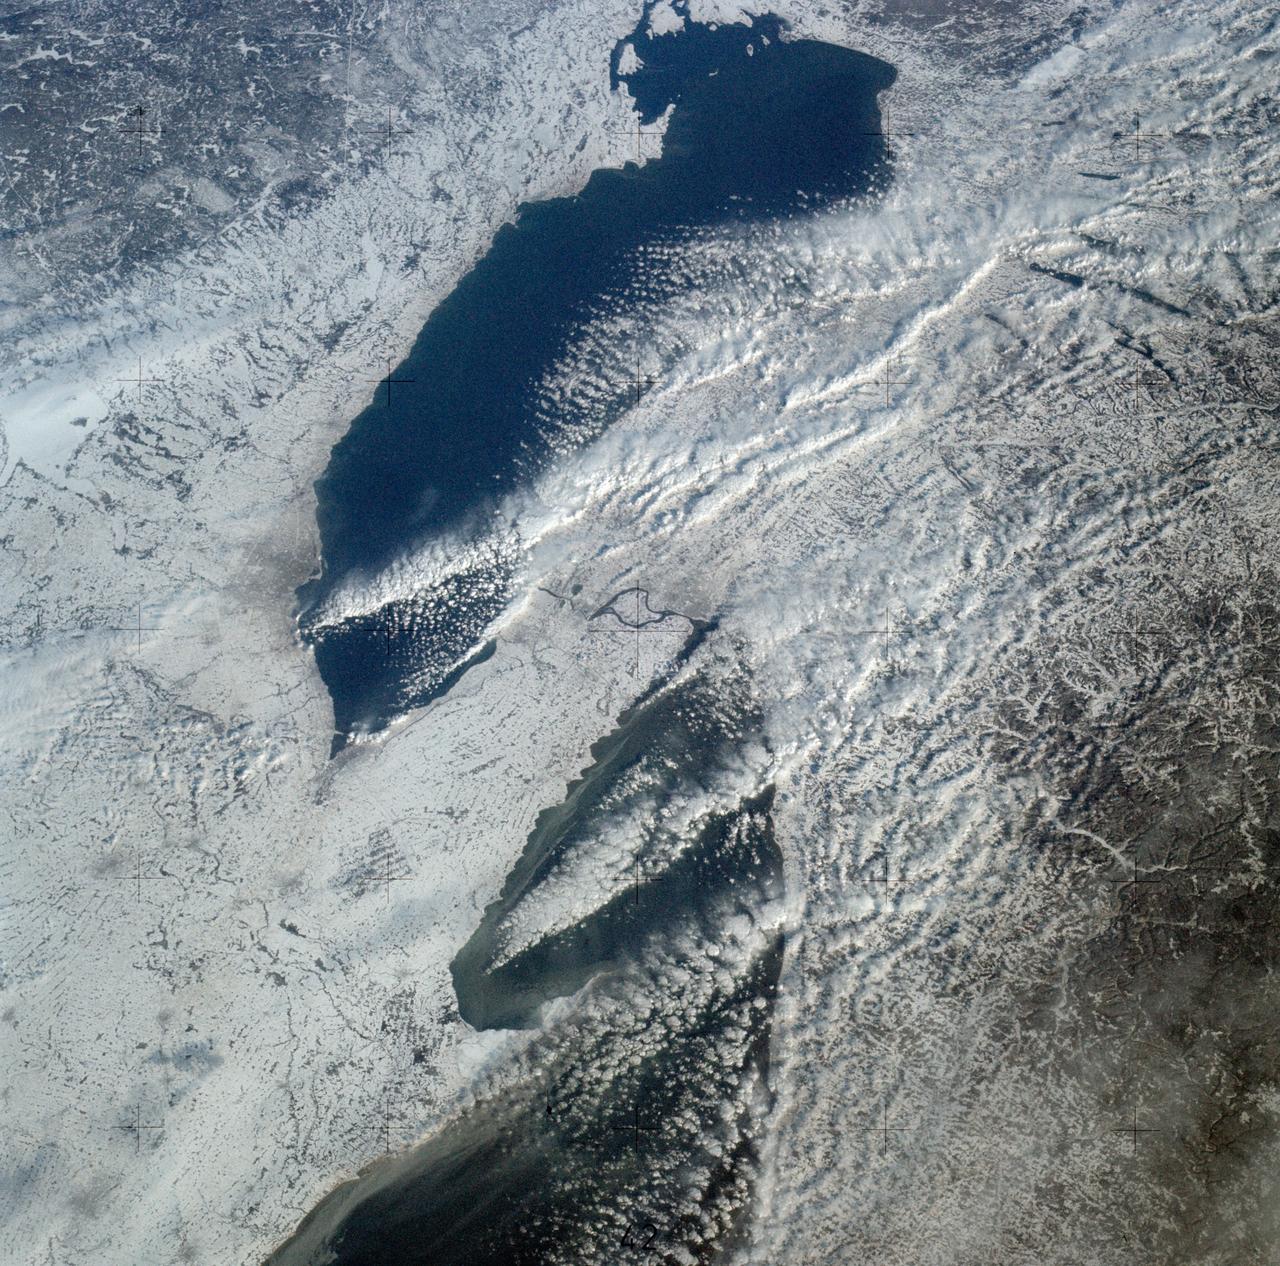
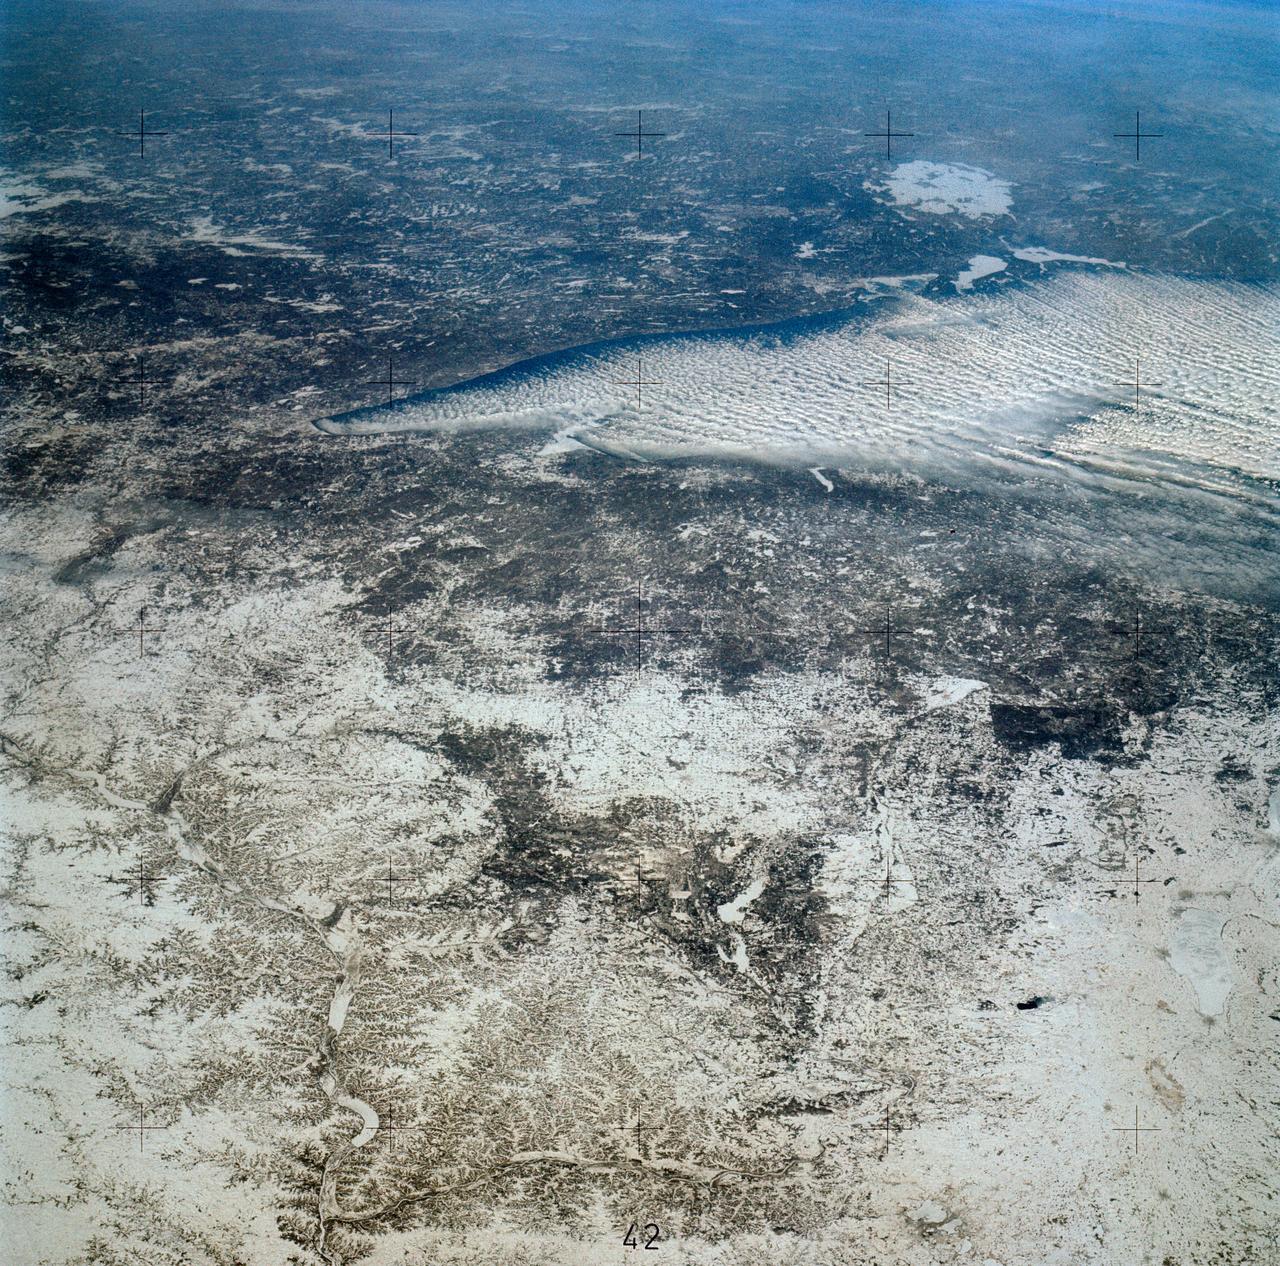
SL4-139-3989 (February 1974) --- An oblique view of a portion of the Great Lakes area as seen from the Skylab space station in Earth orbit. This picture was taken with a hand-held 70mm Hasselblad camera. Lake Erie is in the foreground; and Lake Ontario is in the background. The Niagara Falls area is in the center of the photograph. Portions of Pennsylvania, New York, and Ontario, Canada are visible, but under nearly complete snow cover. Major structural features, drainage patterns, road systems and the cities of Buffalo and Toronto are easily distinguished and actually enhanced by the snow. At the time this picture was taken, these two Great Lakes had no observable ice, although cloud formations partially mask the southern shores of the two bodies of water. James Barnes, a snow-pattern expert, will analyze Skylab photographs like this one to gain further knowledge of snow cover over land masses. Photo credit: NASA

VANDENBERG AFB, Calif. -- During a news conference at Vandenberg Air Force Base, Calif. prior to the launch of NASA's Landsat Data Continuity Mission, or LDCM, media representative heard from Dr. Thomas Loveland, senior scientist and co-chair of the Landsat Science Team U.S. Geological Survey Earth Resources Observation and Science Center, Kass Green, Landsat scientist and president of Kass Green and Associates, and Dr. Mike Wulder, senior research scientist of the Landsat Science Team Canadian Forest Service, Natural Resources Canada. The Landsat Data Continuity Mission LDCM is the future of Landsat satellites. It will continue to obtain valuable data and imagery to be used in agriculture, education, business, science, and government. The Landsat Program provides repetitive acquisition of high resolution multispectral data of the Earth's surface on a global basis. The data from the Landsat spacecraft constitute the longest record of the Earth's continental surfaces as seen from space. It is a record unmatched in quality, detail, coverage, and value. Liftoff is planned for Feb. 11, 2013 aboard a United Launch Alliance Atlas V rocket. For more information, visit: http:__www.nasa.gov_mission_pages_landsat_main_index.html Photo credit: NASA_Kim Shiflett
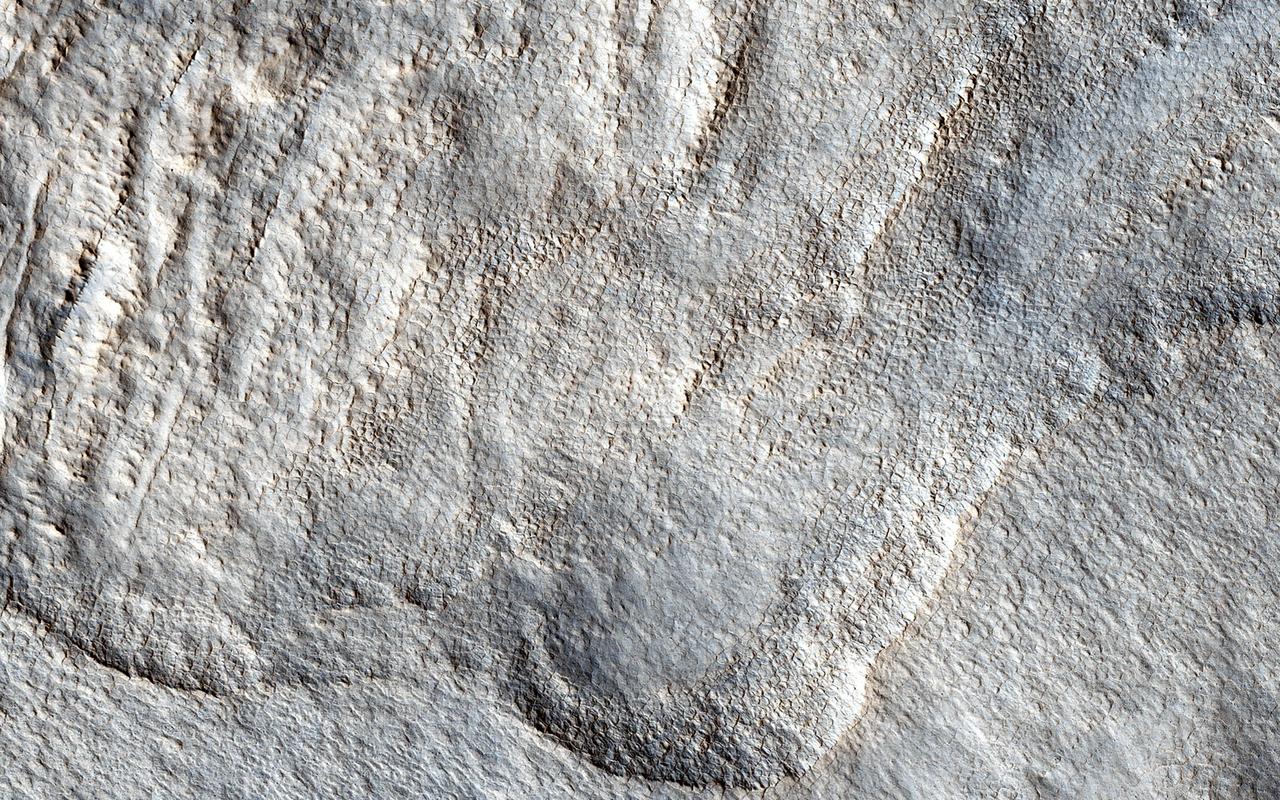
The rotational axis of Mars is currently tilted by about 25 degrees, very similar to that of the Earth (at 23.4 degrees). However, while Earth's axial tilt (also known as "obliquity") tends to change very slightly over time (almost 3 degrees in 40,000 year-cycles), the obliquity of Mars is much more chaotic and varies widely from 0 to almost 60 degrees! The fact that it is currently similar to that of the Earth is merely a coincidence. Currently, water-ice is stable on the Martian surface only in the polar regions. However, during times of "high obliquity," that stability shifts towards the equatorial regions. We see evidence for recent periods of high obliquity on Mars in the form of features common in the mid-latitude regions, which planetary scientists call "viscous flow features," "lobate debris aprons," or "lineated valley fills." These are all scientifically conservative ways of describing features on Mars that resemble mountain glaciers on Earth. We now know from radar observations, particularly using the SHARAD instrument on board the Mars Reconnaissance Orbiter, that these features are really composed of mixtures of pure ice and dust, and as a result, many scientists have started using the term "glacier-like forms" (GLF) to describe some of them. The main reason that these feature are still present for us to observe nowadays-despite the inhospitable conditions for water ice in these latitudes-is that these "glaciers" are covered by thin layers of dust, which protect them from the atmosphere of Mars and prevents, or significantly slows down, the loss of ice through sublimation to the atmosphere. However, if we were to take a look at this image of a "lobate debris apron," we will see that some areas show numerous depressions, which suggests that these areas have lost some of the ice creating these "deflation features." In addition, if we zoom in on one of these depressions, we will see surface polygonal patterns, which are common in cold regions on Earth (such as Alaska, northern Canada, and Siberia) and are indicators of shallow sub-surface water-ice. http://photojournal.jpl.nasa.gov/catalog/PIA21065

NASA image release March 2, 2012 This composite image shows the distribution of dark matter, galaxies, and hot gas in the core of the merging galaxy cluster Abell 520, formed from a violent collision of massive galaxy clusters. The natural-color image of the galaxies was taken with NASA's Hubble Space Telescope and with the Canada-France-Hawaii Telescope in Hawaii. Superimposed on the image are "false-colored" maps showing the concentration of starlight, hot gas, and dark matter in the cluster. Starlight from galaxies, derived from observations by the Canada-France-Hawaii Telescope, is colored orange. The green-tinted regions show hot gas, as detected by NASA's Chandra X-ray Observatory. The gas is evidence that a collision took place. The blue-colored areas pinpoint the location of most of the mass in the cluster, which is dominated by dark matter. Dark matter is an invisible substance that makes up most of the universe's mass. The dark-matter map was derived from the Hubble Wide Field Planetary Camera 2 observations, by detecting how light from distant objects is distorted by the cluster galaxies, an effect called gravitational lensing. The blend of blue and green in the center of the image reveals that a clump of dark matter resides near most of the hot gas, where very few galaxies are found. This finding confirms previous observations of a dark-matter core in the cluster. The result could present a challenge to basic theories of dark matter, which predict that galaxies should be anchored to dark matter, even during the shock of a collision. Abell 520 resides 2.4 billion light-years away. To read more go to: <a href="http://www.nasa.gov/mission_pages/hubble/science/dark-matter-core.html" rel="nofollow">www.nasa.gov/mission_pages/hubble/science/dark-matter-cor...</a> Credit: NASA, ESA, CFHT, CXO, M.J. Jee (University of California, Davis), and A. Mahdavi (San Francisco State University) <b><a href="http://www.nasa.gov/audience/formedia/features/MP_Photo_Guidelines.html" rel="nofollow">NASA image use policy.</a></b> <b><a href="http://www.nasa.gov/centers/goddard/home/index.html" rel="nofollow">NASA Goddard Space Flight Center</a></b> enables NASA’s mission through four scientific endeavors: Earth Science, Heliophysics, Solar System Exploration, and Astrophysics. Goddard plays a leading role in NASA’s accomplishments by contributing compelling scientific knowledge to advance the Agency’s mission. <b>Follow us on <a href="http://twitter.com/NASA_GoddardPix" rel="nofollow">Twitter</a></b> <b>Like us on <a href="http://www.facebook.com/pages/Greenbelt-MD/NASA-Goddard/395013845897?ref=tsd" rel="nofollow">Facebook</a></b> <b>Find us on <a href="http://instagrid.me/nasagoddard/?vm=grid" rel="nofollow">Instagram</a></b>
ISS039-S-001 (April 2013) --- Increment 39 of the International Space Station Program marks the 15th year of operation since the start of the space laboratory assembly. Today, the U.S., Russia, Japan, Canada and the European Space Agency are partnering in the operation of the largest ever orbital outpost managed by humankind. The names of the six crew members are depicted in their native languages. For Expedition 39, the Soyuz spacecraft serves as transport vehicle for the crew members to and from the station. During this expedition, the ISS will serve as a platform for scientific research, Earth and astronomical observation, education, as well as a stage for the development of new technologies used for the exploration beyond low Earth orbit. The star above the complex signifies human space exploration towards new frontiers. The crew members added these words: "The crew of Expedition 39 is proud to serve the international community in furthering our scientific knowledge and in expanding human presence in space." Photo credit: NASA The NASA insignia design for shuttle and space station flights is reserved for use by the astronauts and for other official use as the NASA Administrator may authorize. Public availability has been approved only in the form of illustrations by the various news media. When and if there is any change in this policy, which is not anticipated, it will be publicly announced.
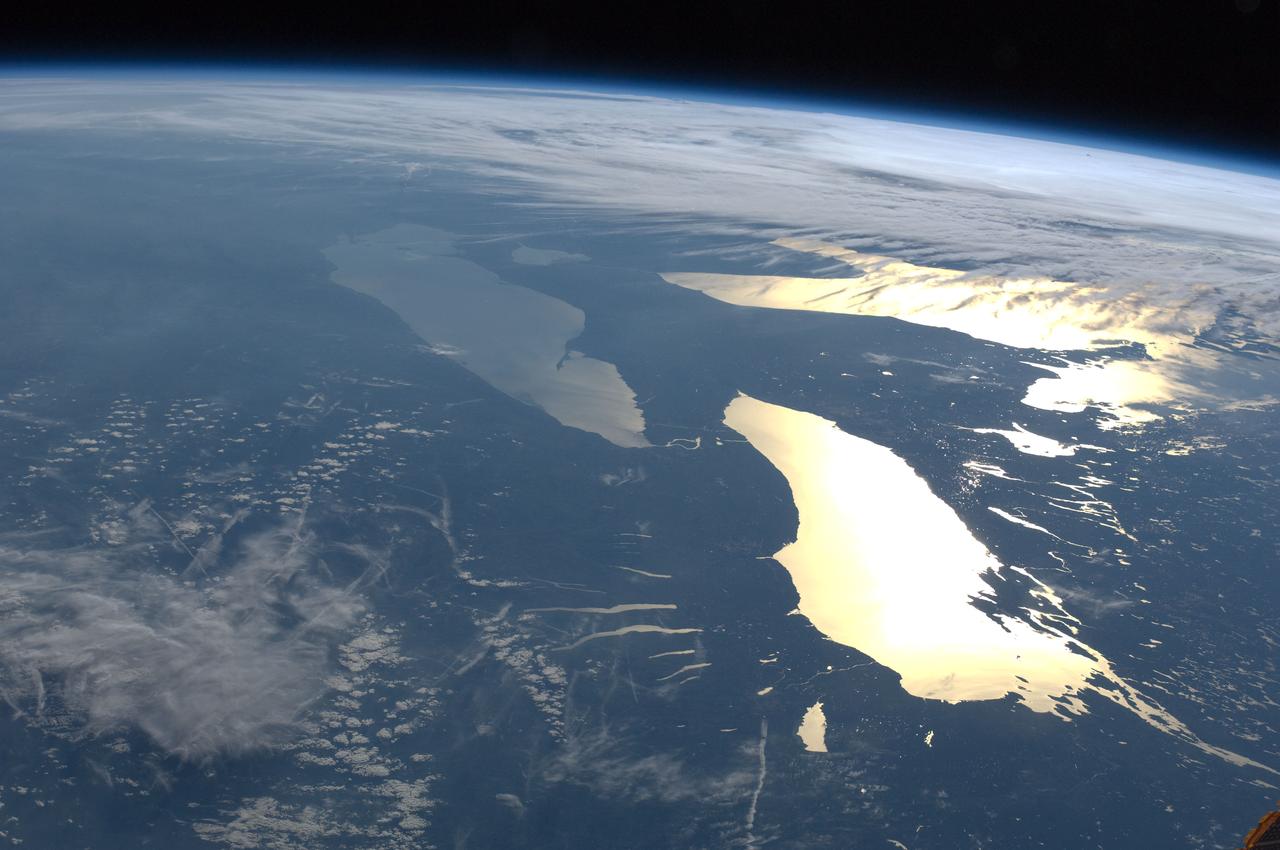
ISS031-E-123071 (14 June 2012) --- The Great Lakes in sunglint are featured in this image photographed by an Expedition 31 crew member on the International Space Station. From the vantage point of the space station, crew members observe many spectacular phenomena including aurora, noctilucent clouds, airglow, and sunglint on Earth?s water bodies. Sunglint is light reflected off of a water surface towards the observer such that it creates the appearance of a mirror-like surface. If the viewing and lighting conditions are ideal, that mirror-like surface can extend over very large areas, such as the entire surface of Lake Ontario (approximately 18,960 square kilometers). This photograph was taken while the space station was located over a point to the southeast of Nova Scotia (approximately 1,200 kilometers ground distance from the center point of the image). Lake Ontario, Lake Huron, the Finger Lakes of upstate New York, and numerous other bodies of water appear brilliantly lit by sunglint. To the west, Lake Erie is also highlighted by sunglint, but less light is being reflected back towards the observer resulting in a duller appearance. Much of central Canada is obscured by extensive cloud cover in the image, whereas a smaller grouping of clouds obscures the Appalachian range and Pennsylvania (lower left). The blue envelope of Earth?s atmosphere is visible above the curved limb, or horizon line that extends across the upper third of the image. Such panoramic views of the planet are readily taken through space station viewing ports with handheld digital cameras which allow the crew to take advantage of the full range of viewing angles.
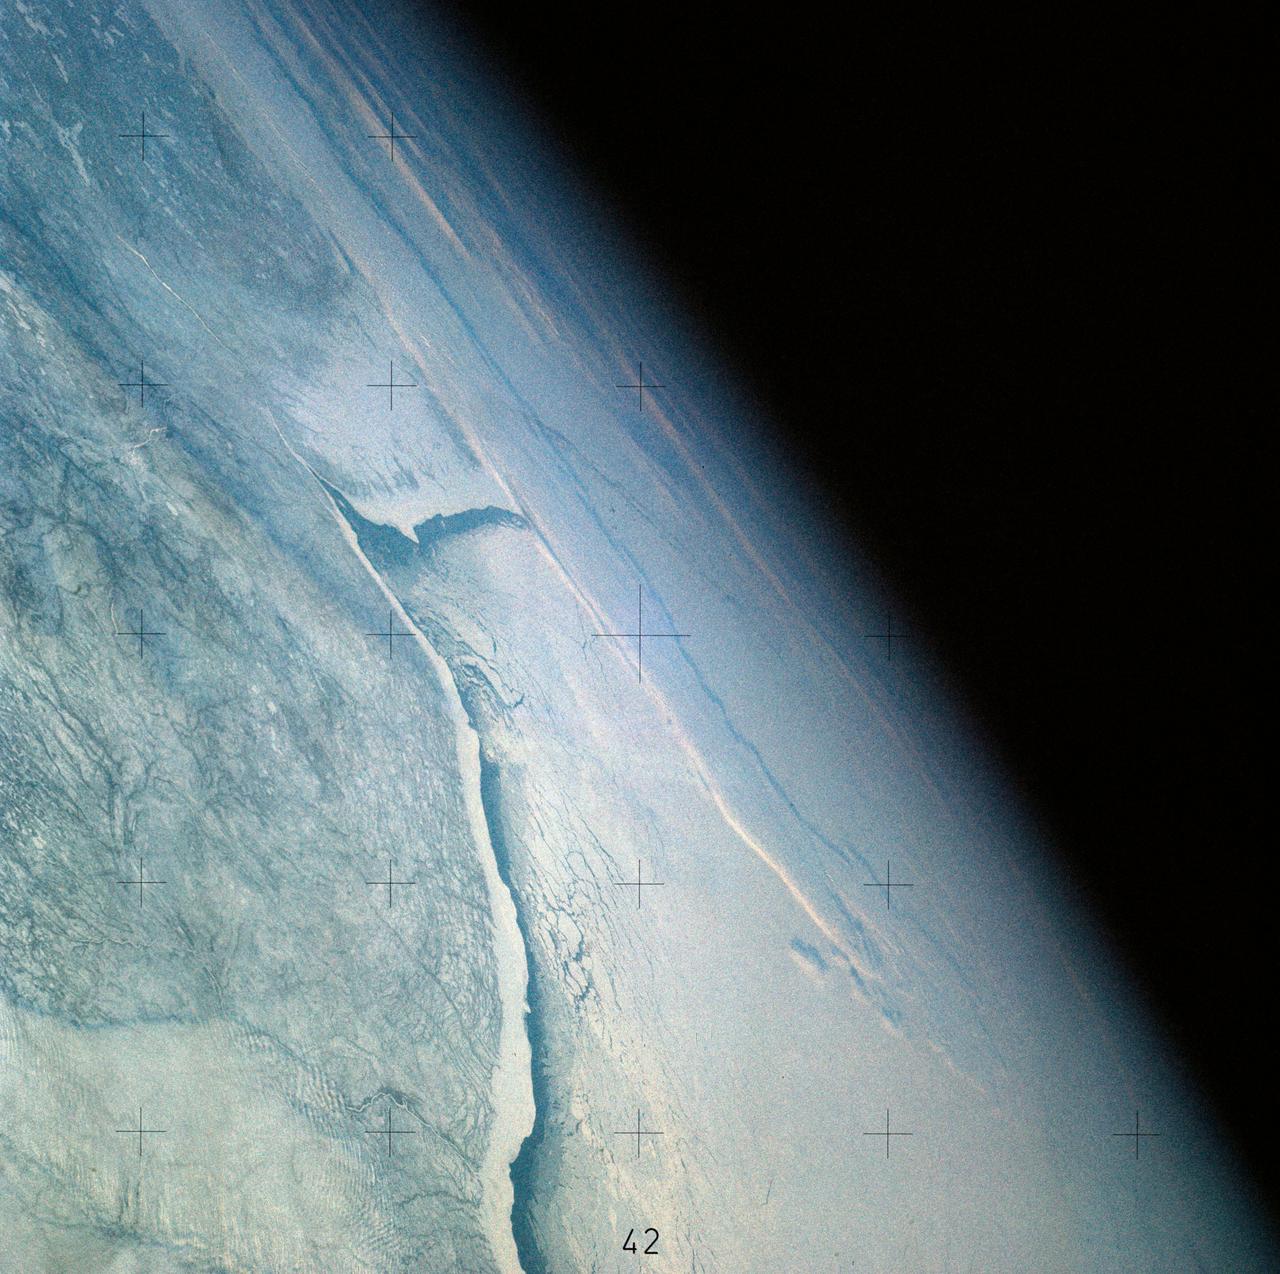
SL4-141-4316 (20 Jan. 1974) --- An oblique view of ice formations in Canada's Hudson Bay, as photographed from the Skylab space station in Earth orbit by one of the Skylab 4 crewmen. The camera used was a hand-held 70mm Hasselblad, with SO-368 medium-speed Ektachrome film. The southwestern part of the bay is prominent with the Nelson River in Manitoba flowing into it. Skylab never flew this far north in latitude. However, its orbital vantage point allowed observations and photography while over a point some 600 miles away as in the case of this picture. The ice formation along the southwest portion of Hudson Bay can be studied from photographs such as this one. The buildup of ice along the windward shore (very white) followed by the clear water gap (dark) caused by the wind blowing the newly formed ice toward the opposite shore, and finally the patterns in the ice structure itself are studied to learn more of the nature of the "winterization" of this area. Photo credit: NASA
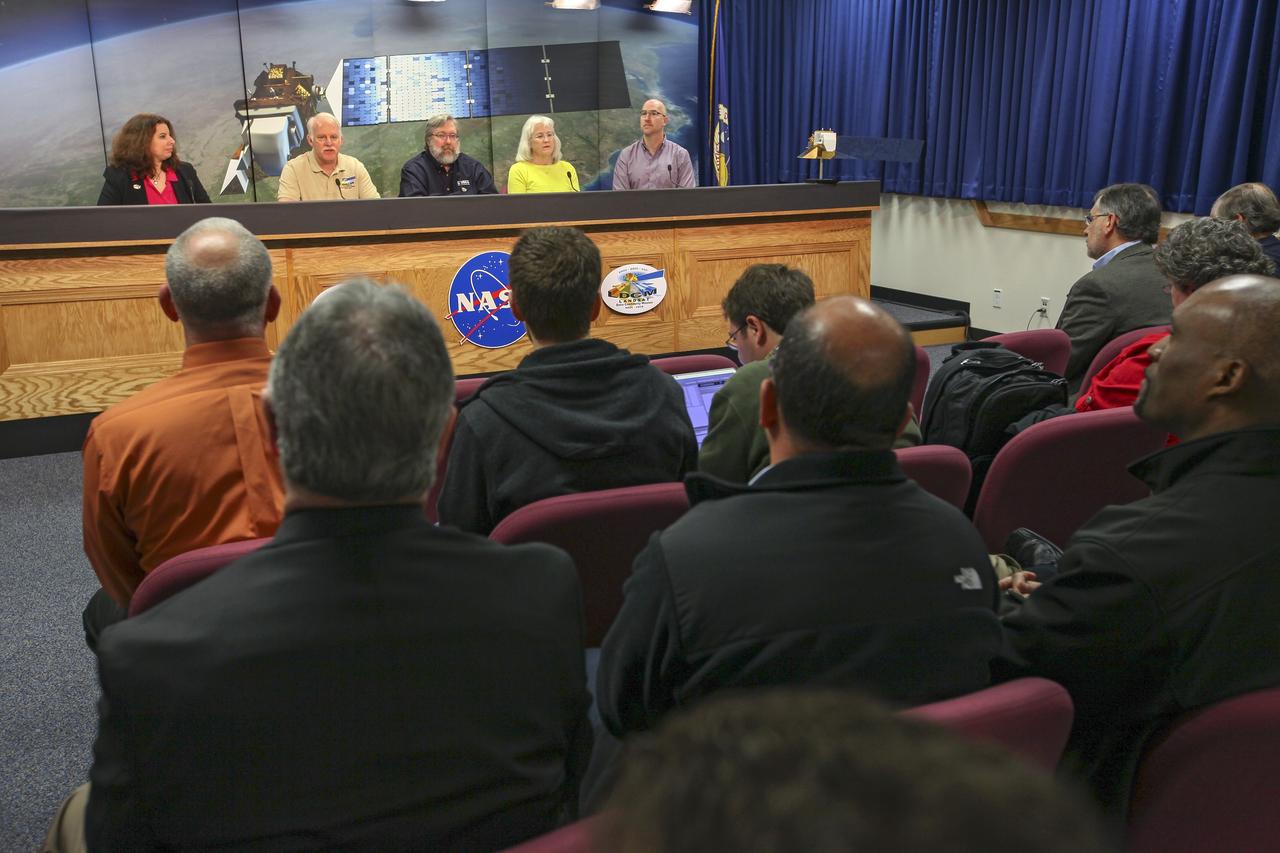
VANDENBERG AIR FORCE BASE, Calif. -- Media attend a mission science briefing at Vandenberg Air Force Base in California in preparation for the launch of the Landsat Data Continuity Mission LDCM. From left are Rani Gran of NASA Public Affairs, LDCM project scientist Dr. Jim Irons from NASA's Goddard Space Flight Center, senior scientist and co-chair of the Landsat Science Team U.S. Geological Survey Earth Resources Observation and Science EROS Center Dr. Thomas Loveland, Landsat scientist and president of Kass Green and Associates Kass Green, and senior research scientist Dr. Mike Wulder of the Landsat Science Team Canadian Forest Service, Natural Resources Canada. Launch of LDCM aboard a United Launch Alliance Atlas V rocket from Vandenberg's Space Launch Complex-3E is planned for Feb. 11 during a 48-minute launch window that opens at 10:02 a.m. PST, or 1:02 p.m. EST. LDCM is the eighth satellite in the Landsat Program series of Earth-observing missions and will continue the program’s critical role in monitoring, understanding and managing the resources needed for human sustainment, such as food, water and forests. NASA's Goddard Space Flight Center in Greenbelt, Md., is responsible for LDCM project management. Orbital Sciences Corp. built the LDCM satellite. NASA's Launch Services Program at the Kennedy Space Center in Florida provides launch management. After launch and the initial checkout phase, the U. S. Geological Survey will take operational control of LDCM, and it will be renamed Landsat 8. Photo credit: NASA/Kim Shiflett
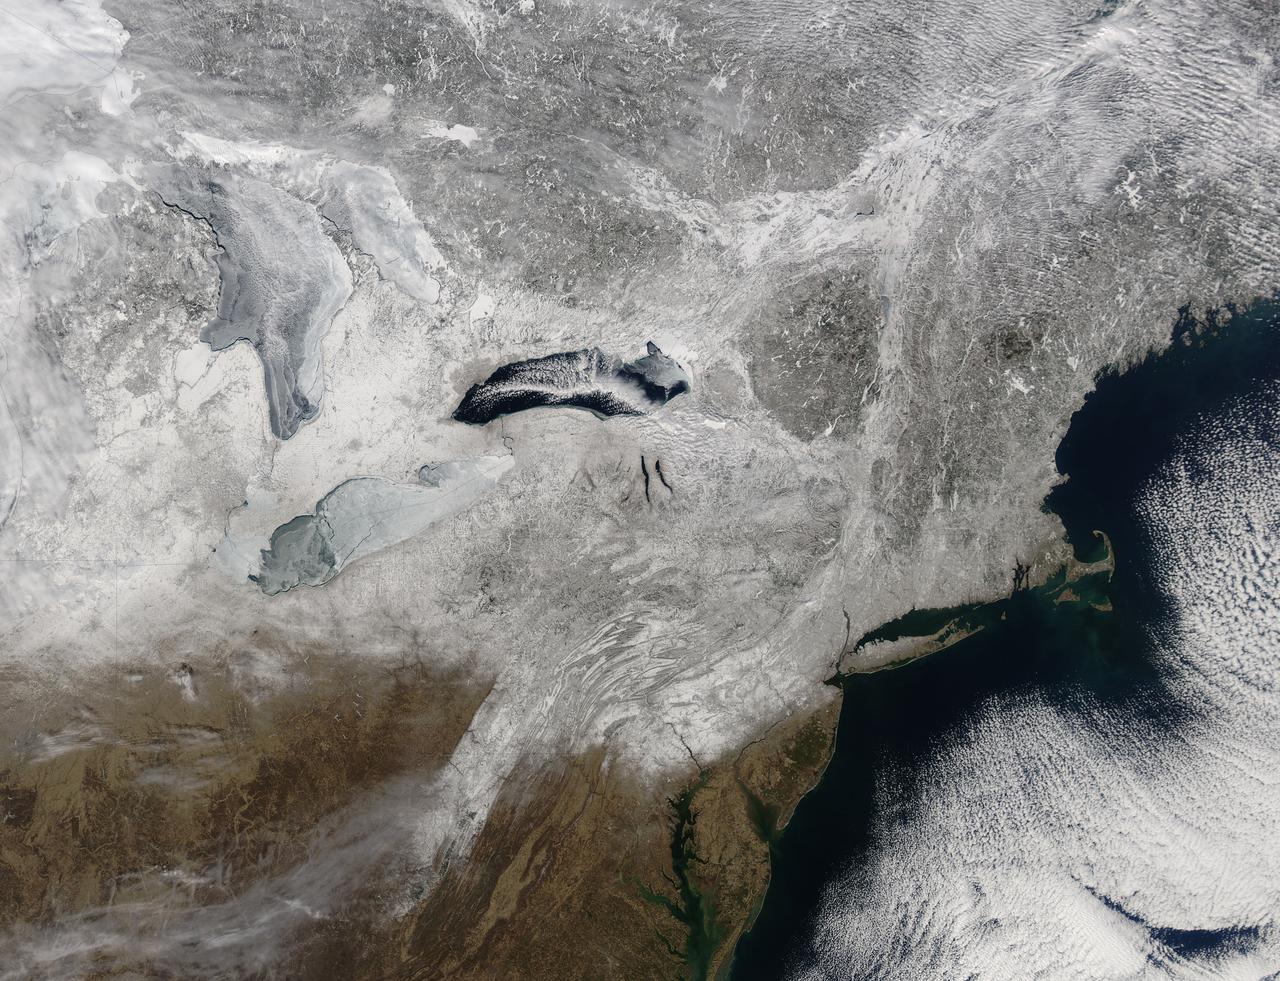
Snow covered the northeastern United States on last day of meteorological winter, 2014. Climatologists and meteorologists break seasons down into three-month groups, based on annual temperature and our calendar. This method is helpful for weather observing and forecasting, and for planning consistent agricultural dates, such as expected first frosts or best planting date. Meteorological winter – the season where temperatures are, on average, coldest and when snow is most likely to fall – runs from December 1 to February 28 in the United States and Canada. Winter can also be defined by the astronomical calendar, which is based on the rotation of the Earth around the sun. In this method, the seasons are defined by two solstices (times when the sun’s path is furthest from the Earth’s equator) and two equinoxes (the times when the sun passes directly above the equator). In the Northern Hemisphere, winter begins on the winter solstice, which falls on or around December 22 and ends on or around March 21, at the vernal (spring) equinox. On February 28, 2014, the Moderate Resolution Imaging Spectroradiometer aboard NASA’s Aqua satellite captured this true-color image of a sunny winter day in the northeastern United States. Snow stretches from Maine west to Indiana and south along the ridges of the Appalachian Mountains well into West Virginia. In Canada, the landscape appears greener, primarily because snow lies on conifers (evergreen) trees in the boreal forest regions. The Great Lakes, with the exception of Lake Ontario, are almost completely covered with ice. Credit: NASA/GSFC/Jeff Schmaltz/MODIS Land Rapid Response Team <b><a href="http://www.nasa.gov/audience/formedia/features/MP_Photo_Guidelines.html" rel="nofollow">NASA image use policy.</a></b> <b><a href="http://www.nasa.gov/centers/goddard/home/index.html" rel="nofollow">NASA Goddard Space Flight Center</a></b> enables NASA’s mission through four scientific endeavors: Earth Science, Heliophysics, Solar System Exploration, and Astrophysics. Goddard plays a leading role in NASA’s accomplishments by contributing compelling scientific knowledge to advance the Agency’s mission. <b>Follow us on <a href="http://twitter.com/NASAGoddardPix" rel="nofollow">Twitter</a></b> <b>Like us on <a href="http://www.facebook.com/pages/Greenbelt-MD/NASA-Goddard/395013845897?ref=tsd" rel="nofollow">Facebook</a></b> <b>Find us on <a href="http://instagram.com/nasagoddard?vm=grid" rel="nofollow">Instagram</a></b>
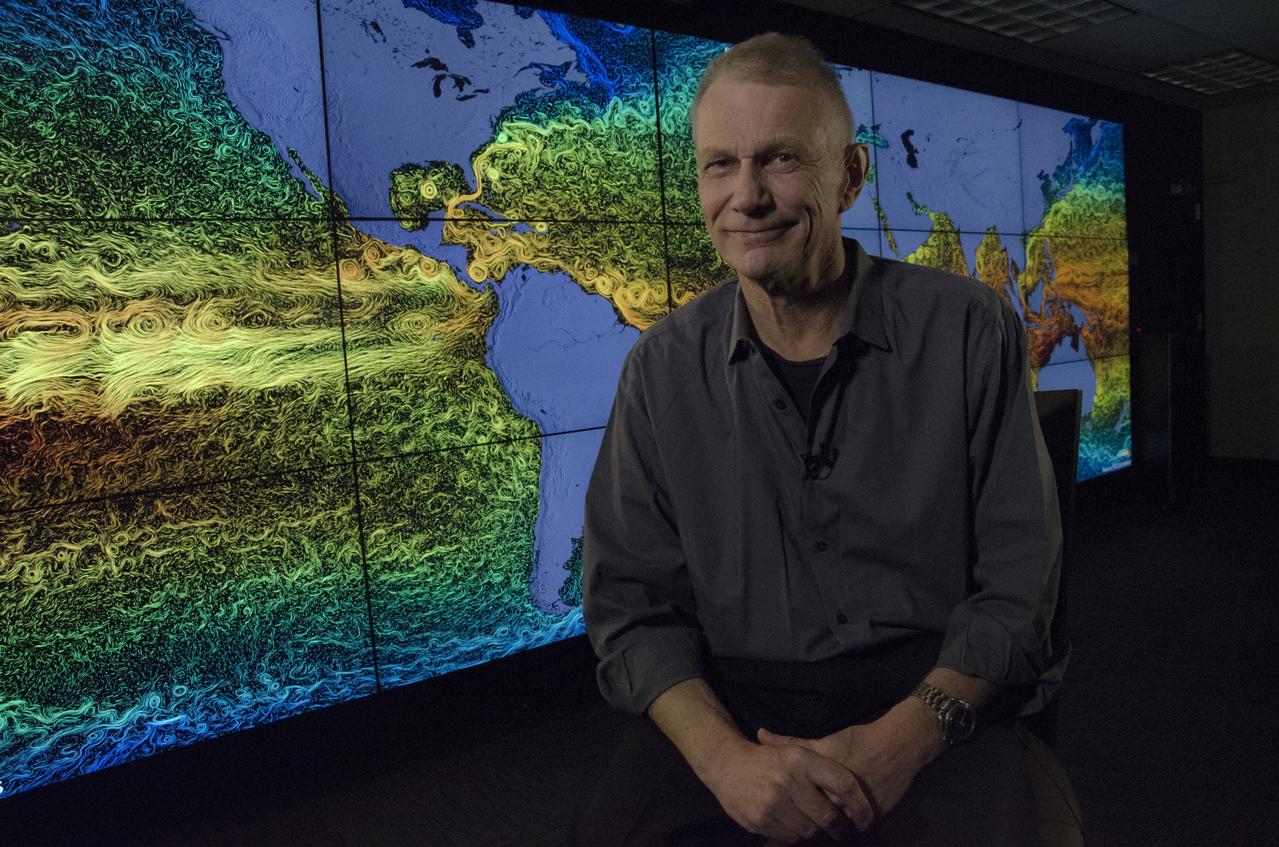
Piers Sellers is currently Deputy Director of the Sciences and Exploration Directorate and Acting Director of the Earth Sciences Division at NASA/GSFC. He was born and educated in the United Kingdom and moved to the U.S. in 1982 to carry out climate research at NASA/GSFC. From 1982 to 1996, he worked on global climate problems, particularly those involving interactions between the biosphere and the atmosphere, and was involved in constructing computer models of the global climate system, satellite data interpretation and conducting large-scale field experiments in the USA, Canada, Africa, and Brazil. He served as project scientist for the first large Earth Observing System platform, Terra, launched in 1998. He joined the NASA astronaut corps in 1996 and flew to the International Space Station (ISS) in 2002, 2006, and 2010, carrying out six spacewalks and working on ISS assembly tasks. He returned to Goddard Space Flight Center in June, 2011. Credit: NASA/Goddard/Rebecca Roth <b><a href="http://www.nasa.gov/audience/formedia/features/MP_Photo_Guidelines.html" rel="nofollow">NASA image use policy.</a></b> <b><a href="http://www.nasa.gov/centers/goddard/home/index.html" rel="nofollow">NASA Goddard Space Flight Center</a></b> enables NASA’s mission through four scientific endeavors: Earth Science, Heliophysics, Solar System Exploration, and Astrophysics. Goddard plays a leading role in NASA’s accomplishments by contributing compelling scientific knowledge to advance the Agency’s mission. <b>Follow us on <a href="http://twitter.com/NASAGoddardPix" rel="nofollow">Twitter</a></b> <b>Like us on <a href="http://www.facebook.com/pages/Greenbelt-MD/NASA-Goddard/395013845897?ref=tsd" rel="nofollow">Facebook</a></b> <b>Find us on <a href="http://instagrid.me/nasagoddard/?vm=grid" rel="nofollow">Instagram</a></b>
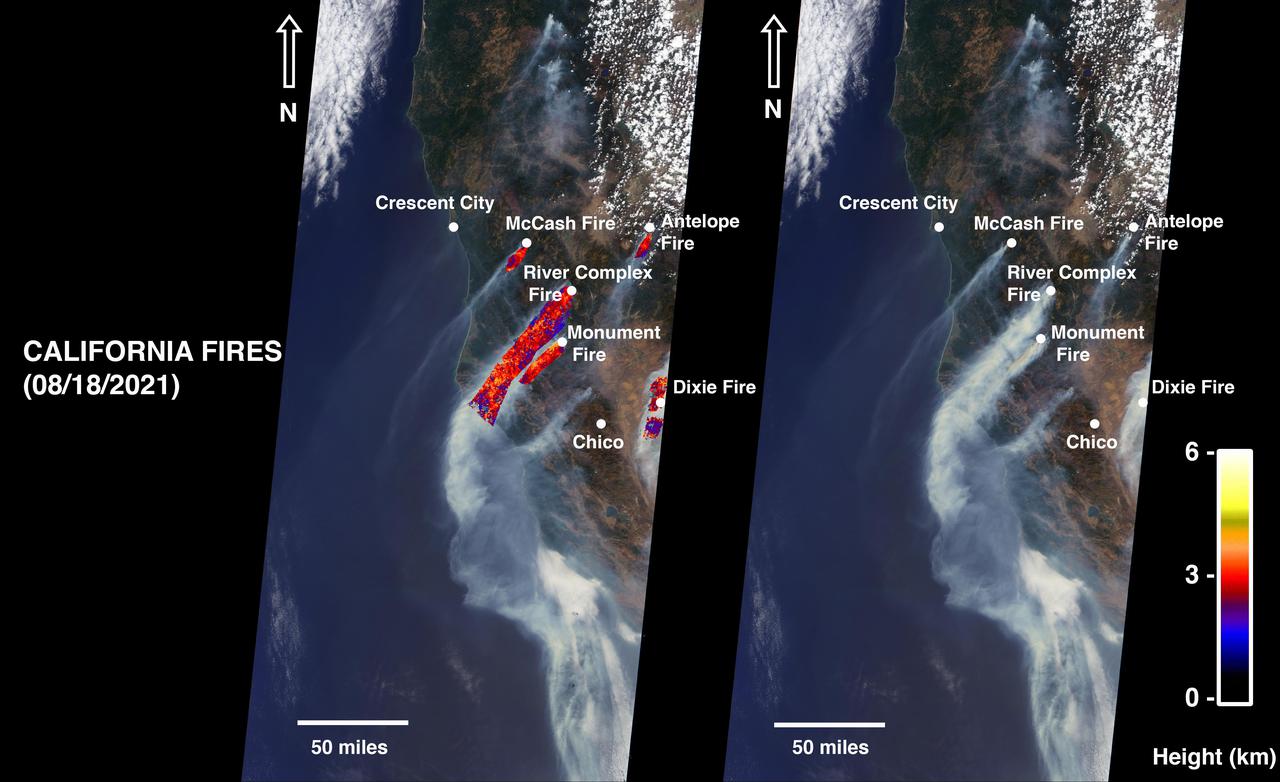
On August 18, 2021, at 12:10 p.m. local time, the Multi-angle Imaging Spectroradiometer (MISR) instrument captured imagery of the McCash, Antelope, River Complex, Monument, and Dixie fires as it passed overhead aboard NASA's Terra satellite. Combined, the fires had burned over 1 million acres as of August 24, 2021. MISR has nine cameras that view Earth at different angles. The right side of the image shows smoke from the five fires as observed by MISR's nadir (downward-pointing) camera. The multi-angular information from MISR's images is used to calculate the height of the smoke plumes. The results of those calculations are shown on the left side of the image. Smoke from areas in red reached an altitude of at least 9,842 feet (3,000 meters). The highest plume top near the active fires reached approximately 19,685 feet (6,000 meters). In general, higher-altitude plumes like this one transport smoke greater distances from the source, impacting communities downwind. In recent weeks, smoke from fires in the Western U.S. and Canada has impacted much of the East Coast. This data was acquired during Terra orbit 115254. The smoke plume height calculation was performed using the publicly available MISR INteractive eXplorer (MINX)software tool. The MISR Plume Height Project maintains a database of global smoke plume heights. https://photojournal.jpl.nasa.gov/catalog/PIA23698
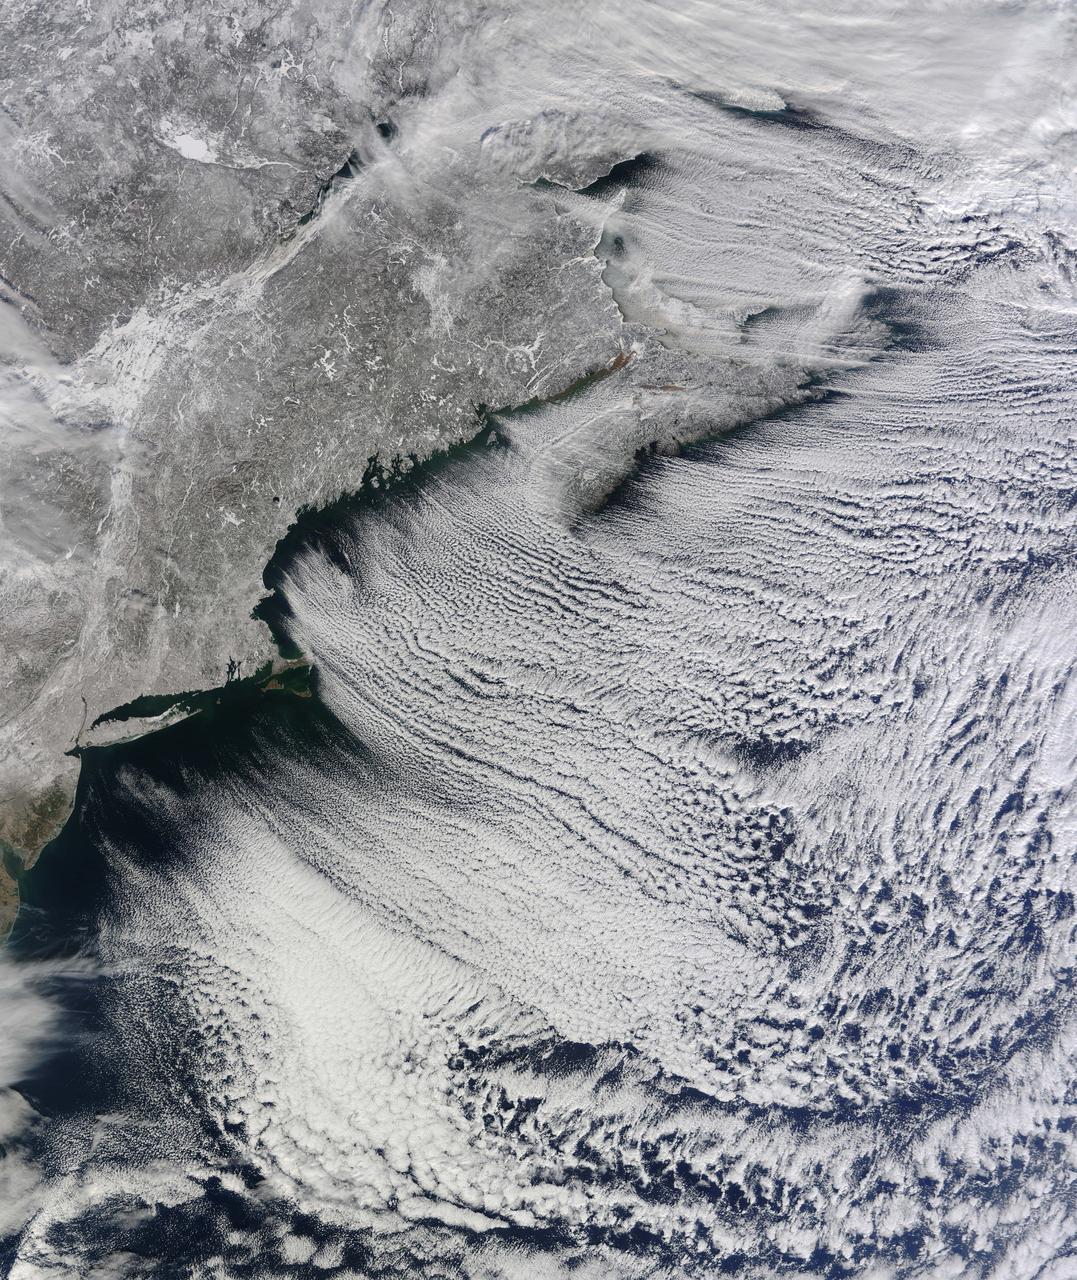
NASA image acquired January 24, 2011 What do you get when you mix below-freezing air temperatures, frigid northwest winds from Canada, and ocean temperatures hovering around 39 to 40 degrees Fahrenheit (4 to 5 degrees Celsius)? Paved highways of clouds across the skies of the North Atlantic. The Moderate Resolution Imaging Spectroradiometer (MODIS) on NASA’s Terra satellite collected this natural-color view of New England, the Canadian Maritimes, and coastal waters at 10:25 a.m. U.S. Eastern Standard Time on January 24, 2011. Lines of clouds stretch from northwest to southeast over the North Atlantic, while the relatively cloudless skies over land afford a peek at the snow that blanketed the Northeast just a few days earlier. Cloud streets form when cold air blows over warmer waters, while a warmer air layer—or temperature inversion—rests over top of both. The comparatively warm water of the ocean gives up heat and moisture to the cold air mass above, and columns of heated air—thermals—naturally rise through the atmosphere. As they hit the temperature inversion like a lid, the air rolls over like the circulation in a pot of boiling water. The water in the warm air cools and condenses into flat-bottomed, fluffy-topped cumulus clouds that line up parallel to the wind. Though they are easy to explain in a broad sense, cloud streets have a lot of mysteries on the micro scale. A NASA-funded researcher from the University of Wisconsin recently observed an unusual pattern in cloud streets over the Great Lakes. Cloud droplets that should have picked up moisture from the atmosphere and grown in size were instead shrinking as they moved over Lake Superior. Read more in an interview at What on Earth? NASA image by Jeff Schmaltz, MODIS Rapid Response Team, Goddard Space Flight Center. Caption by Michael Carlowicz. Instrument: Terra - MODIS Credit: <b><a href="http://www.earthobservatory.nasa.gov/" rel="nofollow"> NASA Earth Observatory</a></b> <b><a href="http://www.nasa.gov/centers/goddard/home/index.html" rel="nofollow">NASA Goddard Space Flight Center</a></b> enables NASA’s mission through four scientific endeavors: Earth Science, Heliophysics, Solar System Exploration, and Astrophysics. Goddard plays a leading role in NASA’s accomplishments by contributing compelling scientific knowledge to advance the Agency’s mission. <b>Follow us on <a href="http://twitter.com/NASA_GoddardPix" rel="nofollow">Twitter</a></b> <b>Join us on <a href="http://www.facebook.com/pages/Greenbelt-MD/NASA-Goddard/395013845897?ref=tsd" rel="nofollow">Facebook</a></b>
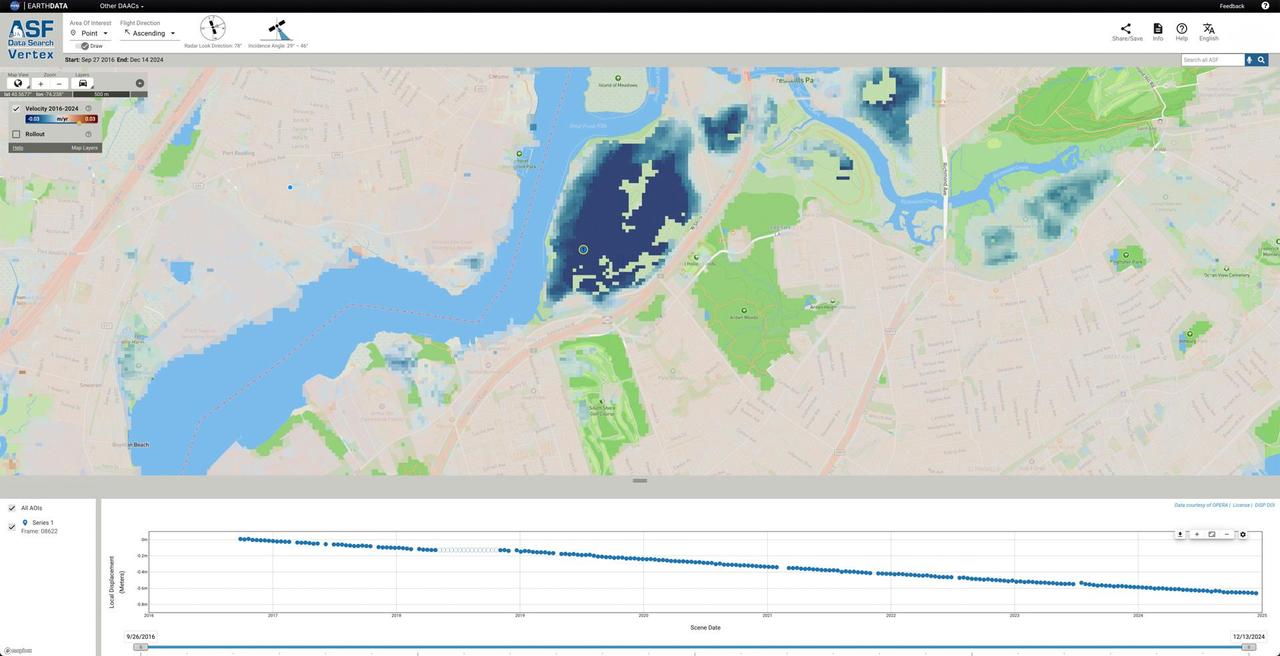
NASA, along with the agency's Jet Propulsion Laboratory in Southern California, is collaborating with the Alaska Satellite Facility in Fairbanks to create a powerful web-based tool that will show the movement of land across North America down to less than an inch. The online portal and its underlying dataset unlock a trove of satellite radar measurements that can help anyone identify where and by how much the land beneath their feet may be moving – whether from earthquakes, volcanoes, landslides, or the extraction of underground natural resources such as groundwater. Spearheaded by NASA's Observational Products for End-Users from Remote Sensing Analysis, or OPERA, project at JPL, the effort equips users with information that would otherwise take years of training to harness. The project builds on data from spaceborne synthetic aperture radars, or SARs, to generate high-resolution data on how Earth's surface is moving. Formally called the North America Surface Displacement Product Suite, the new dataset dates to 2016. By the end of 2025, the data will cover the entire United States, Central America, and Canada within 120 miles (200 kilometers) of the U.S. border. The image shows how the portal visualizes land sinking over time in Freshkills Park, which is being built on a former landfill on Staten Island, New York. Landfills tend to sink over time as waste decomposes, compacts, and settles under its own weight. The blue dot marks the point on the land where the portal is displaying movement in the accompanying scatterplot. https://photojournal.jpl.nasa.gov/catalog/PIA26494

A transmission spectrum made from a single observation using Webb’s Near-Infrared Imager and Slitless Spectrograph (NIRISS) reveals atmospheric characteristics of the hot gas giant exoplanet WASP-96 b. A transmission spectrum is made by comparing starlight filtered through a planet’s atmosphere as it moves across the star, to the unfiltered starlight detected when the planet is beside the star. Each of the 141 data points (white circles) on this graph represents the amount of a specific wavelength of light that is blocked by the planet and absorbed by its atmosphere. In this observation, the wavelengths detected by NIRISS range from 0.6 microns (red) to 2.8 microns (in the near-infrared). The amount of starlight blocked ranges from about 13,600 parts per million (1.36 percent) to 14,700 parts per million (1.47 percent). Researchers are able to detect and measure the abundances of key gases in a planet’s atmosphere based on the absorption pattern – the locations and heights of peaks on the graph: each gas has a characteristic set of wavelengths that it absorbs. The temperature of the atmosphere can be calculated based in part on the height of the peaks: a hotter planet has taller peaks. Other characteristics, like the presence of haze and clouds, can be inferred based on the overall shape of different portions of the spectrum. The gray lines extending above and below each data point are error bars that show the uncertainty of each measurement, or the reasonable range of actual possible values. For a single observation, the error on these measurements is remarkably small. The blue line is a best-fit model that takes into account the data, the known properties of WASP-96 b and its star (e.g., size, mass, temperature), and assumed characteristics of the atmosphere. Researchers can vary the parameters in the model – changing unknown characteristics like cloud height in the atmosphere and abundances of various gases – to get a better fit and further understand what the atmosphere is really like. The difference between the best-fit model shown here and the data simply reflects the additional work to be done in analyzing and interpreting the data and the planet. Although full analysis of the spectrum will take additional time, it is possible to draw a number of preliminary conclusions. The labeled peaks in the spectrum indicate the presence of water vapor. The height of the water peaks, which is less than expected based on previous observations, is evidence for the presence of clouds that suppress the water vapor features. The gradual downward slope of the left side of the spectrum (shorter wavelengths) is indicative of possible haze. The height of the peaks along with other characteristics of the spectrum is used to calculate an atmospheric temperature of about 1350°F (725°C). This is the most detailed infrared exoplanet transmission spectrum ever collected, the first transmission spectrum that includes wavelengths longer than 1.6 microns with such high resolution and accuracy, and the first to cover the entire wavelength range from 0.6 microns (visible red light) to 2.8 microns (near-infrared) in a single shot. The speed with which researchers have been able to make confident interpretations of the spectrum is further testament to the quality of the data. The observation was made using NIRISS’s Single-Object Slitless Spectroscopy (SOSS) mode, which involves capturing the spectrum of a single bright object, like the star WASP-96, in a field of view. WASP-96 b is a hot gas giant exoplanet that orbits a Sun-like star roughly 1,150 light-years away, in the constellation Phoenix. The planet orbits extremely close to its star (less than 1/20th the distance between Earth and the Sun) and completes one orbit in less than 3½ Earth-days. The planet’s discovery, based on ground-based observations, was announced in 2014. The star, WASP-96, is somewhat older than the Sun, but is about the same size, mass, temperature, and color. The background illustration of WASP-96 b and its star is based on current understanding of the planet from both NIRISS spectroscopy and previous ground- and space-based observations. Webb has not captured a direct image of the planet or its atmosphere. NIRISS was contributed by the Canadian Space Agency. The instrument was designed and built by Honeywell in collaboration with the Université de Montréal and the National Research Council Canada.
SL4-139-3953 (7 Jan. 1974) --- An oblique view of a portion of the Middle West looking northeastward toward Lake Superior and Ontario, Canada, as seen from the Skylab space station in Earth orbit. This picture was taken by one of the Skylab 4 crewmen with a hand-held 70mm Hasselblad camera using a 100mm lens. Most of the land mass in the foreground is Wisconsin. Iowa is in the lower left corner. Minnesota is at left and upper left. Ontario is in the far right background. Michigan is at right center. Note the circular-shaped feature at center left which was first observed by the Skylab 4 crewmen. The feature is 85 kilometers (55 miles) in diameter, and it is centered near 91.5 degrees west longitude and 44.5 degrees north latitude. The Mississippi River Valley forms the southwest side of the circular feature. The City of La Crosse, Wisconsin, is just south of the near side of the circle, and the Black River completes the southern and eastern part. The City of Eau Claire is at the north edge of the circle. The most likely origin of circular features of this magnitude are (1) volcanic, (2) structural, or (3) meteorite impact. The feature is not volcanic -- the rocks are the wrong type. Possibly it is structural, formed by slight warping of layered rocks into a basin or dome, followed by erosion of all but the most subtle trace of the structure. The feature could be a severely eroded meteorite impact crater. If so, a thorough study of the area may yield evidence of the extreme pressure and temperature the rocks were subjected to by the shock of an impacting meteorite. Photo credit: NASA

Using NASA’s Hubble Space Telescope, astronomers have captured for the first time snapshots of fledging white dwarf stars beginning their slow-paced, 40-million-year migration from the crowded center of an ancient star cluster to the less populated suburbs. White dwarfs are the burned-out relics of stars that rapidly lose mass, cool down and shut off their nuclear furnaces. As these glowing carcasses age and shed weight, their orbits begin to expand outward from the star cluster’s packed downtown. This migration is caused by a gravitational tussle among stars inside the cluster. Globular star clusters sort out stars according to their mass, governed by a gravitational billiard ball game where lower mass stars rob momentum from more massive stars. The result is that heavier stars slow down and sink to the cluster's core, while lighter stars pick up speed and move across the cluster to the edge. This process is known as "mass segregation." Until these Hubble observations, astronomers had never definitively seen the dynamical conveyor belt in action. Astronomers used Hubble to watch the white-dwarf exodus in the globular star cluster 47 Tucanae, a dense swarm of hundreds of thousands of stars in our Milky Way galaxy. The cluster resides 16,700 light-years away in the southern constellation Tucana. Read more: <a href="http://www.nasa.gov/feature/goddard/hubble-catches-stellar-exodus-in-action" rel="nofollow">www.nasa.gov/feature/goddard/hubble-catches-stellar-exodu...</a> Credits: NASA, ESA, and H. Richer and J. Heyl (University of British Columbia, Vancouver, Canada); acknowledgement: J. Mack (STScI) and G. Piotto (University of Padova, Italy) <b><a href="http://www.nasa.gov/audience/formedia/features/MP_Photo_Guidelines.html" rel="nofollow">NASA image use policy.</a></b> <b><a href="http://www.nasa.gov/centers/goddard/home/index.html" rel="nofollow">NASA Goddard Space Flight Center</a></b> enables NASA’s mission through four scientific endeavors: Earth Science, Heliophysics, Solar System Exploration, and Astrophysics. Goddard plays a leading role in NASA’s accomplishments by contributing compelling scientific knowledge to advance the Agency’s mission. <b>Follow us on <a href="http://twitter.com/NASAGoddardPix" rel="nofollow">Twitter</a></b> <b>Like us on <a href="http://www.facebook.com/pages/Greenbelt-MD/NASA-Goddard/395013845897?ref=tsd" rel="nofollow">Facebook</a></b> <b>Find us on <a href="http://instagrid.me/nasagoddard/?vm=grid" rel="nofollow">Instagram</a></b>