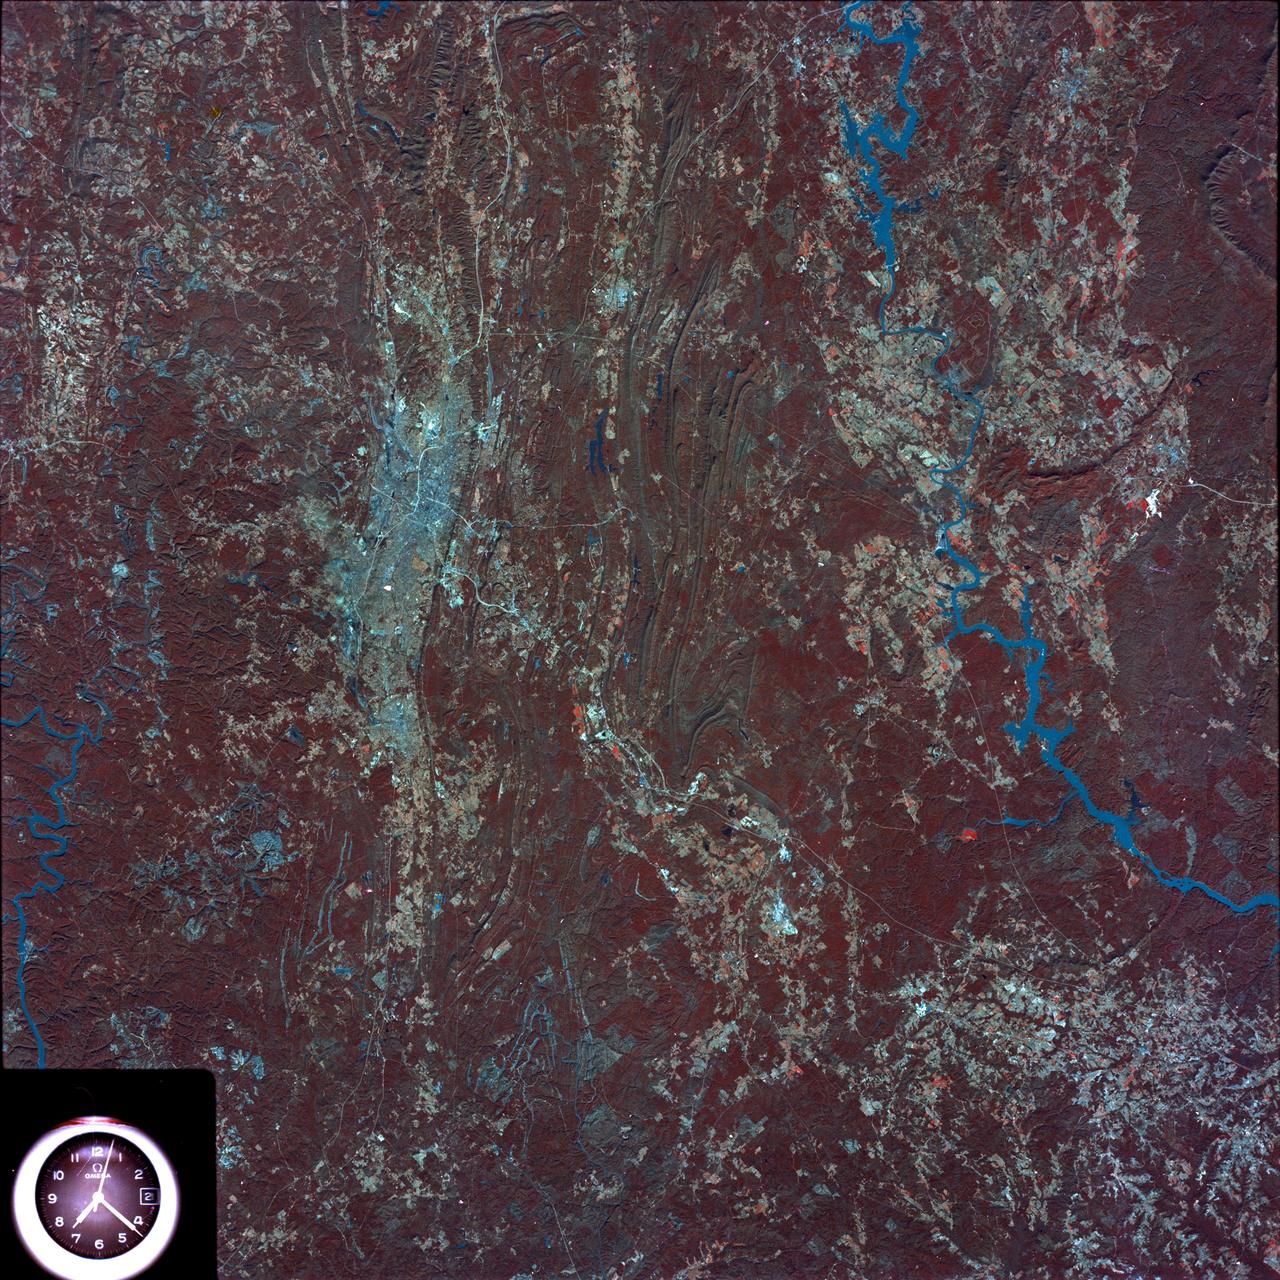
SL4-93-153 (February 1974) --- A vertical view of the Birmingham and central Alabama area is seen in this Skylab 4 Earth Resources Experiments Package S190-B (five-inch earth terrain camera) infrared photographed taken from the Skylab space station in Earth orbit. Illustrated here is the utility of color infrared film in depicting distribution of living vegetation in the 3,600 square mile Birmingham region. The Birmingham industrial complex, with a population of nearly 850,000, is the light gray area nestled in the valley between the northeast-trending ridges that are prominent topographic features in the southern Appalachian Mountains. The narrow ridges and adjacent valleys reflect folded and faulted sedimentary rocks, indicating the complex geological history of the region. Two major rivers and several reservoirs are easily distinguished in this photograph. Bankhand Lake, formed by a dam on the Black Warrior River, appears as bright blue west of Birmingham. Two lakes are formed by dams on the Goosa River east of Birmingham. Federal and state highways appear as thin white lines and are easily identified. Interstate 65 to Montgomery is the prominent white line extending southward from Birmingham. Power line clearings are visible in the center of the picture along the Goosa River, and can be traced northwestward to northern parts of Birmingham. The predominant deep red color of the picture is due to the reflections from living vegetation. In contrast are the light tan areas that commonly occur as rectangular patterns in the east part of the photograph and represent mature agricultural crops or grazing lands. Analysis of the photographic data from the earth terrain camera will be conducted by Dr. H. Jayroe of the Marshall Space Flight Center in developing analytical techniques. All EREP photography is available to the public through the Department of Interior's Earth Resources Observations Systems Data Center, Sioux Falls, South Dakota, 57198. Photo credit: NASA
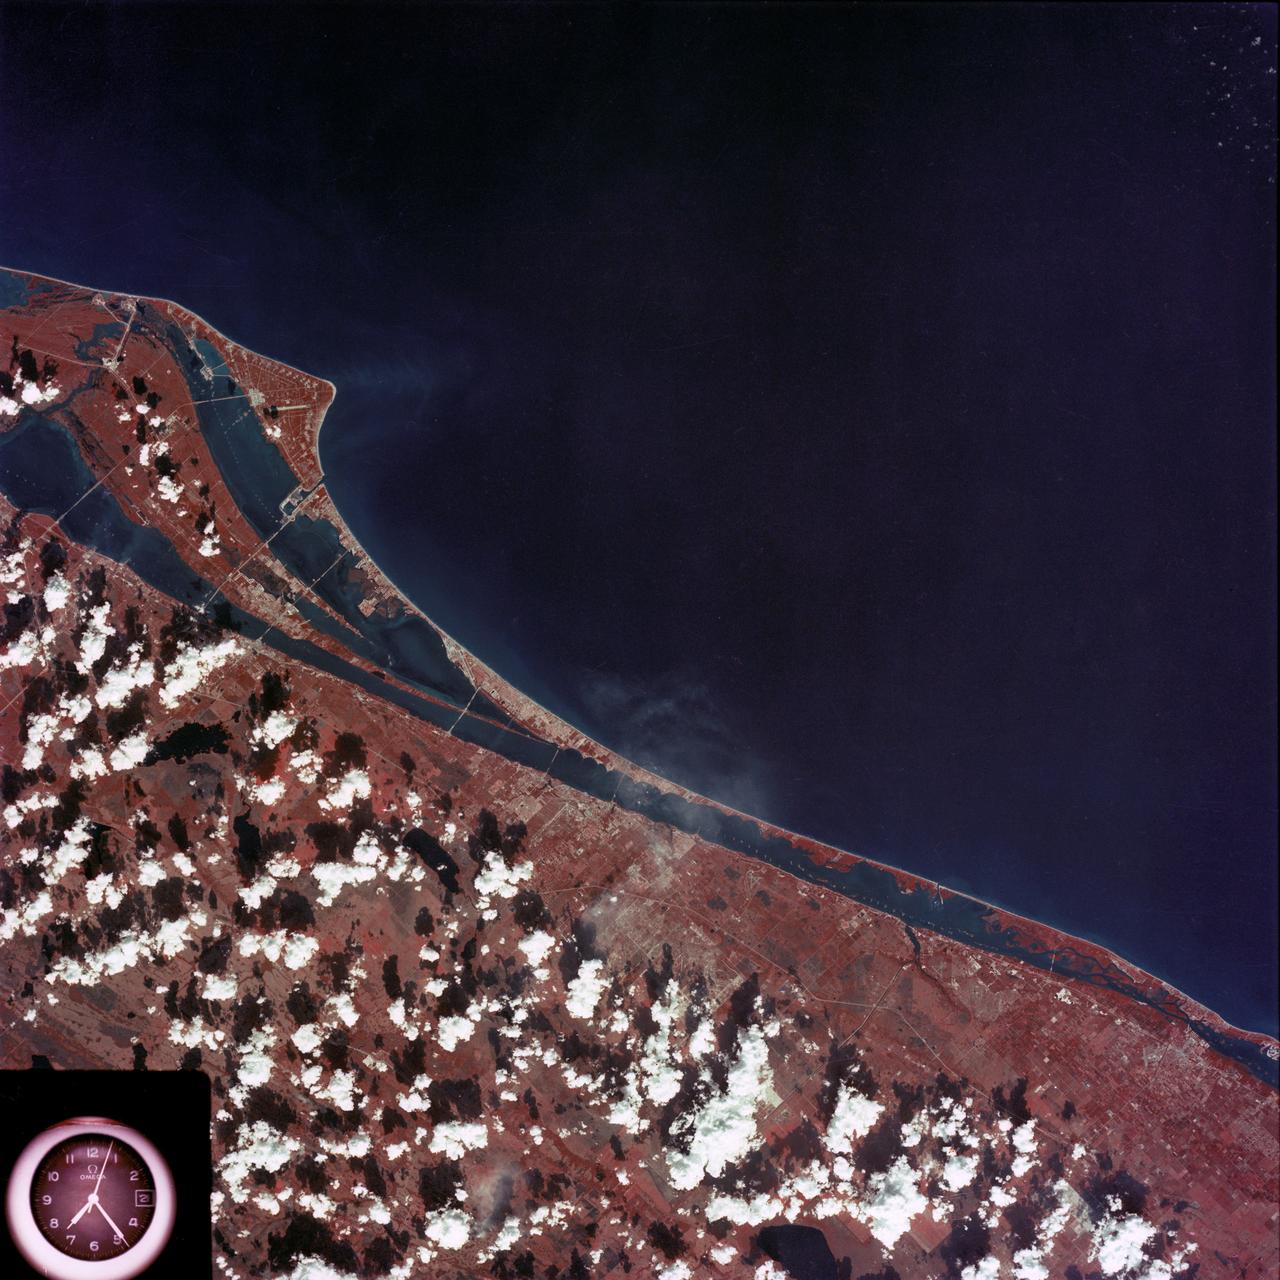
SL4-93-167 (February 1974) --- A vertical view of the Kennedy Space Center and the Florida Atlantic coast area is seen in this Skylab 4 Earth Resources Experiments Package S190-B (five-inch earth terrain camera) infrared photography taken from the Skylab space station in Earth orbit. This photograph shows the major land-ocean features of the Florida coast near Vero Beach northward to Cape Canaveral and the KSC complex. The launch pads for the Skylab missions are clearly visible. Identification of living vegetation is possible through the use of the color infrared film. Various shades of red portray differences in the vegetation such as shown in the patterns in the agricultural area near Vero Beach. In the Kennedy Space Center, the nearly continuous and uniform red color shows that most of the land areas are heavily vegetated. The white coastal beach areas are strongly contrasted to the red land and the blue Atlantic Ocean. Old dunal areas in KSC are visible on Merritt Island which is separated from the Launch areas by the Banana River and the mainland by the Indian River. Federal and state highways and numerous causeways over the rivers are easily identified. The Florida mainland is partly shadowed by small white clouds which cast a pronounced shadow to the east of each cloud indicated the Sun is west of solar noon. Federal agencies participating with NASA on the EREP project are the Departments of Agriculture, Commerce, Interior, the Environmental Protection Agency and the Core of Engineers. All EREP photography is available to the public through the Department of Interior's Earth Resources Observations Systems Data Center, Sioux Falls, South Dakota, 57198. Photo credit: NASA
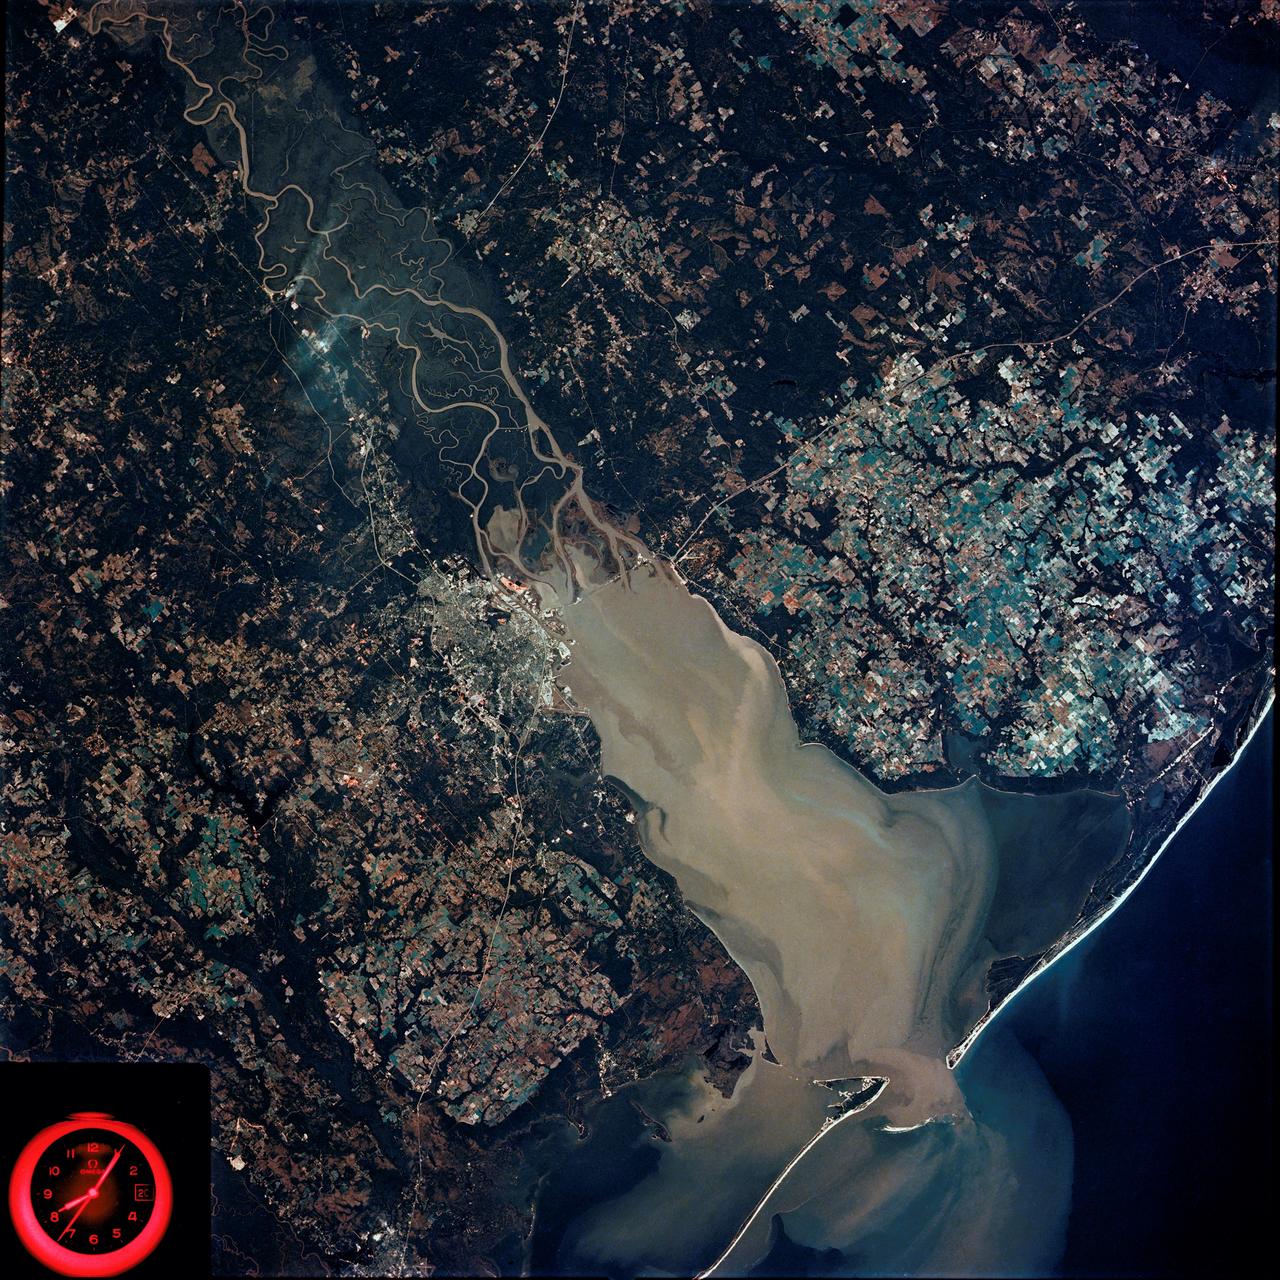
SL4-92-300 (February 1974) --- A near vertical view of the Mobile Bay, Alabama area is seen in this Skylab 4 Earth Resources Experiments Package S190-B (five-inch earth terrain camera) photograph taken from the Skylab space station in Earth orbit. North of Mobile the Tombigbee and Alabama Rivers join to form the Mobile River. Detailed configuration of the individual stream channels and boundaries can be defined as the Mobile River flows into Mobile Bay, and thence into the Gulf of Mexico. The Mobile River Valley with its numerous stream channels is a distinct light shade in contrast to the dark green shade of the adjacent areas. The red coloration of Mobile Bay reflects the sediment load carried into the Bay by the rivers. Variations in red color indicate sediment load and the current paths within Mobile Bay. The waterly movement of the along shore currents at the mouth of Mobile Bay is shown by the contrasting light blue of the sediment-laden current and the blue of the Gulf predominately. Agricultural areas east and west of Mobile Bay are characterized by a rectangular pattern in green to white shades. Color variations may reflect the type and growth cycle of crops. Agricultural areas (light gray-greens) are also clearly visible in other parts of the photograph. Interstate 10 extends from near Pascagoula, Mississippi eastward through Mobile to the outskirts of Pensacola, Florida. Analysis of the EREP photographic data will be undertaken by the U.S. Corps of Engineers to determine bay dynamic processes. Federal agencies participating with NASA on the EREP project are the Departments of Agriculture, Commerce, Interior, the Environmental Protection Agency and the Corps of Engineers. All EREP photography is available to the public through the Department of Interior's Earth Resources Observations Systems Data Center, Sioux Falls, South Dakota. 57198 Photo credit: NASA

SL3-40-077 (July-September 1973) --- A vertical view of the Mediterranean coastal area of southeastern France as photographed from Earth orbit by one of the six lenses of the Itek-furnished S190-A Multispectral Photographic Facility Experiment aboard the Skylab space station. This view of the coast extends from the eastern outskirts of Marseilles easterly to Cannes, and includes the city of Toulon. The S190-A experiment is part of the Skylab Earth Resources Experiments Package. Federal agencies participating with NASA on the EREP project are the Departments of Agriculture, Commerce, Interior, the Environmental Protection Agency and the Corps of Engineers. All EREP photography is available to the public through the Department of Interior?s Earth Resources Observations Systems Data Center, Sioux Falls, South Dakota, 57198. Photo credit: NASA

SL3-22-0214 (July-September 1973) --- A vertical view of southeastern Washington State as photographed from Earth orbit by one of the six lenses of the Itek-furnished S190-A Multispectral Photographic Facility Experiment aboard the Skylab space station. The Snake River flows into the Columbia River in the most southerly corner of the picture. The Wallula Lake is below the junction of the two rivers. The Yakima Valley is at the southwestern edge of the photograph. The Columbia Basin is in the center of the picture. The Cascade Range extends across the northwest corner of the photograph. This picture was taken with type SO-356 regular color film. The S190-A experiment is part of the Earth Resources Experiments Package. Federal agencies participating with NASA on the EREP project are the Departments of Agriculture, Commerce, Interior, the Environmental Protection Agency and the Corps of Engineers. All EREP photography is available to the public through the Department of Interior?s Earth Resources Observations Systems Data Center, Sioux Falls, South Dakota, 57198. Photo credit: NASA

VANDENBERG AFB, Calif. -- During a news conference at Vandenberg Air Force Base, Calif. prior to the launch of NASA's Landsat Data Continuity Mission, or LDCM, media representative heard from Rani Gran of NASA Public Affairs, Dr. Jim Irons, LDCM project scientist from NASA's Goddard Space Flight Center, Dr. Thomas Loveland, senior scientist and co-chair of the Landsat Science Team U.S. Geological Survey Earth Resources Observation and Science Center, Kass Green, Landsat scientist and president of Kass Green and Associates, and Dr. Mike Wulder, senior research scientist of the Landsat Science Team Canadian Forest Service, Natural Resources Canada. The Landsat Data Continuity Mission LDCM is the future of Landsat satellites. It will continue to obtain valuable data and imagery to be used in agriculture, education, business, science, and government. The Landsat Program provides repetitive acquisition of high resolution multispectral data of the Earth's surface on a global basis. The data from the Landsat spacecraft constitute the longest record of the Earth's continental surfaces as seen from space. It is a record unmatched in quality, detail, coverage, and value. Liftoff is planned for Feb. 11, 2013 aboard a United Launch Alliance Atlas V rocket. For more information, visit: http:__www.nasa.gov_mission_pages_landsat_main_index.html Photo credit: NASA_Kim Shiflett
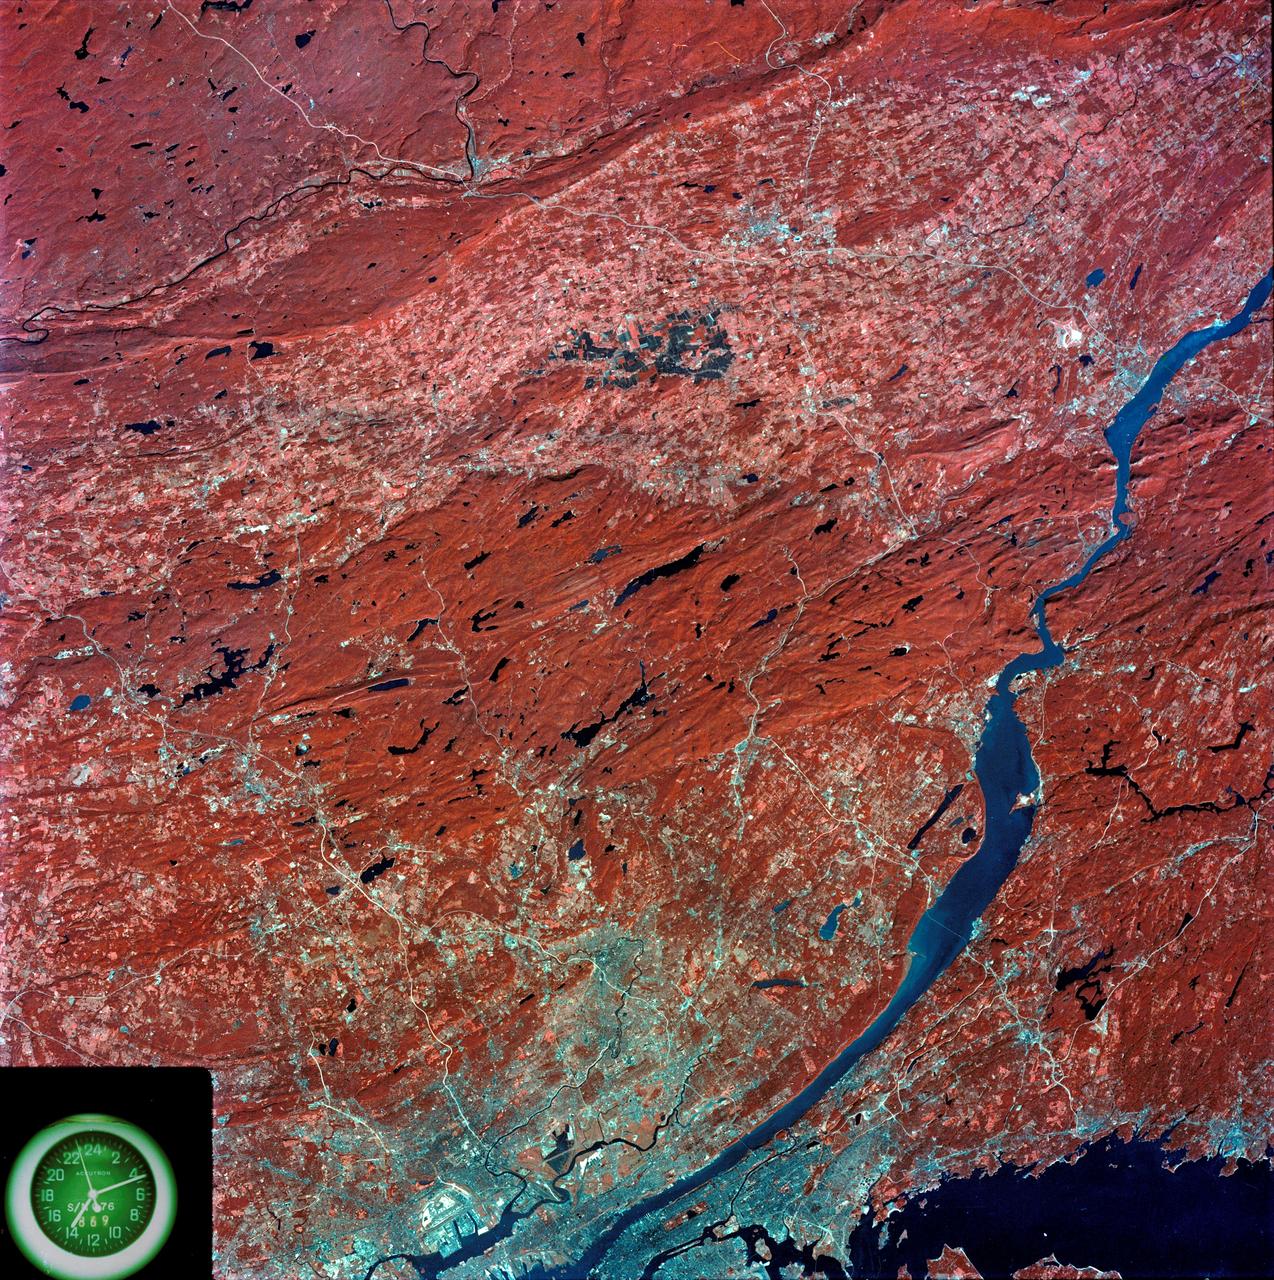
SL3-87-299 (July-September 1973) --- A vertical view of southeastern New York State is seen in this Skylab 3 Earth Resources Experiments Package S190-B (five-inch Earth terrain camera) infrared photograph taken from the Skylab space station in Earth orbit. An 18-inch, 450mm lens and type 2443 infrared Ektachrome film was used. This picture covers the northern part of New Jersey, a part of northwestern Pennsylvania, and the western tip of Connecticut. The body of water is Long Island Sound. The wide Hudson River flows southward across a corner of the photograph. The New York City metropolitan area occupies part of the picture. Federal agencies participating with NASA on the EREP project are the Departments of Agriculture, Commerce, Interior, the Environmental Protection Agency and the Corps of Engineers. All EREP photography is available to the public through the Department of Interior?s Earth Resources Observations Systems Data Center, Sioux Falls, South Dakota, 57198. Photo credit: NASA

VANDENBERG AFB, Calif. -- During a news conference at Vandenberg Air Force Base, Calif. prior to the launch of NASA's Landsat Data Continuity Mission, or LDCM, media representative heard from Dr. Thomas Loveland, senior scientist and co-chair of the Landsat Science Team U.S. Geological Survey Earth Resources Observation and Science Center, Kass Green, Landsat scientist and president of Kass Green and Associates, and Dr. Mike Wulder, senior research scientist of the Landsat Science Team Canadian Forest Service, Natural Resources Canada. The Landsat Data Continuity Mission LDCM is the future of Landsat satellites. It will continue to obtain valuable data and imagery to be used in agriculture, education, business, science, and government. The Landsat Program provides repetitive acquisition of high resolution multispectral data of the Earth's surface on a global basis. The data from the Landsat spacecraft constitute the longest record of the Earth's continental surfaces as seen from space. It is a record unmatched in quality, detail, coverage, and value. Liftoff is planned for Feb. 11, 2013 aboard a United Launch Alliance Atlas V rocket. For more information, visit: http:__www.nasa.gov_mission_pages_landsat_main_index.html Photo credit: NASA_Kim Shiflett
SL3-33-167 (July-September 1973) --- A vertical view of the Argentina-Paraguay border area of South America as photographed from Earth orbit by one of the six lenses of the Itek-furnished S190-A Multispectral Photographic Facility Experiment aboard the Skylab space station. This picture was taken with type 2443 infrared color film. The Parana River flows from east to west across the picture. This part of the Rio Parana is located between the towns of Posadas, Argentina, and Resistencia, Argentina. The major body of water in the large swamp area is Laguna Ibera. Note the several fires burning in this area. The largest land mass (Argentina) is south of the river. Paraguay is north of the river. Isla Apipe Grande is near the center of the photograph. The S190-A experiment is part of the Skylab Earth Resources Experiments Package. Federal agencies participating with NASA on the EREP project are the Departments of Agriculture, Commerce, Interior, the Environmental Protection Agency and the Corps of Engineers. All EREP photography is available to the public through the Department of Interior?s Earth Resources Observations Systems Data Center, Sioux Falls, South Dakota, 57198. Photo credit: NASA

SL3-33-156 (July-September 1973) --- A near vertical view of the Florence, Italy area as photographed from Earth orbit by one of the Itek-furnished S190-A Multispectral Photographic Facility Experiment aboard the Skylab space station. The view extends from the Ligurian Sea, an extension of the Mediterranean Sea, across the Apennine Mountains to the Po River Valley. Florence (Firenze) is near the center of the land mass. The mouth of the Arno River is at the center of the coastline. The city of Leghorn (Livorno) is on the coast just south of the Arno River. This picture was taken with type 2443 infrared color film. The S190-A experiment is part of the Skylab Earth Resources Experiments Package. Federal agencies participating with NASA on the EREP project are the Department of Agriculture, Commerce, Interior, the Environmental Protection Agency and the Corps of Engineers. All EREP photography is available to the public through the Department of Interior?s Earth Resources Observations Systems Data Center, Sioux Falls, South Dakota, 57198. Photo credit: NASA
SL3-45-020 (July-September 1973) --- A vertical view of the Virginia-Tennessee-Kentucky border area as photographed from Earth orbit by one of the six lenses of the Itek-furnished S190-A Multispectral Photographic Facility Experiment aboard the Skylab space station. This picture was taken with type 2443 infrared color film. The S190-A experiment is part of the Skylab Earth Resources Experiments Package. The long, narrow ridge is Pine Mountain; and it is crossed by U.S. 25E at Pineville near its southernmost end. Some 25 miles south of Pineville U.S. 25E passes through the famed Cumberland Gap which at 1,600 feet elevation crosses Cumberland Mountain. Kingsport, Tennessee is located east of Cumberland Gap near the center of the picture. Bristol, Tennessee-Virginia is further east. Greenville and Elizabethton, Tennessee can also be seen in this photograph. The clouds across the southeast edge of the picture are over the Blue Ridge Mountains. Federal agencies participating with NASA on the EREP project are the Departments of Agriculture, Commerce, Interior, the Environmental Protection Agency and the Corps of Engineers. All EREP photography is available to the public through the Department of Interior?s Earth Resources Observations Systems Data Center, Sioux Falls, 57198. Photo credit: NASA
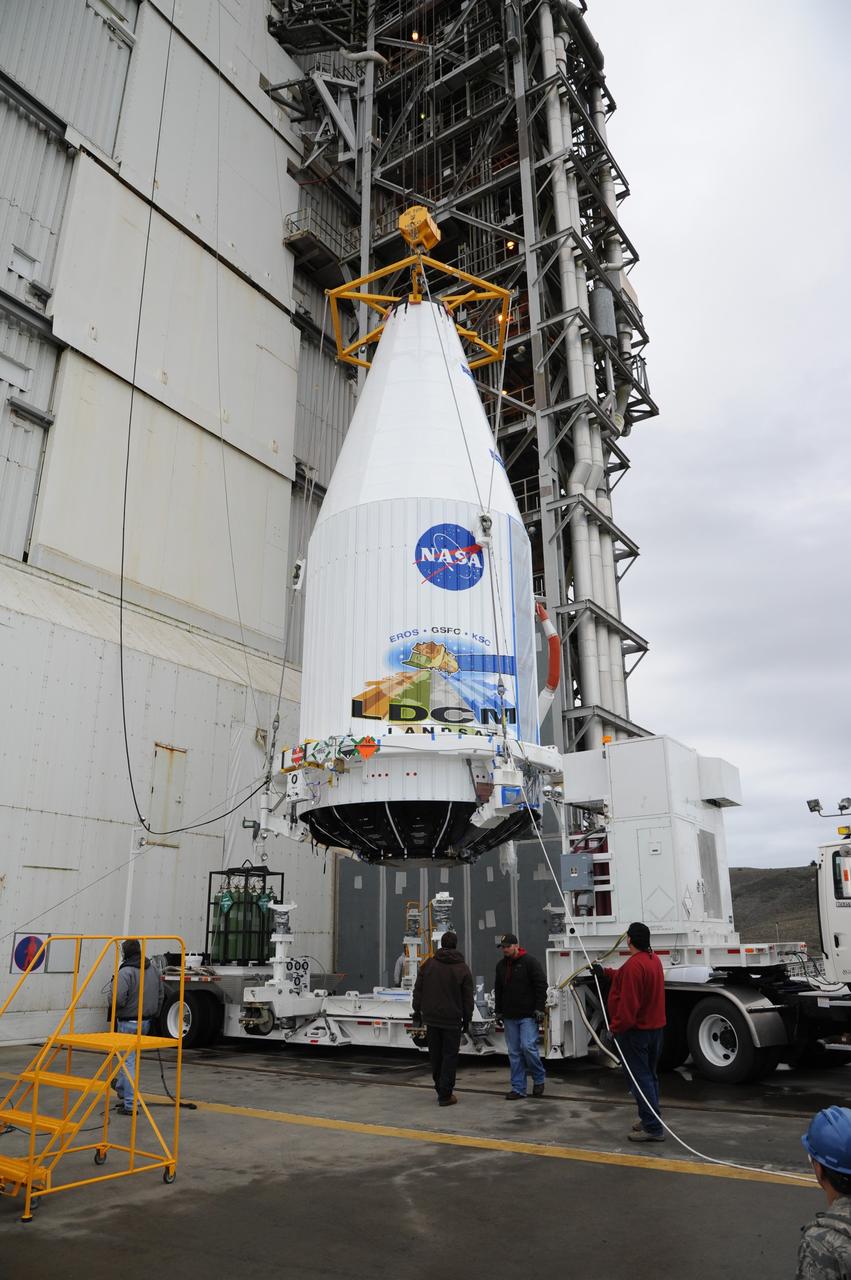
VANDENBERG AIR FORCE BASE, Calif. ---The payload faring containing the Landsat Data Continuity Mission LDCM spacecraft is lifted from a transporter at Vandenberg Air Force Base's Space Launch Complex-3E where it will be hoisted atop a United Launch Alliance Atlas V for launch. LDCM is the eighth satellite in the Landsat Program series of Earth-observing missions jointly managed by NASA and the U.S. Geological Survey. LDCM will continue the program’s critical role in monitoring, understanding and managing the resources needed for human sustainment such as food, water and forests. Photo credit: NASA/VAFB
SL2-10-250 (May-June 1973) --- A vertical view of eastern Iowa and northwestern Illinois, as photographed from Skylab space station in Earth orbit. Davenport, Burlington and Muscatine, Iowa; and Rock Island and Moline, Illinois can be delineated on opposite sides of the Mississippi River. The Iowa River and tributaries of it can also be delineated. This photograph was taken with one of six lenses of the Itek-furnished Multispectral Photographic Facility Experiment S190-A mounted in the Multiple Docking Adapter (MDA) of the space station. A six-inch lens, using 70mm medium speed Ektachrome (SO-356) film, was used. Agencies participating with NASA on the EREP project are the Departments of Agriculture, Commerce and Interior; the Environmental Protection Agency and the Corps of Engineers. All EREP photography is available to the public through the Department of Interior's Earth Resources Observations Systems Data Center, Sioux Falls, South Dakota, 57198. Photo credit: NASA
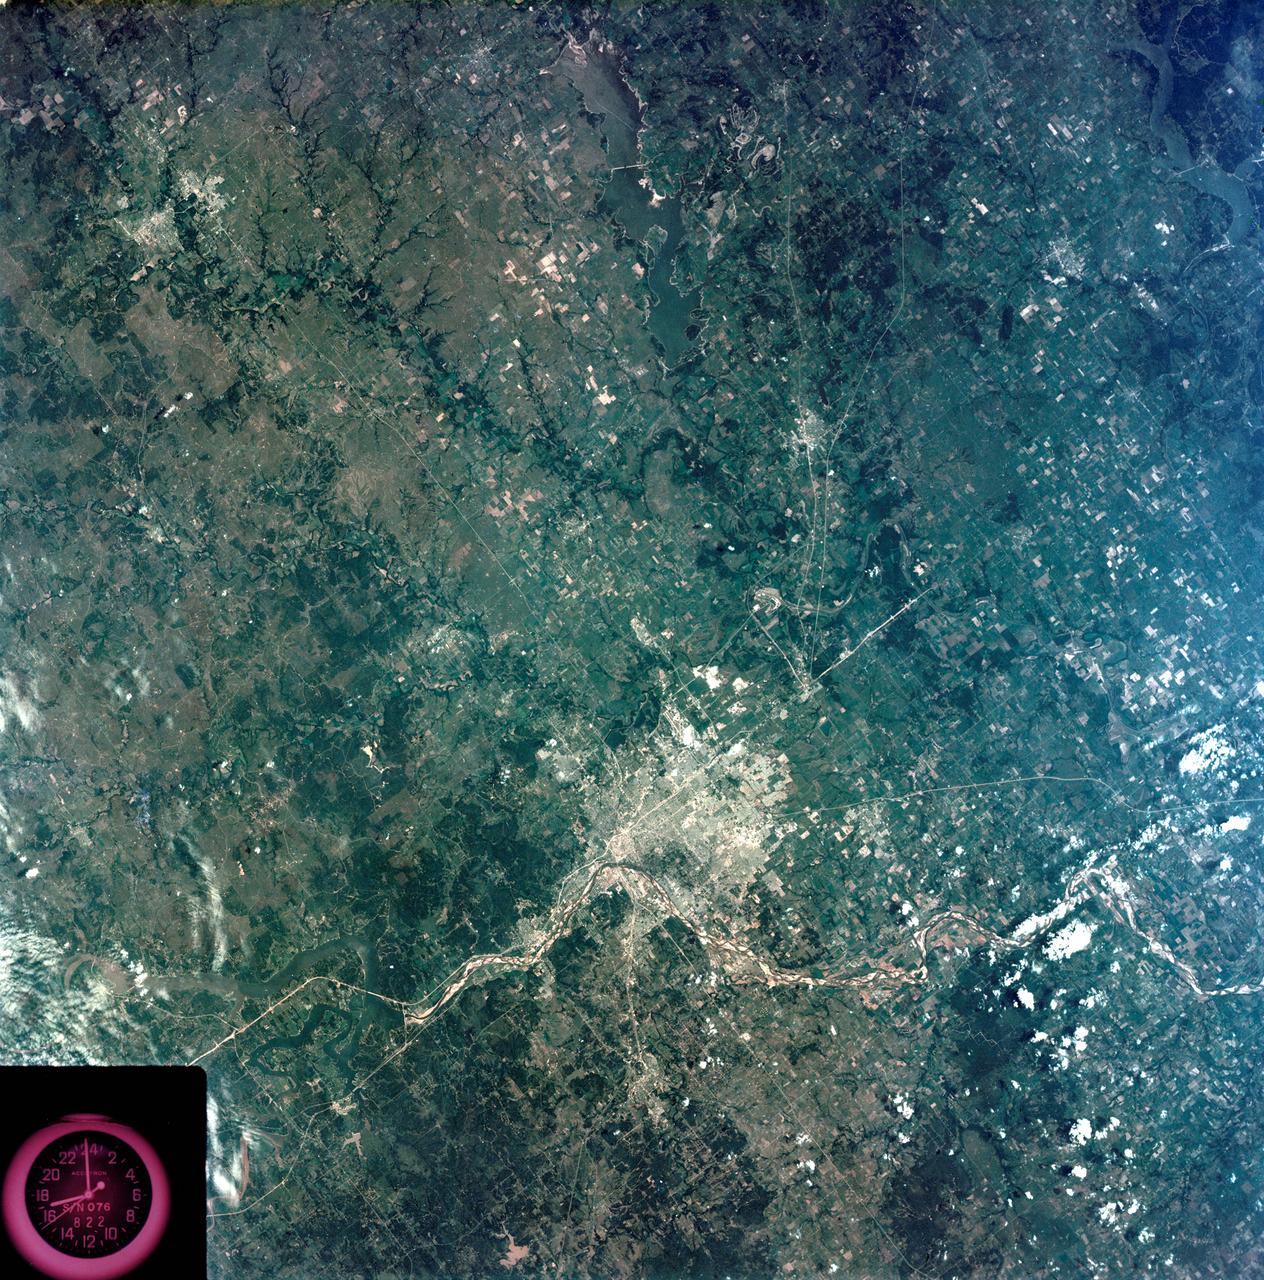
S73-35080 (July-September 1973) --- A vertical view of northeast Oklahoma and the metropolitan Tulsa area is seen in this Skylab 3 Earth Resources Experiments Package S190-B (five-inch Earth terrain camera) photograph taken from the Skylab space station in Earth orbit. THE PICTURE SHOULD BE HELD WITH THE CLOCK ON THE LEFT AND THE LAKE IN THE CORNER ON THE RIGHT. THE LONG STRETCH OF HIGHWAY (U.S. 75) RUNS STRAIGHT NORTH FROM TULSA. Tulsa, a rapidly expanding city in the heart of the mid-continent oil field, has a population of approximately 330,000. The Arkansas River meanders across the southern (lower) portion of the photograph passing through Tulsa as it flows southeastward. Oologah Reservoir, the long body of water, is located northeast of Tulsa. Lake Hudson is the body of water in the right corner of the picture. Keystone Reservoir is to the west and upstream from Tulsa. Westward from Tulsa U.S. 64 makes a 45 degree bend as it turns northwest to cross the Keystone Reservoir. The thin white line over the Oologah Reservoir is a highway bridge. Bartlesville is on U.S. 75 near the north (top) corner of the picture. The Tulsa International Airport is immediately northeast of downtown Tulsa. Several smaller airfields are visible in the surrounding area. The toll roads and other major highways are clearly visible in the picture. Claremore is northeast of Tulsa on U.S. 66 with the Will Rogers Turnpike passing nearby. Sapulpa is southwest of Tulsa on the Turner Turnpike which leads toward Oklahoma City. The detailed information contained in this photograph can be extracted by direct observation and applied to updating land use and cultural maps of Tulsa and to numerous surrounding satellite cities. All EREP photography is available to the public through the Department of Interior?s Earth Resources Observations Systems Data Center, Sioux Falls, South Dakota, 57198. (Alternate number SL3-83-206) Photo credit: NASA
The Gravity Recovery and Climate Experiment Follow-On (GRACE-FO) twin satellites, attached to turntable fixtures, at the Astrotech Space Operations processing facility at Vandenberg Air Force Base, California. GRACE-FO will extend GRACE's legacy of scientific achievements, which range from tracking mass changes of Earth's polar ice sheets and estimating global groundwater changes, to measuring the mass changes of large earthquakes and inferring changes in deep ocean currents, a driving force in climate. To date, GRACE observations have been used in more than 4,300 research publications. Its measurements provide a unique view of the Earth system and have far-reaching benefits to society, such as providing insights into where global groundwater resources may be shrinking or growing and where dry soils are contributing to drought. GRACE-FO is planned to fly at least five years. https://photojournal.jpl.nasa.gov/catalog/PIA22340
The Gravity Recovery and Climate Experiment Follow-On (GRACE-FO) twin satellites, attached to turntable fixtures, at the Astrotech Space Operations processing facility at Vandenberg Air Force Base, California. GRACE-FO will extend GRACE's legacy of scientific achievements, which range from tracking mass changes of Earth's polar ice sheets and estimating global groundwater changes, to measuring the mass changes of large earthquakes and inferring changes in deep ocean currents, a driving force in climate. To date, GRACE observations have been used in more than 4,300 research publications. Its measurements provide a unique view of the Earth system and have far-reaching benefits to society, such as providing insights into where global groundwater resources may be shrinking or growing and where dry soils are contributing to drought. GRACE-FO is planned to fly at least five years. https://photojournal.jpl.nasa.gov/catalog/PIA22341
SL3-27-224 (July-September 1973) --- A vertical view of the western portion of the Republic of Panama on the Isthmus of Panama as photographed from Earth orbit by one of the six lenses of the Itek-furnished S190-A Multispectral Photographic Facility Experiment aboard the Skylab space station. This picture was taken with 2443 infrared color film. The large, clear body of water on the north side of the isthmus is Golfo de los Mosquitos, an extension of the Caribbean Sea. The large, partly cloud-covered body of water on the south side of the isthmus is Golfo de Chiriqui, an extension of the Pacific Ocean. Federal agencies participating with NASA on the EREP project are the Department of Agriculture, Commerce, Interior, the Environmental Protection Agency and the Corps of Engineers. All EREP photography is available to the public through the Department of Interior?s Earth Resources Observation Systems Data Center, Sioux Falls, South Dakota, 57198. Photo credit: NASA
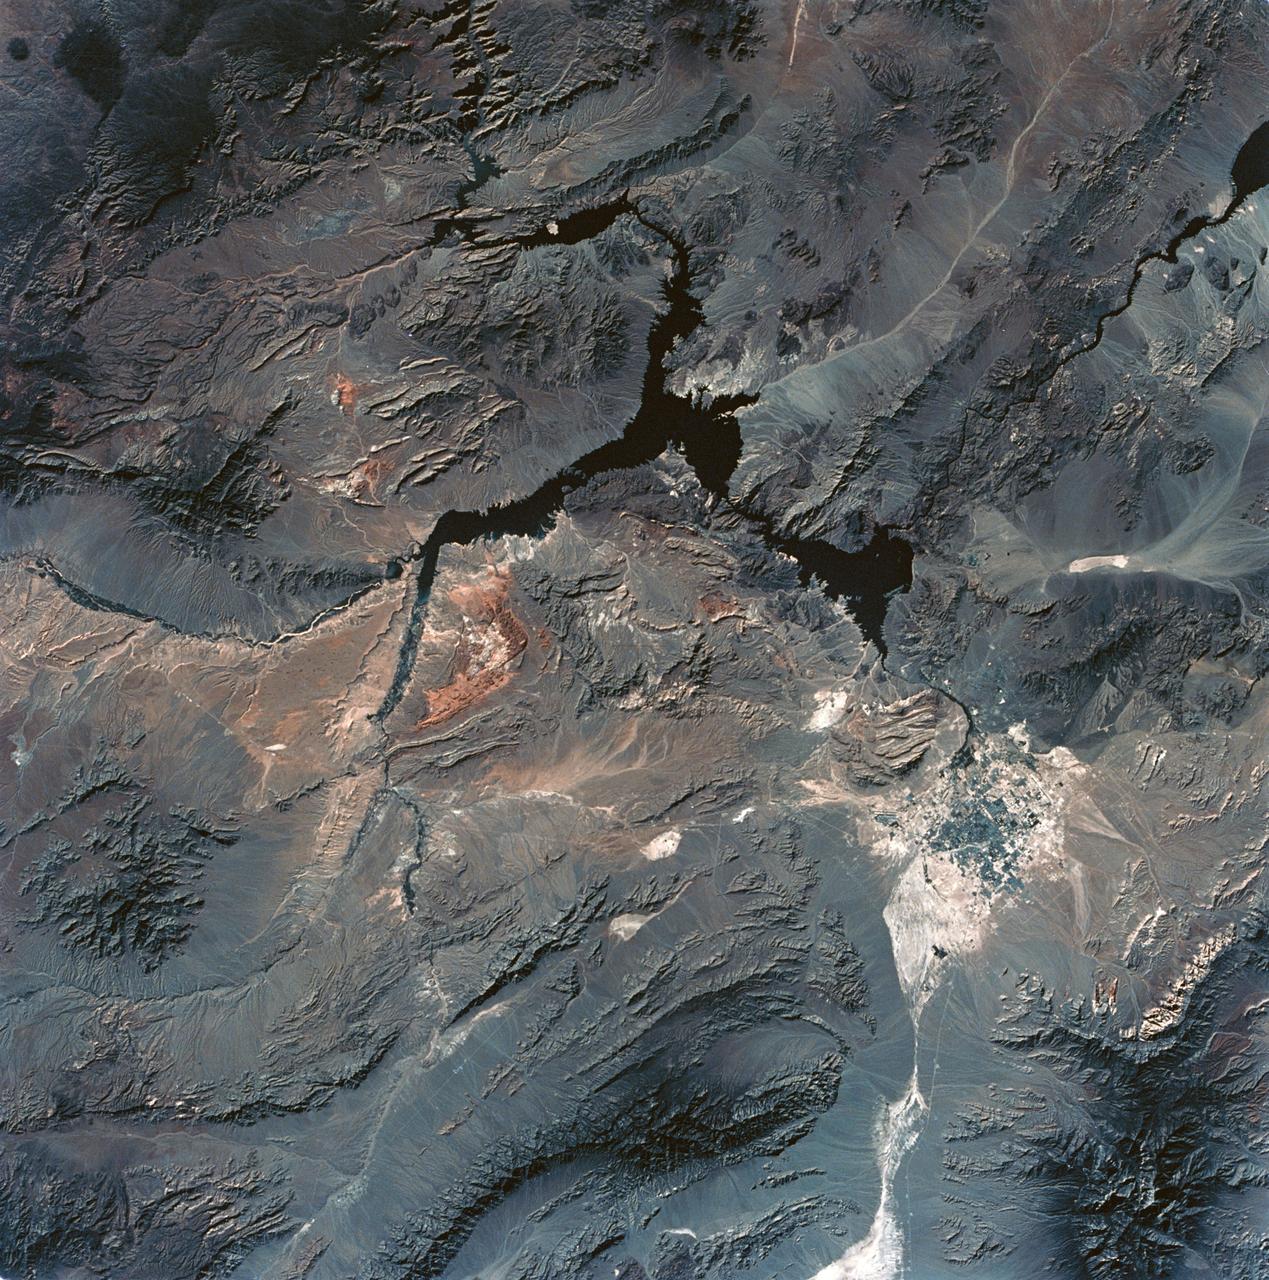
SL3-28-059 (July-September 1973) --- A vertical view of the Lake Mead and Las Vegas, Nevada area as photographed from Earth orbit by one of the six lenses of the Itek-furnished S190-A Multispectral Photographic Facility Experiment aboard the Skylab space station. Lake Mead is water of the Colorado River impounded by Hoover Dam. Most of the land in the picture is Nevada. However, a part of the northwest corner of Arizona can be seen. Federal agencies participating with NASA on the EREP project are the Departments of Agriculture, Commerce, Interior, the Environmental Protection Agency and the Corps of Engineers. All EREP photography is available to the public through the Department of Interior?s Earth Resources Observations Systems Data Center, Sioux Falls, South Dakota, 57198. Photo credit: NASA

The Gravity Recovery and Climate Experiment Follow-On (GRACE-FO) twin satellites, attached to turntable fixtures, at the Astrotech Space Operations processing facility at Vandenberg Air Force Base, California. GRACE-FO will extend GRACE's legacy of scientific achievements, which range from tracking mass changes of Earth's polar ice sheets and estimating global groundwater changes, to measuring the mass changes of large earthquakes and inferring changes in deep ocean currents, a driving force in climate. To date, GRACE observations have been used in more than 4,300 research publications. Its measurements provide a unique view of the Earth system and have far-reaching benefits to society, such as providing insights into where global groundwater resources may be shrinking or growing and where dry soils are contributing to drought. GRACE-FO is planned to fly at least five years. https://photojournal.jpl.nasa.gov/catalog/PIA22338
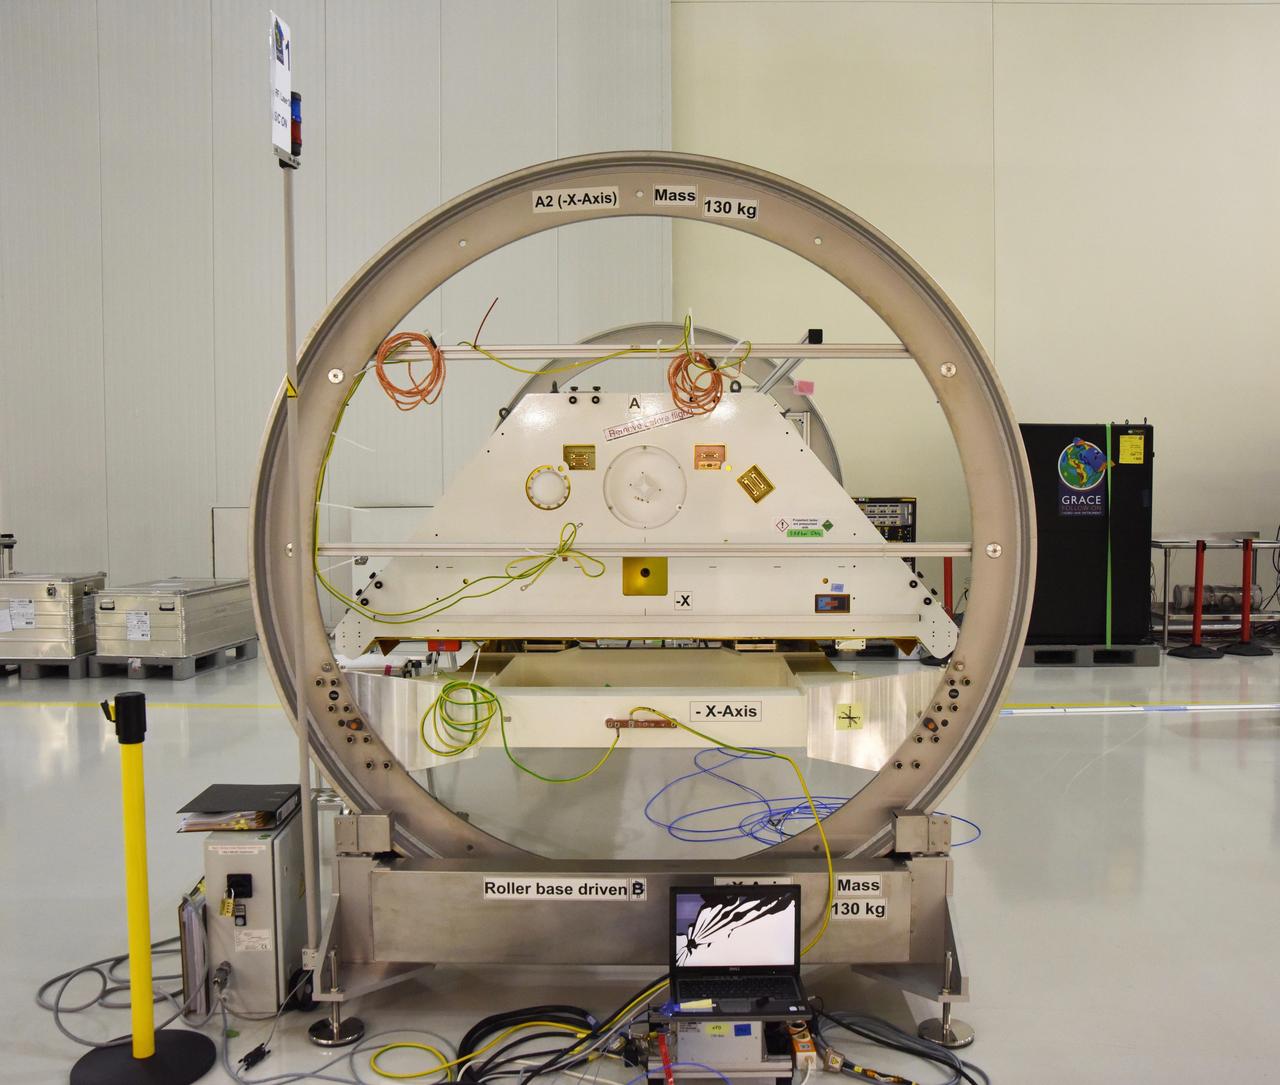
One of the two Gravity Recovery and Climate Experiment Follow-On (GRACE-FO) satellites and its turntable fixture at the Astrotech Space Operations processing facility at Vandenberg Air Force Base, California. GRACE-FO will extend GRACE's legacy of scientific achievements, which range from tracking mass changes of Earth's polar ice sheets and estimating global groundwater changes, to measuring the mass changes of large earthquakes and inferring changes in deep ocean currents, a driving force in climate. To date, GRACE observations have been used in more than 4,300 research publications. Its measurements provide a unique view of the Earth system and have far-reaching benefits to society, such as providing insights into where global groundwater resources may be shrinking or growing and where dry soils are contributing to drought. GRACE-FO is planned to fly at least five years. https://photojournal.jpl.nasa.gov/catalog/PIA22339
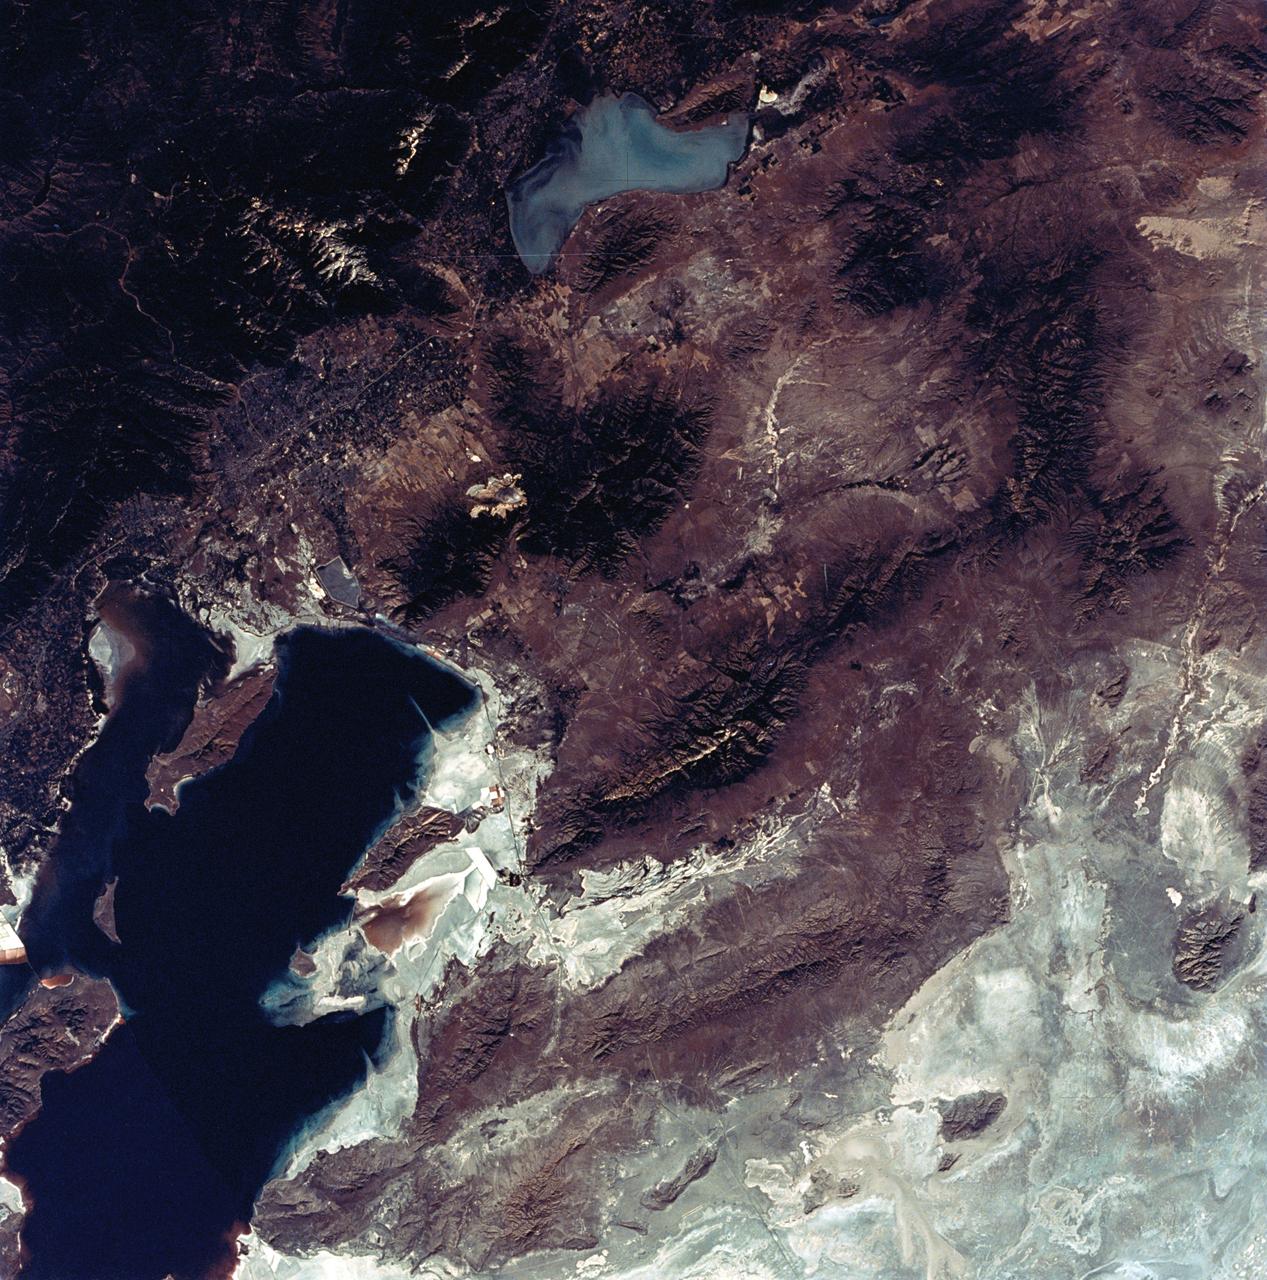
SL3-22-0322 (July-September 1973) --- An oblique view of the Salt Lake City, Utah area as photographed from Earth orbit by one of the six lenses of the Itek-furnished S190-A Multispectral Photographic Facility Experiment aboard the Skylab space station. Approximately two-thirds of the Great Salt Lake is in view. The smaller body of water south of Salt Lake City is Utah Lake. The Wasatch Range is on the east side of the Great Salt Lake. Federal agencies participating with NASA on the EREP project are the Departments of Agriculture, Commerce, Interior, the Environmental Protection Agency and the Corps of Engineers. All EREP photography is available to the public through the Department of Interior?s Earth Resources Observations Systems Data Center, Sioux Falls, South Dakota, 57198. Photo credit: NASA
SL3-27-180 (July-September 1973) --- A vertical view of the Snowy Mountains area of Australian Alps in the States of Victoria and New South Wales, Australia, as photographed from Earth orbit by one of the six lenses of the Itek-furnished S190-A Multispectral Photographic Facility Experiment aboard the Skylab space station. This picture was taken with type 2443 infrared color film. The lake near the center of the picture is the Eucumbene Reservoir. This area is located immediately south-southwest of the capital city of Canberra. Federal agencies participating with NASA on the EREP project are the Departments of Agriculture, Commerce, Interior, the Environmental Protection Agency and the Corps of Engineers. All EREP photography is available to the public through the Department of Interior?s Earth Resources Observations Systems Data Center, Sioux Falls, South Dakota, 57198. Photo credit: NASA
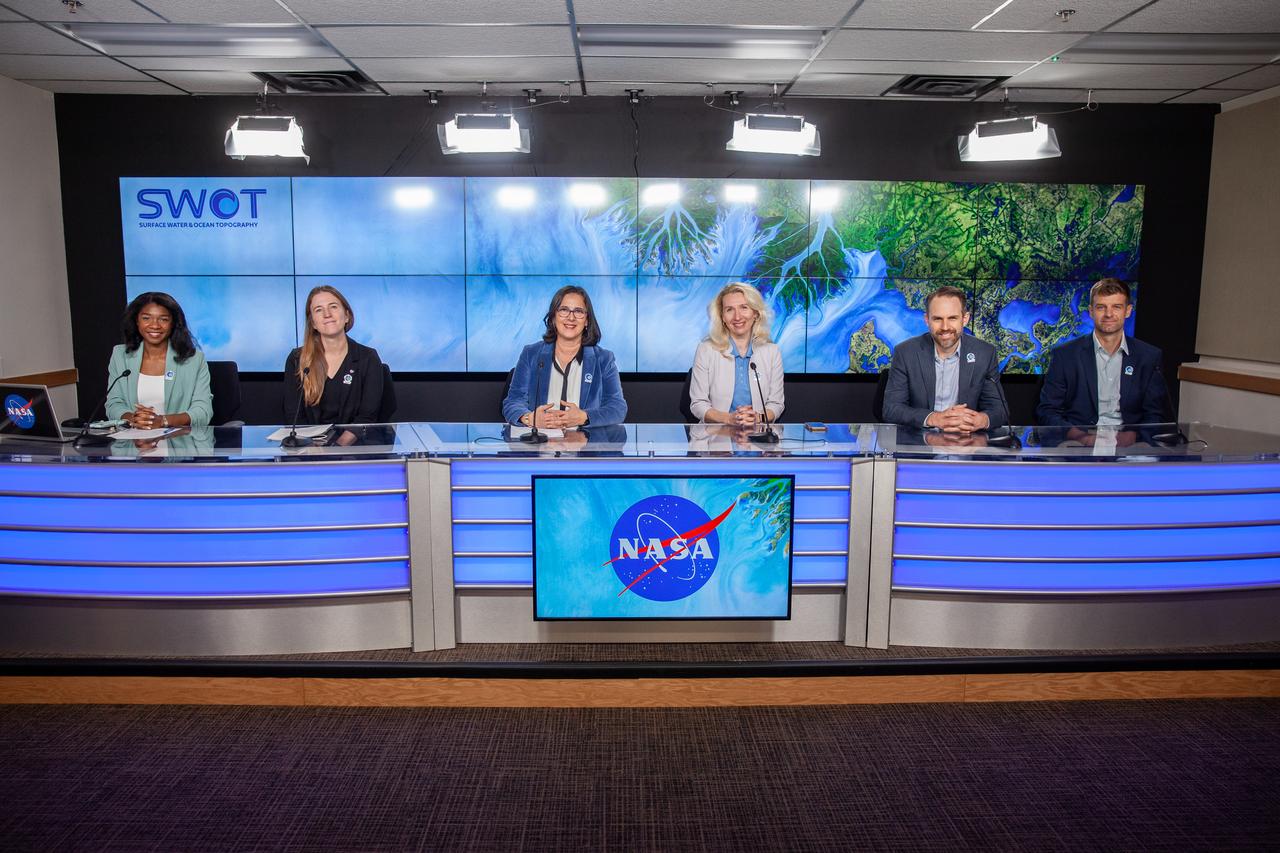
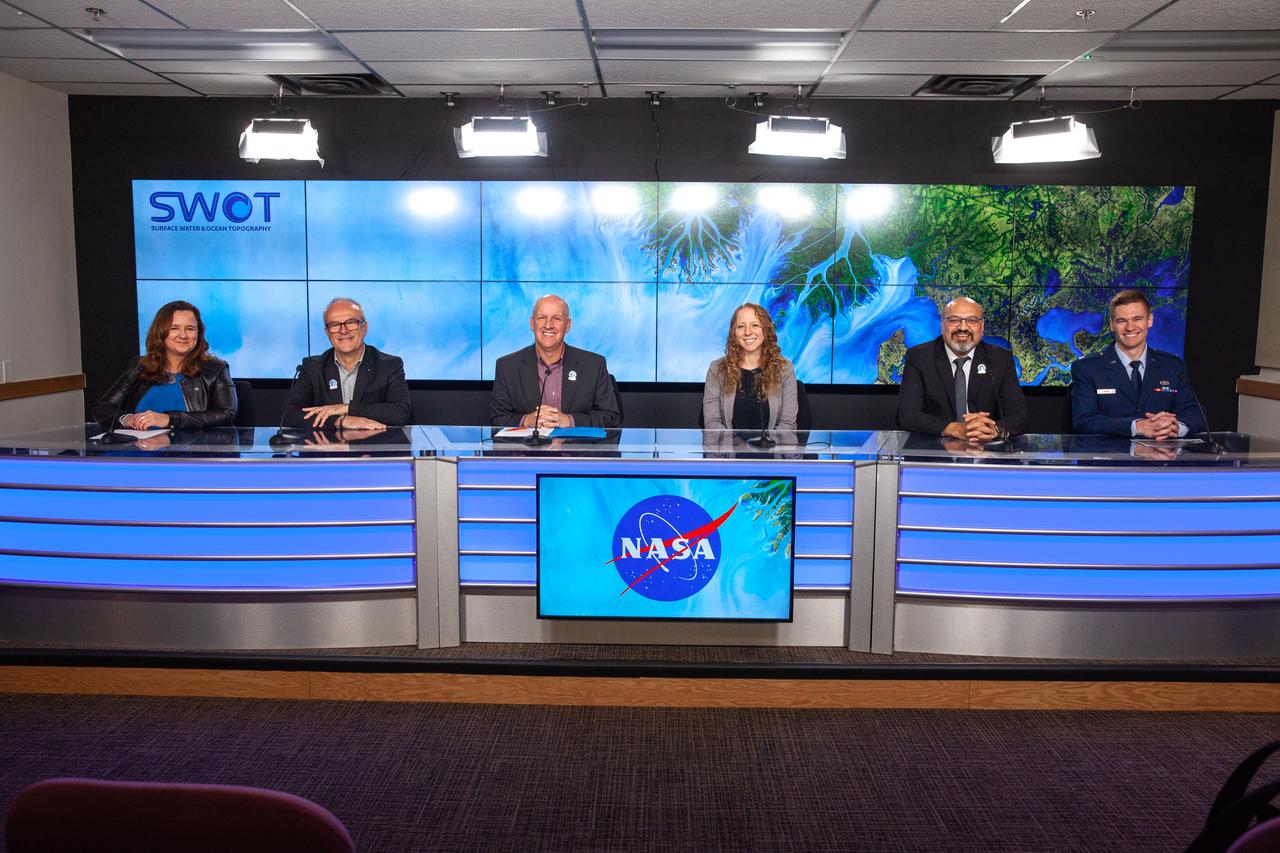
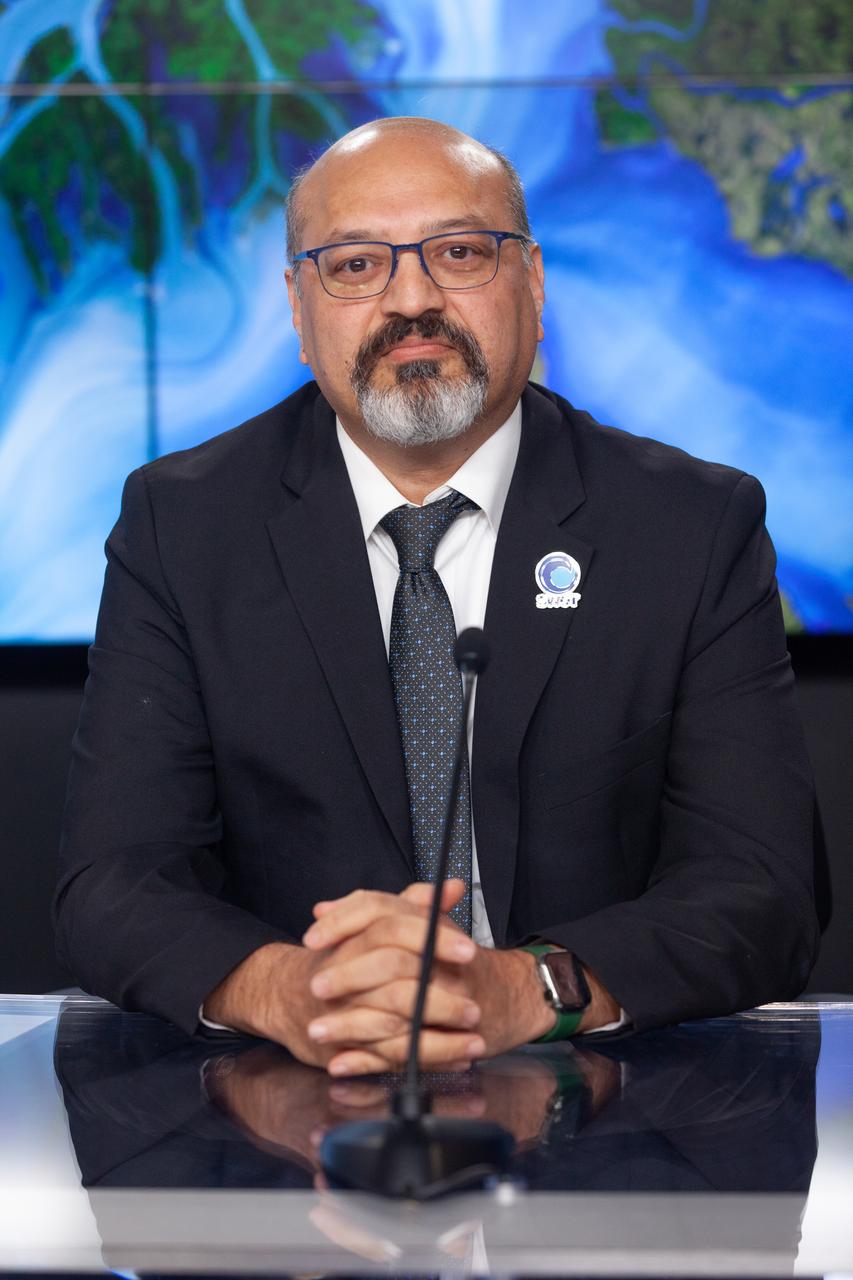
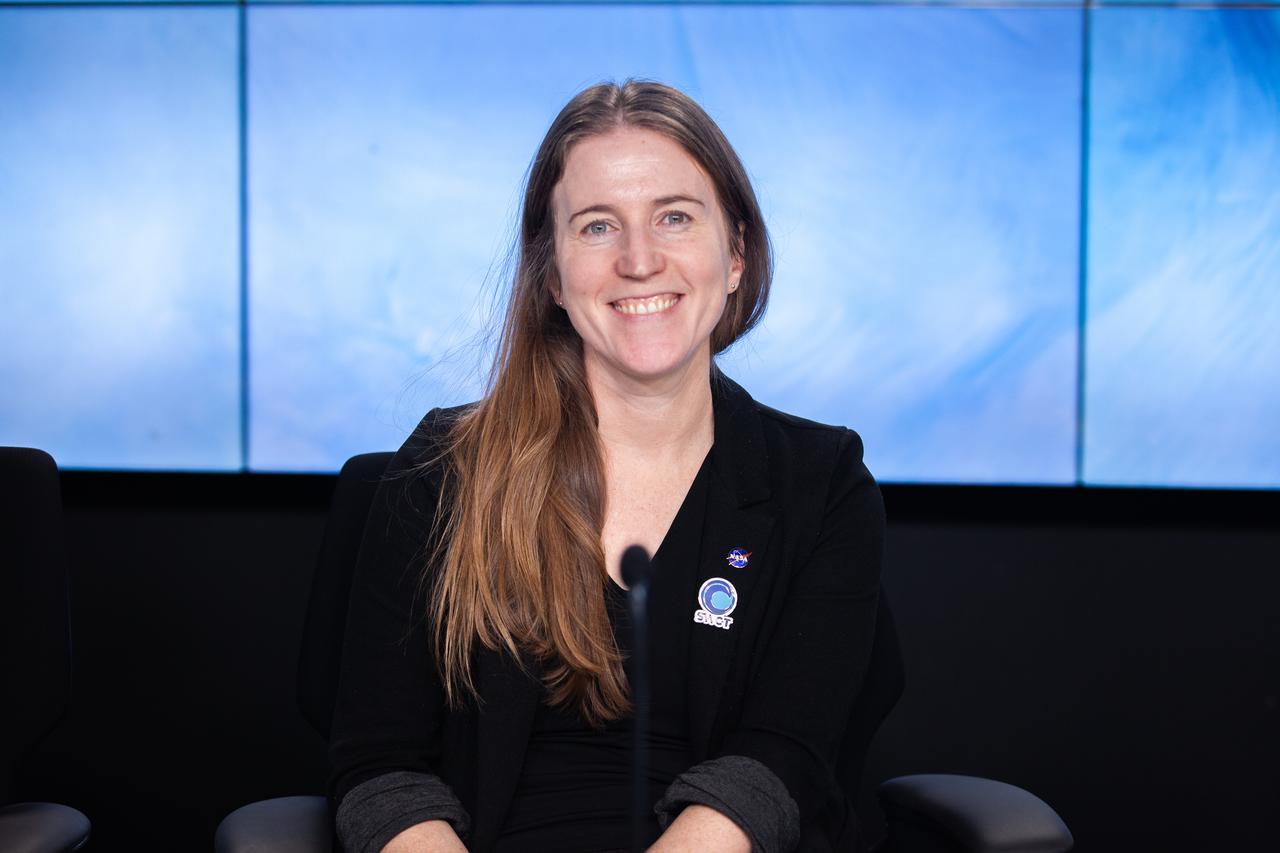
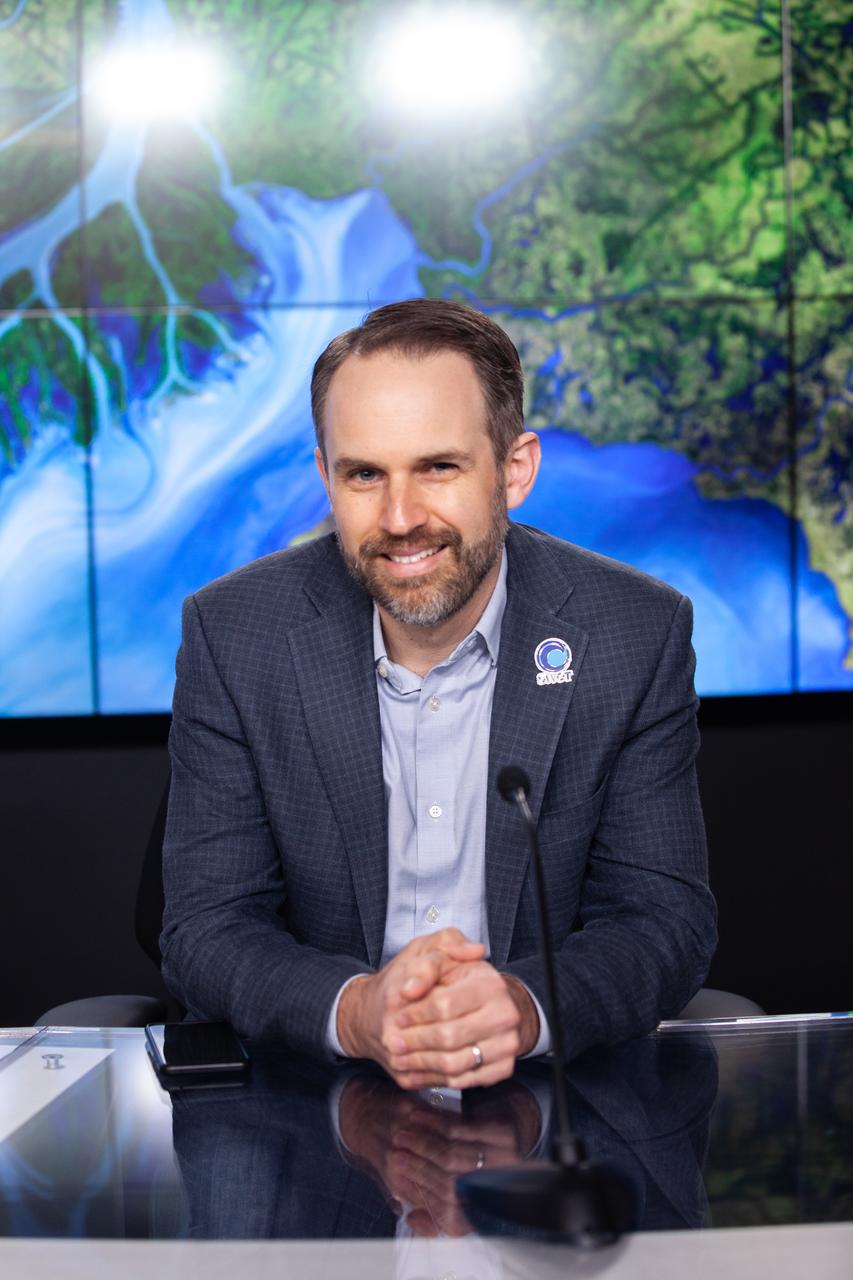
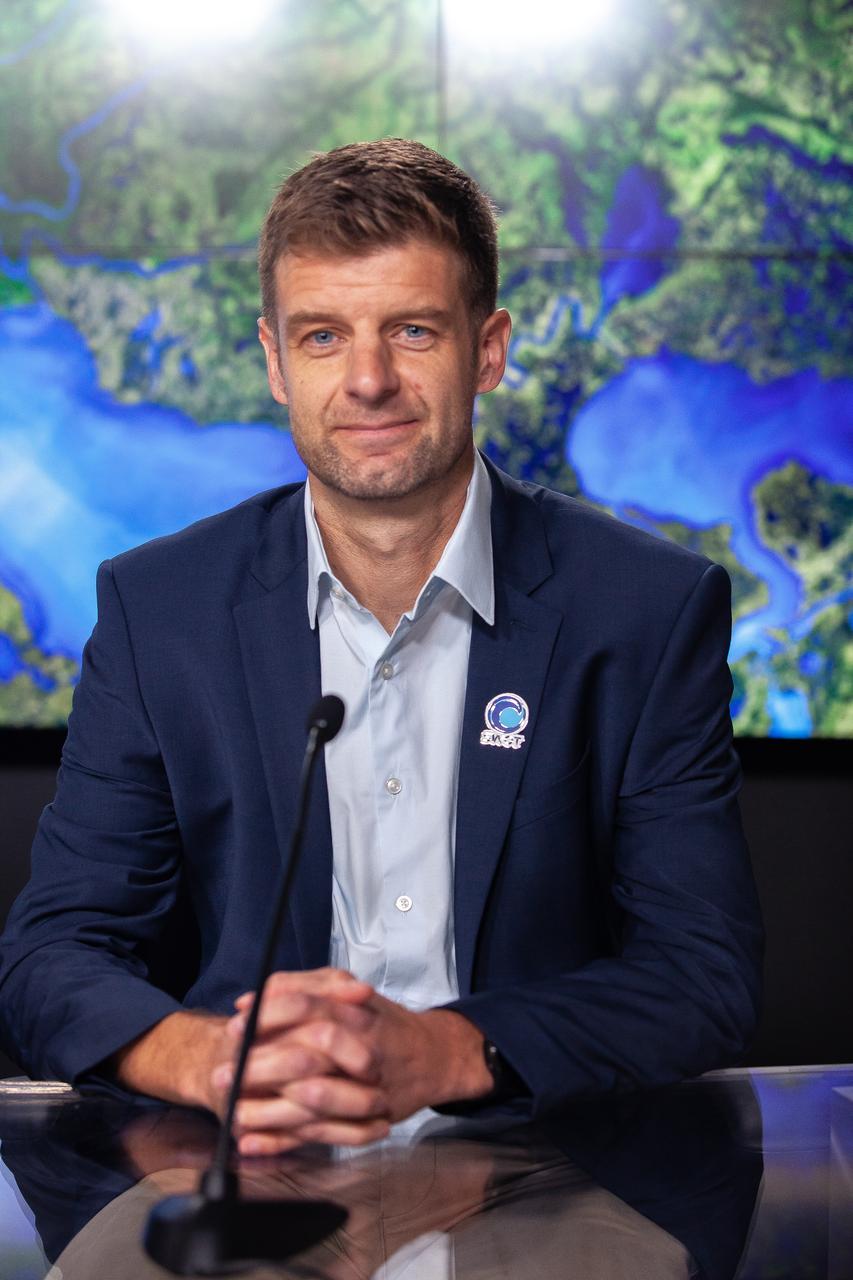
NASA and the French space agency Centre National d’Études Spatiales (CNES) hold a science briefing on the Surface Water and Ocean Topography (SWOT) mission on Dec. 13, 2022, at Vandenberg Space Force Base in California. Participating from left are Katherine Calvin, chief scientist and senior climate advisor, NASA; Selma Cherchali, Earth observation program head, CNES; Nadya Vinogradova Shiffer, SWOT program scientist, NASA; Tamlin Pavelsky, SWOT hydrology science lead, University of North Carolina; Benjamin Hamlington, research scientist, Sea Level and Ice Group, Jet Propulsion Laboratory. SWOT is scheduled to launch on a SpaceX Falcon 9 rocket from Space Launch Complex-4 East at Vandenberg on Dec. 15, 2022, at 3:46 a.m. PST. SWOT will be NASA’s first global survey of nearly all water on Earth’s surface. Scientists plan to use its observations to better understand the global water cycle, furnish insight into the ocean’s role in how climate change unfolds, and provide a global inventory of water resources. The SWOT mission is a collaborative effort between NASA and CNES with contributions from the Canadian Space Agency and the UK Space Agency. NASA’s Launch Services Program, based at the agency’s Kennedy Space Center in Florida, is managing the launch service.

NASA and the French space agency Centre National d’Études Spatiales (CNES) hold a science briefing on the Surface Water and Ocean Topography (SWOT) mission on Dec. 13, 2022, at Vandenberg Space Force Base in California. Participating from left are Katherine Calvin, chief scientist and senior climate advisor, NASA; Selma Cherchali, Earth observation program head, CNES; Nadya Vinogradova Shiffer, SWOT program scientist, NASA; Tamlin Pavelsky, SWOT hydrology science lead, University of North Carolina; Benjamin Hamlington, research scientist, Sea Level and Ice Group, Jet Propulsion Laboratory. SWOT is scheduled to launch on a SpaceX Falcon 9 rocket from Space Launch Complex-4 East at Vandenberg on Dec. 15, 2022, at 3:46 a.m. PST. SWOT will be NASA’s first global survey of nearly all water on Earth’s surface. Scientists plan to use its observations to better understand the global water cycle, furnish insight into the ocean’s role in how climate change unfolds, and provide a global inventory of water resources. The SWOT mission is a collaborative effort between NASA and CNES with contributions from the Canadian Space Agency and the UK Space Agency. NASA’s Launch Services Program, based at the agency’s Kennedy Space Center in Florida, is managing the launch service.
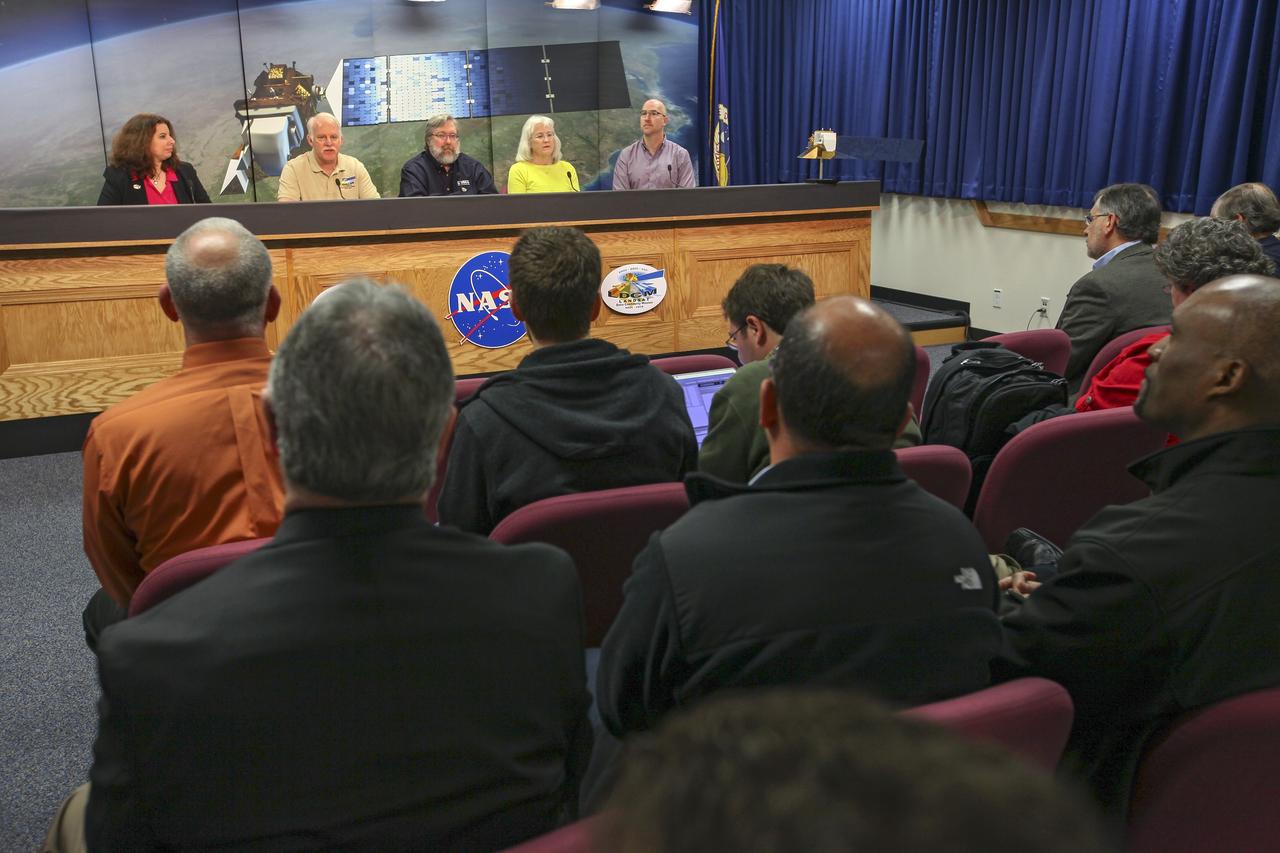
VANDENBERG AIR FORCE BASE, Calif. -- Media attend a mission science briefing at Vandenberg Air Force Base in California in preparation for the launch of the Landsat Data Continuity Mission LDCM. From left are Rani Gran of NASA Public Affairs, LDCM project scientist Dr. Jim Irons from NASA's Goddard Space Flight Center, senior scientist and co-chair of the Landsat Science Team U.S. Geological Survey Earth Resources Observation and Science EROS Center Dr. Thomas Loveland, Landsat scientist and president of Kass Green and Associates Kass Green, and senior research scientist Dr. Mike Wulder of the Landsat Science Team Canadian Forest Service, Natural Resources Canada. Launch of LDCM aboard a United Launch Alliance Atlas V rocket from Vandenberg's Space Launch Complex-3E is planned for Feb. 11 during a 48-minute launch window that opens at 10:02 a.m. PST, or 1:02 p.m. EST. LDCM is the eighth satellite in the Landsat Program series of Earth-observing missions and will continue the program’s critical role in monitoring, understanding and managing the resources needed for human sustainment, such as food, water and forests. NASA's Goddard Space Flight Center in Greenbelt, Md., is responsible for LDCM project management. Orbital Sciences Corp. built the LDCM satellite. NASA's Launch Services Program at the Kennedy Space Center in Florida provides launch management. After launch and the initial checkout phase, the U. S. Geological Survey will take operational control of LDCM, and it will be renamed Landsat 8. Photo credit: NASA/Kim Shiflett
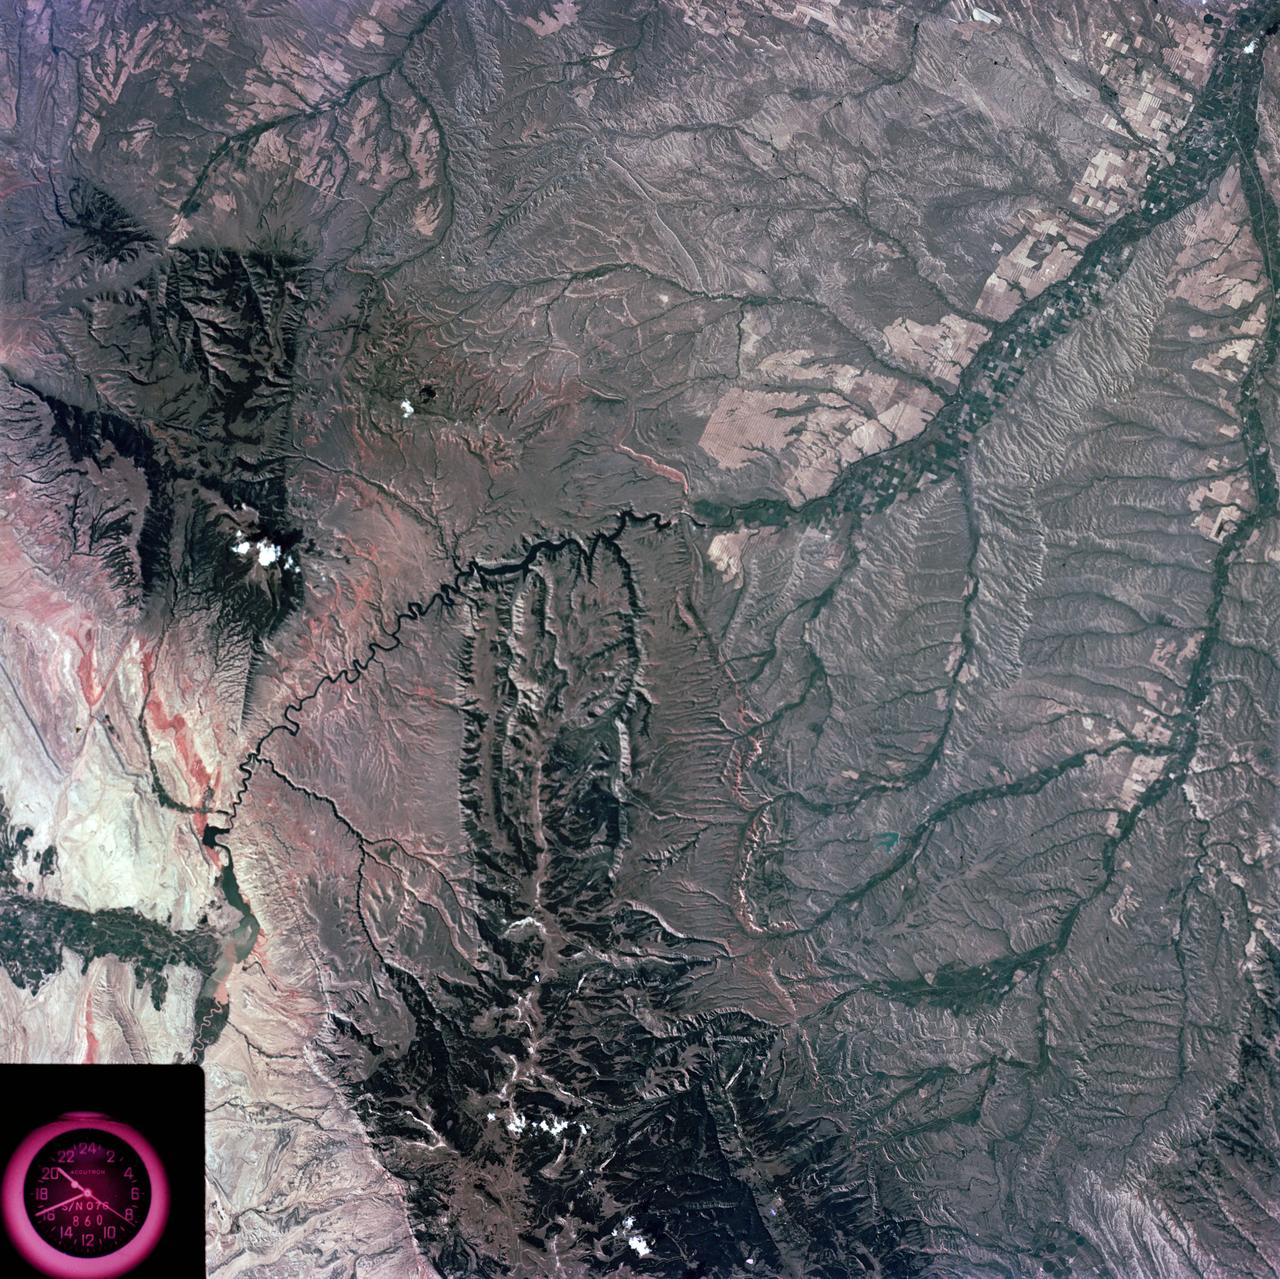
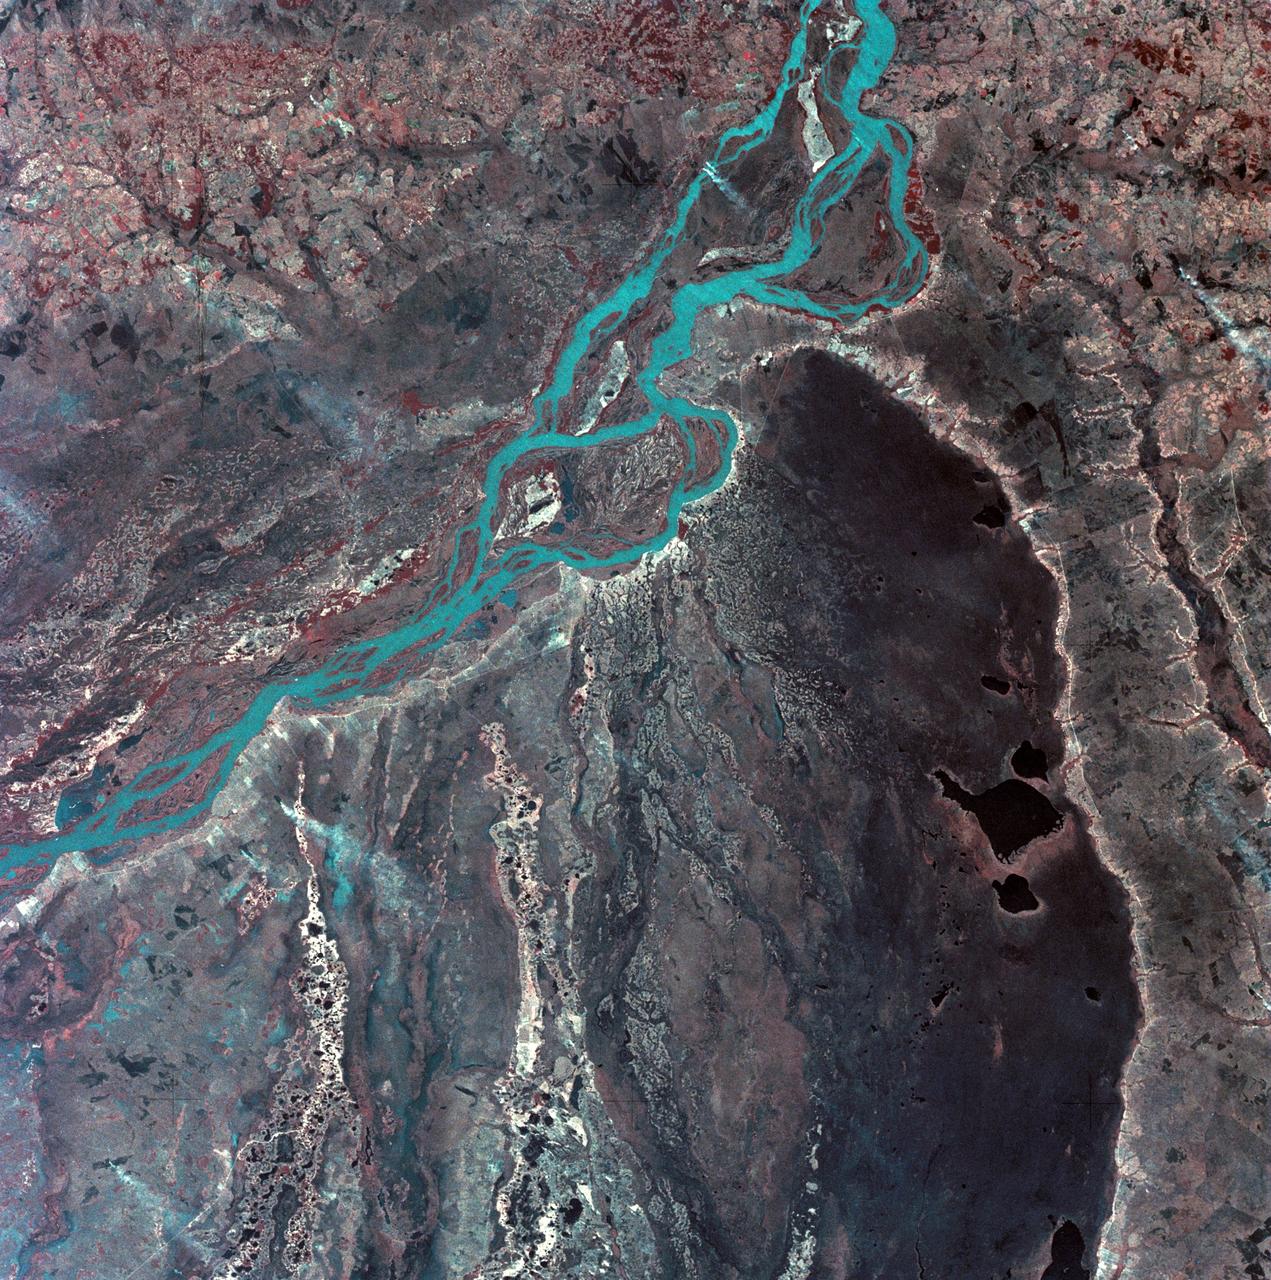
S73-35081 (July-September 1973) --- A view of approximately 3,600 square miles of north central Wyoming and southern Montana is seen in this Skylab 3 Earth Resources Experiments Package S190-B (five-inch Earth terrain camera) photograph taken from the Skylab space station in Earth orbit. The Big Horn River following northward crosses between the northwest trending Big Horn Mountains and the Pryor Mountains. Yellowtail Reservoir, named after a former chief of the Crow Indian tribe in the center of the picture is impounded by a dam across the small rectangular crop area along the Big Horn River (upper right) and the strip farming (yellow) practiced on the rolling hill along the Big Horn River and its tributaries (upper left corner and right edge). The low sun angle enhances the structural features of the mountains as well as the drainage patterns in the adjacent basins. Rock formation appears in this color photograph as they would to the eye from this altitude. The distinctive redbeds can be traced along the front of the Pryor Mountains and indicate the folding that occurred during mountain building. EREP investigators, Dr. Houston of the University of Wyoming and Dr. Hoppin of the University of Iowa, will analyze the photograph and use the results in geological mapping and mineral resource studies. Lowell, Wyoming (lower left corner) and Hardin, Montana (upper right corner) can be recognized. Federal agencies participating with NASA on the EREP project are the Departments of Agriculture, Commerce, Interior, the Environmental Protection Agency and the Corps of Engineers. All EREP photography is available to the public through the Department of Interior?s Earth Resources Observations Systems Data Center, Sioux Falls, South Dakota, 57198. (Alternate number SL3-86-337) Photo credit: NASA
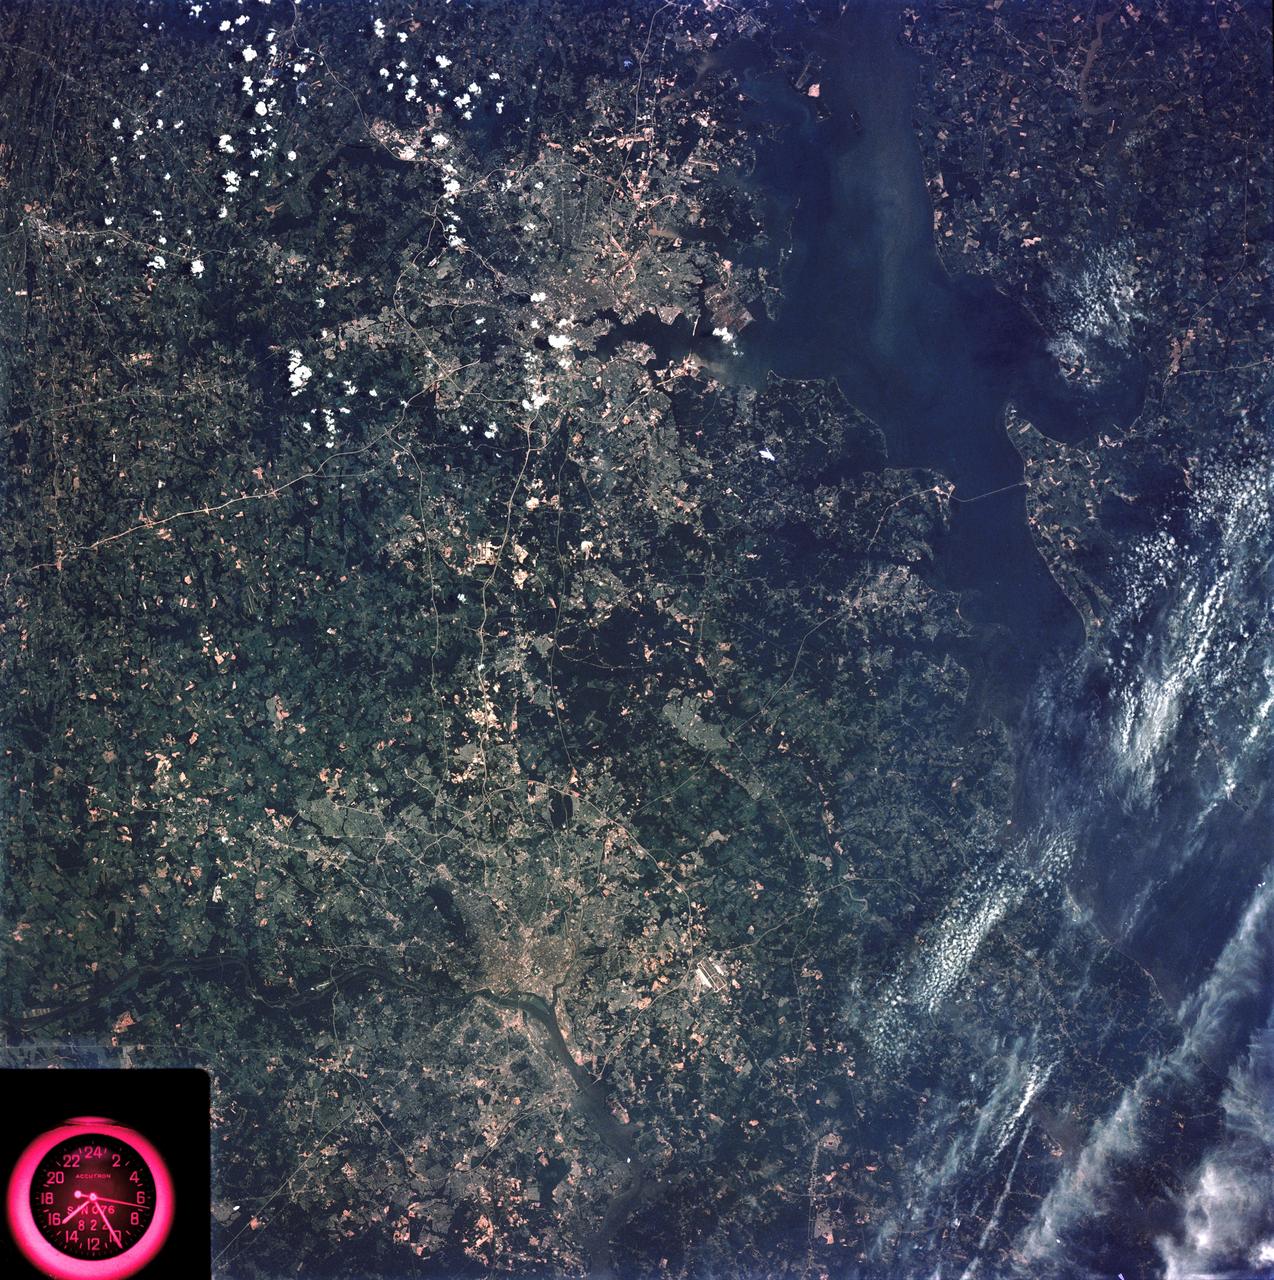
SL3-83-166 (July-September 1973) --- A vertical view of the Washington D.C. and the Baltimore, Maryland area is seen in the Skylab 3 Earth Resources Experiments Package S190-B (five-inch Earth terrain camera) photograph taken from the Skylab space station in Earth orbit. The Chesapeake Bay is on the right (east) side of the picture. The Potomac River flows through the Washington area in the lower left (southwest) corner of the photograph. Several transportation routes and major highways stand out very distinctly. Especially conspicuous are the beltways around the cities, Interstate 95 between Baltimore and the nation?s capitol and Interstate 70N leading west from Baltimore. The tunnel and harbor facilities in Baltimore show clearly, also. Identifiable features in the Washington area include the Capitol Building, the Mall area, Robert F. Kennedy Stadium (white circle), the five bridges across the Potomac, Andrews Air Force Base (on east loop), and the smaller Anacostia River. The extent of the urbanization in this area is dramatically illustrated in this picture. The photograph has sufficient resolution that the housing patterns for individual suburban areas are clearly defined with the houses shown as pink gray, wooded areas as dark green and cleared areas light green. Chesapeake Bay circulation patterns are indicated by contrast of dark and light blue. Sediment plumes (red) are seen entering the bay north and east of Baltimore. The bay bridge stands out white against the blue water. The detailed information contained in this one photograph will be of direct use to several EREP investigator teams in land use analysis, sedimentation and circulation patterns in the bay, and resource surveys of Maryland. All EREP photography is available to the public through the Department of Interior?s Earth Resources Observations Systems Data Center, Sioux Falls, South Dakota, 57198. Photo credit: NASA

Selma Cherchali, Earth observation program head, CNES, participates in a science briefing held by NASA and the French space agency Centre National d’Études Spatiales (CNES) for the Surface Water and Ocean Topography (SWOT) mission on Dec. 13, 2022, at Vandenberg Space Force Base in California. SWOT is scheduled to launch on a SpaceX Falcon 9 rocket from Space Launch Complex-4 East at Vandenberg on Dec. 15, 2022, at 3:46 a.m. PST. SWOT will be NASA’s first global survey of nearly all water on Earth’s surface. Scientists plan to use its observations to better understand the global water cycle, furnish insight into the ocean’s role in how climate change unfolds, and provide a global inventory of water resources. The SWOT mission is a collaborative effort between NASA and CNES with contributions from the Canadian Space Agency and the UK Space Agency. NASA’s Launch Services Program, based at the agency’s Kennedy Space Center in Florida, is managing the launch service.

VANDENBERG AFB, Calif. -- Speaking to NASA social media followers at Vandenberg Air Force Base, Calif., prior to the launch of the Landsat Data Continuity Mission satellite, from the left, are John Yembrick, social media manager at NASA, Dr. Thomas Loveland, senior scientist and co-chair of the Landsat Science Team U.S. Geological Survey Earth Resources Observation and Science Center, and Dr. Jim Irons, Landsat Data Continuity Mission project scientist from NASA's Goddard Space Flight Center. The Landsat Data Continuity Mission LDCM is the future of Landsat satellites. It will continue to obtain valuable data and imagery to be used in agriculture, education, business, science, and government. The Landsat Program provides repetitive acquisition of high resolution multispectral data of the Earth's surface on a global basis. The data from the Landsat spacecraft constitute the longest record of the Earth's continental surfaces as seen from space. It is a record unmatched in quality, detail, coverage, and value. Liftoff is planned for Feb. 11, 2013 aboard a United Launch Alliance Atlas V rocket. For more information, visit: http:__www.nasa.gov_mission_pages_landsat_main_index.html Photo credit: NASA_Kim Shiflett

VANDENBERG AFB, Calif. -- During a news conference at Vandenberg Air Force Base, Calif. prior to the launch of NASA's Landsat Data Continuity Mission, or LDCM, media representative heard from Dr. Jim Irons, LDCM project scientist from NASA's Goddard Space Flight Center, Dr. Thomas Loveland, senior scientist and co-chair of the Landsat Science Team U.S. Geological Survey Earth Resources Observation and Science Center, and Kass Green, Landsat scientist and president of Kass Green and Associates. The Landsat Data Continuity Mission LDCM is the future of Landsat satellites. It will continue to obtain valuable data and imagery to be used in agriculture, education, business, science, and government. The Landsat Program provides repetitive acquisition of high resolution multispectral data of the Earth's surface on a global basis. The data from the Landsat spacecraft constitute the longest record of the Earth's continental surfaces as seen from space. It is a record unmatched in quality, detail, coverage, and value. Liftoff is planned for Feb. 11, 2013 aboard a United Launch Alliance Atlas V rocket. For more information, visit: http:__www.nasa.gov_mission_pages_landsat_main_index.html Photo credit: NASA_Kim Shiflett

VANDENBERG AFB, Calif. -- Dr. Thomas Loveland, senior scientist and co-chair of the Landsat Science Team U.S. Geological Survey Earth Resources Observation and Science Center, left, and Dr. Jim Irons, Landsat Data Continuity Mission project scientist from NASA's Goddard Space Flight Center, speak to NASA social media followers at Vandenberg Air Force Base, Calif., prior to the launch of the LDCM satellite. The Landsat Data Continuity Mission LDCM is the future of Landsat satellites. It will continue to obtain valuable data and imagery to be used in agriculture, education, business, science, and government. The Landsat Program provides repetitive acquisition of high resolution multispectral data of the Earth's surface on a global basis. The data from the Landsat spacecraft constitute the longest record of the Earth's continental surfaces as seen from space. It is a record unmatched in quality, detail, coverage, and value. Liftoff is planned for Feb. 11, 2013 aboard a United Launch Alliance Atlas V rocket. For more information, visit: http:__www.nasa.gov_mission_pages_landsat_main_index.html Photo credit: NASA_Kim Shiflett
SL3-88-004 (July-September 1973) --- A vertical view of the Salinas River Valley area south of Monterey Bay, California area is seen in this Skylab 3 Earth Resources Experiments Package S190-B (five-inch Earth terrain camera) photograph taken from the Skylab space station in Earth orbit. The valley is an irrigated agricultural area, and is indicated by the dark-green and light-gray rectangular patterns in the centre of the picture. The city of Salinas is barely visible under the cloud cover at the top (north) end of the valley. The dark mass on the left (west) side of the valley is the Santa Lucia mountain range. The Big Sur area is on the left and partly covered by clouds. The Diablo Range forms the dark mass in the lower right (southeast) corner of the photograph. The town of Hollister is the gray area in the dark-green rectangular farm tracts which occupy the floor of the San Benito Valley in the upper right (northeast) corner of the photograph. The Salinas River flows northwestward toward Monterey Bay. The towns of Soledad, Greenfield and King City appear as gray areas along U.S. 101 in the Salinas Valley. The geology of the area is complex, and has been racked by several earthquakes resulting from movement along the San Andreas and subsidiary faults. Here, the surface expression of the San Andreas Fault can be traced from a point just west of Hollister at the contrast of dark brown and tan to a point about one inch left of the lower right (southeast) corner of the picture. Subsidiary faults are indicated by the curving trend of the rocks along the right side. The photograph will provide detailed information on land use patterns (Dr. R. Colwell, University of California, Berkeley) and fault tectonics (Dr. P. Merifield, Earth Science Res., Inc. and Dr. M. Abdel-Gawad, Rockwell International). Federal agencies participating with NASA on the EREP project are the Departments of Agriculture, Commerce, Interior, the Environmental Protection Agency and the Corps of Engineers. All EREP photography is available to the public through the Department of Interior’s Earth Resources Observations Systems Data Center, Sioux Falls, South Dakota, 57198. Photo credit: NASA

Jasmine Hopkins, NASA Communications, moderates a science briefing held by NASA and the French space agency Centre National d’Études Spatiales (CNES) for the Surface Water and Ocean Topography (SWOT) mission on Dec. 13, 2022, at Vandenberg Space Force Base in California. SWOT is scheduled to launch on a SpaceX Falcon 9 from Space Launch Complex-4 East at Vandenberg on Dec. 15, 2022, at 3:46 a.m. PST. SWOT will be NASA’s first global survey of nearly all water on Earth’s surface. Scientists plan to use its observations to better understand the global water cycle, furnish insight into the ocean’s role in how climate change unfolds, and provide a global inventory of water resources. The SWOT mission is a collaborative effort between NASA and CNES with contributions from the Canadian Space Agency and the UK Space Agency. NASA’s Launch Services Program, based at the agency’s Kennedy Space Center in Florida, is managing the launch service.
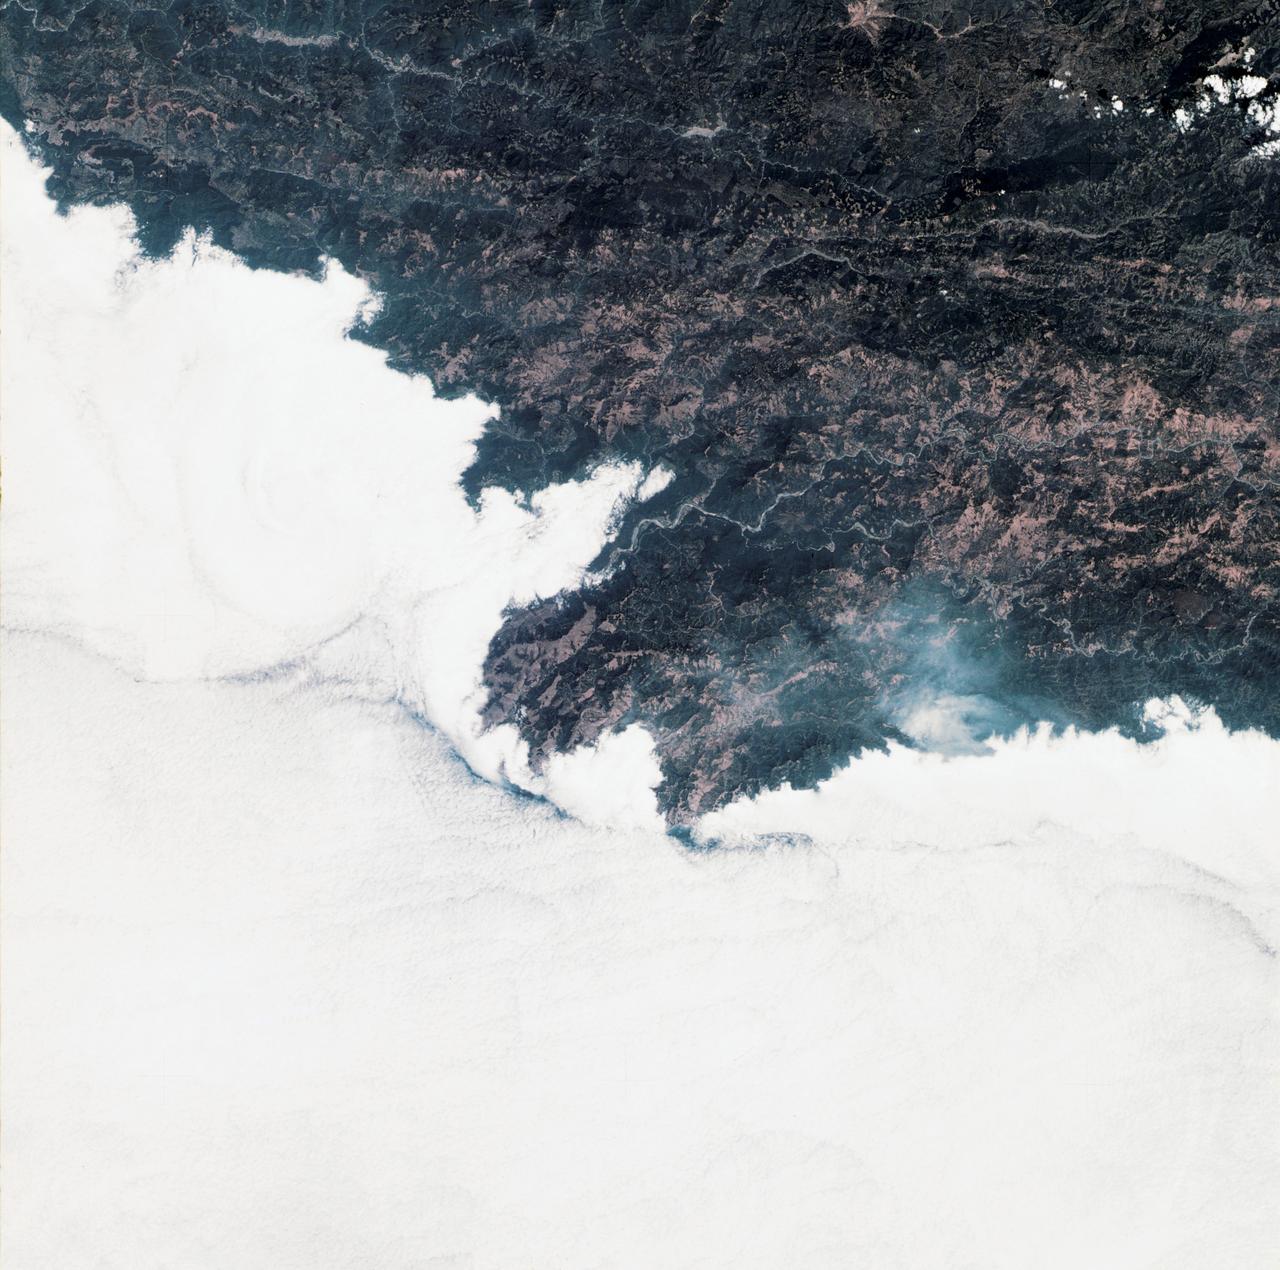
SL3-34-336 (July-September 1973) --- A vertical view of a portion of northern California near the Pacific coast as photographed from Earth orbit by one of the six lenses of the Itek-furnished S190-A Multispectral Photographic Facility Experiment in the Multiple Docking Adapter of the Skylab space station. A cloud deck covers the Pacific Ocean. Most of Cape Mendocino is clear of clouds and extends into the Pacific as the westernmost part of California. The sinuous pattern of the Bel River (in center) flows northward into the ocean and is characteristic of the rivers that drain the coastal ranges. This area is immediately southeast of Eureka. During Skylab 3 extensive forest fires occurred near Briceland and the smoke rising from the fires is clearly visible next to the cloud bank. Redwood and fir forests are sources of lumber in this region; and a variety of clear cut (timbering) patterns appear as light against the dark forest. The patterns appear to be related to the topography. Analysis of this photograph will aid Dr. P.G. Langley, Earth Satellite Corporation, in developing methods for forest inventory using space photography. Federal agencies participating with NASA on the EREP project are the Departments of Agriculture, Commerce, Interior, the Environmental Protection Agency and the Corps of Engineers. All EREP photography is available to the public through the Department of Interior?s Earth Resources Observations Systems Data Center, Sioux Falls, South Dakota, 57198. Photo credit: NASA
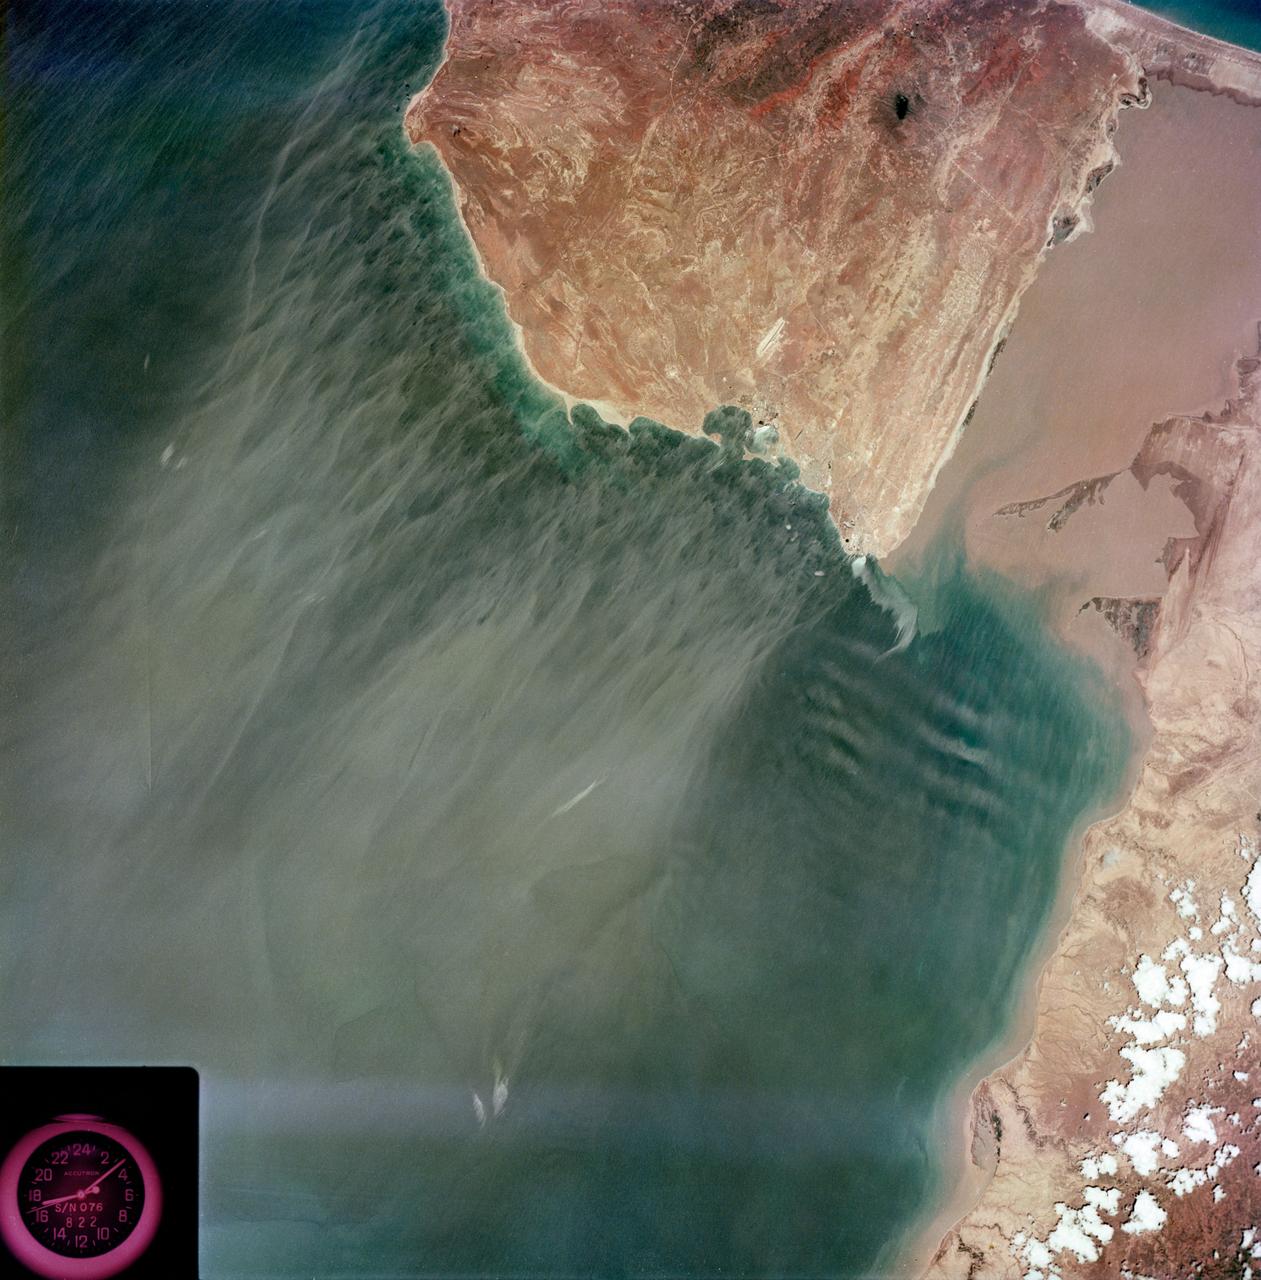
S73-35079 (July-September 1973) --- A near vertical view of the Caribbean coast of Venezuela is seen in this Skylab 3 Earth Resources Experiment Package S190-B (five-inch Earth terrain camera) photograph taken from the Skylab space station in Earth orbit. The large body of water is the Golfo de Venezuela; and the major land mass is the Peninsula de Paraguana. The view is looking northward from the mouth of the Golfete de Coro and Punta Cardon to Punta Macolla. The peninsula is connected to the Venezuelan mainland by the narrow strip of land in the most easterly corner of the picture. The dry, arid climate on the peninsula is indicated by sparse vegetation and the abundance of sand dunes. The highest point is about 2,700 feet above the sea and is the conspicuous black spot. Old raised shoreline features appear as streaks parallel to the Golfete de Coro. Sand dunes and stream erosion have modified these features. Water of the Golfete de Coro is red from the high sediment content. The streaks in the water off the peninsula is apparently an effect of wind which is blowing sand and water offshore. The EREP investigator Dr. Jose Antonio Galavis, of the Ministerio de Mines e Hidrocarburos, will use this information to map geology and coastal sedimentation in the Peninsula de Paraguana. Federal agencies participating with NASA on the EREP projects are the Departments of Agriculture, Commerce, Interior, the Environmental Protection Agency and the Corps of Engineers. All EREP photography is available to the public through the Department of Interior?s Earth Resources Observations Systems Data Center, Sioux Falls, South Dakota, 57198. (Alternate number SL3-83-237) Photo credit: NASA
NASA, SpaceX, and the French space agency Centre National d’Études Spatiales (CNES) hold a prelaunch news conference for the Surface Water and Ocean Topography (SWOT) mission on Dec. 14, 2022, at Vandenberg Space Force Base in California. Participating from left are Karen St. Germain, Earth Science Division director, NASA; Thierry Lafon, SWOT project manager, CNES; Tim Dunn, launch director, NASA’s Launch Services Program; Julianna Scheiman, civil satellite missions director, SpaceX; Parag Vaze, SWOT project manager, Jet Propulsion Laboratory; Capt. Max Rush, launch weather officer, U.S. Air Force. SWOT is scheduled to launch on a SpaceX Falcon 9 rocket from Space Launch Complex-4 East at Vandenberg on Dec. 15, 2022, at 3:46 a.m. PST. SWOT will be NASA’s first global survey of nearly all water on Earth’s surface. Scientists plan to use its observations to better understand the global water cycle, furnish insight into the ocean’s role in how climate change unfolds, and provide a global inventory of water resources. The SWOT mission is a collaborative effort between NASA and CNES with contributions from the Canadian Space Agency and the UK Space Agency. NASA’s Launch Services Program, based at the agency’s Kennedy Space Center in Florida, is managing the launch service.
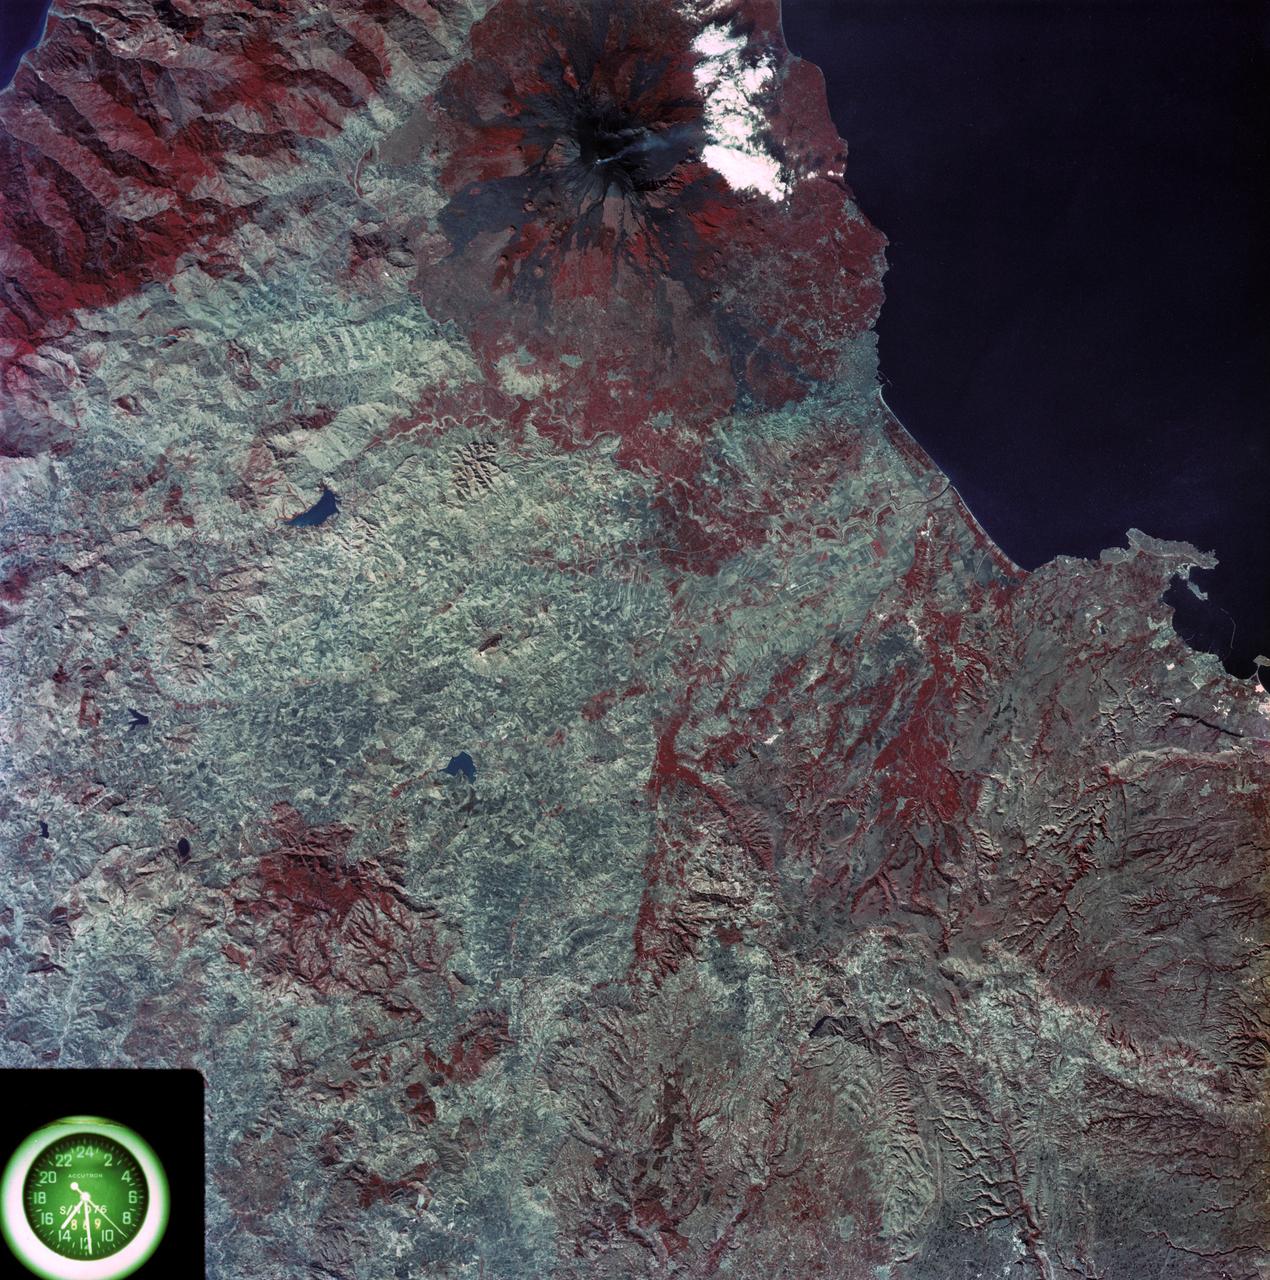
SL3-87-355 (July-September 1973) --- A vertical view of the eastern coast of Sicily area is seen in this Skylab 3 Earth Resources Experiments Package S190-B (five-inch earth terrain camera) infrared photograph taken from the Skylab space station in Earth orbit. Mount Etna, the highest volcano in Europe (10,958 feet), is still active as evidenced by the thin plume of smoke emanating from its crest. (The altitude is approximate because the height of the volcano changes with each eruption). On the flanks of Etna recent lava flows appear black in contrast to the older flows and volcanic debris that are red. Numerous small, circular cinder cones on the flanks represent sites of previous eruptions. Catania, on the Mediterranean coast south of Etna, is the largest of several cities and villages which appear as light-gray patches on the lower slopes of the volcano. Plano de Catania, south of the city of Catania, is outlined by polygonal light and dark agricultural tracts. Several lakes, the largest of which is Lake Pozzillo, show up as dark blue in the photograph. The unusual colors in the picture are due to the use of color infrared film in which vegetation appears red. This is very evident on the slopes of Etna, in the Monti Nebrodi area at upper let, and in the local areas in the lower part of the picture. Studies of Mount Etna and related volcanic features will be undertaken by Professor Roberto Cassinis of Servizio Geologio d?Italia, Rome. Federal agencies participating with NASA on the EREP project are the Departments of Agriculture, Commerce, Interior, the Environmental Protection Agency and the Corps of Engineers. All EREP photography is available to the public through the Department of Interior?s Earth Resources Observation Systems Data Center, Sioux Falls, South Dakota, 57198. Photo credit: NASA

Karen St. Germain, Earth Science Division director, NASA, participates in a prelaunch news conference held by NASA, SpaceX, and the French space agency Centre National d’Études Spatiales (CNES) for the Surface Water and Ocean Topography (SWOT) mission on Dec. 14, 2022, at Vandenberg Space Force Base in California. SWOT is scheduled to launch on a SpaceX Falcon 9 rocket from Space Launch Complex-4 East at Vandenberg on Dec. 15, 2022, at 3:46 a.m. PST. SWOT will be NASA’s first global survey of nearly all water on Earth’s surface. Scientists plan to use its observations to better understand the global water cycle, furnish insight into the ocean’s role in how climate change unfolds, and provide a global inventory of water resources. The SWOT mission is a collaborative effort between NASA and CNES with contributions from the Canadian Space Agency and the UK Space Agency. NASA’s Launch Services Program, based at the agency’s Kennedy Space Center in Florida, is managing the launch service.

S73-35082 (July-Sept. 1973) --- A near vertical view of a portion of west Africa ravaged by drought for the past five years is seen in this Skylab 3 Earth Resources Experiments Package S190-B (five-inch Earth terrain camera) photograph taken from the Skylab space station in Earth orbit. The semi-desert scene is in southeastern Niger about 200 nautical miles east-northeast of the capital city of Niamey. A polygonal-shaped area (dark) in the lower right corner of the picture represents a range-management ranch. The dry stream beds trending diagonally across the photograph locally contain some water or vegetation (green). The beds are sources of water through shallow drilling and contain soils suitable for production of crops. The variety of tans, browns and grays are typical desert colors that represent barren rocks and soil or sand-filled ancient stream valleys. Absence of vegetation is the singular feature of the area. Dr. G. Stuckmann of the Geographic Institute, University of Technology, Mannover, Federal Republic of Germany, will use this photograph in the study of the hydrologic regime of the region through analysis of fossil drainage patterns, geological structures and accumulations of surface water. Federal agencies participating with NASA on the EREP project are the Departments of Agriculture, Commerce, Interior, the Environmental Protection Agency and the Corps of Engineers. All EREP photography is available to the public through the Department of Interior?s Earth Resources Observations Systems Data Center, Sioux Falls, South Dakota, 57198. (Alternate number SL3-86-166) Photo credit: NASA
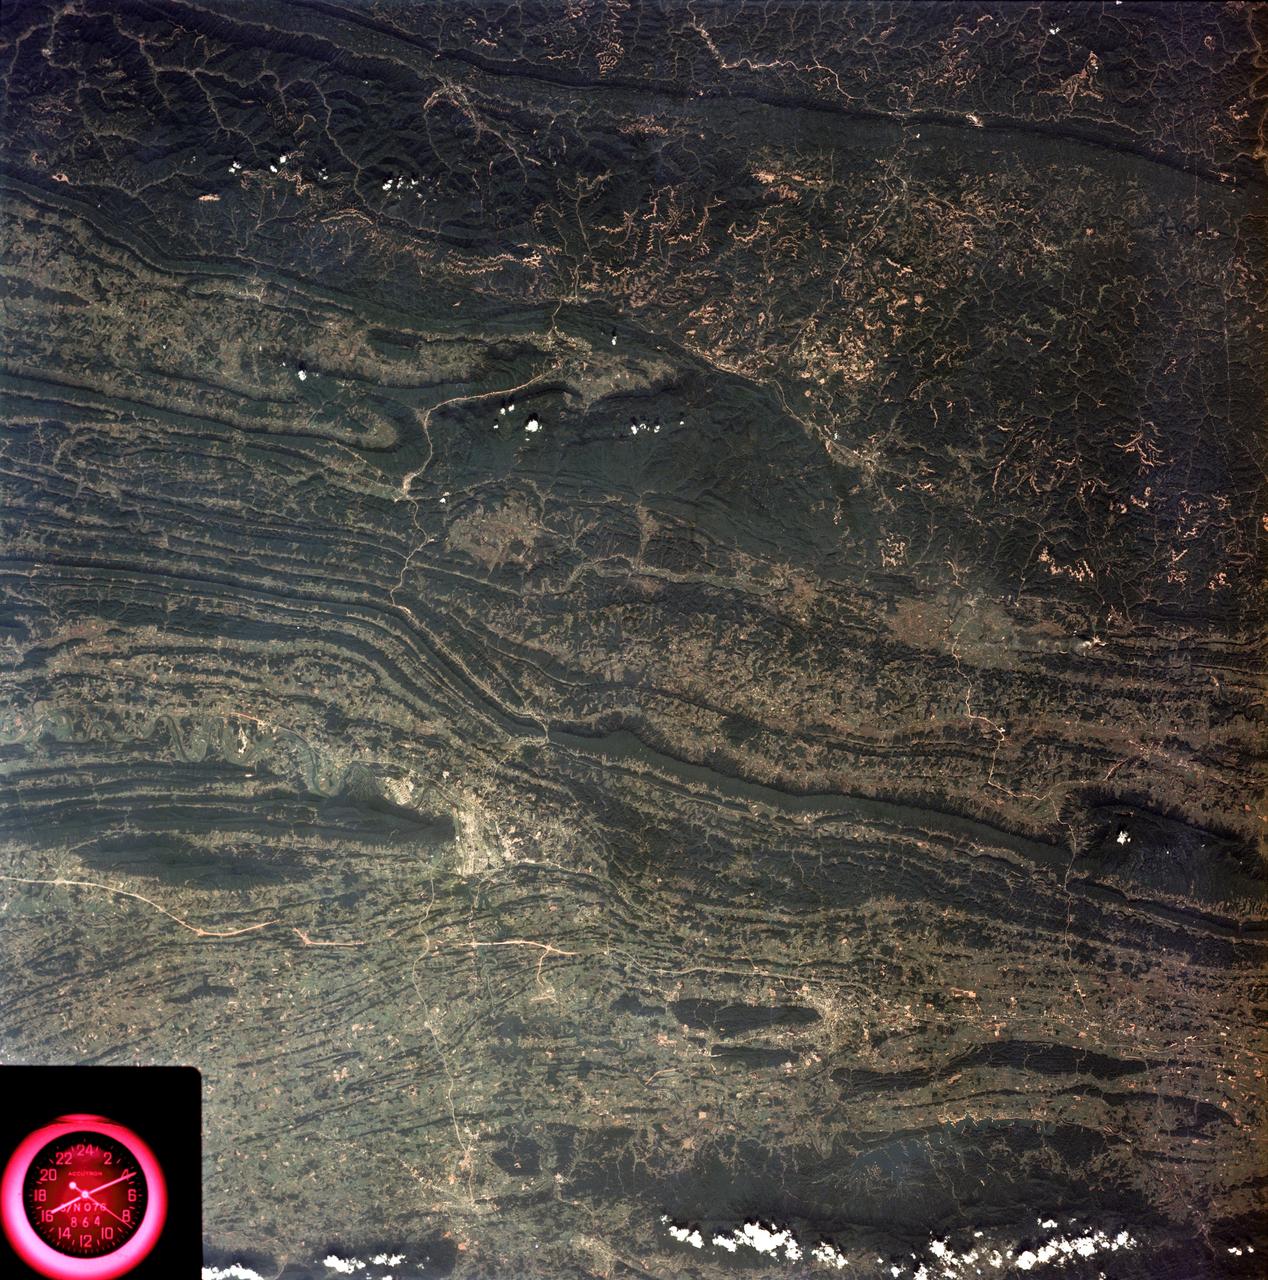
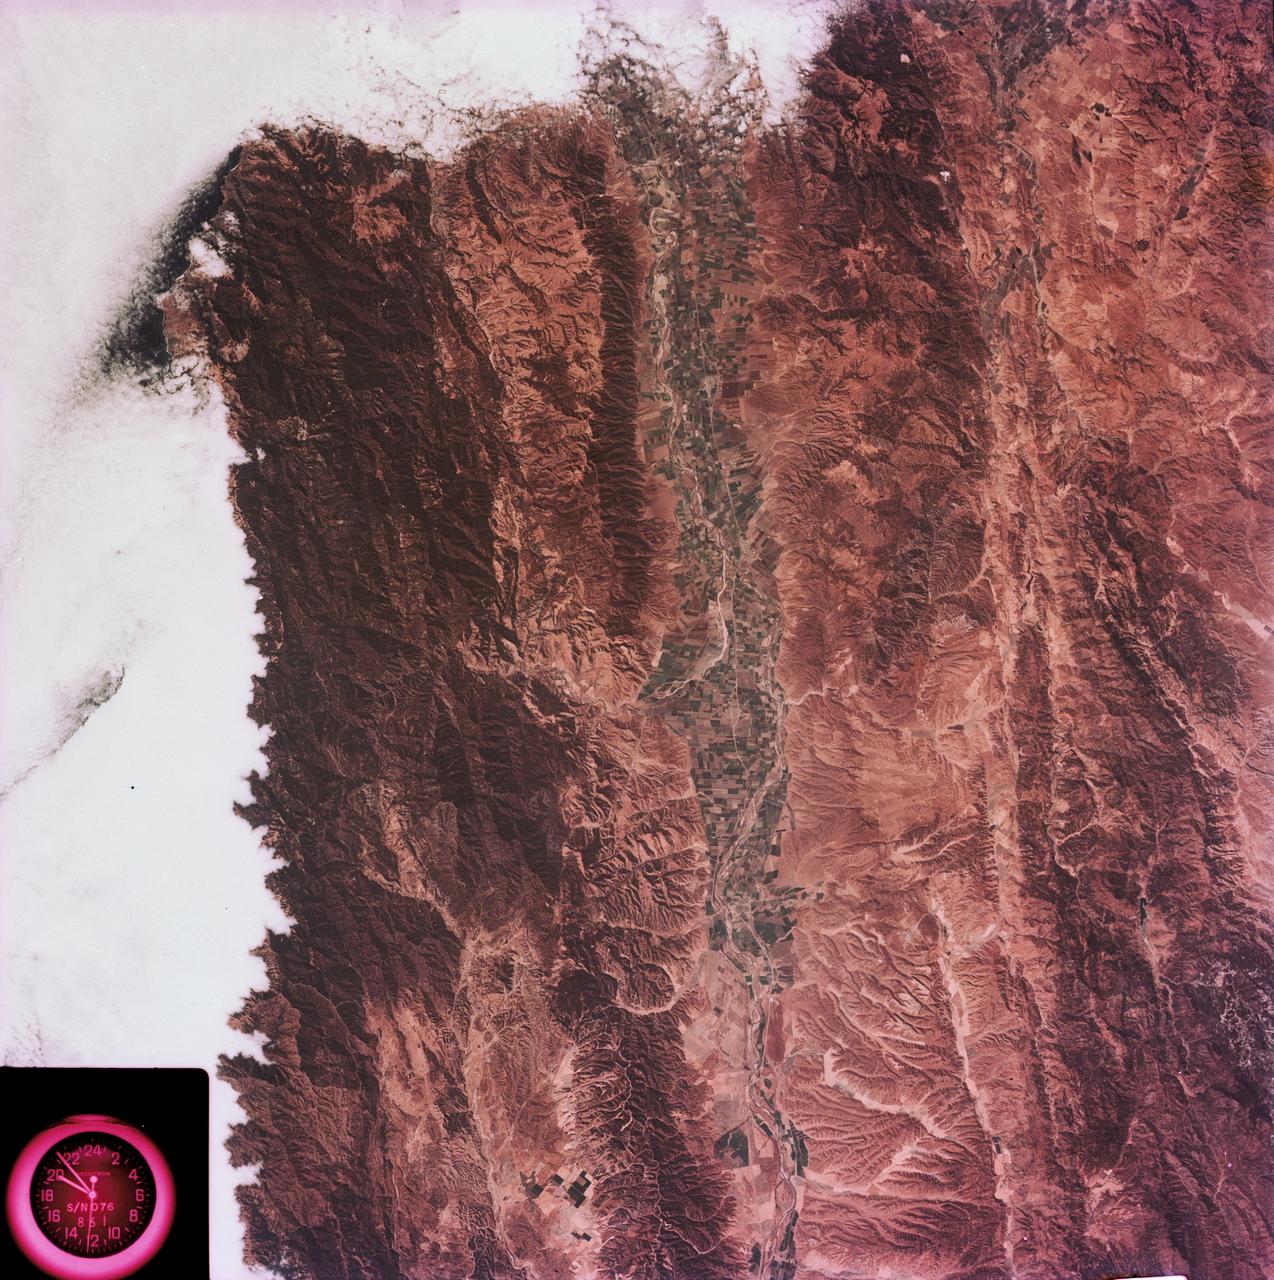
SL3-88-053 (July-September 1973) --- A near vertical view of the Tennessee-Virginia-Kentucky border area is seen in this Skylab 3 Earth Resources Experiments Package S190-B (five-inch Earth terrain camera) photograph taken from the Skylab space station in Earth orbit. The clock is in the most southerly corner of the picture. Interstate 81 under construction extends northeast-southwest across the bottom portion of the photograph. The larger urban area nearest the center of the picture is Kingsport, Tennessee. On the southern side of I-80 and east of Kingsport is the city of Bristol, Tennessee-Virginia. Johnson City, Tennessee is the urban area near the edge of the picture southeast of Kingsport. The Holston River, a tributary of the Tennessee River, meanders through the Kingsport area. The characteristic ridge and valley features in the Cumberland Plateau of Kentucky, Tennessee and Virginia are clearly visible. Forests (dark green) occur on the ridges and clearly outline the folded and faulted rock formations. The valleys (light) were formed in the softer rocks as a result of erosion. Agricultural areas are indicated by the characteristic rectangular patterns. Coal production is an important industry of this area; and it is mined by surface open pit operations. The irregular light areas in the Kentucky-Virginia border area are the strip mines which follow the contour of the land. Reclamation of the strip mine areas is aided through accurate knowledge of the mine and drainage systems. Dr. Ronald Brooks of the Wolf Research and Development Corporation can use this photograph in study of strip mine areas in the east central U.S. Federal agencies participating with NASA on the EREP project are the Departments of Agriculture, Commerce, Interior, the Environmental Protection Agency and the Corps of Engineers. All EREP photography is available to the public through the Department of Interior’s Earth Resources Observations Systems Data Center, Sioux Falls, South Dakota, 57198. Photo credit: NASA
SL3-34-056 (July-September 1973) --- A near vertical view of an 8,000 square-mile area of the Grand Erg Oriental in east central Algeria as photographed from Earth orbit by one of the six lenses of the Itek-furnished S190-A Multispectral Photographic Facility Experiment in the Multiple Docking Adapter of the Skylab space station. The Grand Erg contains vast areas of sand dunes and sand plains. This photograph illustrates the variety of surface features that are characteristic of the Sahara Desert. The dark areas are relatively sand free, and may contain rock outcrops along which travel is considerably easier. Sand dunes are abundant in this picture, and their size, shape, location and pattern are due to the underlying topography and direction of the prevailing winds. Scientists interested in study of dune fields will be able to use this photograph for detailed analysis of the dune features, especially their characteristics adjacent to the sand-free areas. Federal agencies participating with NASA on the EREP project are the Departments of Agriculture, Commerce, Interior, the Environmental Protection Agency and the Corps of Engineers. All EREP photography is available to the public through the Department of Interior?s Earth Resources Observations Systems Data Center, Sioux Falls, South Dakota, 57198. Photo credit: NASA
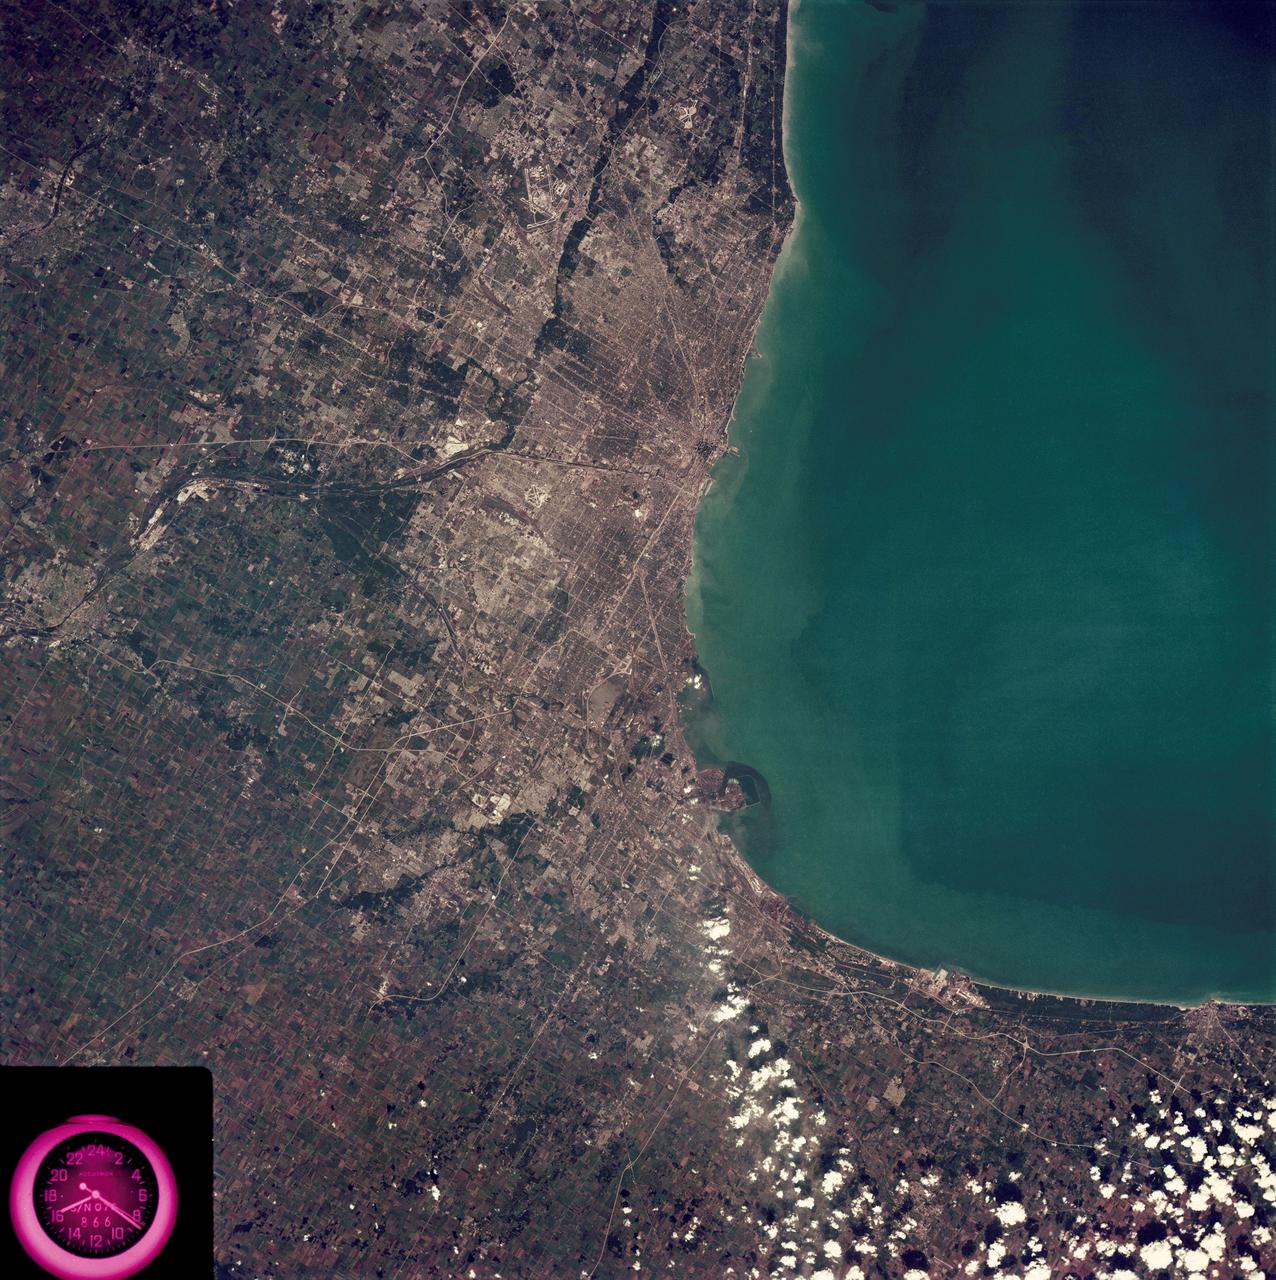
SL3-88-222 (18 Sept. 1973) --- The metropolitan area of Chicago is encompassed in this Skylab 3 Earth Resources Experiments Package (EREP) S190-B photograph taken on Sept. 18, 1973 from the Skylab space station cluster in Earth orbit. The surrounding major cities of Aurora and Joliet, Illinois; Hammond, Gary and East Chicago, Indiana, are easily delineated. The photograph reveals the following: (1) Cultural differentiation of commercial, industrial and residential areas for use in population and social studies in micro-macro community planning and in cultural pattern studies in the improvement of urban areas. (Aurora is one of 27 census cities of interest to Robert Alexander, a principal investigator. Alexander is with the U.S. Geological Survey). (2) The transportation network with major corridors and their interchanges, primary and feeder streets for use in network analysis and in the development of models for population movement and land use projection. (3) The agricultural lands for land use identification on crop inventory analysis; airports for use in delineation of service and infringement of major man-made features that affect ecosystem balance (support to environmental impact studies). (4) Air and water plumes for use in case studies, natural and man-made differentiation of pollution sources, in support of model development and in ecosystem research studies on the effects of pollution. (5) Recreational centers for use in relating recreational centers to population centers, establishing possible demands and in development of possible future recreational centers to support the demand. All EREP photography is available to the public through the Department of Interior?s Earth Resources Observations Systems Data Center, Sioux Falls, South Dakota, 57198. Photo credit: NASA
Parag Vaze, SWOT project manager, Jet Propulsion Laboratory, participates in a prelaunch news conference held by NASA, SpaceX, and the French space agency Centre National d’Études Spatiales (CNES) for the Surface Water and Ocean Topography (SWOT) mission on Dec. 14, 2022, at Vandenberg Space Force Base in California. SWOT is scheduled to launch on a SpaceX Falcon 9 rocket from Space Launch Complex-4 East at Vandenberg on Dec. 15, 2022, at 3:46 a.m. PST. SWOT will be NASA’s first global survey of nearly all water on Earth’s surface. Scientists plan to use its observations to better understand the global water cycle, furnish insight into the ocean’s role in how climate change unfolds, and provide a global inventory of water resources. The SWOT mission is a collaborative effort between NASA and CNES with contributions from the Canadian Space Agency and the UK Space Agency. NASA’s Launch Services Program, based at the agency’s Kennedy Space Center in Florida, is managing the launch service.
Katherine Calvin, chief scientist and senior climate advisor, NASA, participates in a science briefing held by NASA and the French space agency Centre National d’Études Spatiales (CNES) for the Surface Water and Ocean Topography (SWOT) mission on Dec. 13, 2022, at Vandenberg Space Force Base in California. SWOT is scheduled to launch on a SpaceX Falcon 9 rocket from Space Launch Complex-4 East at Vandenberg on Dec. 15, 2022, at 3:46 a.m. PST. SWOT will be NASA’s first global survey of nearly all water on Earth’s surface. Scientists plan to use its observations to better understand the global water cycle, furnish insight into the ocean’s role in how climate change unfolds, and provide a global inventory of water resources. The SWOT mission is a collaborative effort between NASA and CNES with contributions from the Canadian Space Agency and the UK Space Agency. NASA’s Launch Services Program, based at the agency’s Kennedy Space Center in Florida, is managing the launch service.
Tamlin Pavelsky, SWOT hydrology science lead, University of North Carolina, participates in a science briefing held by NASA and the French space agency Centre National d’Études Spatiales (CNES) for the Surface Water and Ocean Topography (SWOT) mission on Dec. 13, 2022, at Vandenberg Space Force Base in California. SWOT is scheduled to launch on a SpaceX Falcon 9 rocket from Space Launch Complex-4 East at Vandenberg on Dec. 15, 2022, at 3:46 a.m. PST. SWOT will be NASA’s first global survey of nearly all water on Earth’s surface. Scientists plan to use its observations to better understand the global water cycle, furnish insight into the ocean’s role in how climate change unfolds, and provide a global inventory of water resources. The SWOT mission is a collaborative effort between NASA and CNES with contributions from the Canadian Space Agency and the UK Space Agency. NASA’s Launch Services Program, based at the agency’s Kennedy Space Center in Florida, is managing the launch service.

Nadya Vinogradova Shiffer, SWOT program scientist, NASA, participates in a science briefing held by NASA and the French space agency Centre National d’Études Spatiales (CNES) for the Surface Water and Ocean Topography (SWOT) mission on Dec. 13, 2022, at Vandenberg Space Force Base in California. SWOT is scheduled to launch on a SpaceX Falcon 9 rocket from Space Launch Complex-4 East at Vandenberg on Dec. 15, 2022, at 3:46 a.m. PST. SWOT will be NASA’s first global survey of nearly all water on Earth’s surface. Scientists plan to use its observations to better understand the global water cycle, furnish insight into the ocean’s role in how climate change unfolds, and provide a global inventory of water resources. The SWOT mission is a collaborative effort between NASA and CNES with contributions from the Canadian Space Agency and the UK Space Agency. NASA’s Launch Services Program, based at the agency’s Kennedy Space Center in Florida, is managing the launch service.

Tim Dunn, launch director, NASA’s Launch Services Program, participates in a prelaunch news conference held by NASA, SpaceX, and the French space agency Centre National d’Études Spatiales (CNES) for the Surface Water and Ocean Topography (SWOT) mission on Dec. 14, 2022, at Vandenberg Space Force Base in California. SWOT is scheduled to launch on a SpaceX Falcon 9 rocket from Space Launch Complex-4 East at Vandenberg on Dec. 15, 2022, at 3:46 a.m. PST. SWOT will be NASA’s first global survey of nearly all water on Earth’s surface. Scientists plan to use its observations to better understand the global water cycle, furnish insight into the ocean’s role in how climate change unfolds, and provide a global inventory of water resources. The SWOT mission is a collaborative effort between NASA and CNES with contributions from the Canadian Space Agency and the UK Space Agency. NASA’s Launch Services Program, based at the agency’s Kennedy Space Center in Florida, is managing the launch service.

Capt. Max Rush, launch weather officer, U.S. Air Force, participates in a prelaunch news conference held by NASA, SpaceX, and the French space agency Centre National d’Études Spatiales (CNES) for the Surface Water and Ocean Topography (SWOT) mission on Dec. 14, 2022, at Vandenberg Space Force Base in California. SWOT is scheduled to launch on a SpaceX Falcon 9 rocket from Space Launch Complex-4 East at Vandenberg on Dec. 15, 2022, at 3:46 a.m. PST. SWOT will be NASA’s first global survey of nearly all water on Earth’s surface. Scientists plan to use its observations to better understand the global water cycle, furnish insight into the ocean’s role in how climate change unfolds, and provide a global inventory of water resources. The SWOT mission is a collaborative effort between NASA and CNES with contributions from the Canadian Space Agency and the UK Space Agency. NASA’s Launch Services Program, based at the agency’s Kennedy Space Center in Florida, is managing the launch service.

Megan Cruz, NASA Communications, moderates a prelaunch news conference held by NASA, SpaceX, and the French space agency Centre National d’Études Spatiales (CNES) for the Surface Water and Ocean Topography (SWOT) mission on Dec. 14, 2022, at Vandenberg Space Force Base in California. SWOT is scheduled to launch on a SpaceX Falcon 9 rocket from Space Launch Complex-4 East at Vandenberg on Dec. 15, 2022, at 3:46 a.m. PST. SWOT will be NASA’s first global survey of nearly all water on Earth’s surface. Scientists plan to use its observations to better understand the global water cycle, furnish insight into the ocean’s role in how climate change unfolds, and provide a global inventory of water resources. The SWOT mission is a collaborative effort between NASA and CNES with contributions from the Canadian Space Agency and the UK Space Agency. NASA’s Launch Services Program, based at the agency’s Kennedy Space Center in Florida, is managing the launch service.
Benjamin Hamlington, research scientist, Sea Level and Ice Group, Jet Propulsion Laboratory, participates in a science briefing held by NASA and the French space agency Centre National d’Études Spatiales (CNES) for the Surface Water and Ocean Topography (SWOT) mission on Dec. 13, 2022, at Vandenberg Space Force Base in California. SWOT is scheduled to launch on a SpaceX Falcon 9 rocket from Space Launch Complex-4 East at Vandenberg on Dec. 15, 2022, at 3:46 a.m. PST. SWOT will be NASA’s first global survey of nearly all water on Earth’s surface. Scientists plan to use its observations to better understand the global water cycle, furnish insight into the ocean’s role in how climate change unfolds, and provide a global inventory of water resources. The SWOT mission is a collaborative effort between NASA and CNES with contributions from the Canadian Space Agency and the UK Space Agency. NASA’s Launch Services Program, based at the agency’s Kennedy Space Center in Florida, is managing the launch service.

Thierry Lafon, SWOT project manager, CNES, participates in a prelaunch news conference held by NASA, SpaceX, and the French space agency Centre National d’Études Spatiales (CNES) for the Surface Water and Ocean Topography (SWOT) mission on Dec. 14, 2022, at Vandenberg Space Force Base in California. SWOT is scheduled to launch on a SpaceX Falcon 9 rocket from Space Launch Complex-4 East at Vandenberg on Dec. 15, 2022, at 3:46 a.m. PST. SWOT will be NASA’s first global survey of nearly all water on Earth’s surface. Scientists plan to use its observations to better understand the global water cycle, furnish insight into the ocean’s role in how climate change unfolds, and provide a global inventory of water resources. The SWOT mission is a collaborative effort between NASA and CNES with contributions from the Canadian Space Agency and the UK Space Agency. NASA’s Launch Services Program, based at the agency’s Kennedy Space Center in Florida, is managing the launch service.
Julianna Scheiman, civil satellite missions director, SpaceX, participates in a prelaunch news conference held by NASA, SpaceX, and the French space agency Centre National d’Études Spatiales (CNES) for the Surface Water and Ocean Topography (SWOT) mission on Dec. 14, 2022, at Vandenberg Space Force Base in California. SWOT is scheduled to launch on a SpaceX Falcon 9 rocket from Space Launch Complex-4 East at Vandenberg on Dec. 15, 2022, at 3:46 a.m. PST. SWOT will be NASA’s first global survey of nearly all water on Earth’s surface. Scientists plan to use its observations to better understand the global water cycle, furnish insight into the ocean’s role in how climate change unfolds, and provide a global inventory of water resources. The SWOT mission is a collaborative effort between NASA and CNES with contributions from the Canadian Space Agency and the UK Space Agency. NASA’s Launch Services Program, based at the agency’s Kennedy Space Center in Florida, is managing the launch service.
Engineers in a clean room at NASA's Jet Propulsion Laboratory in Southern California in April 2023 examine the imaging spectrometer that will ride aboard the first of two satellites to be launched by the Carbon Mapper Coalition. The instrument will help researchers detect emissions of carbon dioxide and methane from sources on Earth's surface from space. The gold-colored component is the spectrometer, which was developed at JPL. It's designed to receive sunlight reflected from Earth and divide that light into hundreds of distinct colors in the near-infrared and visible portion of the electromagnetic spectrum. By analyzing the light's spectroscopic signature – the wavelengths that show up in the signal as well as those that do not – researchers can determine whether the instrument is observing greenhouse gas emissions and, if so, estimate their concentrations. The black portion at the base of the instrument is a telescope that captures light from Earth's surface and reflects it into the spectrometer. When released into the atmosphere, carbon dioxide and methane are the greenhouse gases most responsible for human-caused global warming. Both have unique spectral signatures that make them detectable from space via spectroscopy. The imaging spectrometer is JPL's contribution to the Carbon Mapper Coalition, a joint effort led by the nonprofit Carbon Mapper that also includes Planet Labs PBC, the California Air Resources Board, Arizona State University, and the University of Arizona. Once the instrument is in orbit, researchers will use its measurements to identify the sources of carbon dioxide and methane plumes it detects. Identification of the origins of emissions is considered the first step towards mitigation. https://photojournal.jpl.nasa.gov/catalog/PIA25869

SL3-83-0152 (July-September 1973) --- A near vertical view of the metropolitan Detroit, Michigan area is seen in this Skylab 3 Earth Resources Experiments Package S190-B (five-inch Earth terrain camera) photograph taken from the Skylab space station in Earth orbit. The 25-mile long Detroit River drains the smaller body of water (Lake St. Clair) and flows southwestward separating Detroit from Windsor, Ontario, and empties into Lake Erie. The Detroit River handles a great deal of Great Lakes barge and ship traffic. Major streets and thoroughfares radiating from the city are clearly visible. Fighting Island is the highly reflective, white area located almost in the center of the picture. This high reflectivity is caused by the functional use of the island-disposal ponds for chemical salts. Sedimentation and/or pollution patterns in the area provide interesting visual phenomena for speculation and analysis. Distinct and rather unique cultivated field patterns can be observed south and east of Windsor, Ontario. This is a direct result of an English survey and land tenure system which was utilized when the area was settled. New areas of residential development are fairly easy to differentiate from older, established residential areas. Vegetation and extent of area coverage can be determined. The Oakland County Planning Commission and the Federal Bureau of Outdoor Recreation working closely with Irv Sattinger of the Environmental Research Institute of Michigan (University of Michigan) are presently processing and analyzing photographic and Multispectral scanner data to determine its usefulness for recreation and open space site studies for this area. Photo credit: NASA
Children at the visitor center at NASA's Goddard Space Flight Center in Greenbelt, Md., receive a rainfall demonstration as part of activities tied to the launch of the Global Precipitation Measurement mission's Core Observatory on Feb. 27, 2014. <b>Credit: NASA's Goddard Space Flight Center/Debbie McCallum</b> GPM's Core Observatory is poised for launch from the Japan Aerospace Exploration Agency's Tanegashima Space Center, scheduled for the afternoon of Feb. 27, 2014 (EST). GPM is a joint venture between NASA and the Japan Aerospace Exploration Agency. The GPM Core Observatory will link data from a constellation of current and planned satellites to produce next-generation global measurements of rainfall and snowfall from space. The GPM mission is the first coordinated international satellite network to provide near real-time observations of rain and snow every three hours anywhere on the globe. The GPM Core Observatory anchors this network by providing observations on all types of precipitation. The observatory's data acts as the measuring stick by which partner observations can be combined into a unified data set. The data will be used by scientists to study climate change, freshwater resources, floods and droughts, and hurricane formation and tracking. <b><a href="http://www.nasa.gov/audience/formedia/features/MP_Photo_Guidelines.html" rel="nofollow">NASA image use policy.</a></b> <b><a href="http://www.nasa.gov/centers/goddard/home/index.html" rel="nofollow">NASA Goddard Space Flight Center</a></b> enables NASA’s mission through four scientific endeavors: Earth Science, Heliophysics, Solar System Exploration, and Astrophysics. Goddard plays a leading role in NASA’s accomplishments by contributing compelling scientific knowledge to advance the Agency’s mission. <b>Follow us on <a href="http://twitter.com/NASAGoddardPix" rel="nofollow">Twitter</a></b> <b>Like us on <a href="http://www.facebook.com/pages/Greenbelt-MD/NASA-Goddard/395013845897?ref=tsd" rel="nofollow">Facebook</a></b> <b>Find us on <a href="http://instagram.com/nasagoddard?vm=grid" rel="nofollow">Instagram</a></b>
One of the control rooms at NASA’s Goddard Space Flight Center in Greenbelt, Md., prepares for the GPM mission’s Core Observatory on Feb. 27, 2014. <b>Credit: NASA's Goddard Space Flight Center/Debbie McCallum</b> GPM's Core Observatory is poised for launch from the Japan Aerospace Exploration Agency's Tanegashima Space Center, scheduled for the afternoon of Feb. 27, 2014 (EST). GPM is a joint venture between NASA and the Japan Aerospace Exploration Agency. The GPM Core Observatory will link data from a constellation of current and planned satellites to produce next-generation global measurements of rainfall and snowfall from space. The GPM mission is the first coordinated international satellite network to provide near real-time observations of rain and snow every three hours anywhere on the globe. The GPM Core Observatory anchors this network by providing observations on all types of precipitation. The observatory's data acts as the measuring stick by which partner observations can be combined into a unified data set. The data will be used by scientists to study climate change, freshwater resources, floods and droughts, and hurricane formation and tracking. <b><a href="http://www.nasa.gov/audience/formedia/features/MP_Photo_Guidelines.html" rel="nofollow">NASA image use policy.</a></b> <b><a href="http://www.nasa.gov/centers/goddard/home/index.html" rel="nofollow">NASA Goddard Space Flight Center</a></b> enables NASA’s mission through four scientific endeavors: Earth Science, Heliophysics, Solar System Exploration, and Astrophysics. Goddard plays a leading role in NASA’s accomplishments by contributing compelling scientific knowledge to advance the Agency’s mission. <b>Follow us on <a href="http://twitter.com/NASAGoddardPix" rel="nofollow">Twitter</a></b> <b>Like us on <a href="http://www.facebook.com/pages/Greenbelt-MD/NASA-Goddard/395013845897?ref=tsd" rel="nofollow">Facebook</a></b> <b>Find us on <a href="http://instagram.com/nasagoddard?vm=grid" rel="nofollow">Instagram</a></b>
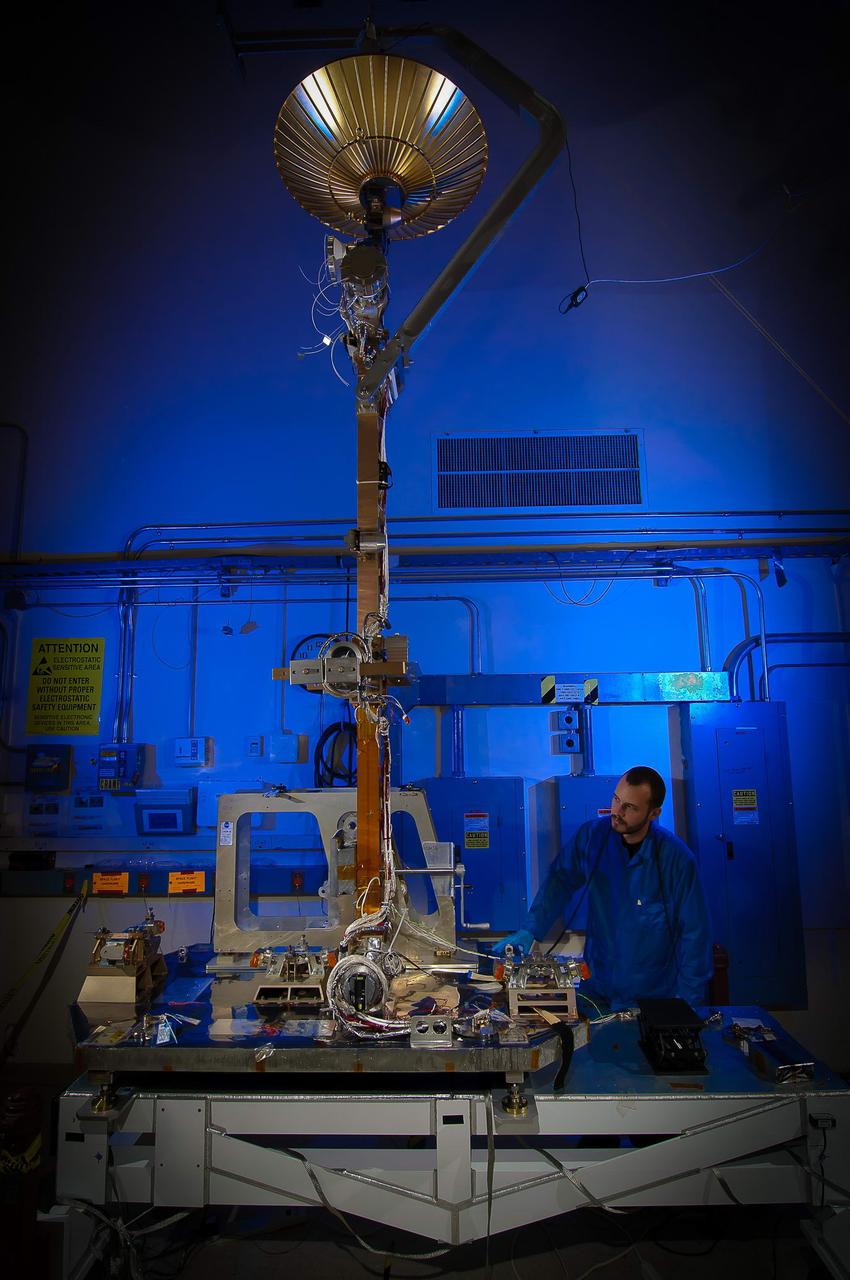
File: 03/26/2012 The GPM High Gain Antenna System (HGAS) in integration and testing at Goddard Space Flight Center. GPM is a joint mission between NASA and the Japan Aerospace Exploration Agency (JAXA). The Core Observatory will link data from a constellation of current and planned satellites to produce next-generation global measurements of rainfall and snowfall from space. The GPM mission is the first coordinated international satellite network to provide near real-time observations of rain and snow every three hours anywhere on the globe. The GPM Core Observatory anchors this network by providing observations on all types of precipitation. The observatory's data acts as the measuring stick by which partner observations can be combined into a unified data set. The data will be used by scientists to study climate change, freshwater resources, floods and droughts, and hurricane formation and tracking. Credit: Craig E. Huber, Chief Engineer SGT Inc, NASA Goddard Space Flight Center <b><a href="http://www.nasa.gov/audience/formedia/features/MP_Photo_Guidelines.html" rel="nofollow">NASA image use policy.</a></b> <b><a href="http://www.nasa.gov/centers/goddard/home/index.html" rel="nofollow">NASA Goddard Space Flight Center</a></b> enables NASA’s mission through four scientific endeavors: Earth Science, Heliophysics, Solar System Exploration, and Astrophysics. Goddard plays a leading role in NASA’s accomplishments by contributing compelling scientific knowledge to advance the Agency’s mission. <b>Follow us on <a href="http://twitter.com/NASAGoddardPix" rel="nofollow">Twitter</a></b> <b>Like us on <a href="http://www.facebook.com/pages/Greenbelt-MD/NASA-Goddard/395013845897?ref=tsd" rel="nofollow">Facebook</a></b> <b>Find us on <a href="http://instagram.com/nasagoddard?vm=grid" rel="nofollow">Instagram</a></b>
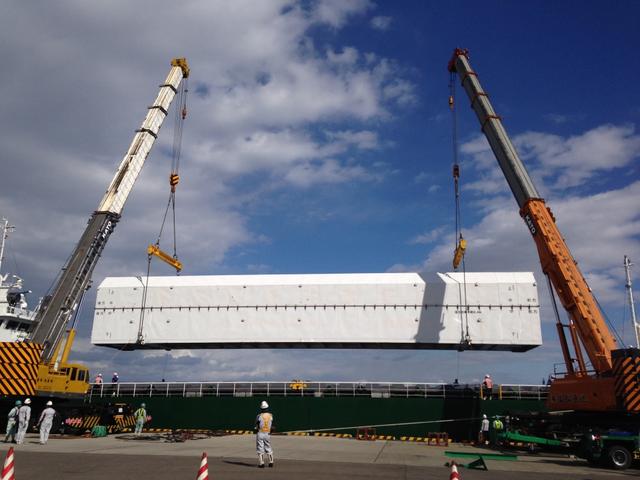
The launch vehicle for the Global Precipitation Measurement, or GPM, mission's Core Observatory arrived at Tanegashima Space Center, Japan, in the pre-dawn hours of Tuesday, Jan. 21, local time. Credits: NASA/Goddard/Warren Schultzaburger GPM is a joint mission between NASA and the Japan Aerospace Exploration Agency (JAXA). The Core Observatory will link data from a constellation of current and planned satellites to produce next-generation global measurements of rainfall and snowfall from space. The GPM mission is the first coordinated international satellite network to provide near real-time observations of rain and snow every three hours anywhere on the globe. The GPM Core Observatory anchors this network by providing observations on all types of precipitation. The observatory's data acts as the measuring stick by which partner observations can be combined into a unified data set. The data will be used by scientists to study climate change, freshwater resources, floods and droughts, and hurricane formation and tracking. Credit: Mitsubishi Heavy Industries <b><a href="http://www.nasa.gov/audience/formedia/features/MP_Photo_Guidelines.html" rel="nofollow">NASA image use policy.</a></b> <b><a href="http://www.nasa.gov/centers/goddard/home/index.html" rel="nofollow">NASA Goddard Space Flight Center</a></b> enables NASA’s mission through four scientific endeavors: Earth Science, Heliophysics, Solar System Exploration, and Astrophysics. Goddard plays a leading role in NASA’s accomplishments by contributing compelling scientific knowledge to advance the Agency’s mission. <b>Follow us on <a href="http://twitter.com/NASAGoddardPix" rel="nofollow">Twitter</a></b> <b>Like us on <a href="http://www.facebook.com/pages/Greenbelt-MD/NASA-Goddard/395013845897?ref=tsd" rel="nofollow">Facebook</a></b> <b>Find us on <a href="http://instagram.com/nasagoddard?vm=grid" rel="nofollow">Instagram</a></b>
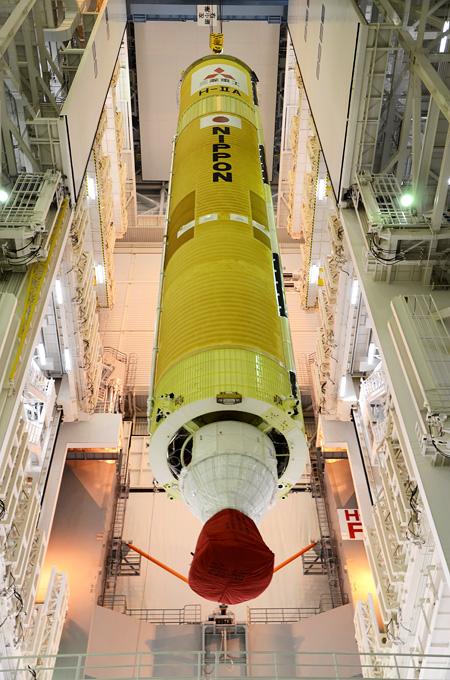
GPM's launch vehicle, the H-IIA No.23, first stage VOS (Vehicle On Stand). GPM is a joint mission between NASA and the Japan Aerospace Exploration Agency (JAXA). The Core Observatory will link data from a constellation of current and planned satellites to produce next-generation global measurements of rainfall and snowfall from space. The GPM mission is the first coordinated international satellite network to provide near real-time observations of rain and snow every three hours anywhere on the globe. The GPM Core Observatory anchors this network by providing observations on all types of precipitation. The observatory's data acts as the measuring stick by which partner observations can be combined into a unified data set. The data will be used by scientists to study climate change, freshwater resources, floods and droughts, and hurricane formation and tracking. Credit: Mitsubishi Heavy Industries <b><a href="http://www.nasa.gov/audience/formedia/features/MP_Photo_Guidelines.html" rel="nofollow">NASA image use policy.</a></b> <b><a href="http://www.nasa.gov/centers/goddard/home/index.html" rel="nofollow">NASA Goddard Space Flight Center</a></b> enables NASA’s mission through four scientific endeavors: Earth Science, Heliophysics, Solar System Exploration, and Astrophysics. Goddard plays a leading role in NASA’s accomplishments by contributing compelling scientific knowledge to advance the Agency’s mission. <b>Follow us on <a href="http://twitter.com/NASAGoddardPix" rel="nofollow">Twitter</a></b> <b>Like us on <a href="http://www.facebook.com/pages/Greenbelt-MD/NASA-Goddard/395013845897?ref=tsd" rel="nofollow">Facebook</a></b> <b>Find us on <a href="http://instagram.com/nasagoddard?vm=grid" rel="nofollow">Instagram</a></b>
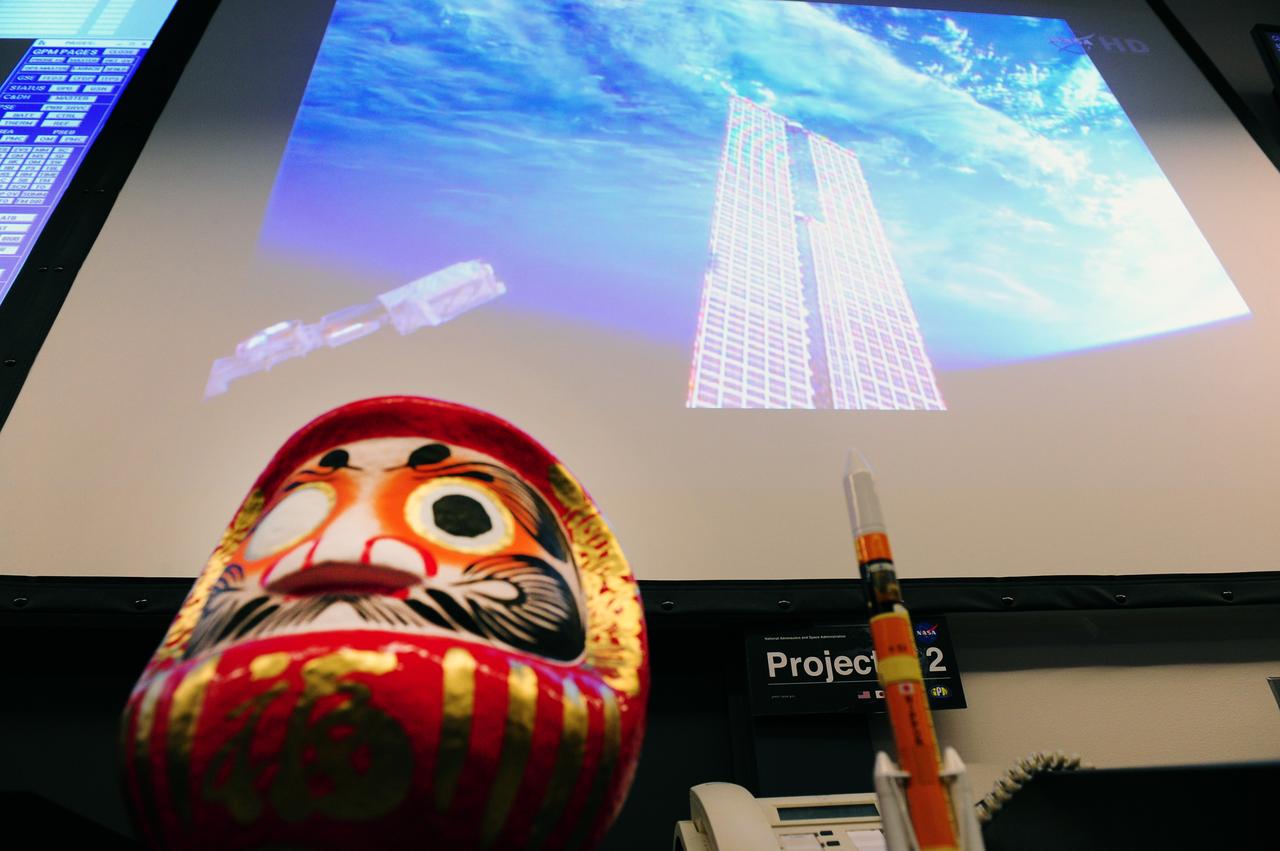
The Daruma doll is a symbol of good luck and in Japan is often given as a gift for encouragement to reach a goal. When the goal is set, one eye is colored in. When the goal is achieved, the other eye is colored. <a href="http://www.flickr.com/photos/nasahqphoto/12714130984/in/set-72157641344480584" target="_blank">An identical doll</a> sits in the control room at the Japan Aerospace Agency’s (JAXA) Tanegashima Space Center, leading up to the launch of the joint NASA-JAXA Global Precipitation Measurement mission’s Core Observatory. <b>Credit: NASA's Goddard Space Flight Center/Debbie McCallum</b> GPM's Core Observatory is poised for launch from the Japan Aerospace Exploration Agency's Tanegashima Space Center, scheduled for the afternoon of Feb. 27, 2014 (EST). GPM is a joint venture between NASA and the Japan Aerospace Exploration Agency. The GPM Core Observatory will link data from a constellation of current and planned satellites to produce next-generation global measurements of rainfall and snowfall from space. The GPM mission is the first coordinated international satellite network to provide near real-time observations of rain and snow every three hours anywhere on the globe. The GPM Core Observatory anchors this network by providing observations on all types of precipitation. The observatory's data acts as the measuring stick by which partner observations can be combined into a unified data set. The data will be used by scientists to study climate change, freshwater resources, floods and droughts, and hurricane formation and tracking. <b><a href="http://www.nasa.gov/audience/formedia/features/MP_Photo_Guidelines.html" rel="nofollow">NASA image use policy.</a></b> <b><a href="http://www.nasa.gov/centers/goddard/home/index.html" rel="nofollow">NASA Goddard Space Flight Center</a></b> enables NASA’s mission through four scientific endeavors: Earth Science, Heliophysics, Solar System Exploration, and Astrophysics. Goddard plays a leading role in NASA’s accomplishments by contributing compelling scientific knowledge to advance the Agency’s mission. <b>Follow us on <a href="http://twitter.com/NASAGoddardPix" rel="nofollow">Twitter</a></b> <b>Like us on <a href="http://www.facebook.com/pages/Greenbelt-MD/NASA-Goddard/395013845897?ref=tsd" rel="nofollow">Facebook</a></b> <b>Find us on <a href="http://instagram.com/nasagoddard?vm=grid" rel="nofollow">Instagram</a></b>
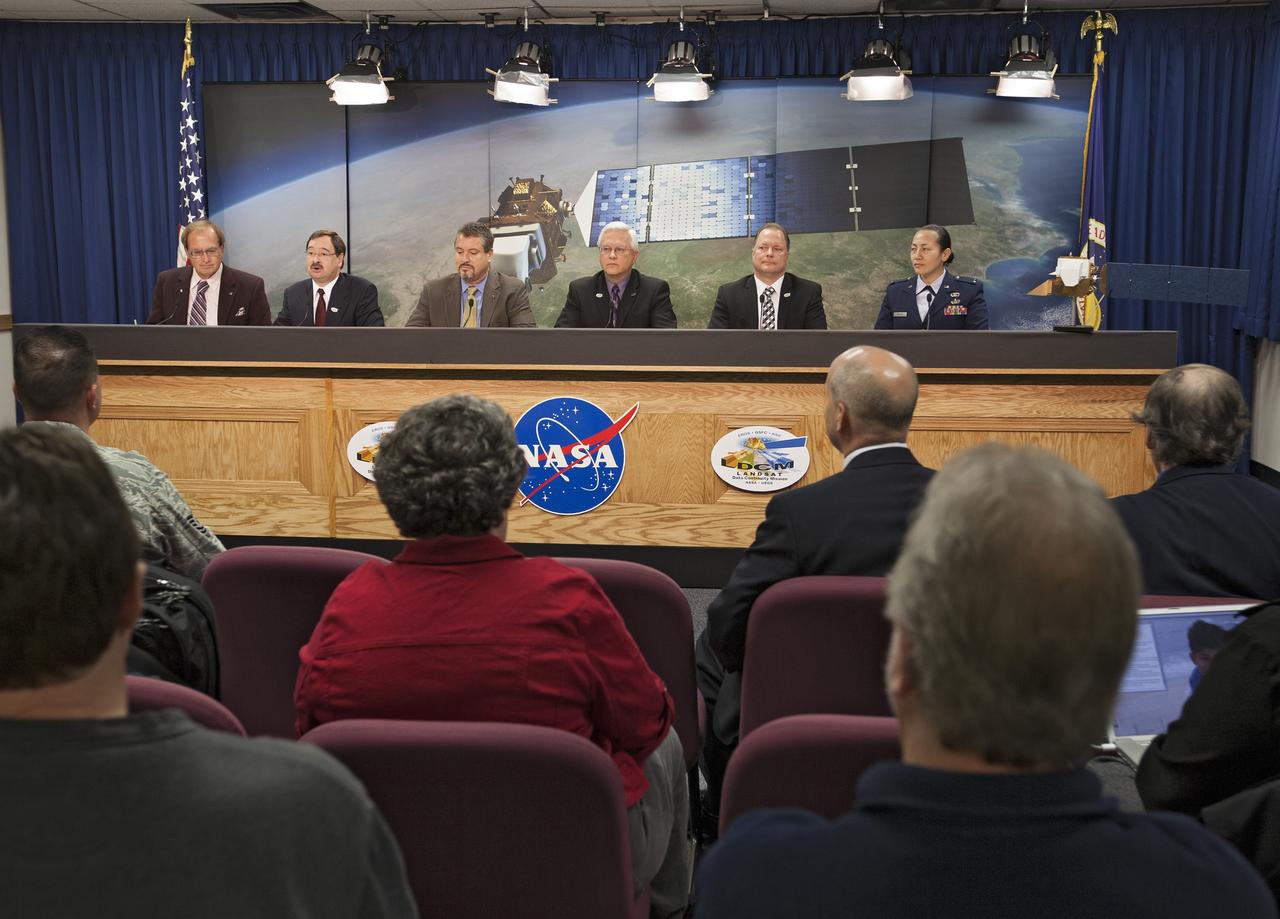
VANDENBERG AIR FORCE BASE, Calif. -- Media attend a prelaunch press conference at Vandenberg Air Force Base in California to discuss NASA's readiness to launch the Landsat Data Continuity Mission LDCM. From left are George Diller of NASA Public Affairs, LDCM program executive David Jarrett from NASA Headquarters, NASA Launch Director Omar Baez from Kennedy Space Center, United Launch Alliance Program Manager for NASA Missions Vernon Thorp, LDCM Project Manager Ken Schwer from Goddard Space Flight Center, and 1st Lt. Jennifer Kelley, launch weather officer for the 30th Operations Support Squadron at Vandenberg. Launch of LDCM aboard a United Launch Alliance Atlas V rocket from Vandenberg's Space Launch Complex-3E is planned for Feb. 11 during a 48-minute launch window that opens at 10:02 a.m. PST, or 1:02 p.m. EST. LDCM is the eighth satellite in the Landsat Program series of Earth-observing missions and will continue the program’s critical role in monitoring, understanding and managing the resources needed for human sustainment, such as food, water and forests. NASA's Goddard Space Flight Center in Greenbelt, Md., is responsible for LDCM project management. Orbital Sciences Corp. built the LDCM satellite. NASA's Launch Services Program at the Kennedy Space Center in Florida provides launch management. After launch and the initial checkout phase, the U. S. Geological Survey will take operational control of LDCM, and it will be renamed Landsat 8. Photo credit: NASA/Kim Shiflett
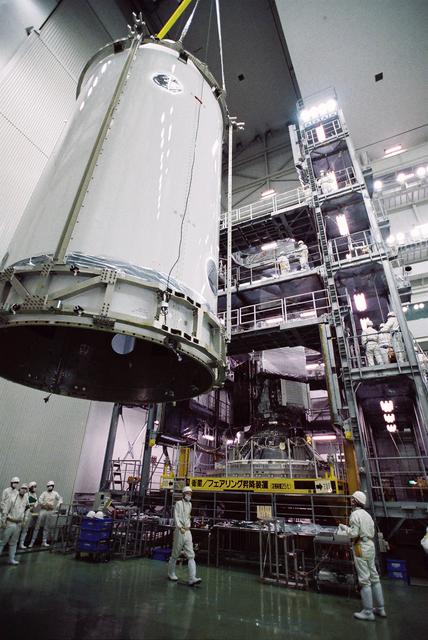
GPM is a joint mission between NASA and the Japan Aerospace Exploration Agency (JAXA). The Core Observatory will link data from a constellation of current and planned satellites to produce next-generation global measurements of rainfall and snowfall from space. On Feb. 11, the Core Observatory was moved into the spacecraft fairing assembly building and into the Encapsulation Hall. Final inspections and preparations were completed for the installation into the fairing, which began on Feb 13. The fairing is the part of the rocket that will contain the spacecraft at the top of the H-IIA rocket. The encapsulation process for the H-IIA is very different than for most U.S. rockets. For U.S. rockets, the fairing is usually in two pieces that close around the payload like a clamshell. To install the GPM Core Observatory into the fairing of the H-IIA rocket, first the Core Observatory and the Payload Attach Fitting (PAF) are set up in scaffolding in the Encapsulation Hall. Then, the fairing is lifted above and lowered onto the fitting. When only a few feet remain above the final position, stanchions support the fairing while technicians go inside to complete the electrical connections. When this is completed, they remove the stanchions and lower the fairing to its final position, where it is bolted in place. The GPM mission is the first coordinated international satellite network to provide near real-time observations of rain and snow every three hours anywhere on the globe. The GPM Core Observatory anchors this network by providing observations on all types of precipitation. The observatory's data acts as the measuring stick by which partner observations can be combined into a unified data set. The data will be used by scientists to study climate change, freshwater resources, floods and droughts, and hurricane formation and tracking. Credit: Japan Aerospace Exploration Agency <b><a href="http://www.nasa.gov/audience/formedia/features/MP_Photo_Guidelines.html" rel="nofollow">NASA image use policy.</a></b> <b><a href="http://www.nasa.gov/centers/goddard/home/index.html" rel="nofollow">NASA Goddard Space Flight Center</a></b> enables NASA’s mission through four scientific endeavors: Earth Science, Heliophysics, Solar System Exploration, and Astrophysics. Goddard plays a leading role in NASA’s accomplishments by contributing compelling scientific knowledge to advance the Agency’s mission. <b>Follow us on <a href="http://twitter.com/NASAGoddardPix" rel="nofollow">Twitter</a></b> <b>Like us on <a href="http://www.facebook.com/pages/Greenbelt-MD/NASA-Goddard/395013845897?ref=tsd" rel="nofollow">Facebook</a></b> <b>Find us on <a href="http://instagram.com/nasagoddard?vm=grid" rel="nofollow">Instagram</a></b>
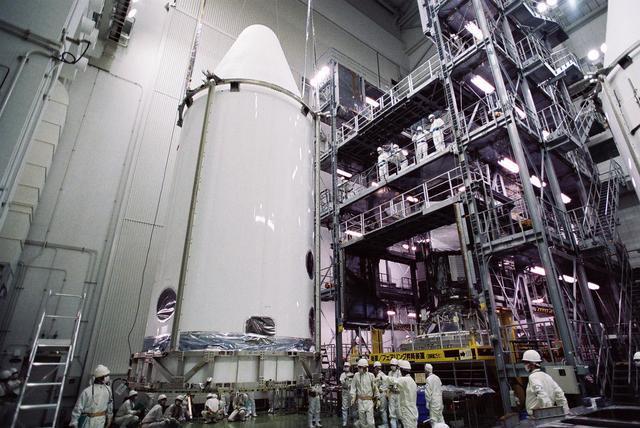
GPM is a joint mission between NASA and the Japan Aerospace Exploration Agency (JAXA). The Core Observatory will link data from a constellation of current and planned satellites to produce next-generation global measurements of rainfall and snowfall from space. On Feb. 11, the Core Observatory was moved into the spacecraft fairing assembly building and into the Encapsulation Hall. Final inspections and preparations were completed for the installation into the fairing, which began on Feb 13. The fairing is the part of the rocket that will contain the spacecraft at the top of the H-IIA rocket. The encapsulation process for the H-IIA is very different than for most U.S. rockets. For U.S. rockets, the fairing is usually in two pieces that close around the payload like a clamshell. To install the GPM Core Observatory into the fairing of the H-IIA rocket, first the Core Observatory and the Payload Attach Fitting (PAF) are set up in scaffolding in the Encapsulation Hall. Then, the fairing is lifted above and lowered onto the fitting. When only a few feet remain above the final position, stanchions support the fairing while technicians go inside to complete the electrical connections. When this is completed, they remove the stanchions and lower the fairing to its final position, where it is bolted in place. The GPM mission is the first coordinated international satellite network to provide near real-time observations of rain and snow every three hours anywhere on the globe. The GPM Core Observatory anchors this network by providing observations on all types of precipitation. The observatory's data acts as the measuring stick by which partner observations can be combined into a unified data set. The data will be used by scientists to study climate change, freshwater resources, floods and droughts, and hurricane formation and tracking. Credit: Japan Aerospace Exploration Agency <b><a href="http://www.nasa.gov/audience/formedia/features/MP_Photo_Guidelines.html" rel="nofollow">NASA image use policy.</a></b> <b><a href="http://www.nasa.gov/centers/goddard/home/index.html" rel="nofollow">NASA Goddard Space Flight Center</a></b> enables NASA’s mission through four scientific endeavors: Earth Science, Heliophysics, Solar System Exploration, and Astrophysics. Goddard plays a leading role in NASA’s accomplishments by contributing compelling scientific knowledge to advance the Agency’s mission. <b>Follow us on <a href="http://twitter.com/NASAGoddardPix" rel="nofollow">Twitter</a></b> <b>Like us on <a href="http://www.facebook.com/pages/Greenbelt-MD/NASA-Goddard/395013845897?ref=tsd" rel="nofollow">Facebook</a></b> <b>Find us on <a href="http://instagram.com/nasagoddard?vm=grid" rel="nofollow">Instagram</a></b>
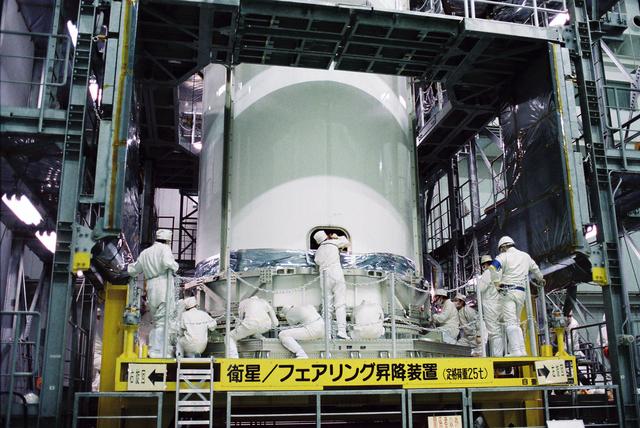
GPM is a joint mission between NASA and the Japan Aerospace Exploration Agency (JAXA). The Core Observatory will link data from a constellation of current and planned satellites to produce next-generation global measurements of rainfall and snowfall from space. On Feb. 11, the Core Observatory was moved into the spacecraft fairing assembly building and into the Encapsulation Hall. Final inspections and preparations were completed for the installation into the fairing, which began on Feb 13. The fairing is the part of the rocket that will contain the spacecraft at the top of the H-IIA rocket. The encapsulation process for the H-IIA is very different than for most U.S. rockets. For U.S. rockets, the fairing is usually in two pieces that close around the payload like a clamshell. To install the GPM Core Observatory into the fairing of the H-IIA rocket, first the Core Observatory and the Payload Attach Fitting (PAF) are set up in scaffolding in the Encapsulation Hall. Then, the fairing is lifted above and lowered onto the fitting. When only a few feet remain above the final position, stanchions support the fairing while technicians go inside to complete the electrical connections. When this is completed, they remove the stanchions and lower the fairing to its final position, where it is bolted in place. The GPM mission is the first coordinated international satellite network to provide near real-time observations of rain and snow every three hours anywhere on the globe. The GPM Core Observatory anchors this network by providing observations on all types of precipitation. The observatory's data acts as the measuring stick by which partner observations can be combined into a unified data set. The data will be used by scientists to study climate change, freshwater resources, floods and droughts, and hurricane formation and tracking. Credit: Japan Aerospace Exploration Agency <b><a href="http://www.nasa.gov/audience/formedia/features/MP_Photo_Guidelines.html" rel="nofollow">NASA image use policy.</a></b> <b><a href="http://www.nasa.gov/centers/goddard/home/index.html" rel="nofollow">NASA Goddard Space Flight Center</a></b> enables NASA’s mission through four scientific endeavors: Earth Science, Heliophysics, Solar System Exploration, and Astrophysics. Goddard plays a leading role in NASA’s accomplishments by contributing compelling scientific knowledge to advance the Agency’s mission. <b>Follow us on <a href="http://twitter.com/NASAGoddardPix" rel="nofollow">Twitter</a></b> <b>Like us on <a href="http://www.facebook.com/pages/Greenbelt-MD/NASA-Goddard/395013845897?ref=tsd" rel="nofollow">Facebook</a></b> <b>Find us on <a href="http://instagram.com/nasagoddard?vm=grid" rel="nofollow">Instagram</a></b>
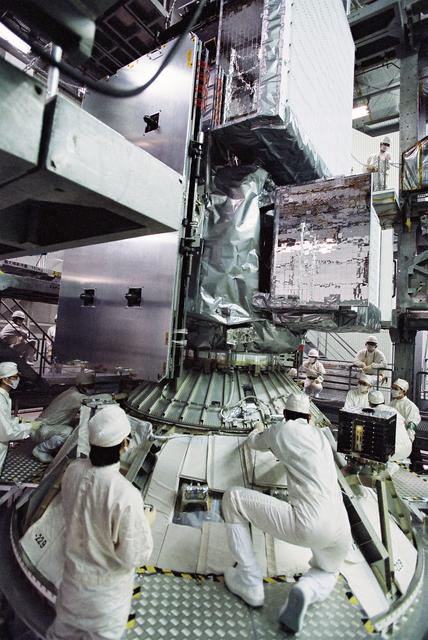
GPM is a joint mission between NASA and the Japan Aerospace Exploration Agency (JAXA). The Core Observatory will link data from a constellation of current and planned satellites to produce next-generation global measurements of rainfall and snowfall from space. On Feb. 11, the Core Observatory was moved into the spacecraft fairing assembly building and into the Encapsulation Hall. Final inspections and preparations were completed for the installation into the fairing, which began on Feb 13. The fairing is the part of the rocket that will contain the spacecraft at the top of the H-IIA rocket. The encapsulation process for the H-IIA is very different than for most U.S. rockets. For U.S. rockets, the fairing is usually in two pieces that close around the payload like a clamshell. To install the GPM Core Observatory into the fairing of the H-IIA rocket, first the Core Observatory and the Payload Attach Fitting (PAF) are set up in scaffolding in the Encapsulation Hall. Then, the fairing is lifted above and lowered onto the fitting. When only a few feet remain above the final position, stanchions support the fairing while technicians go inside to complete the electrical connections. When this is completed, they remove the stanchions and lower the fairing to its final position, where it is bolted in place. The GPM mission is the first coordinated international satellite network to provide near real-time observations of rain and snow every three hours anywhere on the globe. The GPM Core Observatory anchors this network by providing observations on all types of precipitation. The observatory's data acts as the measuring stick by which partner observations can be combined into a unified data set. The data will be used by scientists to study climate change, freshwater resources, floods and droughts, and hurricane formation and tracking. Credit: Japan Aerospace Exploration Agency <b><a href="http://www.nasa.gov/audience/formedia/features/MP_Photo_Guidelines.html" rel="nofollow">NASA image use policy.</a></b> <b><a href="http://www.nasa.gov/centers/goddard/home/index.html" rel="nofollow">NASA Goddard Space Flight Center</a></b> enables NASA’s mission through four scientific endeavors: Earth Science, Heliophysics, Solar System Exploration, and Astrophysics. Goddard plays a leading role in NASA’s accomplishments by contributing compelling scientific knowledge to advance the Agency’s mission. <b>Follow us on <a href="http://twitter.com/NASAGoddardPix" rel="nofollow">Twitter</a></b> <b>Like us on <a href="http://www.facebook.com/pages/Greenbelt-MD/NASA-Goddard/395013845897?ref=tsd" rel="nofollow">Facebook</a></b> <b>Find us on <a href="http://instagram.com/nasagoddard?vm=grid" rel="nofollow">Instagram</a></b>
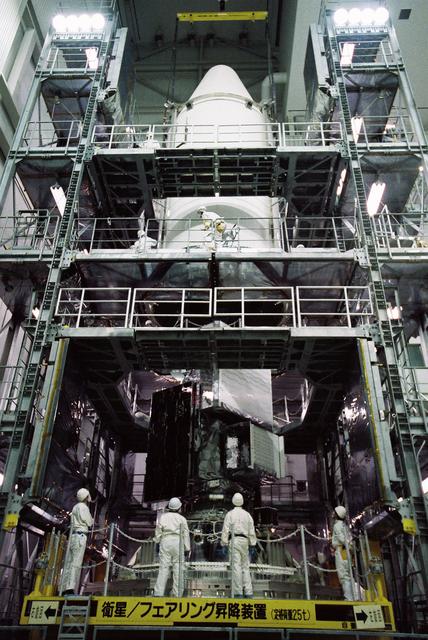
GPM is a joint mission between NASA and the Japan Aerospace Exploration Agency (JAXA). The Core Observatory will link data from a constellation of current and planned satellites to produce next-generation global measurements of rainfall and snowfall from space. On Feb. 11, the Core Observatory was moved into the spacecraft fairing assembly building and into the Encapsulation Hall. Final inspections and preparations were completed for the installation into the fairing, which began on Feb 13. The fairing is the part of the rocket that will contain the spacecraft at the top of the H-IIA rocket. The encapsulation process for the H-IIA is very different than for most U.S. rockets. For U.S. rockets, the fairing is usually in two pieces that close around the payload like a clamshell. To install the GPM Core Observatory into the fairing of the H-IIA rocket, first the Core Observatory and the Payload Attach Fitting (PAF) are set up in scaffolding in the Encapsulation Hall. Then, the fairing is lifted above and lowered onto the fitting. When only a few feet remain above the final position, stanchions support the fairing while technicians go inside to complete the electrical connections. When this is completed, they remove the stanchions and lower the fairing to its final position, where it is bolted in place. The GPM mission is the first coordinated international satellite network to provide near real-time observations of rain and snow every three hours anywhere on the globe. The GPM Core Observatory anchors this network by providing observations on all types of precipitation. The observatory's data acts as the measuring stick by which partner observations can be combined into a unified data set. The data will be used by scientists to study climate change, freshwater resources, floods and droughts, and hurricane formation and tracking. Credit: Japan Aerospace Exploration Agency <b><a href="http://www.nasa.gov/audience/formedia/features/MP_Photo_Guidelines.html" rel="nofollow">NASA image use policy.</a></b> <b><a href="http://www.nasa.gov/centers/goddard/home/index.html" rel="nofollow">NASA Goddard Space Flight Center</a></b> enables NASA’s mission through four scientific endeavors: Earth Science, Heliophysics, Solar System Exploration, and Astrophysics. Goddard plays a leading role in NASA’s accomplishments by contributing compelling scientific knowledge to advance the Agency’s mission. <b>Follow us on <a href="http://twitter.com/NASAGoddardPix" rel="nofollow">Twitter</a></b> <b>Like us on <a href="http://www.facebook.com/pages/Greenbelt-MD/NASA-Goddard/395013845897?ref=tsd" rel="nofollow">Facebook</a></b> <b>Find us on <a href="http://instagram.com/nasagoddard?vm=grid" rel="nofollow">Instagram</a></b>
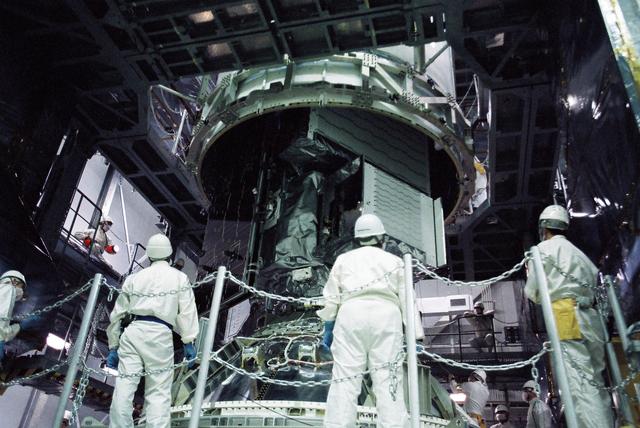
GPM is a joint mission between NASA and the Japan Aerospace Exploration Agency (JAXA). The Core Observatory will link data from a constellation of current and planned satellites to produce next-generation global measurements of rainfall and snowfall from space. On Feb. 11, the Core Observatory was moved into the spacecraft fairing assembly building and into the Encapsulation Hall. Final inspections and preparations were completed for the installation into the fairing, which began on Feb 13. The fairing is the part of the rocket that will contain the spacecraft at the top of the H-IIA rocket. The encapsulation process for the H-IIA is very different than for most U.S. rockets. For U.S. rockets, the fairing is usually in two pieces that close around the payload like a clamshell. To install the GPM Core Observatory into the fairing of the H-IIA rocket, first the Core Observatory and the Payload Attach Fitting (PAF) are set up in scaffolding in the Encapsulation Hall. Then, the fairing is lifted above and lowered onto the fitting. When only a few feet remain above the final position, stanchions support the fairing while technicians go inside to complete the electrical connections. When this is completed, they remove the stanchions and lower the fairing to its final position, where it is bolted in place. The GPM mission is the first coordinated international satellite network to provide near real-time observations of rain and snow every three hours anywhere on the globe. The GPM Core Observatory anchors this network by providing observations on all types of precipitation. The observatory's data acts as the measuring stick by which partner observations can be combined into a unified data set. The data will be used by scientists to study climate change, freshwater resources, floods and droughts, and hurricane formation and tracking. Credit: Japan Aerospace Exploration Agency <b><a href="http://www.nasa.gov/audience/formedia/features/MP_Photo_Guidelines.html" rel="nofollow">NASA image use policy.</a></b> <b><a href="http://www.nasa.gov/centers/goddard/home/index.html" rel="nofollow">NASA Goddard Space Flight Center</a></b> enables NASA’s mission through four scientific endeavors: Earth Science, Heliophysics, Solar System Exploration, and Astrophysics. Goddard plays a leading role in NASA’s accomplishments by contributing compelling scientific knowledge to advance the Agency’s mission. <b>Follow us on <a href="http://twitter.com/NASAGoddardPix" rel="nofollow">Twitter</a></b> <b>Like us on <a href="http://www.facebook.com/pages/Greenbelt-MD/NASA-Goddard/395013845897?ref=tsd" rel="nofollow">Facebook</a></b> <b>Find us on <a href="http://instagram.com/nasagoddard?vm=grid" rel="nofollow">Instagram</a></b>
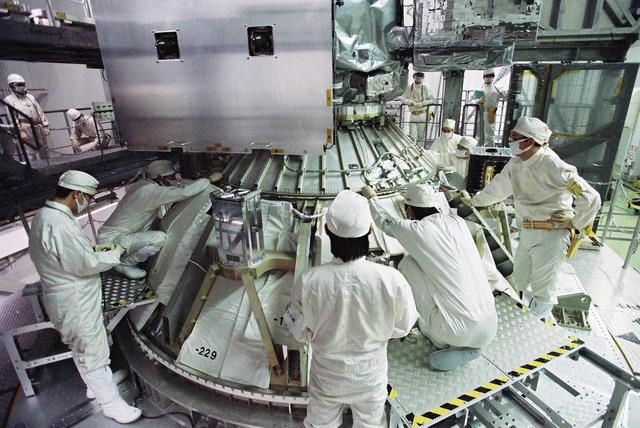
GPM is a joint mission between NASA and the Japan Aerospace Exploration Agency (JAXA). The Core Observatory will link data from a constellation of current and planned satellites to produce next-generation global measurements of rainfall and snowfall from space. On Feb. 11, the Core Observatory was moved into the spacecraft fairing assembly building and into the Encapsulation Hall. Final inspections and preparations were completed for the installation into the fairing, which began on Feb 13. The fairing is the part of the rocket that will contain the spacecraft at the top of the H-IIA rocket. The encapsulation process for the H-IIA is very different than for most U.S. rockets. For U.S. rockets, the fairing is usually in two pieces that close around the payload like a clamshell. To install the GPM Core Observatory into the fairing of the H-IIA rocket, first the Core Observatory and the Payload Attach Fitting (PAF) are set up in scaffolding in the Encapsulation Hall. Then, the fairing is lifted above and lowered onto the fitting. When only a few feet remain above the final position, stanchions support the fairing while technicians go inside to complete the electrical connections. When this is completed, they remove the stanchions and lower the fairing to its final position, where it is bolted in place. The GPM mission is the first coordinated international satellite network to provide near real-time observations of rain and snow every three hours anywhere on the globe. The GPM Core Observatory anchors this network by providing observations on all types of precipitation. The observatory's data acts as the measuring stick by which partner observations can be combined into a unified data set. The data will be used by scientists to study climate change, freshwater resources, floods and droughts, and hurricane formation and tracking. Credit: Japan Aerospace Exploration Agency <b><a href="http://www.nasa.gov/audience/formedia/features/MP_Photo_Guidelines.html" rel="nofollow">NASA image use policy.</a></b> <b><a href="http://www.nasa.gov/centers/goddard/home/index.html" rel="nofollow">NASA Goddard Space Flight Center</a></b> enables NASA’s mission through four scientific endeavors: Earth Science, Heliophysics, Solar System Exploration, and Astrophysics. Goddard plays a leading role in NASA’s accomplishments by contributing compelling scientific knowledge to advance the Agency’s mission. <b>Follow us on <a href="http://twitter.com/NASAGoddardPix" rel="nofollow">Twitter</a></b> <b>Like us on <a href="http://www.facebook.com/pages/Greenbelt-MD/NASA-Goddard/395013845897?ref=tsd" rel="nofollow">Facebook</a></b> <b>Find us on <a href="http://instagram.com/nasagoddard?vm=grid" rel="nofollow">Instagram</a></b>
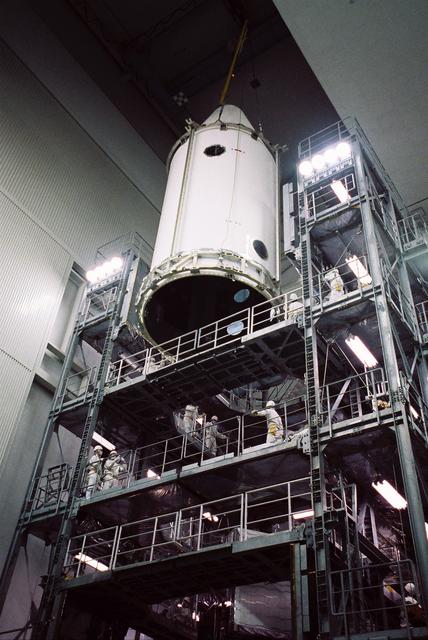
GPM is a joint mission between NASA and the Japan Aerospace Exploration Agency (JAXA). The Core Observatory will link data from a constellation of current and planned satellites to produce next-generation global measurements of rainfall and snowfall from space. On Feb. 11, the Core Observatory was moved into the spacecraft fairing assembly building and into the Encapsulation Hall. Final inspections and preparations were completed for the installation into the fairing, which began on Feb 13. The fairing is the part of the rocket that will contain the spacecraft at the top of the H-IIA rocket. The encapsulation process for the H-IIA is very different than for most U.S. rockets. For U.S. rockets, the fairing is usually in two pieces that close around the payload like a clamshell. To install the GPM Core Observatory into the fairing of the H-IIA rocket, first the Core Observatory and the Payload Attach Fitting (PAF) are set up in scaffolding in the Encapsulation Hall. Then, the fairing is lifted above and lowered onto the fitting. When only a few feet remain above the final position, stanchions support the fairing while technicians go inside to complete the electrical connections. When this is completed, they remove the stanchions and lower the fairing to its final position, where it is bolted in place. The GPM mission is the first coordinated international satellite network to provide near real-time observations of rain and snow every three hours anywhere on the globe. The GPM Core Observatory anchors this network by providing observations on all types of precipitation. The observatory's data acts as the measuring stick by which partner observations can be combined into a unified data set. The data will be used by scientists to study climate change, freshwater resources, floods and droughts, and hurricane formation and tracking. Credit: Japan Aerospace Exploration Agency <b><a href="http://www.nasa.gov/audience/formedia/features/MP_Photo_Guidelines.html" rel="nofollow">NASA image use policy.</a></b> <b><a href="http://www.nasa.gov/centers/goddard/home/index.html" rel="nofollow">NASA Goddard Space Flight Center</a></b> enables NASA’s mission through four scientific endeavors: Earth Science, Heliophysics, Solar System Exploration, and Astrophysics. Goddard plays a leading role in NASA’s accomplishments by contributing compelling scientific knowledge to advance the Agency’s mission. <b>Follow us on <a href="http://twitter.com/NASAGoddardPix" rel="nofollow">Twitter</a></b> <b>Like us on <a href="http://www.facebook.com/pages/Greenbelt-MD/NASA-Goddard/395013845897?ref=tsd" rel="nofollow">Facebook</a></b> <b>Find us on <a href="http://instagram.com/nasagoddard?vm=grid" rel="nofollow">Instagram</a></b>
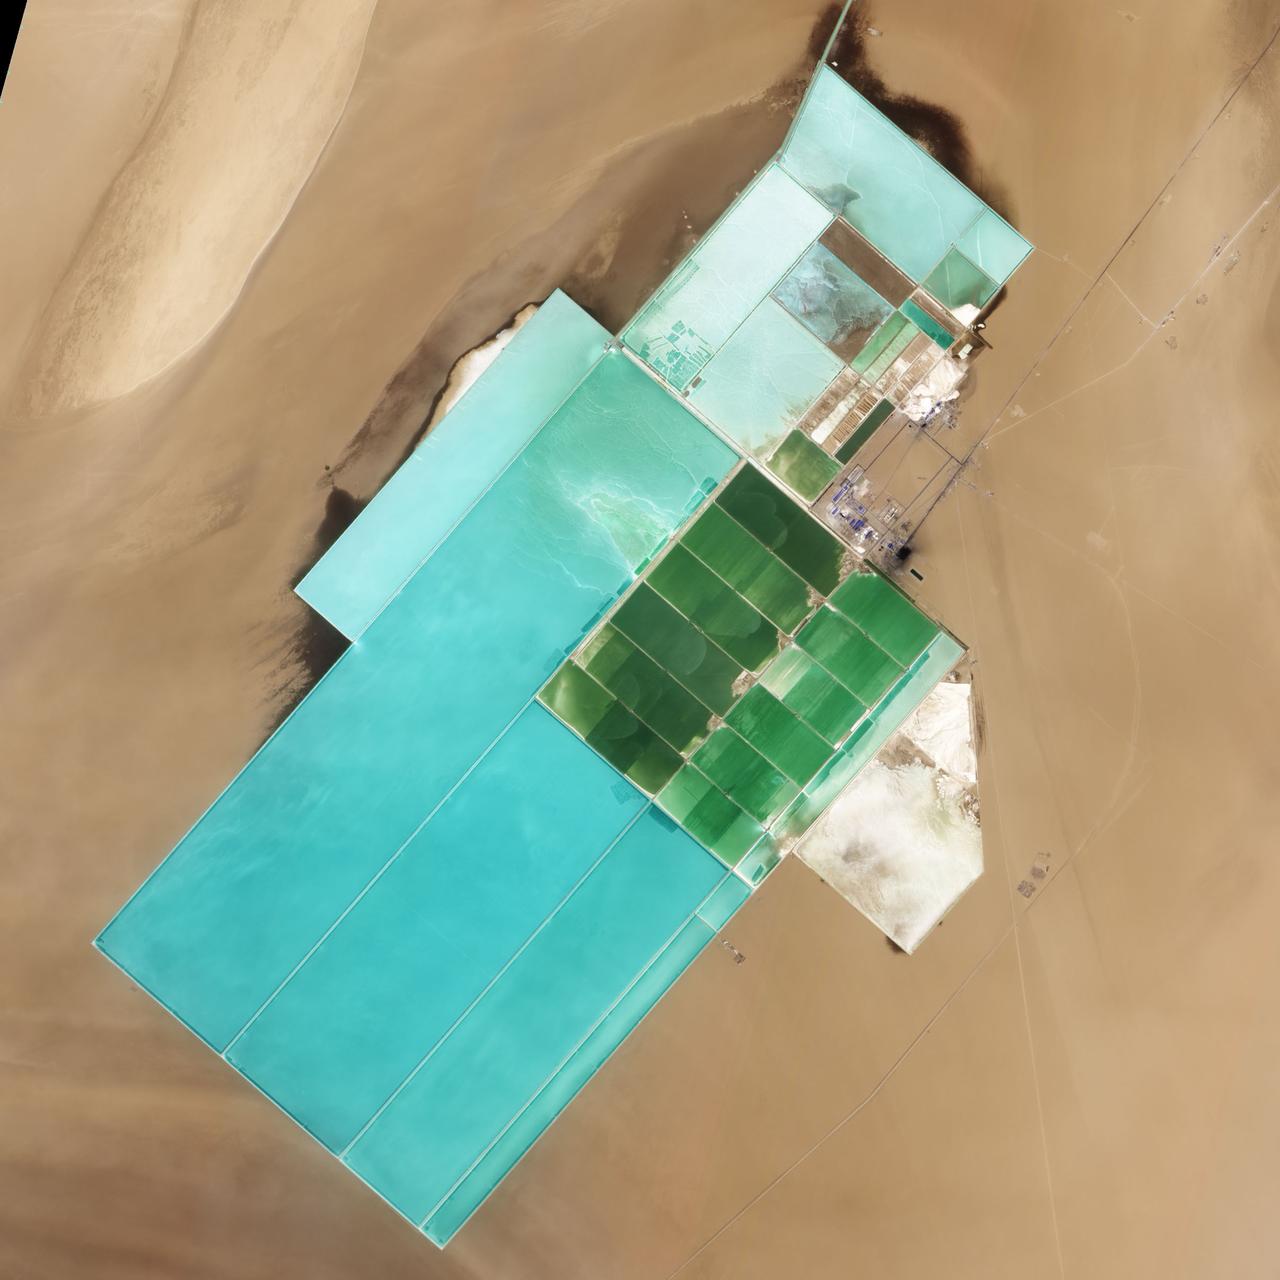
NASA image acquired May 17, 2011 Located in China’s resource-rich but moisture-poor Xinjiang autonomous region, Lop Nur is an uninviting location for any kind of agriculture. It sits at the eastern end of the Taklimakan Desert, where marching sand dunes can reach heights of 200 meters (650 feet), and dust storms rage across the landscape. Yet for all it lacks in agricultural appeal, Lop Nur offers something valuable to farmers the world over: potash. This potassium salt provides a major nutrient required for plant growth, making it a key ingredient in fertilizer. The discovery of potash at Lop Nur in the mid-1990s turned the area into a large-scale mining operation. The Advanced Land Imager (ALI) on NASA’s Earth Observing-1 (EO-1) satellite captured this natural-color image of Lop Nur on May 17, 2011. The rectangular shapes in this image show the bright colors characteristic of solar evaporation ponds. Around the evaporation ponds are the earth tones typical of sandy desert. During the early and middle Pleistocene epoch, this area held a large brackish lake. Uplift of the northern part of the lake in the late Pleistocene created hollows that became receptacles for potash deposition. The main potash deposits found at Lop Nur today are brine potash, and this site is the second-largest source of potash in China. Lop Nur slowly dried up in the Holocene. The area now receives average annual precipitation of just 31.2 millimeters (1.2 inches), and experiences annual evaporation of 2,901 millimeters (114 inches), according to a study published in 2008. The study found, however, that this area has experienced seven major climate changes since the end of the Pleistocene, including climatic conditions far more favorable to farming and settlement than today. Examination of plant and mollusk remains at the lake, as well as studies of sediments, indicate that the Lop Nur region experienced a severe drought about 3,000 years ago, followed by wetter conditions. Between 1,250 and 400 years ago, Lop Nur likely experienced the conditions most favorable to farming and settlement, and red willow trees grew in the area. Pottery dating from the Tang and Song dynasties further testifies to welcoming conditions at the lake centuries ago. Starting around 400 years ago, however, a more arid climate took hold, completely drying out Lop Nur. Today, by providing potash, the desiccated lake still supports agriculture, but it does so for farming efforts further afield. NASA Earth Observatory image created by Jesse Allen and Robert Simmon, using EO-1 ALI data provided courtesy of the NASA EO-1 team. Caption by Michon Scott. Instrument: EO-1 - ALI Credit: <b><a href="http://www.earthobservatory.nasa.gov/" rel="nofollow"> NASA Earth Observatory</a></b> <b><a href="http://www.nasa.gov/centers/goddard/home/index.html" rel="nofollow">NASA Goddard Space Flight Center</a></b> enables NASA’s mission through four scientific endeavors: Earth Science, Heliophysics, Solar System Exploration, and Astrophysics. Goddard plays a leading role in NASA’s accomplishments by contributing compelling scientific knowledge to advance the Agency’s mission. <b>Follow us on <a href="http://twitter.com/NASA_GoddardPix" rel="nofollow">Twitter</a></b> <b>Like us on <a href="http://www.facebook.com/pages/Greenbelt-MD/NASA-Goddard/395013845897?ref=tsd" rel="nofollow">Facebook</a></b> <b>Find us on <a href="http://web.stagram.com/n/nasagoddard/?vm=grid" rel="nofollow">Instagram</a></b>
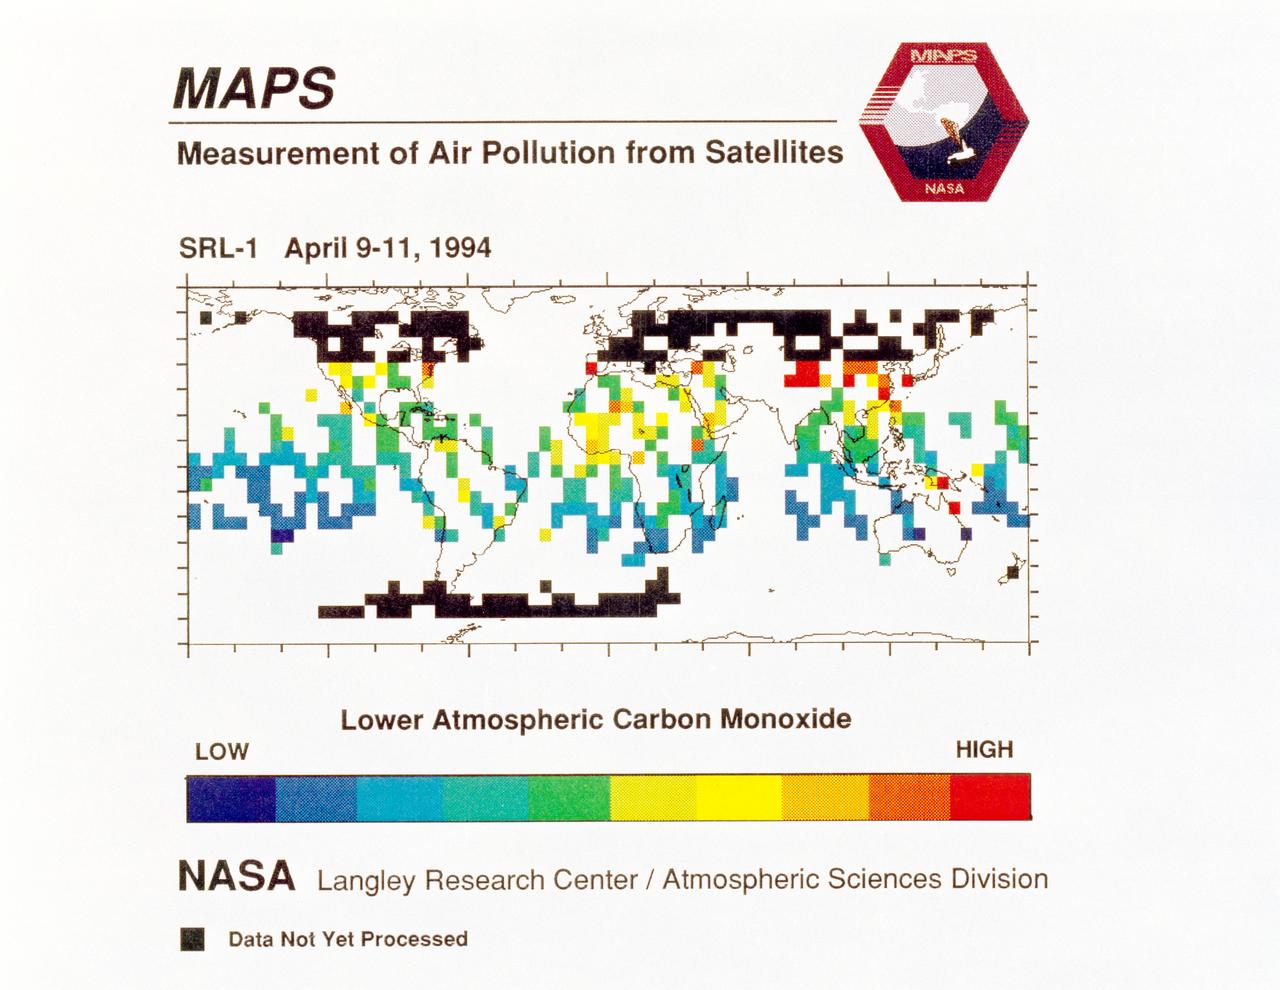
STS059-S-040 (12 April 1994) --- STS-59's MAPS (Measurement of Air Pollution from Satellites) experiment is sending real-time data that provides the most comprehensive view of carbon monoxide concentrations on Earth ever recorded. This computer image shows a summary of "quick look" data obtained by the MAPS instrument during its first days of operations as part of the Space Shuttle Endeavour's SRL-1 payload. This data will be processed using more sophisticated techniques following the flight. The color red indicates areas with the highest levels of carbon monoxide. These Northern Hemisphere springtime carbon monoxide values are generally significantly higher than the values found in the Southern Hemisphere. This is in direct contrast to the data obtained by the MAPS experiment during November 1981 and October 1984, i.e. during Northern Hemisphere fall. The astronauts aboard Endeavour have seen fires in most of the areas showing higher carbon monoxide values (China, Eastern Australia, and equatorial Africa). The relationship between the observed fires and the higher carbon monoxide values will be investigated following SRL-1 by combining the MAPS data with meteorological data, surface imagery, and Space Shuttle hand-held photographs. By the end of SRL-1, MAPS will have acquired data over most of the globe between 57 degrees north and 57 degrees south latitudes. The entire data set will be carefully analyzed using sophisticated post-flight data processing techniques. The data will then be applied in a variety of scientific studies concerning chemistry and transport processes in the atmosphere. The MAPS experiment measures the carbon monoxide in the lower atmosphere. This gas is produced both as a result of natural processes and as a result of human activities. The primary human resources of carbon monoxide are automobiles and industry and the burning of plant materials. The primary natural source is the interaction of sunlight with naturally occurring ozone and water vapor. The strength of all of these sources changes seasonally.
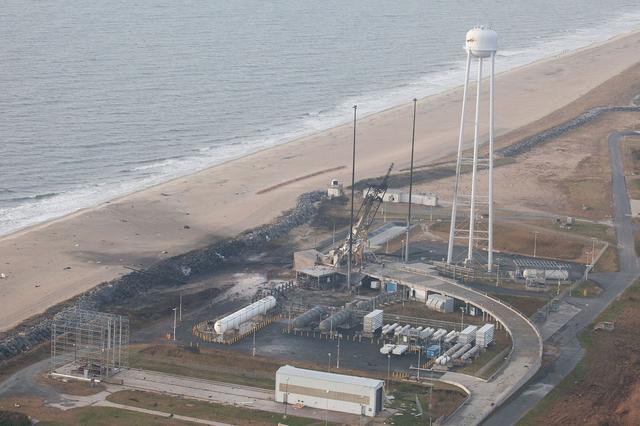
An aerial view of the Wallops Island launch facilities taken by the Wallops Incident Response Team Oct. 29 following the failed launch attempt of Orbital Science Corp.'s Antares rocket Oct. 28. Credit: NASA/Terry Zaperach --- The Wallops Incident Response Team completed today an initial assessment of Wallops Island, Virginia, following the catastrophic failure of Orbital Science Corp.’s Antares rocket shortly after liftoff at 6:22 p.m. EDT Tuesday, Oct. 28, from Pad 0A of the Mid-Atlantic Regional Spaceport at NASA’s Wallops Flight Facility in Virginia. “I want to praise the launch team, range safety, all of our emergency responders and those who provided mutual aid and support on a highly-professional response that ensured the safety of our most important resource -- our people,” said Bill Wrobel, Wallops director. “In the coming days and weeks ahead, we'll continue to assess the damage on the island and begin the process of moving forward to restore our space launch capabilities. There's no doubt in my mind that we will rebound stronger than ever.” The initial assessment is a cursory look; it will take many more weeks to further understand and analyze the full extent of the effects of the event. A number of support buildings in the immediate area have broken windows and imploded doors. A sounding rocket launcher adjacent to the pad, and buildings nearest the pad, suffered the most severe damage. At Pad 0A the initial assessment showed damage to the transporter erector launcher and lightning suppression rods, as well as debris around the pad. The Wallops team also met with a group of state and local officials, including the Virginia Department of Environmental Quality, the Virginia Department of Emergency Management, the Virginia Marine Police, and the U.S. Coast Guard. The Wallops environmental team also is conducting assessments at the site. Preliminary observations are that the environmental effects of the launch failure were largely contained within the southern third of Wallops Island, in the area immediately adjacent to the pad. Immediately after the incident, the Wallops’ industrial hygienist collected air samples at the Wallops mainland area, the Highway 175 causeway, and on Chincoteague Island. No hazardous substances were detected at the sampled locations. Additional air, soil and water samples will be collected from the incident area as well as at control sites for comparative analysis. The Coast Guard and Virginia Marine Resources Commission reported today they have not observed any obvious signs of water pollution, such as oil sheens. Furthermore, initial assessments have not revealed any obvious impacts to fish or wildlife resources. The Incident Response Team continues to monitor and assess. Following the initial assessment, the response team will open the area of Wallops Island, north of the island flagpole opposite of the launch pad location, to allow the U.S. Navy to return back to work. Anyone who finds debris or damage to their property in the vicinity of the launch mishap is cautioned to stay away from it and call the Incident Response Team at 757-824-1295. Further updates on the situation and the progress of the ongoing investigation will be available at: <a href="http://www.orbital.com" rel="nofollow">www.orbital.com</a> and <a href="http://www.nasa.gov/orbital" rel="nofollow">www.nasa.gov/orbital</a> <b><a href="http://www.nasa.gov/audience/formedia/features/MP_Photo_Guidelines.html" rel="nofollow">NASA image use policy.</a></b> <b><a href="http://www.nasa.gov/centers/goddard/home/index.html" rel="nofollow">NASA Goddard Space Flight Center</a></b> enables NASA’s mission through four scientific endeavors: Earth Science, Heliophysics, Solar System Exploration, and Astrophysics. Goddard plays a leading role in NASA’s accomplishments by contributing compelling scientific knowledge to advance the Agency’s mission. <b>Follow us on <a href="http://twitter.com/NASAGoddardPix" rel="nofollow">Twitter</a></b> <b>Like us on <a href="http://www.facebook.com/pages/Greenbelt-MD/NASA-Goddard/395013845897?ref=tsd" rel="nofollow">Facebook</a></b> <b>Find us on <a href="http://instagram.com/nasagoddard?vm=grid" rel="nofollow">Instagram</a></b>
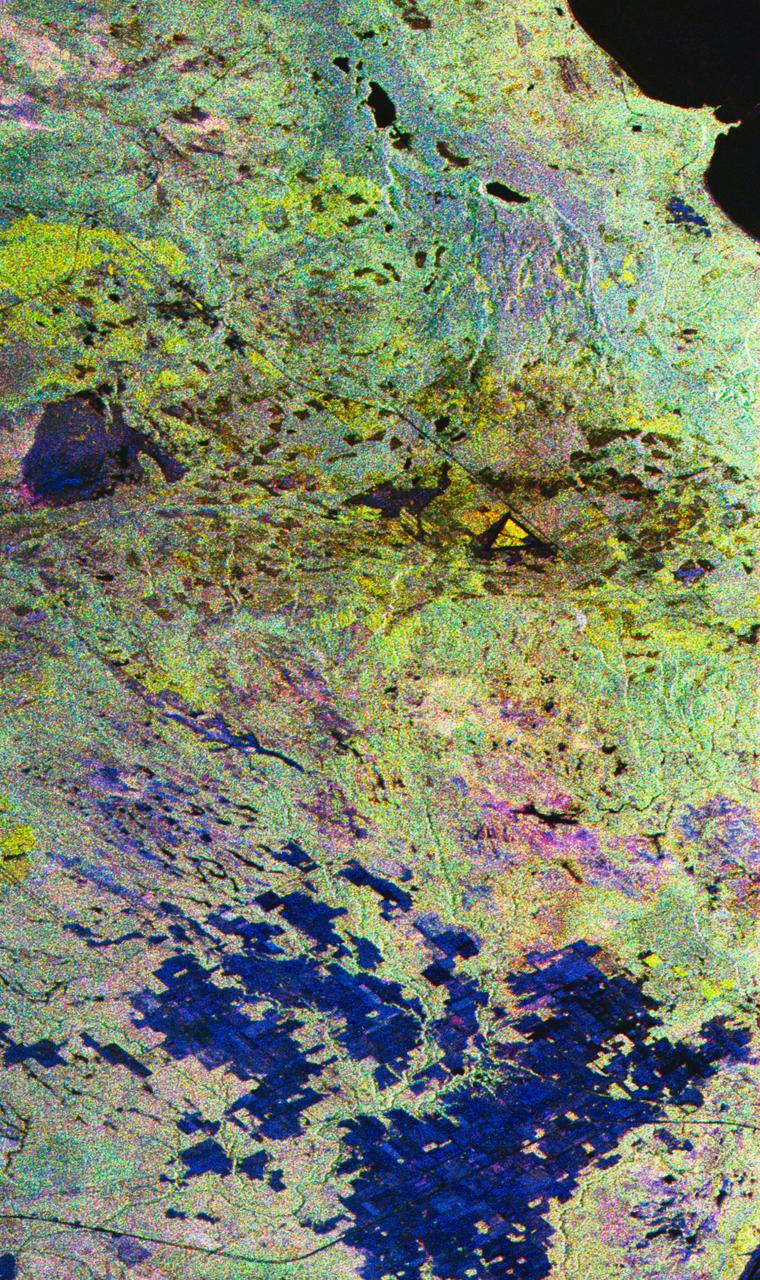
STS059-S-027 (10 April 1994) --- This image is a false-color composite of Raco, Michigan, centered at 46.39 degrees north latitude, 84.88 degrees east longitude. This image was acquired by the Spaceborne Imaging Radar-C and X-Band Synthetic Aperture Radar (SIR-C/X-SAR) aboard the Space Shuttle Endeavour on its 6th orbit and during the first full-capacity test of the instrument. This image was produced using both L-Band and C-Band data. The area shown is approximately 20 kilometers by 50 kilometers. Raco is located at the eastern end of Michigan's upper peninsula, west of Sault Ste. Marie and south of Whitefish Bay on Lake Superior. The site is located at the boundary between the boreal forests and the northern temperate forests, a transitional zone that is expected to be ecologically sensitive to anticipated global changes resulting from climatic warming. On any given day, there is a 60 percent chance that this area will be obscured to some extent by cloud cover which makes it difficult to image using optical sensors. In this color representation (Red=LHH, Green=LHV, Blue=CHH), darker areas in the image are smooth surfaces such as frozen lakes and other non-forested areas. The colors are related to the types of trees and the brightness is related to the amount of plant material covering the surface, called forest biomass. Accurate information about land-cover is important to area resource managers and for use in regional- to global-scale scientific models used to understand global change. SIR-C/X-SAR radars illuminate Earth with microwaves allowing detailed observations at any time, regardless of weather or sunlight conditions. SIR-C/X-SAR uses three microwave wavelengths: L-Band (24 cm), C-Band (6 cm), and X-Band (3 cm). The multi-frequency data will be used by the international scientific community to better understand the global environment and how it is changing. The SIR-C/X-SAR data, complemented by aircraft and ground studies, will give scientists clearer insights into those environmental changes which are caused by nature and those changes which are induced by human activity. SIR-C was developed by NASA's Jet Propulsion Laboratory (JPL). X-SAR was developed by the Dornire and Alenia Spazio Companies for the German Space Agency, Deutsche Agentur fuer Raumfahrtangelegenheiten (DARA), and the Italian Space Agency, Agenzia Spaziale Italiana (ASI). JPL Photo ID: P-43882

NASA image release March 11, 2011 Caption: The lunar farside as never seen before! LROC WAC orthographic projection centered at 180° longitude, 0° latitude. Credit: NASA/Goddard/Arizona State University. Because the moon is tidally locked (meaning the same side always faces Earth), it was not until 1959 that the farside was first imaged by the Soviet Luna 3 spacecraft (hence the Russian names for prominent farside features, such as Mare Moscoviense). And what a surprise - unlike the widespread maria on the nearside, basaltic volcanism was restricted to a relatively few, smaller regions on the farside, and the battered highlands crust dominated. A different world from what we saw from Earth. Of course, the cause of the farside/nearside asymmetry is an interesting scientific question. Past studies have shown that the crust on the farside is thicker, likely making it more difficult for magmas to erupt on the surface, limiting the amount of farside mare basalts. Why is the farside crust thicker? That is still up for debate, and in fact several presentations at this week's Lunar and Planetary Science Conference attempt to answer this question. The Clementine mission obtained beautiful mosaics with the sun high in the sky (low phase angles), but did not have the opportunity to observe the farside at sun angles favorable for seeing surface topography. This WAC mosaic provides the most complete look at the morphology of the farside to date, and will provide a valuable resource for the scientific community. And it's simply a spectacular sight! The Lunar Reconnaissance Orbiter Camera (LROC) Wide Angle Camera (WAC) is a push-frame camera that captures seven color bands (321, 360, 415, 566, 604, 643, and 689 nm) with a 57-km swath (105-km swath in monochrome mode) from a 50 km orbit. One of the primary objectives of LROC is to provide a global 100 m/pixel monochrome (643 nm) base map with incidence angles between 55°-70° at the equator, lighting that is favorable for morphological interpretations. Each month, the WAC provides nearly complete coverage of the Moon under unique lighting. As an added bonus, the orbit-to-orbit image overlap provides stereo coverage. Reducing all these stereo images into a global topographic map is a big job, and is being led by LROC Team Members from the German Aerospace Center (Deutsches Zentrum für Luft- und Raumfahrt; DLR). Several preliminary WAC topographic products have appeared in LROC featured images over the past year (Orientale basin, Sinus Iridum). For a sneak preview of the WAC global DEM with the WAC global mosaic, view a rotating composite moon (70 MB video from ASU's LROC website). The WAC topographic dataset will be completed and released later this year. The global mosaic released today is comprised of over 15,000 WAC images acquired between November 2009 and February 2011. The non-polar images were map projected onto the GLD100 shape model (WAC derived 100 m/pixel DTM), while polar images were map projected on the LOLA shape model. In addition, the LOLA derived crossover corrected ephemeris, and an improved camera pointing, provide accurate positioning (better than 100 m) of each WAC image. As part of the March 2011 PDS release, the LROC team posted the global map in ten regional tiles. Eight of the tiles are equirectangular projections that encompass 60° latitude by 90° longitude. In addition, two polar stereographic projections are available for each pole from ±60° to the pole. These reduced data records (RDR) products will be available for download on March 15, 2011. As the mission progresses, and our knowledge of the lunar photometric function increases, improved and new mosaics will be released! Work your way around the moon with these six orthographic projections constructed from WAC mosaics. The nearside view linked below is different from that released on 21 February. To read more con't here: <a href="http://www.nasa.gov/mission_pages/LRO/news/lro-farside.html" rel="nofollow">www.nasa.gov/mission_pages/LRO/news/lro-farside.html</a> <b><a href="http://www.nasa.gov/centers/goddard/home/index.html" rel="nofollow">NASA Goddard Space Flight Center</a></b> enables NASA’s mission through four scientific endeavors: Earth Science, Heliophysics, Solar System Exploration, and Astrophysics. Goddard plays a leading role in NASA’s accomplishments by contributing compelling scientific knowledge to advance the Agency’s mission. <b>Follow us on <a href="http://twitter.com/NASA_GoddardPix" rel="nofollow">Twitter</a></b> <b>Join us on <a href="http://www.facebook.com/pages/Greenbelt-MD/NASA-Goddard/395013845897?ref=tsd" rel="nofollow">Facebook</a></b>