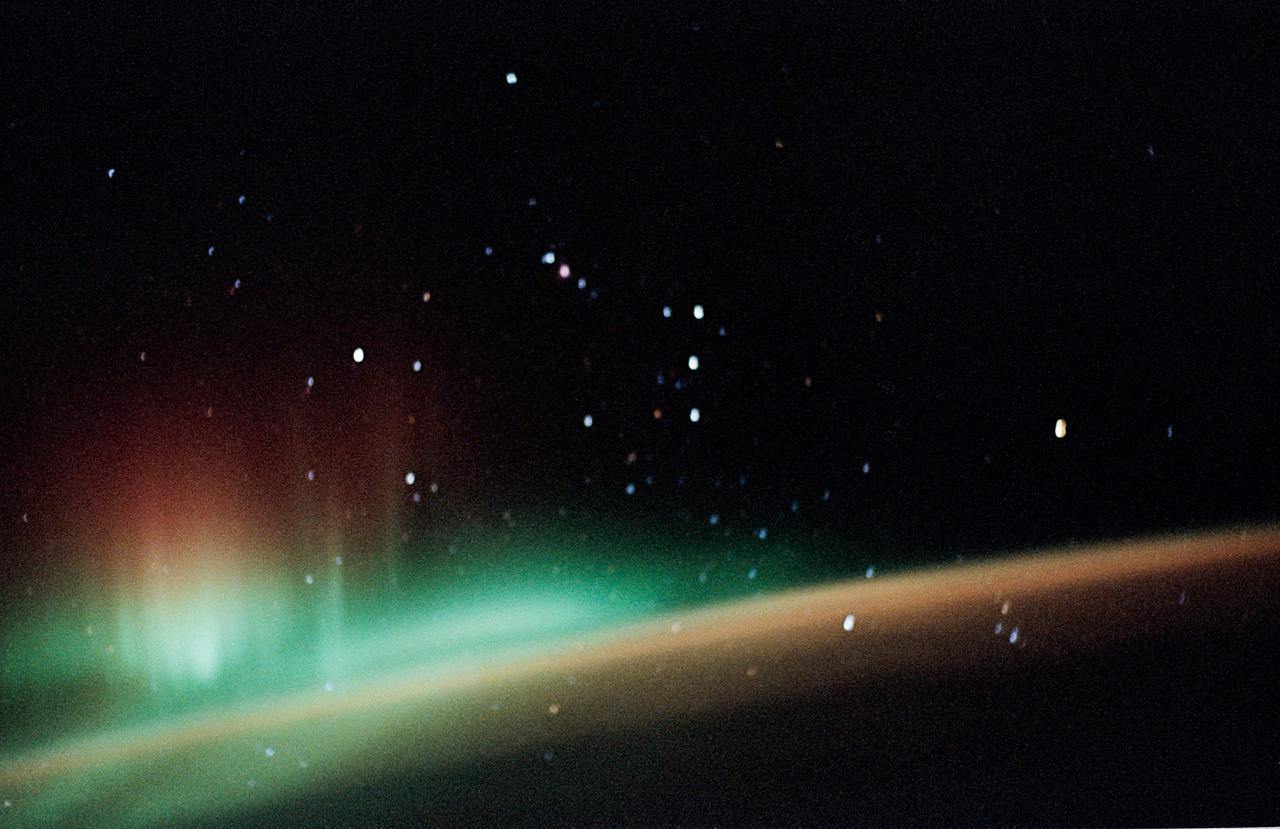
STS059-52-029 (9-20 April 1994) --- The constellation Orion is backdropped against a colorful display of the Southern Lights (aurora australis) in this 35mm image. Six NASA astronauts went on to spend a week and a half aboard the Space Shuttle Endeavour in support of the Space Radar Laboratory (SRL-1) mission.
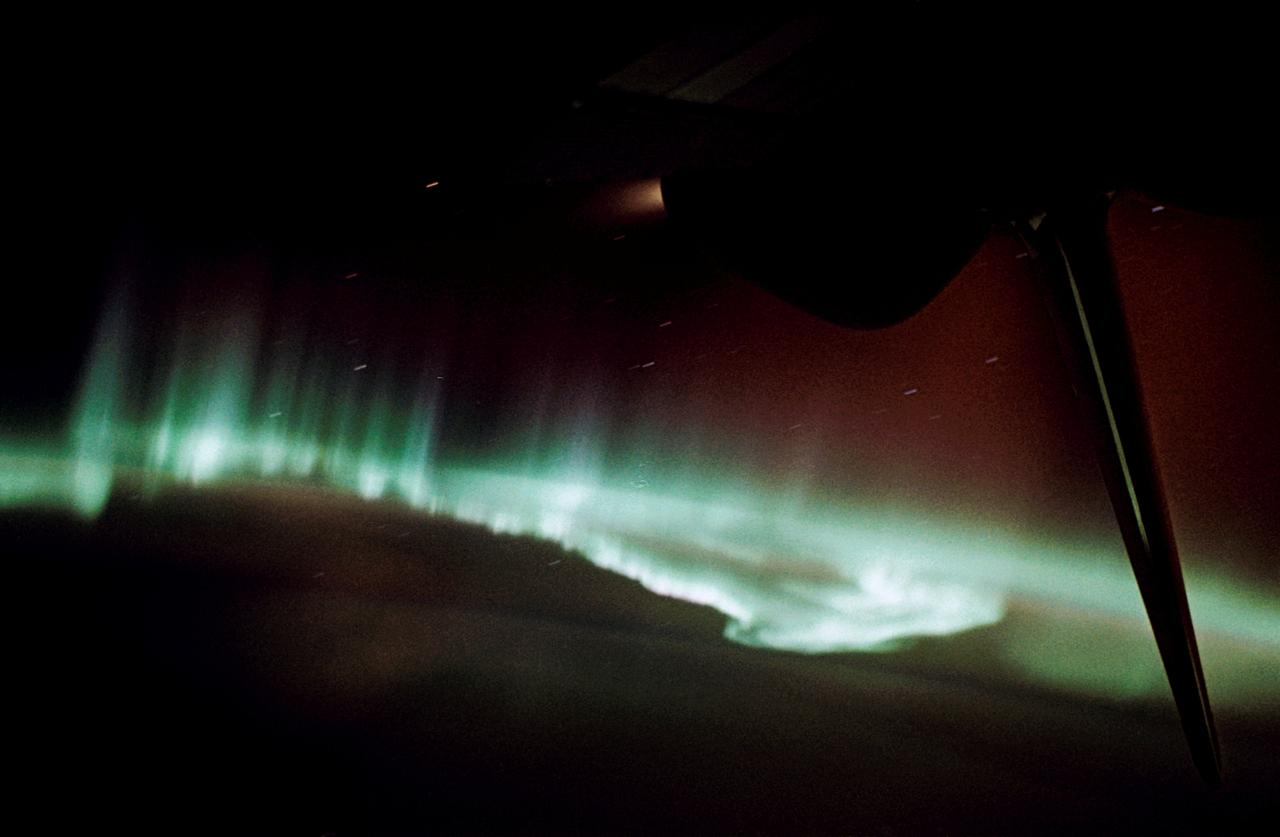
STS059-58-018 (9-20 April 1994) --- Part of the Space Shuttle Endeavour and its Space Radar Laboratory (SRL-1) payload are backdropped against a colorful display of the Southern Lights (aurora australis). The vehicle was firing a reaction control subsystem thruster (below center) when the 35mm image was exposed.
STS059-213-019 (9-20 April 1994) --- SRL scientists will use these photographs with the radar imagery to discriminate among different ages of basalt flows, and different ecosystems of shrub communities, on these equatorial volcanic islands. Aims are twofold: to understand the history of physical and biological systems on the islands themselves, and to extend what is learned to other, less-well-known areas globally. Hasselblad photograph.
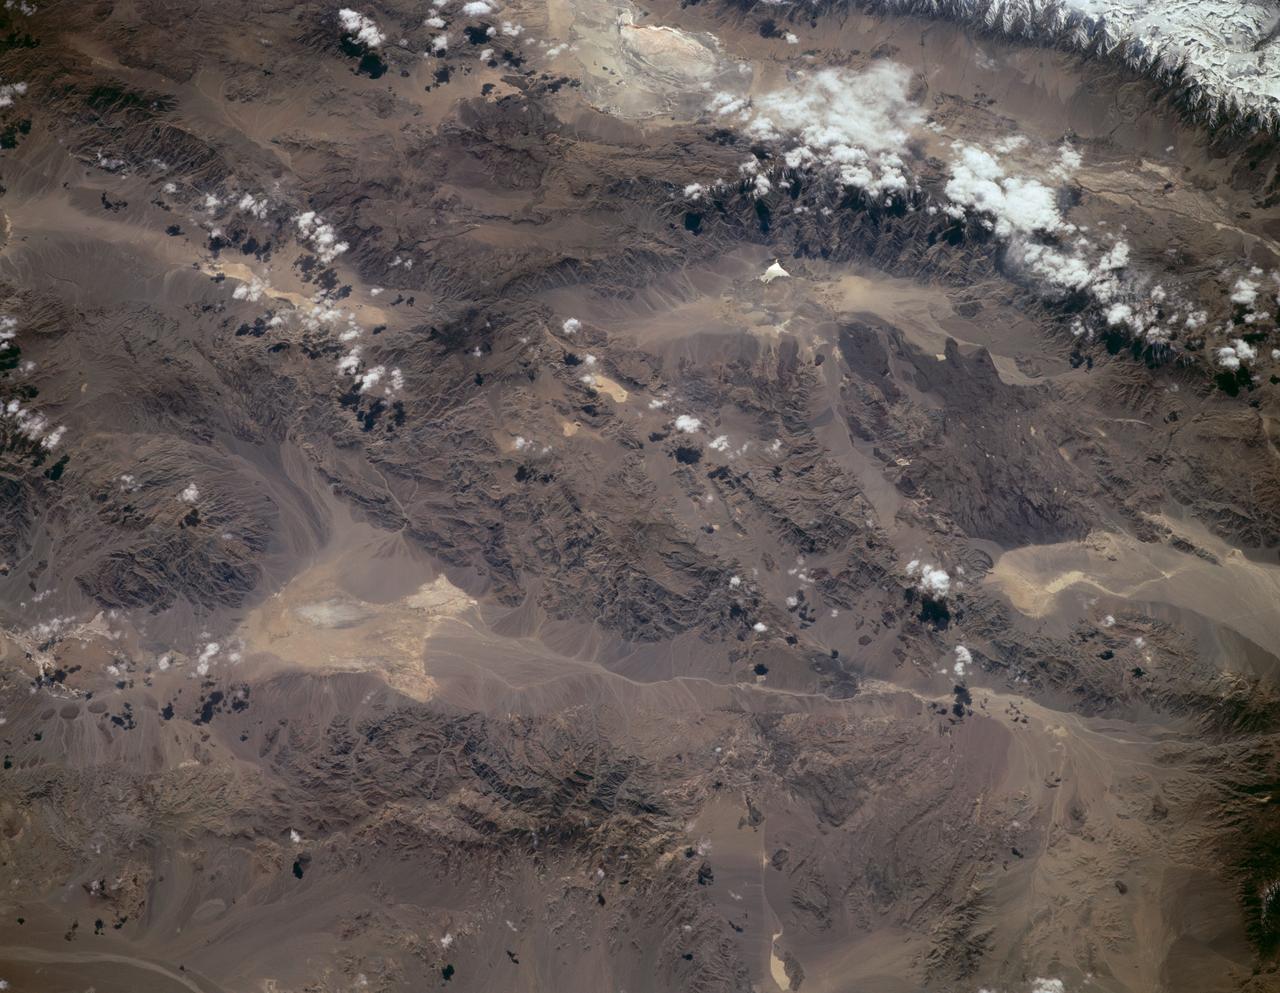
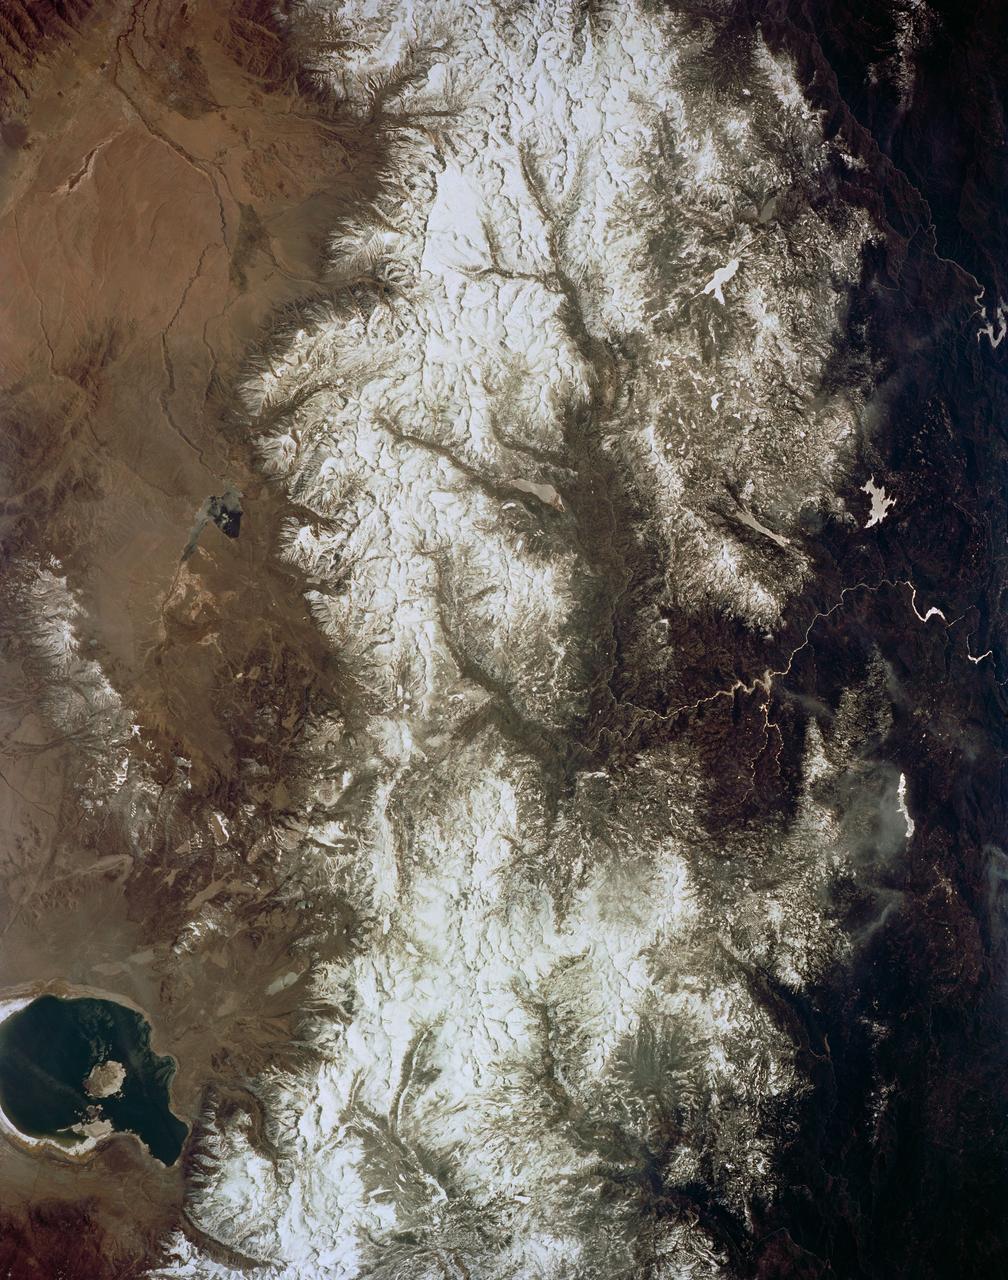
STS059-L09-162 (9-20 April 1994) --- Orient with the snow-covered mountains (Sierra Nevada of California) in the upper right corner. Then Owens Valley runs along the top of the photograph to Owens Lake playa at top center. The upper end of Death Valley extends from right to left in the foreground, with the drainage running down to a playa at Stovepipe Wells in the left foreground. Geologists are studying microwave signatures of the different playa surfaces, and the coatings on alluvial fans that extend from mountain masses, to try to sort out the history of different climates in this formerly wet but now hyperarid region.
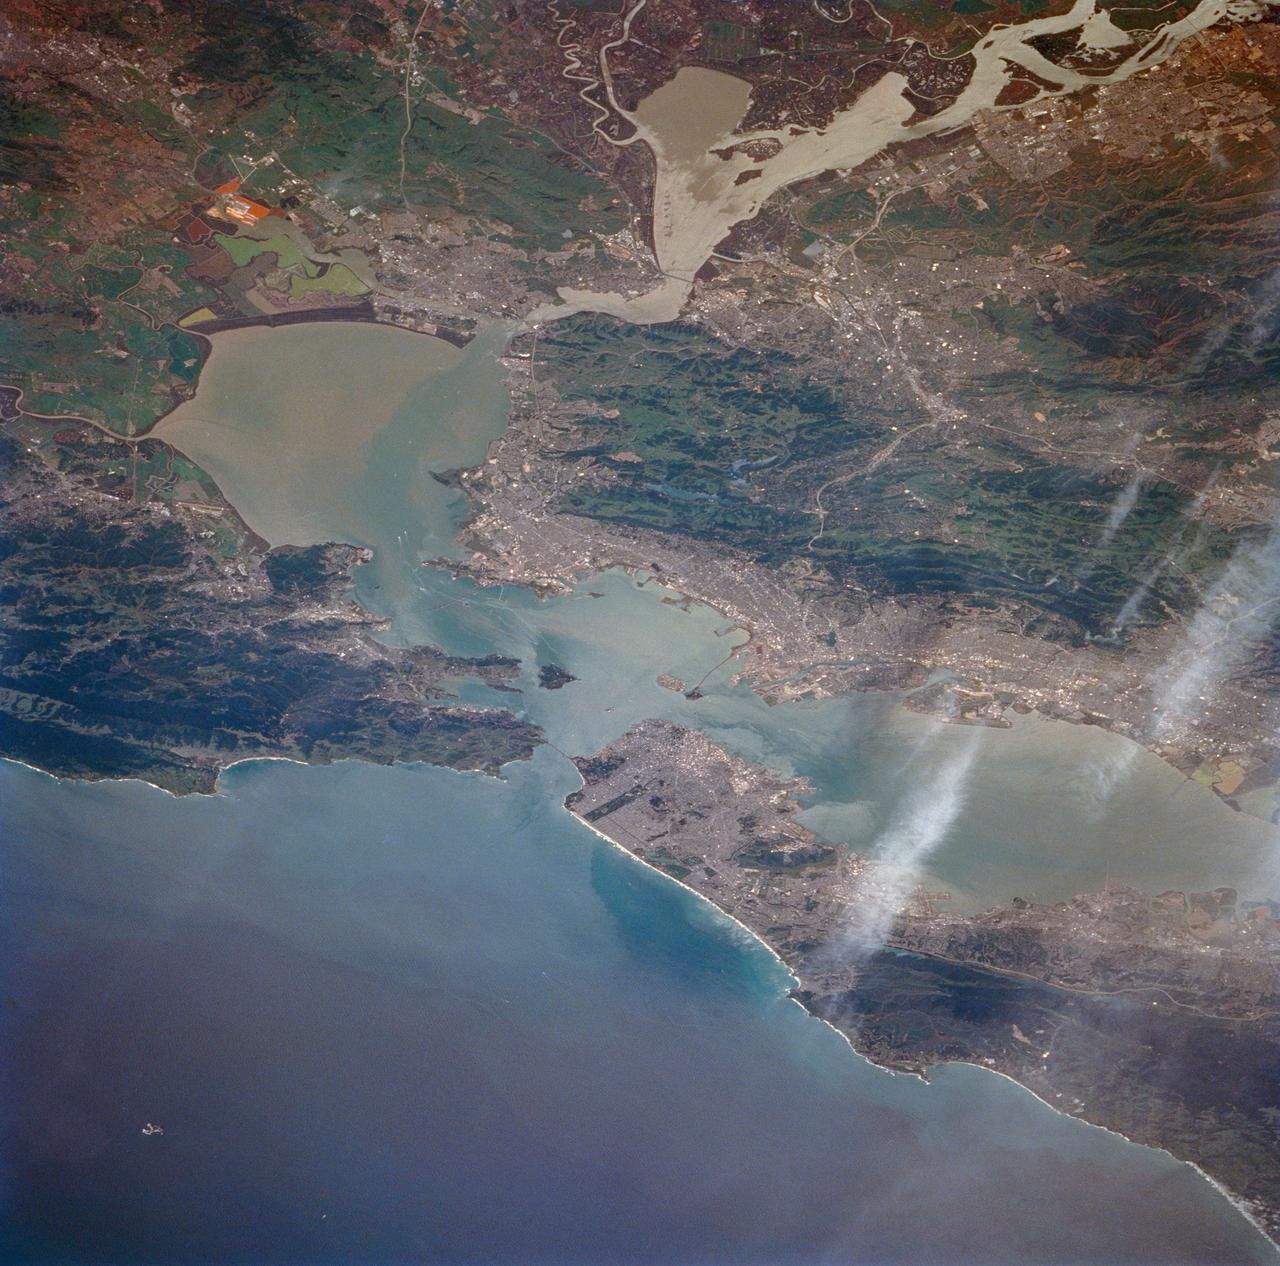
STS059-213-009 (9-20 April 1994) --- San Francisco Bay. Orient with the sea up. The delta of the combined Sacramento and San Joaquin Rivers occupies the foreground, San Francisco Bay the middle distance, and the Pacific Ocean the rest. Variations in water color caused both by sediment load and by wind streaking strike the eye. Man-made features dominate this scene. The Lafayette/Concord complex is left of the bay head, Vallejo is to the right, the Berkeley/Oakland complex rims the shoreline of the main bay, and San Francisco fills the peninsula beyond. Salt-evaporation ponds contain differently-colored algae depending on salinity. The low altitude (less than 120 nautical miles) and unusually-clear air combine to provide unusually-strong green colors in this Spring scene. Hasselblad camera.
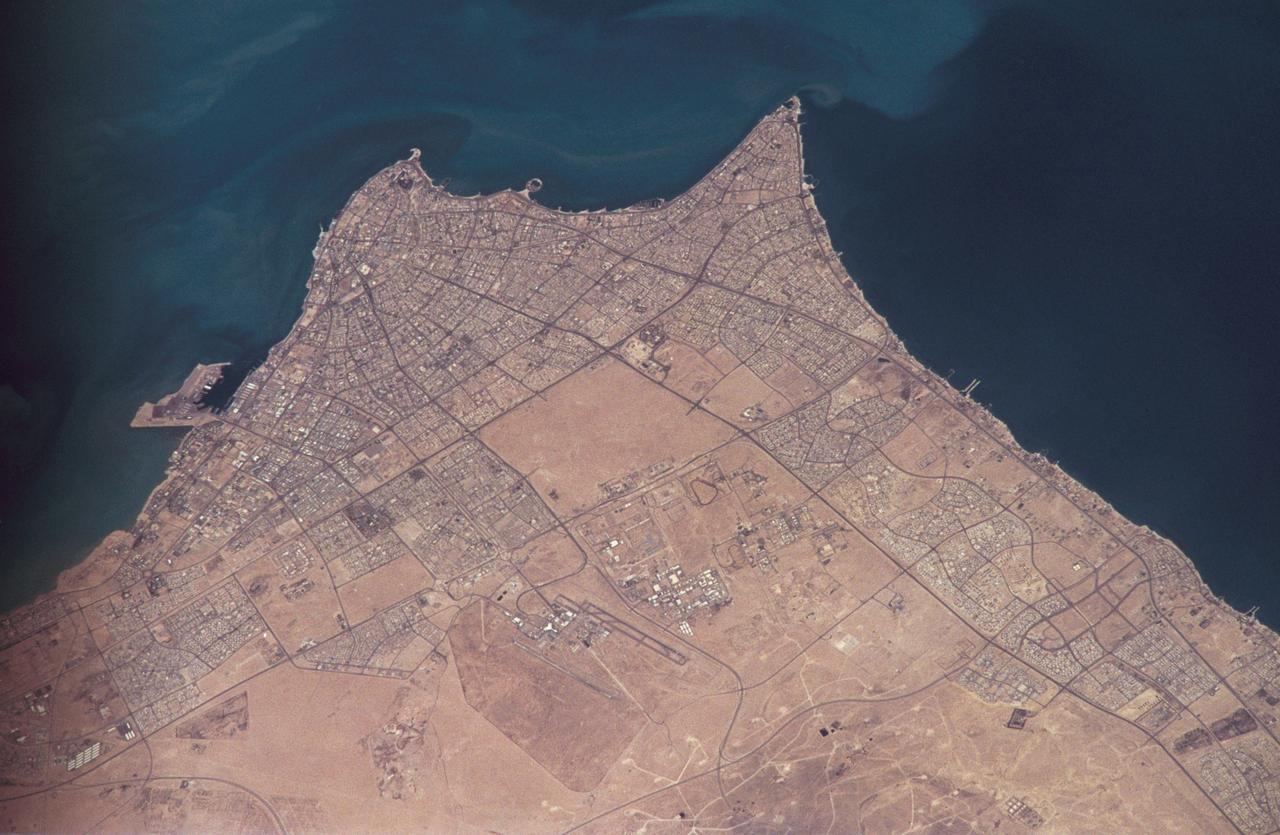
STS059-306-034 (9-20 April 1994) --- The radiating transportation pattern of this 20th-Century urban plan is nicely displayed in this high-resolution photograph. Light-toned spots in the desert mark oil well sites; along the south edge of the scene, some dark residue remains from the fires set during the recent Gulf War. Blown sand has nearly hidden the soot and thick oil that were deposited on the surface. Nikon photograph, 300mm lens.
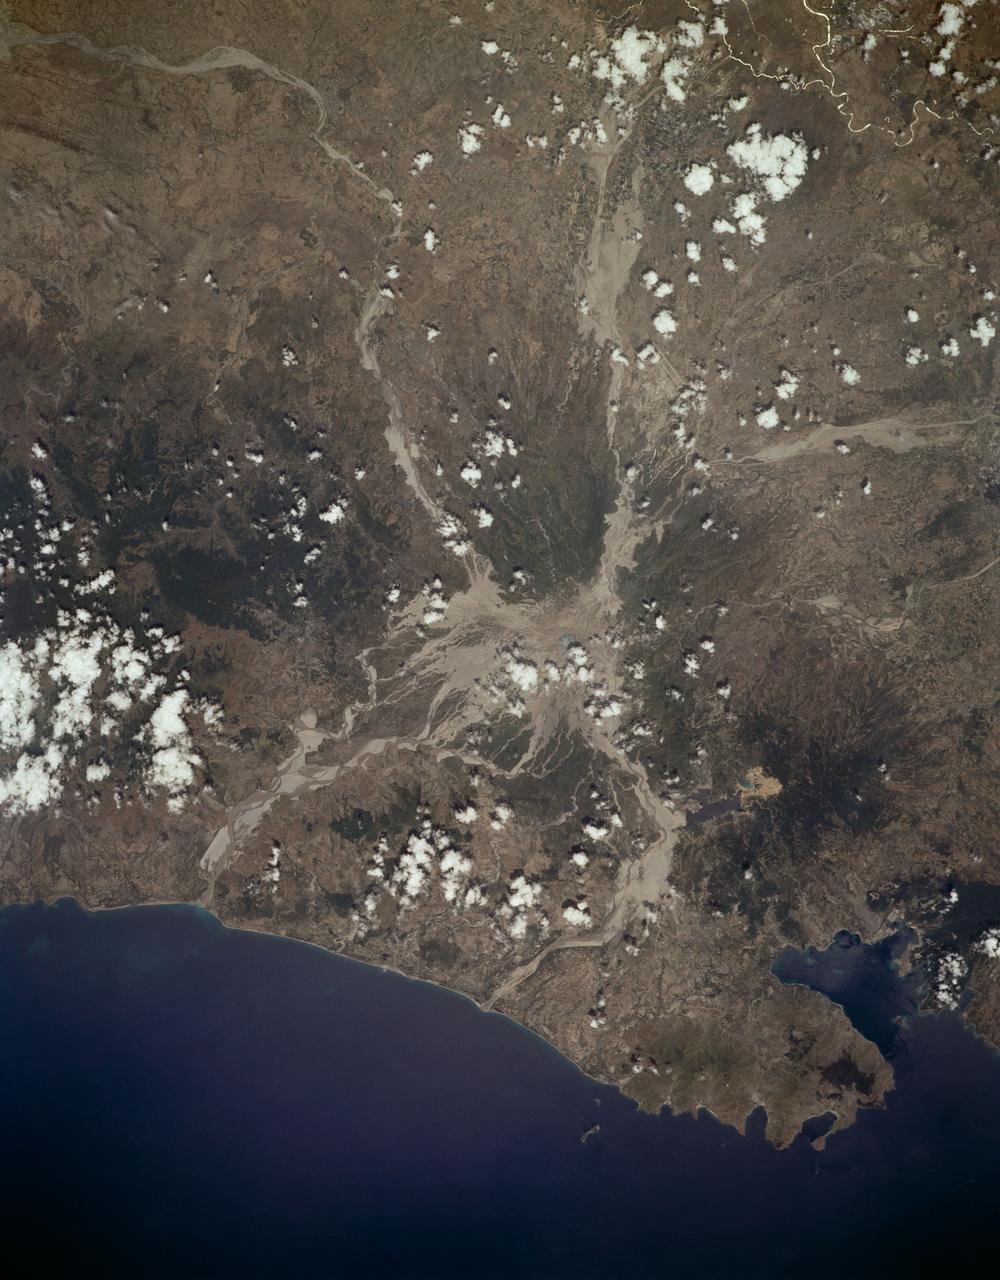
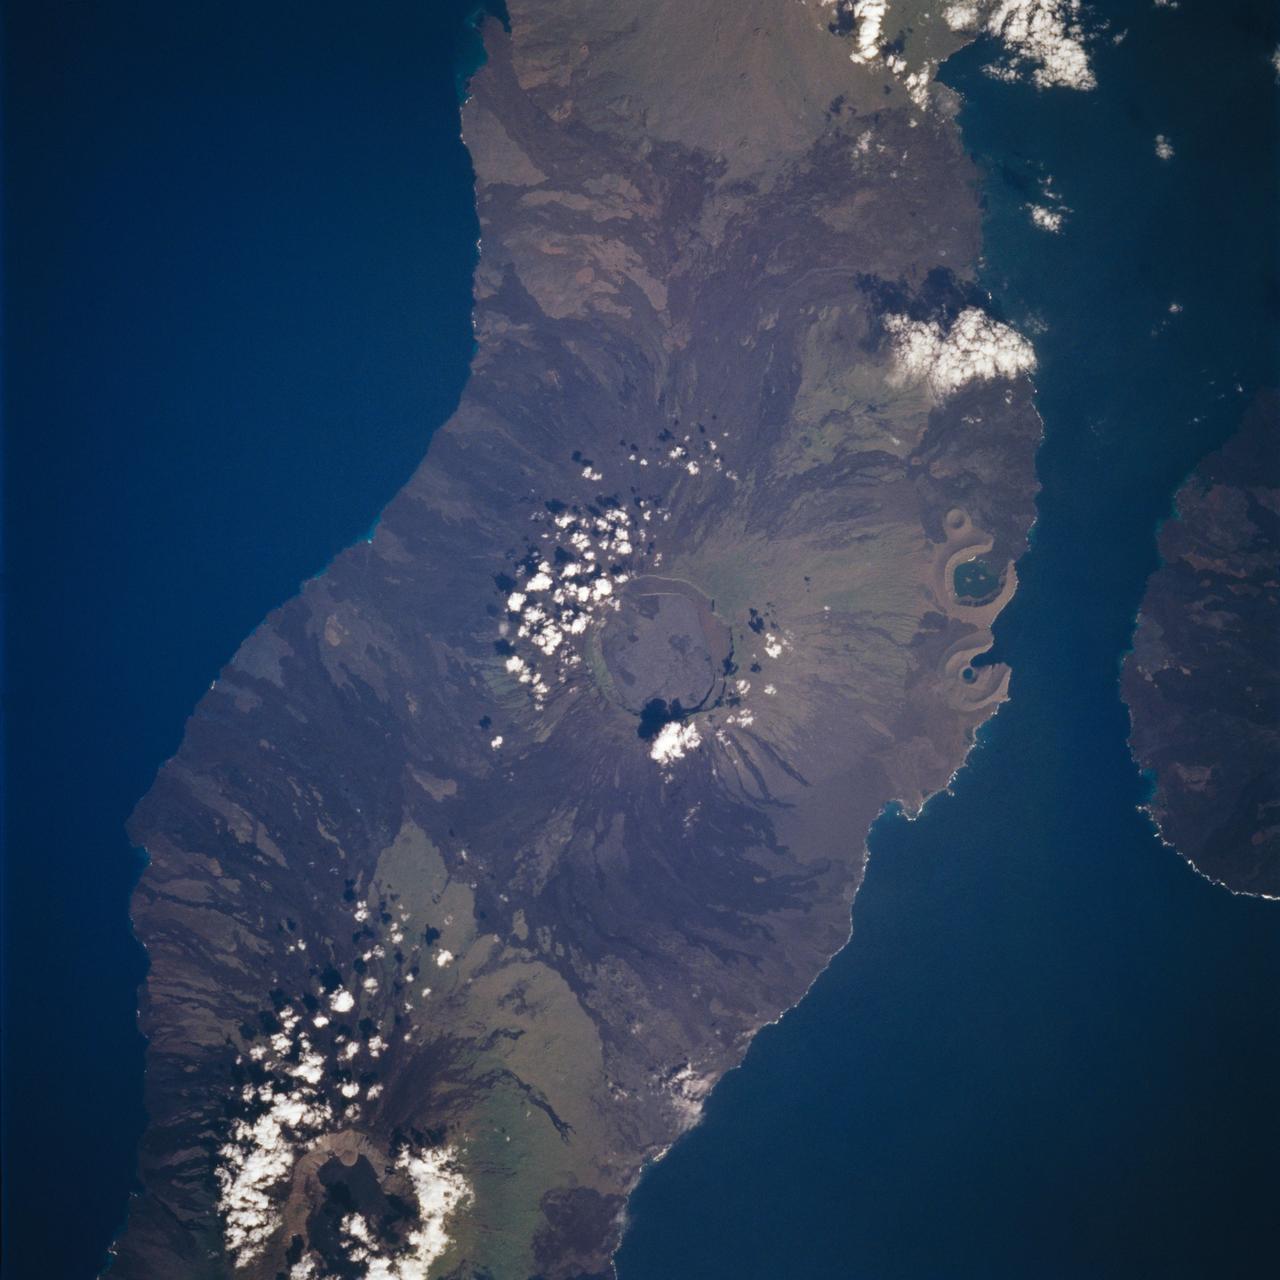
STS059-L14-170 (9-20 April 1994) --- Orient with the sea at the left. Then Subic Bay is at the lower left corner, and Clark Air Force Base (abandoned after the eruption) is to the lower right of the volcano. A turquoise lake occupies the caldera just below the center of the photograph. Mount Pinatubo erupted in June, 1991 after several hundred years of quiescence. Eruptive activity has nearly ceased, but every torrential rain in this monsoonal climate causes renewed mud flows of a viscous slurry composed of volcanic ash and pumice. Shuttle crews have been photographing the mountain at every opportunity, to add documentation to unmanned-satellite, aerial, and ground-based observations of changes. SRL scientists will use the excellent radar imagery obtained during STS-59 to help discriminate among different kinds of volcanic material, and to extend their observations to other volcanoes around the world using future, perhaps unmanned, radar satellites. Linhof photograph.
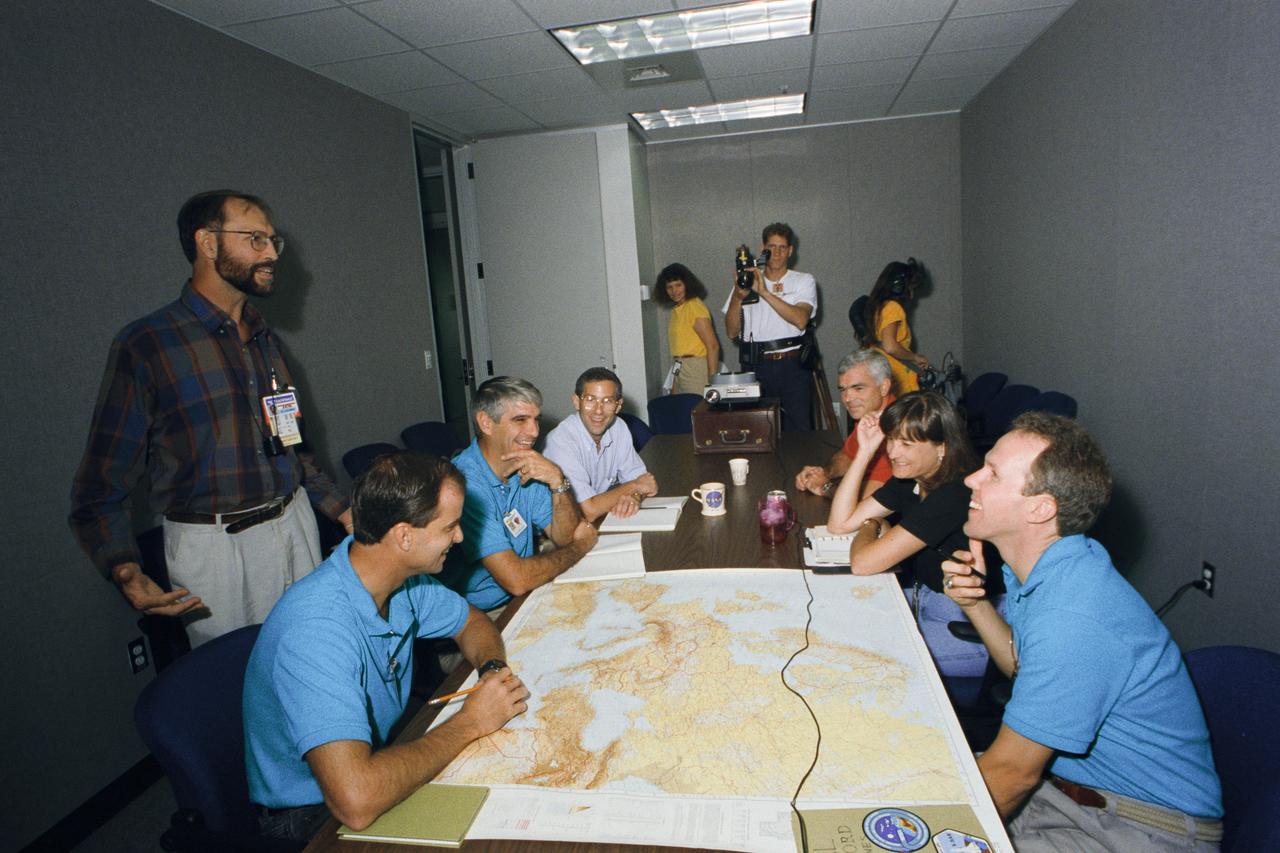
S93-42727 (26 Aug 1993) --- The six astronauts in training for the STS-59 mission are given some onboard Earth observations tips by Justin Wilkinson (standing, foreground) of the Space Shuttle Earth Observations Project (SSEOP) group. Astronaut Sidney M. Gutierrez, mission commander, is at center on the left side of the table. Others, left to right, are astronauts Kevin P. Chilton, pilot; Jerome (Jay) Apt and Michael R.U. (Rich) Clifford, both mission specialists; Linda M. Godwin, payload commander; and Thomas D. Jones, mission specialist.
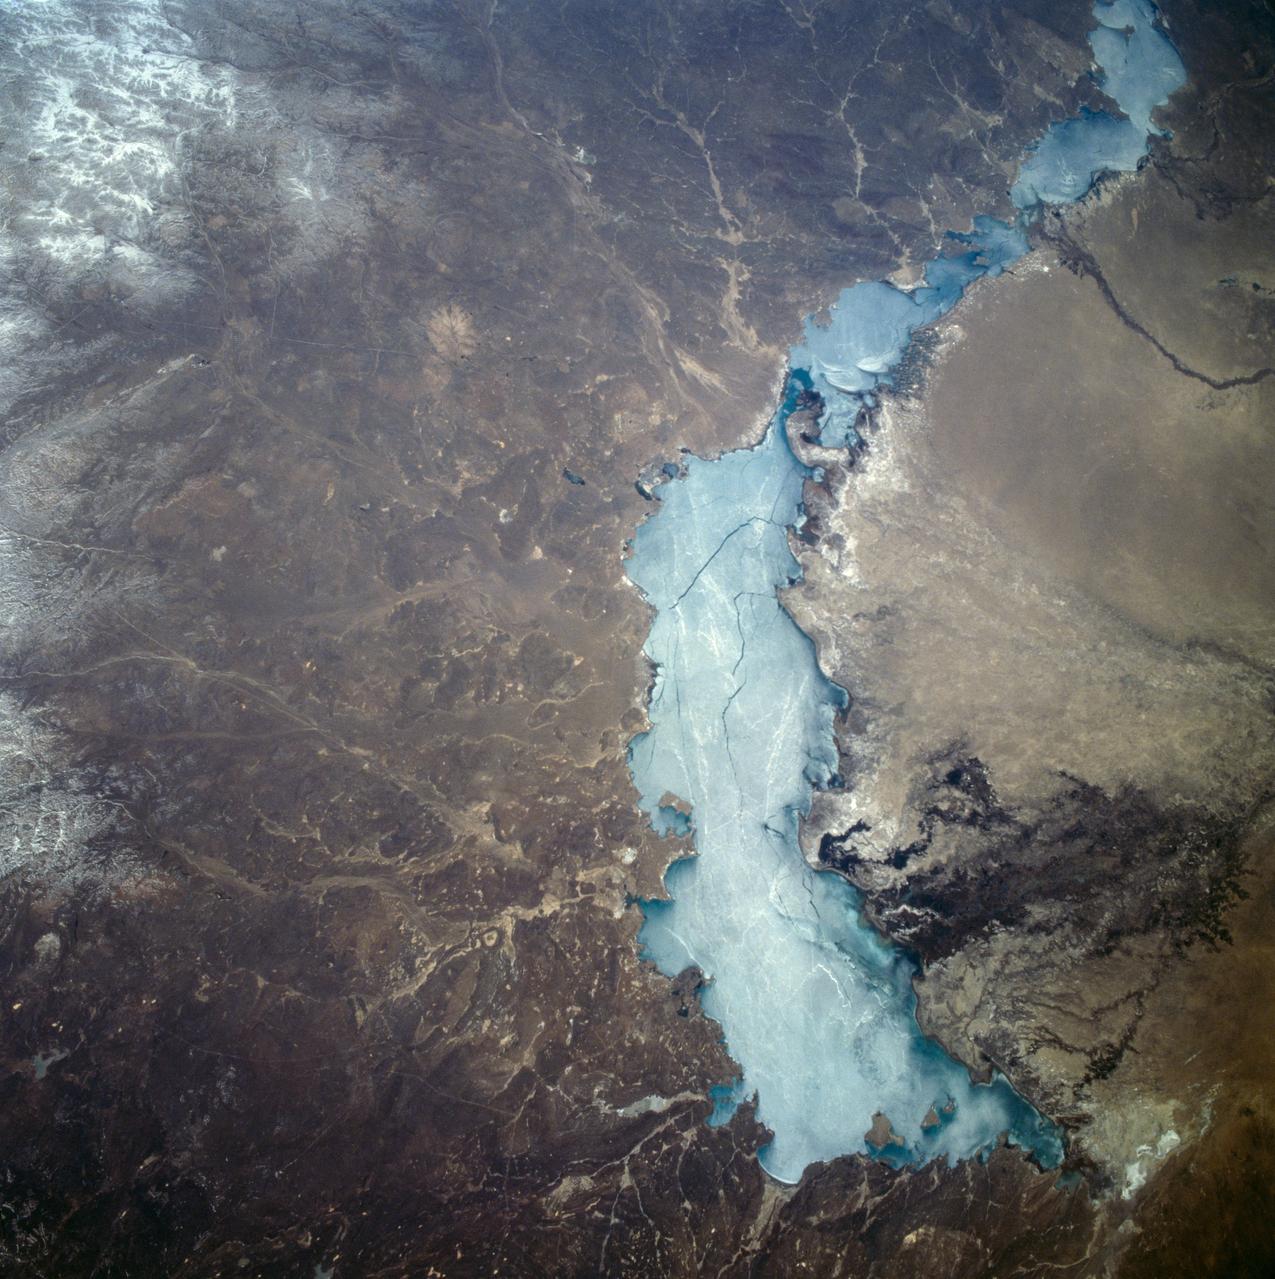
STS059-209-081 (9-20 April 1994) --- Lake Balkhash, in eastern Kazakhstan, is some 300 miles long. The lake, frozen in this scene, thawed noticeably during the mission. The shape of the lake is controlled by the delta of the Ili River, which flows from the Tien Shan Mountains in western China across this arid steppe. SRL scientists will use radar data to study the microwave effects of differences in soil moisture, and in freezing or thawing, on the deltaic sediments. Hasselblad camera.
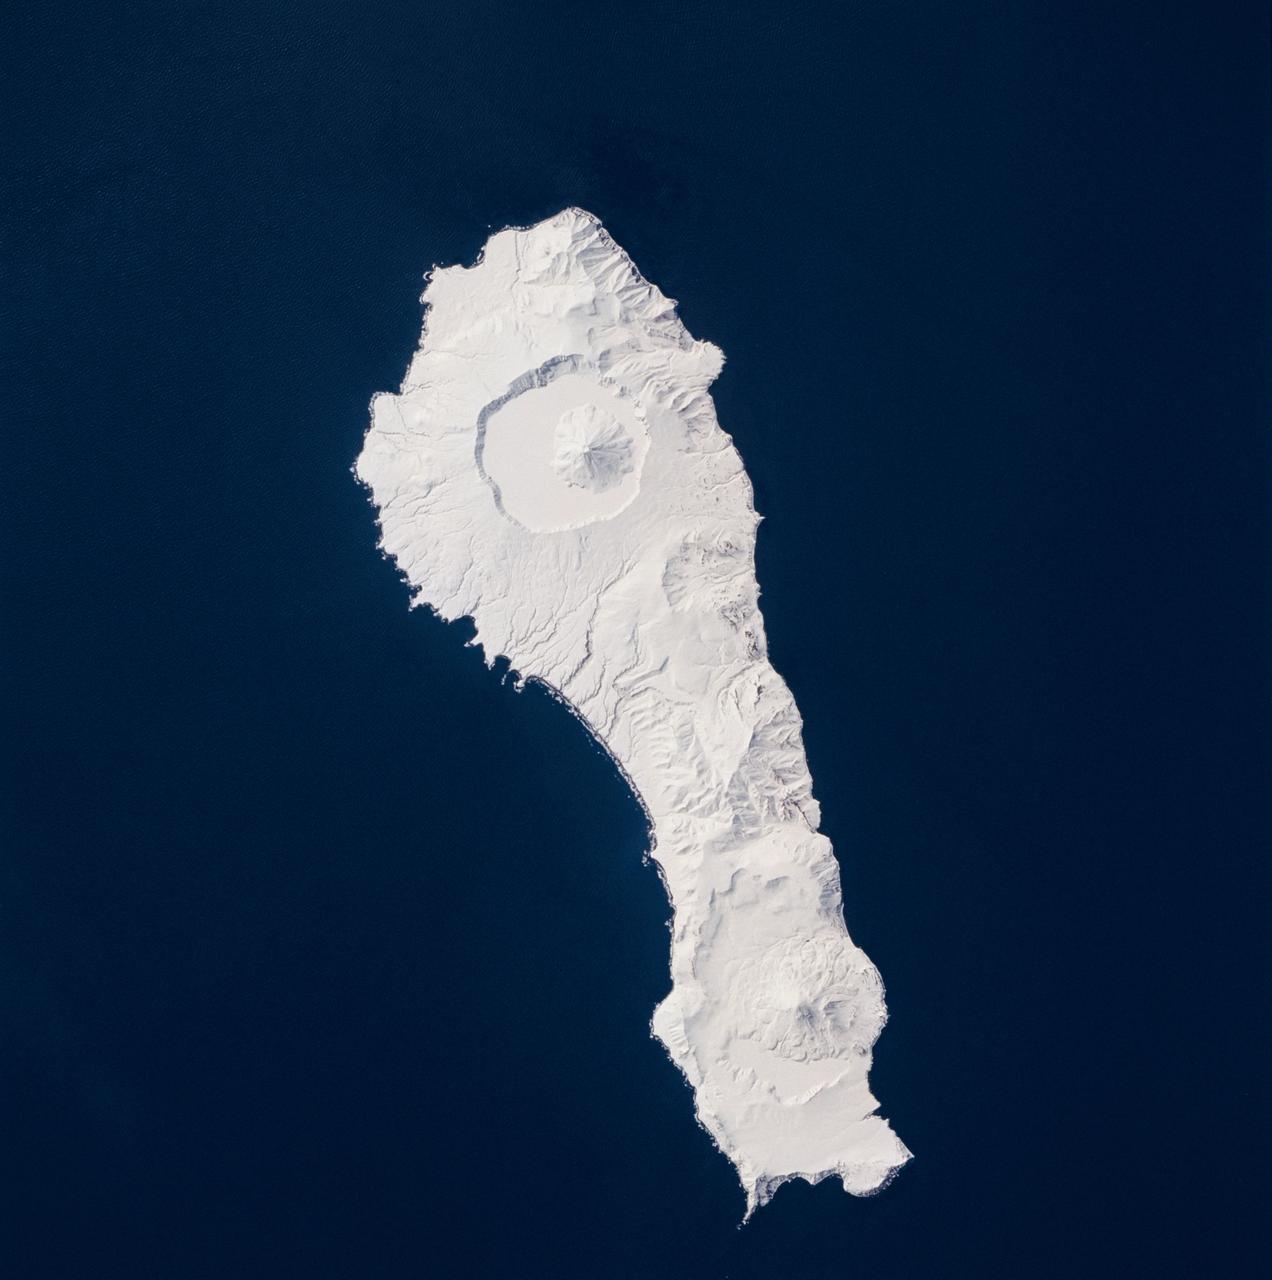
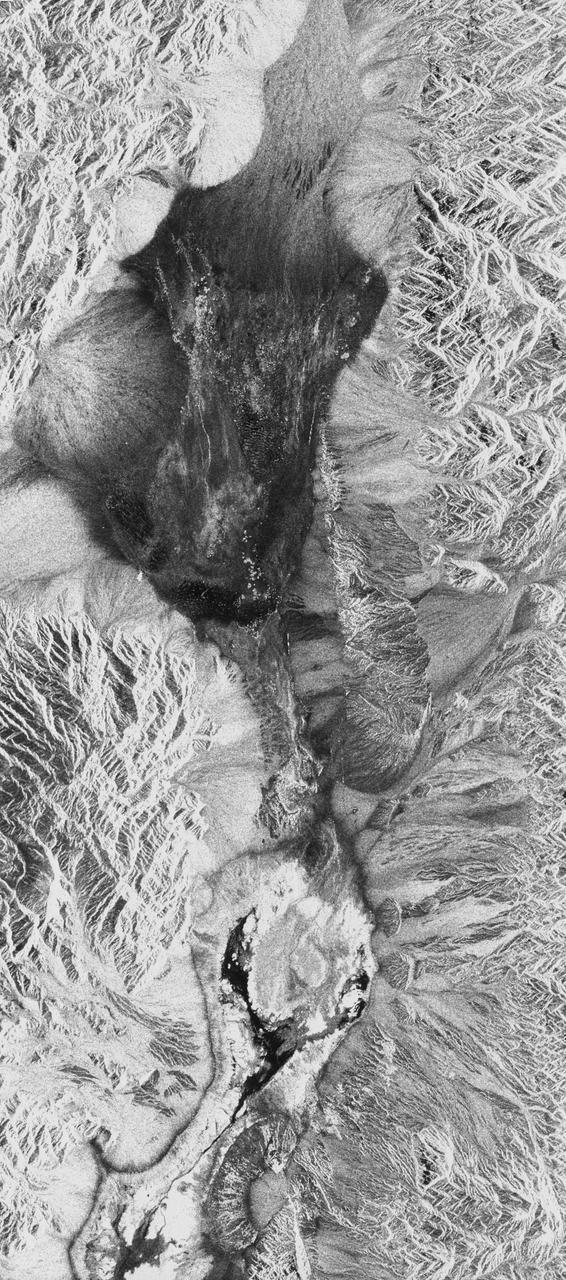
STS059-219-065 (9-20 April 1994) --- The narrow end of the island is to the north by northeast. This is one of several volcanic islands extending south by southwest between the southern tip of Kamchatka and Japan. The exposure was stopped down to provide extremely fine detail in the totally snow-covered landscape, at the same time making the dark sea look completely black. Compare to STS047-90-087, taken in September, which shows a green ground cover. Hasselblad photograph.
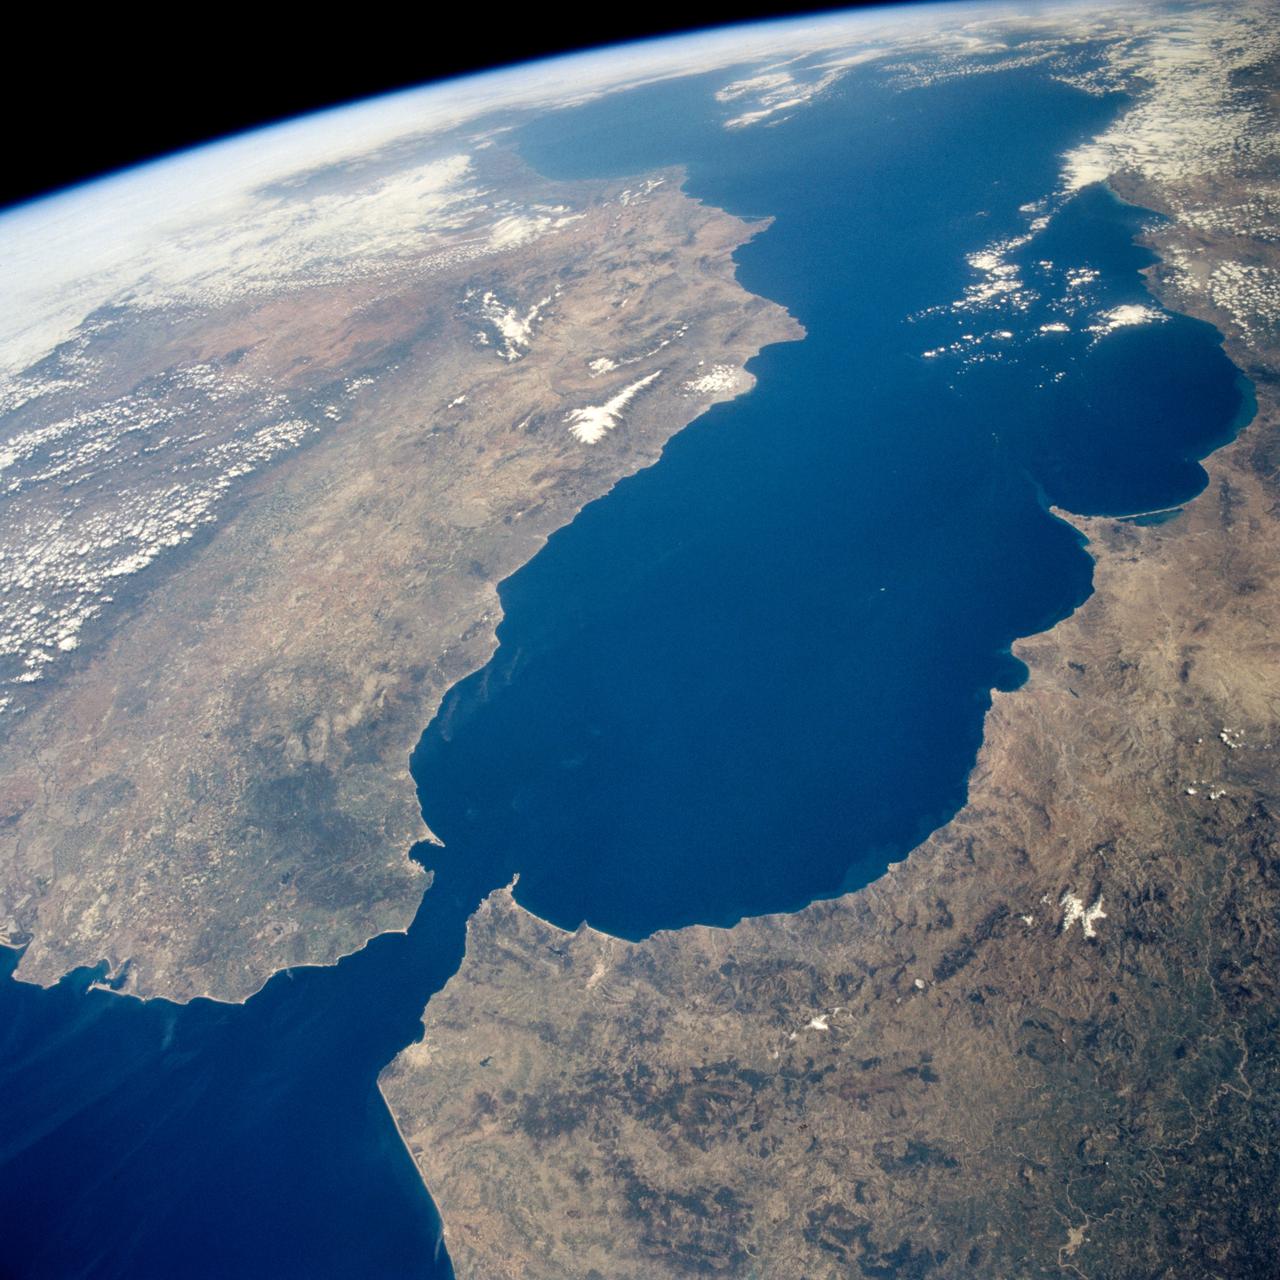
STS059-238-074 (9-20 April 1994) --- The Atlantic Ocean, Straits of Gibraltar, and Alboran Sea (the westernmost portion of the Mediterranean Sea) separate Spain on the left from Morocco on the right. Algeciras Harbor is the prominent notch cut out of the eastern end of the north shore of the Strait; the Rock of Gibraltar is the tiny arrowhead that separates the notch from the Alboran Sea. The Sierra Nevada, farther away down the Spanish coast, lives up to its name in this April scene. The difference in elevation between the Sierra Morena and the Guadalquivir River valley is highlighted nicely by cumulus clouds. Tangier, Morocco can be seen as a light-toned spot on the southern shore of the Strait, near the entrance to the Atlantic Ocean. Hasselblad photograph.
STS059-86-059 (9-20 April 1994) --- This oblique handheld Hasselblad 70mm photo shows Death Valley, near California's border with Nevada. The valley -- the central feature of Death Valley National Monument -- extends north to south for some 140 miles (225 kilometers). Hemmed in to the east by the Amargosa Range and to the west by the Panamints, its width varies from 5 to 15 miles (8 to 24 kilometers). Using Spaceborne Imaging Radar (SIR-C) and X-band Synthetic Aperture Radar (X-SAR) onboard the Space Shuttle Endeavour, the crew was able to record a great deal of data on this and other sites, as part of NASA's Mission to Planet Earth.

STS59-215-022 (12 April 1994) --- This 70mm frame, photographed through the aft flight deck windows of the Space Shuttle Endeavour, features the Space Radar Laboratory (SRL) payload in the cargo bay. An area of the Pacific Ocean northeast of Hawaii forms the backdrop for the image. Six NASA astronauts spent a week and a half in Earth orbit in support of the SRL mission.
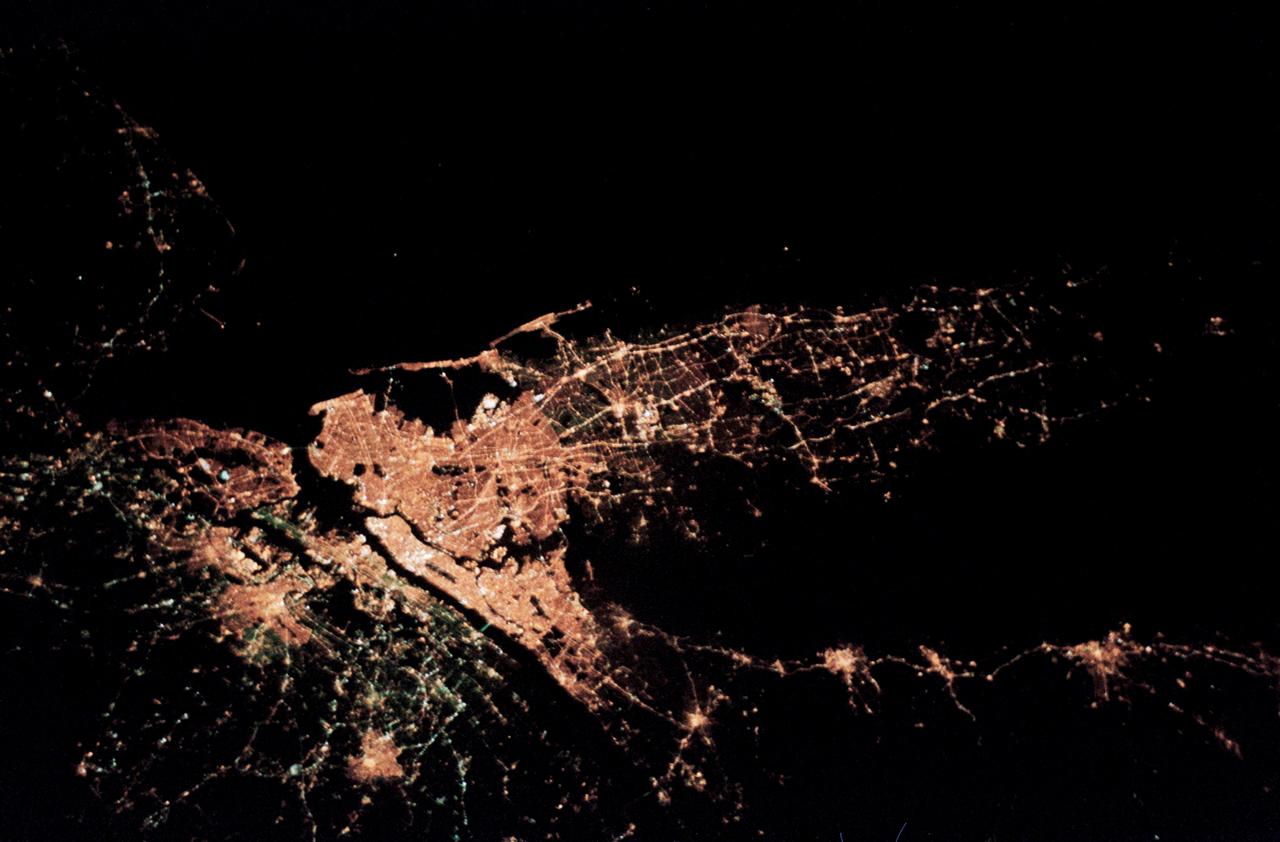
STS059-50-003 (9-20 April 1994) --- This 35mm night image of the New York City metropolitan area was captured by the crew of the STS-59 crew during the Space Radar Laboratory (SRL) mission. Scientists studying film from the Space Shuttle Endeavour feel this is the best nocturnal view of this region from the manned space program.

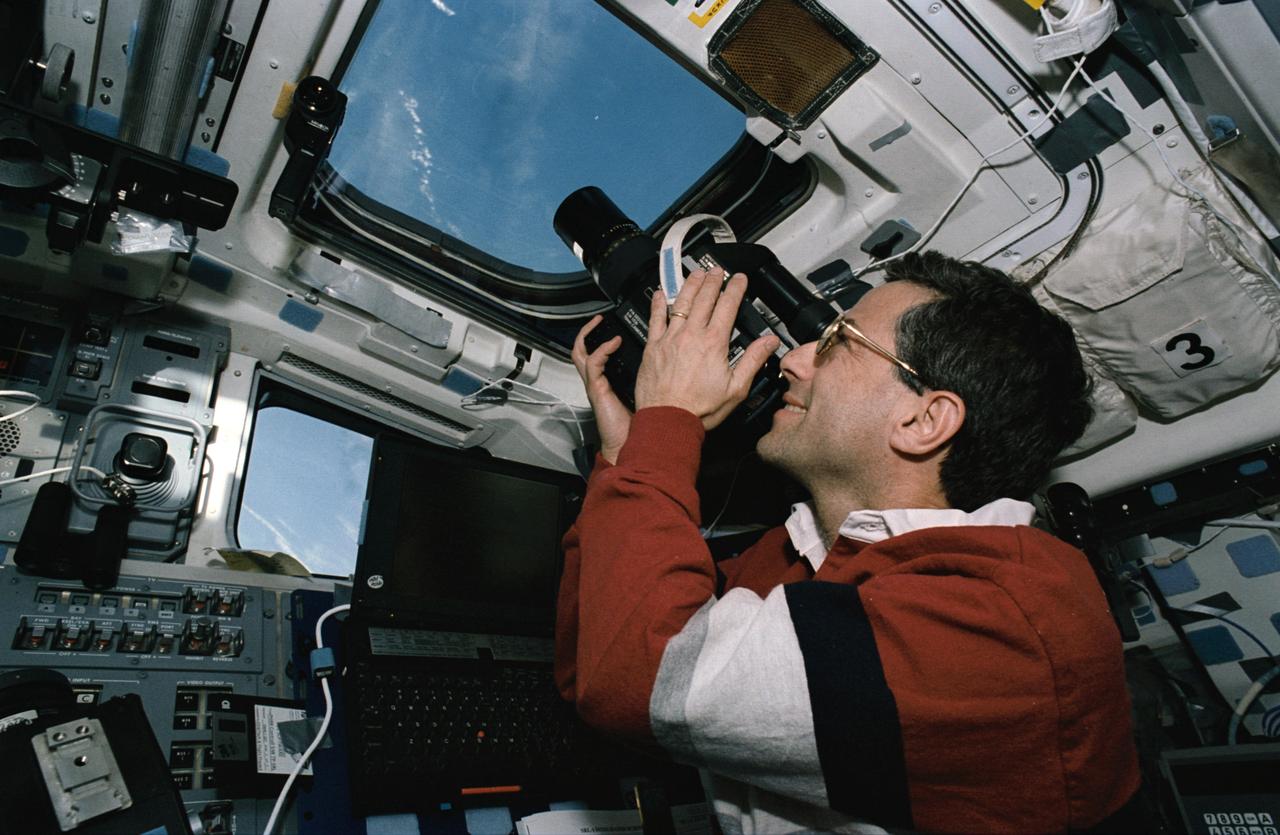
STS059-09-021 (9-20 April 1994) --- Astronaut Thomas D. Jones, mission specialist, monitors a number of cameras fixed on targets of opportunity as the Space Shuttle Endeavour orbits Earth. Jones is one of six NASA astronauts supporting the week and half Space Radar Laboratory (SRL-1) mission. He has been assigned as payload commander for SRL-2, scheduled to fly later this year.
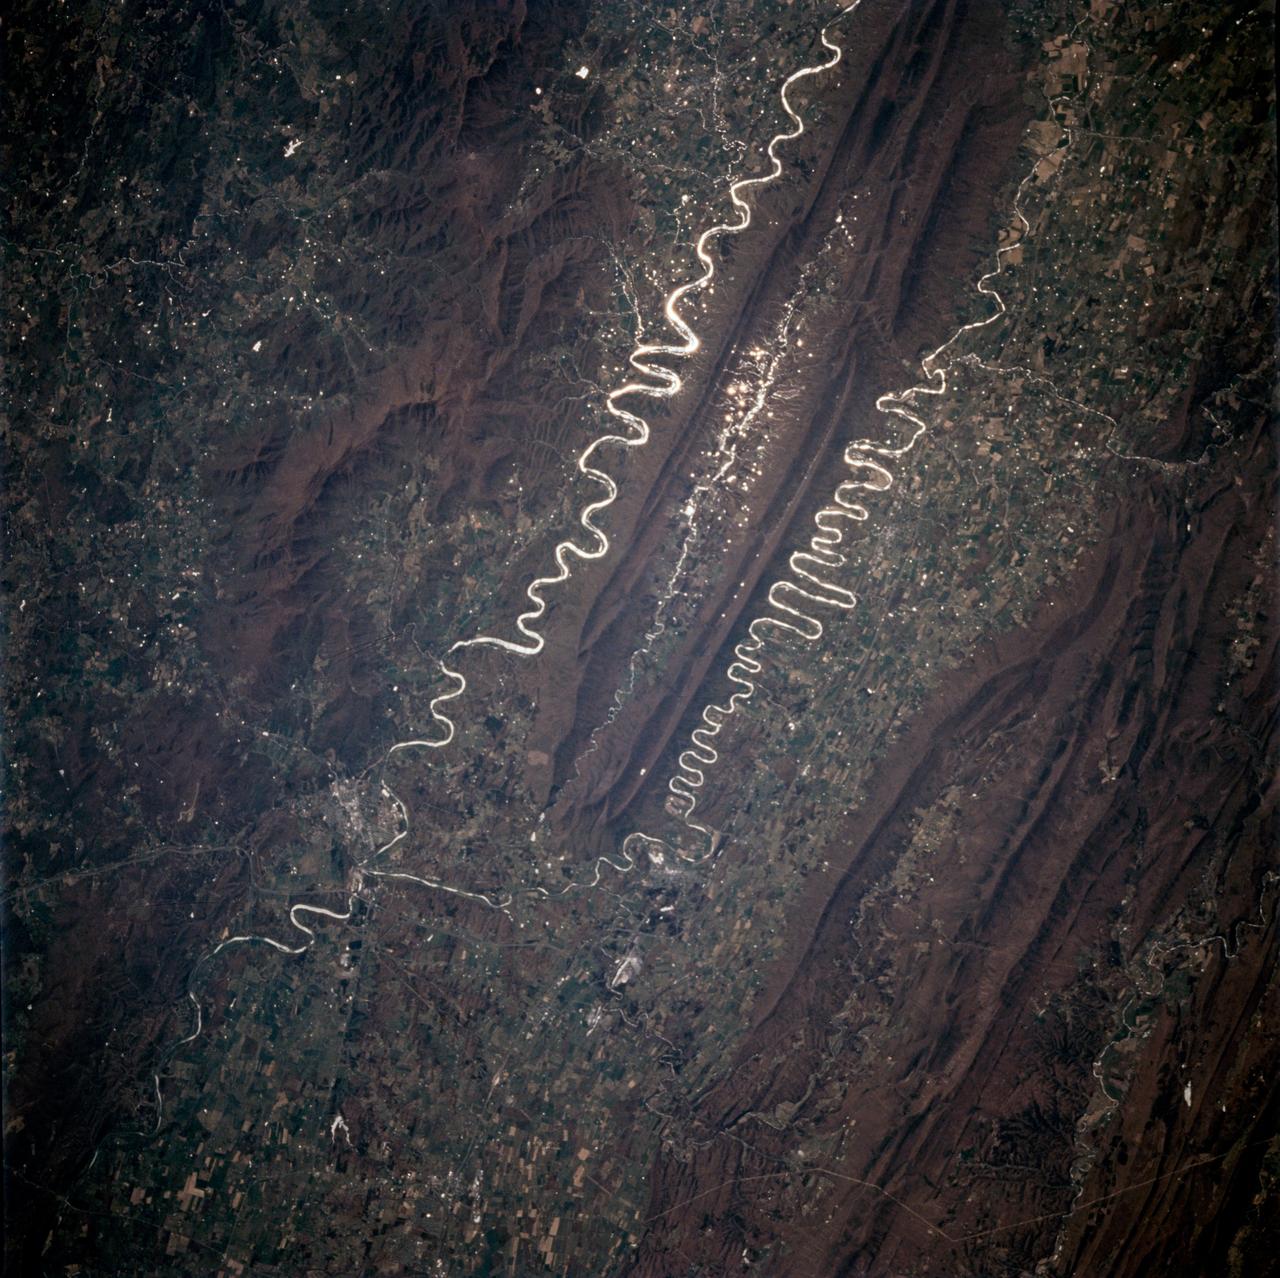
STS059-225-072 (9-20 April 1994) --- Orient with the tuning fork away from the viewer (sunglint is always south of the spacecraft at this latitude). Then the South Fork (left) and North Fork (right) of the Shenandoah meet in the foreground; Front Royal, Virginia is just to the left of the combined rivers at the junction. Massanutten Mountain, covered by reddish-brown fallen leaves of the George Washington National Forest, separates the river forks. The mountain, and other elements of the Appalachian Mountains in this scene, were formed from folded sedimentary rocks that later were eroded into their present shapes; resistant rocks, such as sandstone, form the high ground while shale and limestone form the valleys. Hasselblad photograph.
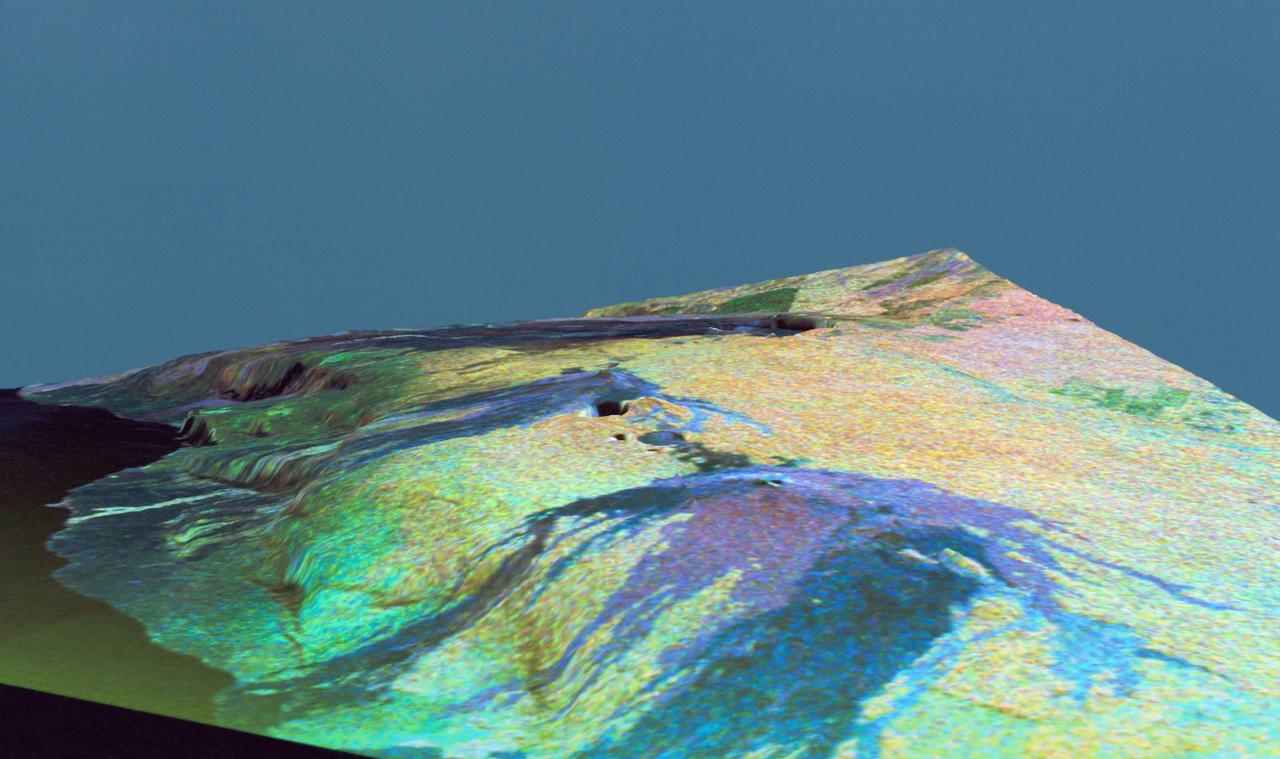
This is a three dimensional perspective view of false-color image of the eastern part of the Big Island of Hawaii. It was produced using all three radar frequencies C-Band and L-Band. This view was constructed by overlaying a SIR-C radar image on a U.S. Geological Survey digital elevation map. The image was acquired on April 12, 1994 during the 52nd orbit of the Shuttle Endeavour by the Spaceborne Imaging Radar-C and X-Band Synthetic Aperture Radar (SIR-C/X-SAR). The area shown is approximately 34 by 57 kilomters with the top of the image pointing toward north-west. The image is centered at about 155.25 degrees west longitude and 19.5 degrees north latitude. Visible in the center of the image in blue are the summit crater (Kilauea Caidera) which contains the smaller Halemaumau Crater, and the line of collapsed craters below them that form the Chain of Craters Road. The rain forest appears bright in the image while green areas correspond to lower vegetation. The lava flows have different colors depending on their types and are easily recognizable due to their shapes. The flows at the top of the image originated from the Muana Loa volcano. The Jet Propulsion Laboratory alternative photo number is P-43932.
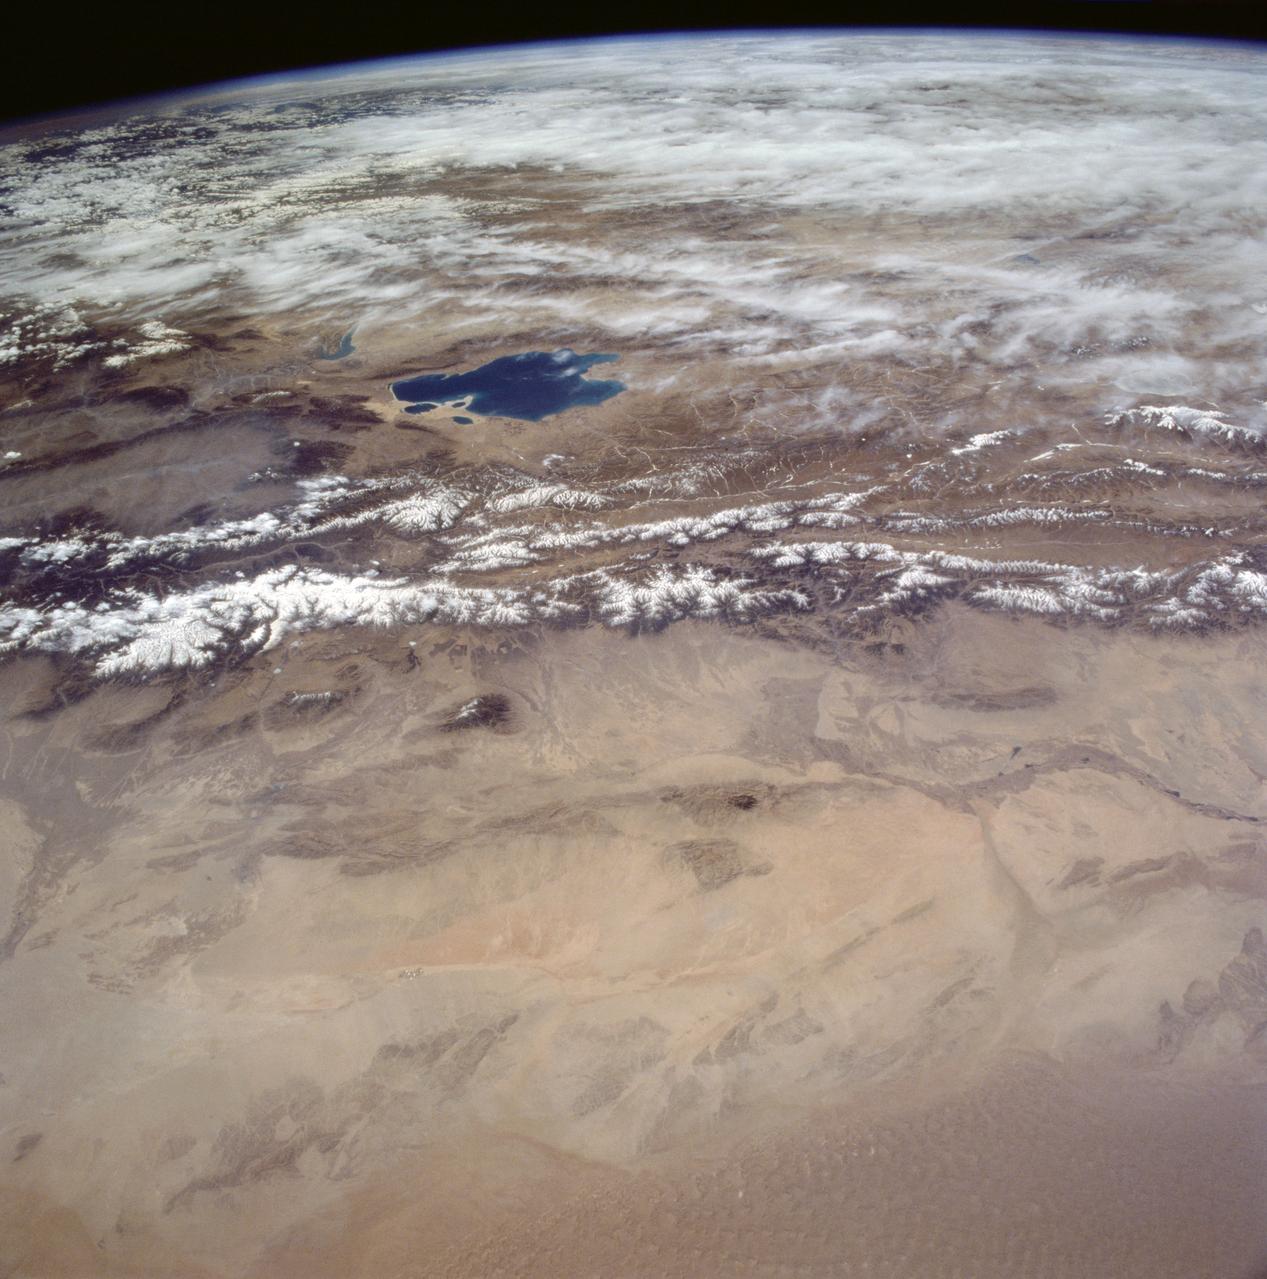
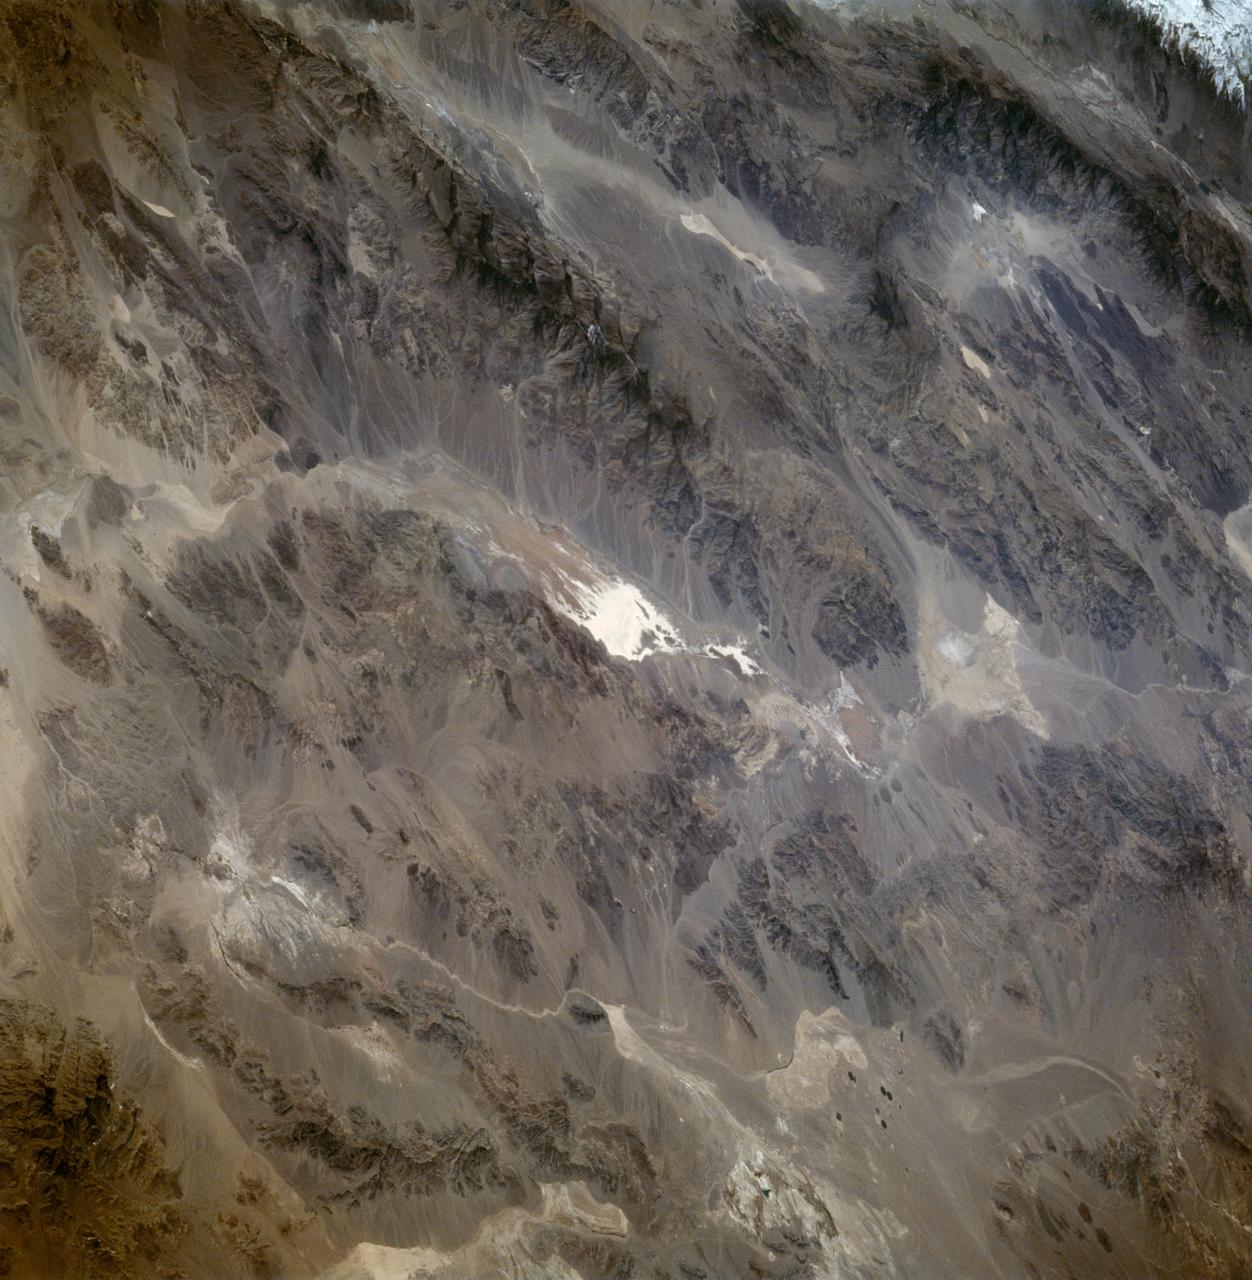
STS059-220-041 (9-20 April 1994) --- View to the south by southwest across the southern Gobi Desert (China) across the Chi-Lien-Shan or Quilienshan or Nanshan (Mountains) in Gansu Province to Lake Quinghai or Ch'ing-Hai (orthography varies with political conditions and scholarship) in Quinghai Province. The lake has a surface elevation of 10,450 feet, partially filling one of the easternmost closed drainage basins of Central Asia. Hasselblad photograph.
STS059-154-160 (9-20 April 1994) --- Orient with Mono Lake, California at the lower right; then the view is westward across the Sierra Nevada into the San Joaquin River drainage. A tiny network of ski trails can be seen on the Mono Lake side of the Sierras, on a line between Mono Lake and the snow-free San Joaquin headwaters. The ski trails mark Mammoth Mountain, where SRL investigators are studying microwave measurements of the water content of snowpacks. Linhof camera.
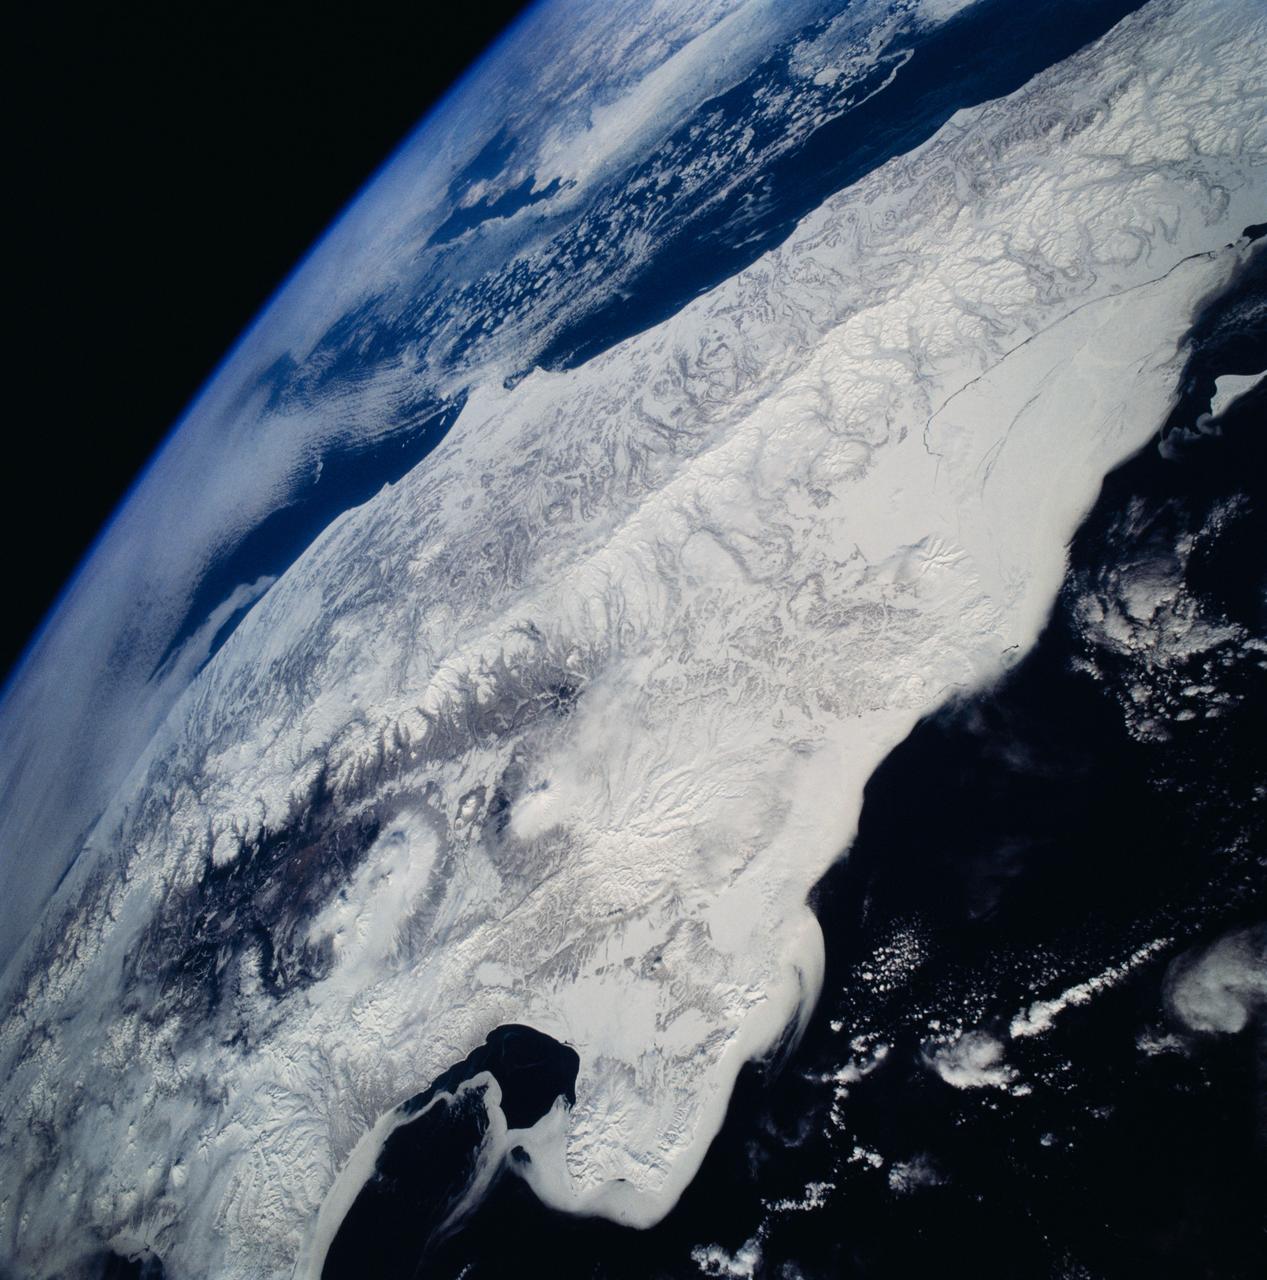
STS059-81-095 (9-20 April 1994) --- View southwestward across the Kamchatka Peninsula. The cluster of volcanoes in the middle distance are active, including Klutchevskaya whose summit reaches 15,580 feet. Changes in volcanic deposits, snow, and ice are being studied by Russian and American SRL investigators. Seasonal changes in sea ice are also of interest, for example, in Kamchatskiy Bay (upper left). Hasselblad camera, 40mm lens.
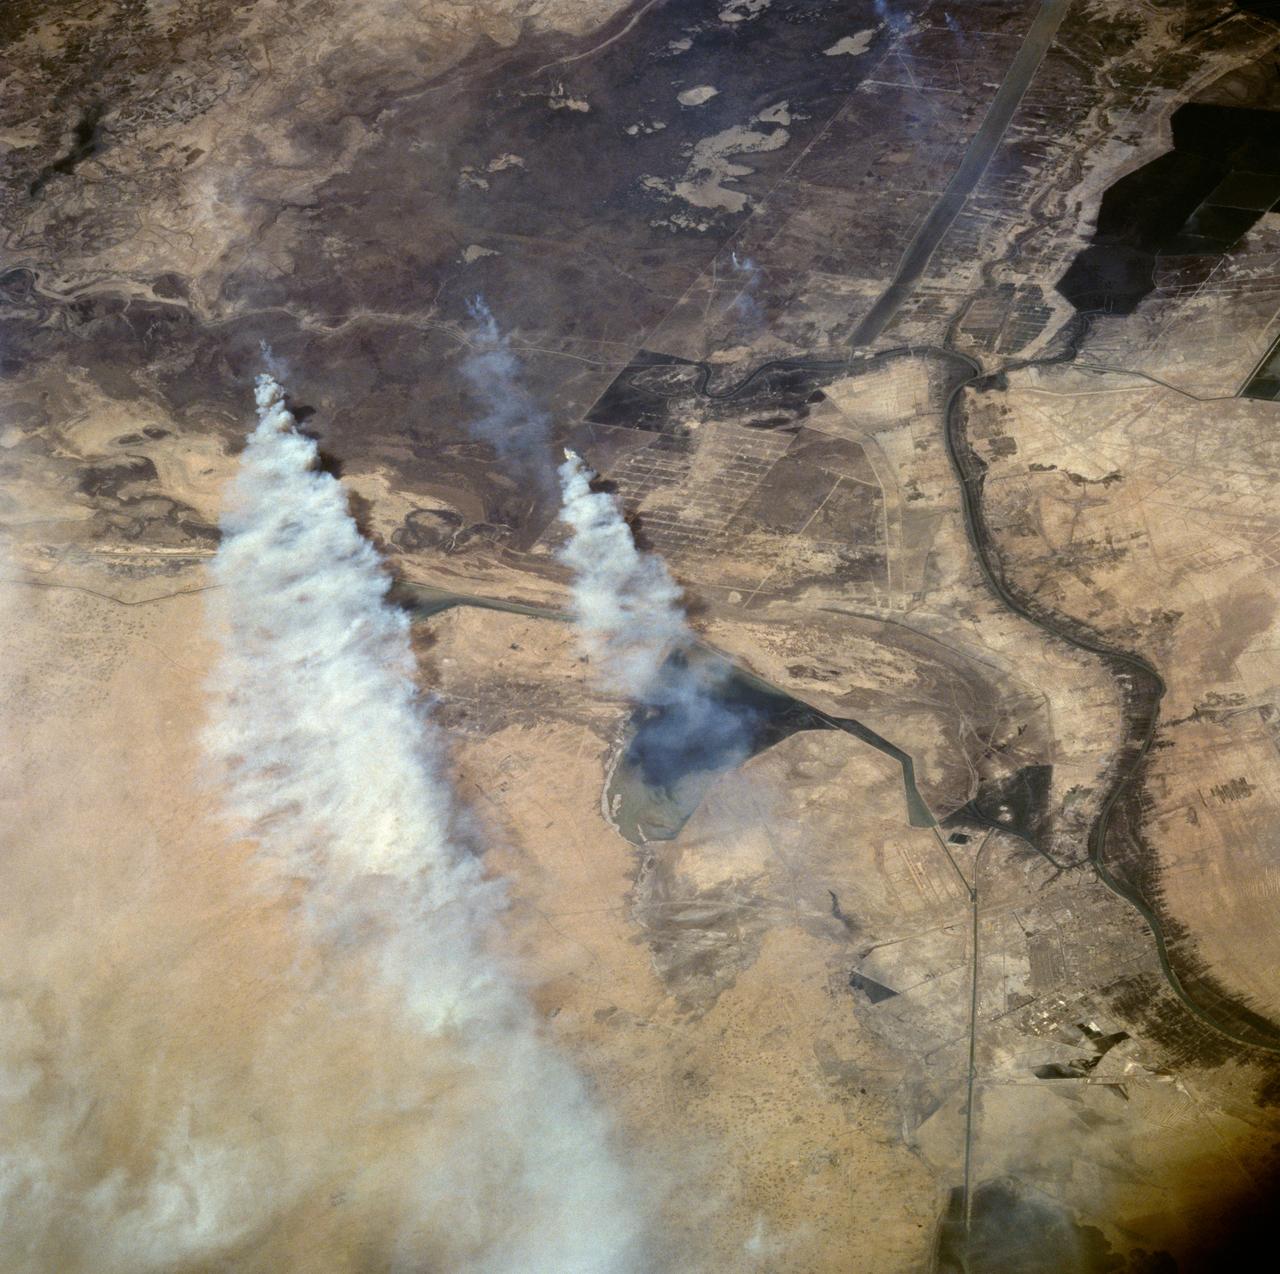
STS059-82-010 (9-20 April 1994) --- View northwestward of a small part of southeastern Iraq. The city of Basra can be seen in the lower left corner, and the former junction of the Tigris and Euphrates Rivers in the upper right. The streams have been channelized, in part to dewater and burn an extensive marsh. Hasselblad camera, 250mm lens.
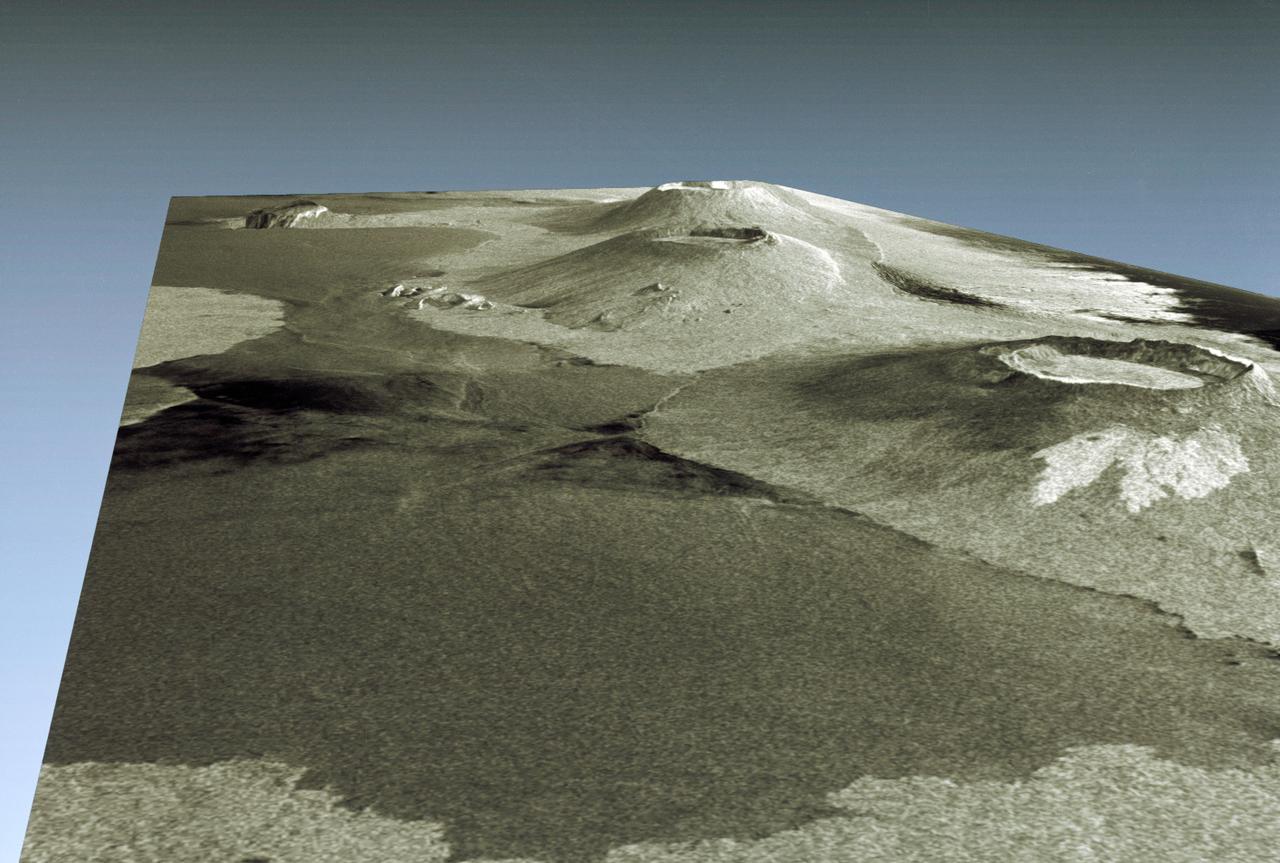
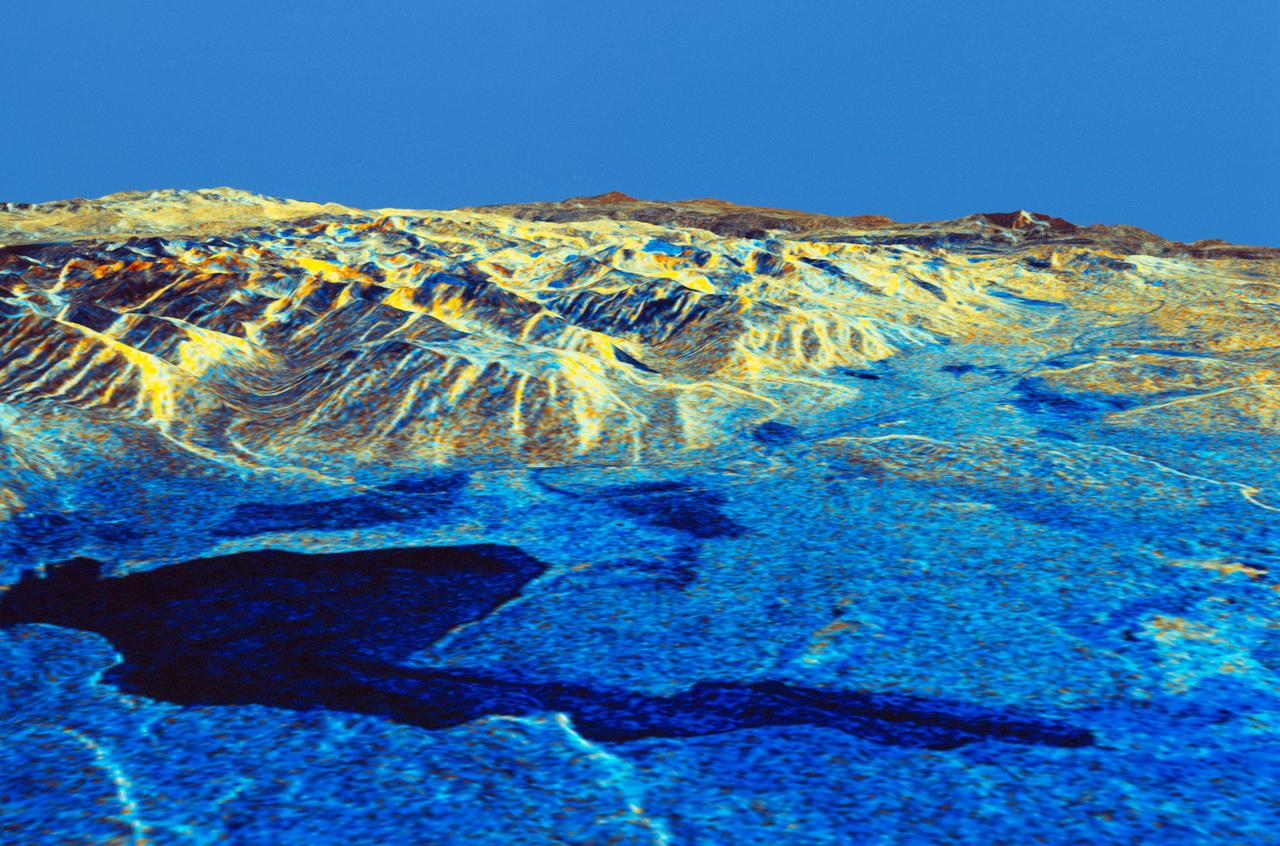
STS059-S-085 (18 April 1994) --- This is a three-dimensional perspective view of part of Isla Isabela in the western Galapagos Islands. It was taken by the L-Band radar in HH polarization from the Spaceborne Imaging Radar-C and X-Band Synthetic Aperture Radar (SIR-C/X-SAR) on the 40th orbit of the Space Shuttle Endeavour. This view was constructed by overlaying a SIR-C radar image on a U.S. Geological Survey digital elevation map. The image is centered at about .5 degrees south latitude and 91 degrees west longitude, and covers an area of 75 by 60 kilometers. The radar incidence angle at the center of the image is about 20 degrees. The western Galapagos Islands, which lie about 1200 kilometers west of Ecuador in the eastern Pacific, have six active volcanoes similar to the volcanoes found in Hawaii. Since the time of Charles Darwin's visit to the area in 1835, there have been over 60 recorded eruptions on these volcanoes. This SIR-C/X-SAR image of Alcedo and Sierra Negra volcanoes shows the rougher lava flows as bright features, while ash deposits and smooth pahoehoe lava flows appear dark. The Galapagos Islands are one of the SIR-C/X-SAR supersites and data of this area will be taken several times during the flight to allow scientists to conduct topographic change studies and to search for different lava flow types, ash deposits and fault lines. SIR-C/X-SAR is part of NASA's Mission to Planet Earth (MTPE). SIR-C/X-SAR radars illuminate Earth with microwaves allowing detailed observations at any time, regardless of weather or sunlight conditions. SIR-C/X-SAR uses three microwave wavelengths: L-Band (24 cm), C-Band (6 cm), and X-Band (3 cm). The multi-frequency data will be used by the international scientific community to better understand the global environment and how it is changing. The SIR-C/X-SAR data, complemented by aircraft and ground studies, will give scientists clearer insights into those environmental changes which are caused by nature and those changes which are induced by human activity. SIR-C was developed by NASA's Jet Propulsion Laboratory (JPL). X-SAR was developed by the Dornire and Alenia Spazio Companies for the German Space Agency, Deutsche Agentur fuer Raumfahrtangelegenheiten (DARA), and the Italian Space Agency, Agenzia Spaziale Italiana (ASI). JPL Photo ID: P-43938

STS059-13-030 (9-20 April 1994) --- From the Space Shuttle Endeavour's aft flight deck, astronauts Kevin P. Chilton, pilot, and Linda M. Godwin, payload commander, monitor and photograph clouds on Earth. The two, along with four other NASA astronauts spent a week and a half aboard Endeavour in support of the Space Radar Laboratory (SRL-1)/STS-59 mission.
STS059-46-025 (9-20 April 1994) --- On the Space Shuttle Endeavour's aft flight deck astronaut Jerome (Jay) Apt, mission specialist, uses a handheld 70mm Hasselblad camera to record still scenes of Earth. Apt, the commander of Endeavour's Blue Shift, joined five other NASA astronauts for a week and a half in space in support of the Space Radar Laboratory/STS-59 mission.
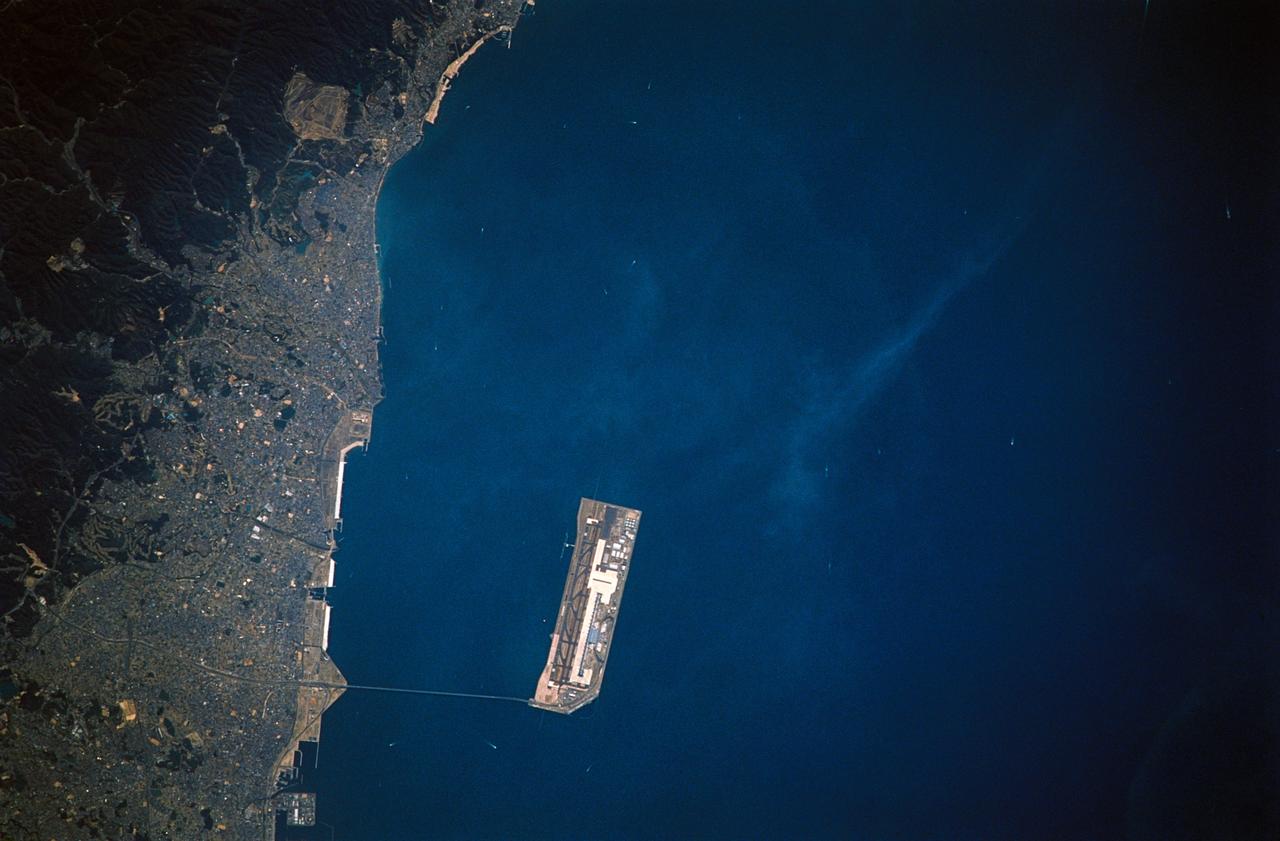
STS059-305-021 (9-20 April 1994) --- The floating airport at Osaka, Honshu, Japan. Nikon photograph, 300mm lens.
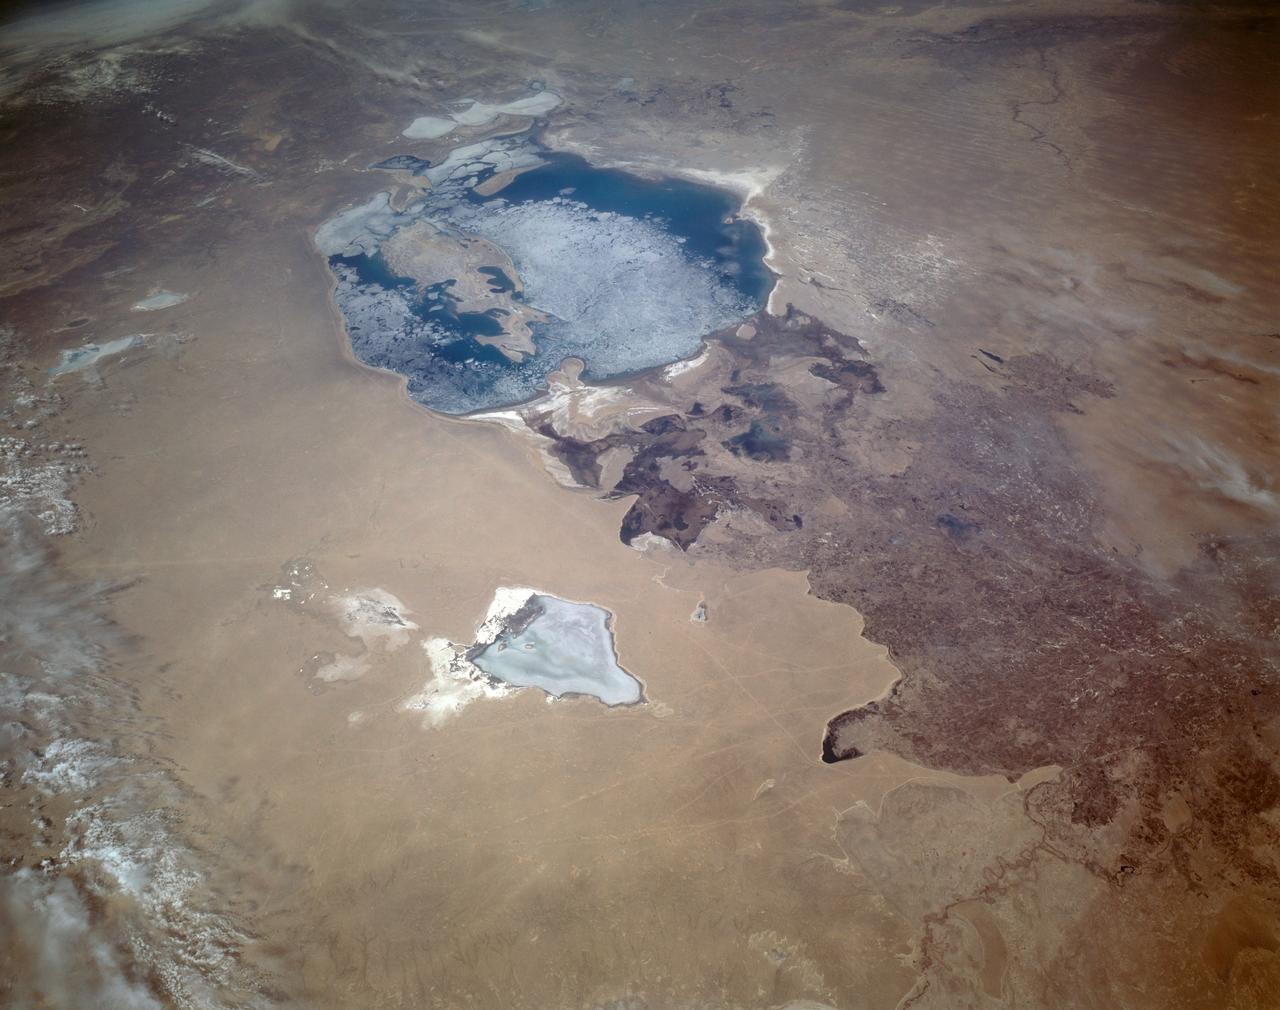
STS059-L22-140 (9-20 April 1994) --- View northeastward across Uzbekastan to the partly-ice-covered Aral Sea and Kazakhstan. The irrigated fan-delta of the Amu Darya extends from the right side of the photograph to end in extensive salt flats at the south end of the sea. The Aral was the fourth-largest inland sea or lake in the world, until diversion and over-use of the river water for irrigation led, in this arid climate, to the sea's decline. Linhof camera.
STS059-S-026 (11 April 1994) --- This is an image of Death Valley, California, centered at 36.629 degrees north latitude, 117.069 degrees west longitude. The image shows Furnace Creek alluvial fan and Furnace Creek Ranch at the far right, and the sand dunes near Stove Pipe Wells at the center. The dark fork-shaped feature between Furnace Creek fan and the dunes is a smooth flood-plain which encloses Cottonball Basin. The SIR-C/X-SAR supersite is an area of extensive field investigations and has been visited by both Space Radar Lab astronaut crews. Elevations in the Valley range from 70 meters below sea level, the lowest in the United States, to more than 3300 meters above sea level. Scientists are using SIR-C/X-SAR data from Death Valley to help answer a number of different questions about the Earth's geology. One question concerns how alluvial fans are formed and change through time under the influence of climatic changes and earthquakes. Alluvial fans are gravel deposits that wash down from the mountains over time. They are visible in the image as circular, fan-shaped bright areas extending into the darker valley floor from the mountains. Information about the alluvial fans help scientists study Earth's ancient climate. Scientists know the fans are bulit up through climatic and tectonic processes and they will use the SIR-C/X-SAR data to understand the nature and rates of weathering processes on the fans, soil formation, and the transport of sand and dust by the wind. SIR-C/X-SAR's sensitivity to centimeter-scale (or inch-scale) roughness provides detailed maps of surface texture. Such information can be used to study the occurrence and movement of dust storms and sand dunes. the goal of these studies is to gain a better understanding of the record of past climatic changes and the effects of those changes on a sensitive environment. This may lead to a better ability to predict future response of the land to different potential global cimate-change scenarios. Death Valley is also one of the primary calibration sites for SIR-C/X-SAR. The bright dots near the center of the image are corner reflectors that have been set-up to calibrate the radar as the Shuttle passes overhead. Thirty triangular-shaped reflectors (they look like aluminum pyramids) have been deployed by the calibration team from JPL over a 40 kilometer by 40 kilometer area in and around Death Valley. The calibration team will also deploy transponders (electronic reflectors) and recievers to measure the radar signals from SIR-C/X-SAR on the ground. Spaceborne Imaging Radar-C and X-Synthetic Aperture Radar (SIR-C/X-SAR) is part of NASA's Mission to Planet Earth (MTPE). The radars illuminate Earth with microwaves allowing detailed observations at any time, regardless of weather or sunlight conditions. SIR-C/X-SAR uses three microwave wavelengths: L-Band (24 cm), C-Band (6 cm), and X-Band (3 cm). The multi-frequency data will be used by the international scientific community to better understand the global environment and how it is changing. The SIR-C/X-SAR data, complemented by aircraft and ground studies, will give scientists clearer insights into those environmental changes which are caused by nature and those changes which are induced by human activity. SIR-C was develpoed by NASA's Jet Propulsion Laboratory (JPL). X-SAR was developed by the Dornire and Alenia Spazio Companies for the German Space Agency, Deutsche Agentur fuer Raumfahrtangelegenheiten (DARA), and the Italian Space Agency, Agenzia Spaziale Italiana (ASI). JPL Photo ID: P-43883
STS059-S-074 (15 April 1994) --- This color composite C-Band and L-Band image of the Kilauea volcano on the big island of Hawaii was acquired by the Spaceborne Imaging Radar-C and X-Band Synthetic Aperture Radar (SIR-C/X-SAR) flying on the Space Shuttle Endeavour. The city of Hilo can be seen at the top. The image shows the different types of lava flows around the crater Pu'u O'o. Ash deposits which erupted in 1790 from the summit of Kilauea volcano show up as dark in this image, and fine details associated with lava flows which erupted in 1919 and 1974 can be seen to the south of the summit in an area called the Ka'u Desert. In addition, the other historic lava flows created in 1881 and 1984 from Mauna Loa volcano (out of view to the left of this image) can easily be seen despite the fact that the surrounding area is covered by forest. Such information will be used to map the extent of such flows, which can pose a hazard to the subdivisions of Hilo. Highway 11 is the linear feature running from Hilo to the Kilauea volcano. The Kilauea volcano has been almost continuously active for more than the last 11 years. Field teams that were on the ground specifically to support these radar observations report that there was vigorous surface activity about 400 meters (one-quarter mile) inland from the coast. A moving lava flow about 200 meters (660 feet) in length was observed at the time of the Shuttle over flight, raising the possibility that subsequent images taken during this mission will show changes in the landscape. SIR-C/X-SAR is part of NASA's Mission to Planet Earth (MTPE). SIR-C/X-SAR radars illuminate Earth with microwaves allowing detailed observations at any time, regardless of weather or sunlight conditions. SIR-C/X-SAR uses three microwave wavelengths: L-Band (24 cm), C-Band (6 cm), and X-Band (3 cm). The multi-frequency data will be used by the international scientific community to better understand the global environment and how it is changing. The SIR-C/X-SAR data, complemented by aircraft and ground studies, will give scientists clearer insights into those environmental changes which are caused by nature and those changes which are induced by human activity. SIR-C was developed by NASA's Jet Propulsion Laboratory (JPL). X-SAR was developed by the Dornire and Alenia Spazio Companies for the German Space Agency, Deutsche Agentur fuer Raumfahrtangelegenheiten (DARA), and the Italian Space Agency, Agenzia Spaziale Italiana (ASI). JPL Photo ID: P-43918
STS059-S-039 (11 April 1994) --- This is a false-color composite of Prince Albert, Canada, centered at 53.91 north latitude and 104.69 west longitude. This image was acquired by the Spaceborne Imaging Radar-C and X-Band Synthetic Aperture Radar (SIR-C/X-SAR) aboard the Space Shuttle Endeavour on its 20th orbit. The area is located 40 kilometers (25 miles) north and 30 kilometers (20 miles) east of the town of Prince Albert in the Saskatchewan province of Canada. The image covers the area east of the Candle Lake, between gravel surface Highways 120 and 106 and west of 106. The area in the middle of the image covers the entire Nipawin (Narrow Hills) provincial park. The look angle of the radar is 30 degrees and the size of the image is approximately 20 kilometers by 50 kilometers (12 by 30 miles). The image was produced by using only the L-Band. The three polarization channels HH, HV and VV are illustrated by red, green and blue respectively. The changes in the intensity of each color are related to various surface conditions such as variations in forest stands, frozen or thawed condition of the surface, disturbances (fire and deforestation), and areas of re-growth. Most of the dark areas in the image are the ice-covered lakes in the region. The dark area on the top right corner of the image is the White Gull Lake north of the intersection of Highway 120 and 913. The right middle part of the image shows Lake Ispuchaw and Lower Fishing Lake. The deforested areas are also shown by dark areas in the image. Since most of the logging practice at the Prince Albert area is around the major highways, the deforested areas can be easily detected as small geometrically shaped dark regions along the roads. At the time of the SIR-C/X-SAR overpass, a major part of the forest is either frozen or undergoing the spring thaw. The L-Band HH shows a high return in the jack pine forest. The reddish areas in the image are old jack pine forest, 12-17 meters (40-55 feet) in height and 60-75 years old. The orange-greenish areas are young jack pine trees, 3-5 meters (10-16 feet) in height and 11-16 years old. The green areas are due to the relative high intensity of the HV channel which is strongly correlated with the amount of biomass. L-Band HV channel shows the biomass variations over the entire region. Most of the green areas, when compared to the forest cover maps are identified as black spruce trees. The dark blue and dark purple colors show recently harvested or re-growth areas respectively. SIR-C/X-SAR is part of NASA's Mission to Planet Earth (MTPE). SIR-C/X-SAR radars illuminate Earth with microwaves allowing detailed observations at any time, regardless of weather or sunlight conditions. SIR-C/X-SAR uses three microwave wavelengths: L-Band (24 cm), C-Band (6 cm), and X-Band (3 cm). The multi-frequency data will be used by the international scientific community to better understand the global environment and how it is changing. The SIR-C/X-SAR data, complemented by aircraft and ground studies, will give scientists clearer insights into those environmental changes which are caused by nature and those changes which are induced by human activity. SIR-C was developed by NASA's Jet Propulsion Laboratory (JPL). X-SAR was developed by the Dornire and Alenia Spazio Companies for the German Space Agency, Deutsche Agentur fuer Raumfahrtangelegenheiten (DARA), and the Italian Space Agency, Agenzia Spaziale Italiana (ASI). JPL Photo ID: P-43886
STS059-S-080 (18 April 1994) --- This is a false-color three frequency image of the Oberpfaffenhofen supersite, an area just south-west of Munich in southern Germany. The colors show the different conditions that the three radars (X-Band, C-Band and L-Band) can see on the ground. The image covers a 27 by 36 kilometer area. The center of the site is 48.09 degrees north and 11.29 degrees east. The image was acquired by the Spaceborne Imaging Radar-C and X-Band Synthetic Aperture Radar (SIR-C/X-SAR) onboard the Space Shuttle Endeavour on April 11, 1994. The dark area on the left is Lake Ammersee. The two smaller lakes are the Woerthsee and the Pilsensee. On the bottom is the tip of the Starnbergersee. The city of Munich is located just beyond the right of the image. The Oberpfaffenhofen supersite is the major test site for SIR-C/X-SAR calibration and scientific investigations concerning agriculture, forestry, hydrology and geology. This color composite image is a three frequency overlay. L-Band total power was assigned red, the C-Band total power is shown in green and the X-Band VV polarization appears blue. The colors on the image stress the differences between the L-Band, C-Band, X-Band images. If the three radar antennas were getting an equal response from objects on the ground, this image would appear in black and white. However, in this image, the blue areas corresponds to area for which the X-Band backscatter is relatively higher than the backscatter at L and C-Bands. This behavior is characteristic of grasslands, clear cuts and shorter vegetation. Similarly, the forested areas have a reddish tint (L-Band). The green areas seen near both the Ammersee and the Pilsensee lakes indicate marshy areas. The agricultural fields in the upper right hand corner appear mostly in blue and green (X-Band and C-Band). The white areas are mostly urban areas, while the smooth surfaces of the lakes appear very dark. SIR-C/X-SAR is part of NASA's Mission to Planet Earth (MTPE). SIR-C/X-SAR radars illuminate Earth with microwaves allowing detailed observations at any time, regardless of weather or sunlight conditions. SIR-C/X-SAR uses three microwave wavelengths: L-Band (24 cm), C-Band (6 cm), and X-Band (3 cm). The multi-frequency data will be used by the international scientific community to better understand the global environment and how it is changing. The SIR-C/X-SAR data, complemented by aircraft and ground studies, will give scientists clearer insights into those environmental changes which are caused by nature and those changes which are induced by human activity. SIR-C was developed by NASA's Jet Propulsion Laboratory (JPL). X-SAR was developed by the Dornire and Alenia Spazio Companies for the German Space Agency, Deutsche Agentur fuer Raumfahrtangelegenheiten (DARA), and the Italian Space Agency, Agenzia Spaziale Italiana (ASI). JPL Photo ID: P-43930
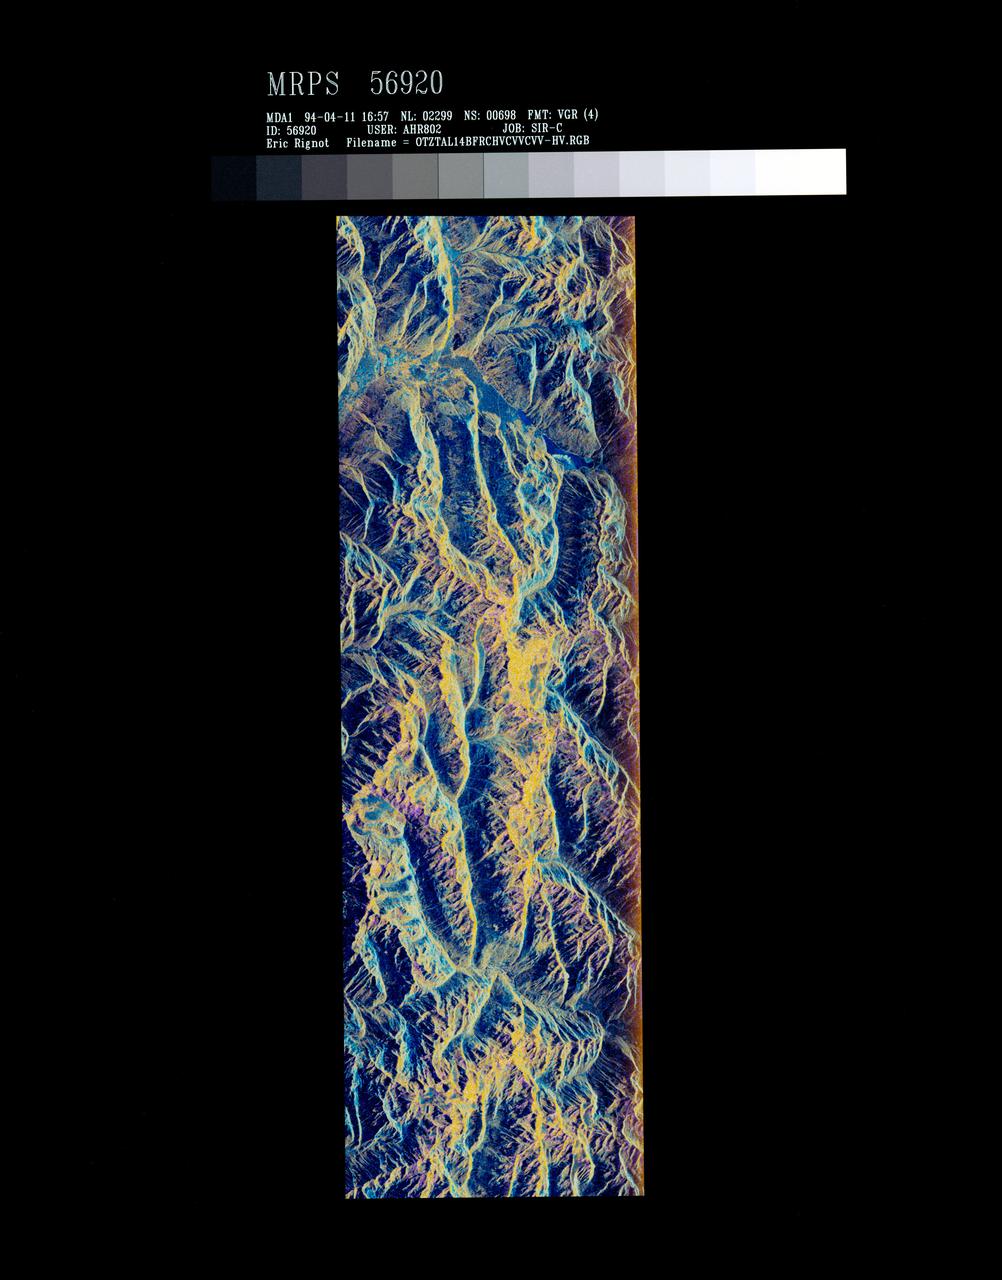
STS059-S-072 (13 April 1994) --- This image is a false-color composite of Oetztal, Austria located in the Central Alps, centered at 46.8 degrees north latitude, and 10.70 degrees east longitude, at the border between Switzerland (top), Italy (left) and Austria (right and bottom). The area shown is 50 kilometers (30 miles) south of Innsbruck, Austria. This image was acquired by the Spaceborne Imaging Radar-C and X-Band Synthetic Aperture Radar (SIR-C/X-SAR) aboard the Space Shuttle Endeavour on its 14th orbit. Oetztal is a SIR-C/X-SAR hydrology supersite. Approximately one quarter of this image is covered by glaciers, the largest of which, Gepatschferner, is visible as a triangular yellow patch in the center of the scene. The summits of the main peaks reach elevations between 3,500 and 3,768 meters (11,500 and 12,362 feet) above sea level. The tongues of the glaciers are descending from elevated plateaus down into narrow valleys which were formed during the last ice age. This color image was produced in C-Band using multi-polarization information (Red=CHV, Green=CVV, Blue=CVV/CHV). The blue areas are lakes (Gepatsch Dam at center right; Lake Muta at top right) and glacier ice. The yellow areas are slopes facing the radar and areas of dry snow. Purple corresponds to slopes facing away from the radar. Yellow in the valley bottom corresponds to tree covered areas. There is 30 to 50 centimeters (12 to 20 inches) of dry, fresh snow on the glaciers, and about 10 centimeters (4 inches) in the valley at the city of Vent, Austria (center). At these data were taken, the weather was cold, with snow and thick fog. The entire area would appear white to an optical sensor because it is all covered under a winter snowpack. Researchers are interested in Oetztal because knowing how glaciers shrink and grow over time is an important indication of climatic change. SIR-C/X-SAR is part of NASA's Mission to Planet Earth (MTPE). SIR-C/X-SAR radars illuminate Earth with microwaves allowing detailed observations at any time, regardless of weather or sunlight conditions. SIR-C/X-SAR uses three microwave wavelengths: L-Band (24 cm), C-Band (6 cm), and X-Band (3 cm). The multi-frequency data will be used by the international scientific community to better understand the global environment and how it is changing. The SIR-C/X-SAR data, complemented by aircraft and ground studies, will give scientists clearer insights into those environmental changes which are caused by nature and those changes which are induced by human activity. SIR-C was developed by NASA's Jet Propulsion Laboratory (JPL). X-SAR was developed by the Dornire and Alenia Spazio Companies for the German Space Agency, Deutsche Agentur fuer Raumfahrtangelegenheiten (DARA), and the Italian Space Agency, Agenzia Spaziale Italiana (ASI). JPL Photo ID: P-43890
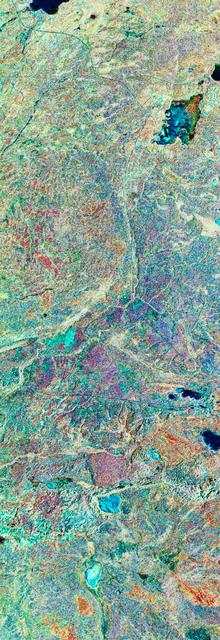
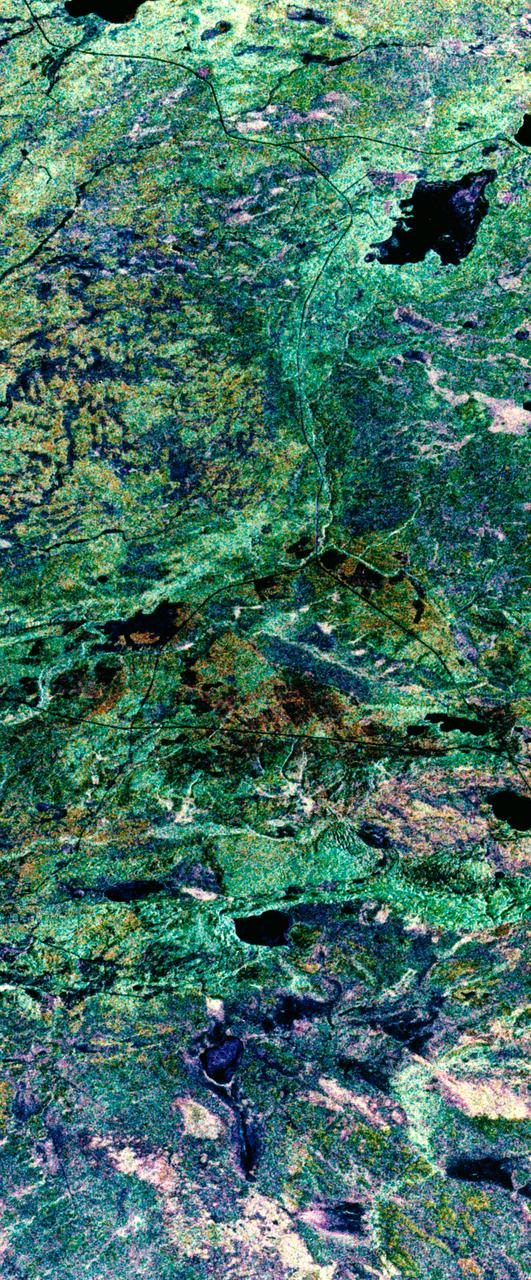
STS059-S-079 (18 April 1994) --- This is a false-color, three frequency image of Prince Albert, Canada, centered at 53.91 north latitude and 104.69 west longitude. It was produced using data from the X-Band, C-Band and L-Band radars that comprise the Spaceborne Imaging Radar-C and X-Band Synthetic Aperture Radar (SIR-C/X-SAR). SIR-C/X-SAR acquired this image on the 20th orbit of the Space Shuttle Endeavour. The area is located 40 kilometers north and 30 kilometers east of the town of Prince Albert in the Saskatchewan province of Canada. The image covers the area east of the Candle Lake, between gravel surface Highways 120 and 106 and west of 106. The area in the middle of the image covers the entire Nipawin (Narrow Hills) provincial park. The look angle of the radar is 30 degrees and the size of the image is approximately 20 by 50 kilometers. The red, green, and blue colors represent L-Band total power, C-Band total power, and XVV respectively. The changes in the intensity of each color are related to various surface conditions such as frozen or thawed forest, fire, deforestation and areas of regrowth. Most of the dark blue areas in the image are the ice covered lakes. The dark area on the top right corner of the image is the White Gull Lake north of the intersection of Highway 120 and 913. The right middle part of the image shows Lake Ispuchaw and Lower Fishing Lake. The deforested areas are shown by light blue in the image. Since most of the logging practice at the Prince Albert area is around the major highways, the deforested areas can be easily detected as small geometrically shaped dark regions along the roads. At the time these data were taken, a major part of the forest was either frozen or undergoing the spring thaw. In such conditions, due to low volume of water in the vegetation, a deeper layer of the canopy is imaged by the radar, revealing valuable information about the type of trees, the amount of vegetation biomass and the condition of the surface. As the frequency increases, the penetration depth in the canopy decreases. Over forest canopies, the X-Band radar contains information about the top of the canopy. Whereas, C-Band and L-Band radar returns show contributions from the crown and trunk areas respectively. The bright areas in the image are dense mixed aspen and old jackpine forests where the return from all three bands is high. The reddish area corresponds to more sparse old jack pine (12 to 17 meters in height and 60 to 75 years old) where the L-Band signal penetrates deeper in the canopy and dominates C-Band and X-Band returns. Comparison of the image with the forest cover map of the area indicates that the three band radar can be used to classify various stands. SIR-C/X-SAR is part of NASA's Mission to Planet Earth (MTPE). SIR-C/X-SAR radars illuminate Earth with microwaves allowing detailed observations at any time, regardless of weather or sunlight conditions. SIR-C/X-SAR uses three microwave wavelengths: L-Band (24 cm), C-Band (6 cm), and X-Band (3 cm). The multi-frequency data will be used by the international scientific community to better understand the global environment and how it is changing. The SIR-C/X-SAR data, complemented by aircraft and ground studies, will give scientists clearer insights into those environmental changes which are caused by nature and those changes which are induced by human activity. SIR-C was developed by NASA's Jet Propulsion Laboratory (JPL). X-SAR was developed by the Dornire and Alenia Spazio Companies for the German Space Agency, Deutsche Agentur fuer Raumfahrtangelegenheiten (DARA), and the Italian Space Agency, Agenzia Spaziale Italiana (ASI). JPL Photo ID: P-43929
STS059-S-084 (17 April 1994) --- This is a three-dimensional perspective of Mammoth Mountain, California. This view was constructed by overlaying a SIR-C radar image on a U.S. Geological Survey digital elevation map. Vertical exaggeration is 2x. The image is centered at 37.6 degrees north, 119.0 degrees west. It was acquired from the Spaceborne Imaging Radar-C and X-Band Synthetic Aperture Radar (SIR-C/X-SAR) onboard the Space Shuttle Endeavour on its 67th orbit, April 13, 1994. In this color representation, red is C-Band HV-polarization, green is C-Band VV-polarization and blue is the ratio of C-Band VV to C-Band HV. Blue areas are smooth and yellow areas are rock outcrops with varying amounts of snow and vegetation. Crowley Lake is in the foreground and Highway 395 crosses in the middle of the image. Mammoth Mountain is shown in the upper right. SIR-C/X-SAR is part of NASA's Mission to Planet Earth (MTPE). SIR-C/X-SAR radars illuminate Earth with microwaves allowing detailed observations at any time, regardless of weather or sunlight conditions. SIR-C/X-SAR uses three microwave wavelengths: L-Band (24 cm), C-Band (6 cm), and X-Band (3 cm). The multi-frequency data will be used by the international scientific community to better understand the global environment and how it is changing. The SIR-C/X-SAR data, complemented by aircraft and ground studies, will give scientists clearer insights into those environmental changes which are caused by nature and those changes which are induced by human activity. SIR-C was developed by NASA's Jet Propulsion Laboratory (JPL). X-SAR was developed by the Dornire and Alenia Spazio Companies for the German Space Agency, Deutsche Agentur fuer Raumfahrtangelegenheiten (DARA), and the Italian Space Agency, Agenzia Spaziale Italiana (ASI). JPL Photo ID: P-43933
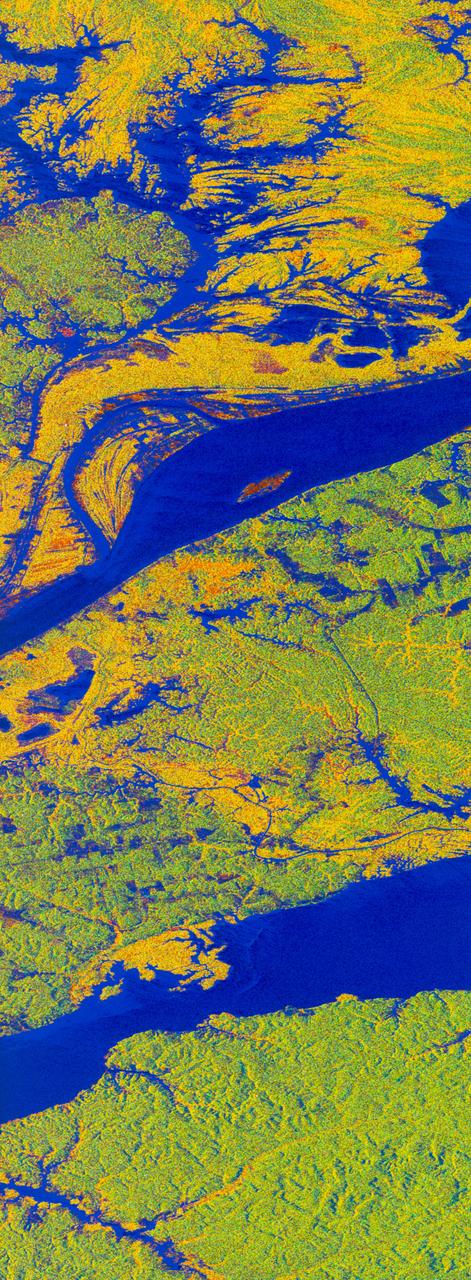
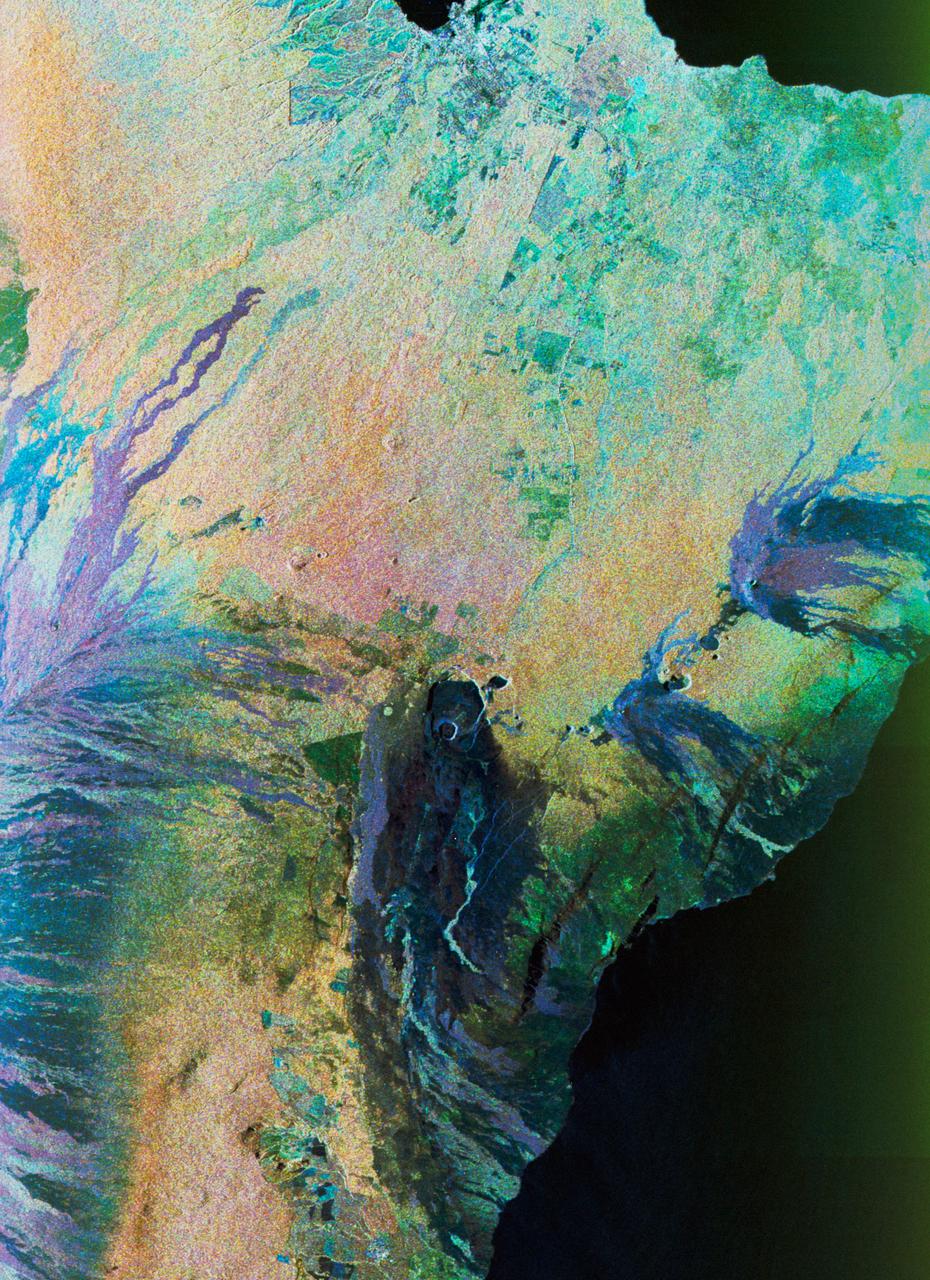
STS059-S-068 (13 April 1994) --- This false-color L-Band image of the Manaus region of Brazil was acquired by the Spaceborne Imaging Radar-C and X-Band Synthetic Aperture Radar (SIR-C/X-SAR) aboard the Space Shuttle Endeavour on orbit 46 of the mission. The area shown is approximately 8 kilometers by 40 kilometers (5 by 25 miles). At the top of the image are the Solimoes and Rio Negro Rivers just before they combine at Manaus to form the Amazon River. The image is centered at about 3 degrees south latitude, and 61 degrees west longitude. The false colors are created by displaying three L-Band polarization channels; red areas correspond to high backscatter at HH polarization, while green areas exhibit high backscatter at HV polarization. Blue areas show low returns at VV polarization; hence the bright blue colors of the smooth river surfaces. Using this color scheme, green areas in the image are heavily forested, while blue areas are either cleared forest or open water. The yellow and red areas are flooded forest. Between Rio Solimoes and Rio Negro a road can be seen running from some cleared areas (visible as blue rectangles north of Rio Solimoes) north towards a tributary of Rio Negro. SIR-C/X-SAR is part of NASA's Mission to Planet Earth (MTPE). SIR-C/X-SAR radars illuminate Earth with microwaves allowing detailed observations at any time, regardless of weather or sunlight conditions. SIR-C/X-SAR uses three microwave wavelengths: L-Band (24 cm), C-Band (6 cm), and X-Band (3 cm). The multi-frequency data will be used by the international scientific community to better understand the global environment and how it is changing. The SIR-C/X-SAR data, complemented by aircraft and ground studies, will give scientists clearer insights into those environmental changes which are caused by nature and those changes which are induced by human activity. SIR-C was developed by NASA's Jet Propulsion Laboratory (JPL). X-SAR was developed by the Dornire and Alenia Spazio Companies for the German Space Agency, Deutsche Agentur fuer Raumfahrtangelegenheiten (DARA), and the Italian Space Agency, Agenzia Spaziale Italiana (ASI). JPL Photo ID: P-43895
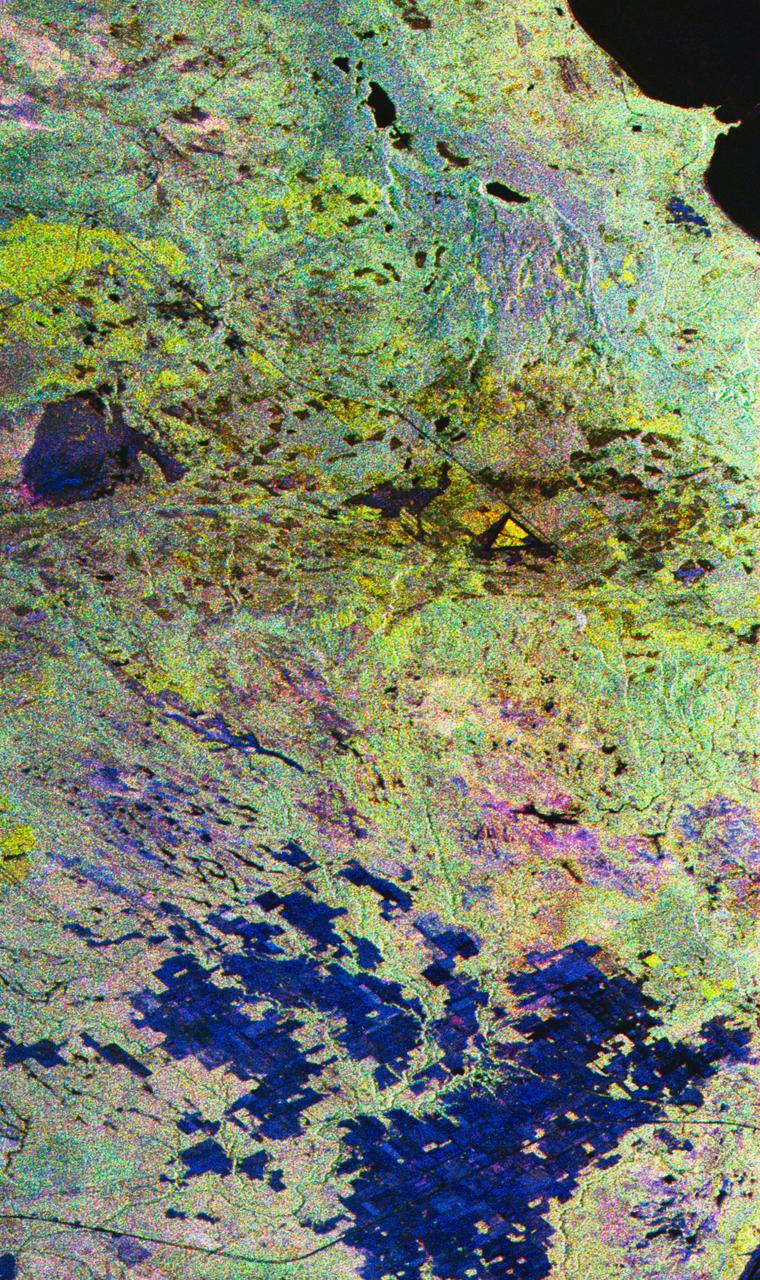
STS059-S-027 (10 April 1994) --- This image is a false-color composite of Raco, Michigan, centered at 46.39 degrees north latitude, 84.88 degrees east longitude. This image was acquired by the Spaceborne Imaging Radar-C and X-Band Synthetic Aperture Radar (SIR-C/X-SAR) aboard the Space Shuttle Endeavour on its 6th orbit and during the first full-capacity test of the instrument. This image was produced using both L-Band and C-Band data. The area shown is approximately 20 kilometers by 50 kilometers. Raco is located at the eastern end of Michigan's upper peninsula, west of Sault Ste. Marie and south of Whitefish Bay on Lake Superior. The site is located at the boundary between the boreal forests and the northern temperate forests, a transitional zone that is expected to be ecologically sensitive to anticipated global changes resulting from climatic warming. On any given day, there is a 60 percent chance that this area will be obscured to some extent by cloud cover which makes it difficult to image using optical sensors. In this color representation (Red=LHH, Green=LHV, Blue=CHH), darker areas in the image are smooth surfaces such as frozen lakes and other non-forested areas. The colors are related to the types of trees and the brightness is related to the amount of plant material covering the surface, called forest biomass. Accurate information about land-cover is important to area resource managers and for use in regional- to global-scale scientific models used to understand global change. SIR-C/X-SAR radars illuminate Earth with microwaves allowing detailed observations at any time, regardless of weather or sunlight conditions. SIR-C/X-SAR uses three microwave wavelengths: L-Band (24 cm), C-Band (6 cm), and X-Band (3 cm). The multi-frequency data will be used by the international scientific community to better understand the global environment and how it is changing. The SIR-C/X-SAR data, complemented by aircraft and ground studies, will give scientists clearer insights into those environmental changes which are caused by nature and those changes which are induced by human activity. SIR-C was developed by NASA's Jet Propulsion Laboratory (JPL). X-SAR was developed by the Dornire and Alenia Spazio Companies for the German Space Agency, Deutsche Agentur fuer Raumfahrtangelegenheiten (DARA), and the Italian Space Agency, Agenzia Spaziale Italiana (ASI). JPL Photo ID: P-43882
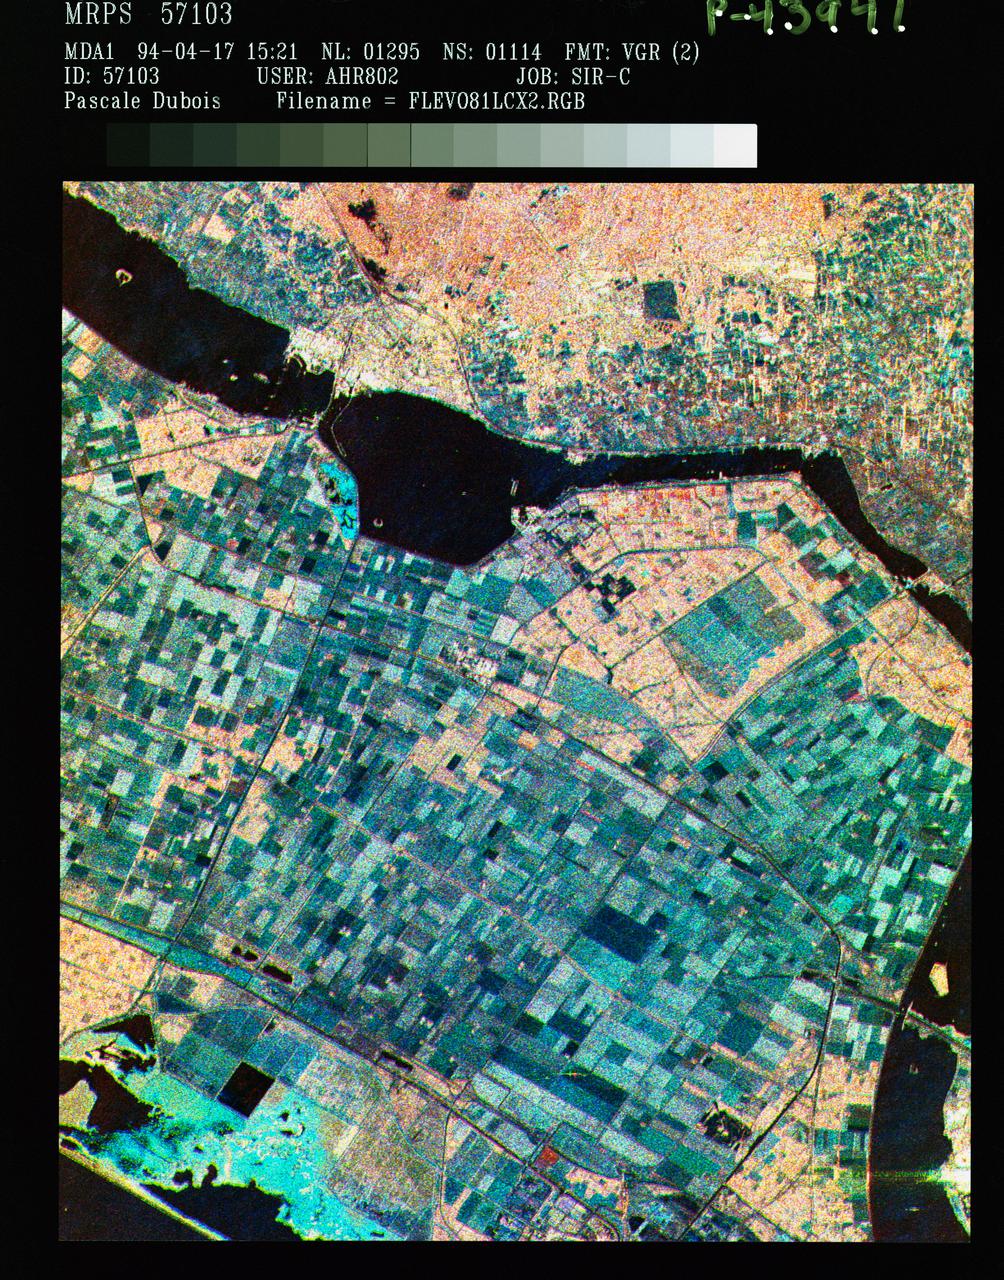
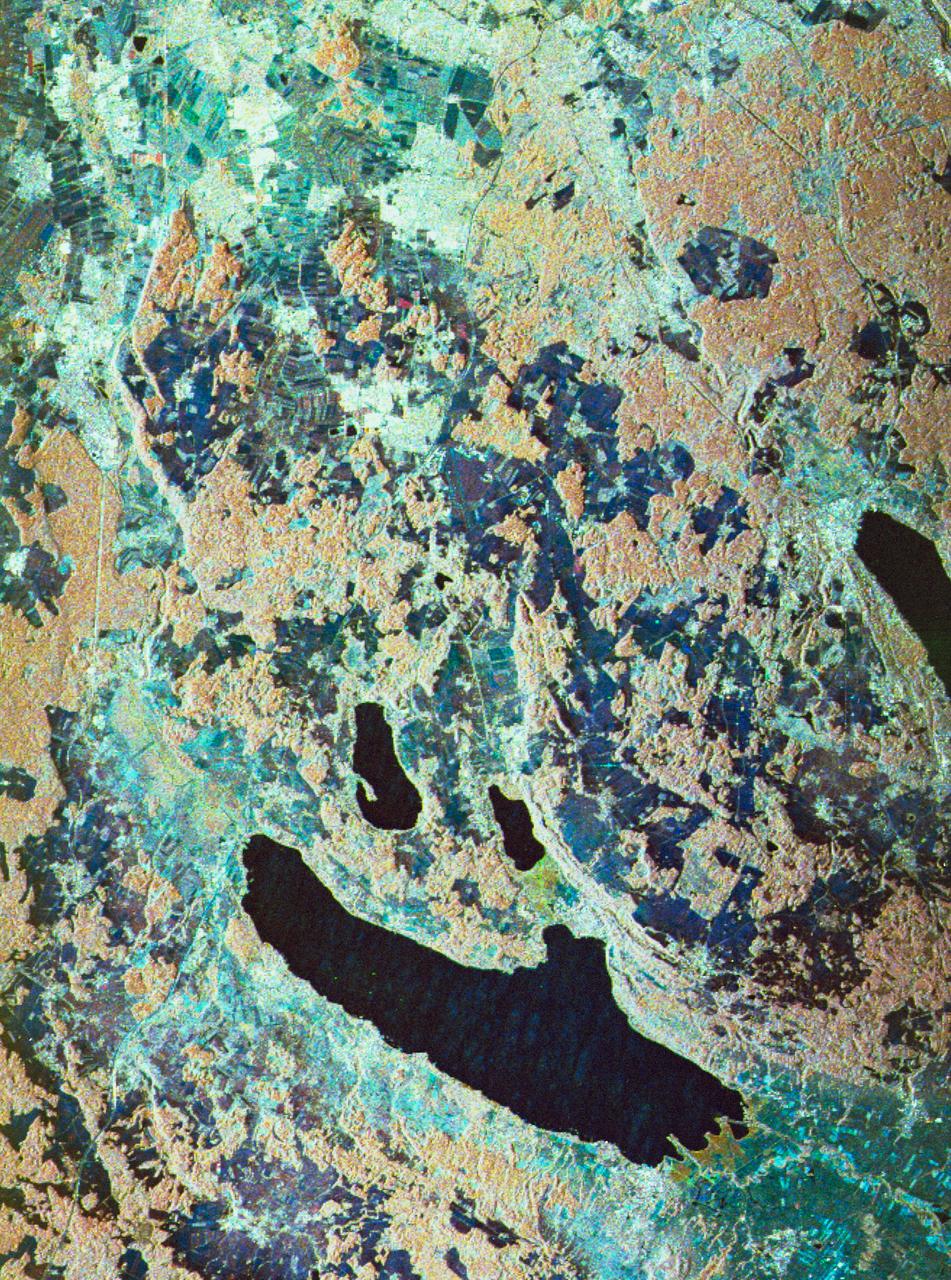
STS059-S-086 (18 April 1994) --- This is a three-frequency false-color image of Flevoland, the Netherlands, centered at 52.4 degrees north latitude, and 5.4 degrees east longitude. This image was acquired by the Spaceborne Imaging Radar-C and X-Band Synthetic Aperture Radar (SIR-C/X-SAR) aboard the Space Shuttle Endeavour on April 14, 1994. It was produced by combining data from the X-Band, C-Band and L-Band radar's. The area shown is approximately 25 by 28 kilometers (15 1/2 by 17 1/2 miles). Flevoland, which fills the lower two-thirds of the image, is a very flat area that is made up of reclaimed land that is used for agriculture and forestry. At the top of the image, across the canal from Flevoland, is an older forest shown in red; the city of Harderwijk is shown in white on the shore of the canal. At this time of the year, the agricultural fields are bare soil, and they show up in this images in blue. The changes in the brightness of the blue areas are equal to the changes in roughness. The dark blue areas are water and the small dots in the canal are boats. This SIR-C/X-SAR supersite is being used for both calibration and agricultural studies. Several soil and crop ground-truth studies will be conducted during the Shuttle flight. In addition, about 10 calibration devices and 10 corner reflectors have been deployed to calibrate and monitor the radar signal. One of these transponders can be seen as a bright star in the lower right quadrant of the image. This false-color image was made using L-Band total power in the red channel, C-Band total power in the green channel, and X-Band VV polarization in the blue channel. SIR-C/X-SAR is part of NASA's Mission to Planet Earth (MTPE). SIR-C/X-SAR radars illuminate Earth with microwaves allowing detailed observations at any time, regardless of weather or sunlight conditions. SIR-C/X-SAR uses three microwave wavelengths: L-Band (24 cm), C-Band (6 cm), and X-Band (3 cm). The multi-frequency data will be used by the international scientific community to better understand the global environment and how it is changing. The SIR-C/X-SAR data, complemented by aircraft and ground studies, will give scientists clearer insights into those environmental changes which are caused by nature and those changes which are induced by human activity. SIR-C was developed by NASA's Jet Propulsion Laboratory (JPL). X-SAR was developed by the Dornire and Alenia Spazio Companies for the German Space Agency, Deutsche Agentur fuer Raumfahrtangelegenheiten (DARA), and the Italian Space Agency, Agenzia Spaziale Italiana (ASI). JPL Photo ID: P-43941
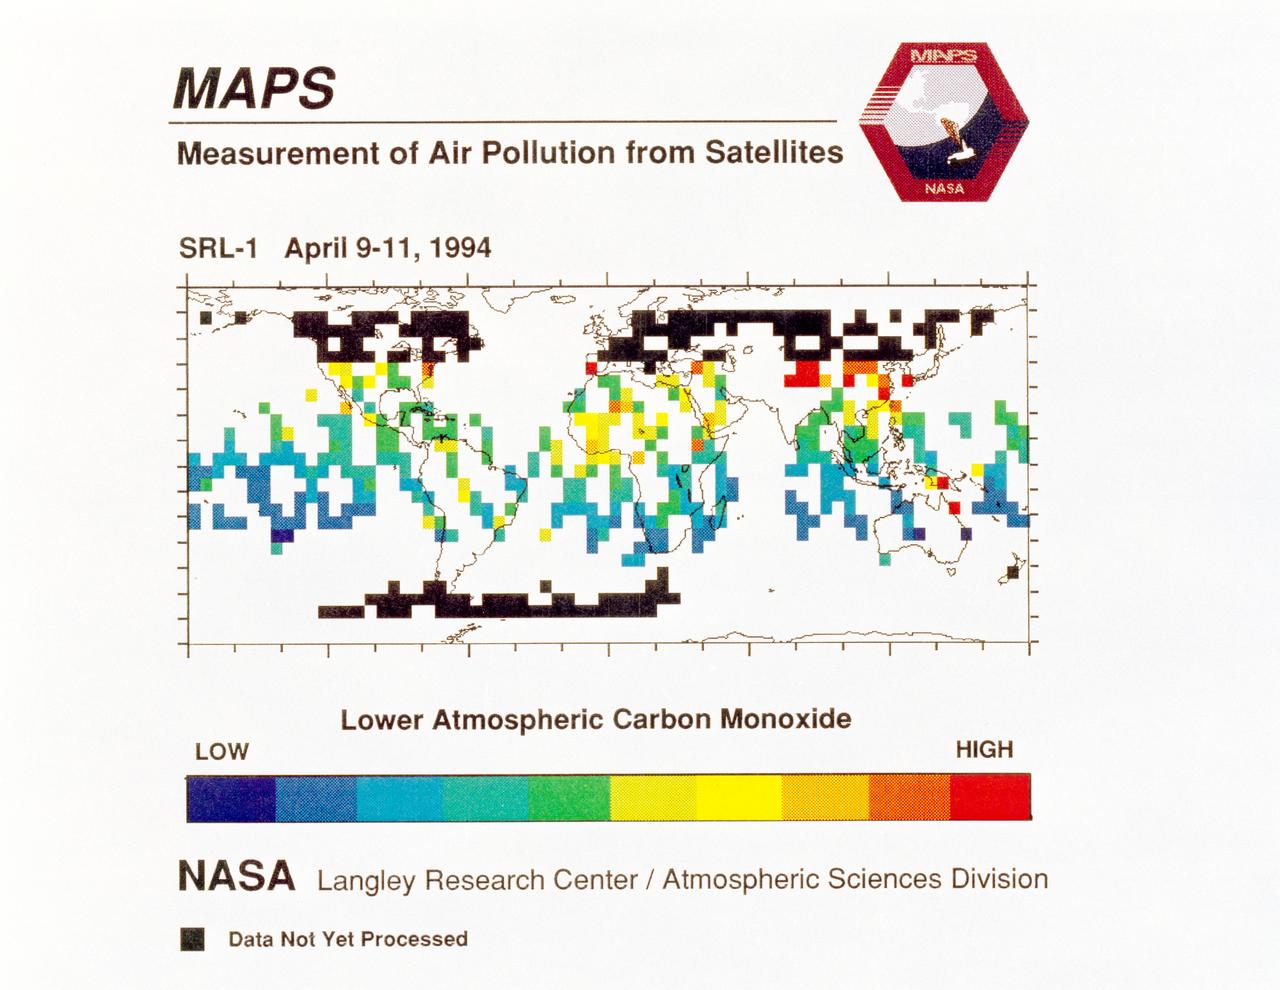
STS059-S-040 (12 April 1994) --- STS-59's MAPS (Measurement of Air Pollution from Satellites) experiment is sending real-time data that provides the most comprehensive view of carbon monoxide concentrations on Earth ever recorded. This computer image shows a summary of "quick look" data obtained by the MAPS instrument during its first days of operations as part of the Space Shuttle Endeavour's SRL-1 payload. This data will be processed using more sophisticated techniques following the flight. The color red indicates areas with the highest levels of carbon monoxide. These Northern Hemisphere springtime carbon monoxide values are generally significantly higher than the values found in the Southern Hemisphere. This is in direct contrast to the data obtained by the MAPS experiment during November 1981 and October 1984, i.e. during Northern Hemisphere fall. The astronauts aboard Endeavour have seen fires in most of the areas showing higher carbon monoxide values (China, Eastern Australia, and equatorial Africa). The relationship between the observed fires and the higher carbon monoxide values will be investigated following SRL-1 by combining the MAPS data with meteorological data, surface imagery, and Space Shuttle hand-held photographs. By the end of SRL-1, MAPS will have acquired data over most of the globe between 57 degrees north and 57 degrees south latitudes. The entire data set will be carefully analyzed using sophisticated post-flight data processing techniques. The data will then be applied in a variety of scientific studies concerning chemistry and transport processes in the atmosphere. The MAPS experiment measures the carbon monoxide in the lower atmosphere. This gas is produced both as a result of natural processes and as a result of human activities. The primary human resources of carbon monoxide are automobiles and industry and the burning of plant materials. The primary natural source is the interaction of sunlight with naturally occurring ozone and water vapor. The strength of all of these sources changes seasonally.