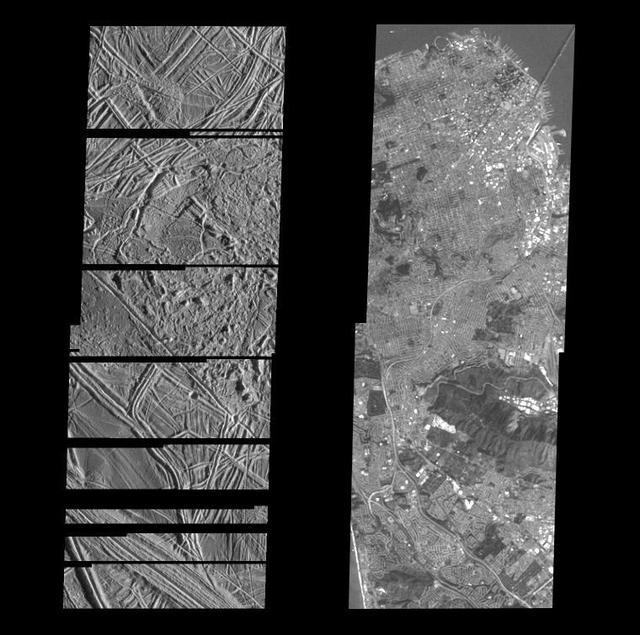
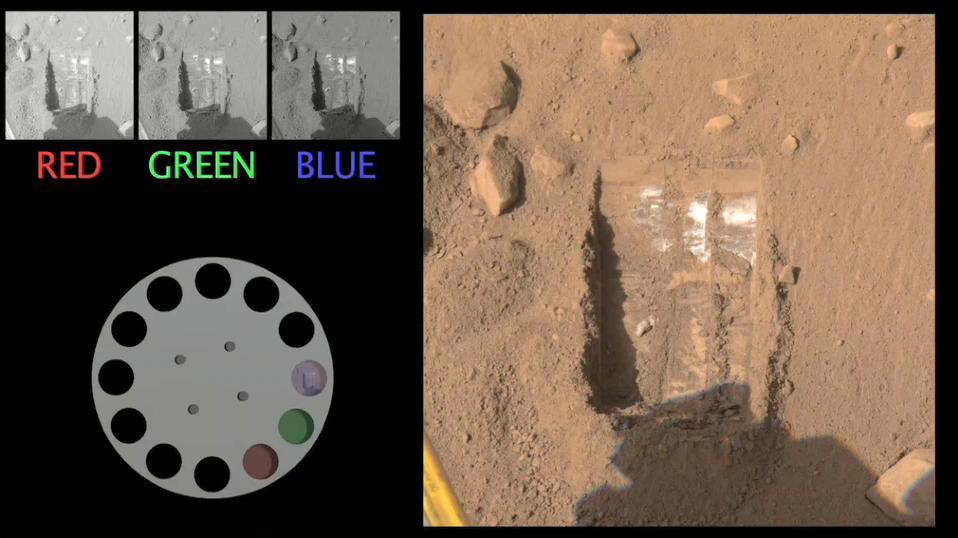
Structurally Complex Surface of Europa and similar scales on Earth
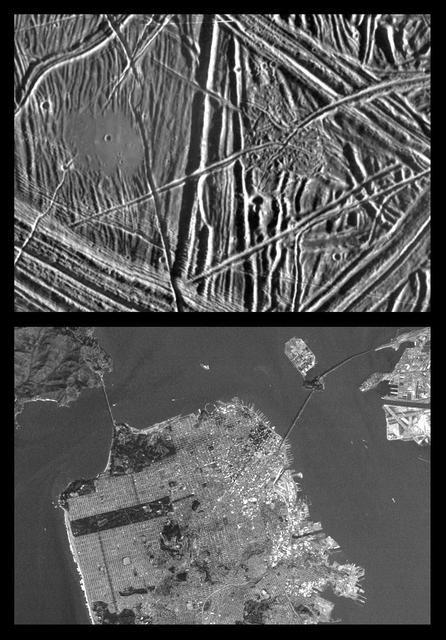
Close-up of Europa Surface and similar scales on Earth
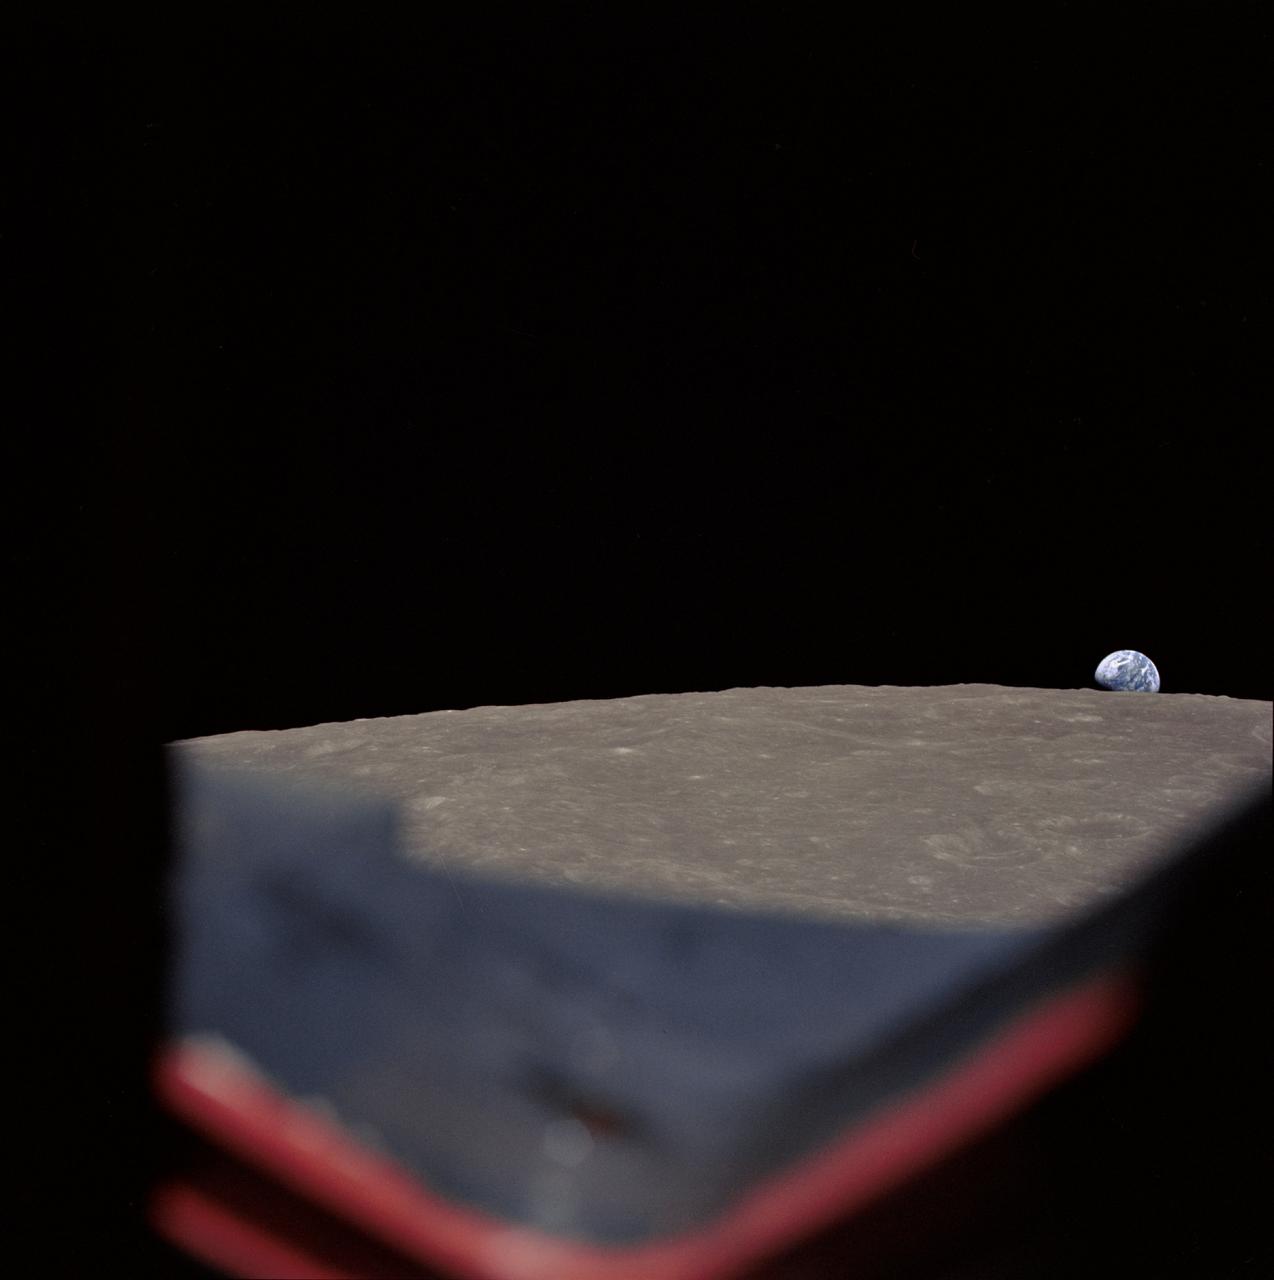
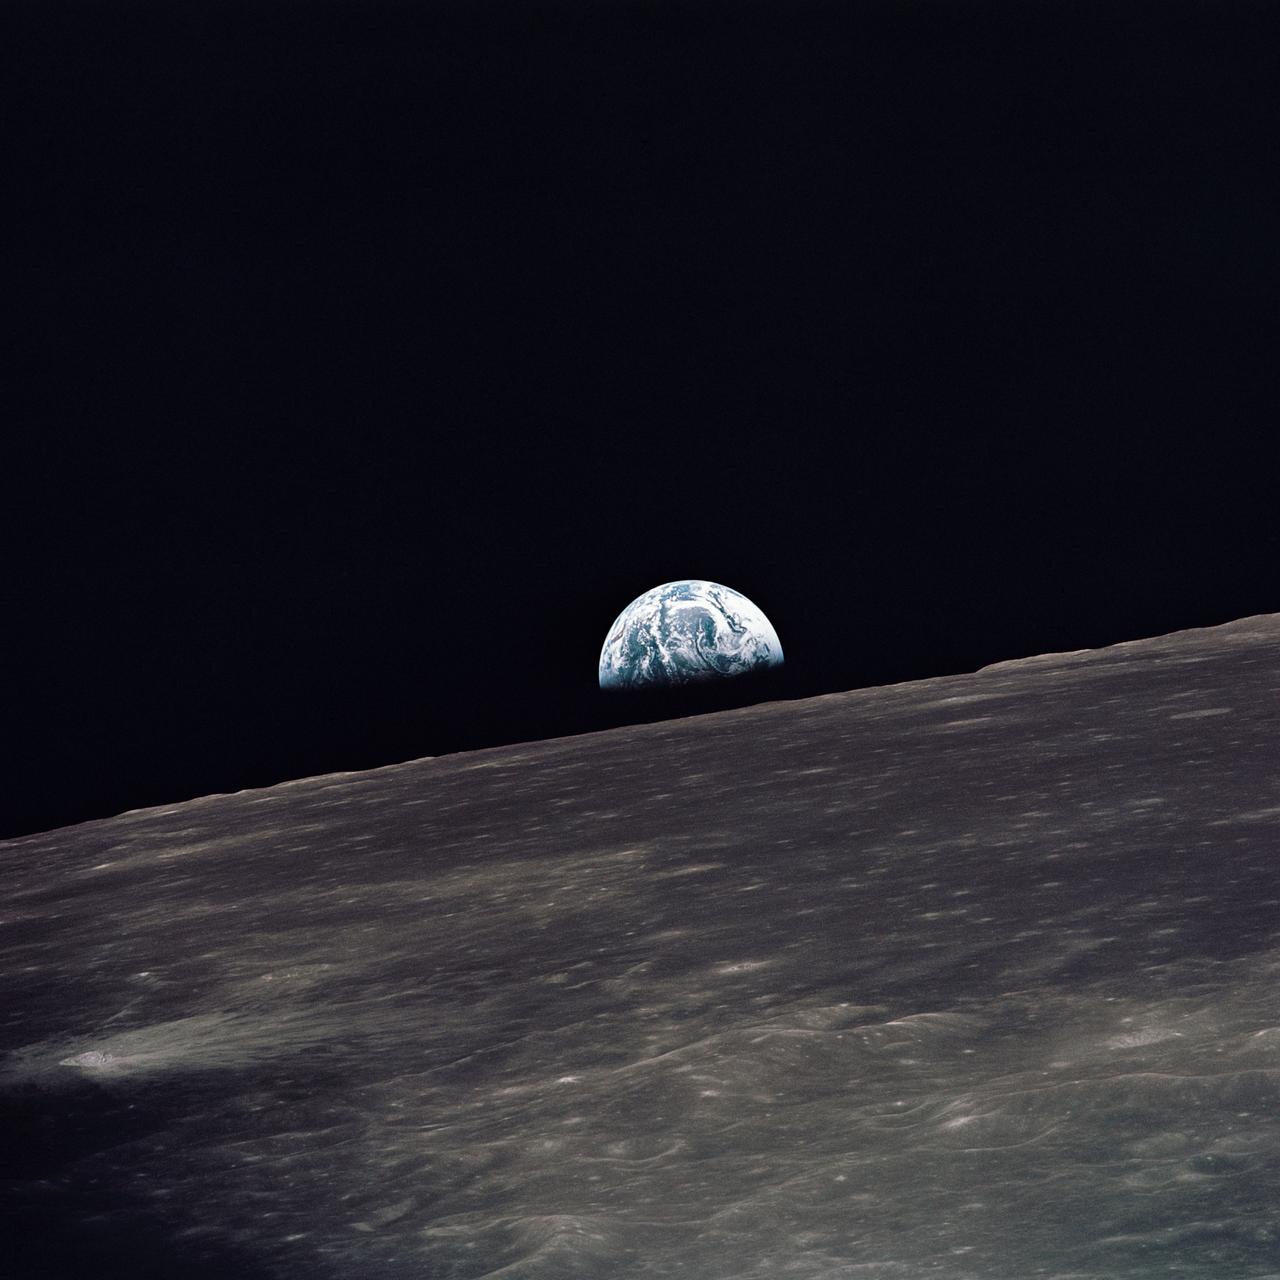
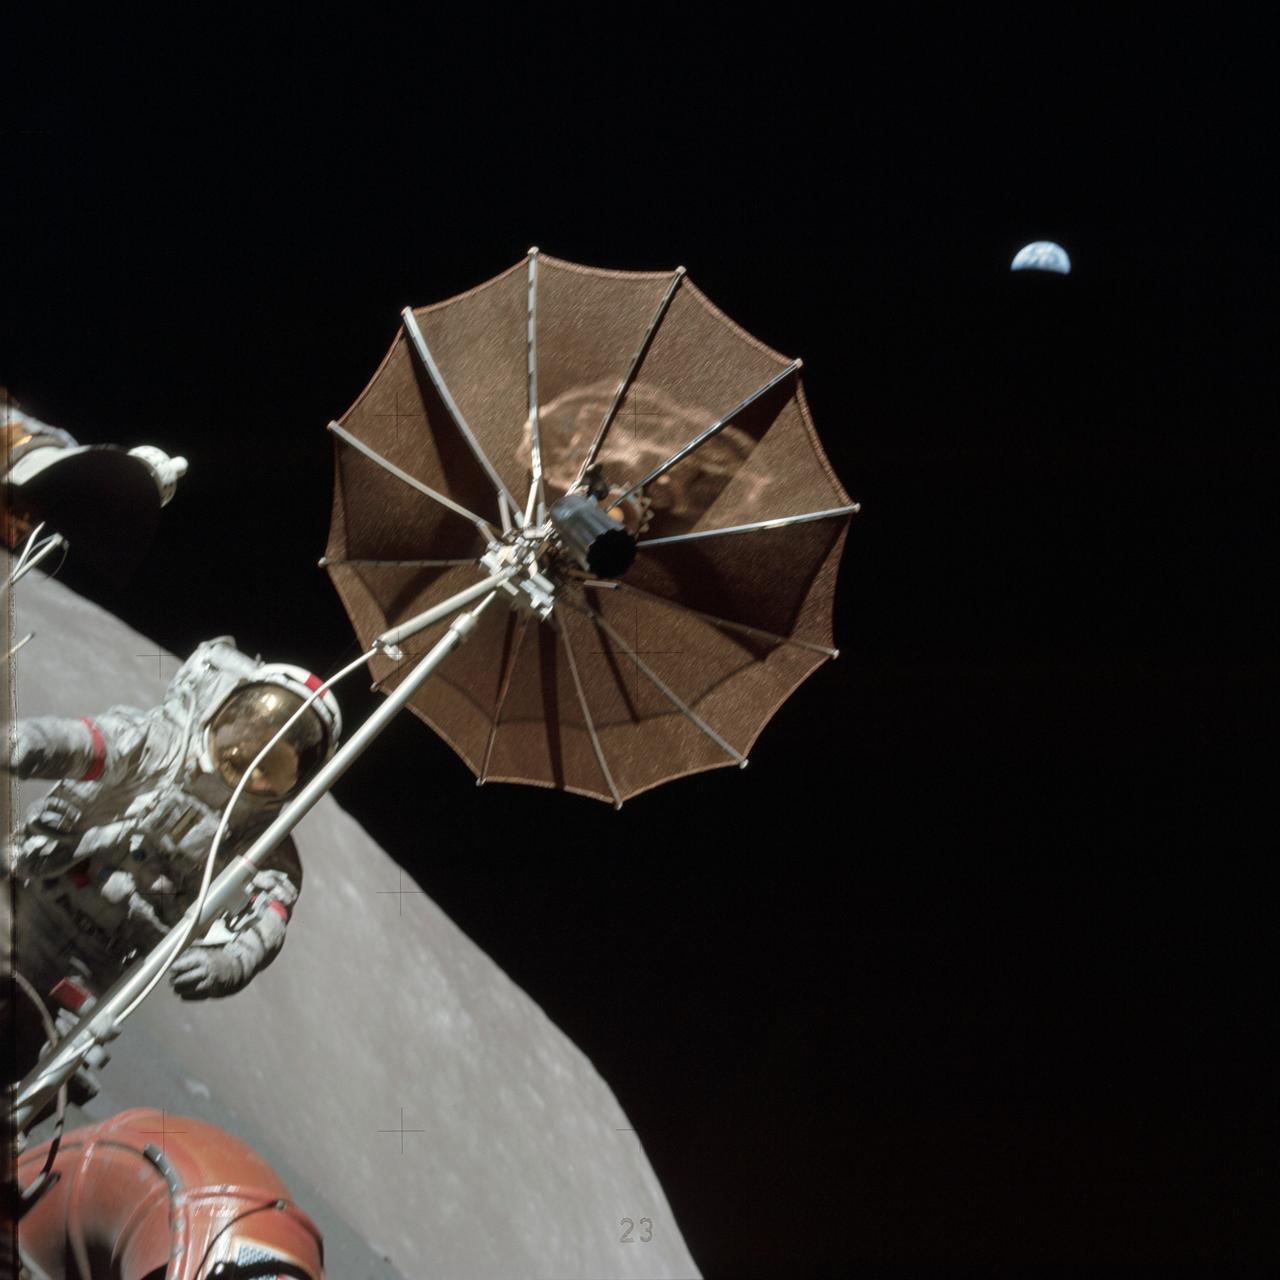
AS8-14-2392 (21-27 Dec. 1968) --- High-oblique view of the moon's surface showing Earth rising above the lunar horizon, looking west-southwest, as photographed from the Apollo 8 spacecraft as it orbited the moon. The center of the picture is located at about 105 degrees east longitude and 13 degrees south latitude. The lunar surface probably has less pronounced color than indicated by this print.

Seasonal changes in Earth surface albedo over a 5-year period are seen in these image summary maps from NASA Terra spacecraft.
The Earth Surface Mineral Dust Source Investigation (EMIT) mission instrument (right) sits in the "trunk" that will travel aboard SpaceX's 25th cargo resupply mission – planned for June 7, 2022 – to the International Space Station. This image was taken May 3, 2022, at SpaceX's Dragonland facility in Florida. Developed at NASA's Jet Propulsion Laboratory in Southern California and launching from Kennedy Space Center in Florida, EMIT will map the world's mineral-dust sources, gathering information about particle color and composition as it orbits over the planet's dry, sparsely vegetated regions. After being mounted on the space station, EMIT will collect measurements of 10 important surface minerals – hematite, goethite, illite, vermiculite, calcite, dolomite, montmorillonite, kaolinite, chlorite, and gypsum – in arid regions between 50-degree south and north latitudes in Africa, Asia, North and South America, and Australia. The data EMIT collects will help scientists better understand the role of airborne dust particles in heating and cooling Earth's atmosphere on global and regional scales. The white covering will prevent the spread of the heat the instrument generates, keeping it from affecting the space station and nearby instruments. EMIT will be one of two pieces of equipment transported to the space station in the external cargo "trunk" on SpaceX's Falcon 9 rocket. The other (left) is a Battery Charge/Discharge Unit. https://photojournal.jpl.nasa.gov/catalog/PIA25148
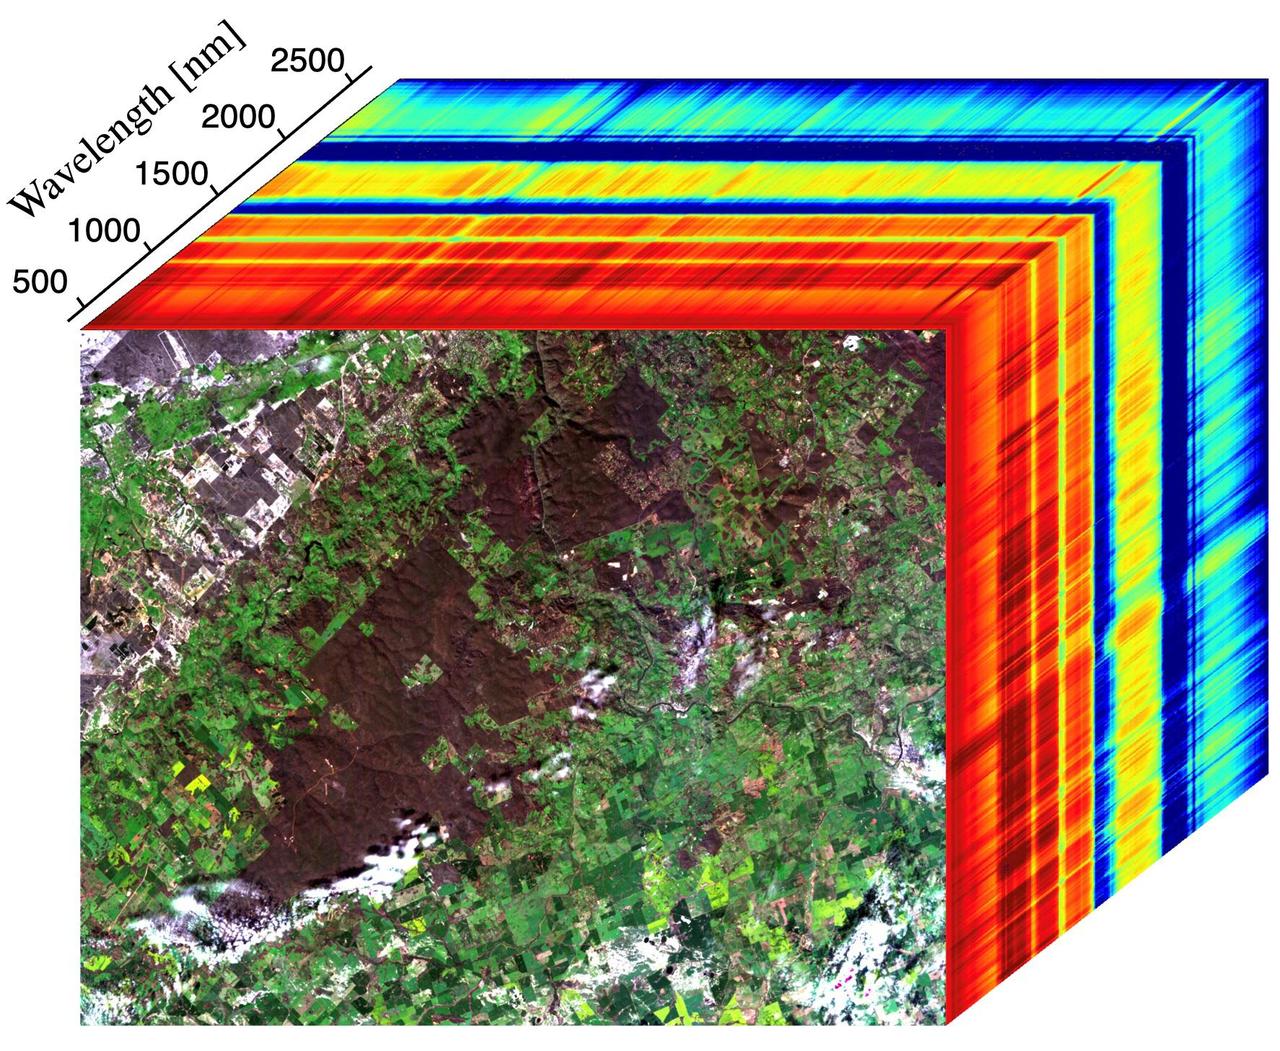
This image shows the first measurements taken by NASA's Earth Surface Mineral Dust Source Investigation (EMIT) from aboard the International Space Station at 7:51 p.m. PDT (10:51 p.m. EDT) on July 27, 2022, as it passed over western Australia. The image at the front of the cube shows a mix of materials in western Australia, including exposed soil (brown), vegetation (dark green), agricultural fields (light green), a small river, and clouds. The rainbow colors extending through the main part of the cube are the wavelengths of light (in nanometers), or spectral fingerprints, from corresponding spots in the front image. The line graph (Figure 1) shows spectral fingerprints for a sample of soil, vegetation, and a river from the image cube. Radiance indicates the amount of each wavelength of light reflected from a substance. Researchers use the combination of radiance and wavelength to determine a substance's spectral fingerprint. Developed by NASA's Jet Propulsion Laboratory in Southern California, EMIT works by measuring the hundreds of wavelengths of light reflected from materials on Earth. Different substances reflect different wavelengths of light, producing a kind of spectral fingerprint that, when collected by an imaging spectrometer and analyzed by researchers, reveal what they are made of. When science operations begin later in August 2022, EMIT's primary mission will be to collect measurements of 10 important surface minerals in regions between 50-degrees south and north latitudes in Africa, Asia, North and South America, and Australia. The minerals include hematite, goethite, illite, vermiculite, calcite, dolomite, montmorillonite, kaolinite, chlorite, and gypsum. The compositional data EMIT collects will help scientists study the role of airborne dust particles in heating and cooling Earth's atmosphere on global and regional scales. Data from EMIT will be delivered to the NASA Land Processes Distributed Active Archive Center (DAAC) for use by other researchers and the public. https://photojournal.jpl.nasa.gov/catalog/PIA24529
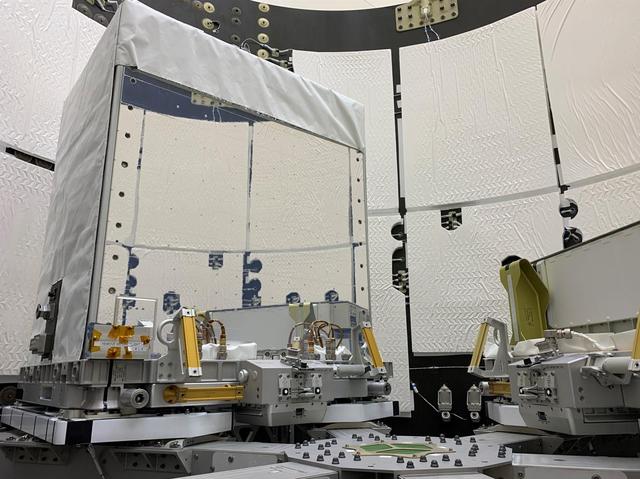
The Earth Surface Mineral Dust Source Investigation (EMIT) mission instrument (left) sits in the "trunk" that will travel aboard SpaceX's 25th cargo resupply mission – planned for June 7, 2022 – to the International Space Station. This image was taken May 3, 2022, at SpaceX's Dragonland facility in Florida. Developed at NASA's Jet Propulsion Laboratory in Southern California and launching from Kennedy Space Center in Florida, EMIT will map the world's mineral-dust sources, gathering information about particle color and composition as it orbits over the planet's dry, sparsely vegetated regions. After being mounted on the space station, EMIT will collect measurements of 10 important surface minerals – hematite, goethite, illite, vermiculite, calcite, dolomite, montmorillonite, kaolinite, chlorite, and gypsum – in arid regions between 50-degree south and north latitudes in Africa, Asia, North and South America, and Australia. The data EMIT collects will help scientists better understand the role of airborne dust particles in heating and cooling Earth's atmosphere on global and regional scales. The mirror-like side radiator panels are designed to keep the instrument's interior electronics and optics at a low enough temperature to work optimally. The white covering will prevent the spread of the heat the instrument generates, keeping it from affecting the space station and nearby instruments. EMIT will be one of two pieces of equipment transported to the space station in the external cargo "trunk" on SpaceX's Falcon 9 rocket. The other (left) is a Battery Charge/Discharge Unit. https://photojournal.jpl.nasa.gov/catalog/PIA25149
This visualization shows water features on New York's Long Island – shown as bright pink splotches nestled within the landscape. Purple, yellow, green, and dark blue shades represent different land elevations, while the surrounding ocean is a lighter blue. The data was collected on Jan. 21, 2023, by an instrument on the Surface Water and Ocean Topography (SWOT) satellite called the Ka-band Radar Interferometer (KaRIn). KaRIn is the scientific heart of the SWOT mission. It's a radar instrument with one antenna at each end of a boom that’s 33 feet (10 meters) long. This enables KaRIn to look off to either side of a center line directly below the satellite as the instrument bounces microwave signals off of Earth's surface. The returning radar signals arrive at each antenna slightly out of step, or phase, from one another. When these signals are combined with other information about the antennas and the satellite's altitude, scientists will be able to map the height of water on Earth's surface with never-before-seen clarity. This initial inland image is a tantalizing indication of how SWOT can measure details of smaller lakes, ponds, and rivers in ways that satellites could not before. Such data will be used to produce an extraordinary accounting of the freshwater on Earth's surface in ways useful to researchers, policymakers, and water resource managers. Led by NASA and the French space agency Centre National d'Études Spatiales (CNES), SWOT will measure the height of water on over 90% of Earth's surface, providing a high-definition survey of our planet's water for the first time. The satellite's measurements of freshwater bodies and the ocean will provide insights into how the ocean influences climate change; how a warming world affects lakes, rivers, and reservoirs; and how communities can better prepare for floods and other disasters. Launched on Dec. 16, 2022, from Vandenberg Space Force Base in central California, SWOT is now in a six-month period called commissioning, calibration and validation. This is when engineers on the mission check out the satellite's systems and science instruments to ensure data accuracy before the start of science operations in July. https://photojournal.jpl.nasa.gov/catalog/PIA25774
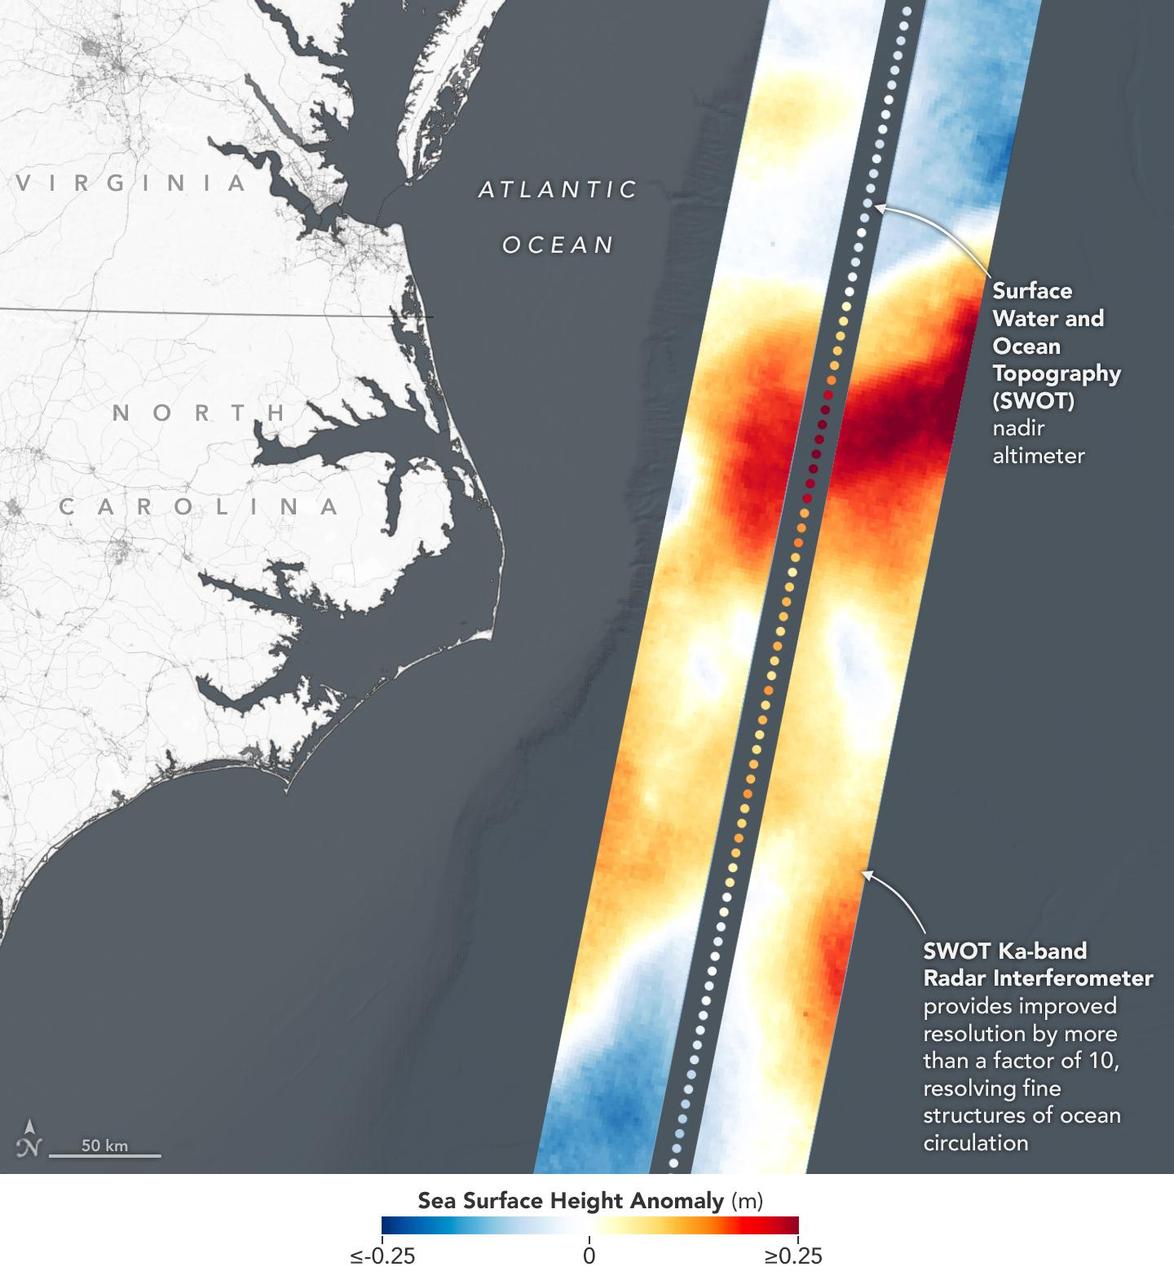
This visualization shows sea surface height measurements in the Gulf Stream off the coast of North Carolina and Virginia. The data was collected on Jan. 21, 2023, by an instrument on the Surface Water and Ocean Topography (SWOT) satellite called the Ka-band Radar Interferometer (KaRIn). KaRIn's two antennas acquired data that was mapped as two wide, colored strips spanning a total of 75 miles (120 kilometers) across. In the visualization, red and orange areas represent sea levels that are higher than the global average, while shades of blue represent sea levels that are lower than average. The spatial resolution of SWOT ocean measurements is 10 times greater than the composite of sea surface height data gathered over the same area by seven other satellites that same day. KaRIn is the scientific heart of the SWOT mission. It's a radar instrument with one antenna at each end of a boom that's 33 feet (10 meters) long. This enables KaRIn to look off to either side of a center line directly below the satellite as the instrument bounces microwave signals off of Earth's surface. The returning radar signals arrive at each antenna slightly out of step, or phase, from one another. When these signals are combined with other information about the antennas and the satellite's altitude, scientists will be able to map the height of water on Earth's surface with never-before-seen clarity. Led by NASA and the French space agency Centre National d'Études Spatiales (CNES), SWOT will measure the height of water on over 90% of Earth's surface, providing a high-definition survey of our planet's water for the first time. The satellite's measurements of freshwater bodies and the ocean will provide insights into how the ocean influences climate change; how a warming world affects lakes, rivers, and reservoirs; and how communities can better prepare for disasters like floods. Launched on Dec. 16, 2022, from Vandenberg Space Force Base in central California, SWOT is now in a six-month period called commissioning, calibration and validation. This is when engineers on the mission check out the satellite's systems and science instruments to ensure data accuracy before the start of science operations in July. https://photojournal.jpl.nasa.gov/catalog/PIA25772
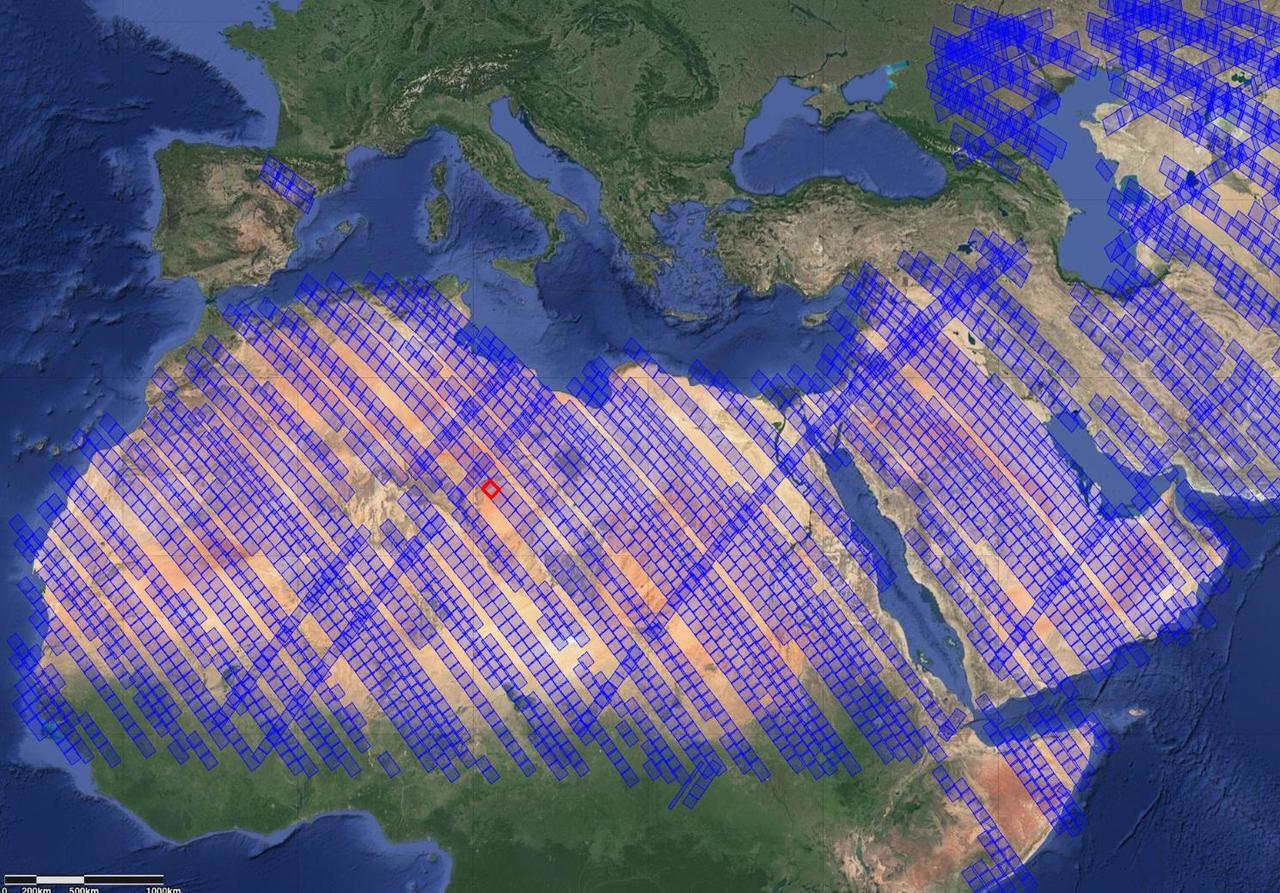
This image shows locations in parts of North Africa, Europe, the Middle East, and Central Asia observed by NASA's Earth Surface Mineral Dust Source Investigation (EMIT). Each blue box is a "scene" the instrument, which is aboard the International Space Station, has captured. The red box indicates where the instrument recently gathered data on three minerals in a location in southwest Libya, in the Sahara Desert. Installed on the space station in July 2022, EMIT orbits Earth about once every 90 minutes to map the world's mineral-dust sources, gathering information about surface composition as the instrument completes about 16 orbits per day. Over the course of its 12-month mission, EMIT will collect measurements of 10 important surface minerals – kaolinite, hematite, goethite, illite, vermiculite, calcite, dolomite, montmorillonite, chlorite, and gypsum – in arid regions between 50-degree south and north latitudes in Africa, Asia, North and South America, and Australia. The data EMIT collects will help scientists better understand the role of airborne dust particles in heating and cooling Earth's atmosphere on global and regional scales. https://photojournal.jpl.nasa.gov/catalog/PIA25429
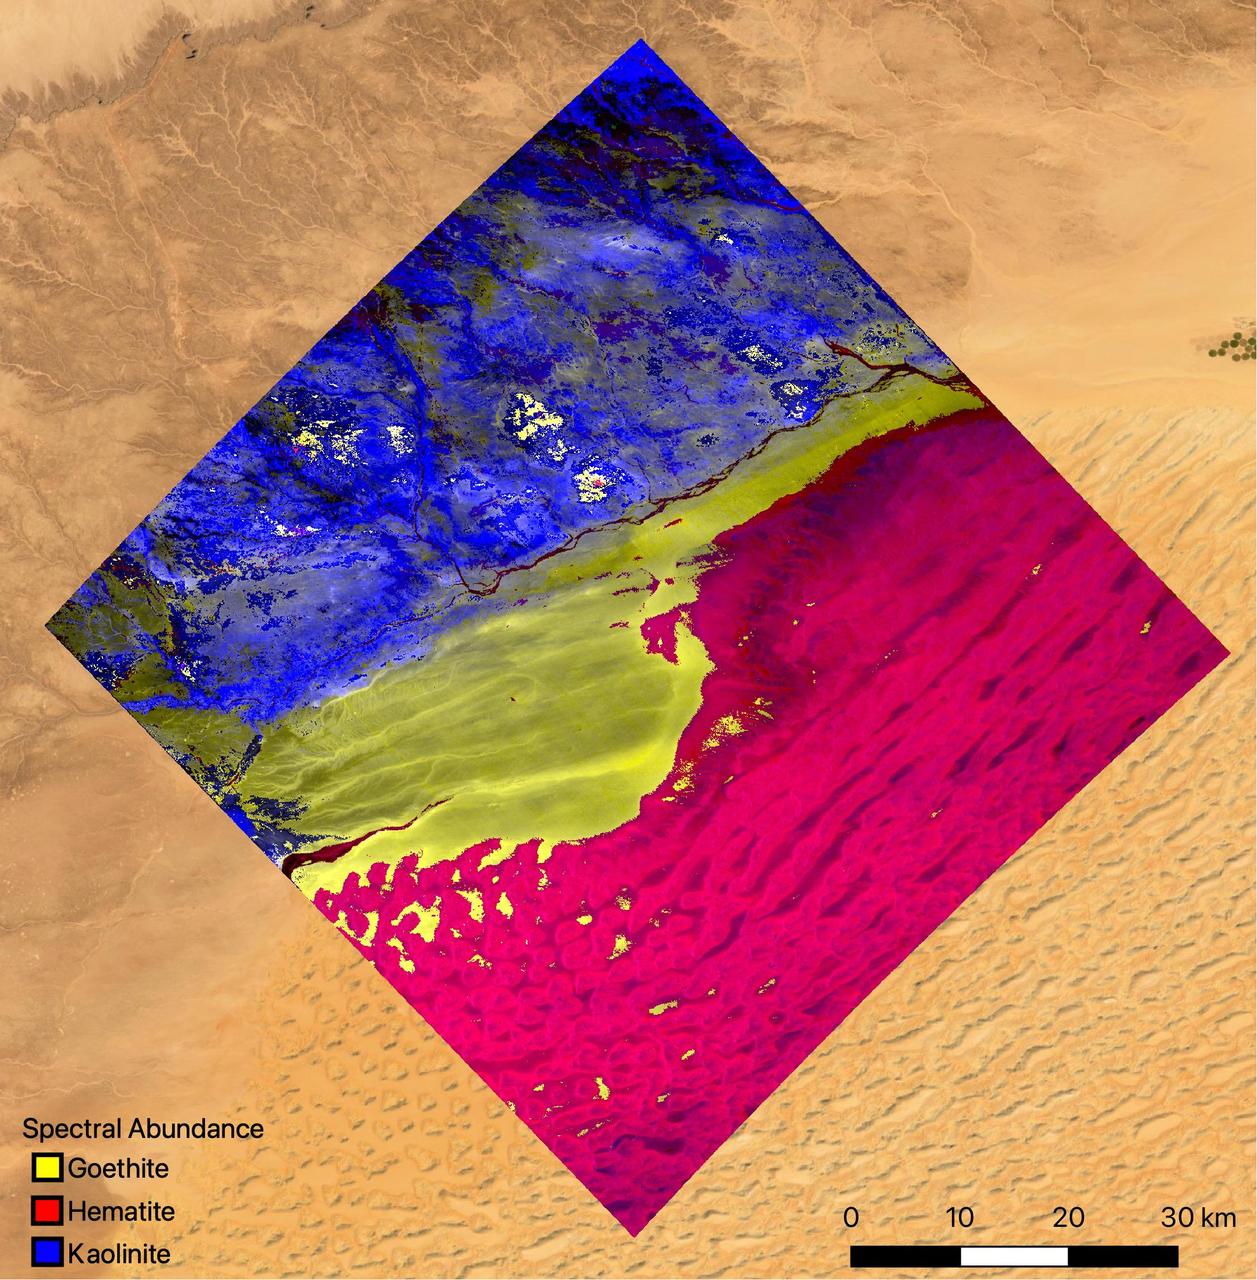
The mineral map shows an area of southwestern Libya in the Sahara Desert observed by NASA's Earth Surface Mineral Dust Source Investigation (EMIT) mission as it maps the world's mineral dust sources, gathering information about surface composition as the instrument, designed at NASA's Jet Propulsion Laboratory in Southern California, orbits aboard the International Space Station. The instrument works by measuring reflected solar energy from Earth across hundreds of wavelengths from the visible to the infrared range of the spectrum. The intensity of the reflected light varies by wavelength based on the material. Scientists are using these patterns, called spectral fingerprints, to identify surface minerals and pinpoint their locations on a map. The map is among the first produced by scientists with EMIT data. Analysis of the patterns indicate that the surface contains kaolinite, a light-colored clay mineral, and goethite and hematite, two varieties of iron oxide, which is darker. When dust from the kaolinite-dominated areas is lofted into the atmosphere, the particles tend to scatter sunlight and reflect it back to space, cooling the air. The opposite effect occurs with airborne particles of iron oxide, which tend to absorb heat and warm the surrounding air. Over the course of its 12-month mission, EMIT will collect measurements of 10 important surface minerals – kaolinite, hematite, goethite, illite, vermiculite, calcite, dolomite, montmorillonite, chlorite, and gypsum – in arid regions between 50-degree south and north latitudes in Africa, Asia, North and South America, and Australia. The data EMIT collects will help scientists better understand the role of airborne dust particles in heating and cooling Earth's atmosphere on global and regional scales. EMIT was developed at NASA's Jet Propulsion Laboratory, which is managed for the agency by Caltech in Pasadena, California. It launched to the space station in July 2022. https://photojournal.jpl.nasa.gov/catalog/PIA25424
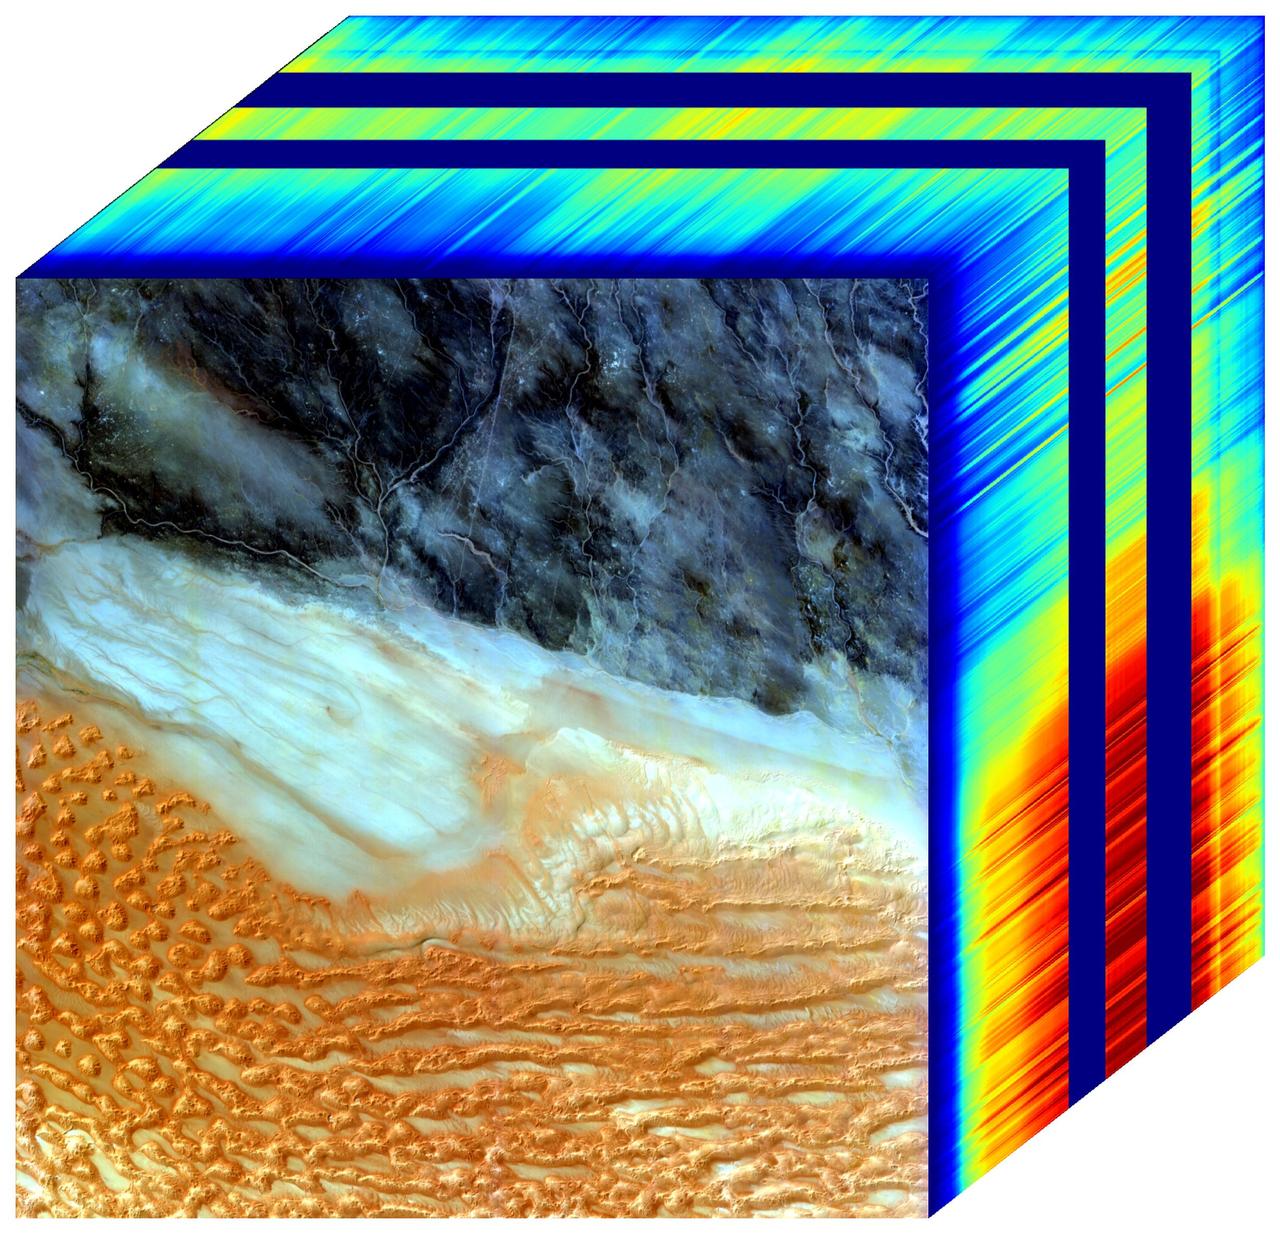
The front panel of this image cube features the true-color view of an area in southwest Libya observed by NASA's Earth Surface Mineral Dust Source Investigation (EMIT) imaging spectrometer, which orbits the planet aboard the International Space Station. The side panels depict the spectral fingerprint for every point in the image, which shows an area about 500 miles (800 kilometers) south of Tripoli. The instrument works by measuring reflected solar energy from Earth across hundreds of wavelengths, from the visible to the infrared range of the spectrum. The intensity of the reflected light varies by wavelength based on the material. Scientists use these patterns, called spectral fingerprints, to identify surface minerals and pinpoint their locations on a map. The cube is among the first created by scientists with EMIT data. Analysis of the patterns indicated that the surface contains kaolinite, a light-colored clay mineral, and goethite and hematite, two varieties of iron oxide, which is darker. When dust from the kaolinite-dominated areas is lofted into the atmosphere, the particles tend to scatter sunlight and reflect it back to space, cooling the air. The opposite effect occurs with airborne particles of iron oxide, which tend to absorb heat and warm the surrounding air. Over the course of its 12-month mission, EMIT will collect measurements of 10 important surface minerals – kaolinite, hematite, goethite, illite, vermiculite, calcite, dolomite, montmorillonite, chlorite, and gypsum – in arid regions between 50-degree south and north latitudes in Africa, Asia, North and South America, and Australia. The data EMIT collects will help scientists better understand the role of airborne dust particles in heating and cooling Earth's atmosphere on global and regional scales. https://photojournal.jpl.nasa.gov/catalog/PIA25430
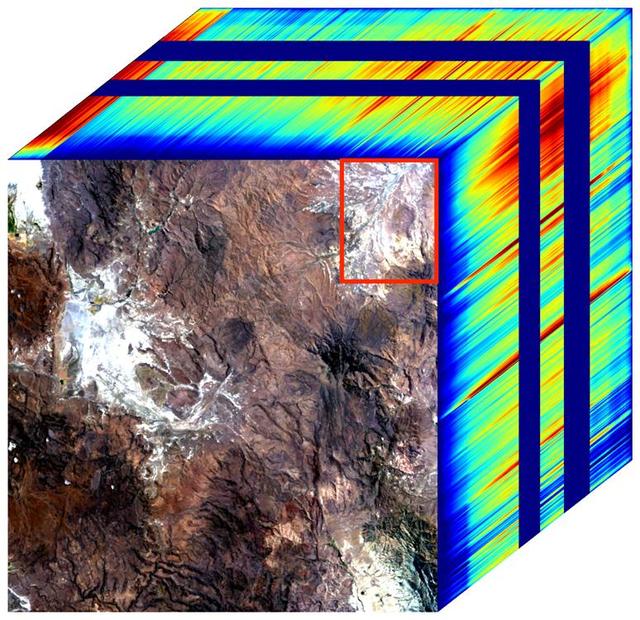
The front panel of this image cube shows the true-color view of an area in northwest Nevada observed by NASA's Earth Surface Mineral Dust Source Investigation (EMIT) imaging spectrometer. The side panels depict the spectral fingerprint for every point in the image, which shows an area about 130 miles (209 kilometers) northeast of Lake Tahoe. The instrument works by measuring reflected solar energy from Earth across hundreds of wavelengths from the visible to the infrared range of the spectrum. The intensity of the reflected light varies by wavelength based on the material. Scientists are using these patterns, called spectral fingerprints, to identify surface minerals and pinpoint their locations on a map. The cube was among the first created by EMIT scientists as they confirmed that the instrument was collecting data accurately before the start of science operations. Analysis of the patterns indicate areas dominated by kaolinite, a light-colored clay mineral. When dust from the kaolinite-dominated areas is lofted into the atmosphere, the particles tend to scatter sunlight and reflect it back to space, cooling the air. Over the course of its 12-month mission, EMIT will collect measurements of 10 important surface minerals – kaolinite, hematite, goethite, illite, vermiculite, calcite, dolomite, montmorillonite, chlorite, and gypsum – in arid regions between 50-degree south and north latitudes in Africa, Asia, North and South America, and Australia. The data EMIT collects will help scientists better understand the role of airborne dust particles in heating and cooling Earth's atmosphere on global and regional scales. Since EMIT was installed on the International Space Station in late July 2022, the science team has been validating the data it collects against data gathered in 2018 by the Airborne Visible/Infrared Imaging Spectrometer (AVIRIS). EMIT and AVIRIS were developed at NASA's Jet Propulsion Laboratory, which is managed for the agency by Caltech in Pasadena, California. https://photojournal.jpl.nasa.gov/catalog/PIA25427
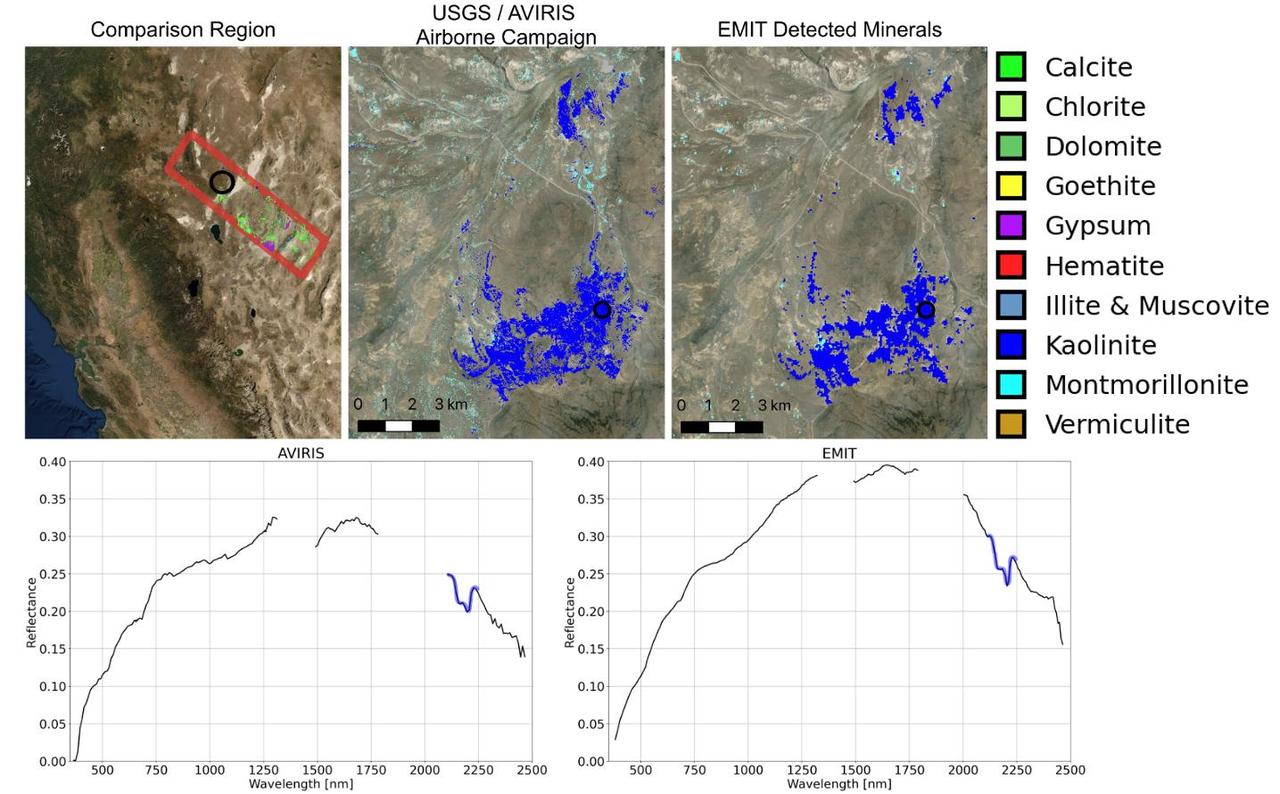
Since NASA's Earth Surface Mineral Dust Source Investigation (EMIT) imaging spectrometer was installed on the International Space Station in late July 2022, the EMIT science team has been validating its data against data gathered in 2018 by NASA's Airborne Visible/Infrared Imaging Spectrometer (AVIRIS). EMIT recently collected data from a mountainous area of Nevada about 130 miles (209 kilometers) northeast of Lake Tahoe. The instrument measures reflected solar energy from Earth across hundreds of wavelengths from the visible to the infrared range of the spectrum. The intensity of the reflected light varies by wavelength based on the material. Scientists use these patterns, called spectral fingerprints, to pinpoint the locations of surface minerals on a map. The top left map shows the region both the EMIT and AVIRIS data sets cover. The center image is a mineral map featuring AVIRIS data. At right is a map generated with EMIT data. The center and right images reveal portions of the landscape dominated by kaolinite, a light-colored clay mineral that scatters sunlight. This comparison, which shows a close match of the data, was one of many that confirmed the accuracy of EMIT's data. The bottom row features an AVIRIS spectral fingerprint, left, beside EMIT data for the same location. The graphs show agreement in the kaolinite fingerprint region, which is marked in blue. Over the course of its 12-month mission, EMIT will collect measurements of 10 important surface minerals – kaolinite, hematite, goethite, illite, vermiculite, calcite, dolomite, montmorillonite, chlorite, and gypsum – in arid regions between 50-degree south and north latitudes in Africa, Asia, North and South America, and Australia. The data EMIT collects will help scientists better understand the role of airborne dust particles in heating and cooling Earth's atmosphere on global and regional scales. https://photojournal.jpl.nasa.gov/catalog/PIA25428

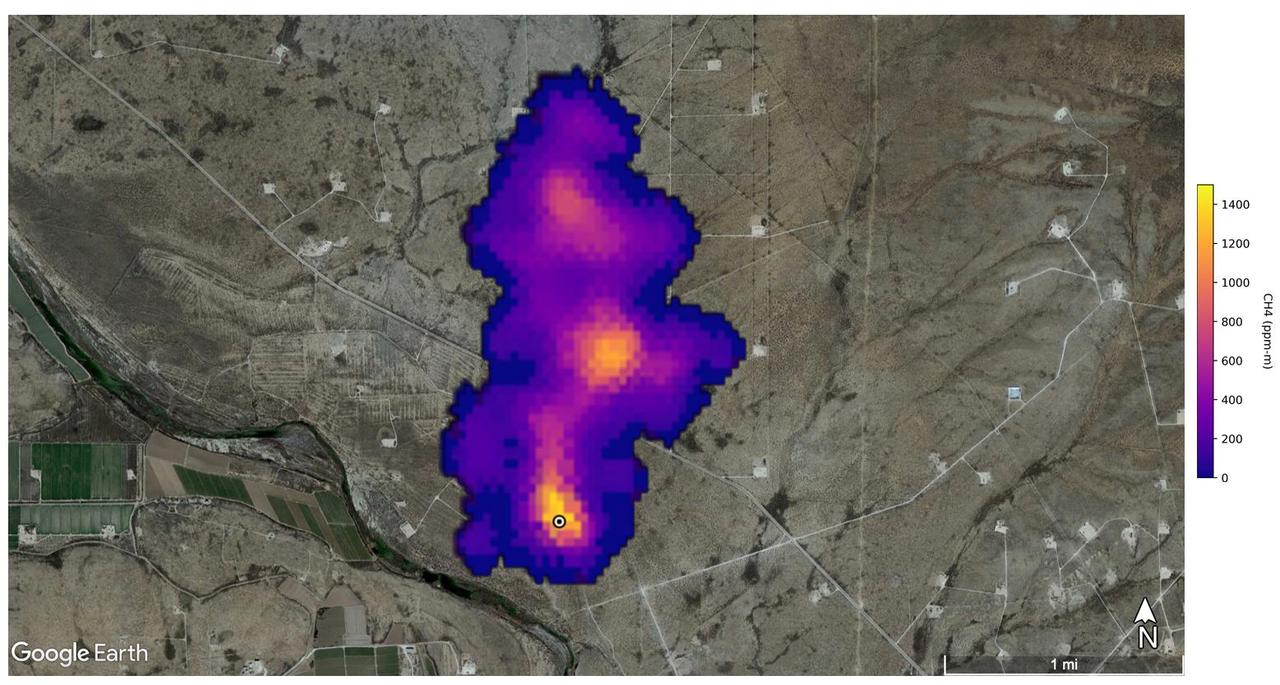
NASA's Earth Surface Mineral Dust Source Investigation (EMIT) detected a cluster of 12 methane plumes on Sept. 1, 2022, in an approximately 150-square-mile (400-square-kilometer) region of southern Uzbekistan. Methane is a potent greenhouse gas about 80 times more effective at trapping heat than carbon dioxide during the time methane spends in the atmosphere, which is typically about a decade. This an area no NASA airborne imaging spectrometers have covered. Whereas EMIT captured the scene in an instant, an airborne campaign might have taken about 65 hours of flight time to cover the same amount of land. The blue shading covers the area captured by EMIT in one "scene," which is 50 miles by 50 miles (80 kilometers by 80 kilometers). The emissions total about 49,734 pounds (22,559 kilograms) per hour. EMIT uses an imaging spectrometer to detect the unique pattern of reflected and absorbed light – called a spectral fingerprint – from various materials on Earth's surface and in its atmosphere. Perched on the International Space Station, EMIT was originally intended to map the prevalence of minerals in Earth's arid regions, such as the deserts of Africa and Australia. Scientists verified that EMIT could also detect methane and carbon dioxide when they were checking the accuracy of the image spectrometer's mineral data. EMIT was selected from the Earth Venture Instrument-4 solicitation under the Earth Science Division of NASA Science Mission Directorate and was developed at NASA's Jet Propulsion Laboratory, which is managed for the agency by Caltech in Pasadena, California. It launched aboard a SpaceX Dragon resupply spacecraft from NASA's Kennedy Space Center in Florida on July 14, 2022. The instrument's data will be delivered to the NASA Land Processes Distributed Active Archive Center (DAAC) for use by other researchers and the public. https://photojournal.jpl.nasa.gov/catalog/PIA26113
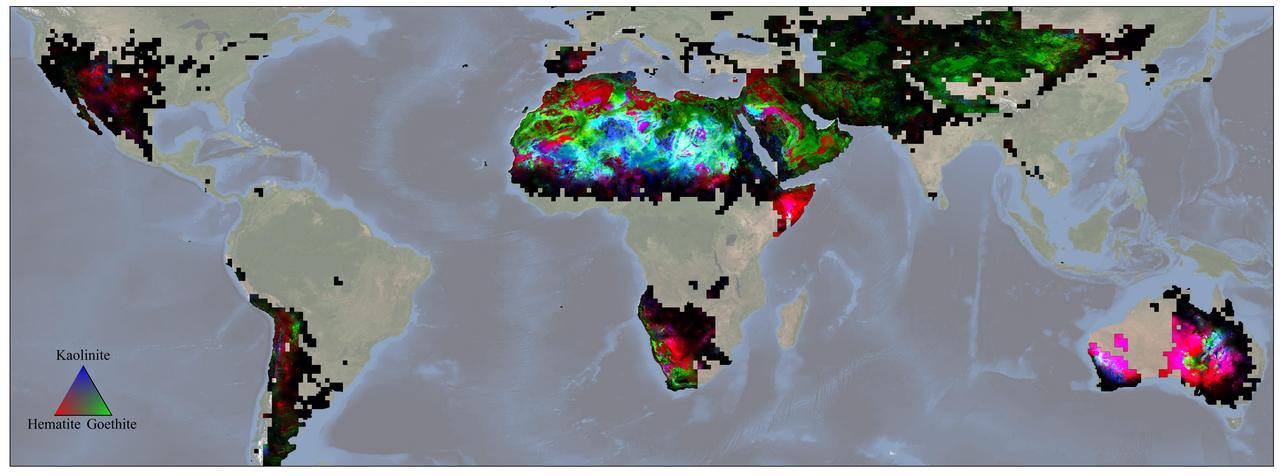
Scientists on NASA's EMIT mission used data from its powerful imaging spectrometer, developed at the agency's Jet Propulsion Laboratory, to map the presence and geographic distributions of three key minerals in the planet's arid regions. The three substances – hematite, goethite, and kaolinite – are thought to have an effect on atmospheric and surface temperatures when wind lofts them into the air, forming dust storms. The data, collected over the course of a year ending in November 2023, was used to create this map. Red represents hematite, green goethite, and blue kaolinite. Magenta indicates regions with hematite and kaolinite, while yellow shows areas that hematite and goethite, and cyan signifies locations with goethite and kaolinite. White indicates the presence of all three, and black signifies portions of the study area that contain none of them. In total, EMIT – short for the Earth Surface Mineral Dust Source Investigation – is mapping 10 minerals as part of its prime mission. In addition to hematite, goethite, and kaolinite, it is also monitoring illite, vermiculite, calcite, dolomite, montmorillonite, chlorite, and gypsum. Launched to the International Space Station in July 2022, EMIT was developed in response to the need for more detailed surface mineral composition information to advance climate science. Researchers know that darker, iron oxide-rich substances, such as hematite and goethite, absorb the Sun's energy and warm the surrounding air, while non-iron-based, whiter substances like kaolinite reflect light and heat, cooling the air. Whether those effects have a net warming or cooling impact, however, has remained uncertain. The missing piece has been the composition – the color, essentially – of the surface in the places dust typically originates. To date, the mission has captured more than 55,000 "scenes" – 50-by-50-mile (80-by-80-kilometer) images of the surface – in its study area, which includes arid regions within a 6,900-mile-wide (11,000-kilometer-wide) belt between 51.6 degrees north and south latitude. https://photojournal.jpl.nasa.gov/catalog/PIA26116

This animation, created in 2012, shows the increasing clarity and detail of measurements of sea height made by successive satellite altimeters launched by NASA and other agencies over the past four decades, concluding with data at the resolution possible with the Surface Water and Ocean Topography (SWOT) satellite, expected to launch in December 2022. Each new spacecraft has been able to obtain higher-resolution observations than its predecessors. Sea height is key to understanding how much, and how fast, the oceans are rising in a warming climate. The animation starts with Seasat, launched in 1978 as one of the NASA's earliest Earth-observing satellites, then moves to Geosat, a U.S. Navy spacecraft launched in 1985, and on to ERS-1, TOPEX/Poseidon, ERS-2, Jason-1, Envisat, and Jason-2. Since the end of the time period shown in the animation, subsequent satellites have continued measuring sea height, creating an ongoing, decadeslong record. In March 2022, Sentinel-6 Michael Freilich, a joint U.S.-European mission, became the official reference satellite for global sea level measurements. SWOT will be latest spacecraft to observe ocean heights from Earth orbit. Its measurements will provide unprecedented insights into the activity of small-scale currents and their impact on climate change. Researchers believe small-scale currents, which are less than 60 miles (100 kilometers) in size, have a significant influence on the ocean's ability to absorb atmospheric heat and carbon and thereby moderate global temperature change. To measure these currents, SWOT will employ the Ka-band Radar Interferometer (KaRIn), a new technology developed at NASA's Jet Propulsion Laboratory in Southern California that will offer even greater spatial resolution than previous instruments that studied the ocean. SWOT will survey the water in Earth's lakes, rivers, reservoirs, and the ocean. The satellite will cover the planet's surface twice every 21 days and has a prime mission of three years. It was jointly developed by NASA and France's Centre National d'Études Spatiales (CNES), with contributions from the Canadian Space Agency (CSA) and the UK Space Agency. JPL, a division of Caltech in Southern California, manages the U.S. portion of the mission for NASA. Animation available at https://photojournal.jpl.nasa.gov/catalog/PIA25561
A plume of methane – a potent greenhouse gas about 80 times more effective at trapping heat in the atmosphere than carbon dioxide – is detected flowing from an area southeast of Carlsbad, New Mexico, in an image that uses data from NASA's Earth Surface Mineral Dust Source Investigation (EMIT) mission. The 2-mile (3.3-kilometer) long plume originates in an area known as the Permian Basin, which spans parts of southeastern New Mexico and western Texas and is one of the largest oilfields in the world. EMIT uses an imaging spectrometer to detect the unique pattern of reflected and absorbed light – called a spectral fingerprint – from various materials on Earth's surface and in its atmosphere. Perched on the International Space Station, EMIT was originally intended to map the prevalence of minerals in Earth's arid regions, such as the deserts of Africa and Australia. Scientists verified that EMIT could also detect methane and carbon dioxide when they were checking the accuracy of the image spectrometer's mineral data. The data for these images was collected by EMIT in August 2022. Scientists estimate flow rates of 20.2 tons (18.3 metric tons) per hour at the Permian site, 55.6 tons (50.4 metric tons) per hour in total for the Turkmenistan sources, and 9.4 tons (8.5 metric tons) per hour at the Iran site. While quite large, these emission rates are broadly consistent with previous studies of locations like the Permian Basin, as well as emission source types like landfills. The Turkmenistan example has a similar magnitude to the 2015 Aliso Canyon Blowout. https://photojournal.jpl.nasa.gov/catalog/PIA25592

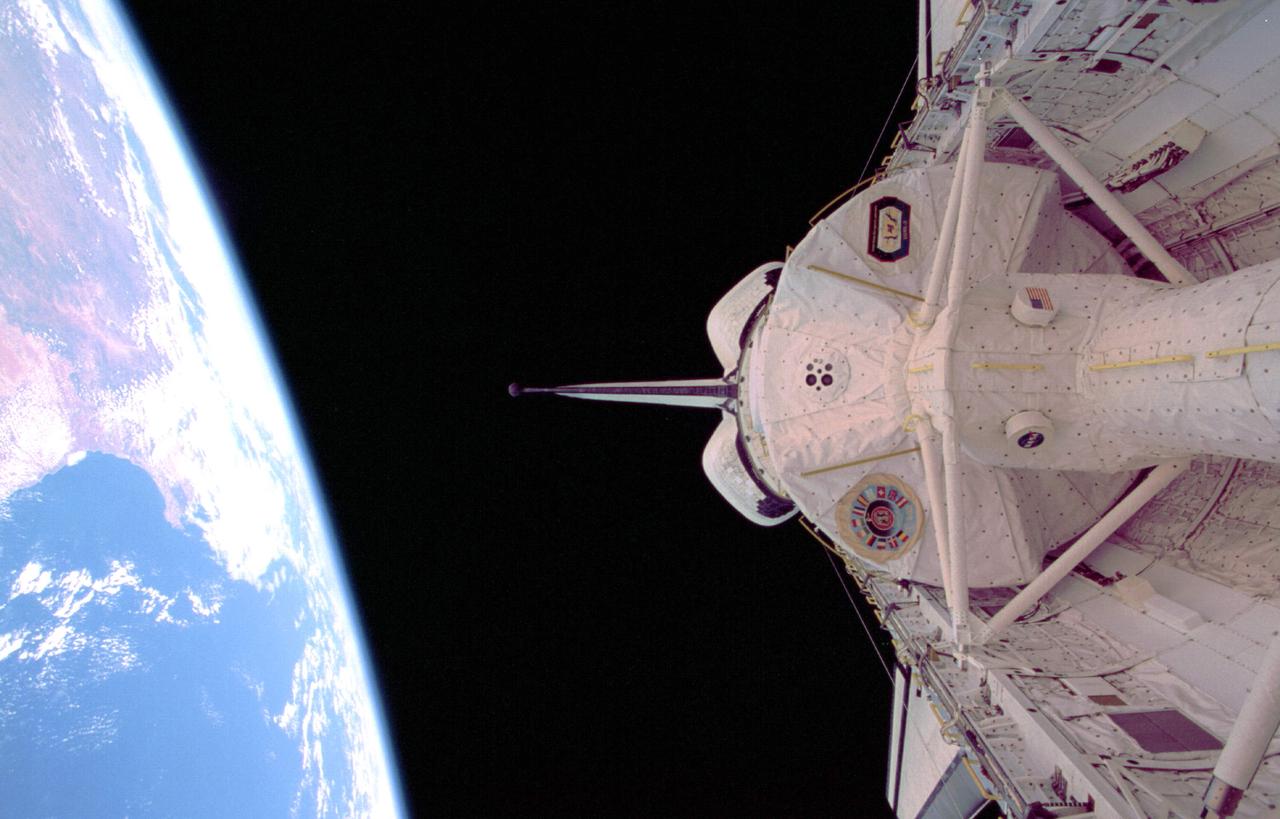
The European Retrievable Carrier 1L (EURECA-1L) spacecraft, with solar array panels extended, drifts above the Earth after deployment from the payload bay of Atlantis, Orbiter Vehicle (OV) 104, during STS-46. EURECA's onboard propulsion unit will boost it to an operational altitude of 270 nautical miles.

The mighty Yukon River and nearby lakes appear in red in this image produced using data recorded on June 18, 2023, by the international Surface Water and Ocean Topography (SWOT) satellite as it passed over Alaska. The satellite measures the height of nearly all the water on Earth's surface, providing one of the most detailed, comprehensive views yet of the planet's ocean and fresh water. The mission is a collaboration between NASA and the French space agency, CNES (Centre National d'Études Spatiales). SWOT will address some of the most pressing climate change questions of our time, offering insights into areas including how a warming world is accelerating Earth's water cycle, leading to more volatile precipitation patterns. SWOT will also help researchers better understand how climate change affects water storage in lakes, rivers, and reservoirs, and how communities can better manage water resources and prepare for floods and other disasters. SWOT passed over the Yukon River and recorded this data during a period called calibration and validation, when the mission confirms the accuracy of its data. Calibration involved ensuring SWOT's software and hardware – including its main scientific instrument, the Ka-band Radar Interferometer (KaRIn) and its antenna – operate as designed. During validation activities, dozens of research teams headed into the field to measure water levels and the slope of rivers, including the Yukon. Mission scientists then compared field measurements to the data taken by the satellite to ensure SWOT's accuracy. In mid-June, the team of freshwater researchers tasked with gathering data on the Yukon drifted down the waterway around midnight – the same time as SWOT passed overhead, collecting its own data on the river. Launched on Dec. 16, 2022, from Vandenberg Space Force Base in central California, SWOT is now in its operations phase, collecting data that will be used for research and other purposes. https://photojournal.jpl.nasa.gov/catalog/PIA25780
STS053-105-002 (2-9 Dec. 1992) --- A crew member onboard the space shuttle Discovery used a 70mm camera to capture this scene of a full Moon backdropped against the blackness of space. Part of Discovery's aft cargo bay and clouds over an ocean complete the scene.
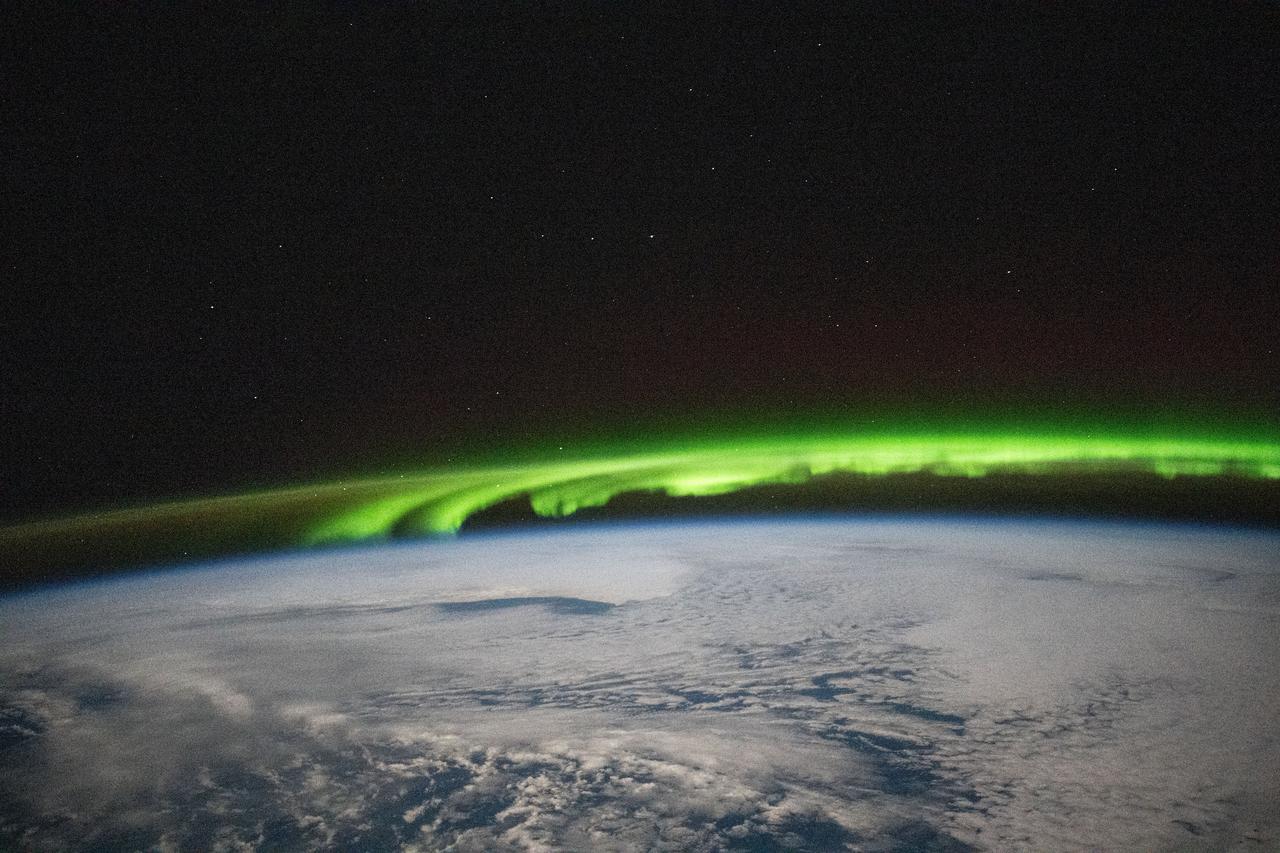
iss072e188141 (Nov. 15, 2024) --- A bright green aurora borealis streams above Earth's surface as the International Space Station orbited 269 miles above a cloudy North Pacific Ocean south of Alaska's Aleutian Islands.

iss074e0494675 (April 21, 2026) --- The Sun begins illuminating Earth’s surface just after an orbital sunrise in this photograph taken at approximately 6:17 a.m. local time from the International Space Station as it orbited 264 miles above southern France. Credit: NASA
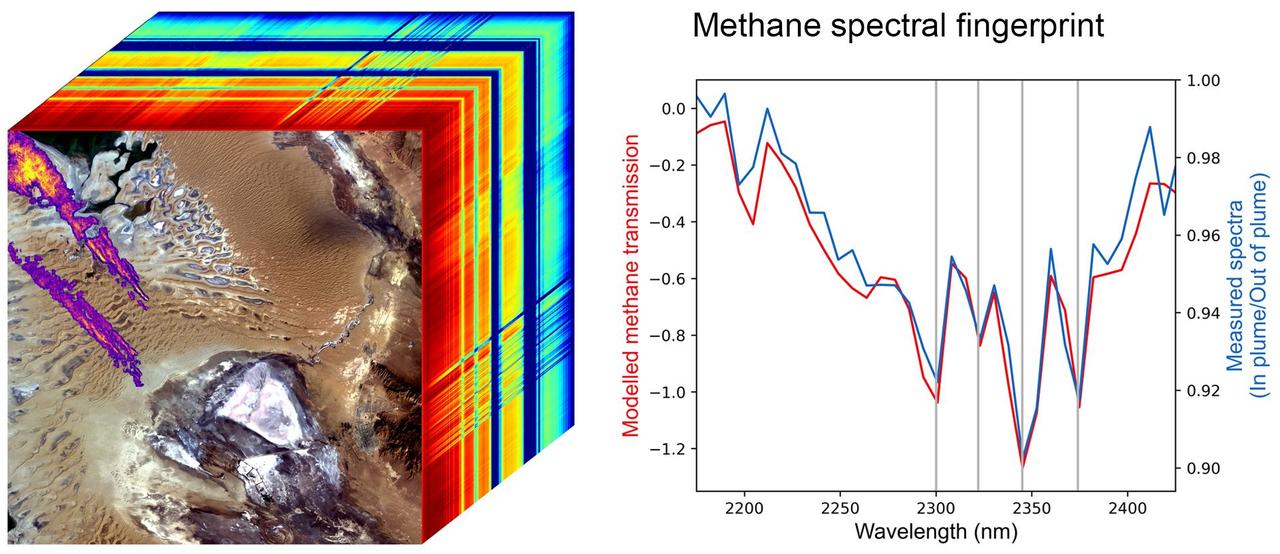
Produced with data from NASA's Earth Surface Mineral Dust Source Investigation (EMIT) mission, this image uses two different ways of displaying methane's unique pattern of absorbed infrared light – called a spectral fingerprint. This potent greenhouse gas is estimated to be 80 times more effective at trapping heat in the atmosphere than carbon dioxide. EMIT uses an imaging spectrometer to detect the spectral fingerprints of various materials on Earth's surface and in its atmosphere. Installed on the International Space Station in July 2022, EMIT was originally intended to map the prevalence of minerals in Earth's arid regions, such as the deserts of Africa, Australia, and the Americas. Scientists verified that EMIT could also detect the spectral fingerprints of methane and carbon dioxide exceptionally well when they were checking the accuracy of the image spectrometer's mineral data. The left panel shows an EMIT data cube that spans an area of Turkmenistan roughly 2,500 square miles (6,400 square kilometers). The rainbow colors extending through the data cube represent the spectral fingerprints from each location within the scene at the front of the cube. The purple, orange, and yellow streaks shown on the satellite image represent multiple methane plumes; the colors correspond to differing concentrations of methane. The line graph on the right displays the methane spectral fingerprint measured by EMIT (blue line). The red line displays the expected spectral fingerprint for methane calculated using an atmospheric simulation. The data for this image was collected by EMIT in August 2022. https://photojournal.jpl.nasa.gov/catalog/PIA25593

AS17-134-20466 (7-19 Dec. 1972) --- A close-up view of the U.S. flag deployed on the moon at the Taurus-Littrow landing site by the crewmen of the Apollo 17 lunar landing mission. The crescent Earth can be seen in the far distant background above the flag. The lunar feature in the near background is South Massif. While astronauts Eugene A. Cernan and Harrison H. Schmitt descended in the Lunar Module "Challenger" to explore the lunar surface, astronaut Ronald E. Evans remained with the Apollo 17 Command and Service Modules in lunar orbit.
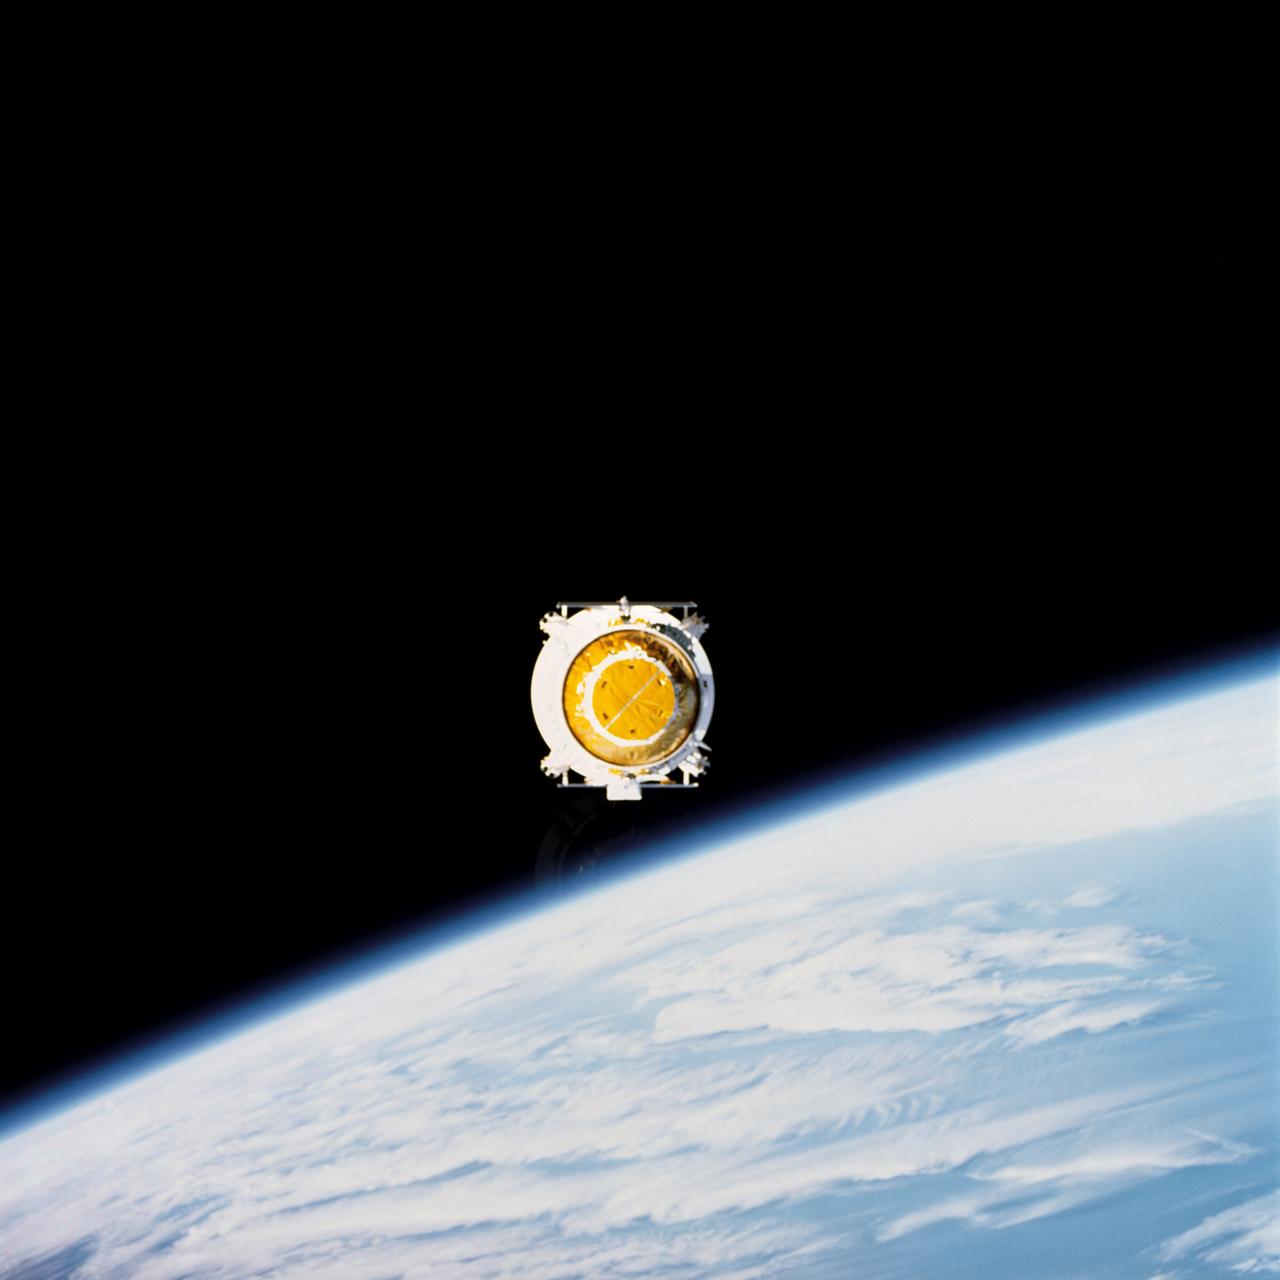
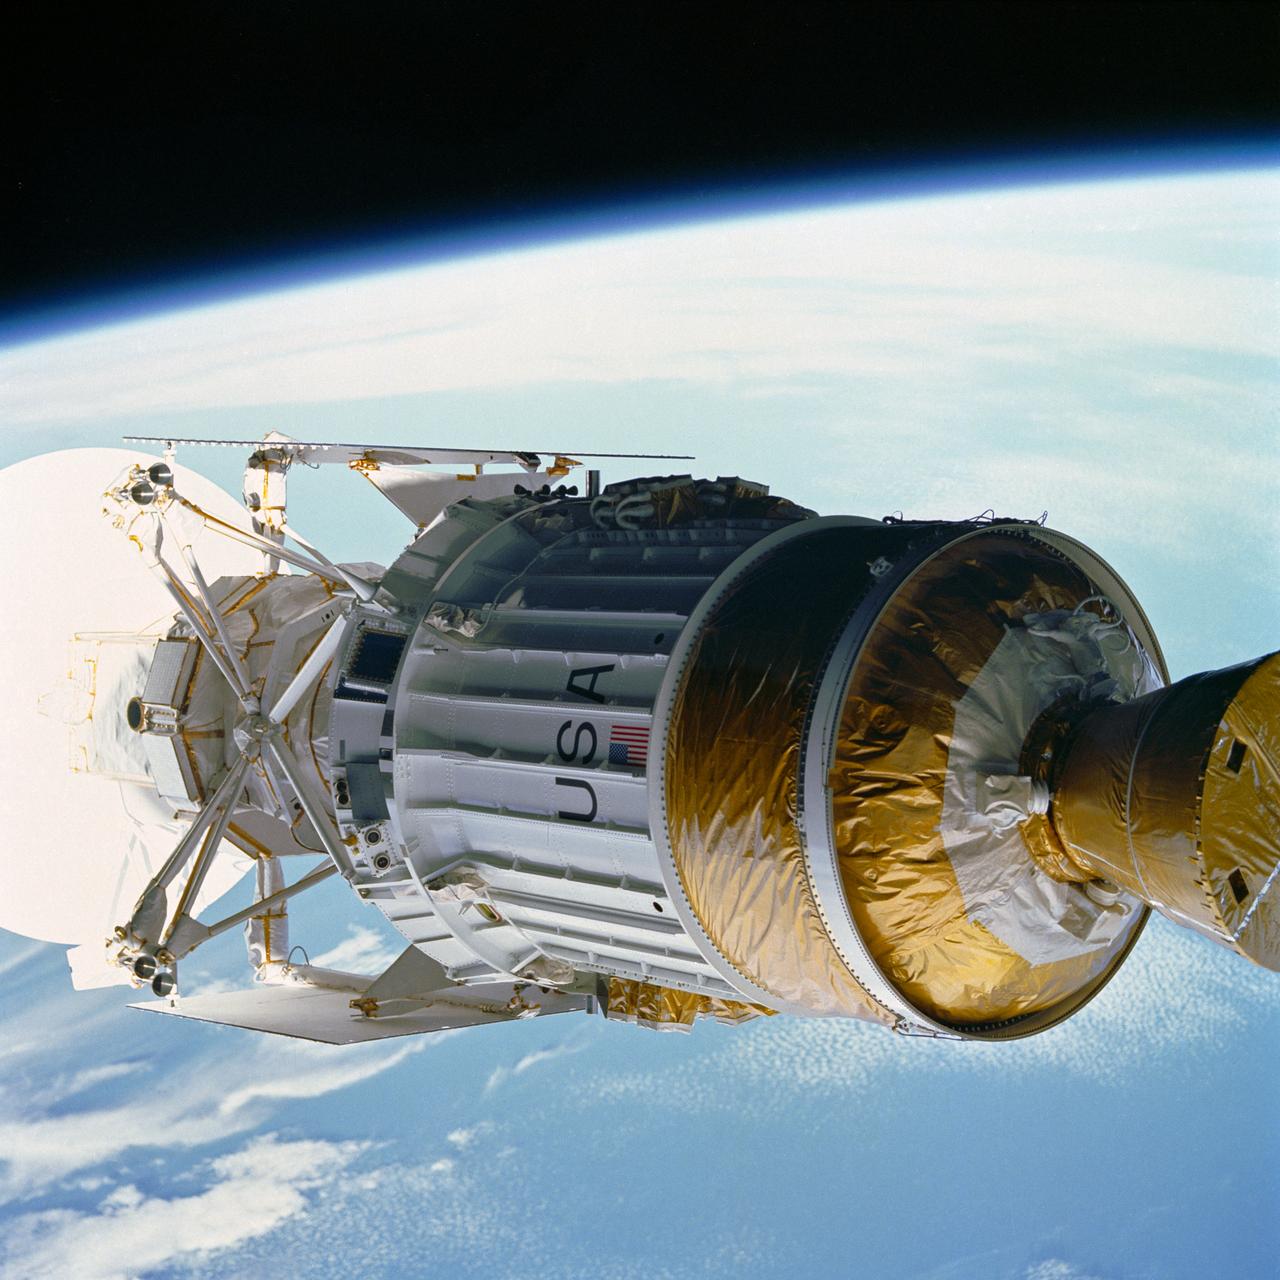
STS054-71-087 (13 Jan 1993) --- The Tracking and Data Relay Satellite (TDRS) is backdropped against the blackness of space, minutes after its release from the Space Shuttle Endeavour. Onboard NASA's newest Shuttle for the six-day mission are astronauts John H. Casper, mission commander; Donald R. McMonagle, pilot; and Mario Runco Jr., Gregory J. Harbaugh and Susan J. Helms, mission specialists. The photograph was taken with a 70mm camera.
STS054-71-077 (13 Jan 1993) --- The Tracking and Data Relay Satellite (TDRS) quickly moves away from the Space Shuttle Endeavour following deployment on the first day of the six-day mission. Onboard NASA's newest Shuttle for the six-day mission are astronauts John H. Casper, mission commander; Donald R. McMonagle, pilot; and Mario Runco Jr., Gregory J. Harbaugh and Susan J. Helms, mission specialists. The photograph was taken with a 70mm camera.

This image from NASA Mars rover Curiosity provides a comparison for how big the moons of Mars appear to be, as seen from the surface of Mars, in relation to the size that Earth moon appears to be when seen from the surface of Earth.
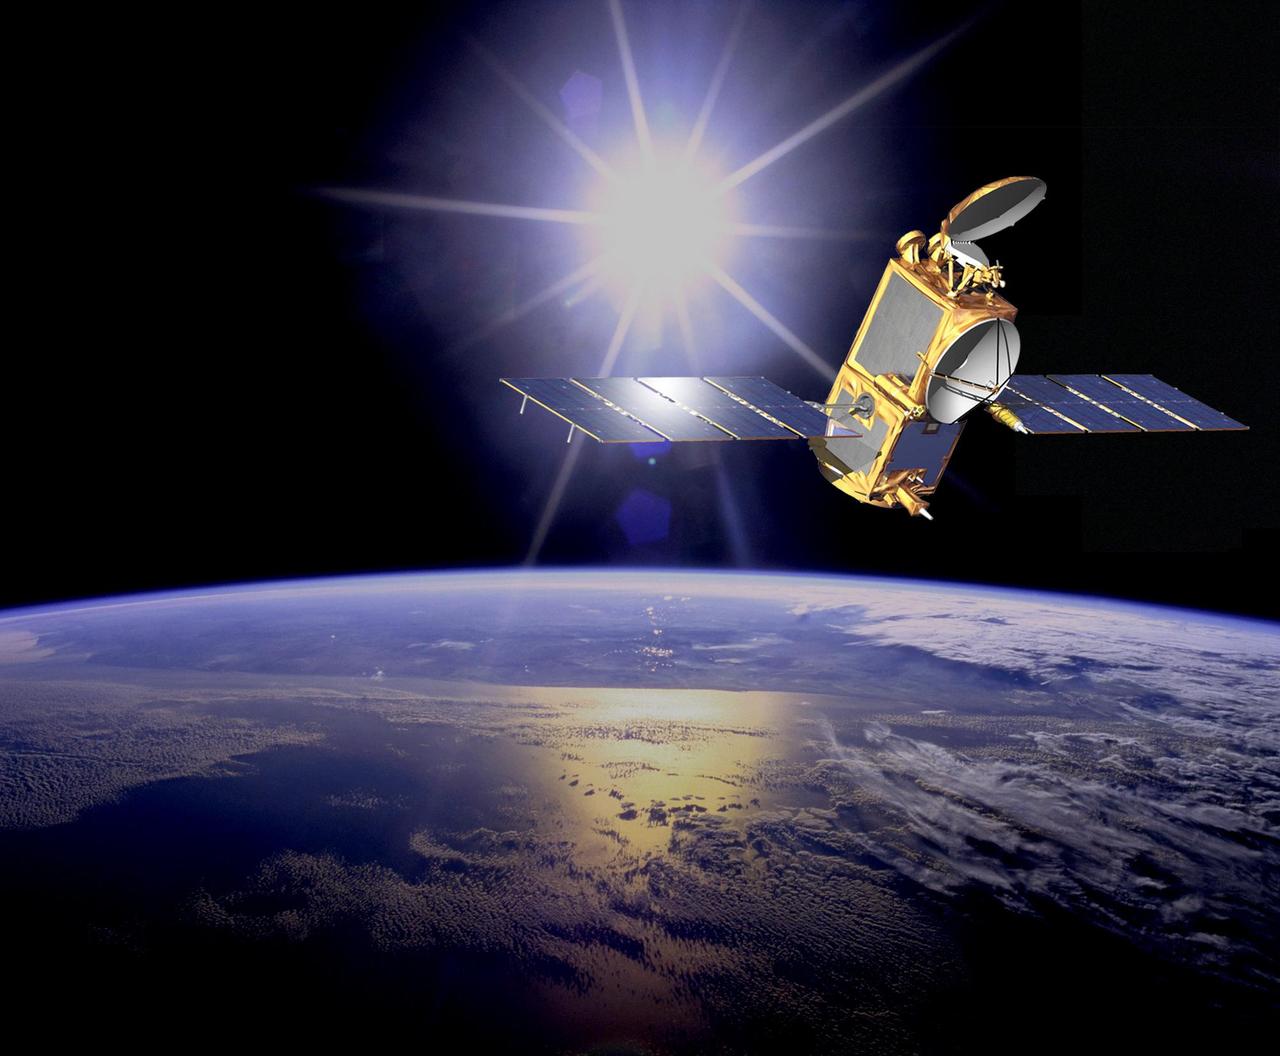
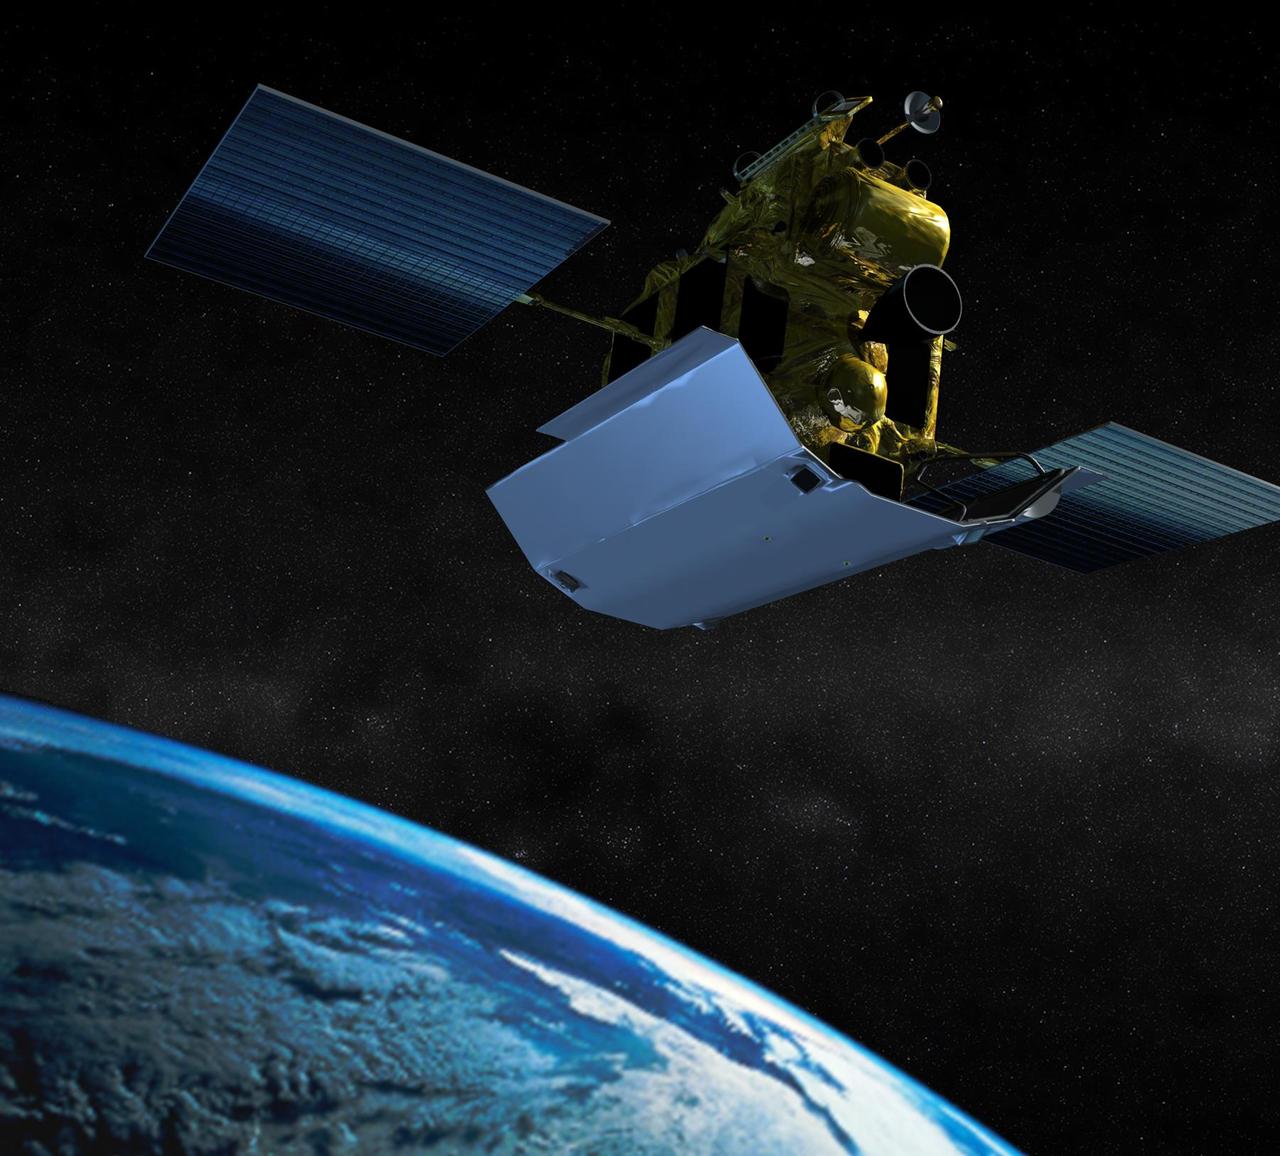
An artist concept of the Ocean Surface Topography Mission/Jason 2 Earth satellite. The Ocean Surface Topography Mission/Jason 2 is an Earth satellite designed to make observations of ocean topography for investigations into sea-level rise and the relationship between ocean circulation and climate change. The satellite also provides data on the forces behind such large-scale climate phenomena as El Niño and La Niña. The mission is a follow-on to the French-American Jason 1 mission, which began collecting data on sea-surface levels in 1992. http://photojournal.jpl.nasa.gov/catalog/PIA18158
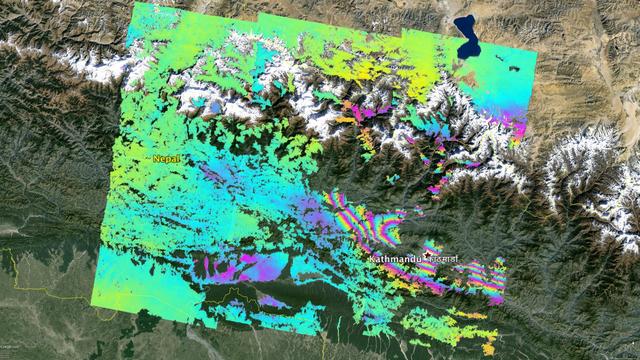
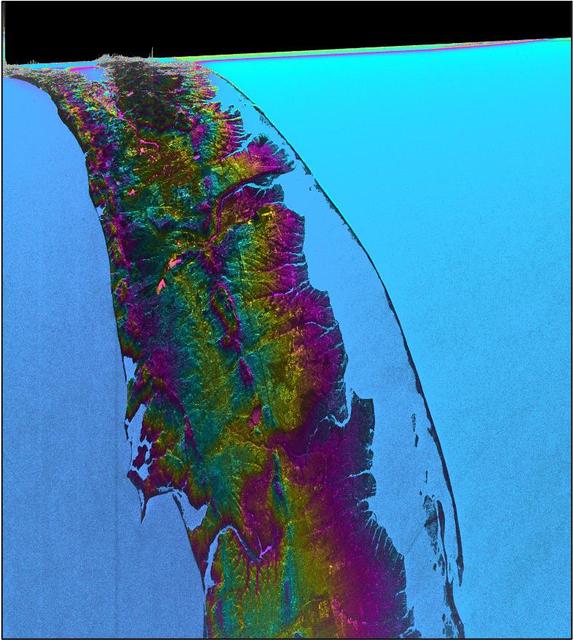
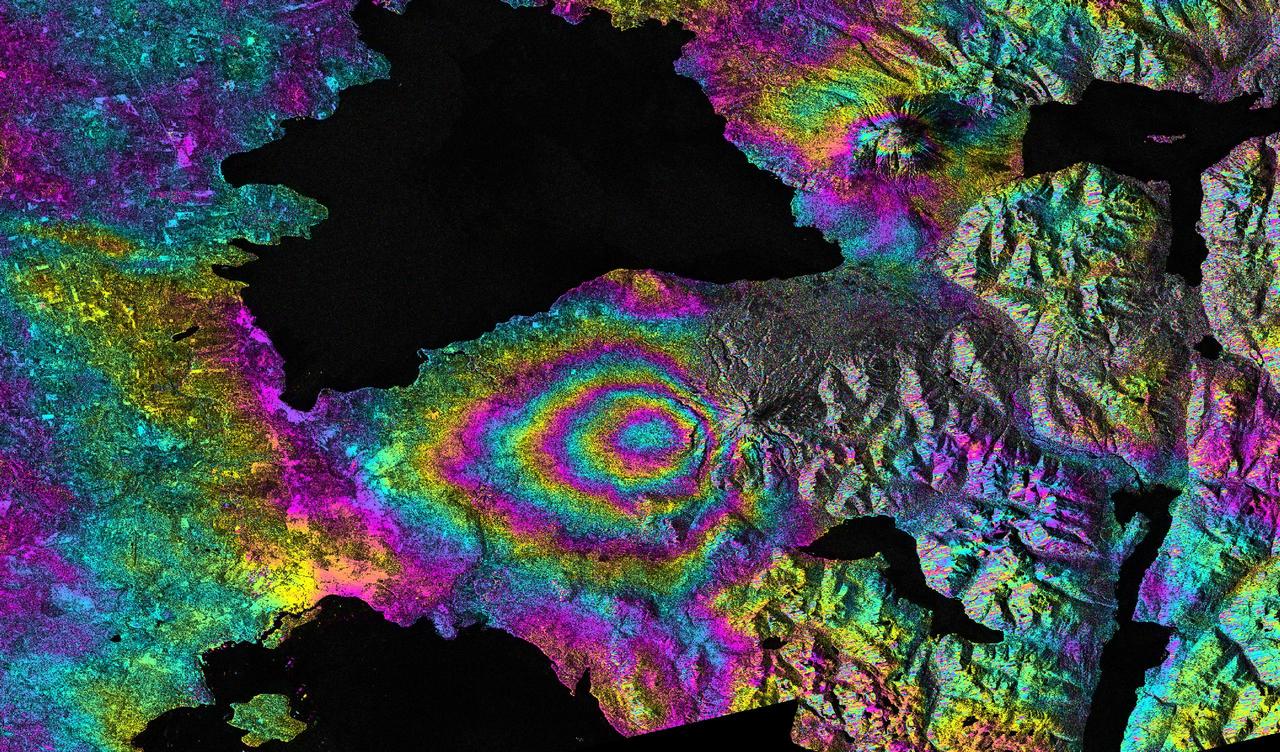
NASA and its partners are contributing important observations and expertise to the ongoing response to the April 25, 2015, magnitude 7.8 Gorkha earthquake in Nepal. The quake was the strongest to occur in that area since the 1934 Nepal-Bihar magnitude 8.0 event and caused significant regional damage and a humanitarian crisis. Scientists with the Advanced Rapid Imaging and Analysis project (ARIA), a collaboration between NASA's Jet Propulsion Laboratory, Pasadena, California, and the California Institute of Technology in Pasadena, analyzed interferometric synthetic aperture radar images from the European Union's Copernicus Sentinel-1A satellite, operated by the European Space Agency and also available from the Alaska Satellite Facility (https://www.asf.alaska.edu), to calculate a map of the deformation of Earth's surface caused by the quake. This false-color map shows the amount of permanent surface movement caused almost entirely by the earthquake, as viewed by the satellite, during a 12-day interval between two Sentinel-1 images acquired on April 17 and April 29, 2015. In the map, surface displacements are seen as color contours (or "fringes"), where each color cycle represents 8 inches (20 centimeters) of surface motion. The contours show the land around Kathmandu has moved upward by more than 40 inches (1 meter). Areas without the color contours have snow or heavy vegetation that affects the radar measurements. Scientists use these maps to build detailed models of the fault and associated land movements to better understand the impact on future earthquake activity. The background image is from Google Earth. The map contains Copernicus data (2015). http://photojournal.jpl.nasa.gov/catalog/PIA19535
STS026-31-071 (3 Oct 1988) --- After deployment from Discovery, Orbiter Vehicle (OV) 103, the inertial upper stage (IUS) with the tracking and data relay satellite C (TDRS-C) drifts above the cloud-covered Earth surface. TDRS-C, in stowed configuration (solar array panels visible), is mounted atop the IUS with the interstage and solid rocket motor and nozzle seen in the foreground.

AS11-44-6642 (21 July 1969) --- The Apollo 11 Lunar Module ascent stage, with astronauts Neil A. Armstrong and Edwin E. Aldrin Jr. aboard, is photographed from the Command and Service Modules (CSM) during rendezvous in lunar orbit. The Lunar Module (LM) was making its docking approach to the CSM. Astronaut Michael Collins remained with the CSM in lunar orbit while the other two crewmen explored the lunar surface. The large, dark-colored area in the background is Smyth's Sea, centered at 85 degrees east longitude and 2 degrees south latitude on the lunar surface (nearside). This view looks west. The Earth rises above the lunar horizon.
AS16-120-19187 (19 April 1972) --- Apollo 16 astronauts captured this Earth rise scene with a handheld Hasselblad camera during the second revolution of the moon. Identifiable craters seen on the moon include Saha, Wyld, and Saenger. Much of the terrain seen here is never visible from Earth, as the Command Module (CM) was just passing onto what is known as the dark side or far side of the moon. Crewmen aboard the CM at the time the photo was made were astronauts John W. Young, Thomas K. Mattingly II and Charles M. Duke Jr. Mattingly remained later with the CM in lunar orbit while Young and Duke descended in the lunar module (LM) to explore the surface of the moon.
STS039-17-017 (3 May 1990) --- This STS-39 35mm scene shows the Strategic Defense Initiative Organization (SDIO) Shuttle Pallet Satellite (SPAS-II) as it approaches the remote manipulator system (RMS) end effector following a period of free-flight and data collection. During the eight-day flight, SPAS collected data in both a free-flying mode and while attached to the RMS. A huge blanket of white clouds obscures identifiable points on Earth, nearly 300 statute miles away. The target grappling apparatus on SPAS is clearly seen near bottom center of frame.

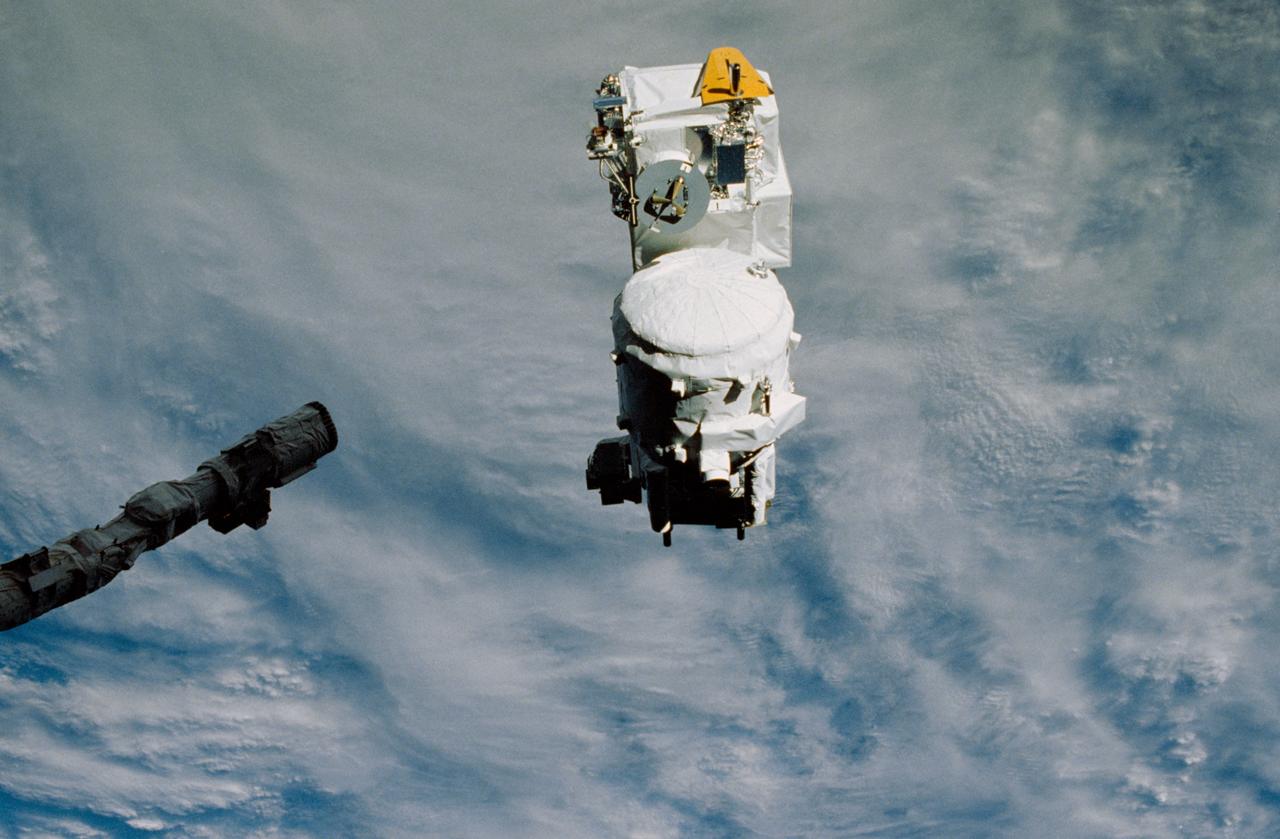
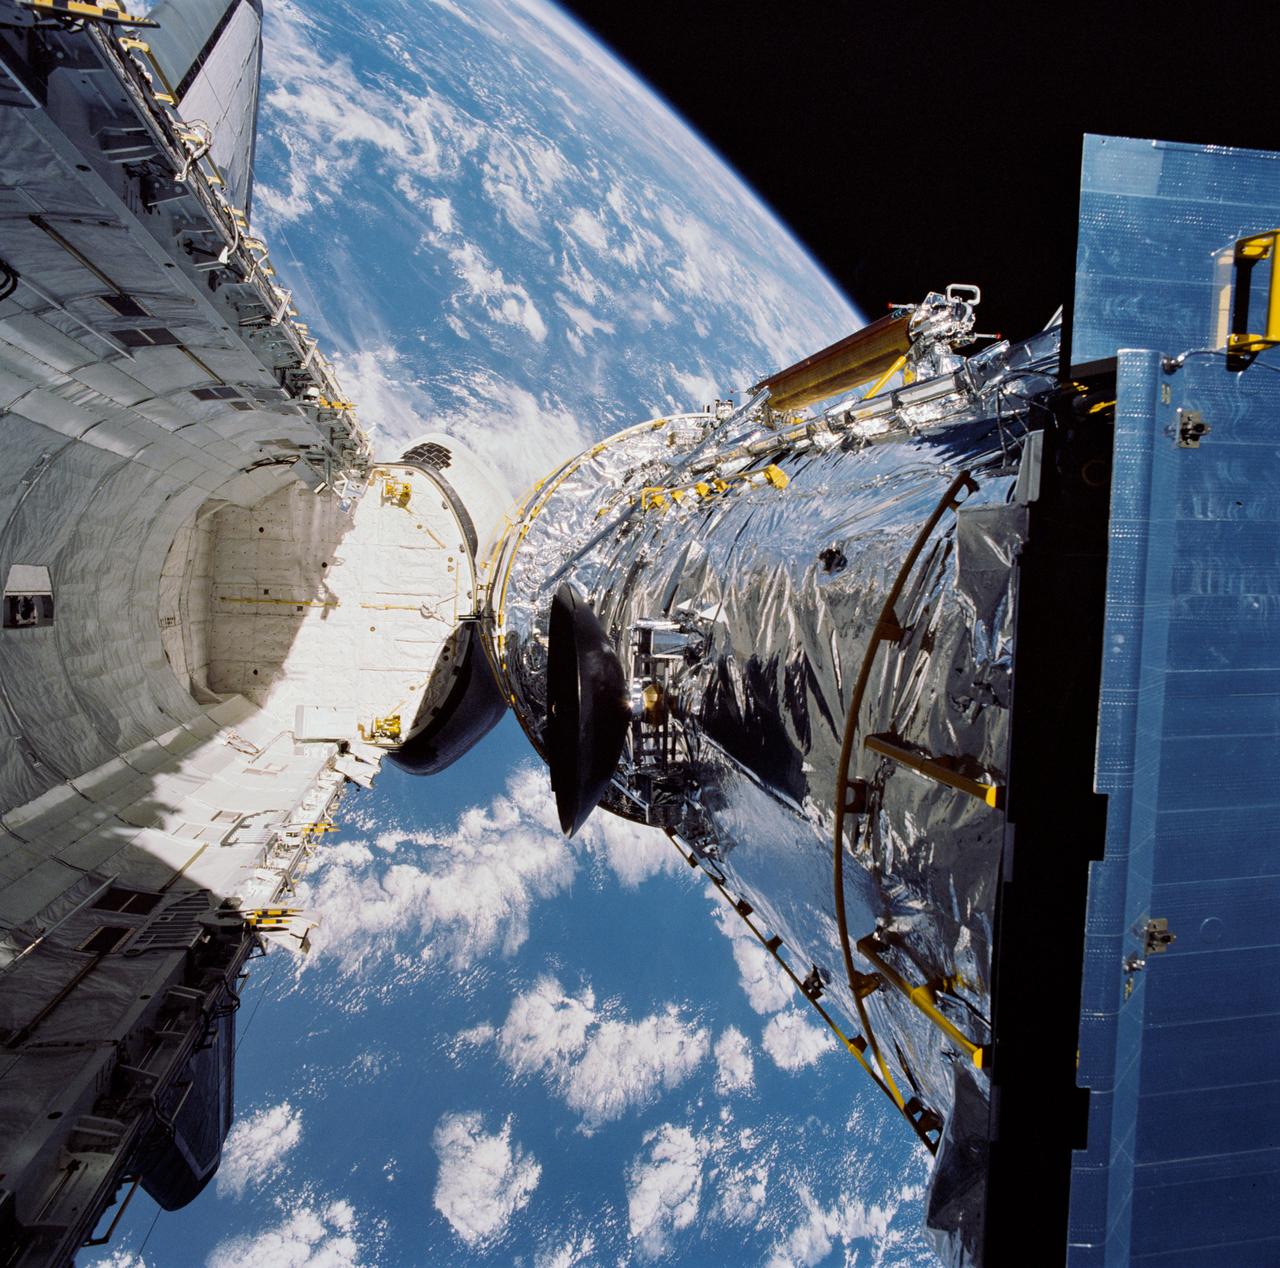
During STS-31, the Hubble Space Telescope (HST) is held in appendage deploy position by Discovery's, Orbiter Vehicle (OV) 103's, remote manipulator system (RMS) above the payload bay (PLB) and crew compartment cabin. While in this position the solar array (SA) wing bistem cassette (HST center) is deployed from its stowed location along side the Support System Module (SSM) forward shell. A high gain antenna (HGA) remains stowed along the SSM. The Earth's surface and the Earth limb creates a dramatic backdrop.
Held in appendage deploy position by Discovery's, Orbiter Vehicle (OV) 103's, remote manipulator system (RMS), the Hubble Space Telescope's (HST's) starboard solar array (SA) bistem cassette is released from its stowed position on the Support System Module (SSM) forward shell. The spreader bar & bistem begin to unfurl the SA wing. View was taken by an STS-31 crewmember through an overhead window & is backdropped against the surface of the Earth.
This view taken through overhead window W7 on Columbia's, Orbiter Vehicle (OV) 102's, aft flight deck shows the Long Duration Exposure Facility (LDEF) in the grasp of the remote manipulator system (RMS) during STS-32 retrieval activities. Other cameras at eye level were documenting the bus-sized spacecraft at various angles as the RMS manipulated LDEF for a lengthy photo survey. The glaring celestial body in the upper left is the sun with the Earth's surface visible below.
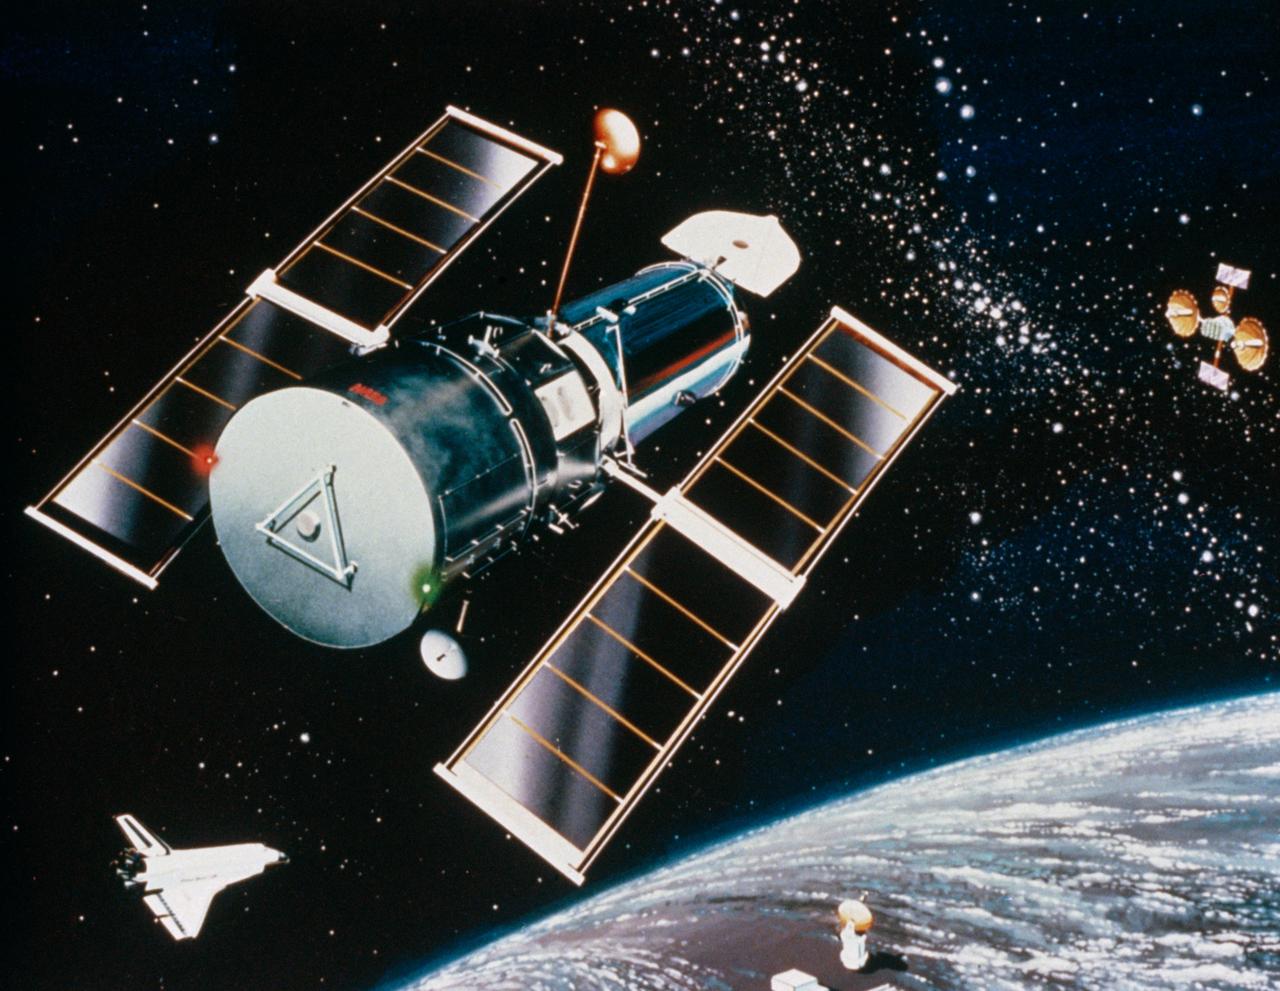
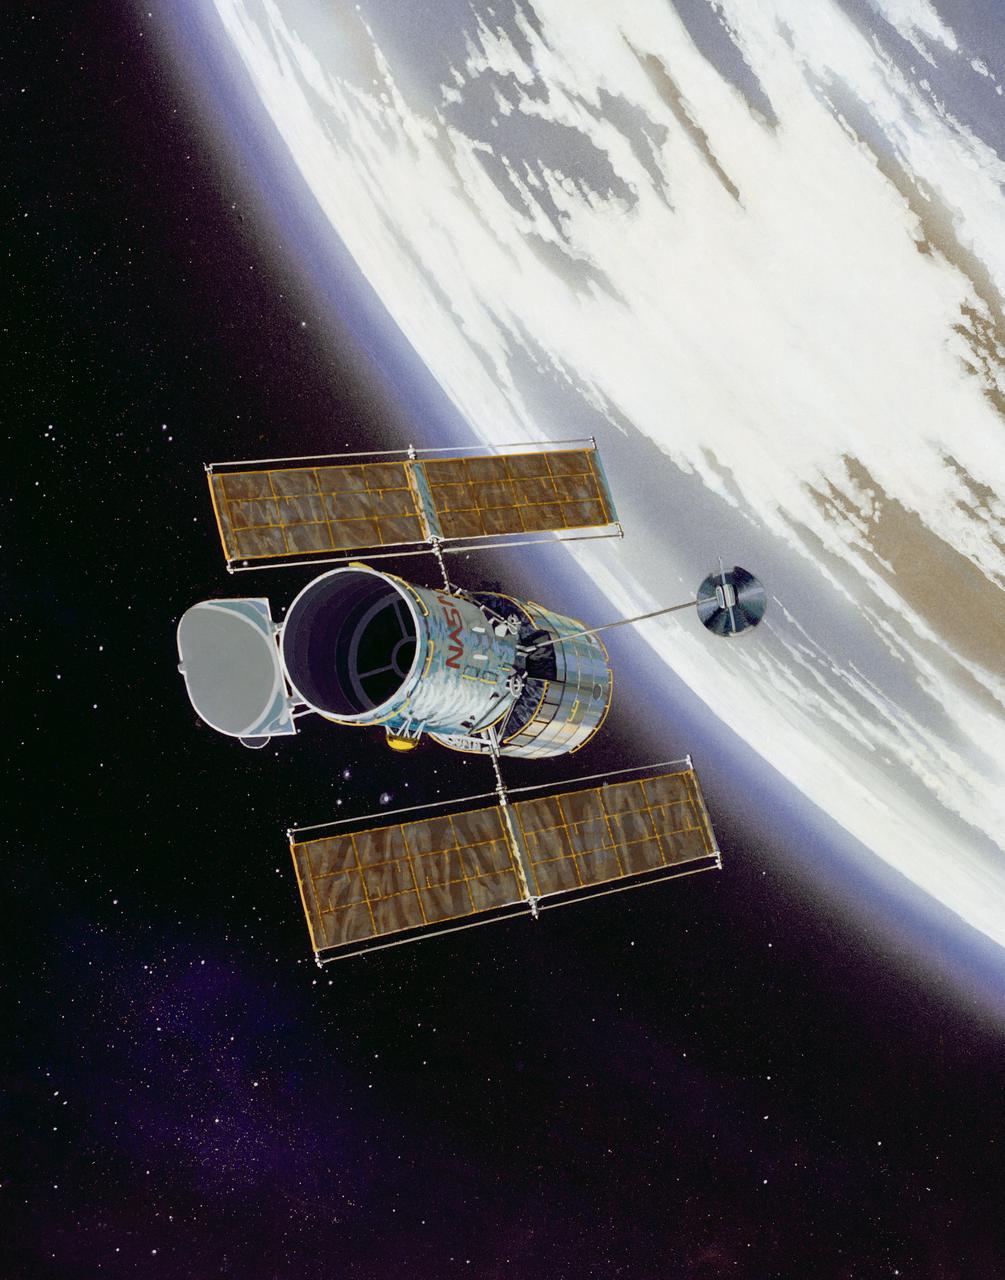
Artist concept shows the Hubble Space Telescope (HST) placed in orbit above the Earth's distorting layer of atmosphere by Discovery, Orbiter Vehicle (OV) 103, during mission STS-31. Tracking and data relay satellite (TDRS) is visible in the background and ground station is visible below on the Earth's surface. HST is the first of the great observatories to go into service and one of NASA's highest priority scientific spacecraft. Capable of observing in both visible and ultraviolet wavelengths, HST has been termed the most important scientific instrument ever designed for use on orbit. It will literally be able to look back in time, observing the universe as it existed early in its lifetime and providing information on how matter has evolved over the eons. The largest scientific payload ever built, the 12 1/2-ton, 43-foot HST was developed by Lockheed Missiles & Space Company, spacecraft prime contractor, and Perkin-Elmer Corporation, prime contractor for the optical assembly. The European Space Agency (ESA) furnished the power generating solar array and one of the system's five major instruments. Marshall Space Flight Center (MSFC) manages the HST project; Goddard Space Flight Center (GSFC) will be responsible, when the spacecraft is in orbit, for controlling the telescope and processing the images and instrument data returns.
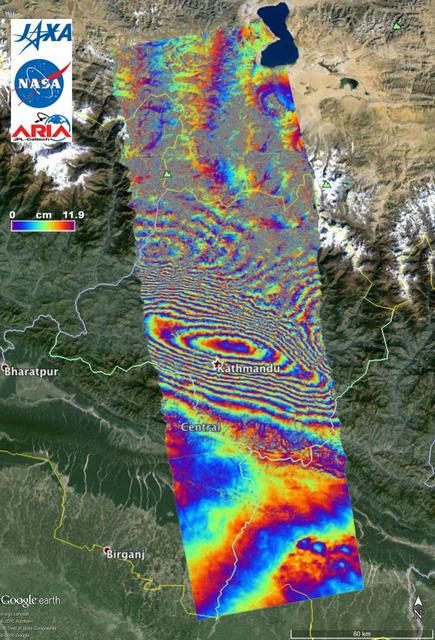
NASA and its partners are contributing important observations and expertise to the ongoing response to the April 25, 2015, magnitude 7.8 Gorkha earthquake in Nepal. The quake was the strongest to occur in that area since the 1934 Nepal-Bihar magnitude 8.0 event and caused significant regional damage and a humanitarian crisis. Scientists with the Advanced Rapid Imaging and Analysis project (ARIA), a collaboration between NASA's Jet Propulsion Laboratory, Pasadena, California, and the California Institute of Technology in Pasadena, analyzed interferometric synthetic aperture radar images from the PALSAR-2 instrument on the ALOS-2 satellite operated by the Japan Aerospace Exploration Agency (JAXA) to calculate a map of the deformation of Earth's surface caused by the quake. This false-color map shows the amount of permanent surface movement caused almost entirely by the earthquake, as viewed by the satellite, during a 70-day interval between two ALOS-2 images, acquired February 21 and May 2, 2015. In the map, surface displacements are seen as color contours (or "fringes"), where each color cycle represents 4.7 inches (11.9 centimeters) of surface motion. The contours show the land around Kathmandu has moved toward the satellite by up to 4.6 feet (1.4 meter), or 5.2 feet (1.6 meters) if we assume purely vertical motion. Areas without the color contours have snow or heavy vegetation that affects the radar measurements. Scientists use these maps to build detailed models of the fault and associated land movements to better understand the impact on future earthquake activity. The PALSAR-2 data were provided by JAXA through the Committee on Earth Observation Satellite (CEOS) in support of the response effort. The background image is from Google Earth. http://photojournal.jpl.nasa.gov/catalog/PIA19383
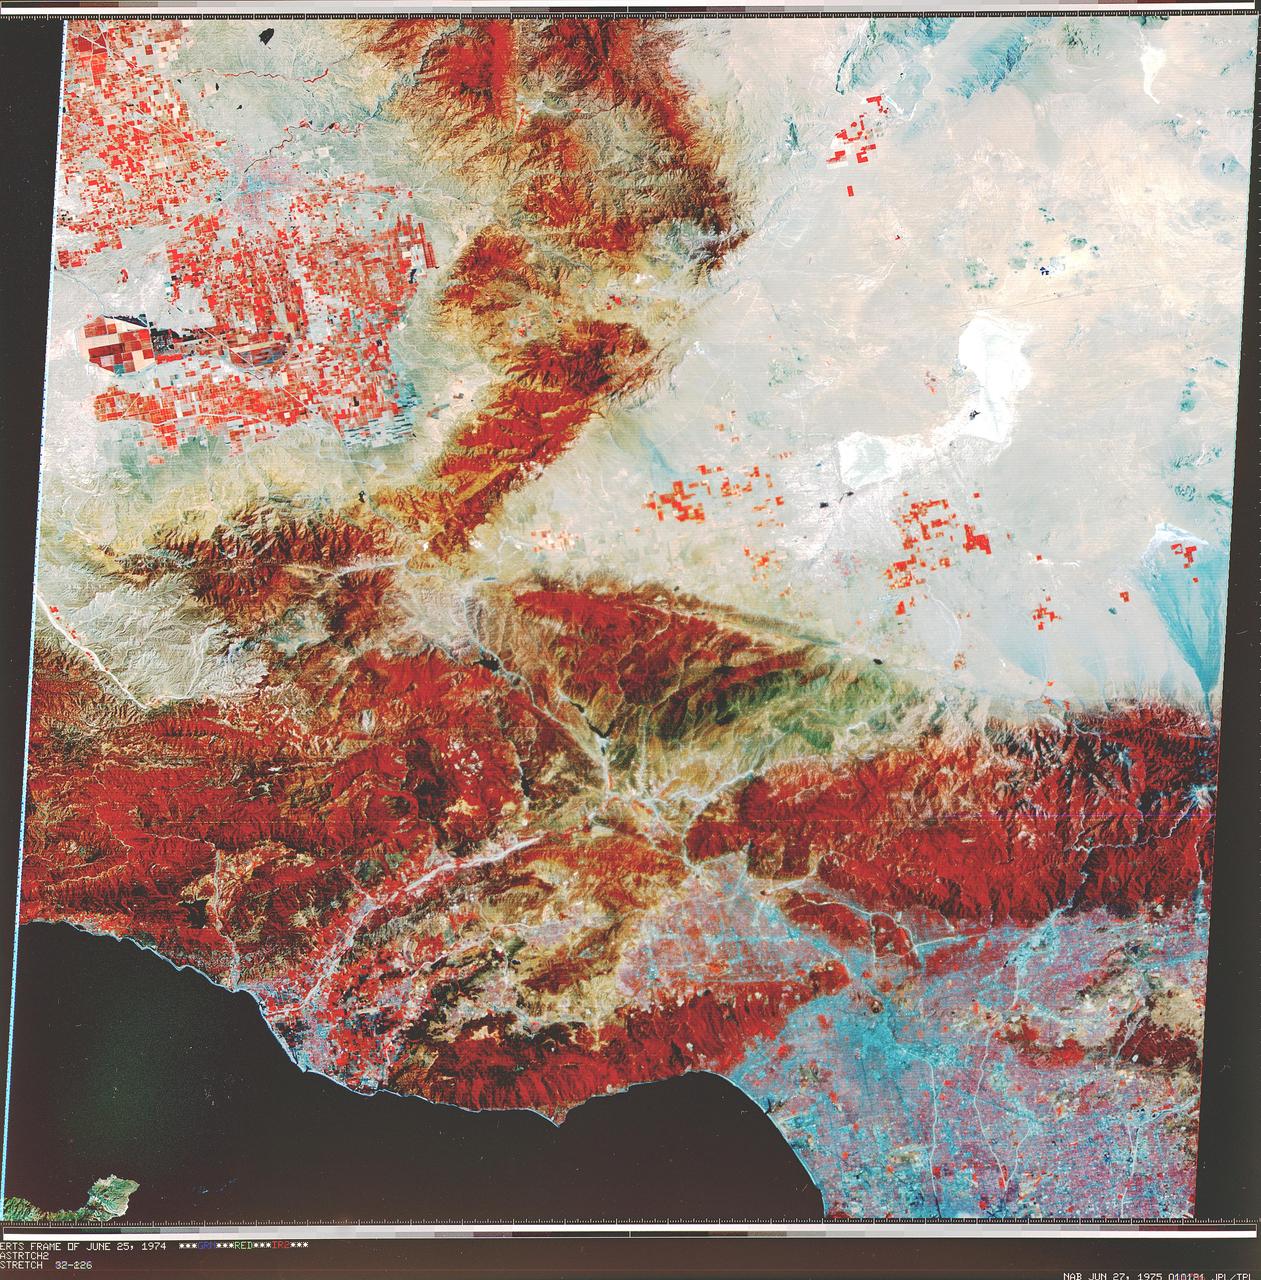
NASA Landsat 1 originally named the Earth Resources Technology Satellite, or ERTS was the first of what was to become a series of satellites designed to map and monitor the Earth land surfaces.
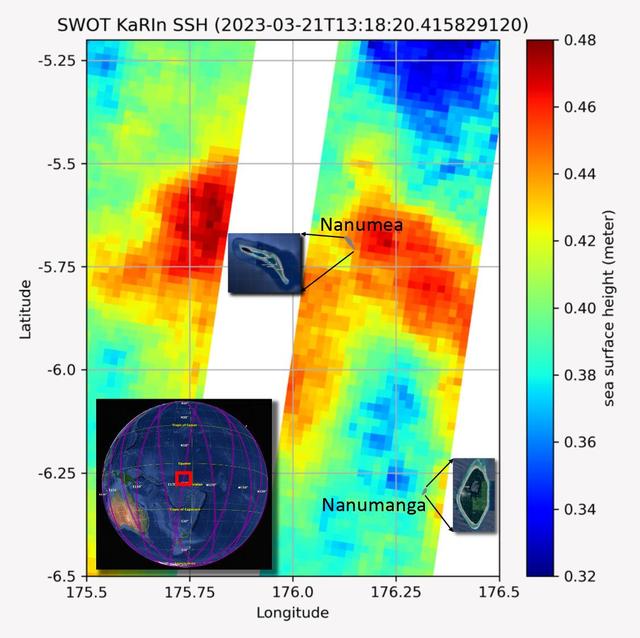
The recently launched Surface Water and Ocean Topography (SWOT) mission collected data on sea levels around two of the inhabited islands of Tuvalu, a nation in the South Pacific Ocean that has been threatened with sea level rise that substantially exceeds the global average. The image shows two areas of red that indicate higher than normal sea levels around two of Tuvalu's inhabited islands, Nanumanga and Nanumea. The higher sea levels were likely caused by internal tides or circular currents called eddies. The SWOT data illuminates for the first time these small ocean features that, when they occur on top of rising sea levels, can lead to episodic flooding along coastlines. The Tuvalu data was collected March 21, 2023. Rising seas are a direct consequence of climate change. On a global scale, the combination of warming ocean waters and ice melt from glaciers and ice sheets is leading to sea level rise that is occurring at an ever-increasing rate. The current rate of rise is more than 0.15 inches (4 millimeters) per year, an increase from 0.08 inches (2 millimeters) per year in 1993. This seemingly small increase holds great significance for coastal communities that have seen more than a century of persistent sea level rise. The gap between the average high tide and flooding conditions has narrowed, and coastal impacts driven by sea level rise have increased in frequency and severity in recent years. This is particularly true for low-lying island nations like Tuvalu, located about 620 miles (1,000 kilometers) north of Fiji. Sea level rise does not occur at the same rate everywhere across the globe, and can be exacerbated by natural ocean fluctuations that occur over time periods from years to decades. For Tuvalu, the amount of sea level rise has been substantially higher than the global average over the past three decades. The amount of rise, when coupled with Tuvalu's low land elevations, places the country increasingly under threat. In the near term, sea level rise will combine with naturally occurring ocean variability and storms to exacerbate events like coastal flooding. Monitoring and understanding sea level change is critical for Tuvalu and other low-lying island nations. Launched on Dec. 16, 2022, from Vandenberg Space Force Base in central California, SWOT collected the Tuvalu sea level data during a period of commissioning, calibration, and validation. Engineers are checking out the performance of the satellite's systems and science instruments before the planned start of science operations in summer 2023. https://photojournal.jpl.nasa.gov/catalog/PIA25777
Backdropped against the Earth's surface, the Gamma Ray Observatory (GRO) with its solar array (SA) panels deployed is grappled by the remote manipulator system (RMS) during STS-37 systems checkout. GRO's four complement instruments are visible: the Energetic Gamma Ray Experiment Telescope (EGRET) (at the bottom); the Imaging Compton Telescope (COMPTEL) (center); the Oriented Scintillation Spectrometer Experiment (OSSE) (top); and Burst and Transient Source Experiment (BATSE) (on four corners). The view was taken by STS-37 crew through an aft flight deck overhead window.
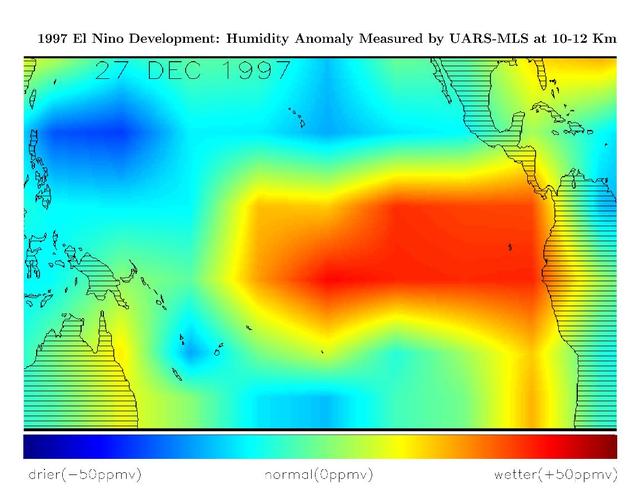
This image shows differences in atmospheric water vapor relative to a normal average year in the Earth upper troposphere about 10 kilometers 6 miles above the surface.
This image of the far side of the lunar surface, with Earth in the background, is of crater De Forest and was taken by NASA MoonKAM system onboard the Ebb spacecraft.

This image shows differences in atmospheric water vapor relative to a normal average year in the Earth upper troposphere about 10 kilometers 6 miles above the surface.
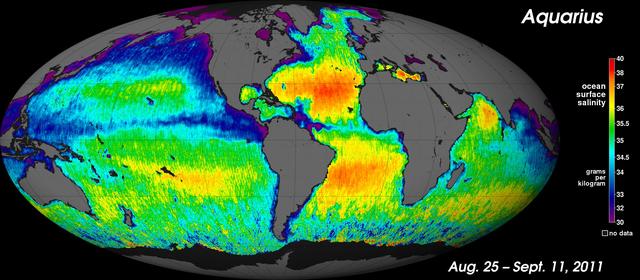
NASA Aquarius instrument has produced its first global map of the salinity, or saltiness, of Earth ocean surface, providing an early glimpse of the mission anticipated discoveries.

This image of the moon was obtained by the Galileo Solid State imaging system on Dec. 8 at 7 p.m. PST as NASA Galileo spacecraft passed the Earth and was able to view the lunar surface from a vantage point not possible from the Earth. http://photojournal.jpl.nasa.gov/catalog/PIA00225
SL4-137-3655 (16 Dec. 1973) --- An island wake produced by the Antipodes Islands in the ocean current south of New Zealand is seen in this photograph taken from the Skylab space station in Earth orbit. A Skylab 4 crewmen took the picture with a hand-held 70mm Hasselblad camera. The bow wave pattern is quite evident and can be used to determine the current speed from the angle of the bow wave if the propagation speed of the surface wave is known. Also, evident is the darker band extending downstream from the island tens of miles. This is the actual wake of the island. The existence of water color differences from within to outside a turbulent island wake may indicate a temperature difference, with cooler water being stirred to the surface in the wake. This temperature difference could be used to drive a thermo-electric type generator to reduce small islands' dependence on imported oil for power generation. Photo credit: NASA

This image from NASA Aqua spacecraft shows how surface emissivity -- how efficiently Earth surface radiates heat -- changed in several regions of Pakistan over a 32-day period between July 11 pre-flood and August 12 post-flood.
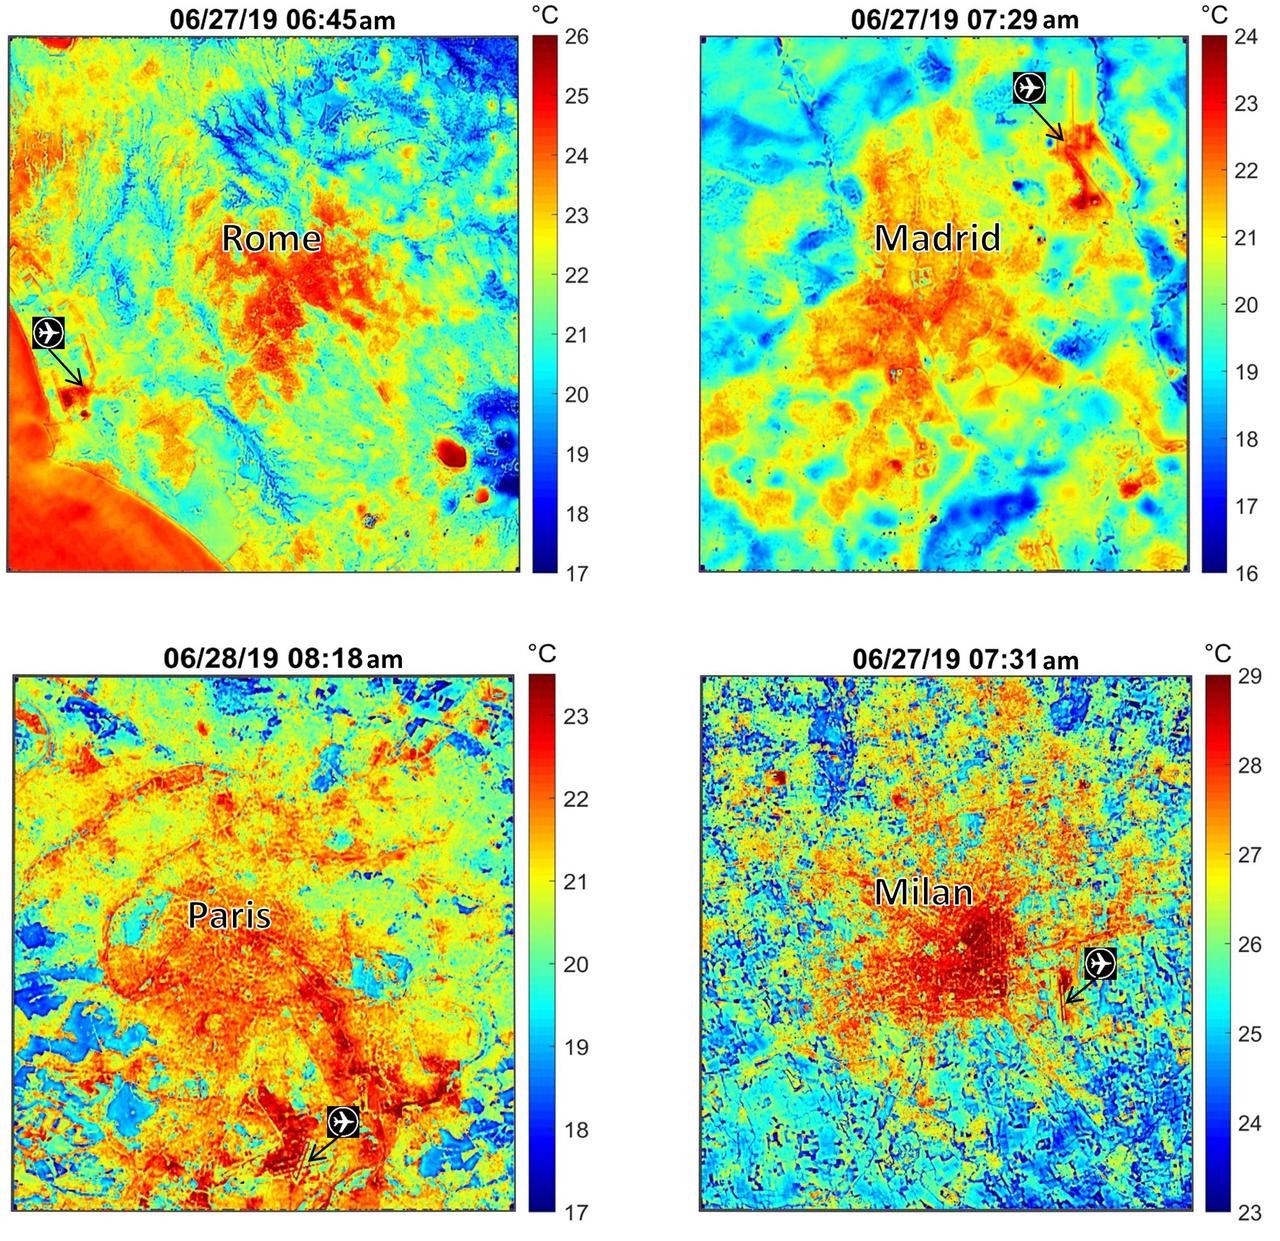
These maps of four European cities show ECOSTRESS surface temperature images acquired in the early mornings of June 27 and 28, 2019, during a heatwave. The images have been sharpened to delineate key features such as airports. Airports and city centers are hotter than surrounding regions because they have more surfaces that retain heat (asphalt, concrete, etc.). ECOSTRESS launched on June 29, 2018, as part of a SpaceX commercial resupply mission to the International Space Station. Its primary mission is to detect plant health by monitoring Earth's surface temperature. However, surface temperature data are also useful in detecting other heat-related phenomena — like heat waves, volcanoes and fires. https://photojournal.jpl.nasa.gov/catalog/PIA23148
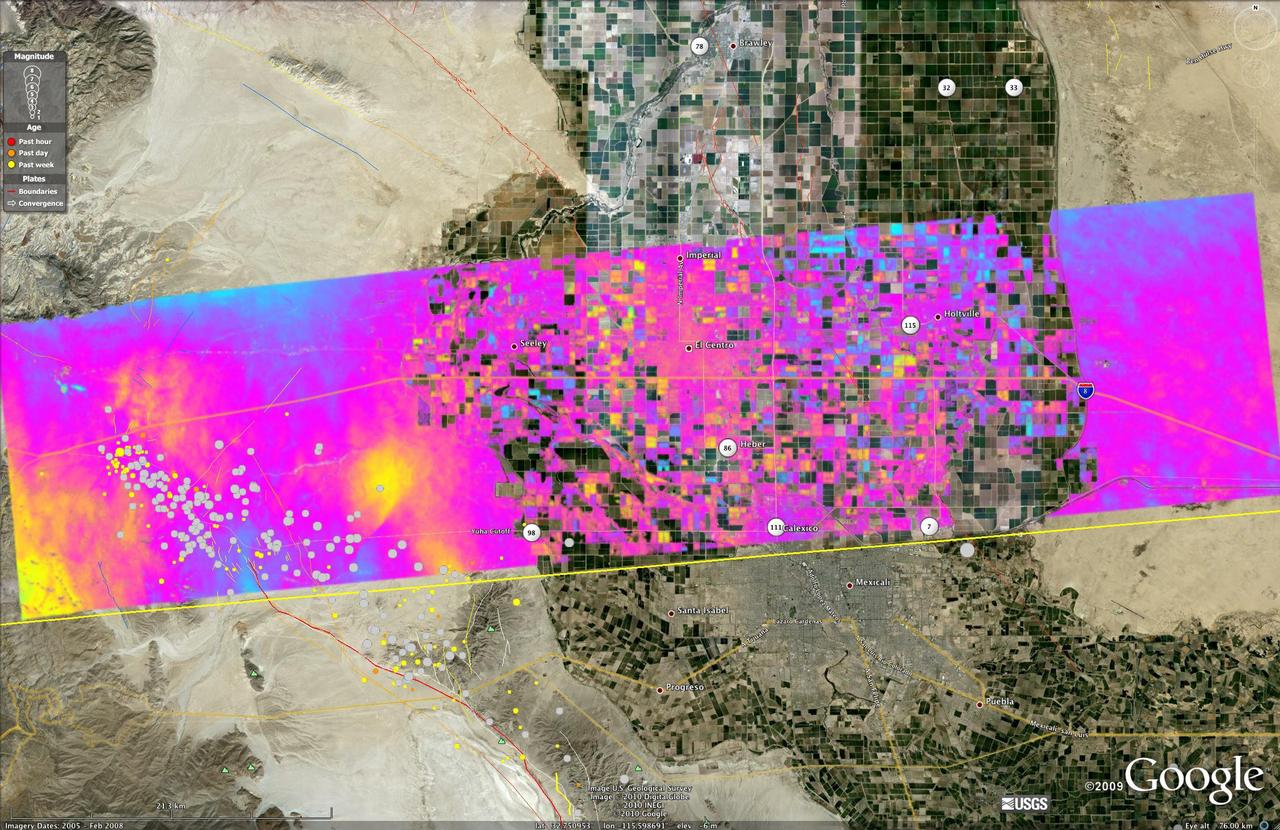
This image shows a UAVSAR interferogram swath overlaid atop a Google Earth image. New NASA airborne radar images show the continuing deformation in Earth surface resulting from the magnitude 7.2 temblor in Baja California on April 4, 2010.
The main agent of erosion on Mars today is the wind. Wind has sculpted the surface in this region into a set of hills and valleys called yardangs on Earth. This image is from NASA 2001 Mars Odyssey spacecraft.
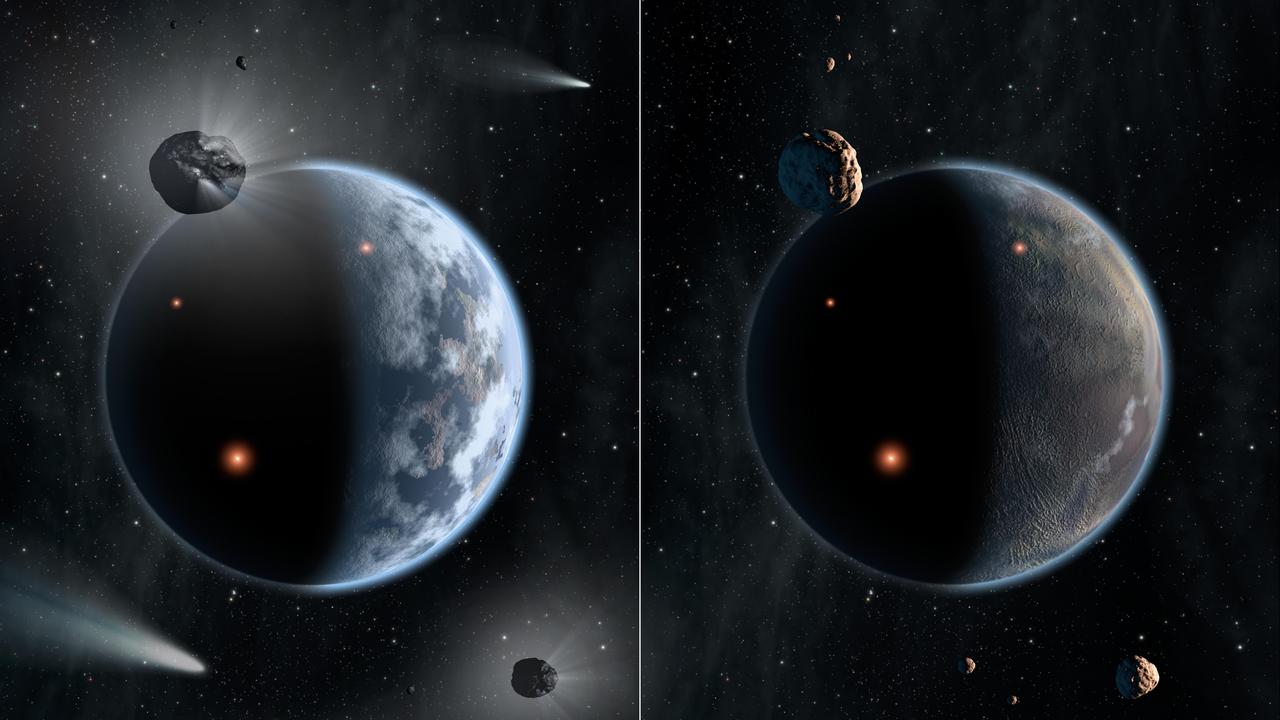
This artist concept illustrates the fate of two different planets: the one on the left is similar to Earth, made up largely of silicate-based rocks with oceans coating its surface.

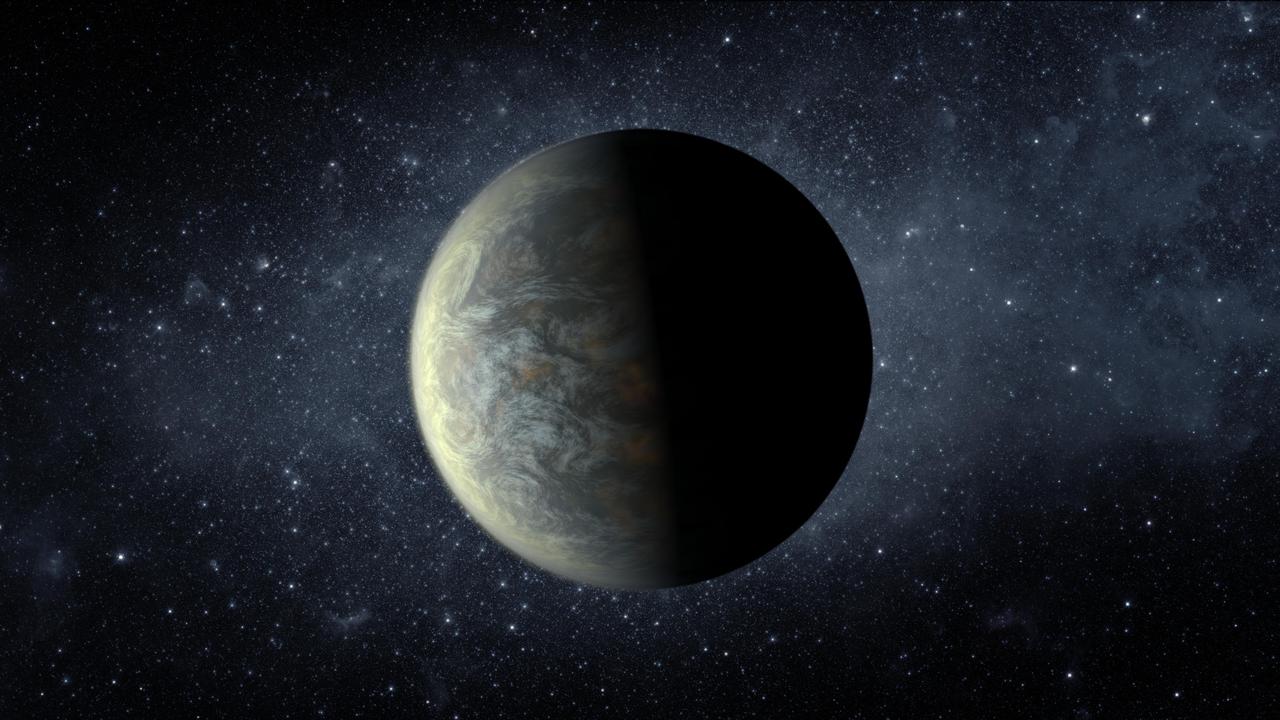
This artist concept depicts Kepler-186f, the first validated Earth-size planet to orbit a distant star in the habitable zone, a range of distance from a star where liquid water might pool on the planet surface.
The Surface Stereo Imager onboard NASA Phoenix Mars Lander captures a scene with three different filters. The images are sent to Earth in black and white and the color is added by mission scientists.

A portion of Alpha Regio is displayed in this three-dimensional perspective view of the surface of Venus from NASA Magellan spacecraft. In 1963, Alpha Regio was the first feature on Venus to be identified from Earth-based radar.
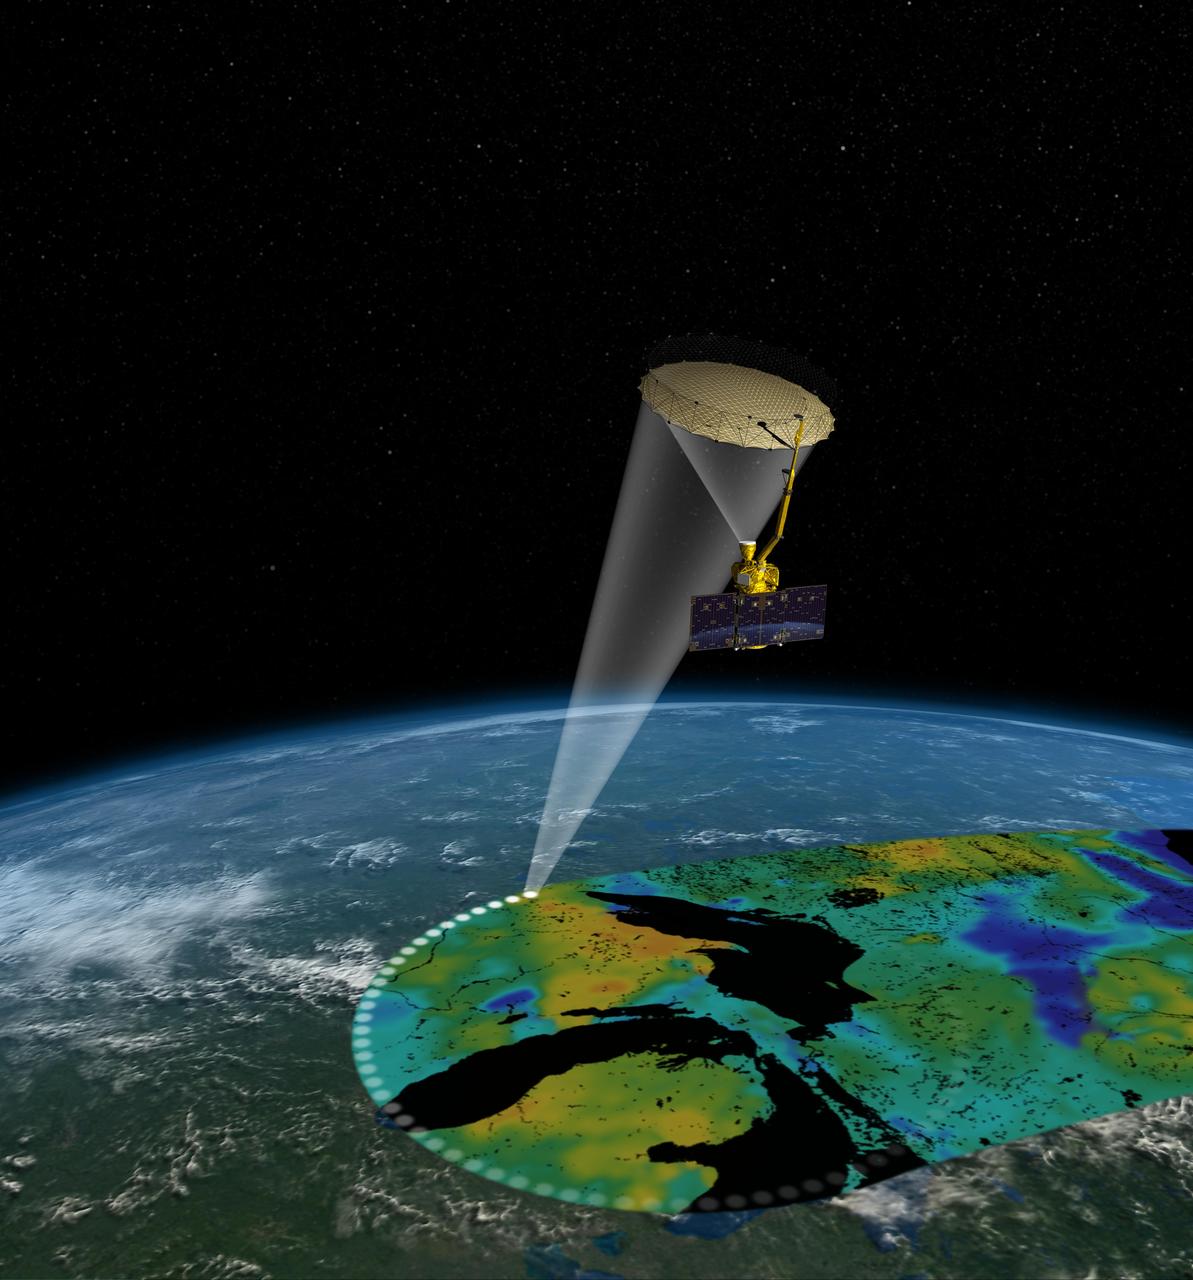
Artist rendering of the Soil Moisture Active Passive SMAP satellite. The width of the region scanned on Earth surface during each orbit is about 620 miles 1,000 kilometers.
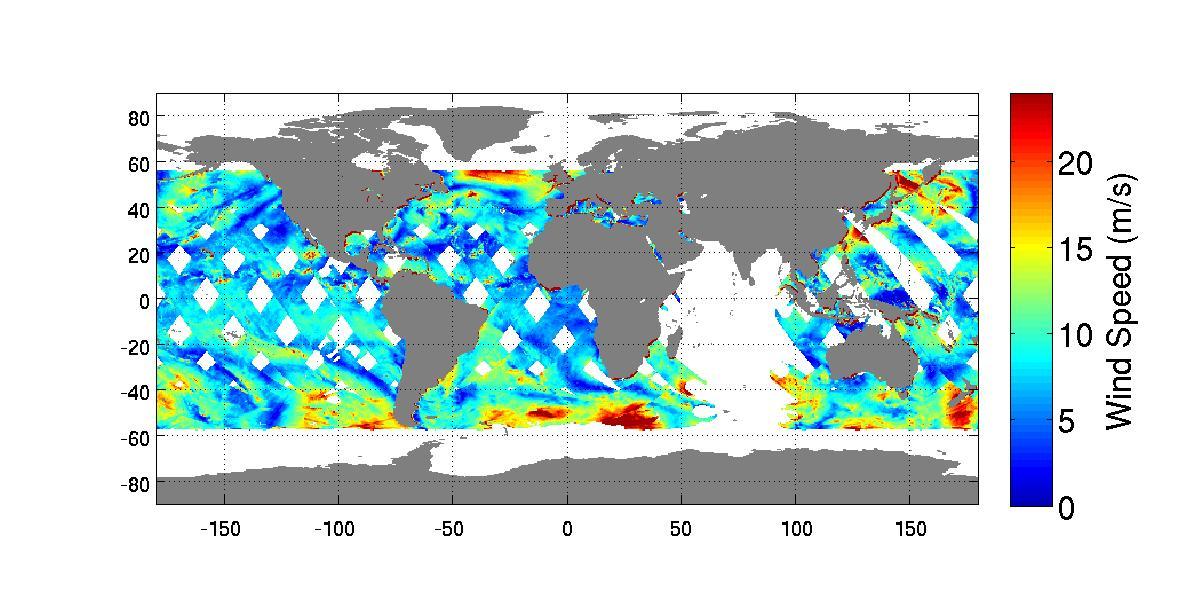
Launched Sept. 21, 2014, to the International Space Station, NASA newest Earth-observing mission, the International Space Station-RapidScat scatterometer to measure global ocean near-surface wind speeds and directions.
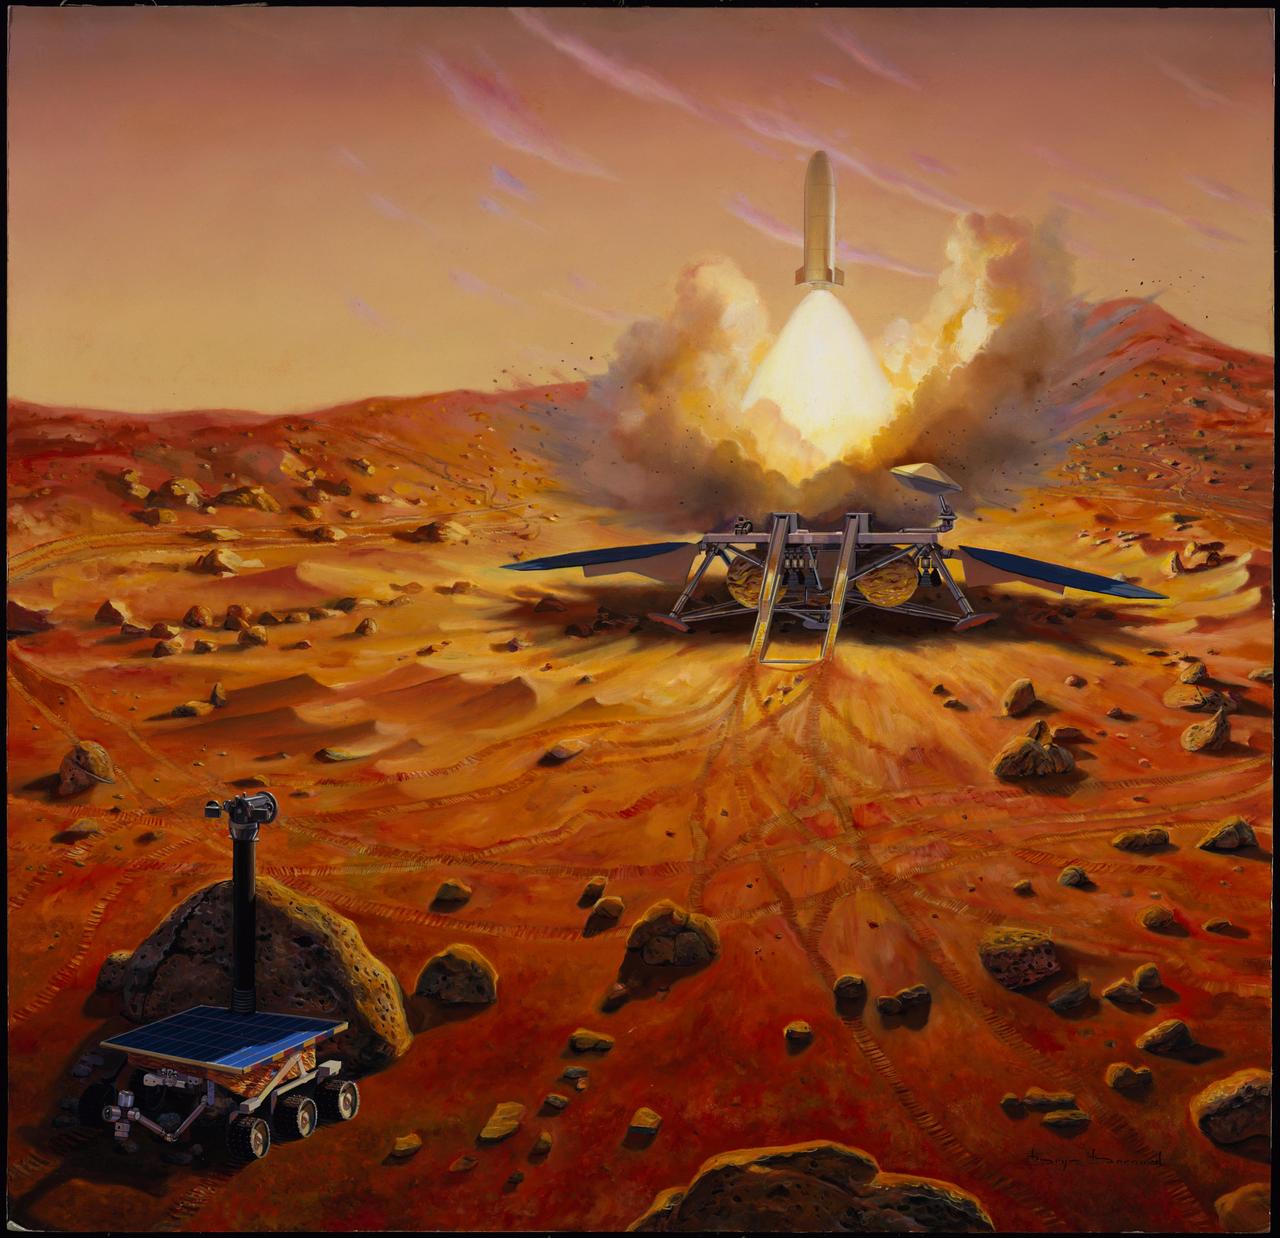
One crucial step in NASA Mars sample return mission would be to launch the collected sample away from the surface of Mars. This artist concept depicts a Mars ascent vehicle for starting a sample of Mars rocks on their trip to Earth.
Kepler-20f is the closest object to the Earth in terms of size ever discovered. With an orbital period of 20 days and a surface temperature of 800 degrees Fahrenheit 430 degrees Celsius, it is too hot to host life, as we know it.
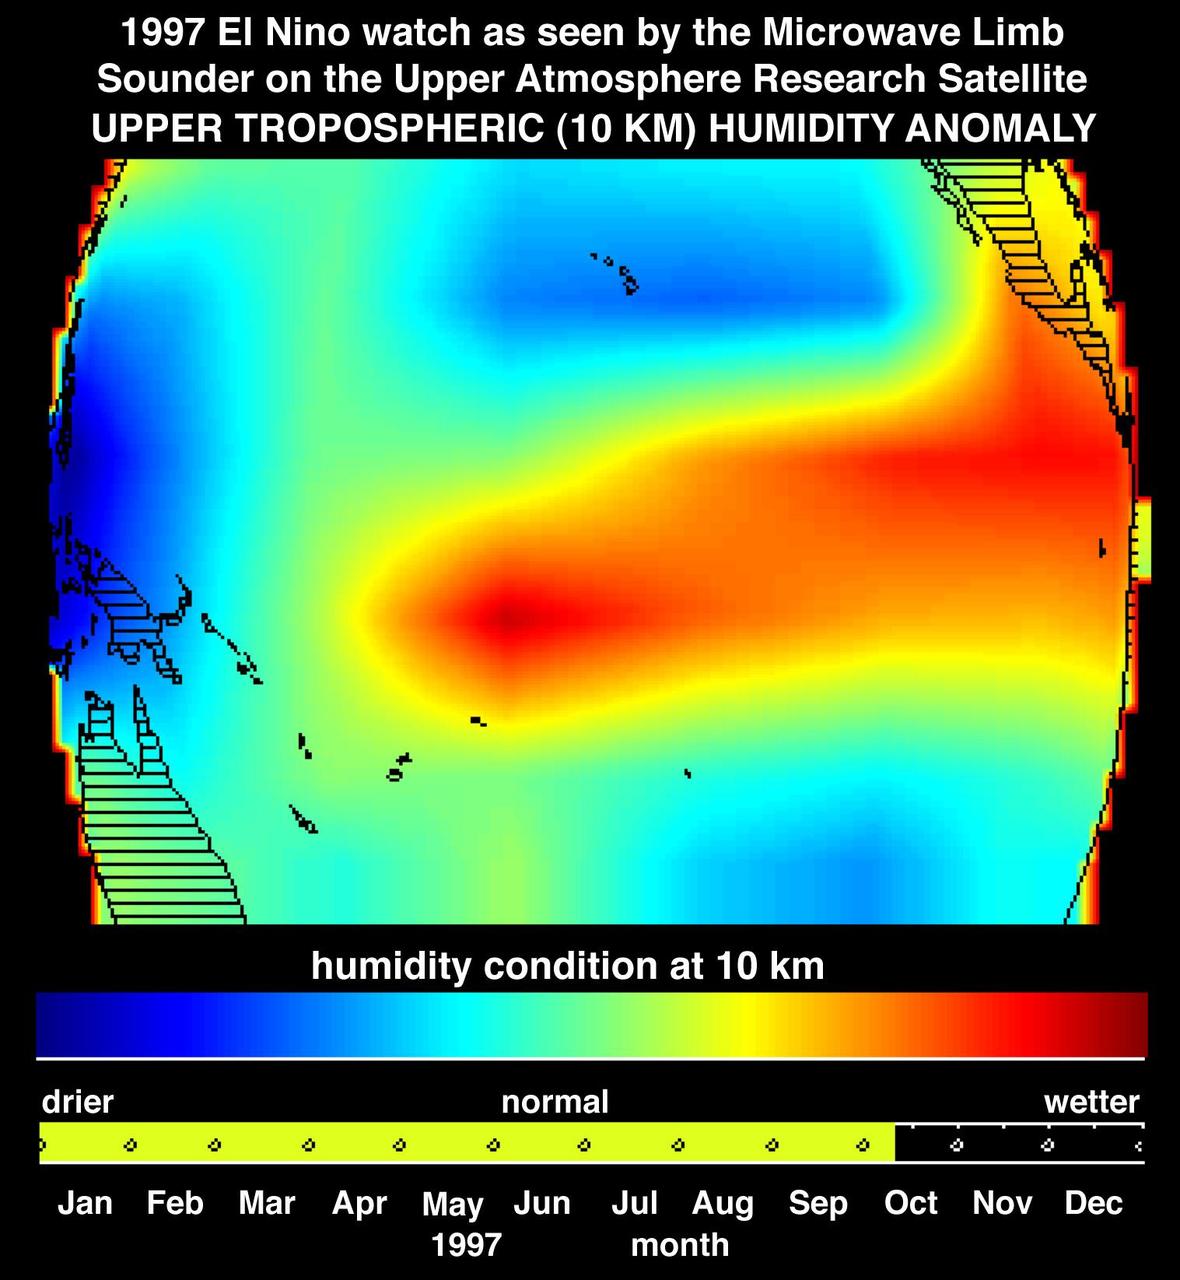
This image shows atmospheric water vapor in Earth upper troposphere, about 10 kilometers 6 miles above the surface, as measured by NASA Microwave Limb Sounder MLS instrument flying aboard the Upper Atmosphere Research Satellite.
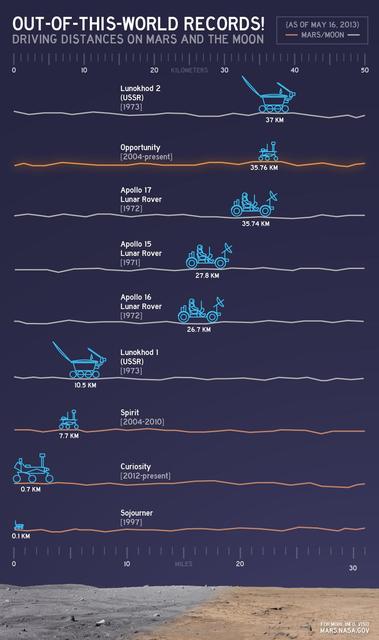
This chart illustrates comparisons among the distances driven by various wheeled vehicles on the surface of Earth moon and Mars. Of the vehicles shown, the NASA Mars rovers Opportunity and Curiosity are still active.
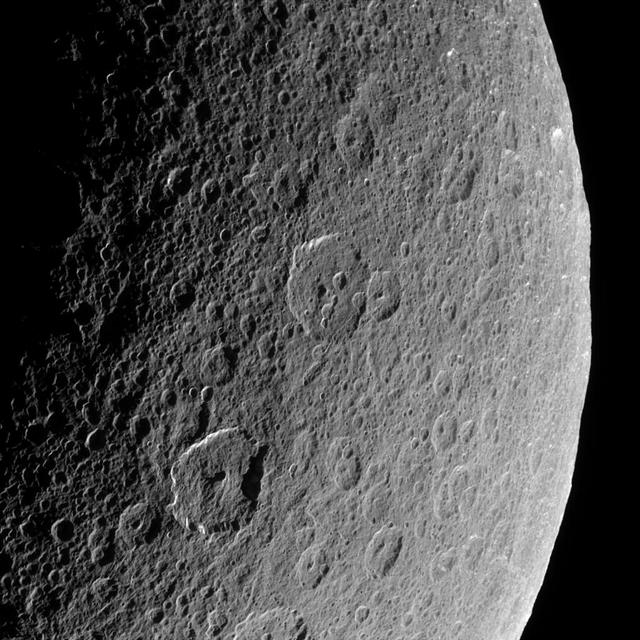
Cassini looks down upon Rhea, whose cratered surface was already ancient before any complex life developed on Earth. The terrain seen here has probably changed little in the past billion years
This satellite interferometric synthetic aperture radar image-pair shows relative deformation of the Earth surface when nn April 22-23, 2015, significant explosive eruptions occurred at Calbuco volcano, Chile.
This artist concept shows the Hubble Space Telescope (HST) in operational configuration orbiting the Earth after its deploy from Discovery, Orbiter Vehicle (OV) 103 during STS-31. The high gain antennas (HGAs) and solar arrays (SAs) have been extended. HST's aperature door is open as it views the universe from a vantage point above the Earth's atmosphere. View provided by the Marshall Space Flight Center (MSFC).
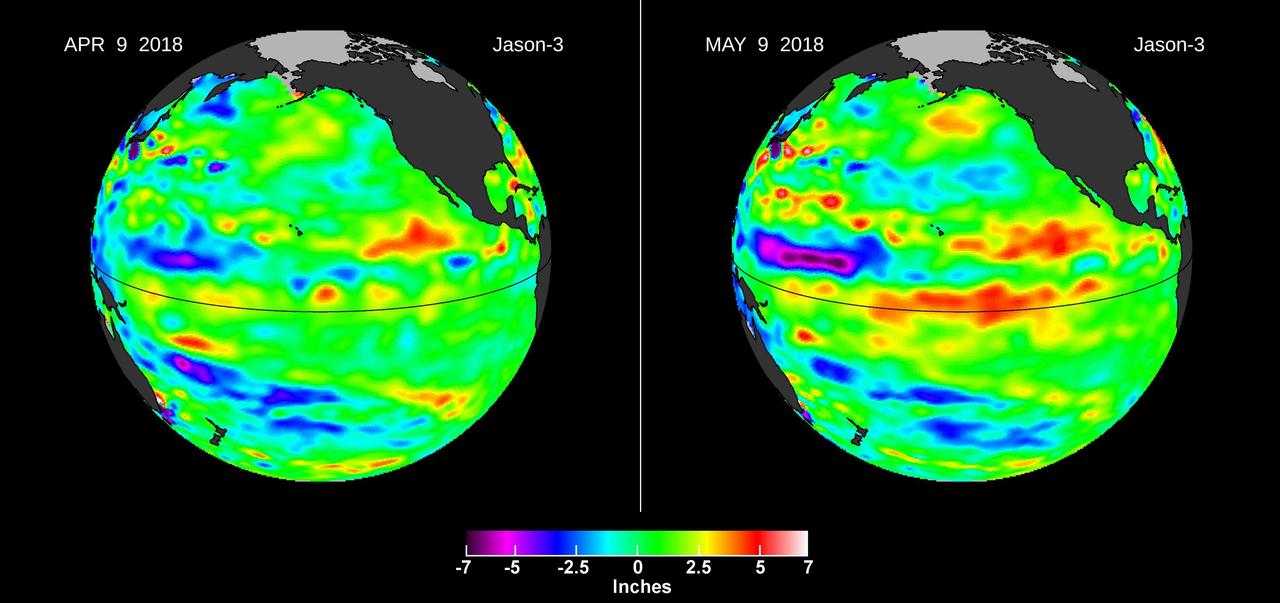
Images from the U.S./European Jason-3 satellite show sea surface height with respect to the seasonal cycle and the long-term trend. Blue/magenta colors indicate lower-than-normal sea levels, while yellow/red colors indicate higher-than-normal sea levels. The April 9, 2018 image (left panel) shows most of the ocean at neutral heights (green). A month later (right panel), a red patch is visible along the equator in the Central Pacific. The red area is a downwelling Kelvin wave, traveling eastward along the equator. https://photojournal.jpl.nasa.gov/catalog/PIA22473
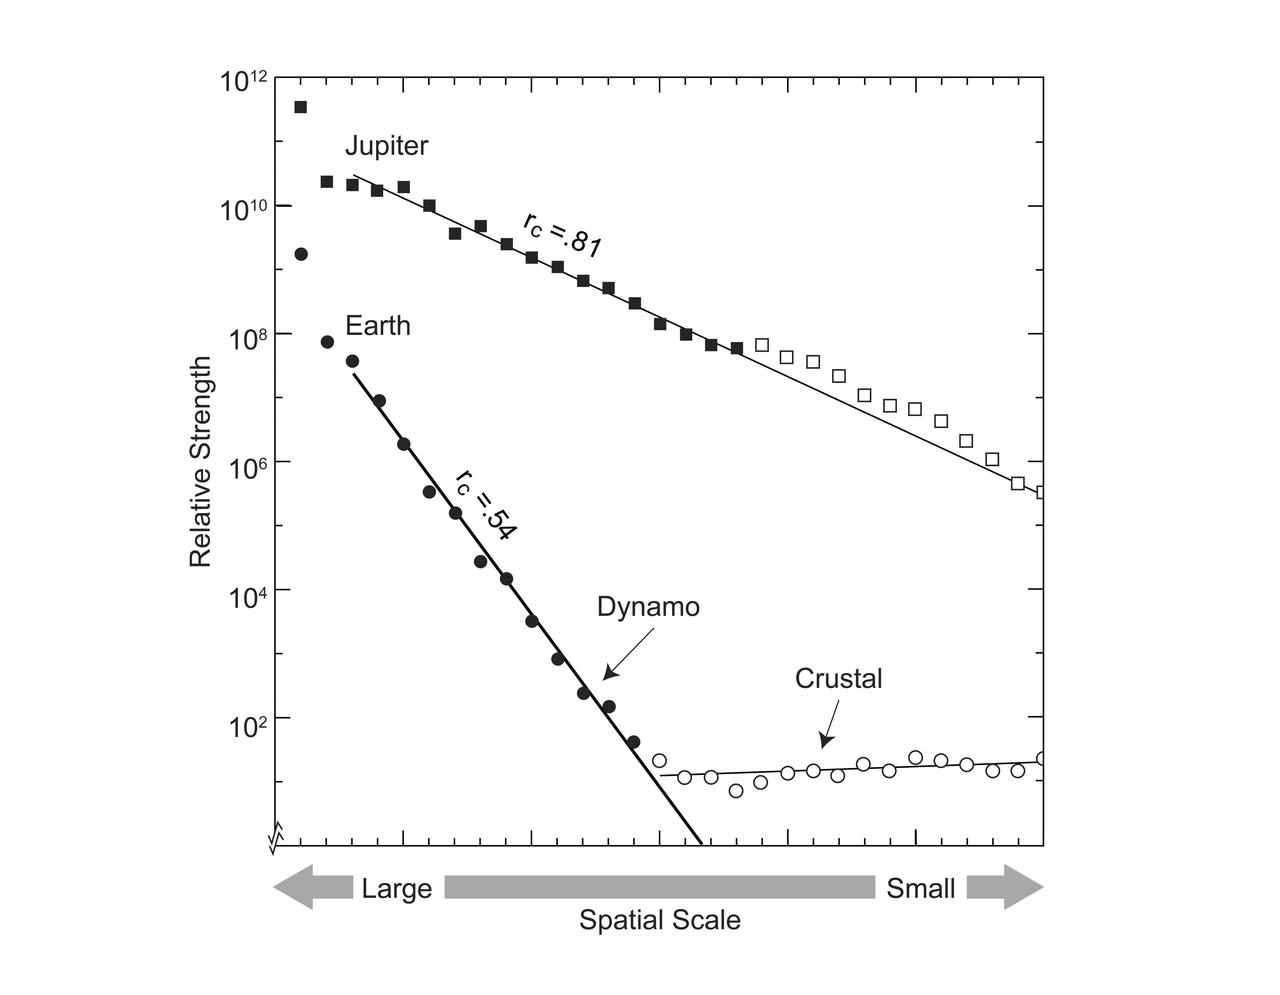
This graphic compares the magnetic fields of Earth and Jupiter, characterizing the field on the surface of each planet in terms of spatial scale, with large scale to the left, and small scale to the right. The linear progression of terms characterizing Earth's field identifies a dynamo core radius at 0.54 planet radius and crustal magnetization at smaller scales. By analogy, the new Jupiter model identifies a dynamo core radius at 0.81 planet radius, in the convective metallic hydrogen just beneath a zone stabilized by helium rain. https://photojournal.jpl.nasa.gov/catalog/PIA25064

This is the first image ever taken of Earth from the surface of a planet beyond the Moon. It was taken by the Mars Exploration Rover Spirit one hour before sunrise on the 63rd martian day, or sol, of its mission. Earth is the tiny white dot in the center. The image is a mosaic of images taken by the rover's navigation camera showing a broad view of the sky, and an image taken by the rover's panoramic camera of Earth. The contrast in the panoramic camera image was increased two times to make Earth easier to see. http://photojournal.jpl.nasa.gov/catalog/PIA05560
STS073-326-021 (20 October - 5 November 1995) --- The darkness of space and the Atlantic coast of southern Africa form the backdrop for this scene. Five NASA astronauts and two guest researchers spent almost 16 days of research in this science module affixed in the payload bay of the Space Shuttle Columbia in Earth-orbit. The tunnel in bottom foreground served as the busy passageway for the seven crew members, who split their forces into two shifts. South Africa and the Cape of Good Hope are the dominant features that can be delineated in the Earth scene.

This is the first image ever taken of Earth from the surface of a planet beyond the Moon. It was taken by the Mars Exploration Rover Spirit one hour before sunrise on the 63rd martian day, or sol, of its mission. The image is a mosaic of images taken by the rover's navigation camera showing a broad view of the sky, and an image taken by the rover's panoramic camera of Earth. The contrast in the panoramic camera image was increased two times to make Earth easier to see. The inset shows a combination of four panoramic camera images zoomed in on Earth. The arrow points to Earth. Earth was too faint to be detected in images taken with the panoramic camera's color filters. http://photojournal.jpl.nasa.gov/catalog/PIA05547
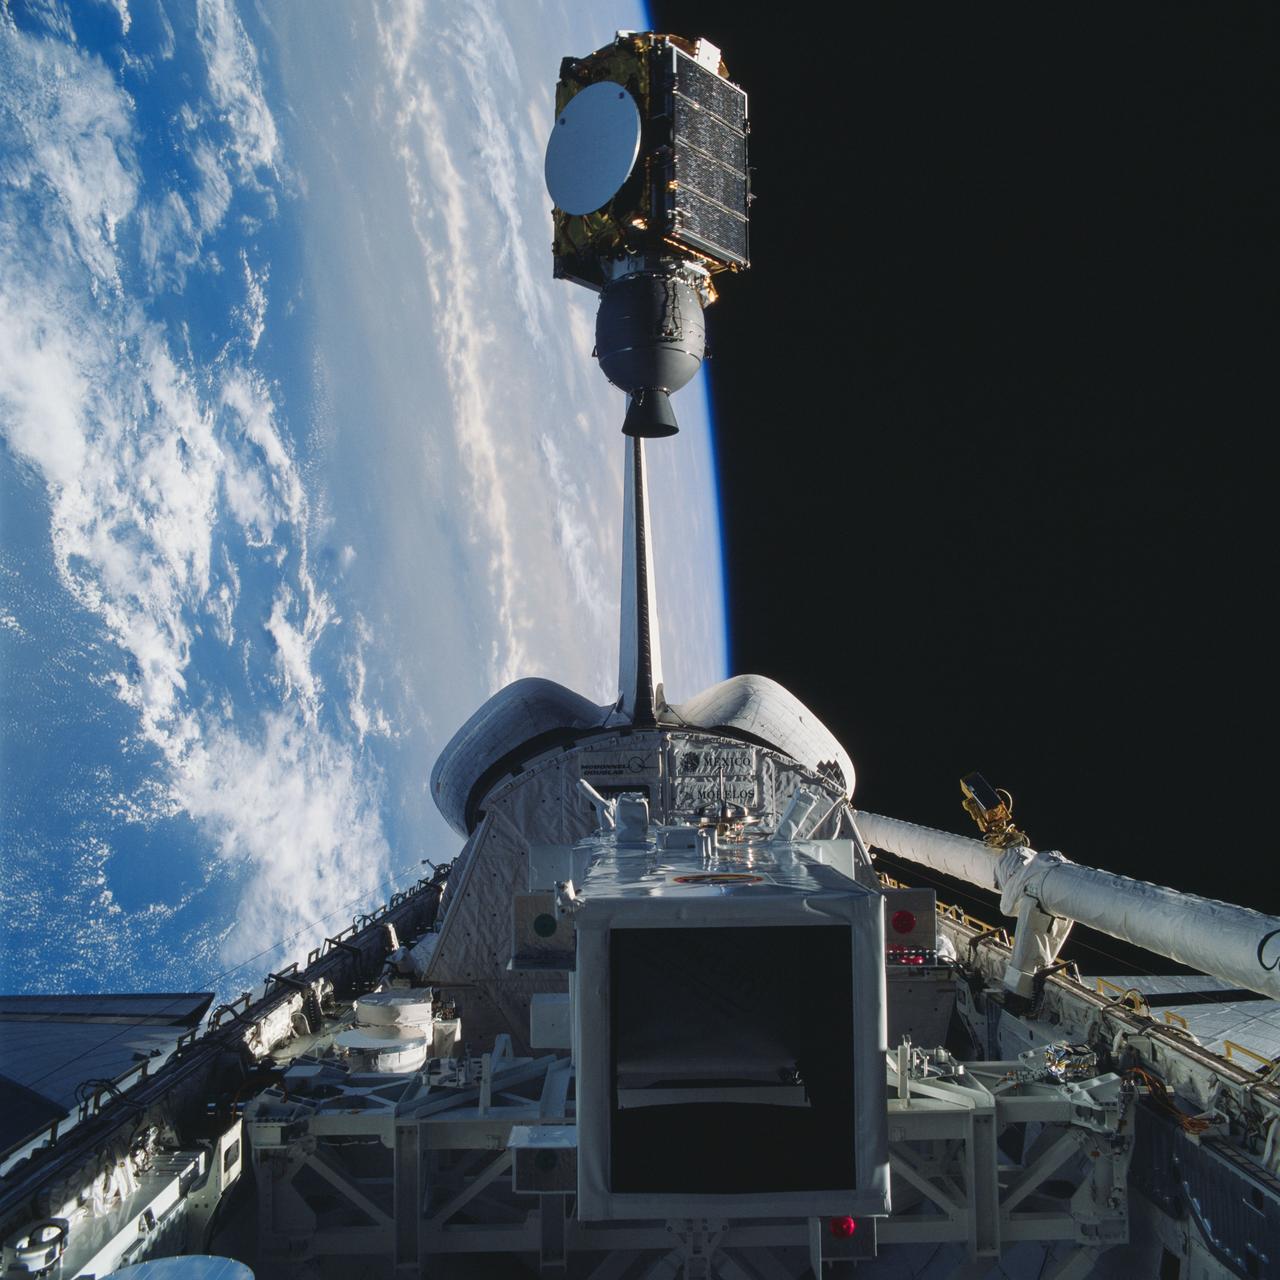
STS030-71-053 (4 May 1989) --- In the early evening hours of Space Shuttle Atlantis’ first day in space for the four-day STS-30 mission, the Magellan spacecraft is released into space to begin its long journey to the planet Venus for an extensive radar mapping mission. The scene was photographed through Atlantis’ aft flight deck windows with a handheld 70mm camera.
AS10-27-3890 (18-26 May 1969) --- A view of Earth rising above the lunar horizon photographed from the Apollo 10 Lunar Module, looking west in the direction of travel. The Lunar Module at the time the picture was taken was located above the lunar farside highlands at approximately 105 degrees east longitude.
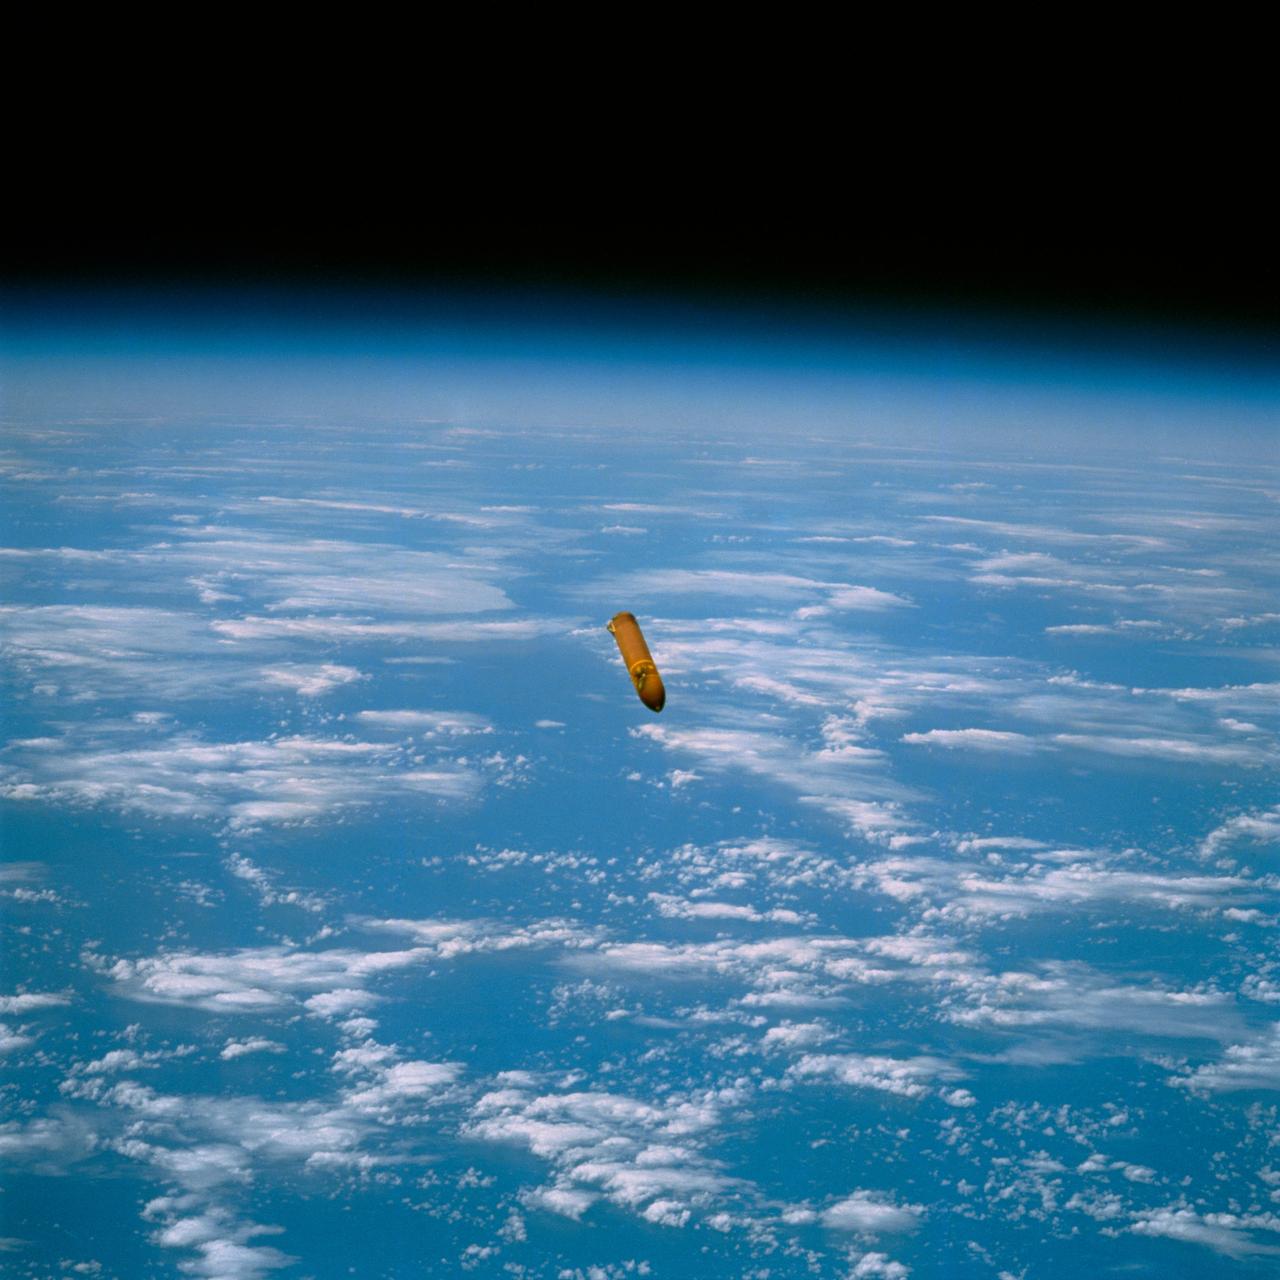
STS029-72-059 (13 March 1989) --- This 70mm photograph, taken by Astronaut James P. Bagian 16 minutes and 7 seconds after liftoff of Discovery, shows the external fuel tank (ET) against the background of Earth. The tank is falling away from the orbiter following ET separation. The left side shows the burn scar above the solid rocket booster (SRB) forward attach point. The burn is caused by the forward SRB separation motors firing during SRB separation. Post 51-L analysis of the thermal and pressure effects of the separation motor exhaust plume indicate that the scarring is not a safety hazard. However, photographs such as this one were requested for additional missions in order to document the phenomenon and corroborate this conclusion. The photo was made at 15:13:07 GMT, March 13, 1989. It was among the visuals used by the crew at its Mar. 28, 1989 post-flight press conference.
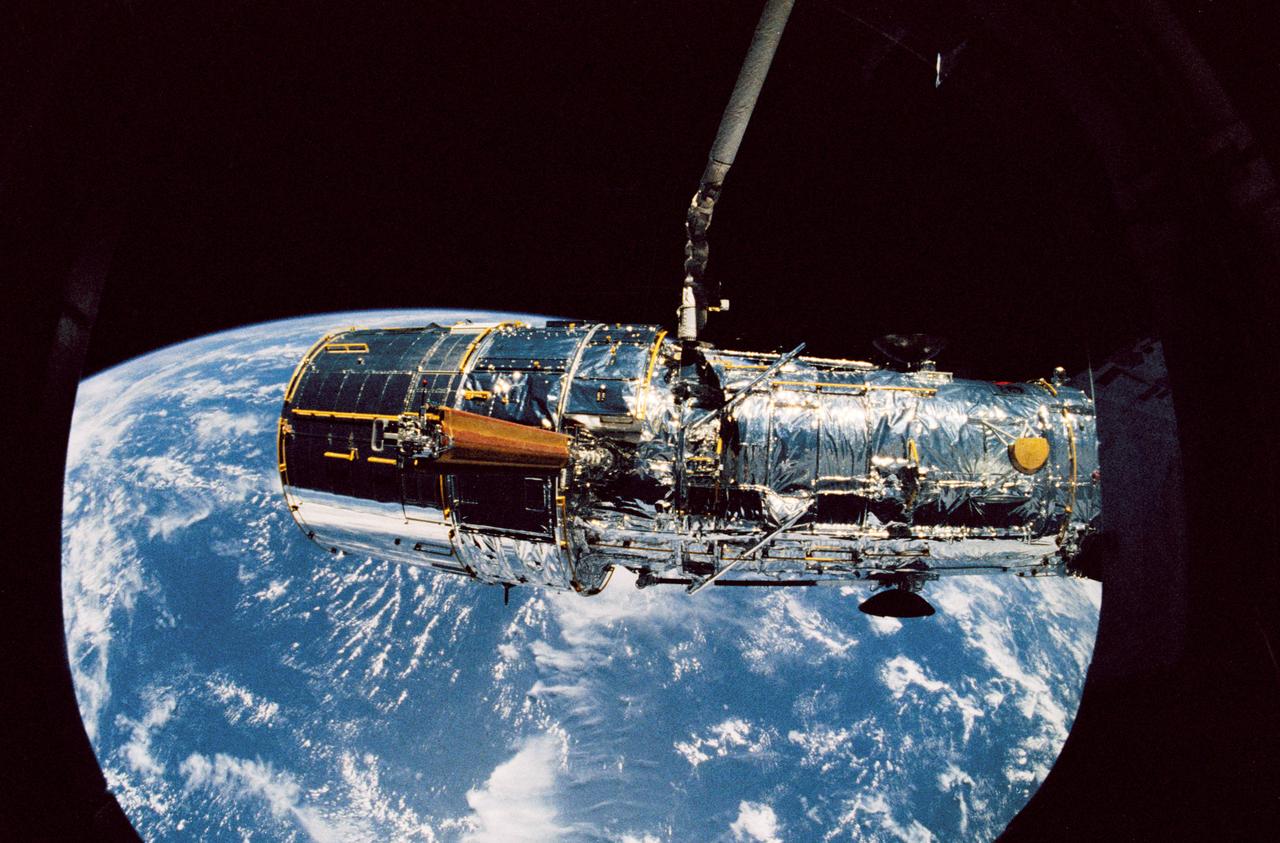
STS031-71-095 (25 April 1990) --- The Hubble Space Telescope (HST) is suspended above Discovery's cargo bay some 332 nautical miles above Earth. The Canadian-built Remote Manipulator System (RMS) arm, controlled from in-cabin by the astronaut crew members of STS-31, held the huge telescope in this position during pre-deployment procedures, which included extension of solar array panels and antennae. The photo was made with a 70mm handheld Hasselblad camera.
STS030-71-052 (4 May 1989) --- In the early evening hours of the Space Shuttle Atlantis' first day in space for the four-day mission, the Magellan spacecraft begins its long journey to the planet Venus for an extensive radar mapping mission. The scene was photographed through Atlantis' aft flight deck windows with a handheld 70mm camera.
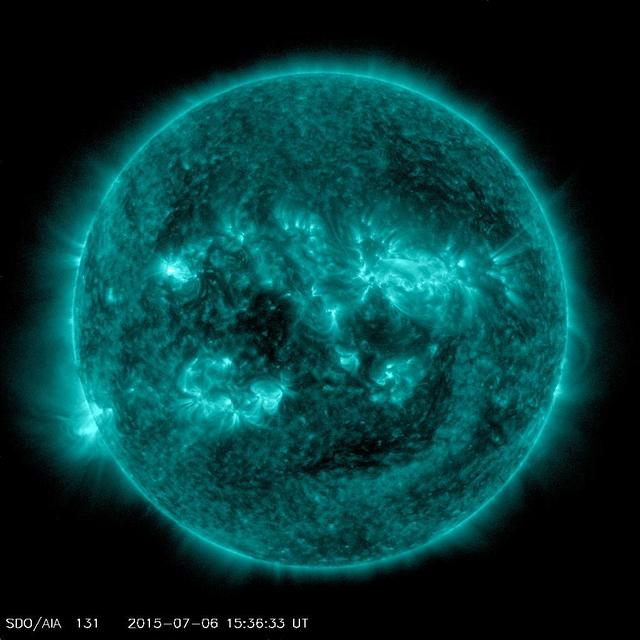
An eruption from the surface of the sun is conspicuous in the lower left portion of this July 6, 2015, image from NASA's Earth-orbiting Solar Dynamics Observatory (SDO). It originates from a location on the surface where NASA's Curiosity Mars rover had been tracking a sunspot in late June and early July. This image was taken by the Atmosphere Imaging Assembly on SDO using the instrument's 131-Angstrom wavelength channel, which is sensitive to hot solar flares. The sun completes a rotation about once a month -- faster near its equator than near its poles. This summer, Mars has a view of the opposite side of the sun from what's facing Earth. Images from Curiosity tracking a southern-hemisphere sunspot until it rotated out of view during the July 4 weekend are in an animation at PIA19801. This location on the sun rotated into position to be seen from Earth a few days later. The eruption visible in this image was linked to a coronal mass ejection observed by SDO and NASA's Solar and Heliospheric Observatory. The coronal mass ejection affected interplanetary space weather, as shown at http://go.nasa.gov/1JSXLF3. http://photojournal.jpl.nasa.gov/catalog/PIA19680
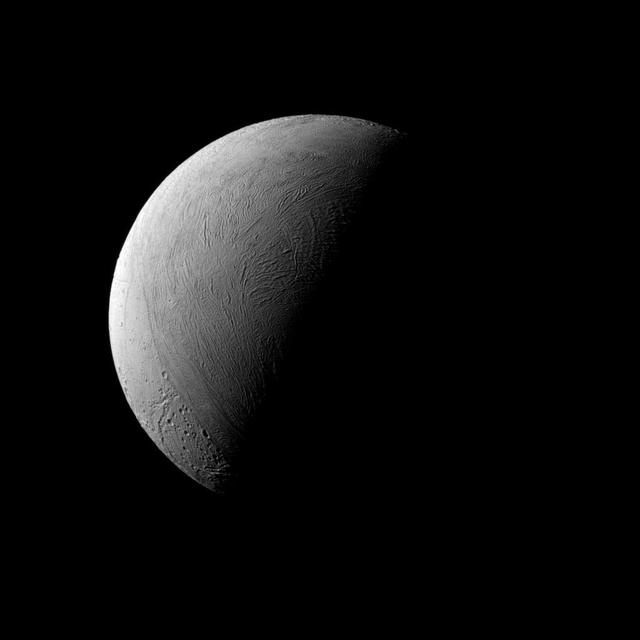
This half-lit view of Enceladus bears a passing resemblance to similar views of Earth's own natural satellite, but the similarities end there. Earth's rocky moon is covered in dark, volcanic basins and brighter, mountainous highlands -- both exceedingly ancient. The surface of icy Enceladus is uniformly bright, far brighter than Earth's moon. Large areas of Enceladus' surface are characterized by youthful (on geologic timescales), wrinkled terrains. Although the north pole of Enceladus (313 miles or 504 kilometers across) was dark when Cassini arrived at Saturn, the march of the seasons at Saturn have brought sunlight to the north and taken it from the south. This view looks toward the leading hemisphere of Enceladus. North on Encealdus is up. The image was taken in visible light with the Cassini spacecraft narrow-angle camera on Sept. 8, 2015. The view was acquired at a distance of approximately 80,000 miles (129,000 kilometers) from Enceladus. Image scale is 2,530 feet (772 meters) per pixel. http://photojournal.jpl.nasa.gov/catalog/PIA18351
Just how dim is the sunlight on Pluto, some three billion miles away? This artist concept of the frosty surface of Pluto with Charon and our sun as backdrops illustrates that while sunlight is much weaker than it is here on Earth, it isnt as dark as you might expect. http://photojournal.jpl.nasa.gov/catalog/PIA19682

This is one of the most detailed views of the surface of Triton taken by NASA Voyager 2 on its flyby of the large satellite of Neptune early in the morning of Aug. 25, 1989. The picture was stored on the tape recorder and relayed to Earth later. http://photojournal.jpl.nasa.gov/catalog/PIA00061
iss058e002448 (Jan. 9, 2019) --- Expedition 58 Commander Oleg Kononenko of Roscosmos is pictured inside the Pirs docking compartment during operations to install gear for the VIZIR earth observation experiment. The study tests the technology of automated coordinate referencing of images of the Earth’s surface, and space, taken by crew members using “free-floating” photography equipment in weightlessness. Credit: Roscosmos

Rob Green, JPL senior research scientist and EMIT (Earth Surface Mineral Dust Source Investigation) principal investigator, participates in a climate conversation at NASA’s Kennedy Space Center in Florida on July 13, 2022, leading up to SpaceX’s 25th Commercial Resupply Services mission for NASA to the International Space Station. The Dragon capsule atop SpaceX’s Falcon 9 rocket is scheduled to lift off from Kennedy’s Launch Complex 39A on July 14 at 8:44 p.m. EDT. Dragon will deliver more than 5,800 pounds of cargo, including a variety of NASA investigations, to the space station.

Rob Green, JPL senior research scientist and EMIT (Earth Surface Mineral Dust Source Investigation) principal investigator, participates in a climate conversation at NASA’s Kennedy Space Center in Florida on July 13, 2022, leading up to SpaceX’s 25th Commercial Resupply Services mission for NASA to the International Space Station. The Dragon capsule atop SpaceX’s Falcon 9 rocket is scheduled to lift off from Kennedy’s Launch Complex 39A on July 14 at 8:44 p.m. EDT. Dragon will deliver more than 5,800 pounds of cargo, including a variety of NASA investigations, to the space station.
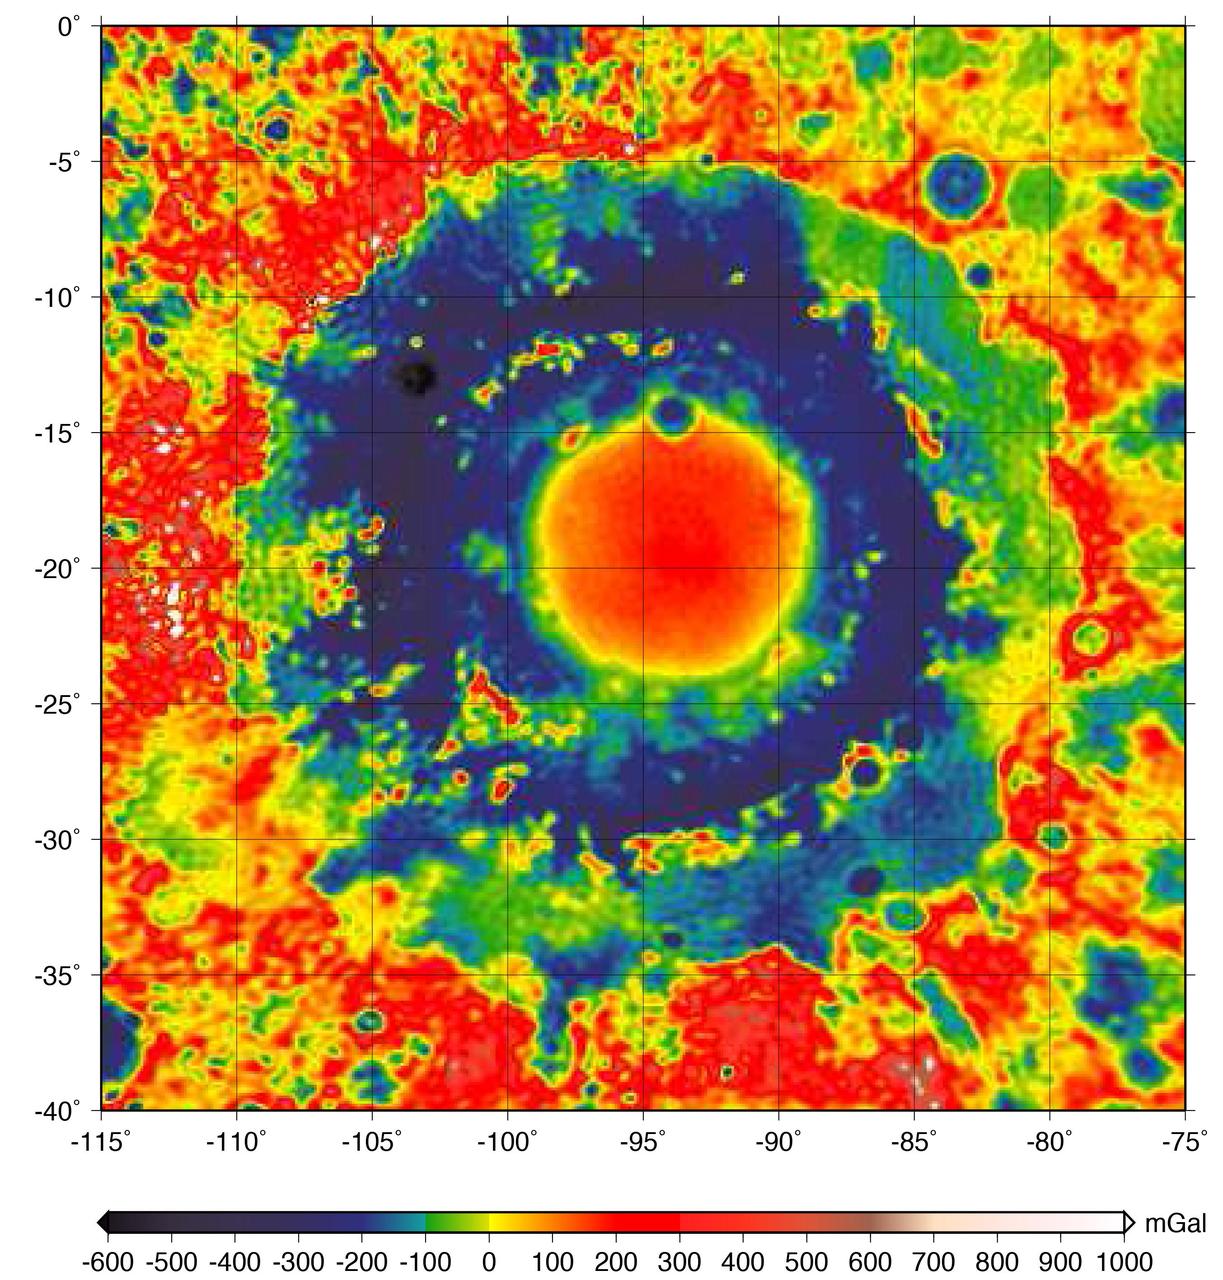
This color-coded map shows the strength of surface gravity around Orientale basin on Earth's moon, derived from data obtained by NASA's GRAIL mission. The GRAIL mission produced a very high-resolution map of gravity over the surface of the entire moon. This plot is zoomed in on the part of that map that features Orientale basin, where the two GRAIL spacecraft flew extremely low near the end of their mission. Their close proximity to the basin made the probes' measurements particularly sensitive to the gravitational acceleration there (due to the inverse squared law). The color scale plots the gravitational acceleration in units of "gals," where 1 gal is one centimeter per second squared, or about 1/1000th of the gravitational acceleration at Earth's surface. (The unit was devised in honor of the astronomer Galileo). Labels on the x and y axes represent latitude and longitude. http://photojournal.jpl.nasa.gov/catalog/PIA21050
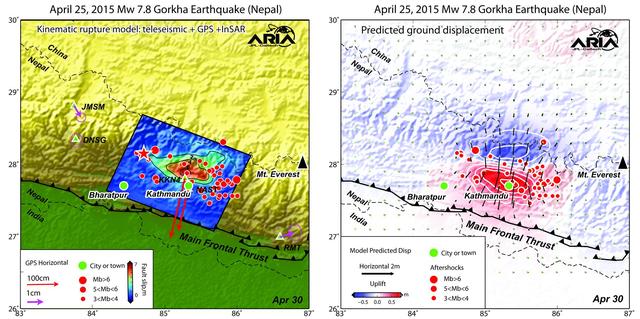
Using a combination of GPS-measured ground motion data, satellite radar data, and seismic observations from instruments distributed around the world, scientists have constructed preliminary estimates of how much the fault responsible for the April 25, 2015, magnitude 7.8 Gorkha earthquake in Nepal moved below Earth's surface (Figure 1). This information is useful for understanding not only what happened in the earthquake but also the potential for future events. It can also be used to infer a map of how Earth's surface moved due to the earthquake over a broader region (Figure 2). The maps created from these data can be viewed at PIA19384. In the first figure, the modeled slip on the fault is shown as viewed from above and indicated by the colors and contours within the rectangle. The peak slip in the fault exceeds 19.7 feet (6 meters). The ground motion measured with GPS is shown by the red and purple arrows and was used to develop the fault slip model. In the second figure, color represents vertical movement and the scaled arrows indicate direction and magnitude of horizontal movement. In both figures, aftershocks are indicated by red dots. Background color and shaded relief reflect regional variations in topography. The barbed lines show where the main fault reaches Earth's surface. The main fault dives northward into the Earth below the Himalaya. http://photojournal.jpl.nasa.gov/catalog/PIA19384
AS17-134-20473 (13 Dec. 1972) --- Earth appears in the far distant background above the hi-gain antenna of the Lunar Roving Vehicle in this photograph taken by scientist-astronaut Harrison H. Schmitt during the third Apollo 17 extravehicular activity (EVA) at the Taurus-Littrow landing site. Astronaut Eugene A. Cernan, Apollo 17 commander, stands beside the LRV. Schmitt is the mission's lunar module pilot. While Cernan and Schmitt descended in the lunar module "Challenger" to explore the moon, astronaut Ronald E. Evans, command module pilot, remained with the Command and Service Modules in lunar orbit.

This concept illustrates Skylab Earth observation studies, an Earth Resources Experiment Package (EREP). EREP was designed to explore the use of the widest possible portion of the electromagnetic spectrum for Earth resource investigations with sensors that recorded data in the visible, infrared, and microwave spectral regions. Resources subject to this study included a capability of mapping Earth resources and land uses, crop and forestry cover, health of vegetation, types of soil, water storage in snow pack, surface or near-surface mineral deposits, sea surface temperature, and the location of likely feeding areas for fish, etc. A significant feature of EREP was the ability of man to operate the sensors in a laboratory fashion.
This gamma ray spectrometer map from NASA Mars Odyssey of the mid-latitude region of Mars is based on gamma-rays from the element iron, one of the most abundant elements on Mars and Earth. It is responsible for the red color on the surface of Mars.

This satellite interferometric synthetic aperture radar image using COSMO-SkyMed radar data, depicts the relative deformation of Earth surface at Kilauea between Feb. 11, 2011 and March 7, 2011 two days following the start of the current eruption.
This image from NASA Dawn spacecraft shows the sun illuminating the landscape of asteroid Vesta during a Vestan unrise; the sun had a low angle relative to Vesta surface, just as the sun has a low angle in the sky in the morning on Earth.
Within that narrow window during a solar eclipse where one on Earth can watch the Moon shadow obscure more than 90% of the Sun, NASA Terra spacecraft captured these views of the Antarctic surface during the total solar eclipse of November 23, 2003.
Artist impression of NASA MErcury Surface, Space ENvironment, GEochemistry, and Ranging MESSENGER spacecraft as it leaves Earth, following its Aug. 3, 2004 launch from Cape Canaveral Air Force Station, Fla. aboard a Delta II rocket.
In this image, Europa is seen in a cutaway view through two cycles of its 3.5 day orbit about the giant planet Jupiter. Like Earth, Europa is thought to have an iron core, a rocky mantle and a surface ocean of salty water. Animation available at the Photo
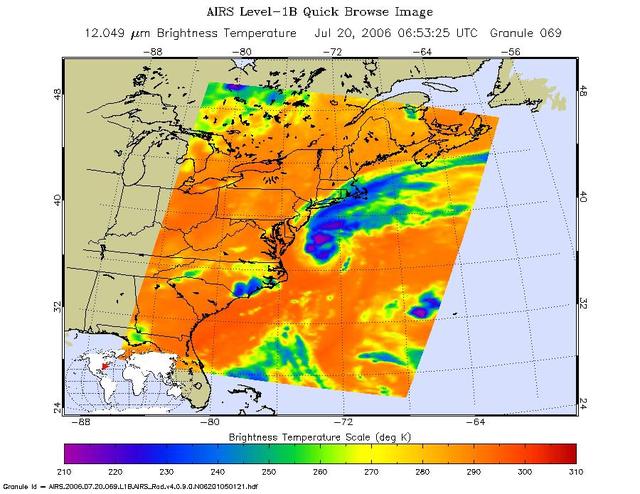
This is an AIRS infrared image of Tropical Storm Beryl in the western Atlantic, from the NASA Aqua satellite on July 20, 2006, 1:30 am local time. The image shows the temperature of the cloud tops or the surface of the Earth in cloud-free regions.

A climate conversation is held at NASA’s Kennedy Space Center in Florida on July 13, 2022, leading up to SpaceX’s 25th Commercial Resupply Services mission for NASA to the International Space Station. Participants, from left are Moderator Tylar Greene, NASA Communications; Kate Calvin, NASA’s chief scientist and climate advisor; Heidi Parris, associate scientist, International Space Station Program; Mike Roberts, chief scientist, ISS National Lab; Rob Green, JPL senior research scientist and EMIT (Earth Surface Mineral Dust Source Investigation) principal investigator; and Paula do Vale Pereira, BeaverCube, Massachusetts Institute of Technology. The Dragon capsule atop SpaceX’s Falcon 9 rocket is scheduled to lift off from Kennedy’s Launch Complex 39A on July 14 at 8:44 p.m. EDT. Dragon will deliver more than 5,800 pounds of cargo, including a variety of NASA investigations, to the space station.

A climate conversation is held at NASA’s Kennedy Space Center in Florida on July 13, 2022, leading up to SpaceX’s 25th Commercial Resupply Services mission for NASA to the International Space Station. Participants, from left are Moderator Tylar Greene, NASA Communications; Kate Calvin, NASA’s chief scientist and climate advisor; Heidi Parris, associate scientist, International Space Station Program; Mike Roberts, chief scientist, ISS National Lab; Rob Green, JPL senior research scientist and EMIT (Earth Surface Mineral Dust Source Investigation) principal investigator; and Paula do Vale Pereira, BeaverCube, Massachusetts Institute of Technology. The Dragon capsule atop SpaceX’s Falcon 9 rocket is scheduled to lift off from Kennedy’s Launch Complex 39A on July 14 at 8:44 p.m. EDT. Dragon will deliver more than 5,800 pounds of cargo, including a variety of NASA investigations, to the space station.
This computer generated image depicts a view of Earth as seen from the surface of the asteroid Toutatis on Nov 29th 1996. A 2.5 degree field-of-view synthetic computer camera was used for this simulation. Toutatis is visible on this date as a twelfth magnitude object in the night sky in the constellation of Virgo and could be viewed with a medium sized telescope. Toutatis currently approaches Earth once every four years and, on Nov. 29th, 1996 will be 5.2 million kilometers away (approx. 3.3 million miles). In approximately 8 years, on Sept. 29th, 2004, it will be less than 1.6 million kilometers from Earth. This is only 4 times the distance to the moon, and is the closest approach predicted for any known asteroid or comet during the next 60 years. http://photojournal.jpl.nasa.gov/catalog/PIA00515
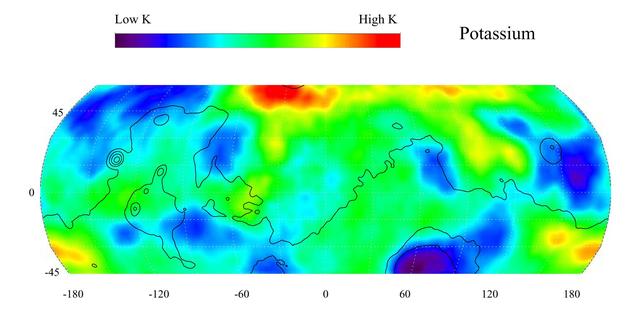
This gamma ray spectrometer map of the mid-latitude region of Mars is based on gamma-rays from the element potassium. Potassium, having the chemical symbol K, is a naturally radioactive element and is a minor constituent of rocks on the surface of both Mars and Earth. The region of highest potassium content, shown in red, is concentrated in the northern part of Acidalia Planitia (centered near 55 degrees N, -30 degrees). Several areas of low potassium content, shown in blue, are distributed across the mid-latitudes, with two significant low concentrations, one associated with the Hellas Basin (centered near 35 degrees S, 70 degrees) and the other lying southeast of Elysium Mons (centered near 10 degrees N, 160 degrees). Contours of constant surface elevation are also shown. The long continuous line running from east to west marks the approximate separation of the younger lowlands in the north from the older highlands in the south. http://photojournal.jpl.nasa.gov/catalog/PIA04255
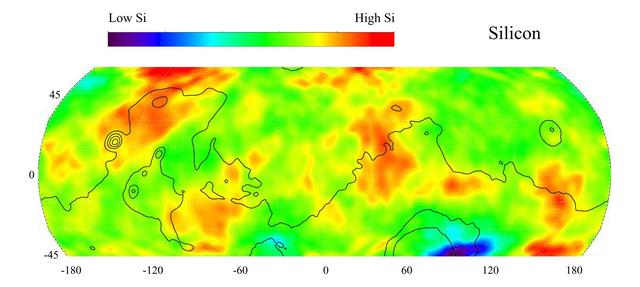
This gamma ray spectrometer map of the mid-latitude region of Mars is based on gamma-rays from the element silicon. Silicon is one of the most abundant elements on the surface of both Mars and Earth (second only to oxygen). The most extensive region of highest silicon content, shown in red, is located in the high latitudes north of Tharsis (centered near 45 degrees latitude, -120 degrees longitude). The area of lowest silicon content, shown in blue, lies just to the east of the Hellas Basin (-45 degrees latitude, 90 degrees longitude). Contours of constant surface elevation are also shown. The long continuous contour line running from east to west marks the approximate separation of the younger lowlands in the north from the older highlands in the south. http://photojournal.jpl.nasa.gov/catalog/PIA04256

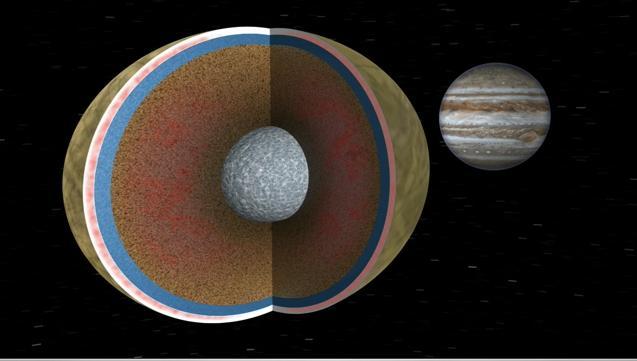
Scientists believe that under the icy surface of Jupiter's moon Europa a saltwater ocean exists that may contain more than twice as much liquid water as all of Earth's oceans combined. This artist's concept (not to scale) depicts what Europa's internal structure could look like: an outer shell of ice, perhaps with plumes of material venting from beneath the surface; a deep, global layer of liquid water; and a rocky interior, potentially with hydrothermal vents on the seafloor. The true nature of Europa's inner structure will be examined by NASA's Europa Clipper mission, which is scheduled to arrive at Jupiter in 2030. Europa Clipper's three main science objectives are to determine the thickness of the moon's icy shell and its interactions with the ocean below, to investigate its composition, and to characterize its geology. The mission's detailed exploration of Europa will help scientists better understand the astrobiological potential for habitable worlds beyond our planet. https://photojournal.jpl.nasa.gov/catalog/PIA26438
Arabsat communications satellite deploying from Discovery's payload bay. Cloudy Earth's surface can be seen to the left of the frame.