
Hematite Abundance Map at Echo
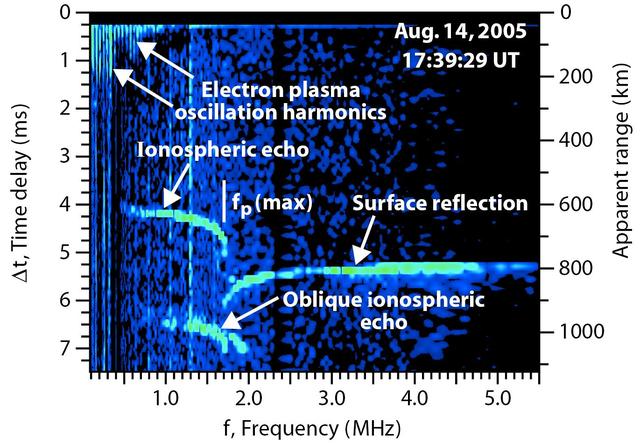
Radar Ionogram with Oblique Ionospheric Echo

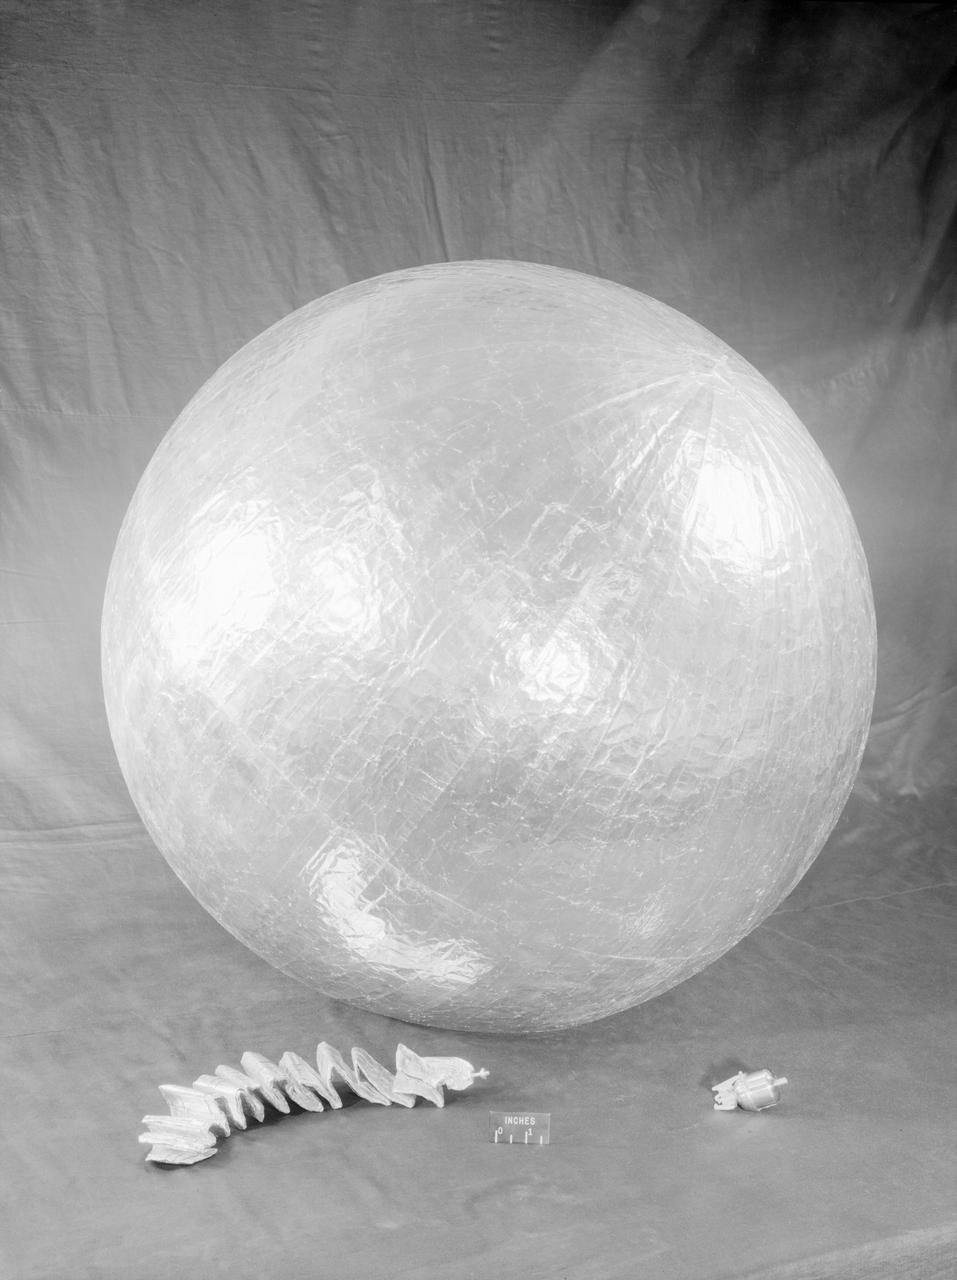
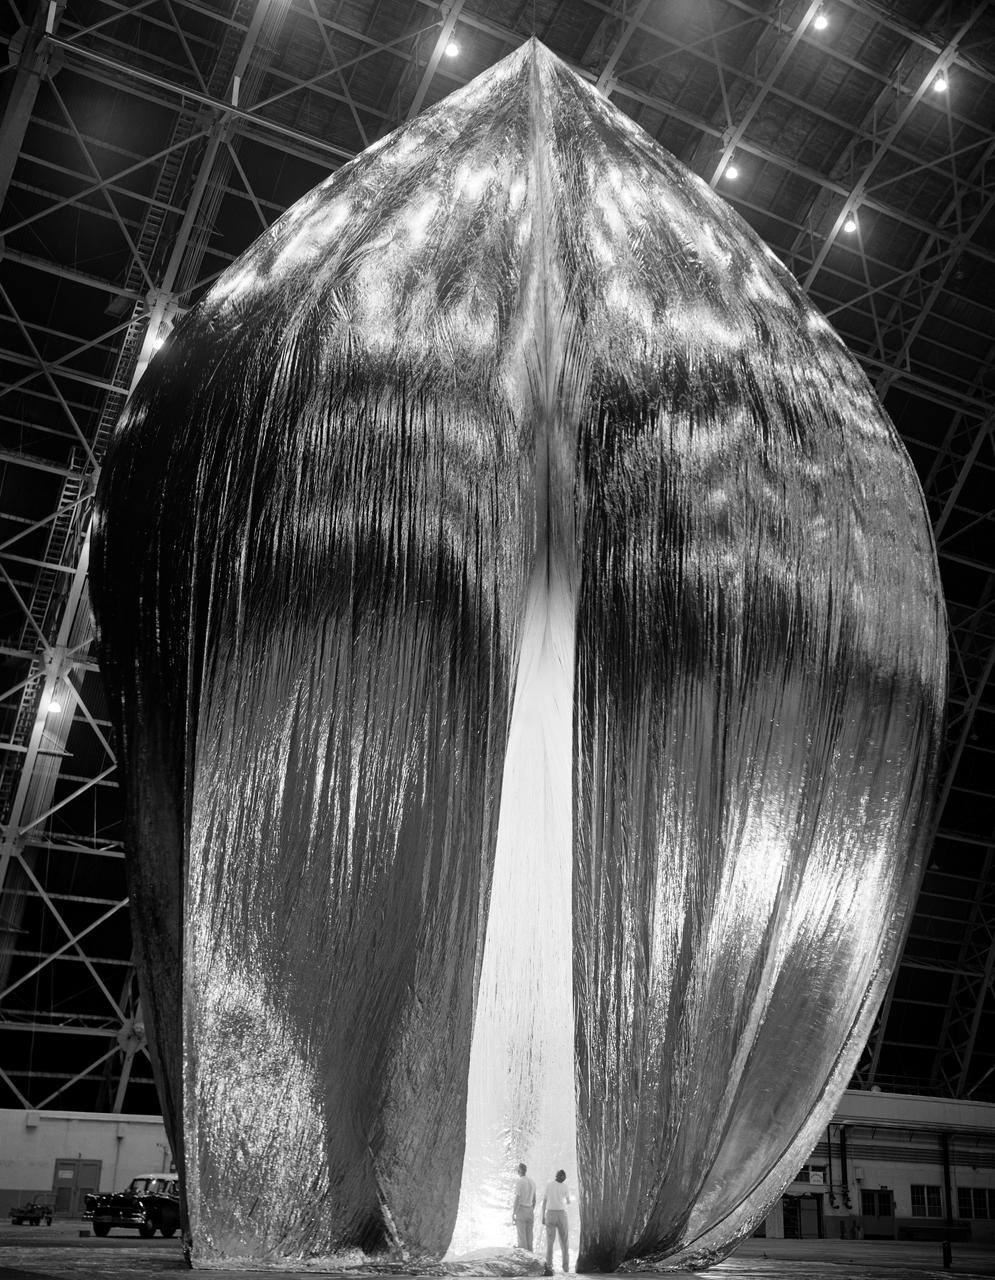
100' Satellite Packaging of Echo
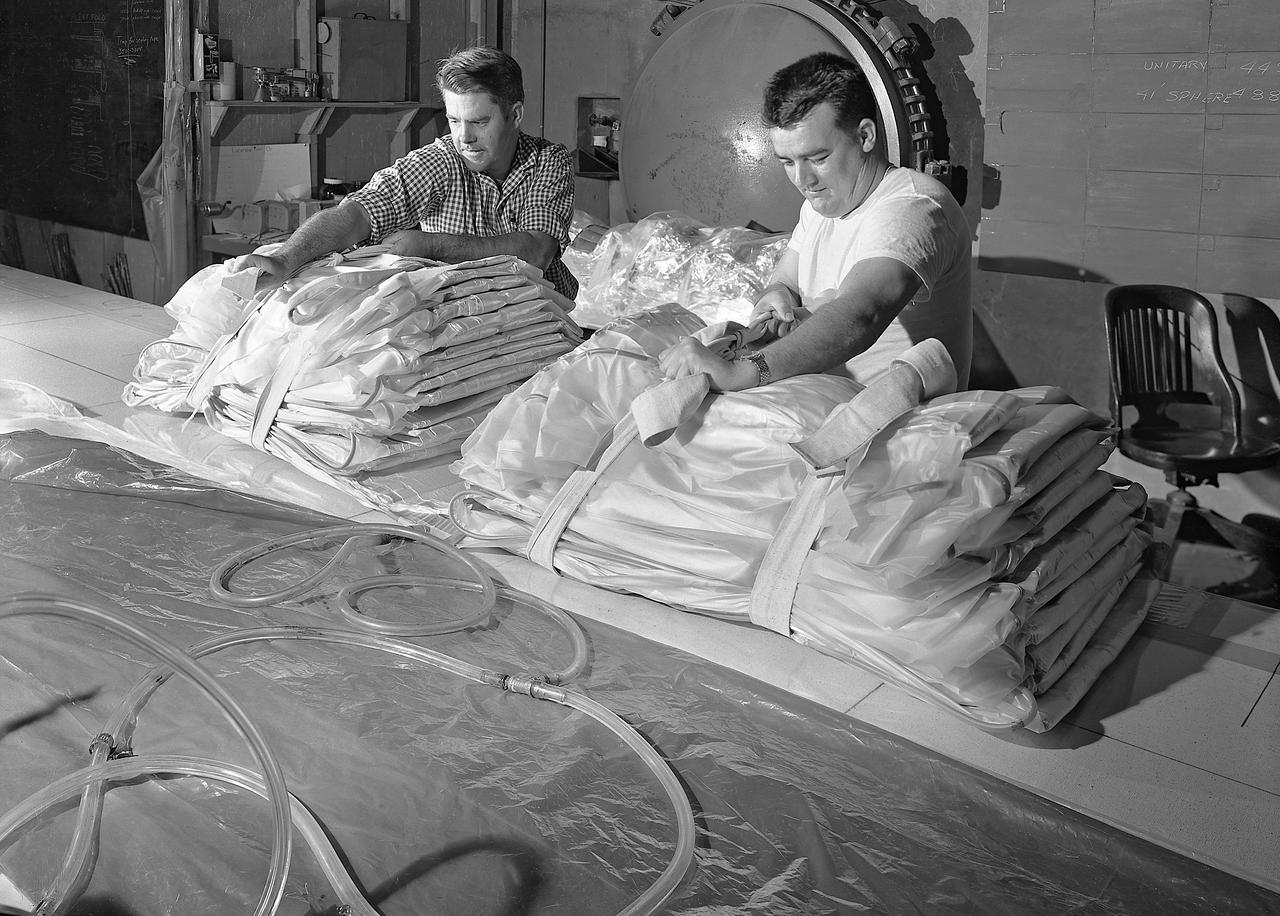
100' Satellite Packaging of Echo
100' Satellite Packaging of Echo

100' Satellite Packaging of Echo

100' Satellite Packaging of Echo

100' Satellite Packaging of Echo
100' Satellite Packaging of Echo
100' Satellite Packaging of Echo
100' Satellite Packaging of Echo
100' Satellite Packaging of Echo
100' Satellite Packaging of Echo
Echo Satellite
Echo Satellite
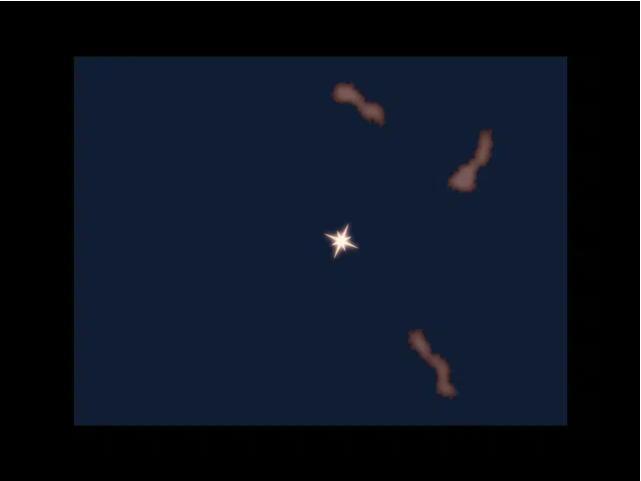
This image illustrates how a light echo works, and how an optical illusion of material moving outward is created.
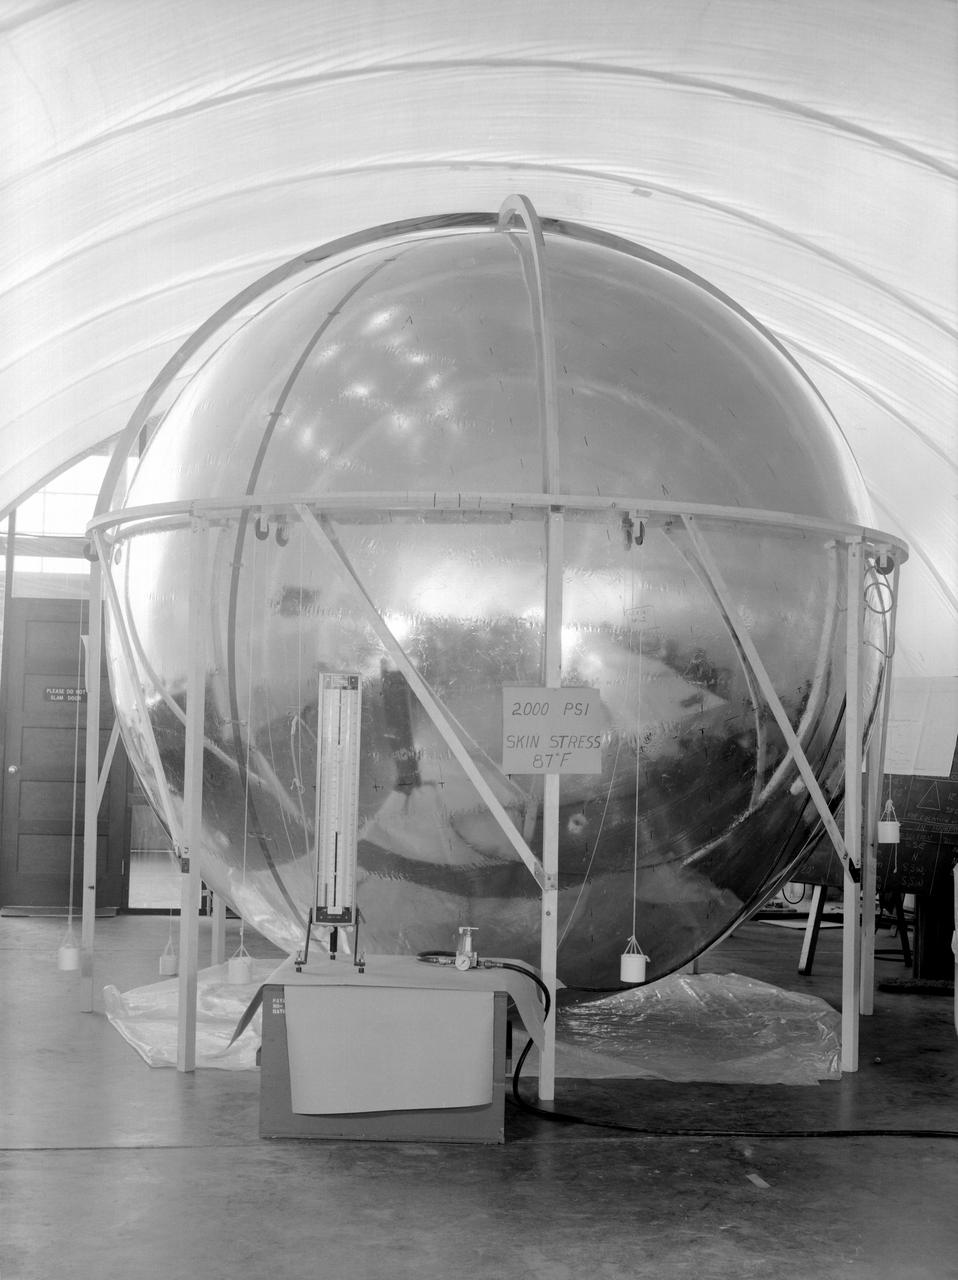
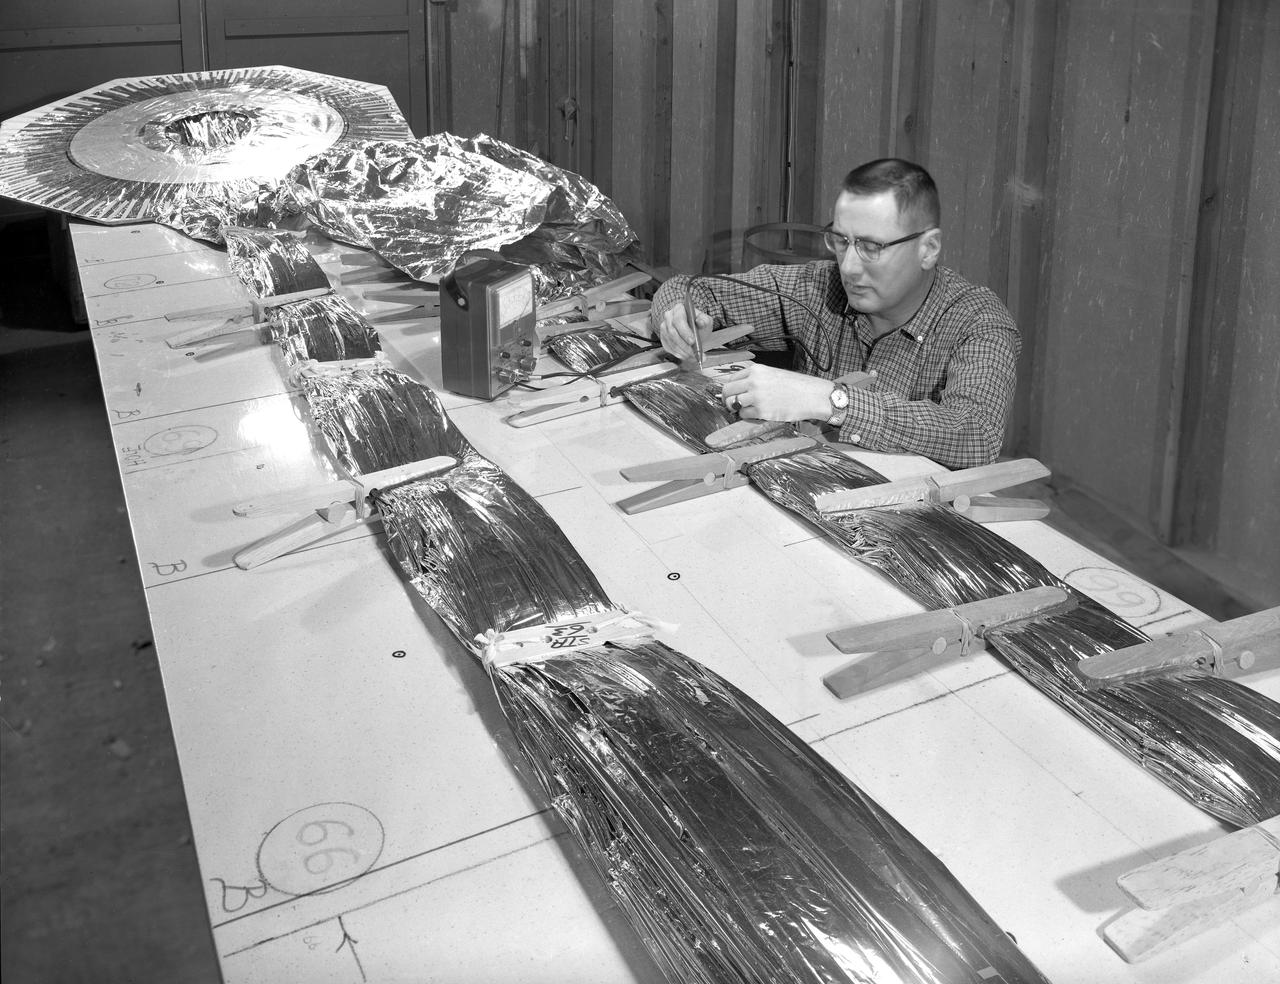
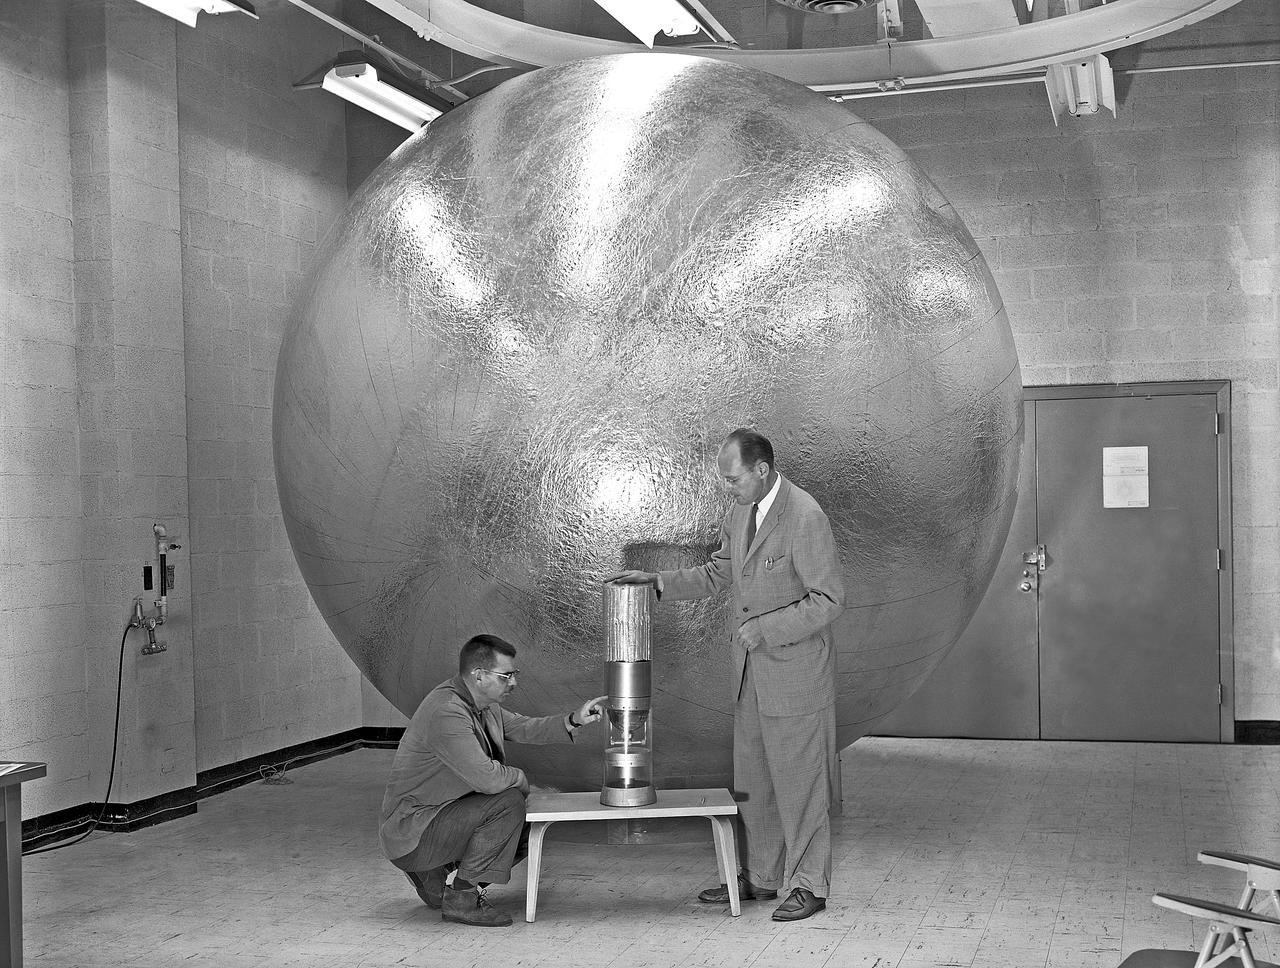
Photographed in 1960. -- Skin Stress Test of the 12-foot satellite built as a prototype of the full-scale Echo satellite. The 12-foot diameter of the sphere was chosen because that was the ceiling height in the Langley model shop. The proposal to build the 12-foot satellite was made in November 1957. -- Published in James R. Hansen, Spaceflight Revolution: NASA Langley Research Center From Sputnik to Apollo, NASA SP-4308, pp. 170-171.
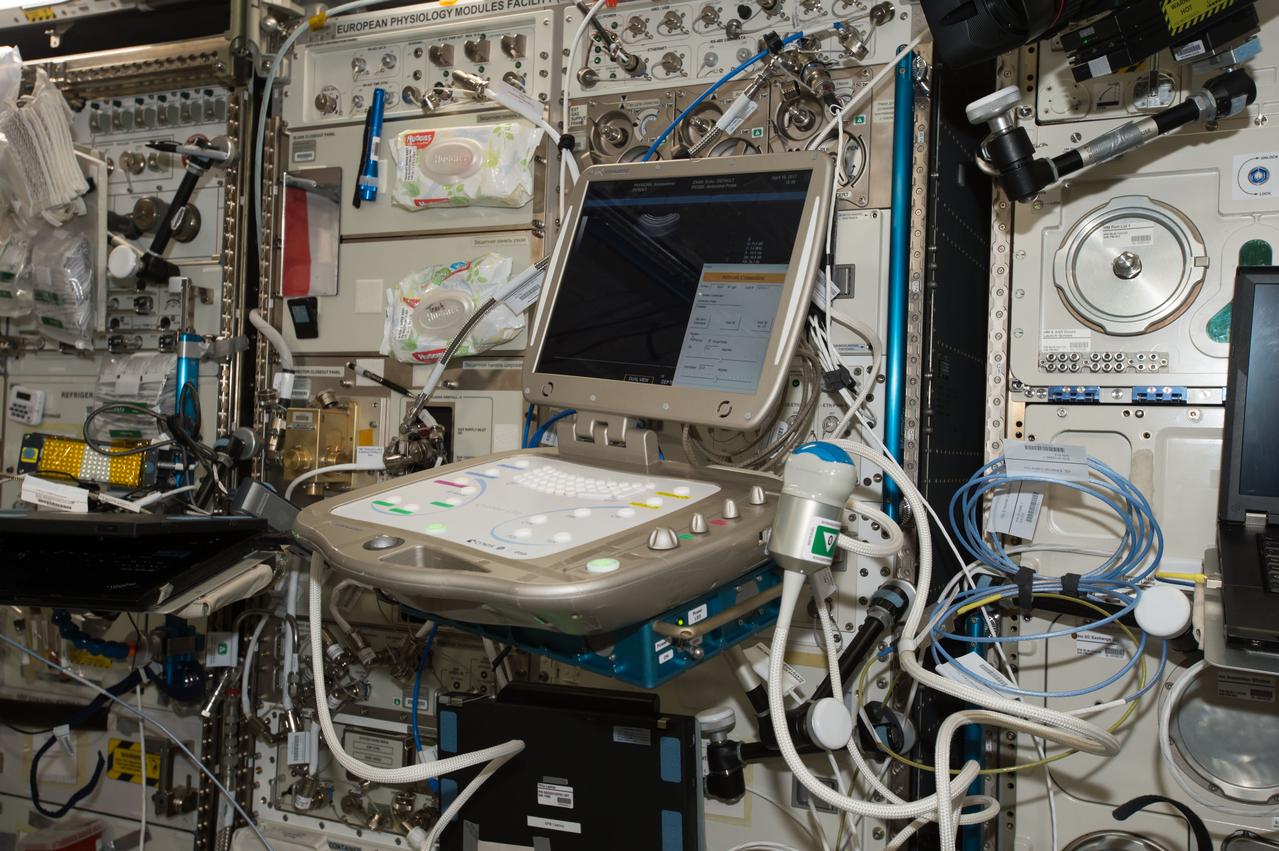
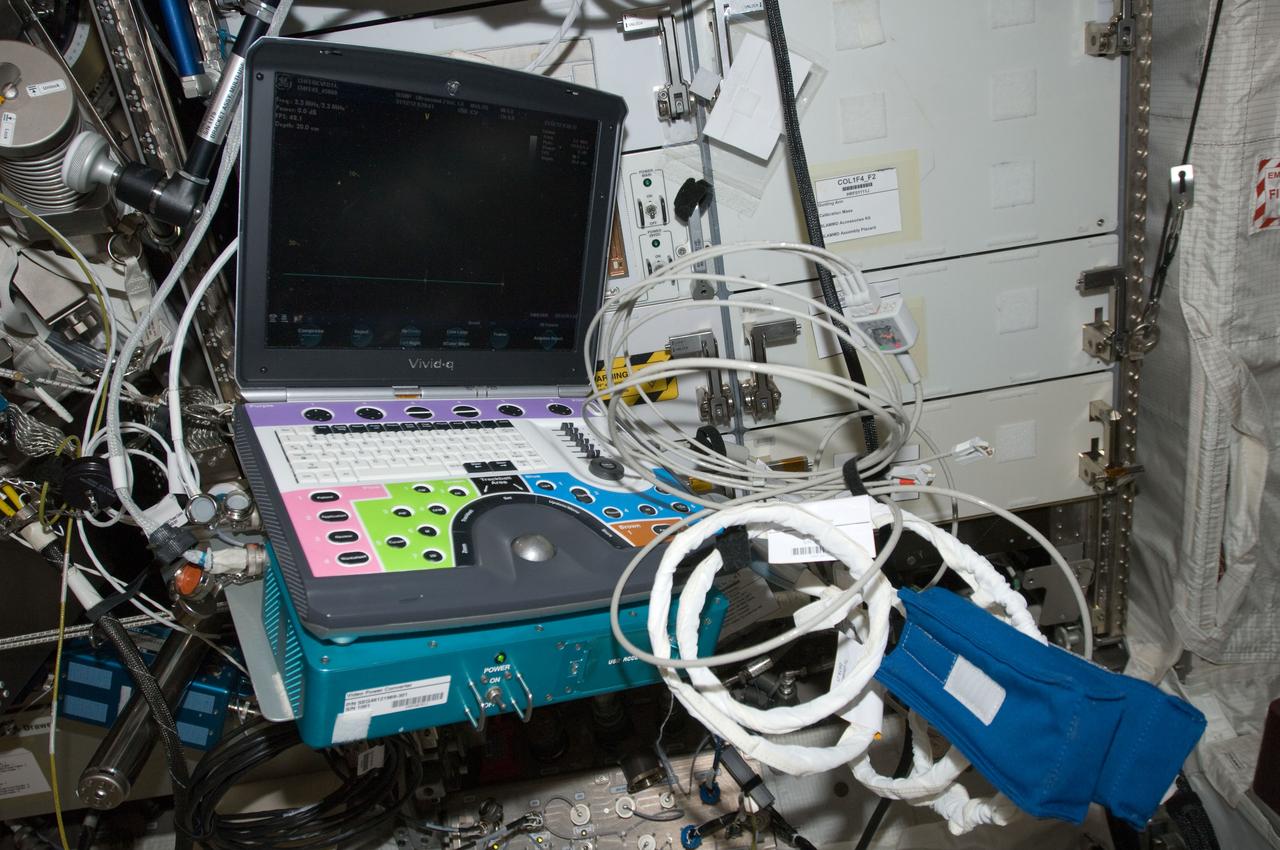
iss051e018997 (4/18/2017) --- Photo documentation of the Echo Unit during setup for Echo experiment commissioning operations (OPS) in the Columbus module aboard the International Space Station (ISS). The purpose of the ECHO investigation is to evaluate a tele-operated ultrasound system, equipped with motorized probes that are controlled by flight controllers on the ground. Additionally, this investigation serves to perform the commissioning of the Echo instrument, which is planned to be used for the Vascular Echo experiment in the future.
Bright Lower Echo in Radargram of South Polar Layered Deposits
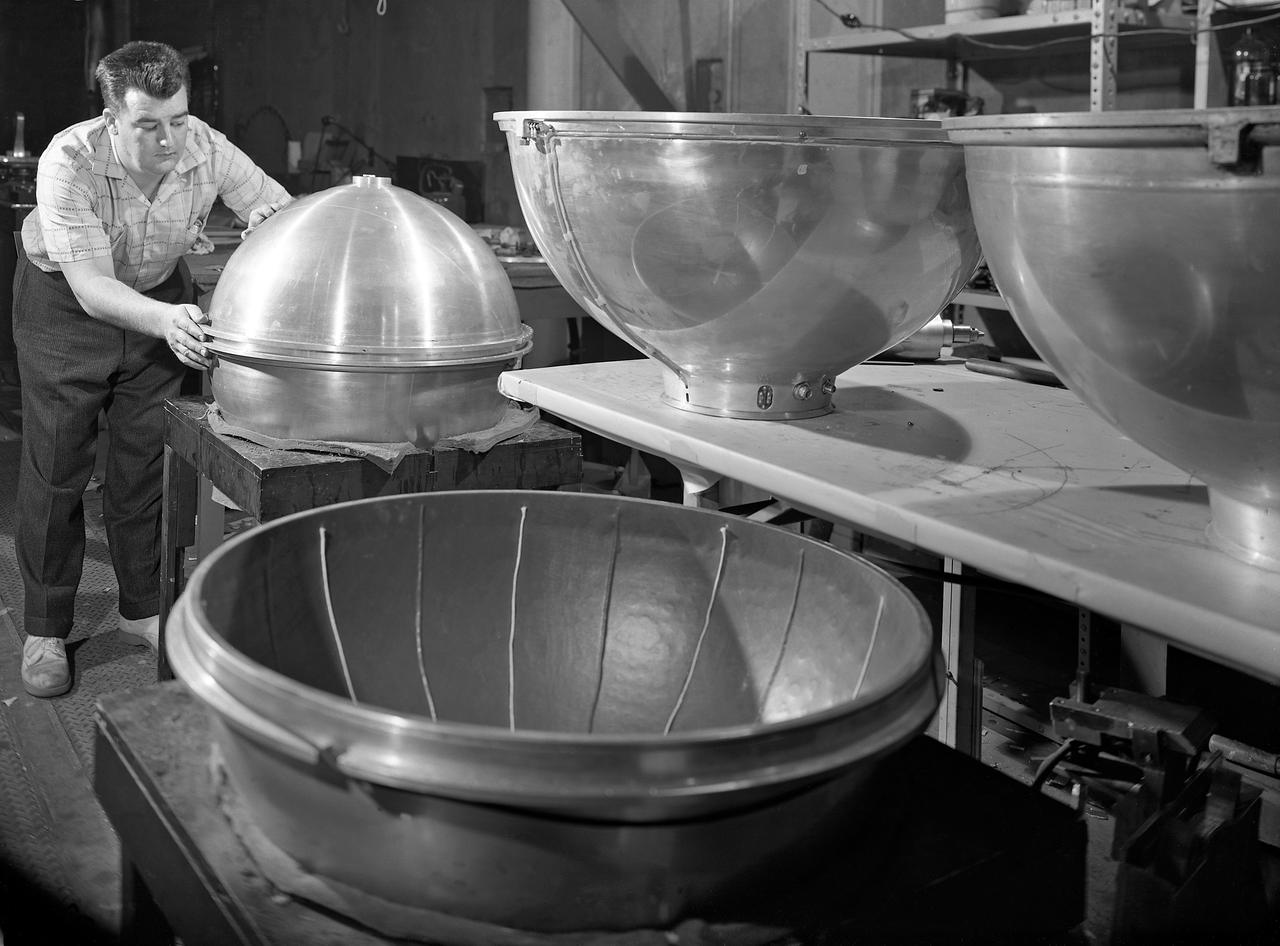
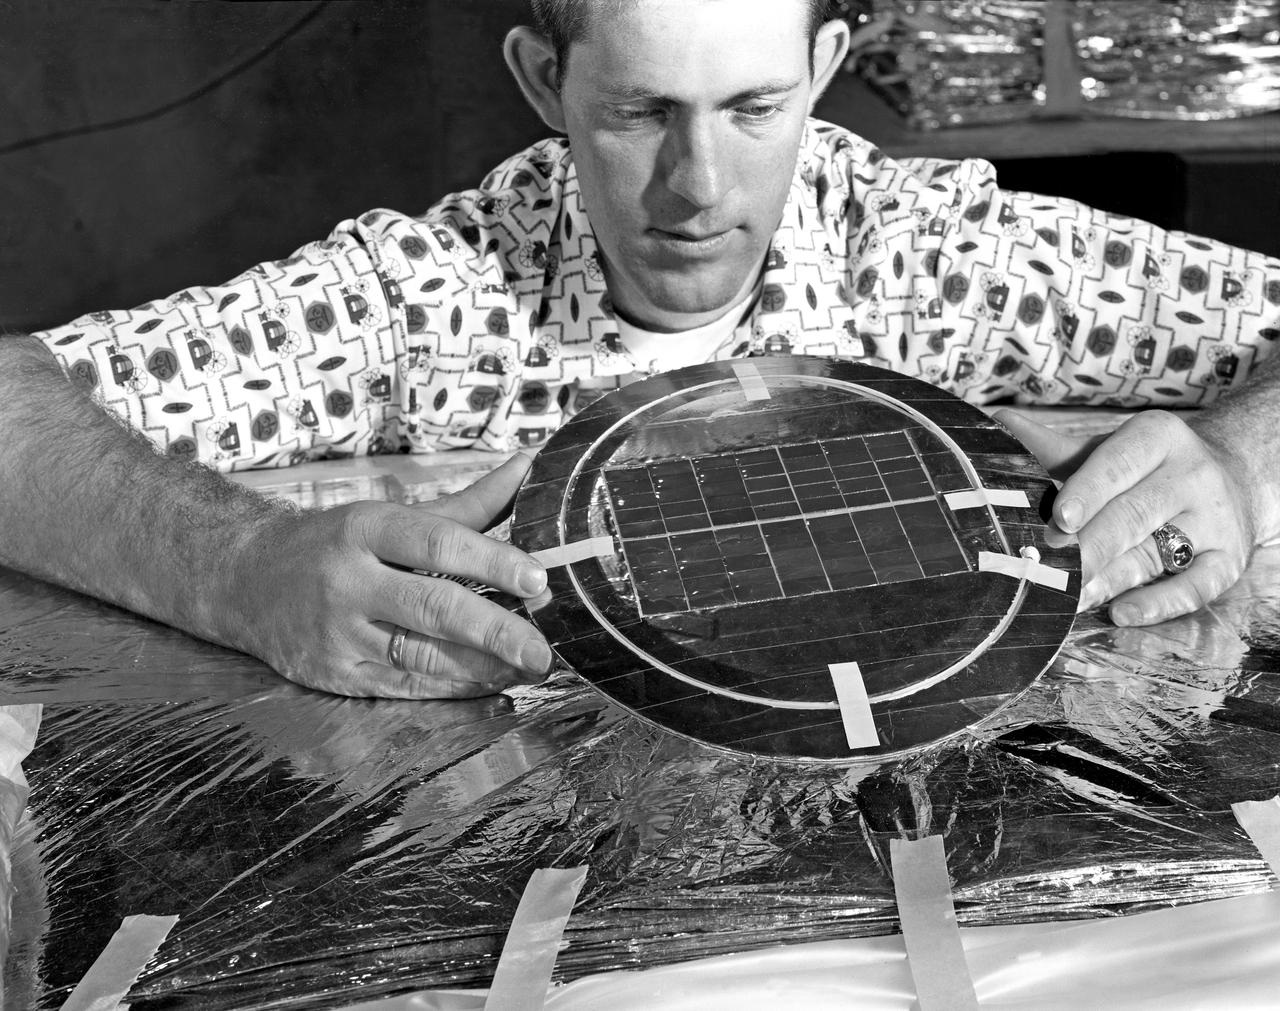
James Hansen describes the work on Project Echo s air density experiment known as the Sub-Satellite. Before launch engineers subjected the sub-satellite to many tests. Here, the sub-satellite is shown prior to tests to determine the capacity of the 30-inch Sub-Satellite to withstand the high temperature of direct sunlight in space, Langley researchers subjected it to 450 F heat test. Results indicated that the aluminum-covered Mylar plastic would effectively reflect the dangerous heat. -- Published in James R. Hansen, Spaceflight Revolution: NASA Langley Research Center From Sputnik to Apollo, NASA SP-4308, p. 168.
This composite image from NASA Spitzer Space Telescope shows the remnant of a star that exploded, called Cassiopeia A center and its surrounding light echoes -- dances of light through dusty clouds, created when stars blast apart.
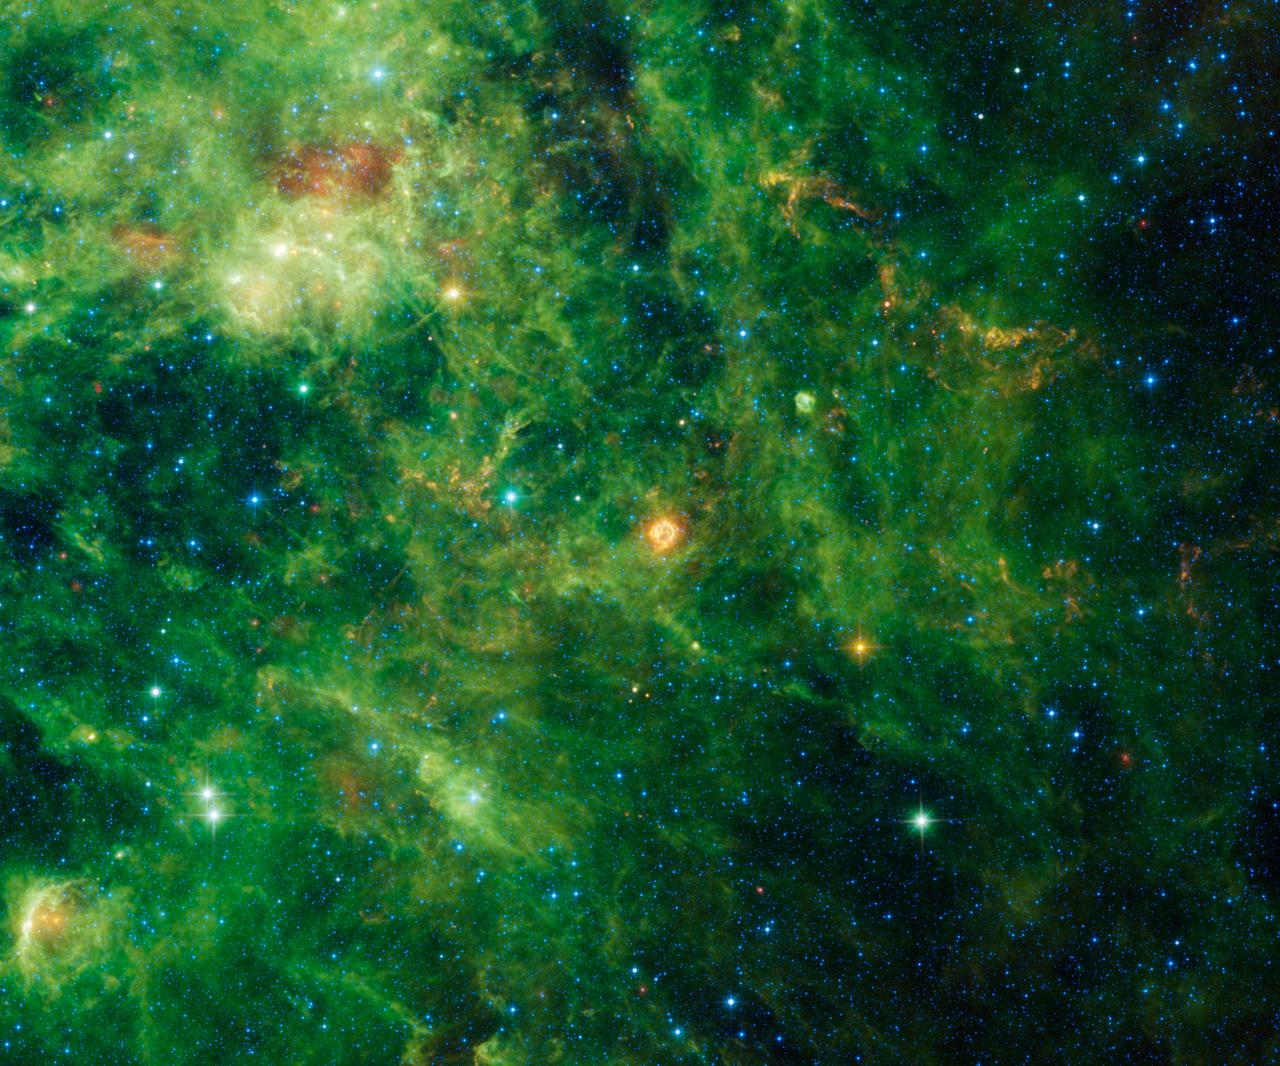
Listed as Cassiopeia A, this remnant of the supernova is one of the brightest radio sources in the known universe. More recently, NASA WISE telescope detected infrared echoes of the flash of light rippling outwards from the supernova.
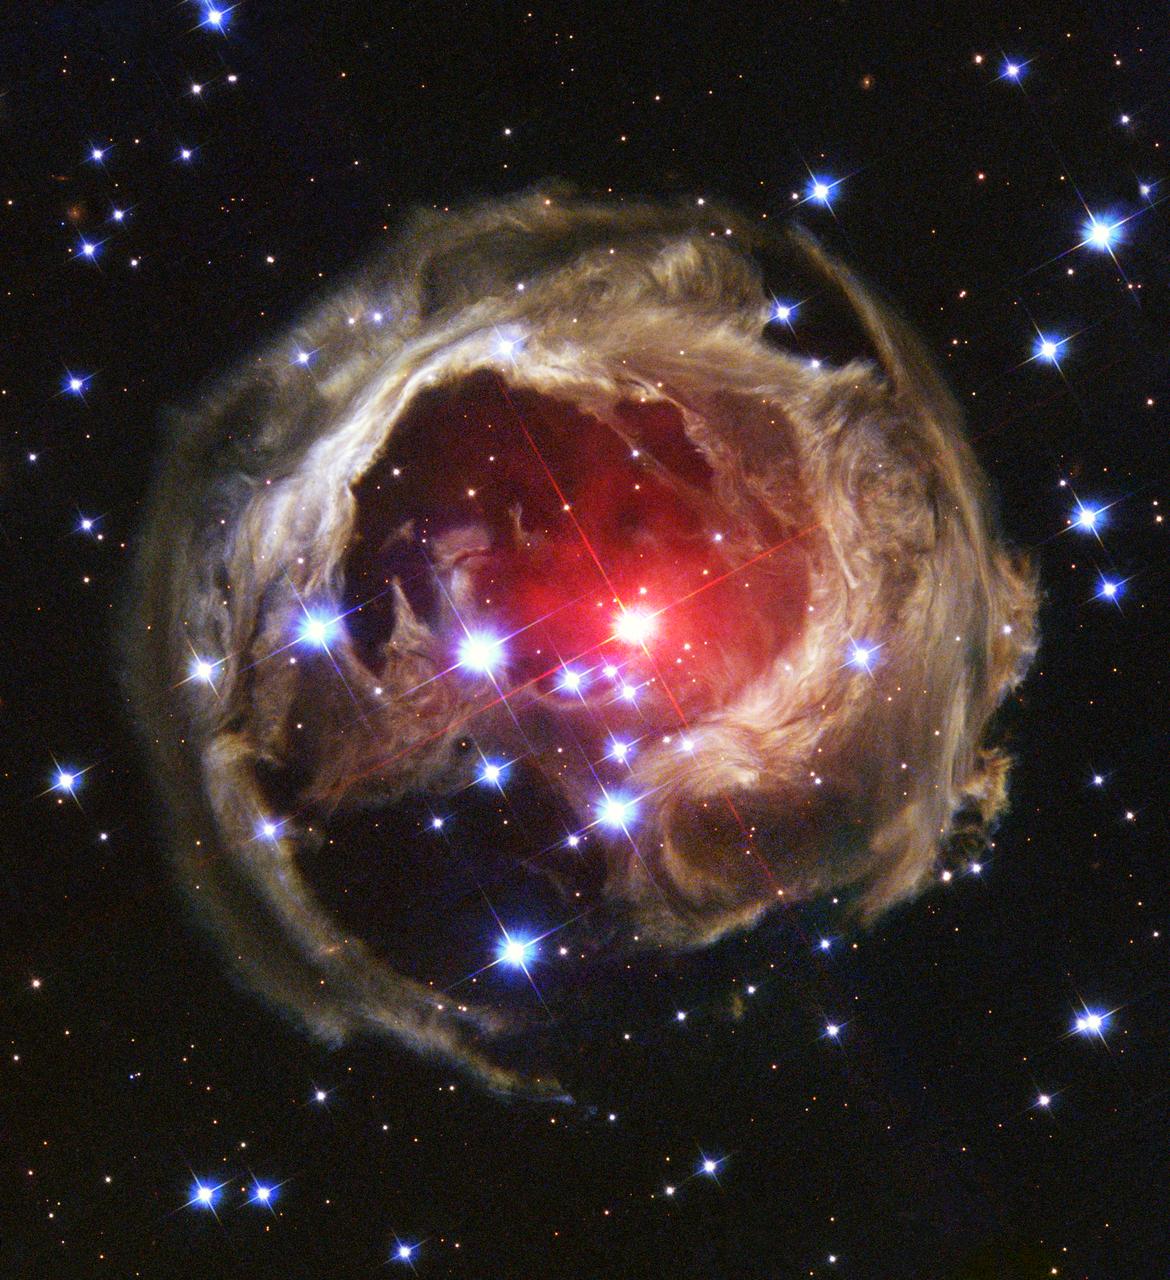
"Light Echo" Illuminates Dust Around Supergiant Star V838 Monocerotis (V838 Mon) Credit: NASA and The Hubble Heritage Team (AURA/STScI) The Hubble Space Telescope is a project of international cooperation between NASA and the European Space Agency. NASA's Goddard Space Flight Center manages the telescope. The Space Telescope Science Institute conducts Hubble science operations. Goddard is responsible for HST project management, including mission and science operations, servicing missions, and all associated development activities. To learn more about the Hubble Space Telescope go here: <a href="http://www.nasa.gov/mission_pages/hubble/main/index.html" rel="nofollow">www.nasa.gov/mission_pages/hubble/main/index.html</a> <b><a href="http://www.nasa.gov/centers/goddard/home/index.html" rel="nofollow">NASA Goddard Space Flight Center</a></b> is home to the nation's largest organization of combined scientists, engineers and technologists that build spacecraft, instruments and new technology to study the Earth, the sun, our solar system, and the universe. <b>Follow us on <a href="http://twitter.com/NASA_GoddardPix" rel="nofollow">Twitter</a></b> <b>Join us on <a href="http://www.facebook.com/pages/Greenbelt-MD/NASA-Goddard/395013845897?ref=tsd" rel="nofollow">Facebook</a><b> </b></b>
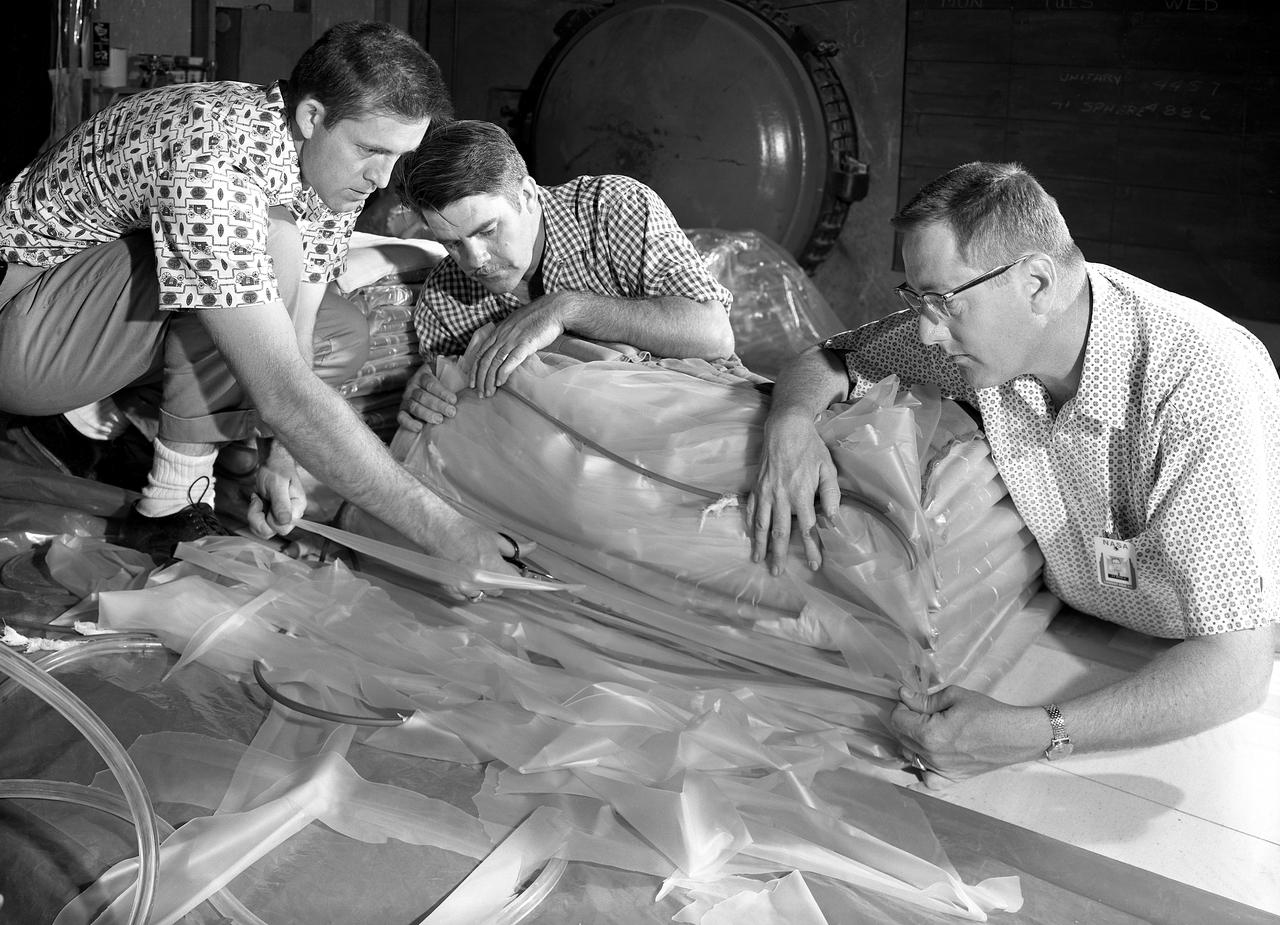
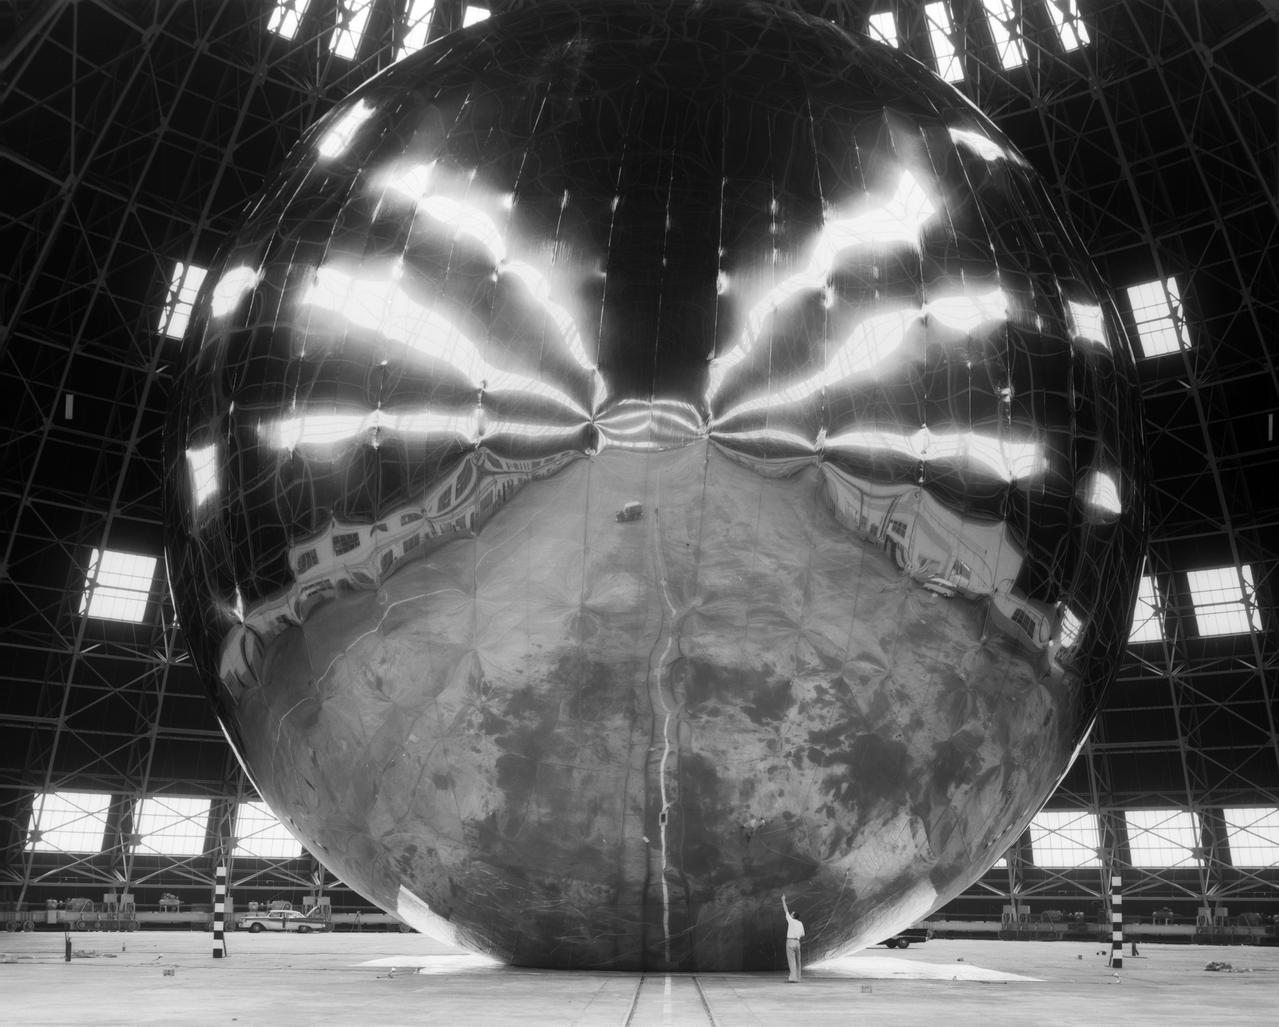
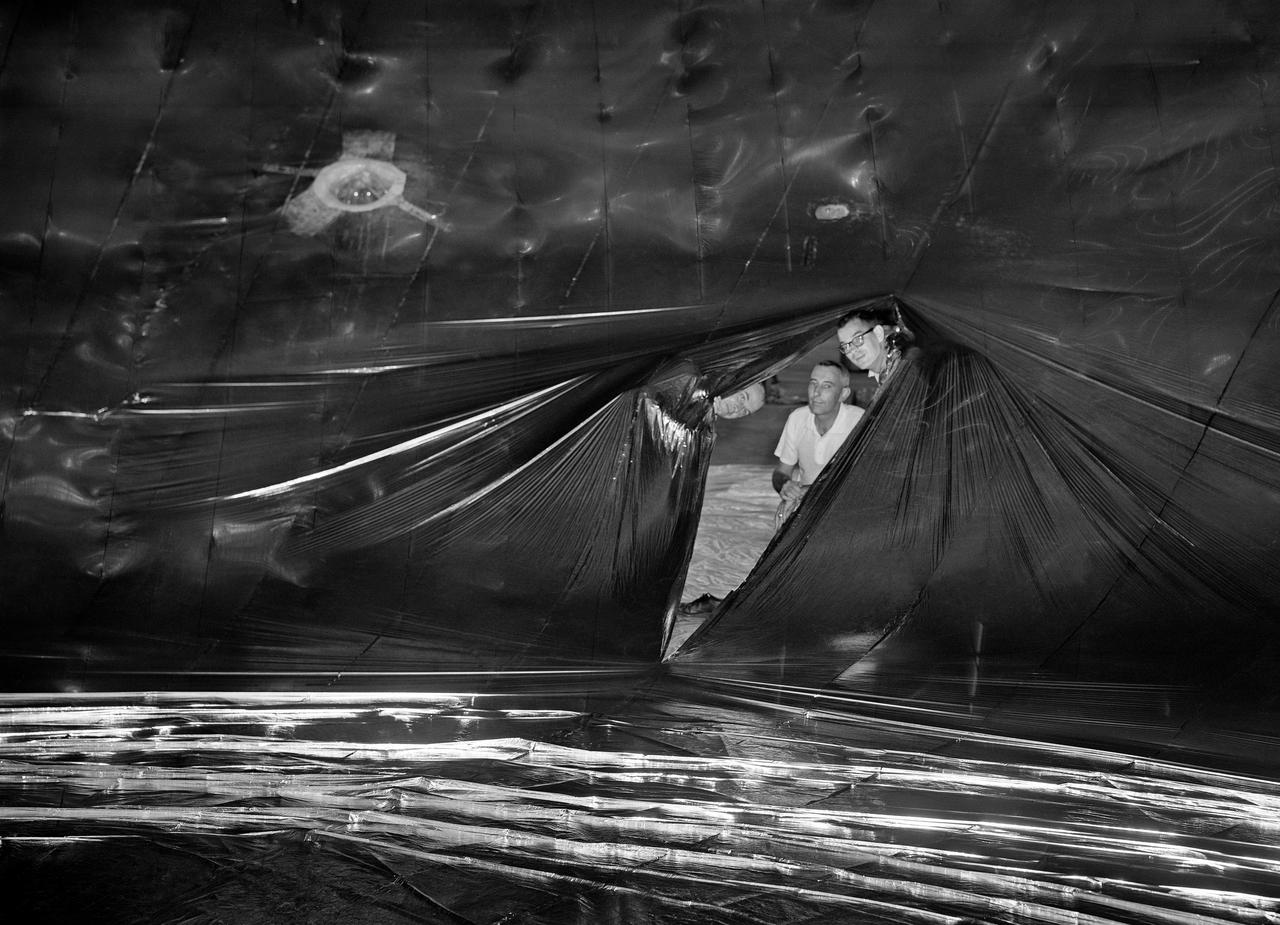
Inflation Tests of the Echo 1 Satellite in Weeksville, N.C. 1958-L-03603 Image Langley engineers Edwin Kilgore (center), Norman Crabill (right) and an unidentified man take a peek inside the vast balloon during inflation tests. Page. 183 Space Flight Revolution NASA Langley Research Center From Sputnik to Apollo. NASA SP-4308.
Inflation Tests of the Echo 1 Satellite in Weeksville, N.C. 1958-L-03603 Image Langley engineers Edwin Kilgore (center), Norman Crabill (right) and an unidentified man take a peek inside the vast balloon during inflation tests. Page. 183 Space Flight Revolution NASA Langley Research Center From Sputnik to Apollo. NASA SP-4308.
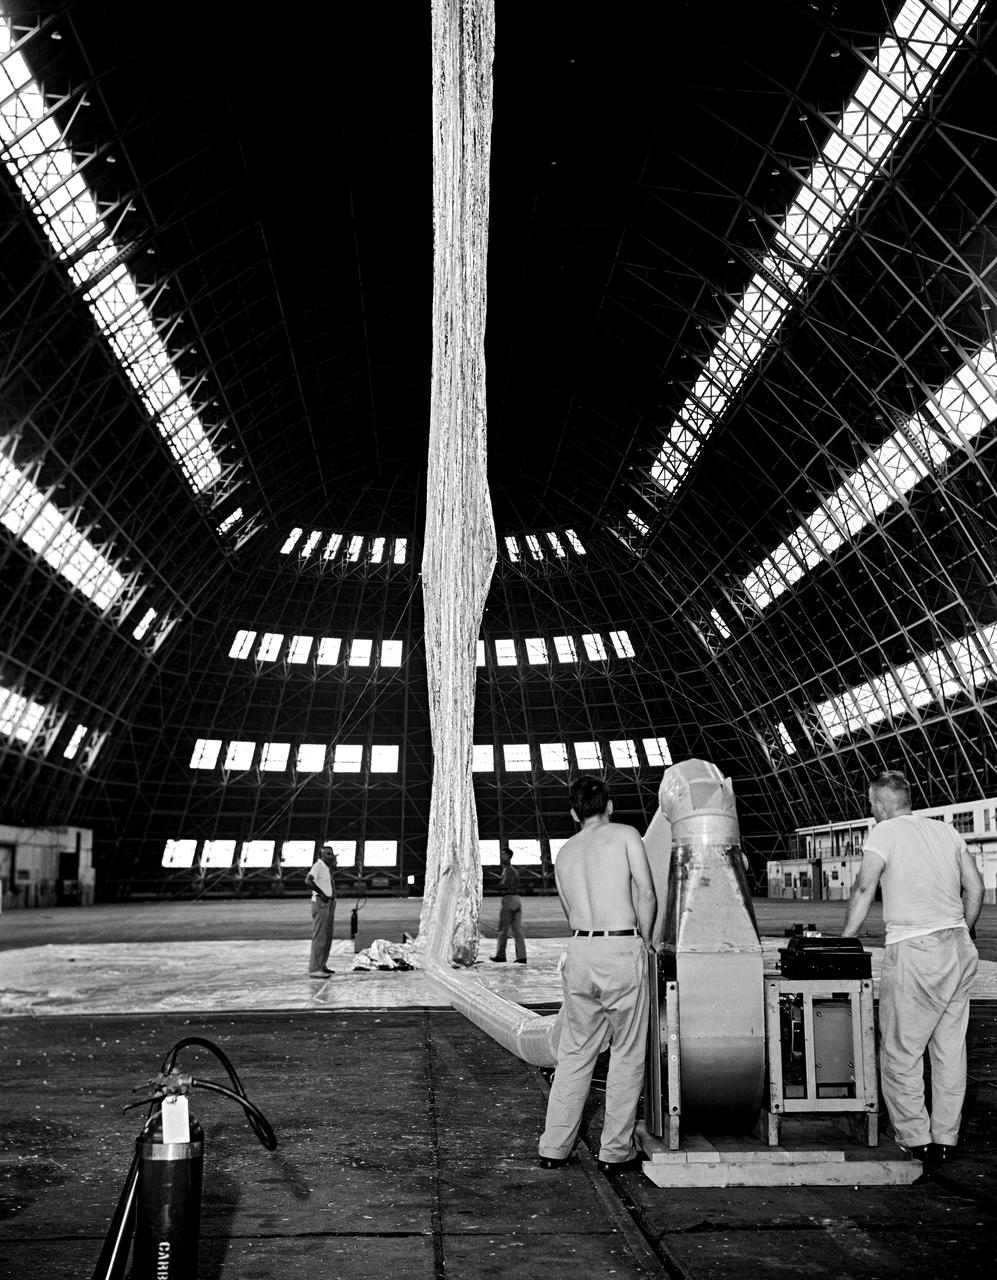
Inflation Tests of the Echo 1 Satellite in Weeksville, N.C. 1958-L-03603 Image Langley engineers Edwin Kilgore (center), Norman Crabill (right) and an unidentified man take a peek inside the vast balloon during inflation tests. Page. 183 Space Flight Revolution NASA Langley Research Center From Sputnik to Apollo. NASA SP-4308.
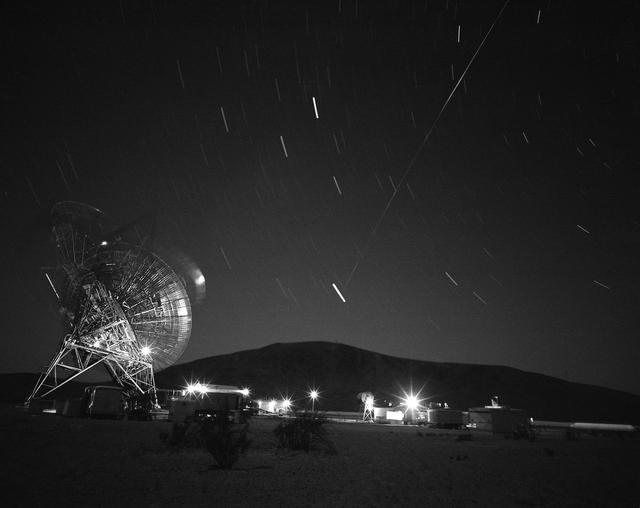
This archival image was released as part of a gallery comparing JPL’s past and present, commemorating the 80th anniversary of NASA’s Jet Propulsion Laboratory on Oct. 31, 2016. This photograph shows the first pass of Echo 1, NASA's first communications satellite, over the Goldstone Tracking Station managed by NASA's Jet Propulsion Laboratory, in Pasadena, California, in the early morning of Aug. 12, 1960. The movement of the antenna, star trails (shorter streaks), and Echo 1 (the long streak in the middle) are visible in this image. Project Echo bounced radio signals off a 10-story-high, aluminum-coated balloon orbiting the Earth. This form of "passive" satellite communication -- which mission managers dubbed a "satelloon" -- was an idea conceived by an engineer from NASA's Langley Research Center in Hampton, Virginia, and was a project managed by NASA's Goddard Space Flight Center in Greenbelt, Maryland. JPL's role involved sending and receiving signals through two of its 85-foot-diameter (26-meter-diameter) antennas at the Goldstone Tracking Station in California's Mojave Desert. The Goldstone station later became part of NASA's Deep Space Network. JPL, a division of Caltech in Pasadena, California, manages the Deep Space Network for NASA. http://photojournal.jpl.nasa.gov/catalog/PIA21114
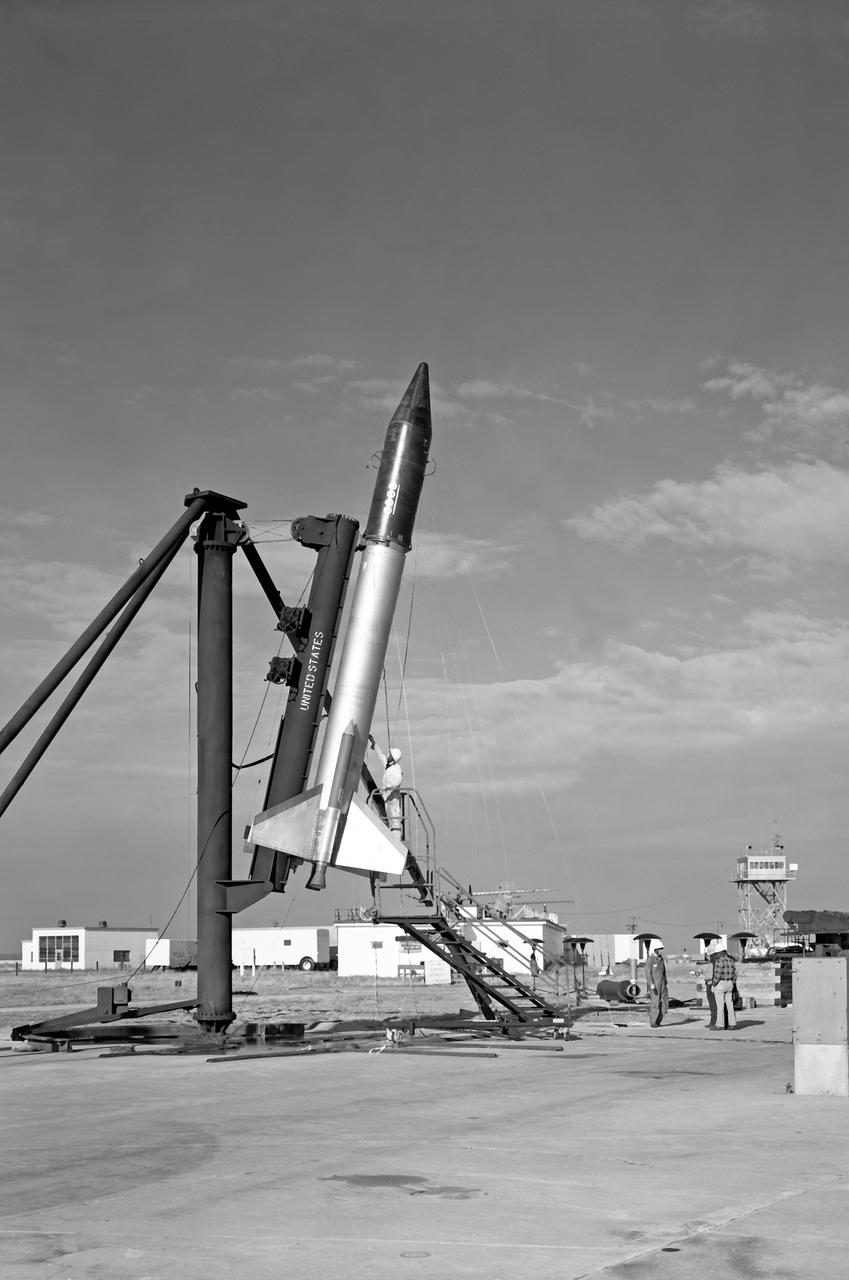
Shot put with shroud over payload - carried early Echo satellite (which burst before achieving orbit). This was the first attempt to launch the Echo satellite.
View of Integrated Cardiovascular (ICV) Echo Ultrasound Scan,in the Columbus module. ICV aims to quantify the extent,time course and clinical significance of cardiac atrophy (decrease in the size of the heart muscle) in space. Photo was taken during Expedition 34.
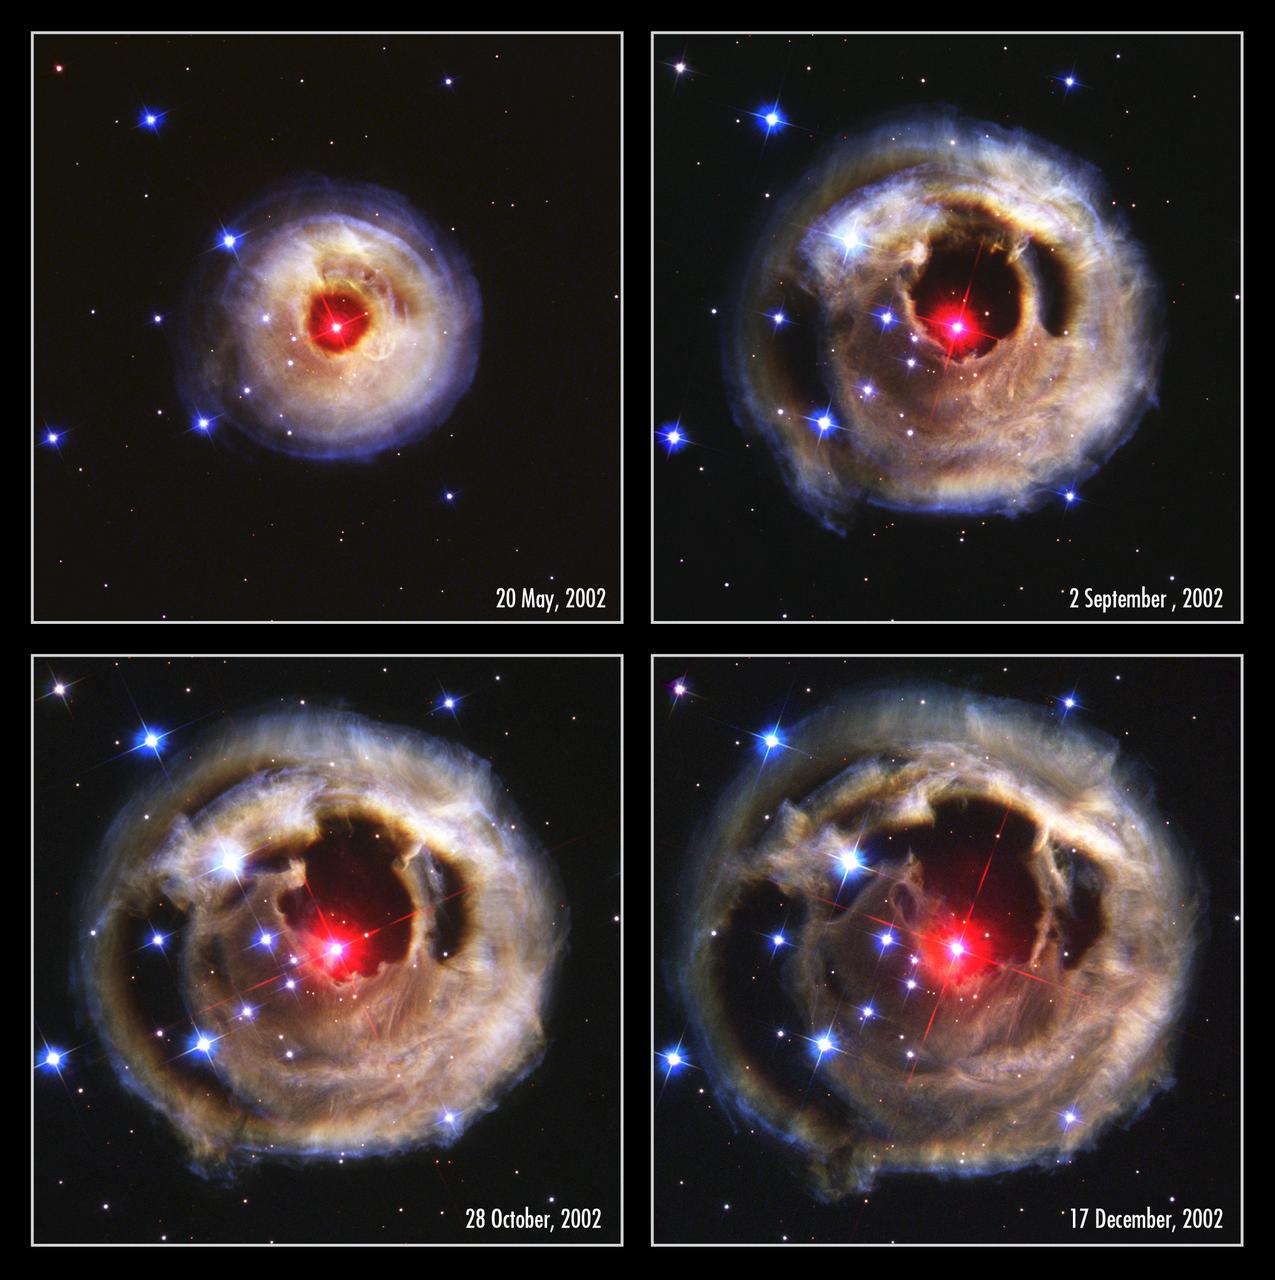
This series of photos, captured by the NASA Hubble Space Telescope's (HST) Advanced Camera for Surveys from May to December 2002, dramatically demonstrates the reverberation of light through space caused by an unusual stellar outburst in January 2002. A burst of light from the bizarre star is spreading into space and reflecting off of surrounding circumstellar dust. As different parts are sequentially illuminated, the appearance of the dust changes. This effect is referred to as a "light echo". The red star at the center of the eyeball like feature is the unusual erupting super giant called V838 Monocerotis, or V Mon, located about 20,000 light-years away in the winter constellation Monoceros (the Unicorn). During its outburst, the star brightened to more than 600,000 times our Sun's luminosity. The circular feature has now expanded to slightly larger than the angular size of Jupiter on the sky, and will continue to expand for several more years until the light from the back side of the nebula begins to arrive. The light echo will then give the illusion of contracting, until it finally disappears by the end of the decade.
ISS030-E-155938 (20 Jan. 2012) --- NASA astronaut Dan Burbank, Expedition 30 commander, sets up the Integrated Cardiovascular (ICV) Resting Echo Scan at the Human Research Facility (HRF) rack in the Columbus laboratory of the International Space Station.

This animation shows the events that serve as the basis of an astrophysics technique called "echo mapping," also known as reverberation mapping. At center is a supermassive black hole surrounded by a disk of material called an accretion disk. As the disk gets brighter it sometimes even releases short flares of visible light. Blue arrows show the light from this flash traveling away from the black hole, both toward an observer on Earth and toward an enormous, doughnut-shaped structure (called a torus) made of dust. The light gets absorbed, causing the dust to heat up and release infrared light. This brightening of the dust is a direct response to — or, one might, say an "echo" — of the changes happening in the disk. Red arrows show this light traveling away from the galaxy, in the same direction as the initial flash of visible light. Thus an observer would see the visible light first, and (with the right equipment) the infrared light later. Astronomers have previously proposed using echo mapping as a means of measuring distances to cosmic objects. If scientists can observe both the initial flare of visible light and the subsequent infrared brightening in the dust, they could in theory use that information to measure the disk's luminosity, which could then be used to measure the distance to that galaxy by comparing it to the galaxy's brightness as seen from Earth. The temperature in the part of the disk closest to the black hole can reach tens of thousands of degrees but decreases with distance. When it reaches about 2,200 degrees Fahrenheit (1,200 Celsius), it is cool enough for dust to form. The more luminous the disk, the farther away from it the dust forms and the longer it takes light from the disk to reach the dust and produce the "echo." The distance from the accretion disk to the inside of the dust doughnut can be billions or trillions of miles. Even light, traveling at 186,000 miles (300,000 kilometers) per second, can take months or years to cross it. NASA's Near Earth Object Wide Field Infrared Survey Explorer (NEOWISE), previously named WISE, surveys the entire sky about once every six months and is on track to complete 16 such surveys by the end of 2020, providing astronomers with repeated opportunities to observe galaxies and look for signs of those light echoes. A study using data from WISE measured the luminosity of over 500 black hole accretion disks using echo mapping, but the subsequent distance measurements lacked precision compared to other distance measuring techniques. Additional data and an improved understanding of dust torus dynamics could improve those measurements. Movie available at https://photojournal.jpl.nasa.gov/catalog/PIA23866

ISS032-E-011853 (1 Aug. 2012) --- NASA astronaut Joe Acaba (left) and Japan Aerospace Exploration Agency astronaut Aki Hoshide, both Expedition 32 flight engineers, perform an Integrated Cardiovascular (ICV) Resting Echo Scan at the Human Research Facility (HRF) rack in the Columbus laboratory of the International Space Station.
ISS030-E-155942 (20 Jan. 2012) --- NASA astronaut Dan Burbank, Expedition 30 commander, prepares to use the Integrated Cardiovascular (ICV) Resting Echo Scan on a crew member (out of frame) at the Human Research Facility (HRF) rack in the Columbus laboratory of the International Space Station.

These spectrograms from the MARSIS instrument on the European Space Agency Mars Express orbiter show the intensity of radar echo in Mars far-northern ionosphere at three times on Oct. 19 and 20, 2014.

This illustration shows a glowing stream of material from a star as it is being devoured by a supermassive black hole in a tidal disruption flare. When a star passes within a certain distance of a black hole -- close enough to be gravitationally disrupted -- the stellar material gets stretched and compressed as it falls into the black hole. In the process of being accreted, the gas heats up and creates a lot of optical and ultraviolet light, which destroys nearby dust but merely heats dust further out. The farther dust that is heated emits a large amount of infrared light. In recent years, a few dozen such flares have been discovered, but they are not well understood. Astronomers gained new insights into tidal disruption flares thanks to data from NASA's Wide-field Infrared Survey Explorer (WISE). Studies using WISE data characterized tidal disruption flares by studying how surrounding dust absorbs and re-emits their light, like echoes. This approach allowed scientists to measure the energy of flares from stellar tidal disruption events more precisely than ever before. http://photojournal.jpl.nasa.gov/catalog/PIA20027
Analyzing a piece of the film that the History Detectives believed was from the Echo II Project. PHOTO CREDIT: NASA/Debbie Mccallum
Analyzing a piece of the film that the History Detectives believed was from the Echo II Project. PHOTO CREDIT: NASA/Debbie Mccallum
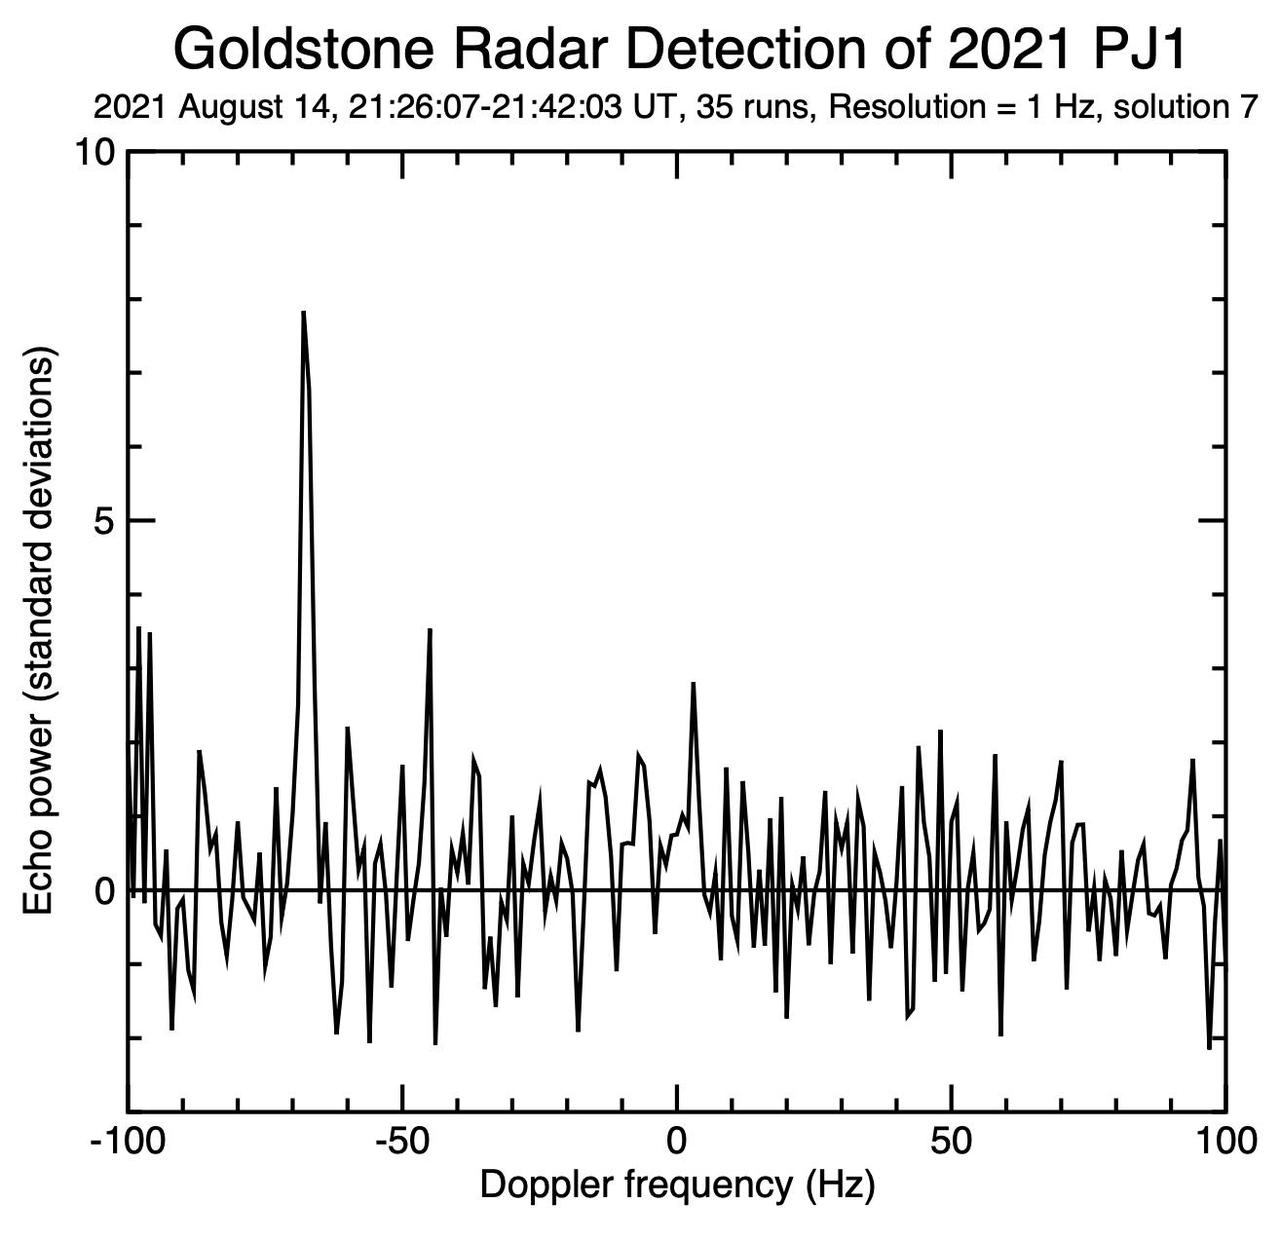
This figure represents the 1,000th near-Earth asteroid (NEA) to be detected by planetary radar since 1968. Being only 65 to 100 feet (20 to 30 meters) wide, asteroid 2021 PJ1 was too small to be imaged in any detail, but the powerful 70-meter (230-foot) Deep Space Station 14 (DSS-14) antenna at the Deep Space Network's Goldstone Deep Space Complex near Barstow, California, was able to measure the Doppler frequency of the radio waves that reflected off the object's surface. The data was recorded for 16 minutes between 2:26 p.m. and 2:42 p.m. PDT on Aug. 14, 2021. The figure shows radar echo signal strength on the vertical axis versus Doppler frequency (in units of hertz, or Hz) on the horizontal axis. The strong spike at a value of minus 70 Hz is the reflected signal (or "echo") from 2021 PJ1; the other, smaller spikes are receiver noise, which is like the static on an AM radio if there aren't any nearby stations. Using this information, scientists at NASA's Jet Propulsion Laboratory in Southern California could more accurately calculate the asteroid's velocity, its distance from Earth and its future motion around the Sun. These observations used a prediction – known as an "ephemeris" – that had relatively large uncertainties because the asteroid had been discovered only a few days earlier. If the original prediction had been perfect, the radar echo would appear at zero Hz. The fact that the radar echo is at minus 70 Hz indicates a correction could be made to the predicted velocity of minus 2.7 miles per hour (minus 1.2 meters per second). This measurement also reduced the uncertainty in the asteroid's distance from Earth from 1,300 miles (2,100 kilometers) to 5.2 miles (8.3 kilometers) – a reduction of a factor of about 250. https://photojournal.jpl.nasa.gov/catalog/PIA24563

Tukufu Zuberi of the History Detectives waits on the analysis of the film. Tthe History Detectives believed a piece of film was from the Echo II Project. PHOTO CREDIT: NASA/Debbie Mccallum

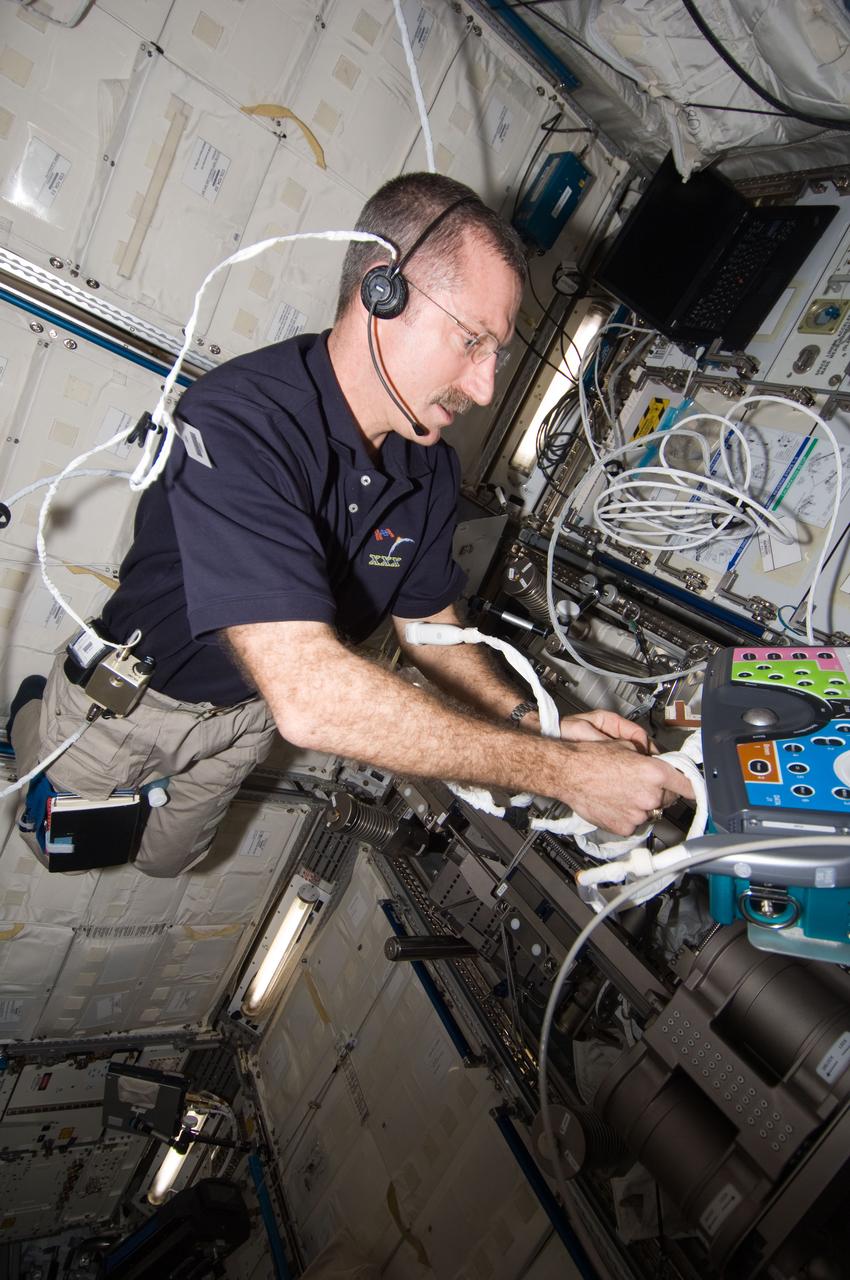
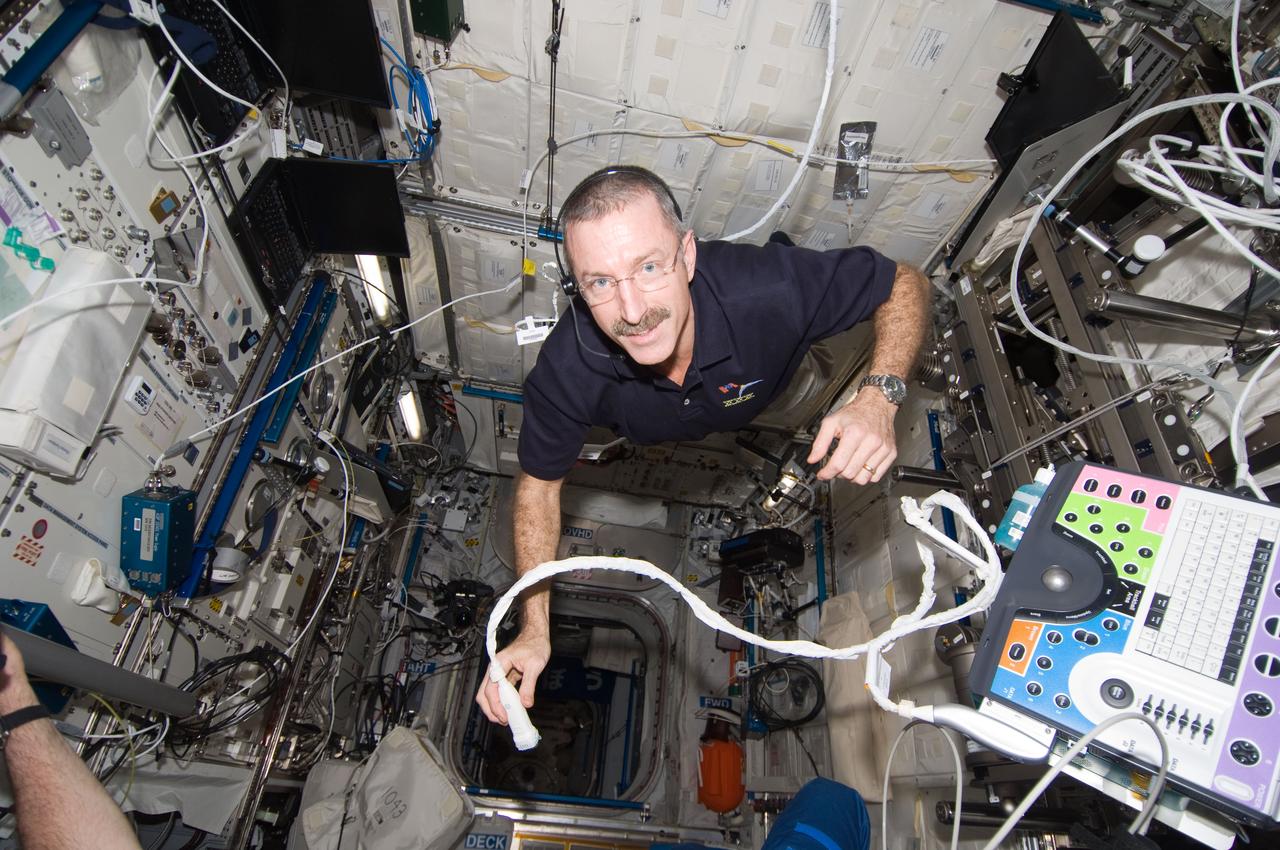
iss066e086655 (Dec. 6, 2021) --- NASA astronaut and Expedition 66 Flight Engineer Thomas Marshburn sets up hardware for the Vascular Echo human research study that examines the cardiovascular changes that take place in microgravity.
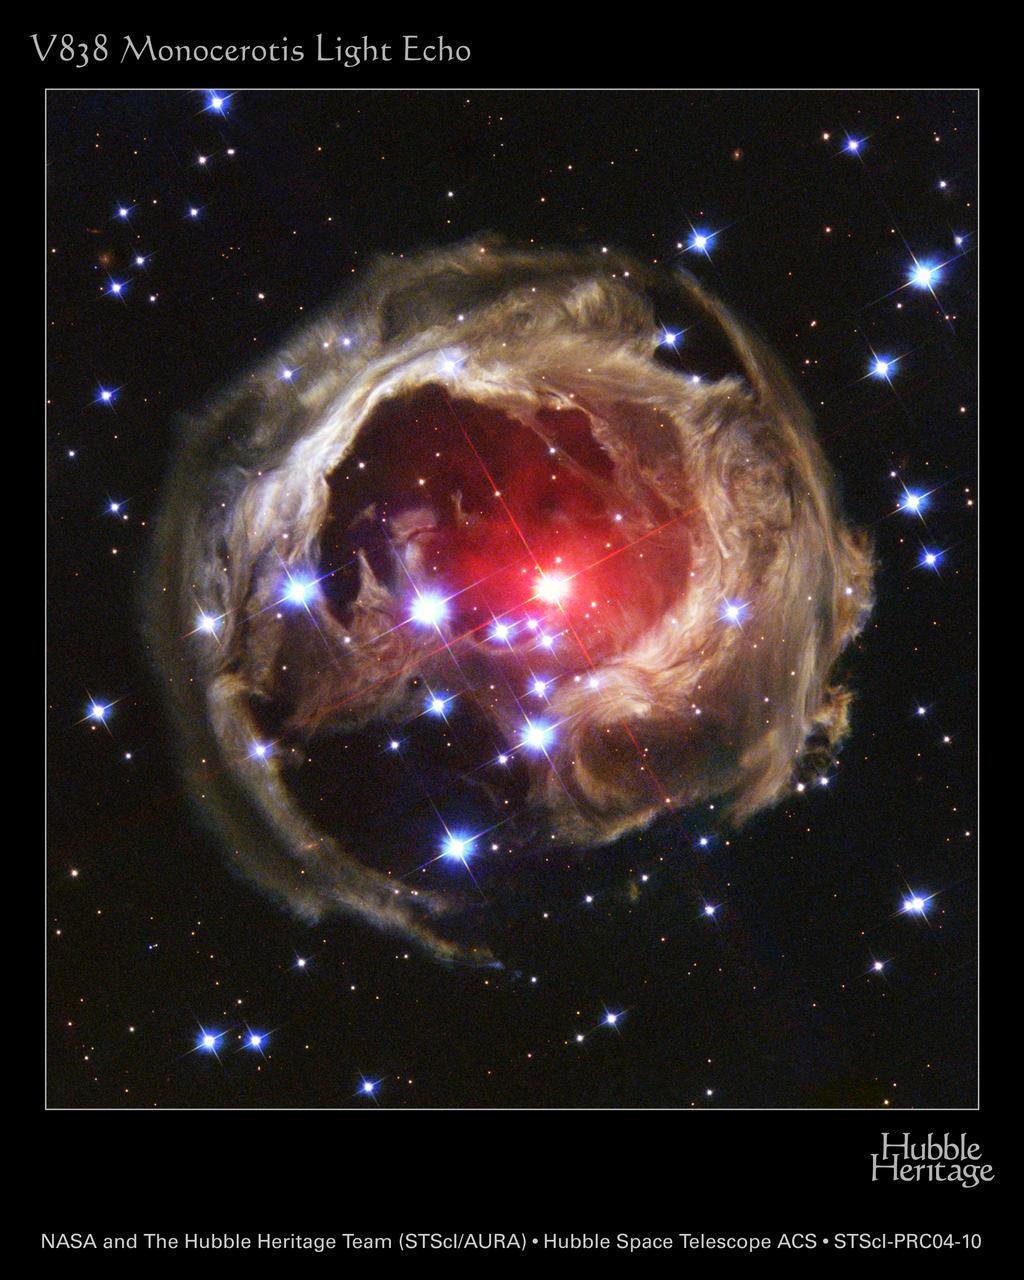
This photo, captured by the NASA Hubble Space Telescope's (HST) Advanced Camera for Surveys, is Hubble's latest view of an expanding halo of light around the distant star V838 Monocerotis, or V Mon, caused by an unusual stellar outburst that occurred back in January 2002. A burst of light from the bizarre star is spreading into space and reflecting off of surrounding circumstellar dust. As different parts are sequentially illuminated, the appearance of the dust changes. This effect is referred to as a "light echo". Located about 20,000 light-years away in the winter constellation Monoceros (the Unicorn), the star brightened to more than 600,000 times our Sun's luminosity. The light echo gives the illusion of contracting, until it finally disappears by the end of the decade.
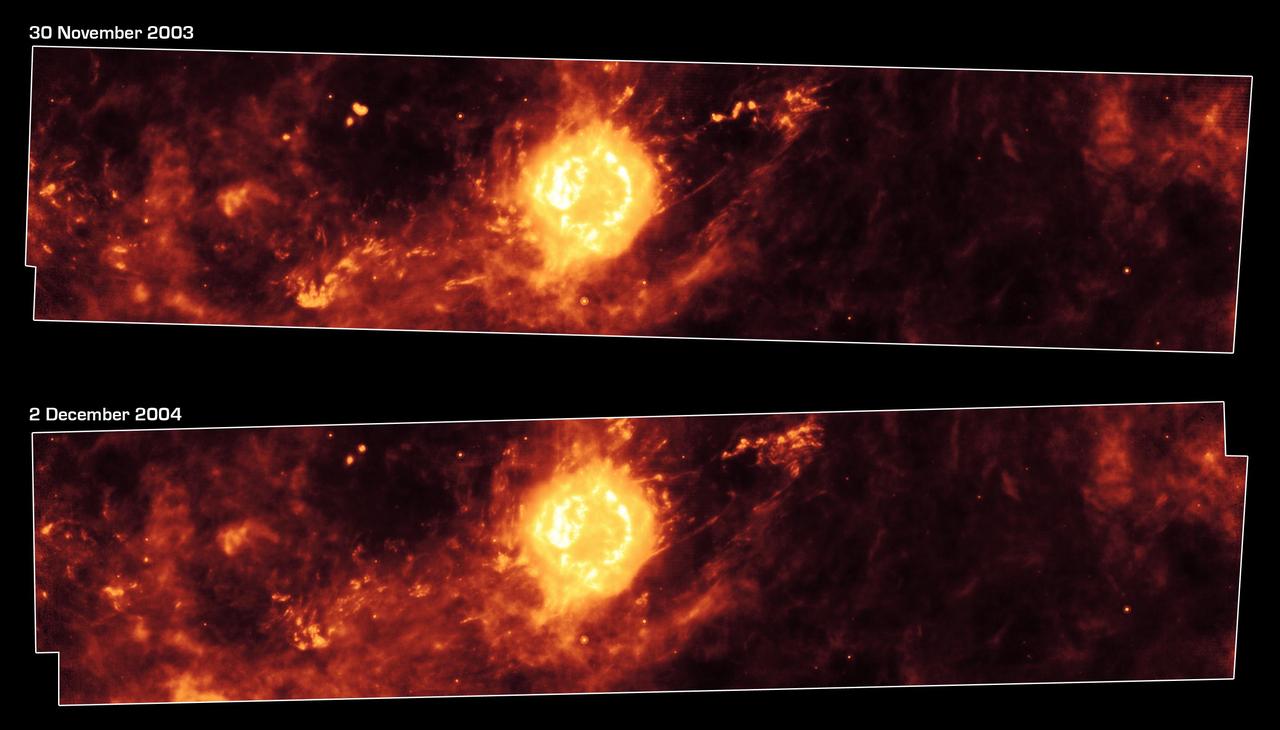
These images from NASA Spitzer Space Telescope, taken one year apart, show the supernova remnant Cassiopeia A yellow ball and surrounding clouds of dust reddish orange.
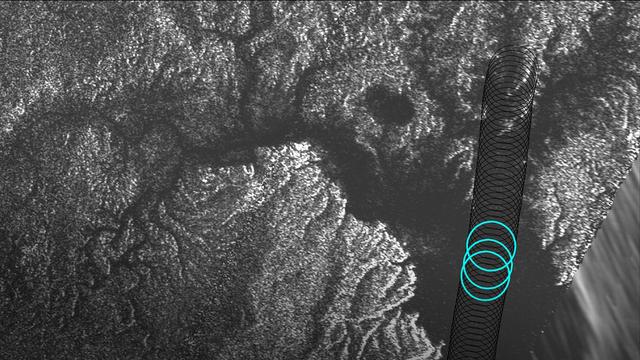
Radar data from NASA's Cassini spacecraft reveal the depth of liquid methane/ethane seas on Saturn's moon Titan. Cassini's Titan flyby on August 21, 2014, included a segment designed to collect altimetry (or height) data, using the spacecraft's radar instrument, along a 120-mile (200-kilometer) shore-to-shore track on Kraken Mare, Titan's largest hydrocarbon sea. For a 25-mile (40-kilometer) stretch of this data, along the sea's eastern shoreline, Cassini's radar beam bounced off the sea bottom and back to the spacecraft, revealing the sea's depth in that area. Observations in this region, near the mouth of a large, flooded river valley, showed depths ranging from 66 to 115 feet (20 to 35 meters). Plots of three radar echoes are shown at left, indicating depths of 89 feet (27 meters), 108 feet (33 meters) and 98 feet (30 meters), respectively. The altimetry echoes show the characteristic double-peaked returns of a bottom-reflection. The tallest peak represents the sea surface; the shorter of the pair represents the sea bottom. The distance between the two peaks is a measure of the liquid's depth. The Synthetic Aperture Radar (SAR) image at right shows successive altimetry observations as black circles. The three blue circles indicate the locations of the three altimetry echoes shown in the plots at left. http://photojournal.jpl.nasa.gov/catalog/PIA19046

Portrait Katherine G. Johnson. Hall of Honor inductee 2017. Langley Research Center NACA and NASA Hall of Honor. In recognition of contributions to the development of methodologies for analysis of manned mission (from Mercury to Apollo) and satellite (Echo) trajectories, and dynamic control of large space structures.

This image from NASA Mars Reconnaissance Orbiter spacecraft shows modified barchan dunes with shapes that resemble raptor claws. The unusual morphology of these dunes suggests a limited supply of windblown sand. Winds likely blew from the northeast resulting in elongate dunes with an asymmetric downwind point. The transverse crests of the smaller ripples/mega-ripple bed-forms surrounding the dune, echo the dominant downwind direction towards the southwest. This locality is in the Northern Lowlands directly east of Dokka Crater in Scandia Cavi. http://photojournal.jpl.nasa.gov/catalog/PIA19962
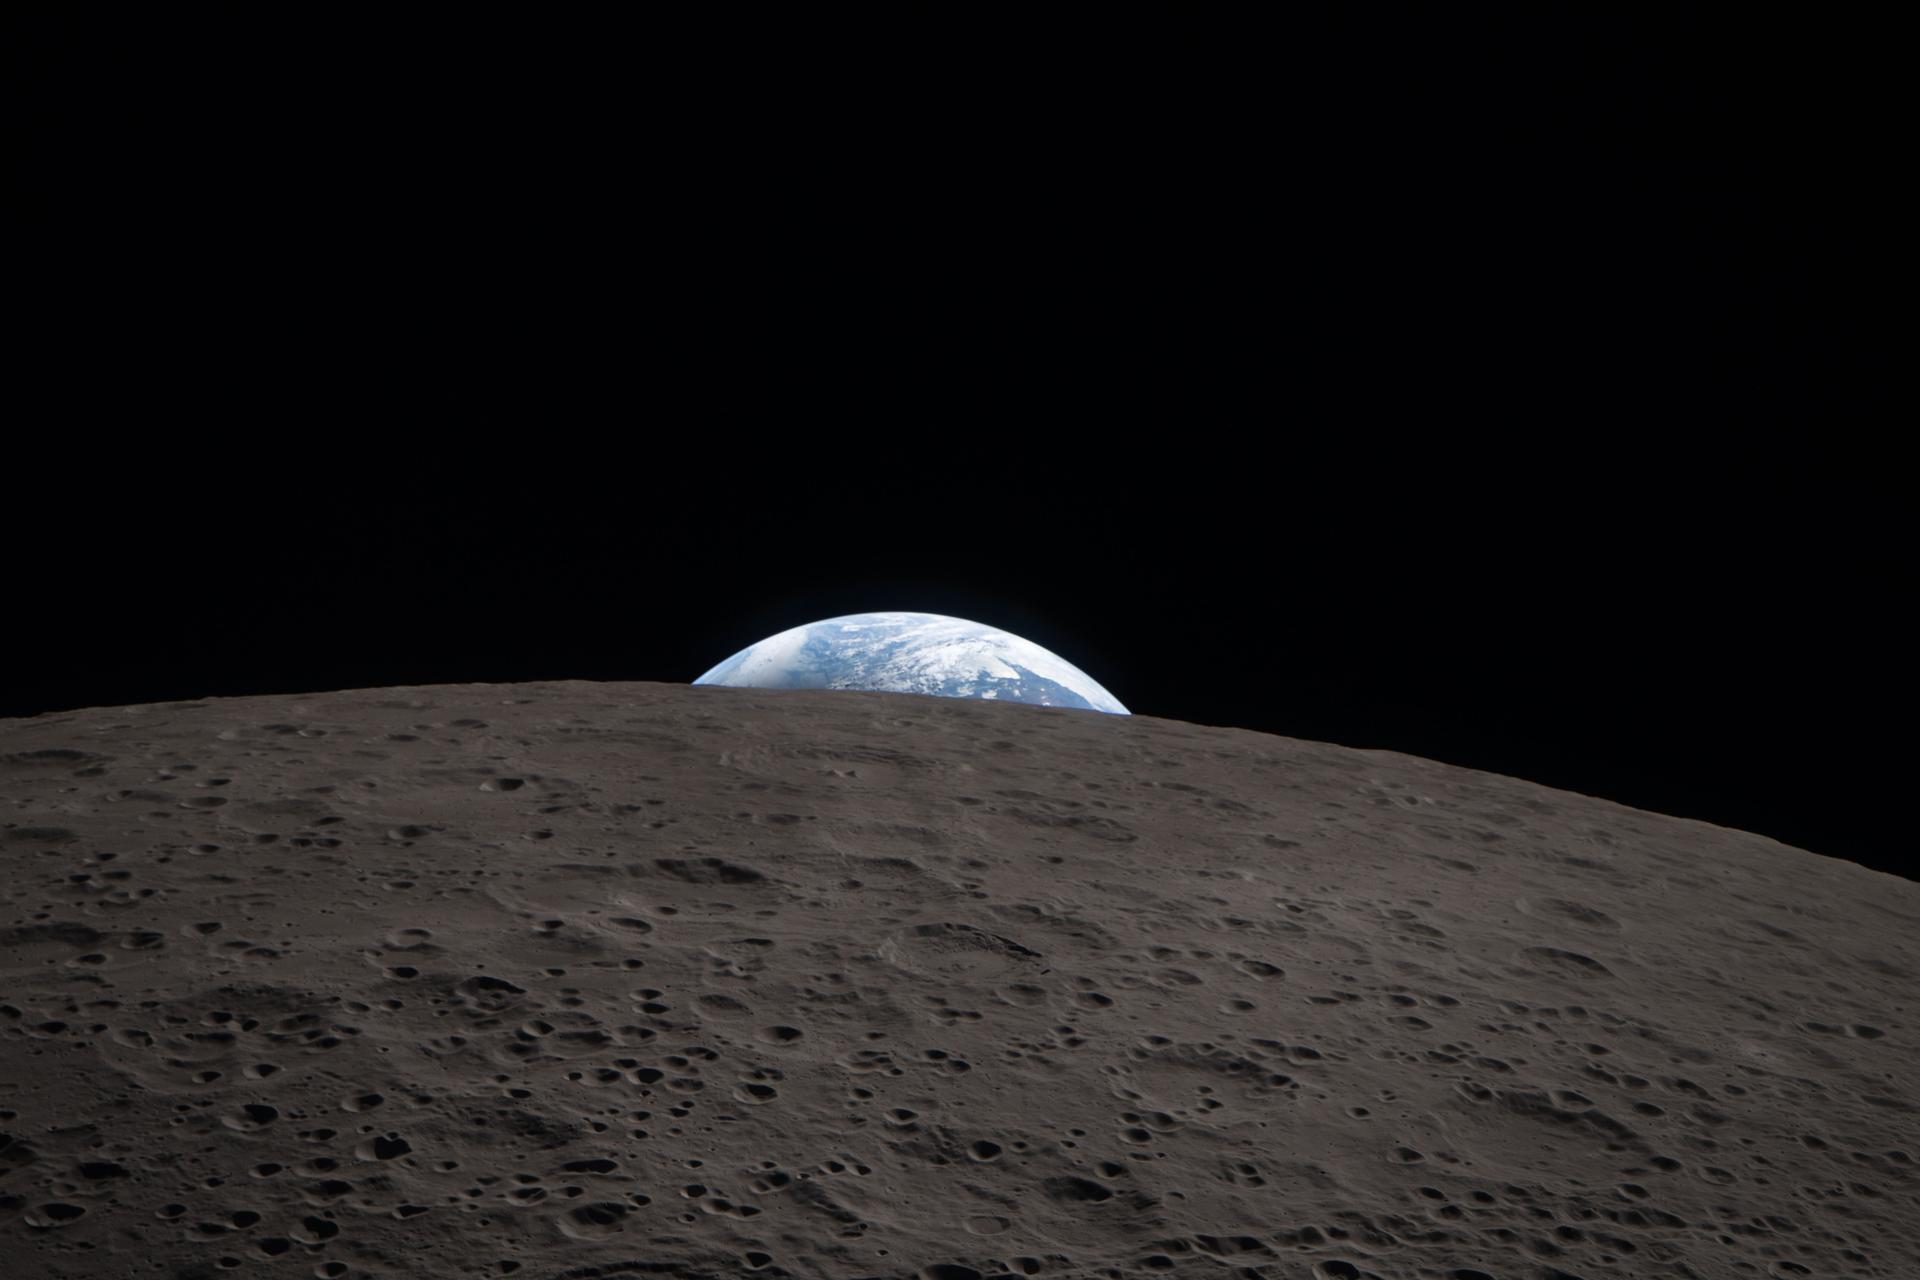
art002e021278 (April 6, 2026) – Echoing the iconic Earthrise photo captured by the Apollo 8 astronauts in 1968, during the lunar flyby, the Artemis II crew captured a shot of Earthset as they passed behind the Moon’s far side. It is one of many photos taken during the seven-hour lunar flyby by the Artemis II crew on the Orion spacecraft. Credit: NASA
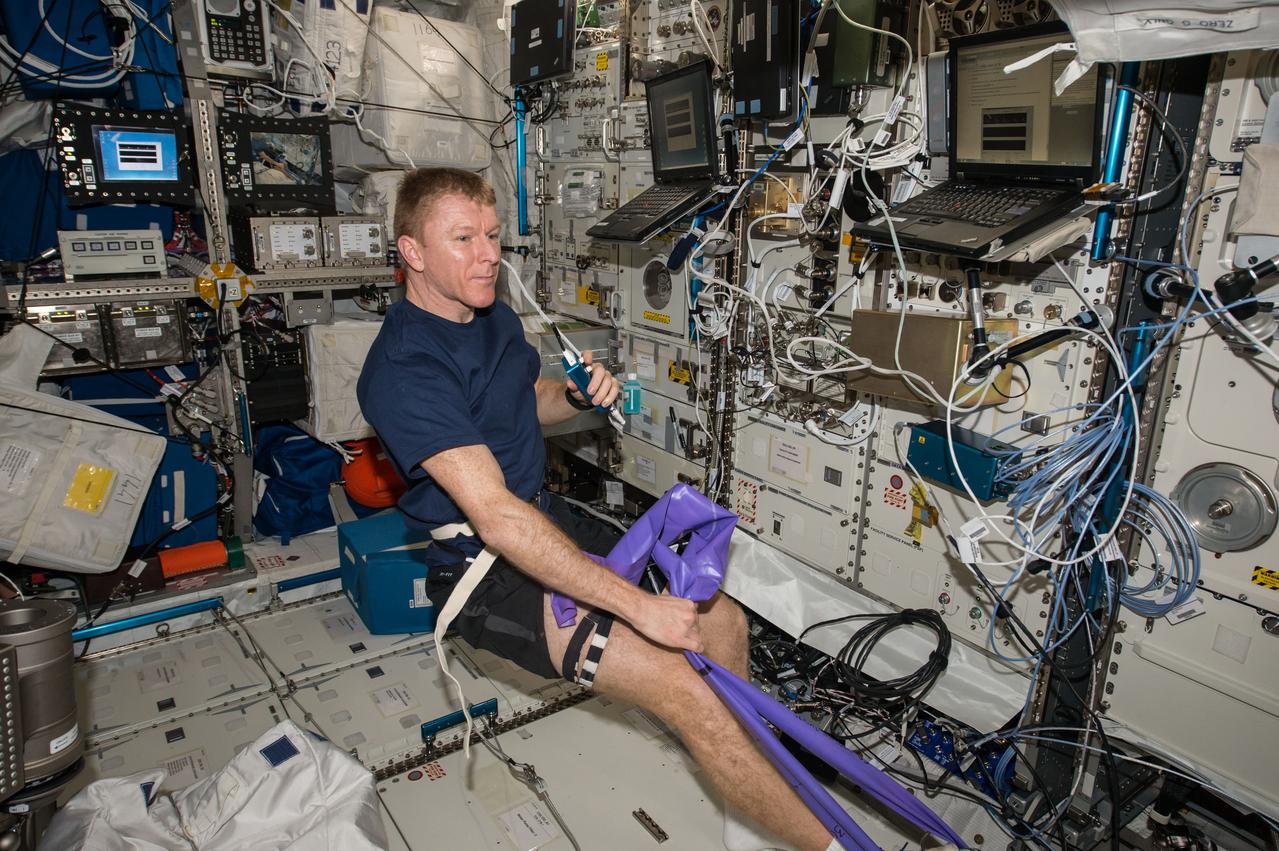
ISS047e134605 (05/30/2016) --- ESA (European Space Agency) astronaut Tim Peake uses hardware for the Vascular Echo experiment. As humans get older on Earth, arteries stiffen and this causes an increase in blood pressure (hypertension) and elevates the risk for cardiovascular disease. Recently, it has been observed that some crew members returning from the International Space Station (ISS) have much stiffer arteries than when they went into space. The results from studying these changes could provide insight into potential countermeasures to help maintain crew member health, and quality of life for everyone.
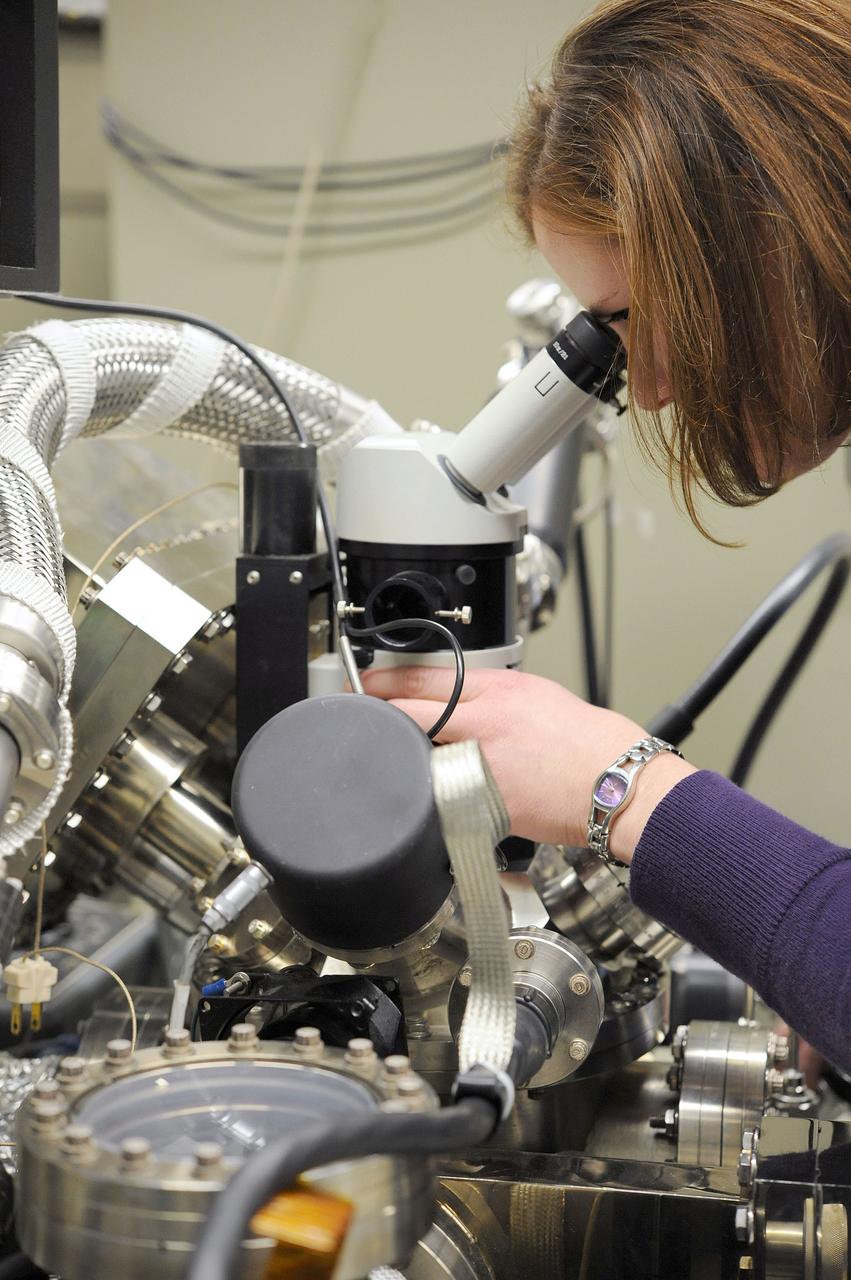
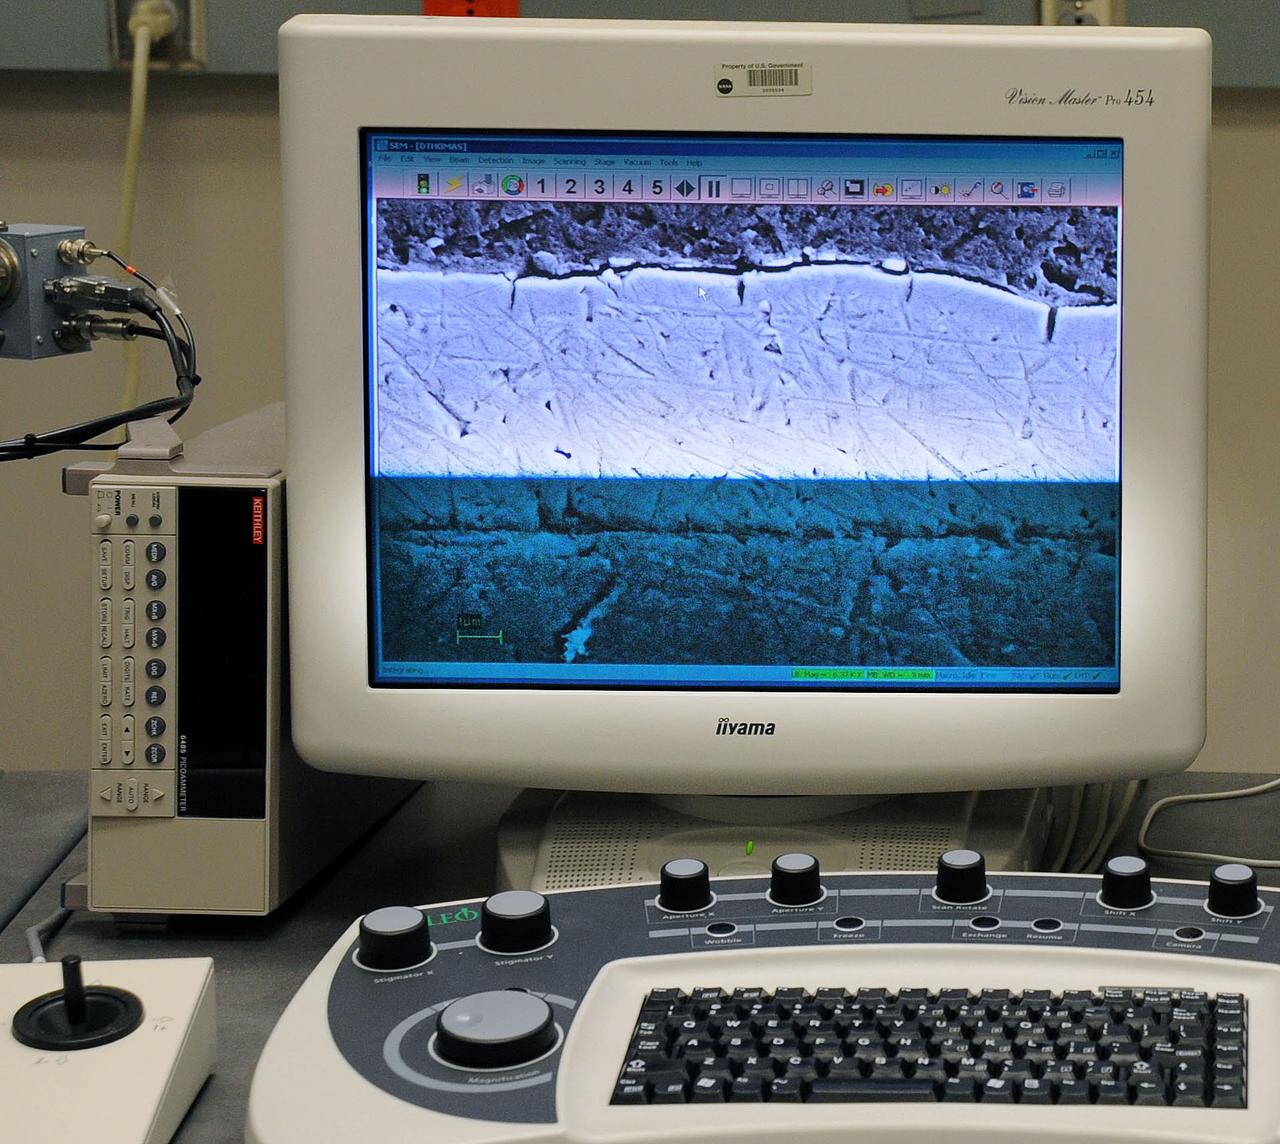
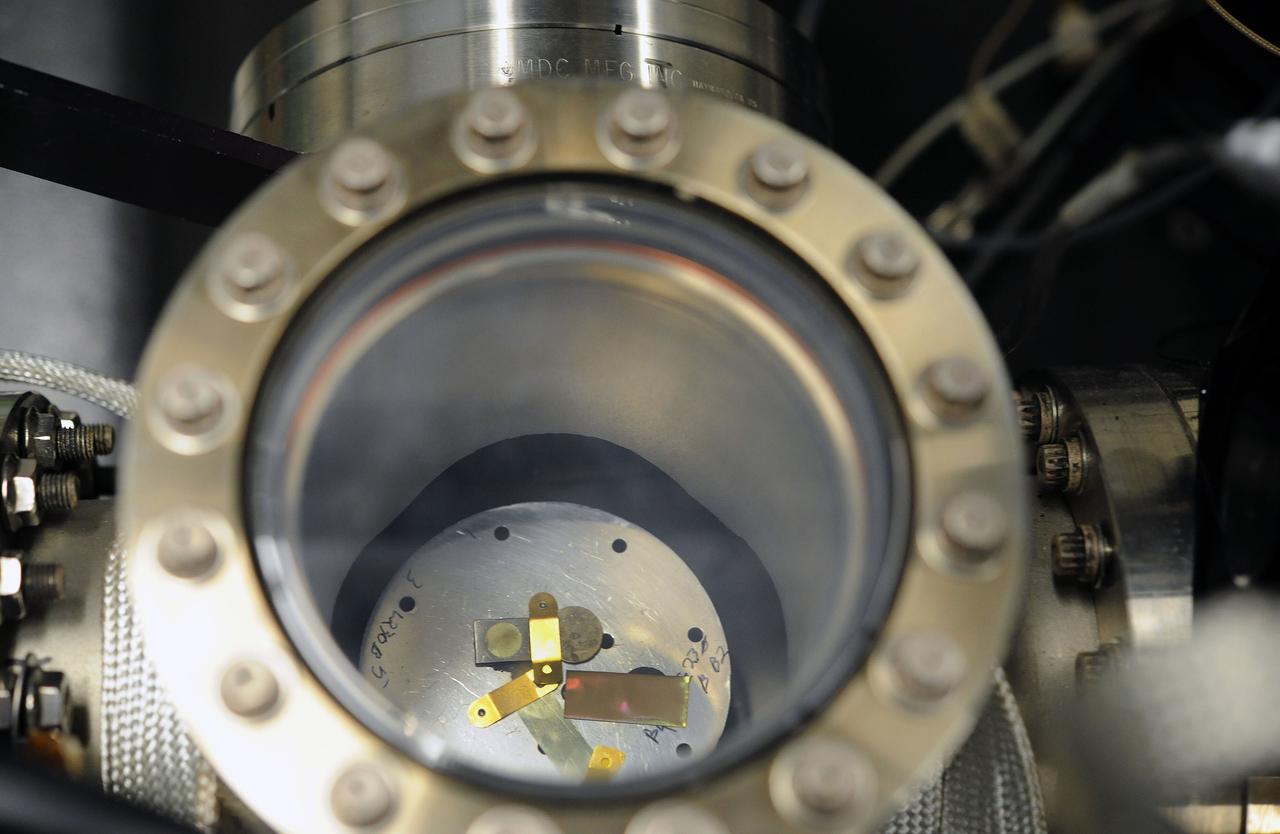
The name of the instrument is X-Ray Photoelecton Spectrometer (acronymed XPS); the lab is in the Materials Engineering Branch and aptly titled the X-Ray Photoelectron Spectrometry Lab. XPS is a non-destructive surface analysis technique that provides an elemental composition of the surface. It is capable of detecting any element with the exception of hydrogen and helium. In the picture, I am analyzing a piece of the film that the History Detectives believed was from the Echo II Project. I was looking for the presence of chromium, which would help confirm that the exterior of the film had a chromium conversion coating. PHOTO CREDIT: NASA/Debbie Mccallum
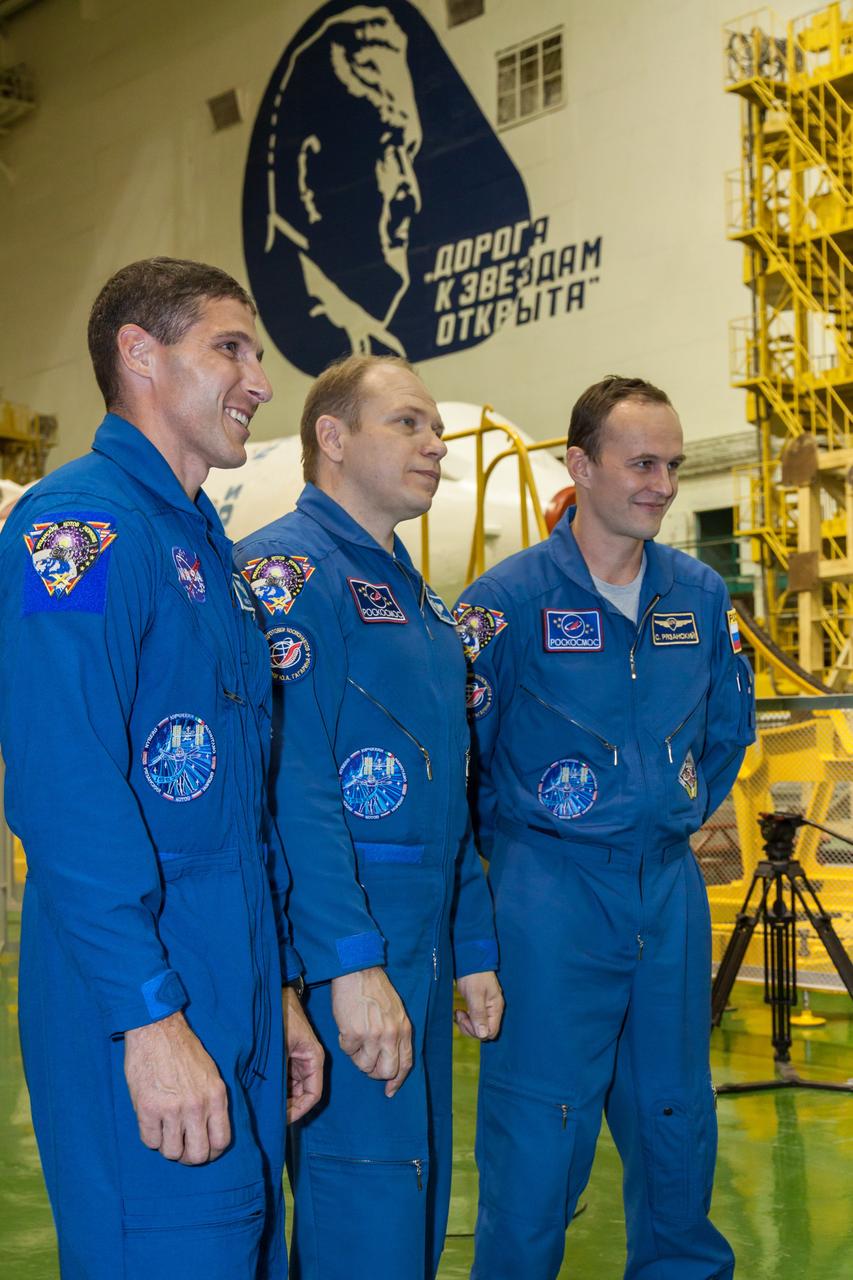
In the Integration Facility at the Baikonur Cosmodrome in Kazakhstan, Expedition 37/38 Flight Engineer Michael Hopkins of NASA (left), Soyuz Commander Oleg Kotov (center) and Flight Engineer Sergey Ryazanskiy (right) pose for pictures Sept. 20 near a wall mural of Russian space icon Sergei Korolev as they completed a final “fit check” dress rehearsal of procedures leading to their launch Sept. 26, Kazakh time, from Baikonur in the Soyuz TMA-10M spacecraft to begin a five and a half month mission on the International Space Station. The words on the mural in Russian echo a famous line by Korolev, “the road to the stars is open”. NASA/Victor Zelentsov
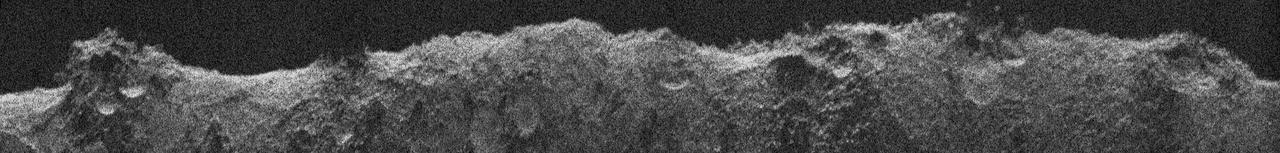
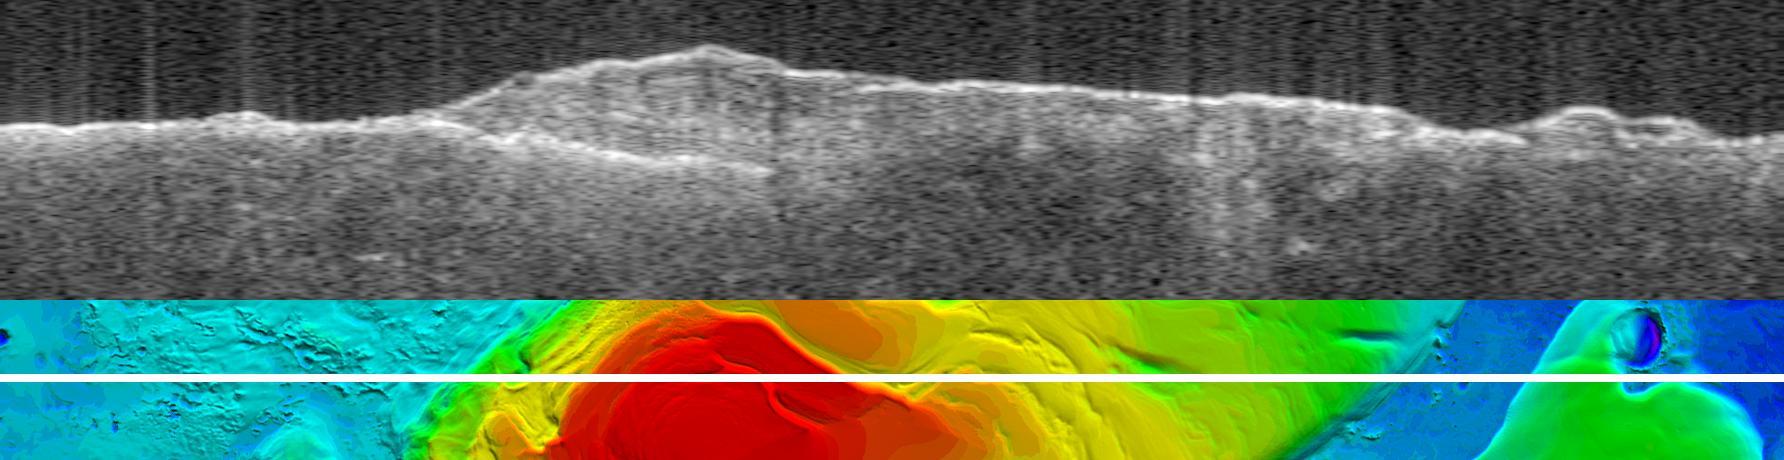
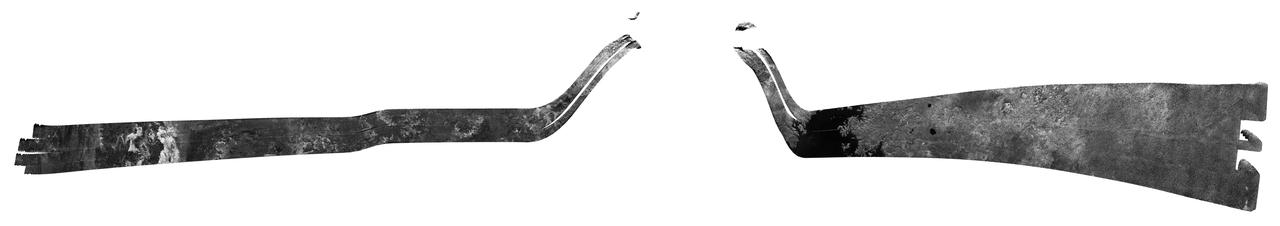
NASA's Europa Clipper, en route to the Jupiter system to investigate the icy moon Europa, conducted a critical test of its radar instrument during a flyby of Mars on March 1, 2025. During the testing, the instrument received echoes of its very-high-frequency radar signals that engineers processed to develop this image, called a radargram. The image was made using radar signals that bounced off Mars. What looks like a skyline is the outline of the topography. Features seen in the radargram include contributions from the topographic features both along and near the ground track (the path below the spacecraft as it passed overhead), such as impact craters, hills, and steep slopes. The 560-mile-long (900-kilometer-long) section of terrain profiled in this radargram is near Mars' equator. The Europa Clipper radar instrument, REASON (Radar for Europa Assessment and Sounding: Ocean to Near-surface), is designed to see into the icy crust of Europa. Though the rocky Martian surface does not allow much penetration by the radar signals, the clarity of the radargram image indicates REASON was performing as expected during the Mars flyby, boding well for future observations at Europa. As Europa Clipper zipped by the Red Planet – starting at 3,100 miles (5,000 kilometers) down to 550 miles (884 kilometers) above the surface – REASON sent and received radio waves for about 40 minutes. In comparison, at Europa the instrument will operate as close as 16 miles (25 kilometers) from the moon's surface. Europa Clipper launched from NASA's Kennedy Space Center in Florida on Oct. 14, 2024, and will arrive at the Jupiter system in 2030 to conduct about 50 flybys of Europa. The mission's main science goal is to determine whether there are places below Europa's surface that could support life. The mission's three main science objectives are to determine the thickness of the moon's icy shell and its surface interactions with the ocean below, to investigate its composition, and to characterize its geology. The mission's detailed exploration of Europa will help scientists better understand the astrobiological potential for habitable worlds beyond our planet. https://photojournal.jpl.nasa.gov/catalog/PIA26568
In July 1959, William J. O Sullivan (right standing) and unidentified engineer examine the capsule containing the tightly folded and packed 12 diameter Beacon satellite inside. Taken from NASA SP-4308 Pg. 174

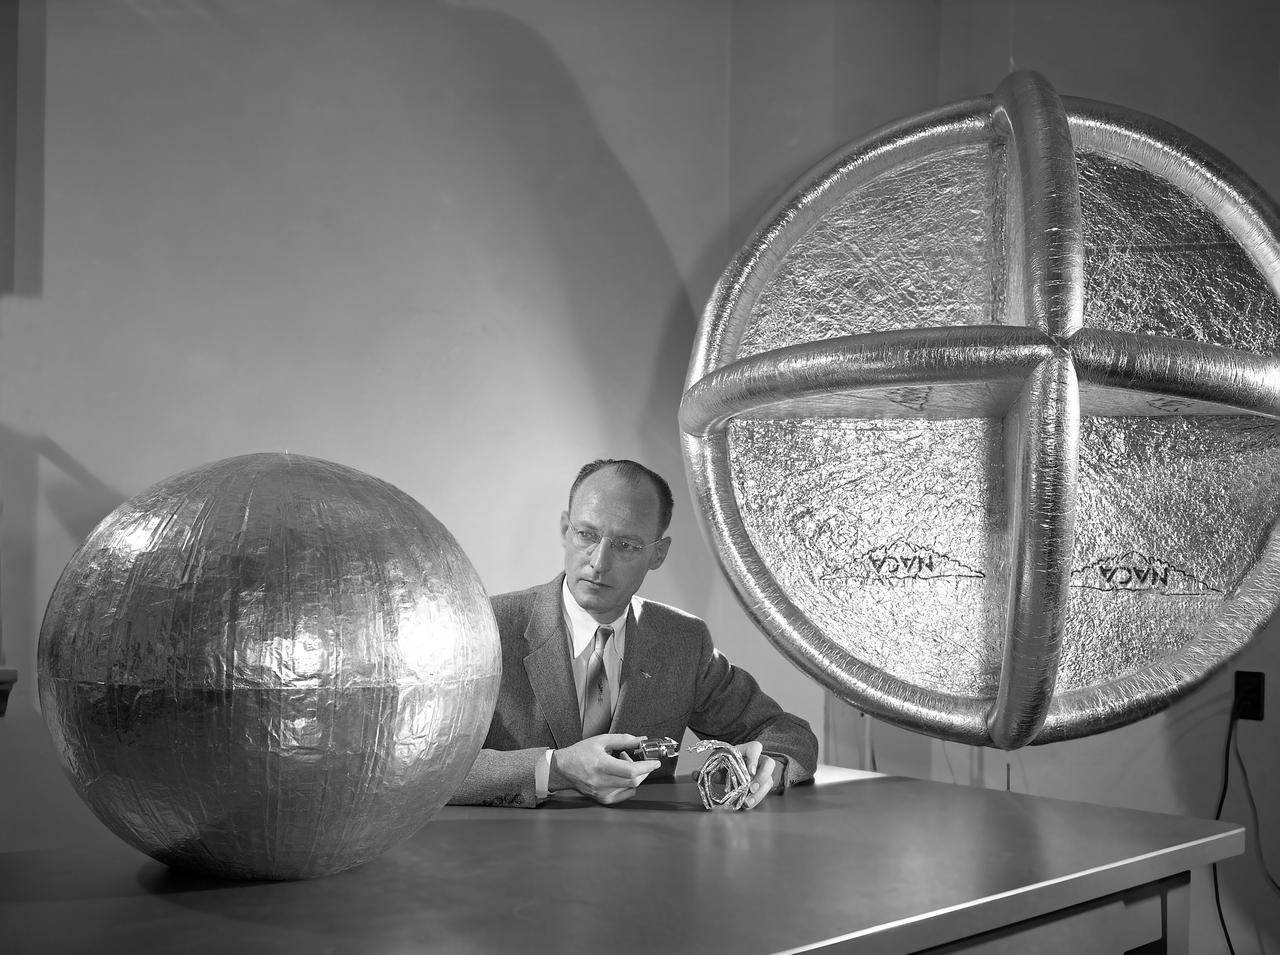
William J. O Sullivan at desk with folded subsatellite, 30 inch subsatellite, 12 foot subsatellite, and corner reflector.

William J. O Sullivan at desk with folded subsatellite, 30 inch subsatellite, 12 foot subsatellite, and corner reflector.
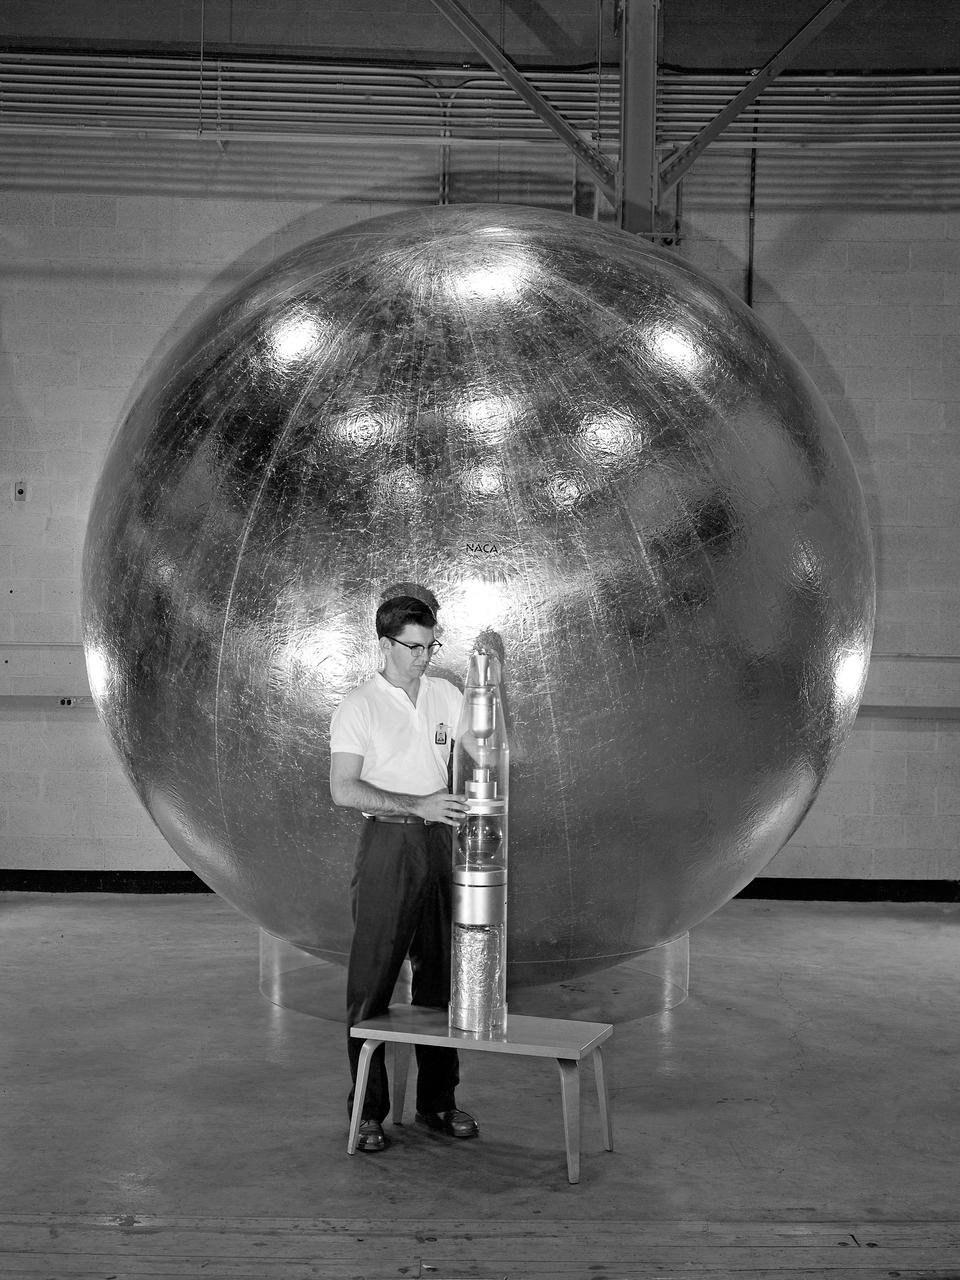
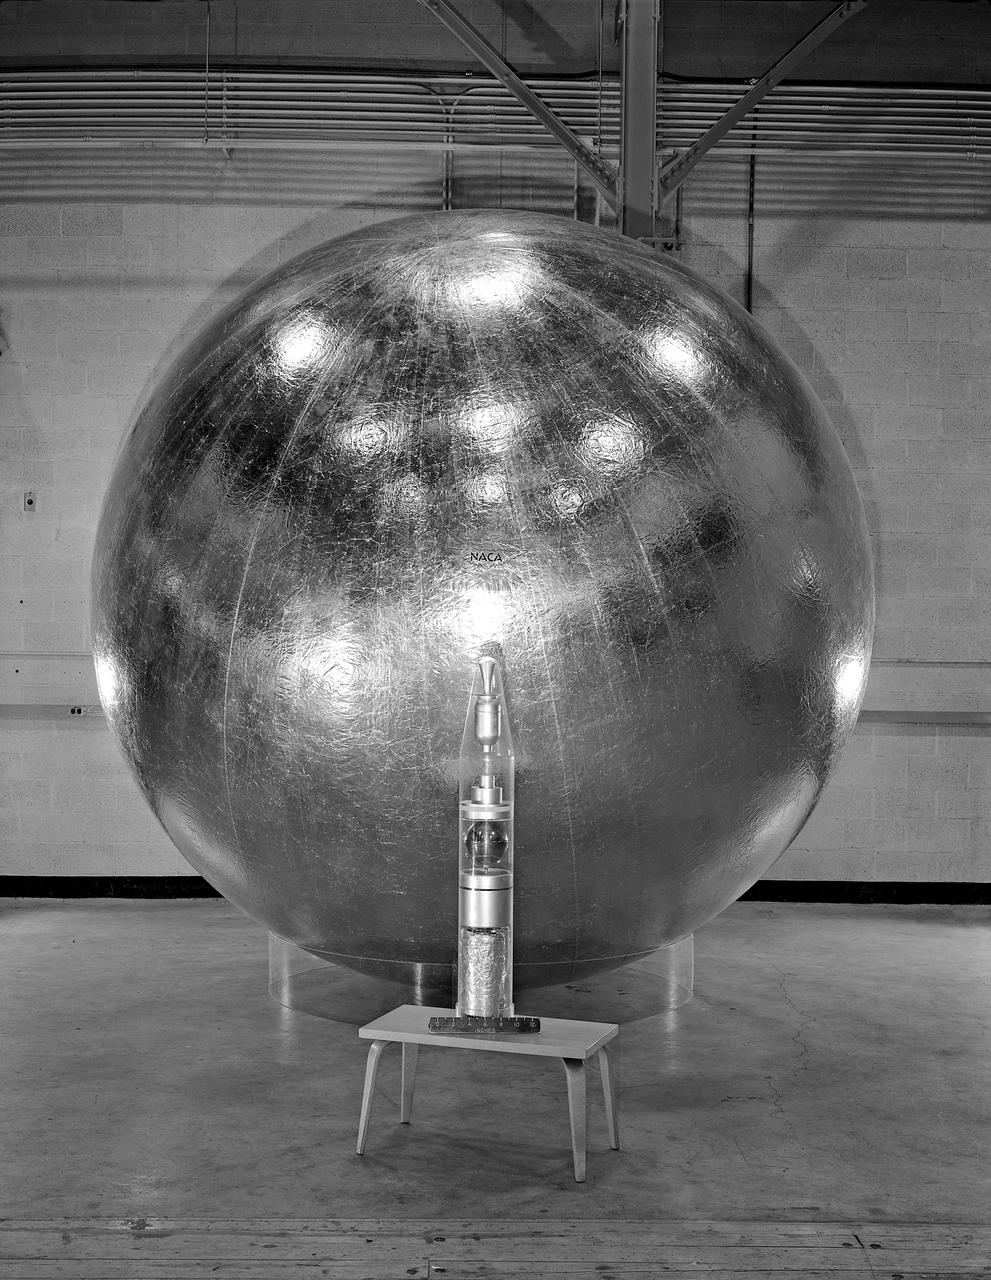
Engineer and 12 foot Beacon showing NACA emblem on inflated satelloon . For related information see, Spaceflight Revolution, NASA from Sputnik to Apollo, by James R. Hansen. NASA SP-4308, 1995. p. 173.
Engineer and 12 foot Beacon showing NACA emblem on inflated satelloon . For related information see, Spaceflight Revolution, NASA from Sputnik to Apollo, by James R. Hansen. NASA SP-4308, 1995. p. 173.
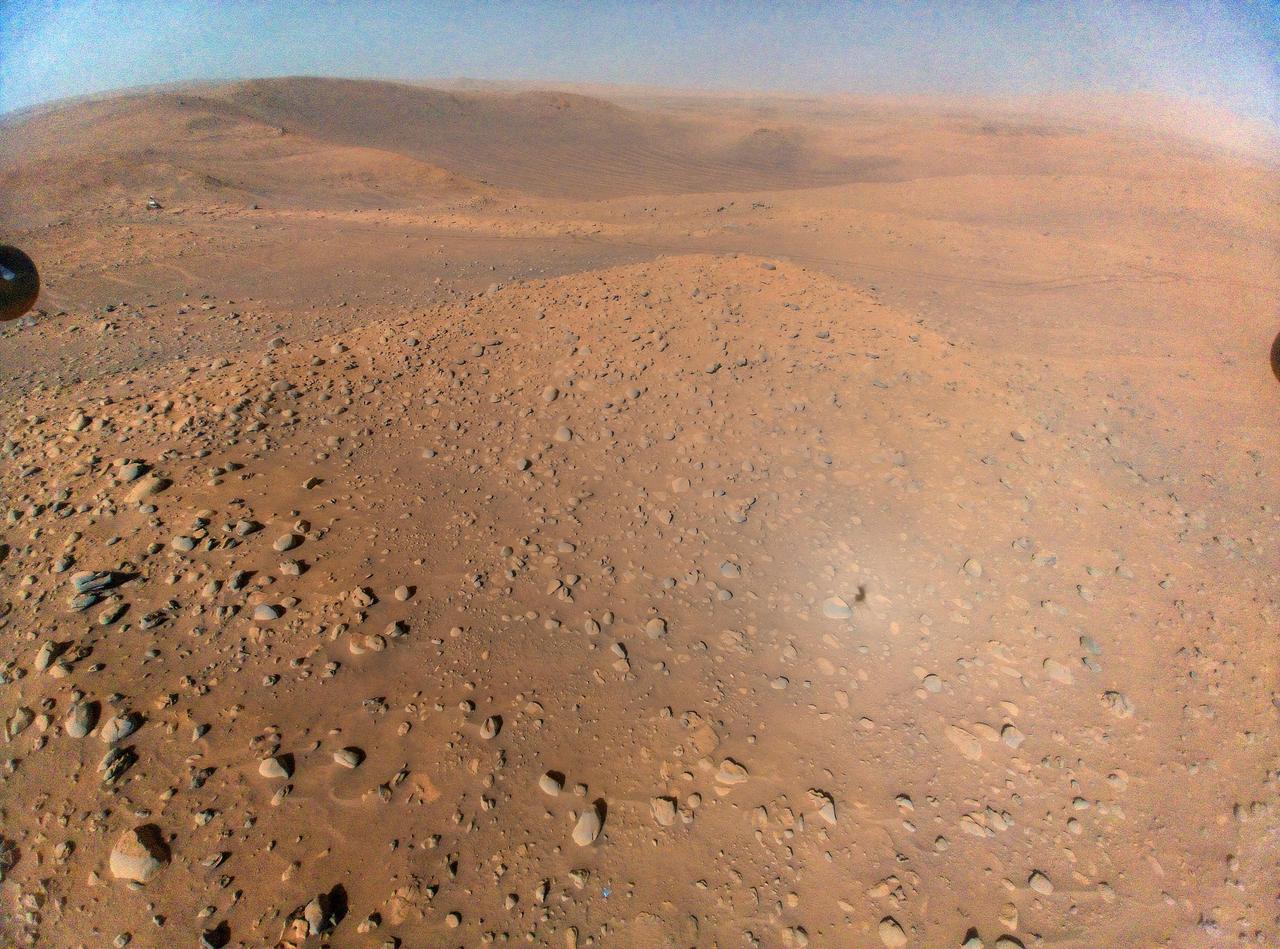
This image of NASA's Perseverance Mars rover at the rim of Belva Crater was taken by the agency's Ingenuity Mars Helicopter during the rotorcraft's 51st flight on April 22, 2023, the 772nd Martian day, or sol, of the rover's mission. At the time the image was taken, the helicopter was at an altitude of about 40 feet (12 meters). The rover is in the upper left of the image, parked at a light-toned rocky outcrop the science team is calling "Echo Creek." Perseverance's tracks can be seen extending from its location to the upper-right side of image. The helicopter's shadow can be seen on the rocky hill in the foreground, just to the right and below the image's center. The hill, designated "Mount Julian" by the science team, is a planned future stop for the rover. A small triangular piece of debris from the rover's entry, descent, and landing system can be seen at the lower center of image. https://photojournal.jpl.nasa.gov/catalog/PIA25884
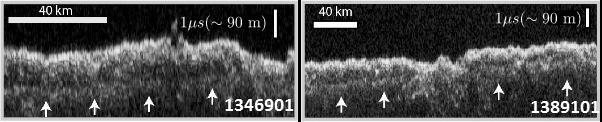
These two images show data acquired by the Shallow Radar (SHARAD) instrument while passing over two ground tracks in a part of Mars' Utopia Planitia region where the orbiting, ground-penetrating radar detected subsurface deposits rich in water ice. The instrument on NASA's Mars Reconnaissance Orbiter emits radio waves and times their echo off of radio-reflective surfaces and interfaces on Mars. The white arrows indicate a subsurface reflector interpreted as the bottom of the ice-rich deposit. The deposit is about as large in area as the state of New Mexico and contains about as much water as Lake Superior. The horizontal scale bar indicates 40 kilometers (25 miles) along the ground track of the radar, as flown by the orbiter overhead. The vertical scale bar indicates a return time of one microsecond for the reflected radio signal, equivalent to a distance of about 90 meters (295 feet). http://photojournal.jpl.nasa.gov/catalog/PIA21137
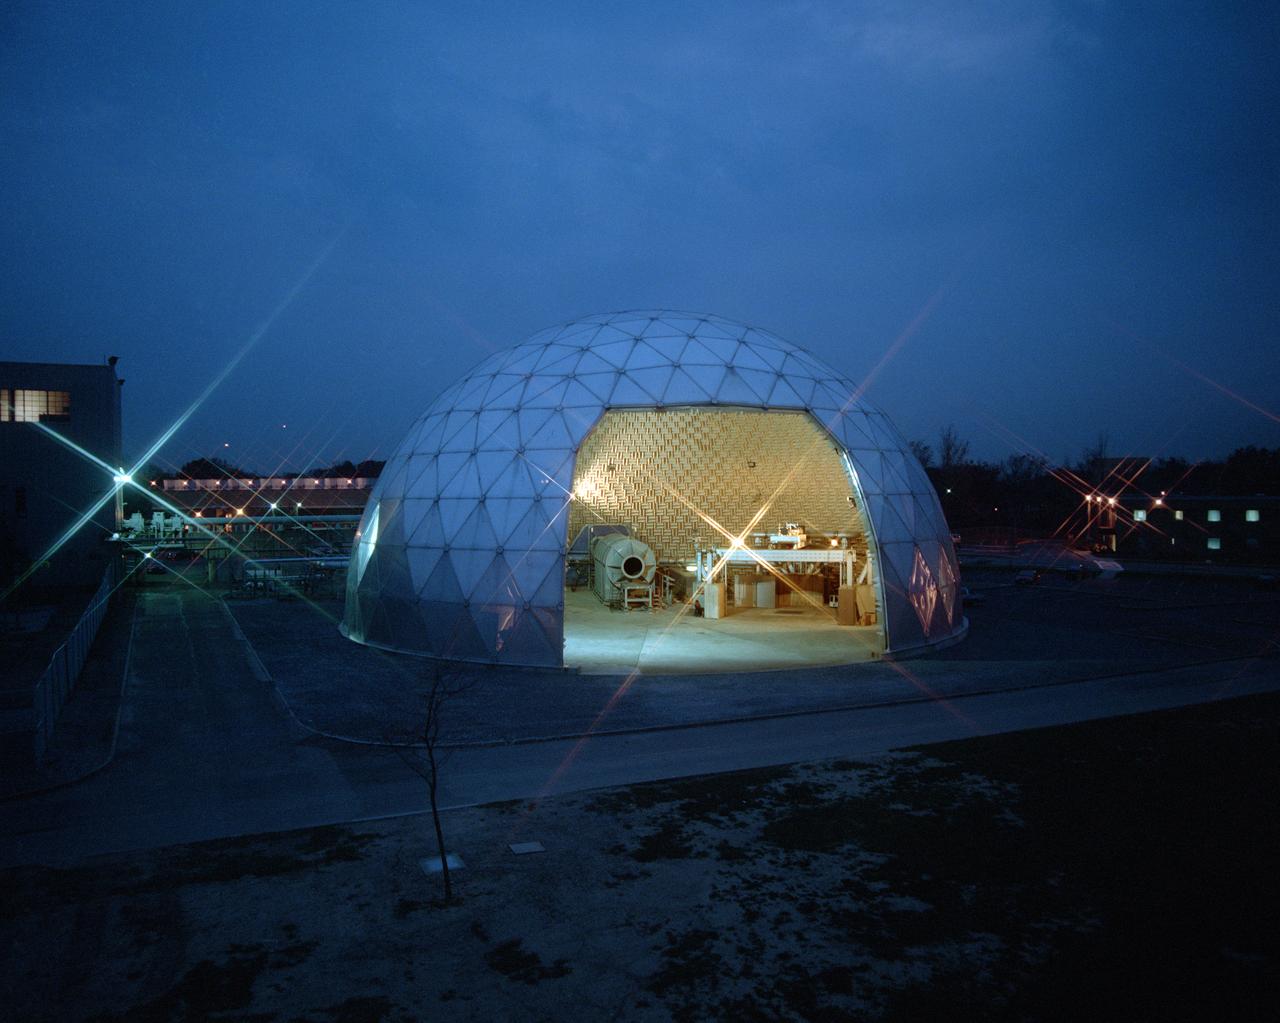
Modern jet engines are loud, but they used to be much louder. NASA’s Glenn Research Center has been at the forefront of the nation’s efforts to reduce aircraft engine noise for over 70 years. During this time, the center has built an array of test facilities to carry out this work, culminating in the Aero-Acoustic Propulsion Laboratory (AAPL), a world-class noise-reduction research facility. The AAPL, referred to as “the dome,” contains multiple test rigs enclosed in a large, echo-free chamber. The unique 130-foot diameter and 65-foot-high hemispherical structure stands out on Glenn’s campus. Its triangular sections make it appear like a golf ball rising from the ground. The interior is covered in spiky, fiberglass sound-dampening wedges and an overhead array of microphones that capture engine noise data.
L57-525 Engineer W.J. O Sullivan, Jr., looks at inflated 20 inch subsatellite while holding inflation bottle and folded duplicate copy, February 1957. Photograph published in A New Dimension Wallops Island Flight Test Range: The First Fifteen Years by Joseph Shortal. A NASA publication. Page 601.
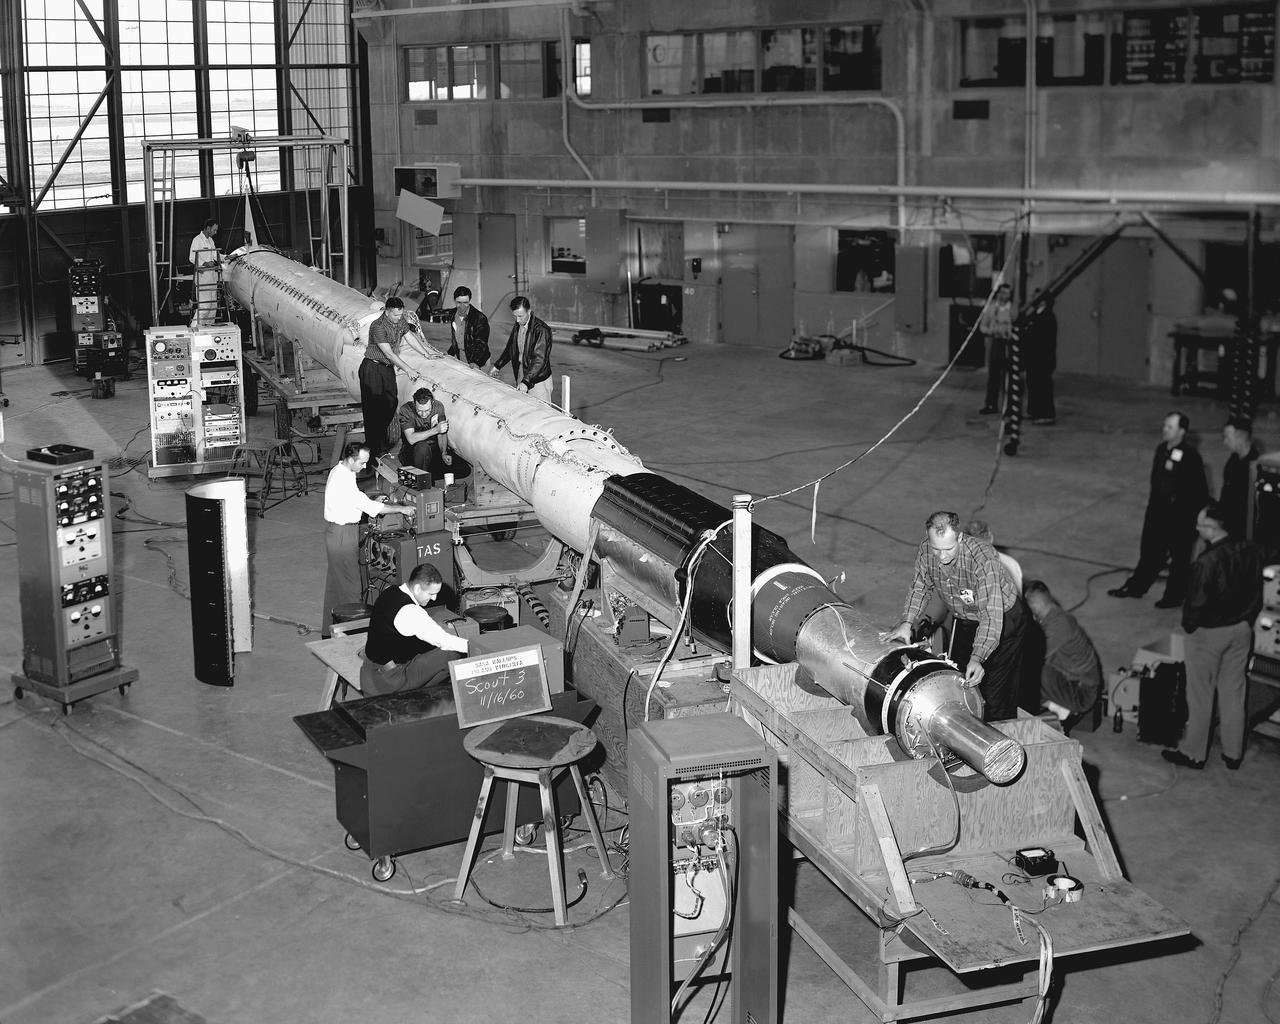
Employees of Vought Astronautic, Scout's prime contractor, work with NASA technicians to prepare ST-3 for launch. Unfortunately, this rocket would fail because of the second-stage misfire.
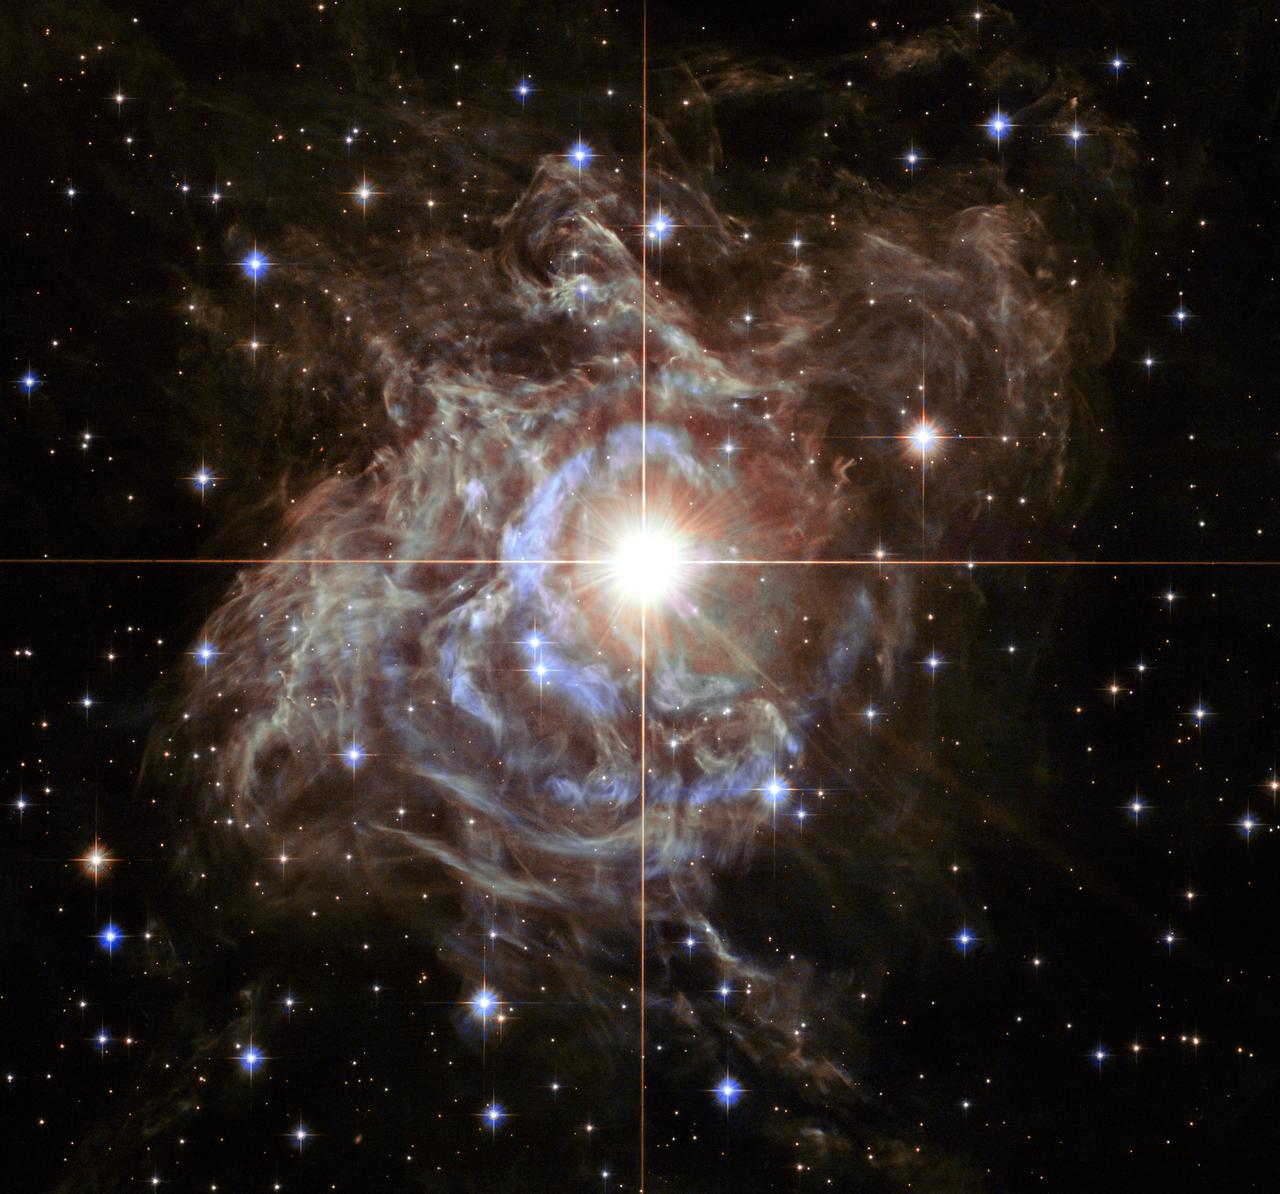
This festive NASA Hubble Space Telescope image resembles a holiday wreath made of sparkling lights. The bright southern hemisphere star RS Puppis, at the center of the image, is swaddled in a gossamer cocoon of reflective dust illuminated by the glittering star. The super star is ten times more massive than our sun and 200 times larger. RS Puppis rhythmically brightens and dims over a six-week cycle. It is one of the most luminous in the class of so-called Cepheid variable stars. Its average intrinsic brightness is 15,000 times greater than our sun’s luminosity. The nebula flickers in brightness as pulses of light from the Cepheid propagate outwards. Hubble took a series of photos of light flashes rippling across the nebula in a phenomenon known as a "light echo." Even though light travels through space fast enough to span the gap between Earth and the moon in a little over a second, the nebula is so large that reflected light can actually be photographed traversing the nebula. By observing the fluctuation of light in RS Puppis itself, as well as recording the faint reflections of light pulses moving across the nebula, astronomers are able to measure these light echoes and pin down a very accurate distance. The distance to RS Puppis has been narrowed down to 6,500 light-years (with a margin of error of only one percent). The Hubble Space Telescope is a project of international cooperation between NASA and the European Space Agency. NASA's Goddard Space Flight Center in Greenbelt, Md., manages the telescope. The Space Telescope Science Institute (STScI) in Baltimore, Md., conducts Hubble science operations. STScI is operated by the Association of Universities for Research in Astronomy, Inc., in Washington, D.C. Acknowledgment: H. Bond (STScI and Pennsylvania State University) <b><a href="http://www.nasa.gov/audience/formedia/features/MP_Photo_Guidelines.html" rel="nofollow">NASA image use policy.</a></b> <b><a href="http://www.nasa.gov/centers/goddard/home/index.html" rel="nofollow">NASA Goddard Space Flight Center</a></b> enables NASA’s mission through four scientific endeavors: Earth Science, Heliophysics, Solar System Exploration, and Astrophysics. Goddard plays a leading role in NASA’s accomplishments by contributing compelling scientific knowledge to advance the Agency’s mission. <b>Follow us on <a href="http://twitter.com/NASA_GoddardPix" rel="nofollow">Twitter</a></b> <b>Like us on <a href="http://www.facebook.com/pages/Greenbelt-MD/NASA-Goddard/395013845897?ref=tsd" rel="nofollow">Facebook</a></b> <b>Find us on <a href="http://instagram.com/nasagoddard?vm=grid" rel="nofollow">Instagram</a></b>

On the left is a radar image of asteroid 1998 WT24 taken in December 2001 by scientists using NASA's the 230-foot (70-meter) DSS-14 antenna at Goldstone, California. On the right is a radar image of the same asteroid acquired on Dec. 11, 2015, during the asteroid's most recent Earth flyby. The radar images from 2001 (on the left), have a resolution of about 60 feet (19 meters) per pixel. The radar image from 2015 (on the right) achieved a spatial resolution as fine as 25 feet (7.5 meters) per pixel. The 2015 radar image was obtained using the same DSS-14 antenna at Goldstone to transmit high-power microwaves toward the asteroid. However, this time, the radar echoes bounced off the asteroid were received by the National Radio Astronomy Observatory's 100-meter (330-foot) Green Bank Telescope in West Virginia. The next visit of asteroid 1998 WT24 to Earth's neighborhood will be on Nov. 11, 2018, when it will make a distant pass at about 12.5-million miles (52 lunar distances). http://photojournal.jpl.nasa.gov/catalog/PIA20216

JOHNSON SPACE CENTER, Houston - The STS-114 patch design signifies the return of the Space Shuttle to flight and honors the memory of the STS-107 Columbia crew. The blue Shuttle rising above Earth’s horizon includes the Columbia constellation of seven stars, echoing the STS-107 patch and commemorating the seven members of that mission. The crew of STS-114 will carry the memory of their friends on Columbia and the legacy of their mission back into Earth orbit. The dominant design element of the STS-114 patch is the planet Earth, which represents the unity and dedication of the many people whose efforts allows the Shuttle to safely return to flight. Against the background of the Earth at night, the blue orbit represents the International Space Station (ISS), with the EVA crewmembers named on the orbit. The red sun on the orbit signifies the contributions of the Japanese Space Agency to the mission and to the ISS program. The multi-colored Shuttle plume represents the broad spectrum of challenges for this mission, including Shuttle inspection and repair experiments, and International Space Station re-supply and repair. The NASA insignia design for Shuttle flights is reserved for use by the astronauts and for other official use as the NASA Administrator may authorize. Public availability has been approved only in the forms of illustrations by the various news media. When and if there is any change in this policy, which is not anticipated, the change will be publicly announced.
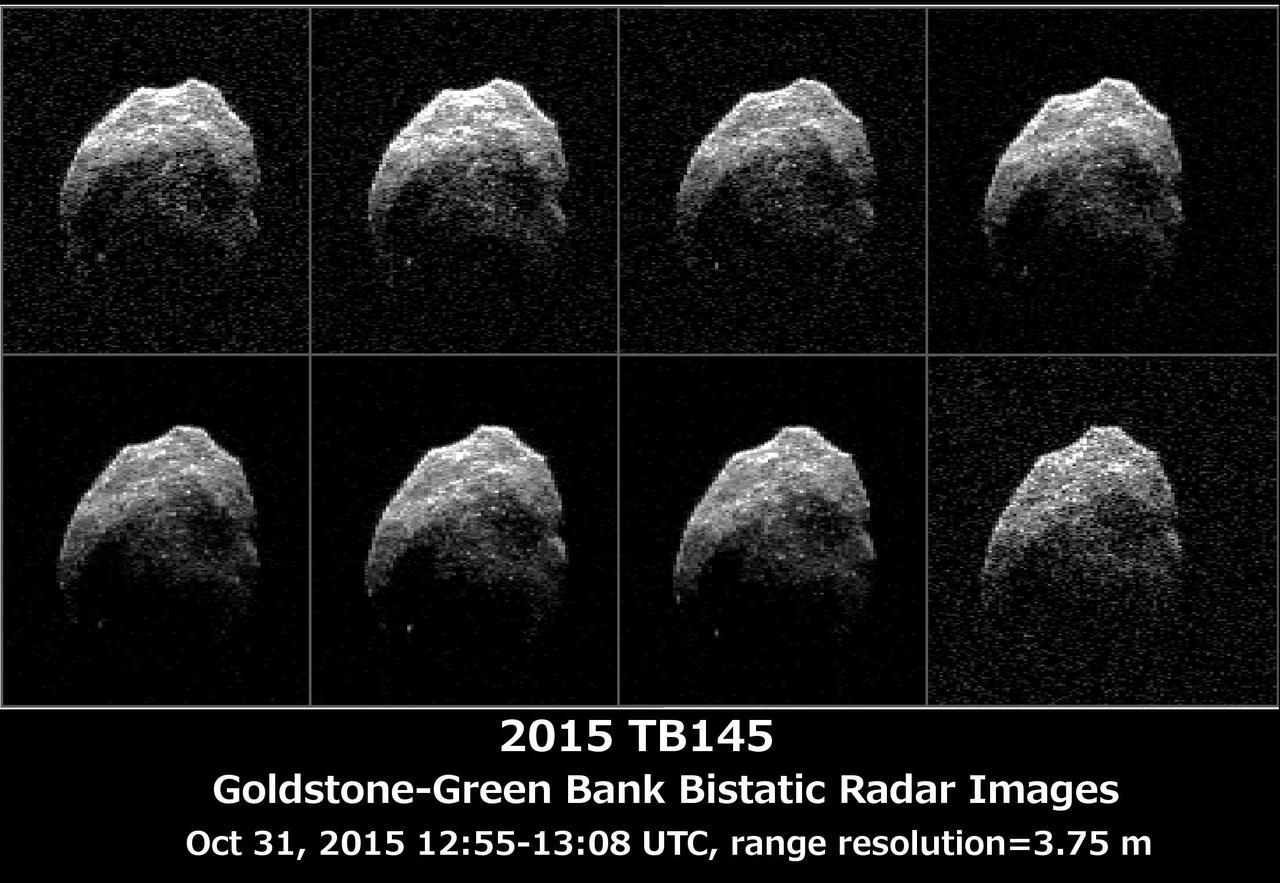
The 230-foot 70-meter DSS-14 antenna at Goldstone, Ca. obtained these radar images of asteroid 2015 TB145 on Oct. 31, 2015. Asteroid 2015 TB145 is depicted in eight individual radar images collected on Oct. 31, 2015 between 5:55 a.m. PDT (8:55 a.m. EDT) and 6:08 a.m. PDT (9:08 a.m. EDT). At the time the radar images were taken, the asteroid was between 440,000 miles (710,000 kilometers) and about 430,000 miles (690,000 kilometers) distant. Asteroid 2015 TB145 safely flew past Earth on Oct. 31, at 10:00 a.m. PDT (1 p.m. EDT) at about 1.3 lunar distances (300,000 miles, 480,000 kilometers). To obtain the radar images, the scientists used the 230-foot (70-meter) DSS-14 antenna at Goldstone, California, to transmit high power microwaves toward the asteroid. The signal bounced of the asteroid, and their radar echoes were received by the National Radio Astronomy Observatory's 100-meter (330-foot) Green Bank Telescope in West Virginia. The images achieve a spatial resolution of about 13 feet (4 meters) per pixel. http://photojournal.jpl.nasa.gov/catalog/PIA20043
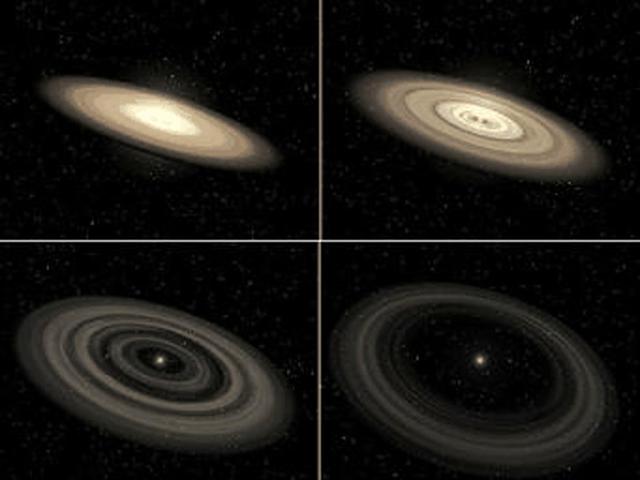
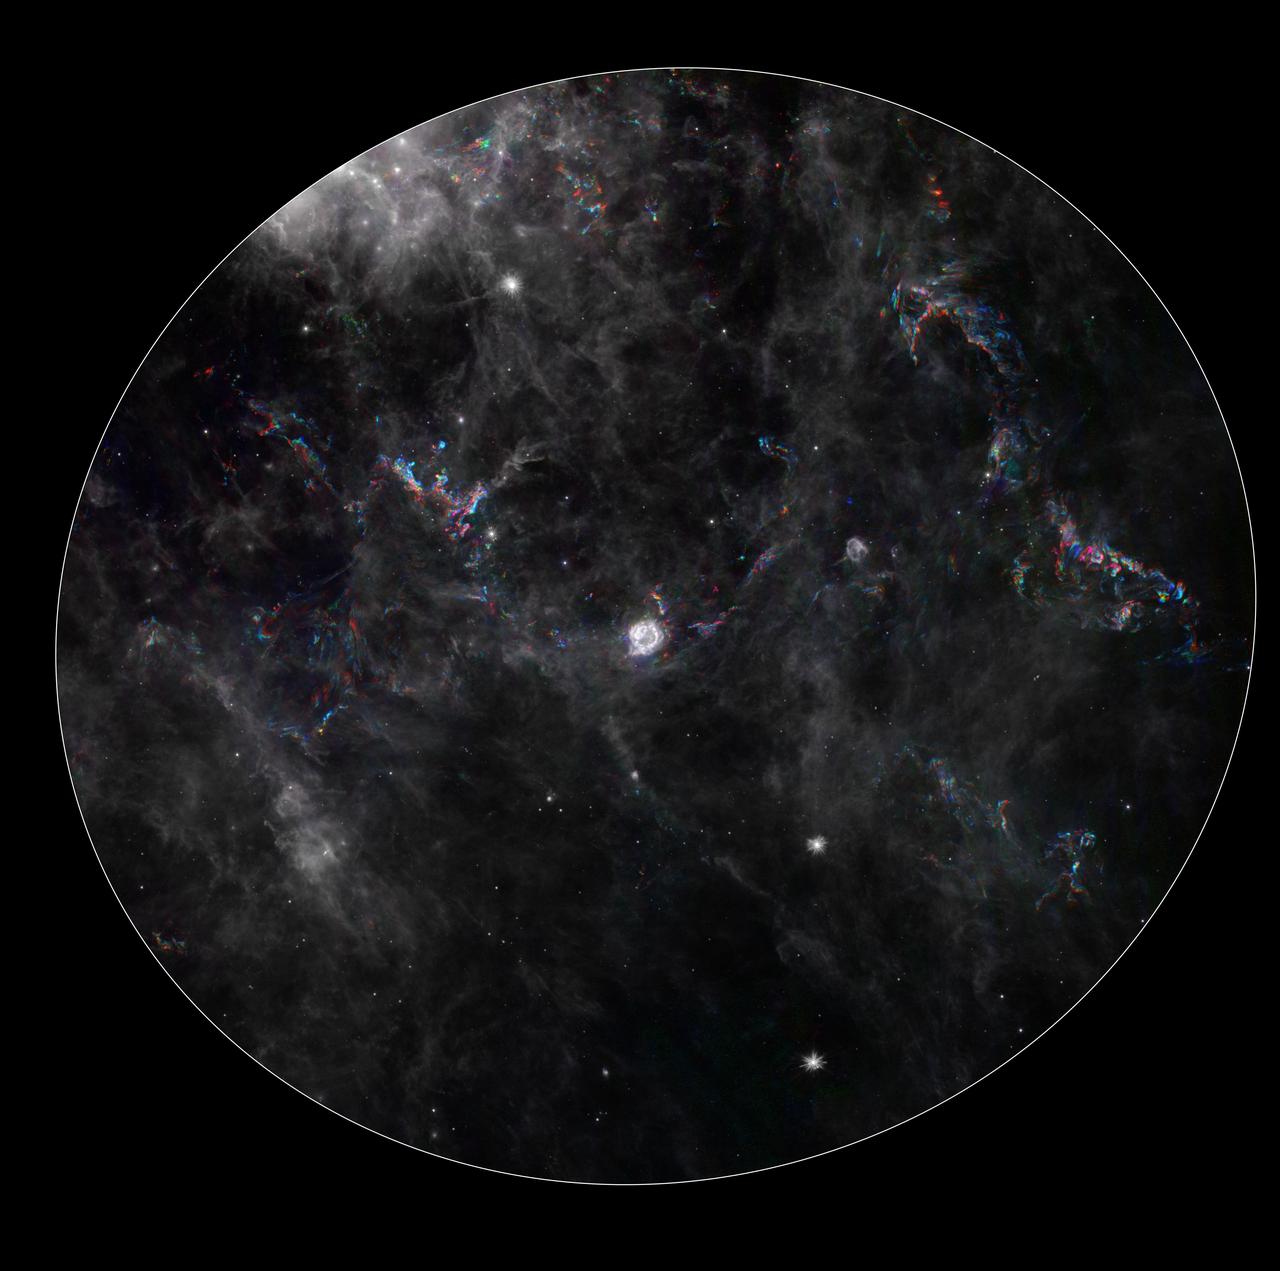
This frame from an animation shows the evolution of a planet-forming disk around a star. Initially, the young disk is bright and thick with dust, providing raw materials for building planets. In the first 10 million years or so, gaps appear within the disk as newborn planets coalesce out of the dust, clearing out a path. In time, this planetary "debris disk" thins out as gravitational interactions with numerous planets slowly sweep away the dust. Steady pressure from the starlight and solar winds also blows out the dust. After a few billion years, only a thin ring remains in the outermost reaches of the system, a faint echo of the once-brilliant disk. Our own solar system has a similar debris disk -- a ring of comets called the Kuiper Belt. Leftover dust in the inner portion of the solar system is known as "zodiacal dust." Bright, young disks can be imaged directly by visible-light telescopes, such as NASA's Hubble Space Telescope. Older, fainter debris disks can be detected only by infrared telescopes like NASA's Spitzer Space Telescope, which sense the disks' dim heat. http://photojournal.jpl.nasa.gov/catalog/PIA07099
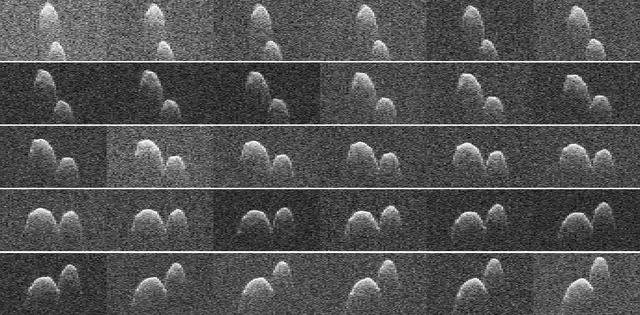
This collage of radar images of near-Earth asteroid 1999 JD6 was collected by NASA scientists on July 25, 2015. The images show the rotation of the asteroid, which made its closest approach on July 24 at 9:55 p.m. PDT (12:55 a.m. EDT on July 25) at a distance of about 4.5 million miles (7.2 million kilometers, or about 19 times the distance from Earth to the moon). The asteroid appears to be a contact binary -- an asteroid with two lobes that are stuck together. These views, which are radar echoes, were obtained by pairing NASA's 230-foot-wide (70-meter) Deep Space Network antenna at Goldstone, California, with the 330-foot (100-meter) National Science Foundation Green Bank Telescope in West Virginia. Using this approach, the Goldstone antenna beams a radar signal at an asteroid and Green Bank receives the reflections. The technique, referred to as a bistatic observation, dramatically improves the amount of detail that can be seen in radar images. The new views obtained with the technique show features as small as about 25 feet (7.5 meters) wide. The images show the asteroid is highly elongated, with a length of approximately 1.2 miles (2 kilometers) on its long axis. http://photojournal.jpl.nasa.gov/catalog/PIA19647
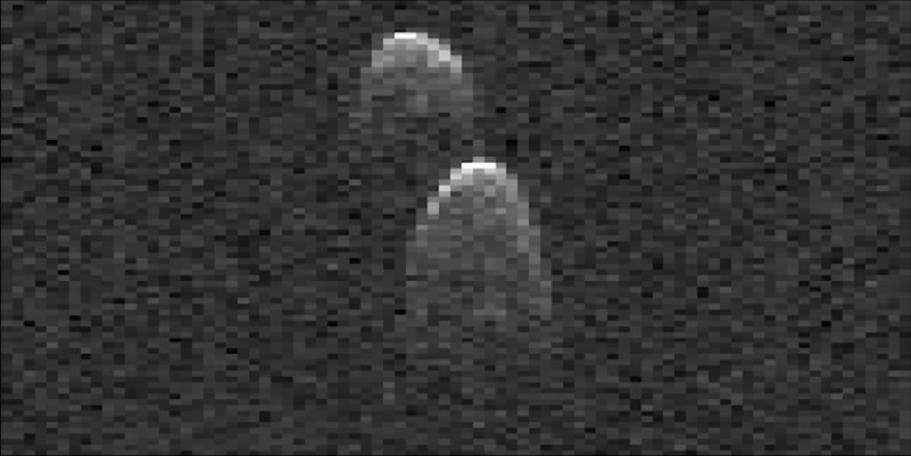
This frame from a movie made from radar images of asteroid 1999 JD6 was collected by NASA scientists on July 25, 2015. The images show the rotation of the asteroid, which made its closest approach on July 24 at 9:55 p.m. PDT (12:55 a.m. EDT on July 25) at a distance of about 4.5 million miles (7.2 million kilometers, or about 19 times the distance from Earth to the moon). The asteroid appears to be a contact binary -- an asteroid with two lobes that are stuck together. The radar images show the asteroid is highly elongated, with a length of approximately 1.2 miles (2 kilometers) on its long axis. These images are radar echoes, which are more like a sonogram than a photograph. The views were obtained by pairing NASA's 230-foot-wide (70-meter) Deep Space Network antenna at Goldstone, California, with the 330-foot (100-meter) National Science Foundation Green Bank Telescope in West Virginia. Using this approach, the Goldstone antenna beams a radar signal at an asteroid and Green Bank receives the reflections. The technique, referred to as a bistatic observation, dramatically improves the amount of detail that can be seen in radar images. The new views obtained with the technique show features as small as about 25 feet (7.5 meters) wide. http://photojournal.jpl.nasa.gov/catalog/PIA19646
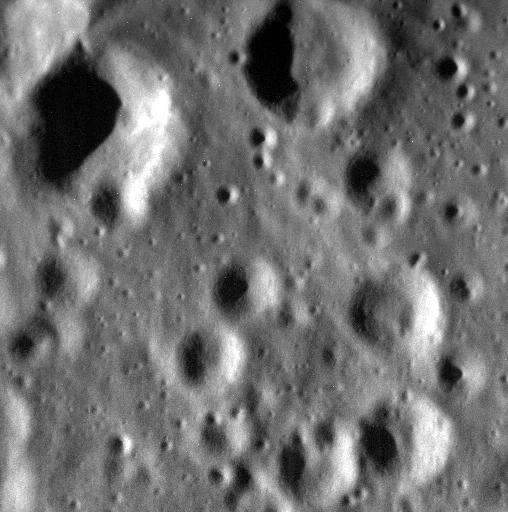
This image is located just inside the southern rim of Chong Chol crater and was obtained on April 25, 2015, the day following NASA MESSENGER final orbital correction maneuver. The spacecraft fuel tanks are now completely empty, and there is no means to prevent the Sun's gravity from pulling MESSENGER's orbit closer and closer to the surface of Mercury. Impact is expected to occur on April 30, 2015. The image is located just inside the southern rim of Chong Chol crater, named for a Korean poet of the 1500s. It is challenging to obtain good images when the spacecraft is very low above the planet, because of the high speed at which the camera's field of view is moving across the surface. Very short exposure times are used to limit smear, and this image was binned from its original size of 1024 x 1024 pixels to 512 x 512 to improve the image quality. The title of today's image is a line from "September Song" (composed by Kurt Weill, with lyrics by Maxwell Anderson. The song was subsequently covered by artists including Ian McCulloch of Echo & the Bunnymen, Lou Reed, and Bryan Ferry). Date acquired: April 25, 2015 Image Mission Elapsed Time (MET): 72264694 Image ID: 8392292 Instrument: Narrow Angle Camera (NAC) of the Mercury Dual Imaging System (MDIS) Center Latitude: 45.43° N Center Longitude: 298.62° E Resolution: 2.1 meters/pixel Scale: The scene is about 2.1 km (1.3 miles) across. This image has not been map projected. Incidence Angle: 69.9° Emission Angle: 20.1° Phase Angle: 90.0° http://photojournal.jpl.nasa.gov/catalog/PIA19436
During its final targeted flyby of Titan on April 22, 2017, Cassini's radar mapper got the mission's last close look at the moon's surface. On this 127th targeted pass by Titan (unintuitively named "T-126"), the radar was used to take two images of the surface, shown at left and right. Both images are about 200 miles (300 kilometers) in width, from top to bottom. Objects appear bright when they are tilted toward the spacecraft or have rough surfaces; smooth areas appear dark. At left are the same bright, hilly terrains and darker plains that Cassini imaged during its first radar pass of Titan, in 2004. Scientists do not see obvious evidence of changes in this terrain over the 13 years since the original observation. At right, the radar looked once more for Titan's mysterious "magic island" (PIA20021) in a portion of one of the large hydrocarbon seas, Ligeia Mare. No "island" feature was observed during this pass. Scientists continue to work on what the transient feature might have been, with waves and bubbles being two possibilities. In between the two parts of its imaging observation, the radar instrument switched to altimetry mode, in order to make a first-ever (and last-ever) measurement of the depths of some of the lakes that dot the north polar region. For the measurements, the spacecraft pointed its antenna straight down at the surface and the radar measured the time delay between echoes from the lakes' surface and bottom. A graph is available at https://photojournal.jpl.nasa.gov/catalog/PIA21626
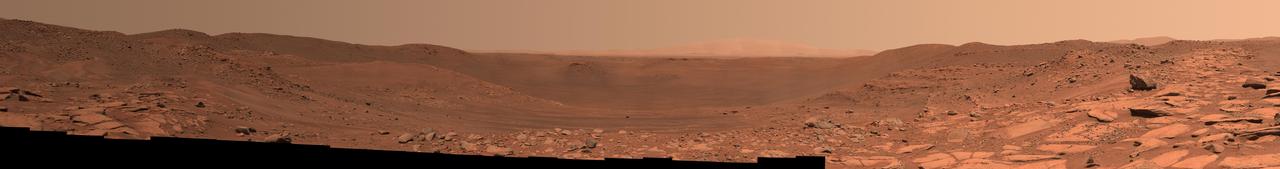
This view of the interior of Belva Crater was generated using data collected by the Mastcam-Z instrument aboard NASA's Perseverance Mars rover on April 22, 2023, the 772nd Martian day, or sol, of the mission. When the 152 individual images that make up this mosaic were taken, the rover was parked at the west side of the crater's rim, on a light-toned rocky outcrop the science team is calling "Echo Creek." Belva Crater is about 0.6 miles (0.9 kilometers) in diameter. The view here is looking across the crater towards the distant east-northeast wall of the much-larger Jezero Crater (center of the image), some 25 miles (40 kilometers) away. Impact craters like Belva can offer grand views and contain vertical cuts that provide important clues to the geologic history of the area. The mosaic shows multiple locations of bedrock exposed in vertical cross-section. One of these exposed sections of bedrock (located on the hill seen between the 60 and 75 hashmarks) is angled steeply downward and is nearly 65 feet (20 meters) tall. Called "dipping beds," such a steeply angled bedrock section could indicate the presence of a large Martian sandbar made of sediment that billions of years ago was deposited by a river flowing into the lake that Jezero Crater once held. The most distant point on Belva Crater's rim (just to the left of center in the mosaic) is about 3,500 feet (1,060 meters) away from the rover. The large boulder seen in the far right of the mosaic is about 65 feet (20 meters) away and is about 5 feet (1.5 meters) in diameter. Arizona State University leads the operations of the Mastcam-Z instrument, working in collaboration with Malin Space Science Systems in San Diego, on the design, fabrication, testing, and operation of the cameras, and in collaboration with the Niels Bohr Institute of the University of Copenhagen on the design, fabrication, and testing of the calibration targets. A key objective for Perseverance's mission on Mars is astrobiology, including the search for signs of ancient microbial life. The rover will characterize the planet's geology and past climate, pave the way for human exploration of the Red Planet, and be the first mission to collect and cache Martian rock and regolith (broken rock and dust). Subsequent NASA missions, in cooperation with ESA (European Space Agency), would send spacecraft to Mars to collect these sealed samples from the surface and return them to Earth for in-depth analysis. The Mars 2020 Perseverance mission is part of NASA's Moon to Mars exploration approach, which includes Artemis missions to the Moon that will help prepare for human exploration of the Red Planet. https://photojournal.jpl.nasa.gov/catalog/PIA25889
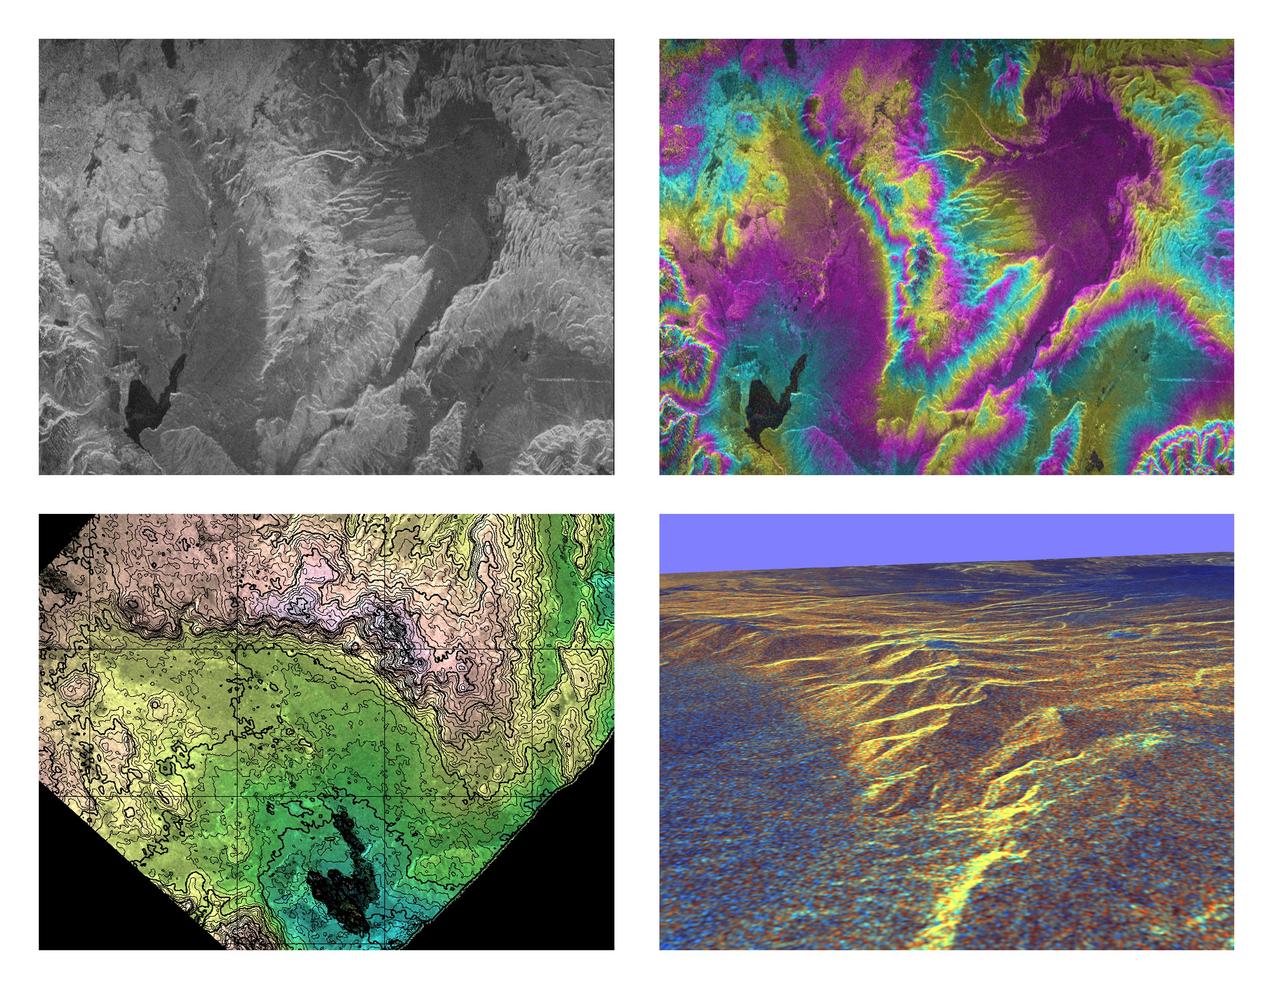
These four images of the Long Valley region of east-central California illustrate the steps required to produced three dimensional data and topographics maps from radar interferometry. All data displayed in these images were acquired by the Spaceborne Imaging Radar-C/X-band Synthetic Aperture Radar (SIR-C/X-SAR) aboard the space shuttle Endeavour during its two flights in April and October, 1994. The image in the upper left shows L-band (horizontally transmitted and received) SIR-C radar image data for an area 34 by 59 kilometers (21 by 37 miles). North is toward the upper right; the radar illumination is from the top of the image. The bright areas are hilly regions that contain exposed bedrock and pine forest. The darker gray areas are the relatively smooth, sparsely vegetated valley floors. The dark irregular patch near the lower left is Lake Crowley. The curving ridge that runs across the center of the image from top to bottom is the northeast rim of the Long Valley Caldera, a remnant crater from a massive volcanic eruption that occurred about 750,000 years ago. The image in the upper right is an interferogram of the same area, made by combining SIR-C L-band data from the April and October flights. The colors in this image represent the difference in the phase of the radar echoes obtained on the two flights. Variations in the phase difference are caused by elevation differences. Formation of continuous bands of phase differences, known as interferometric "fringes," is only possible if the two observations were acquired from nearly the same position in space. For these April and October data takes, the shuttle tracks were less than 100 meters (328 feet) apart. The image in the lower left shows a topographic map derived from the interferometric data. The colors represent increments of elevation, as do the thin black contour lines, which are spaced at 50-meter (164-foot) elevation intervals. Heavy contour lines show 250-meter intervals (820-foot). Total relief in this area is about 1,320 meters (4,330 feet). Brightness variations come from the radar image, which has been geometrically corrected to remove radar distortions and rotated to have north toward the top. The image in the lower right is a three-dimensional perspective view of the northeast rim of the Long Valley caldera, looking toward the northwest. SIR-C C-band radar image data are draped over topographic data derived from the interferometry processing. No vertical exaggeration has been applied. Combining topographic and radar image data allows scientists to examine relationships between geologic structures and landforms, and other properties of the land cover, such as soil type, vegetation distribution and hydrologic characteristics. http://photojournal.jpl.nasa.gov/catalog/PIA01770