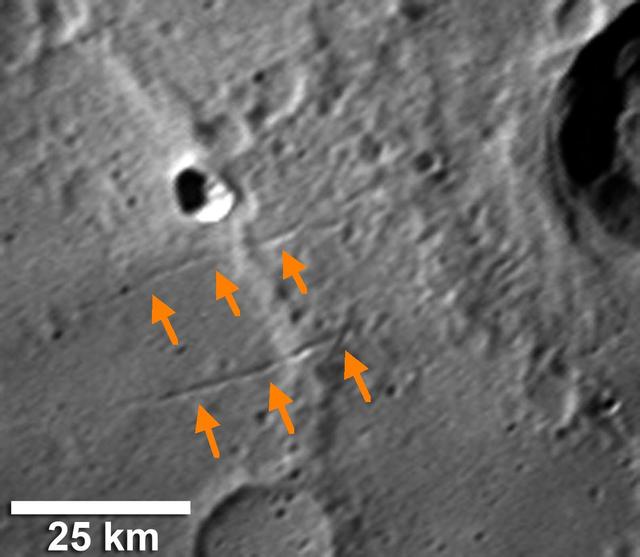
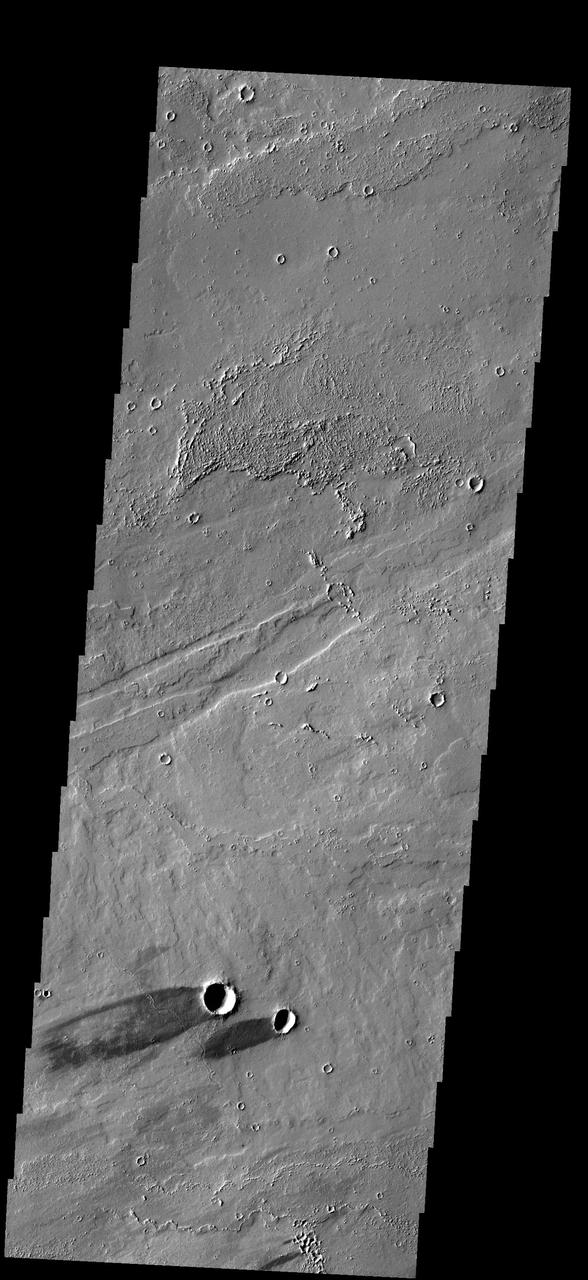
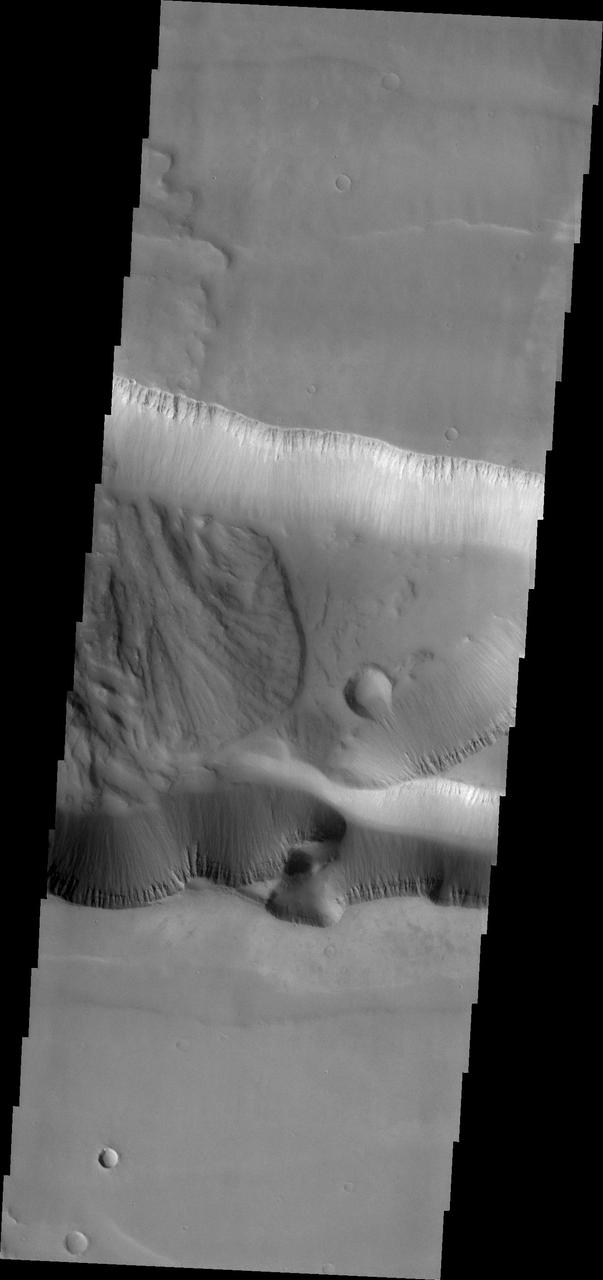
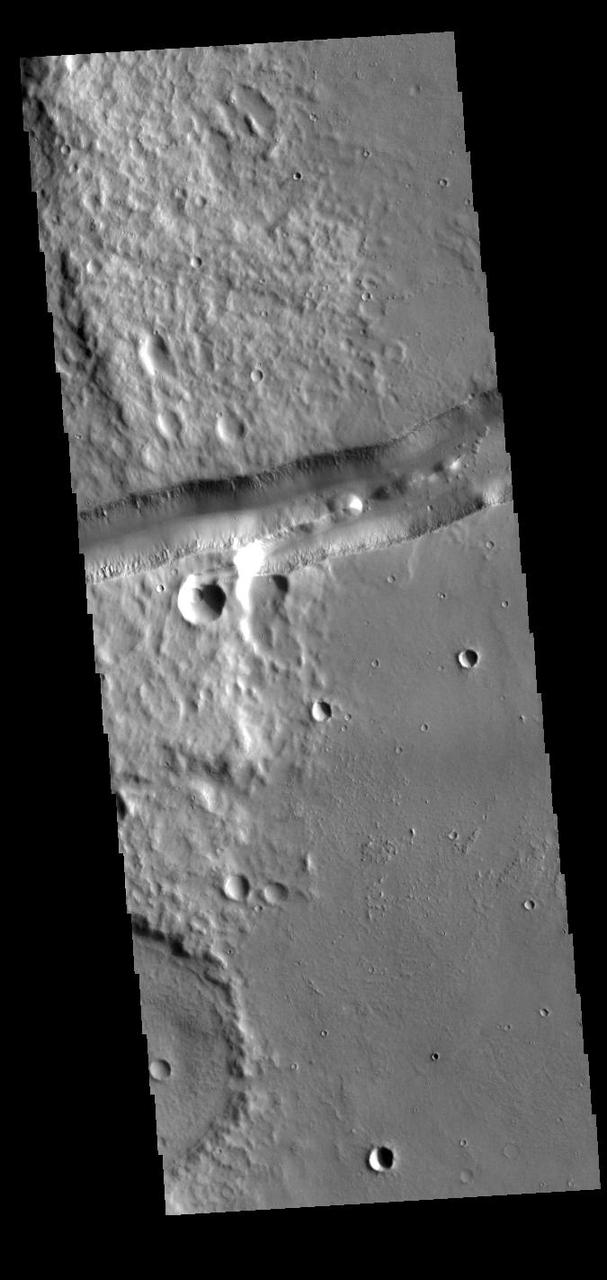
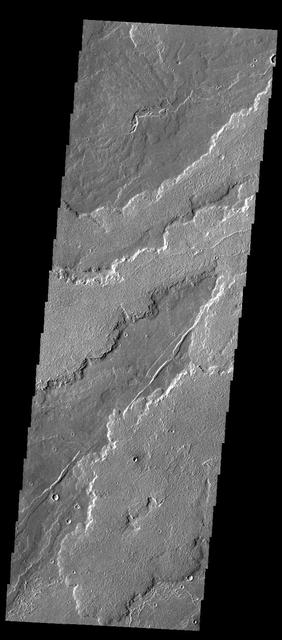
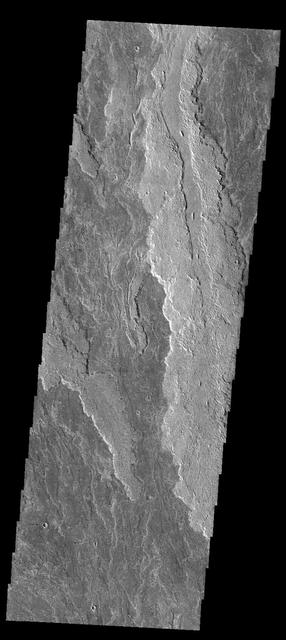
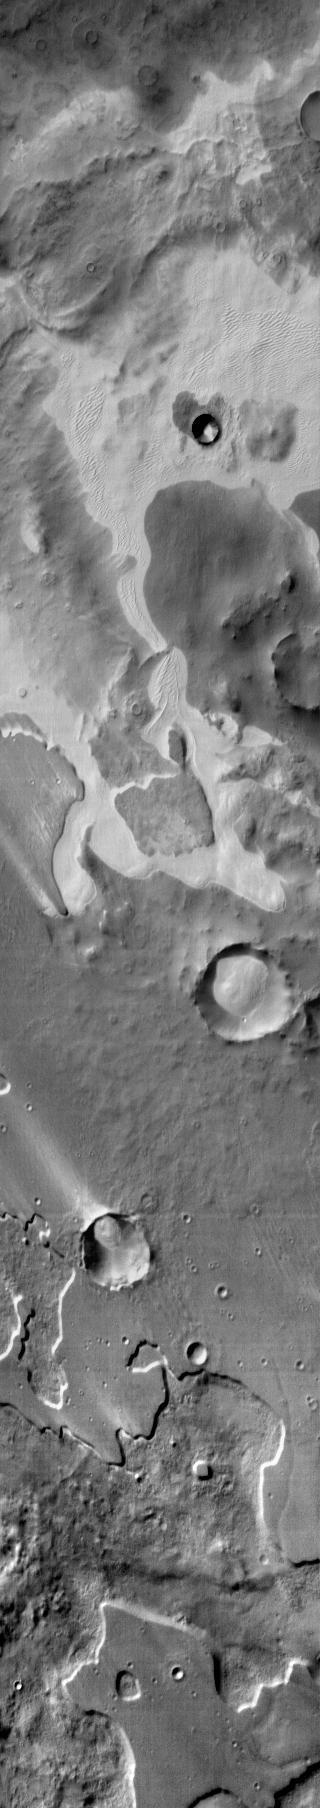
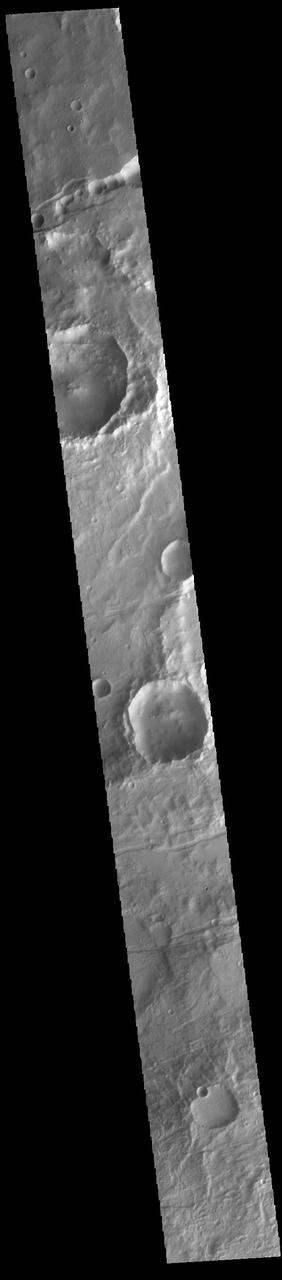
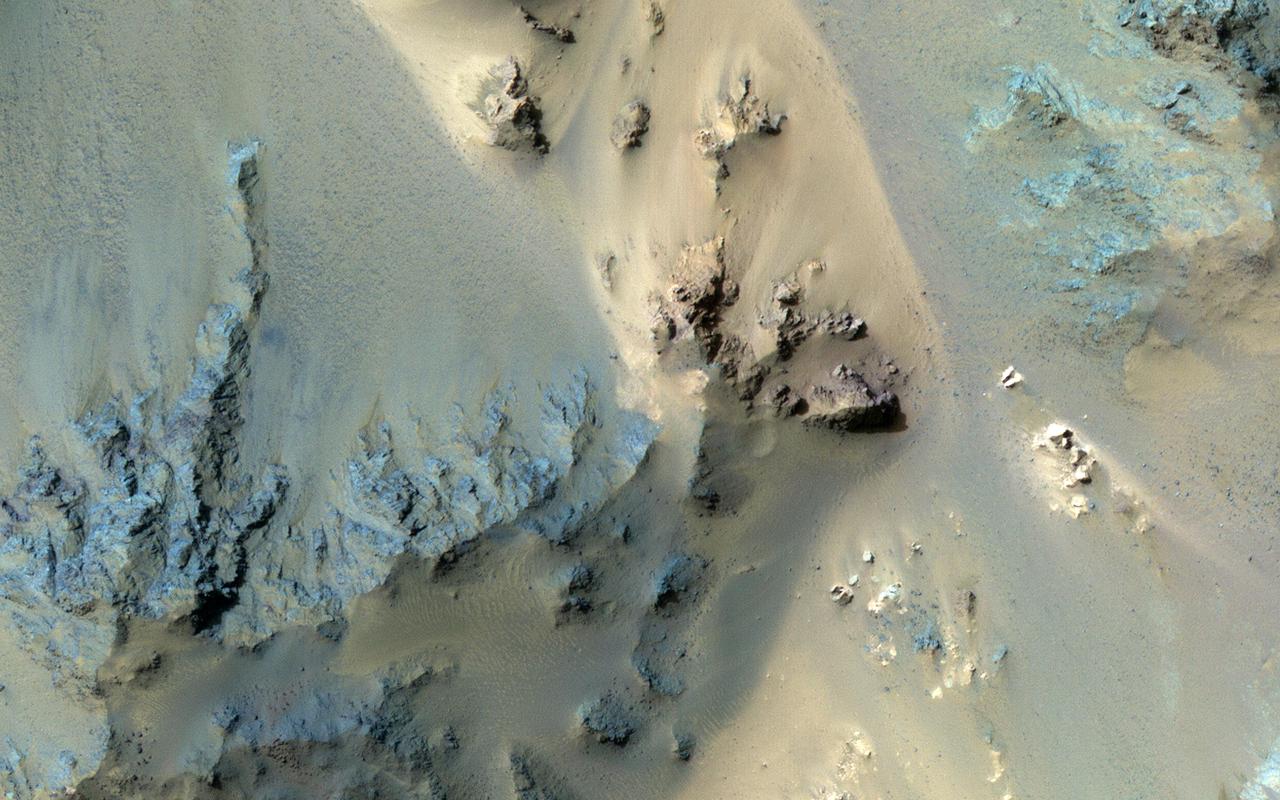
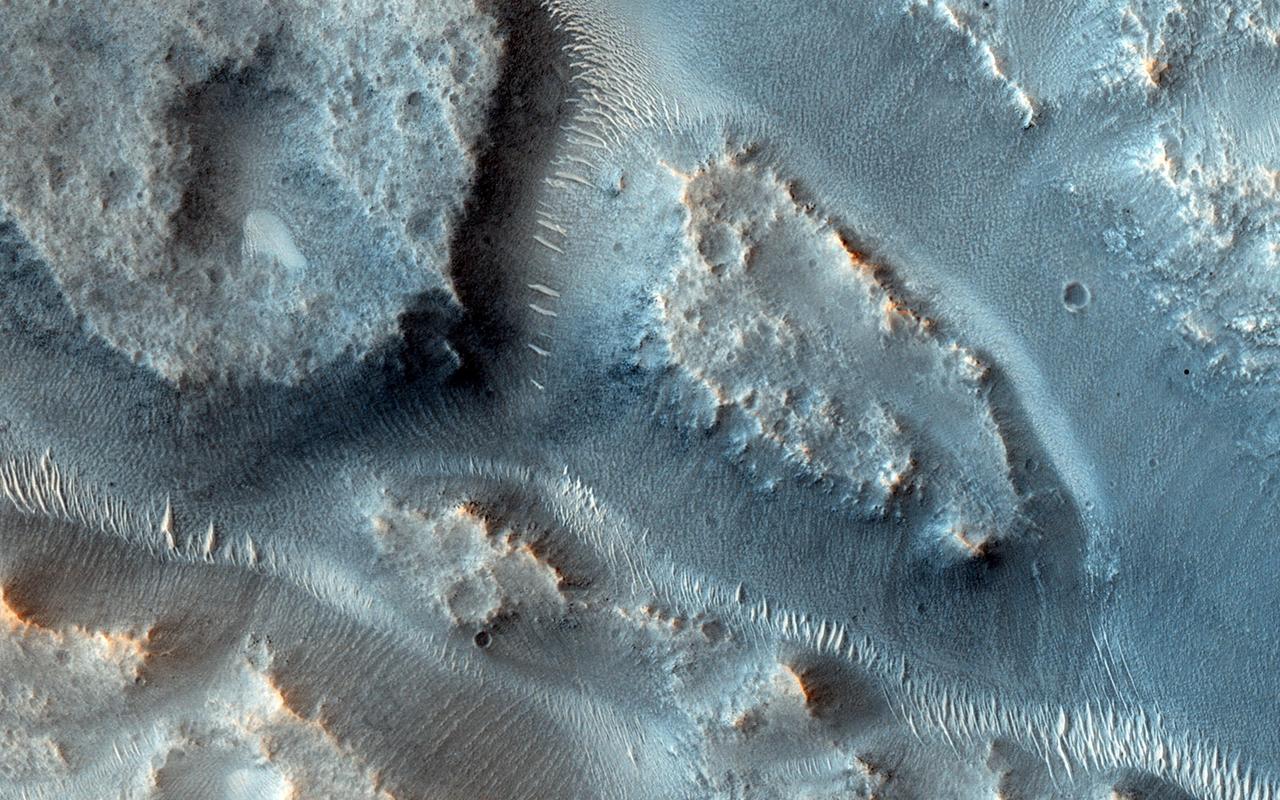
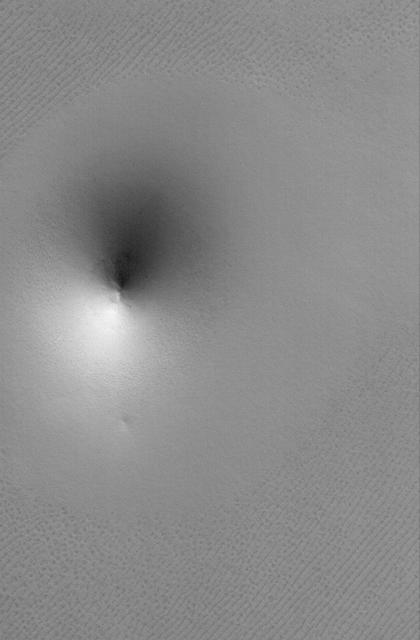
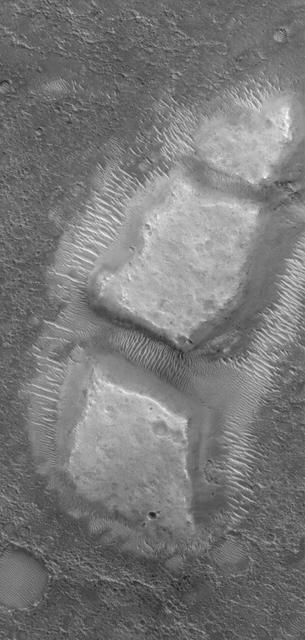
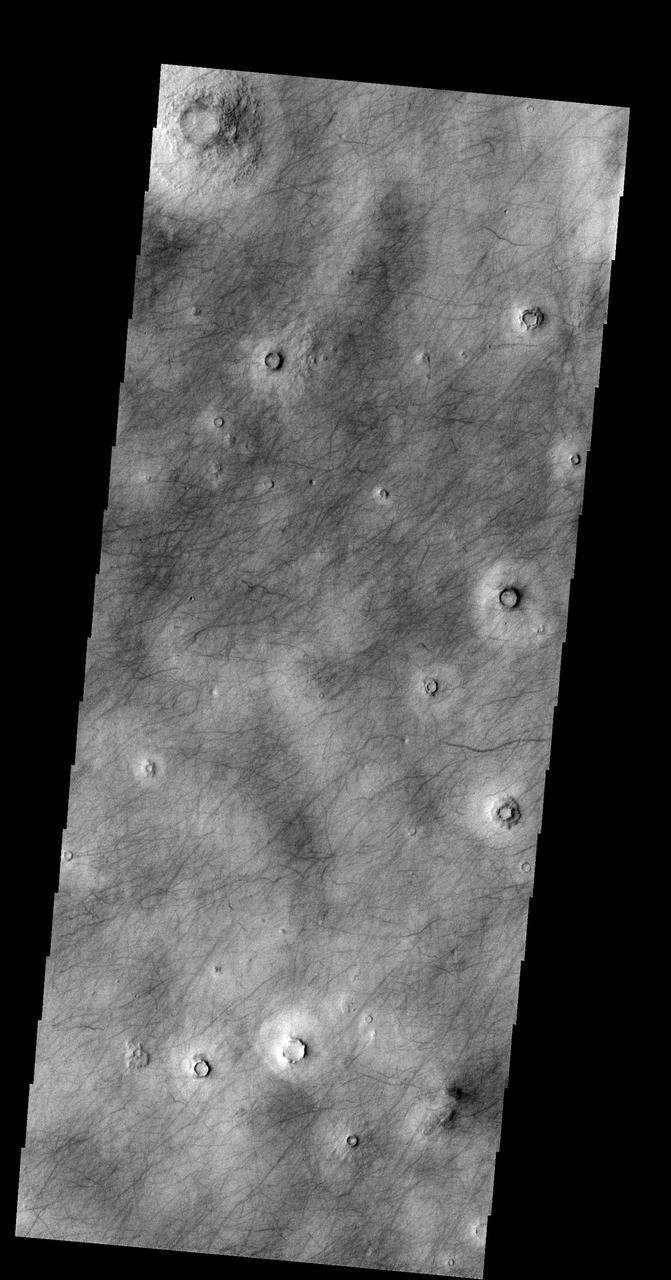
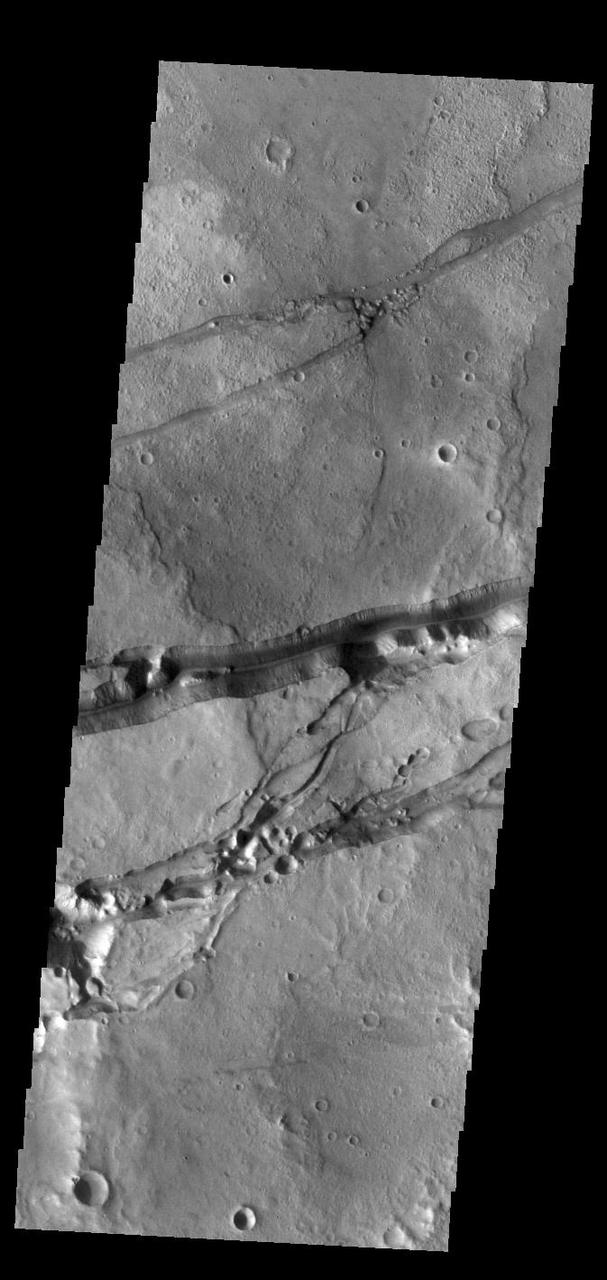
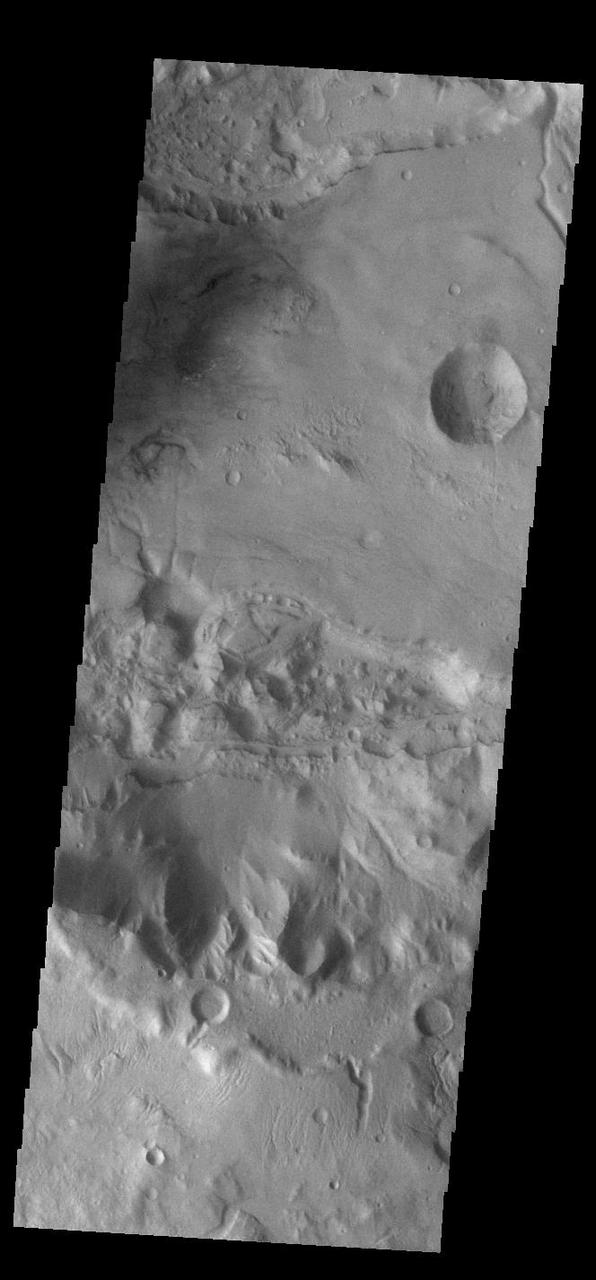
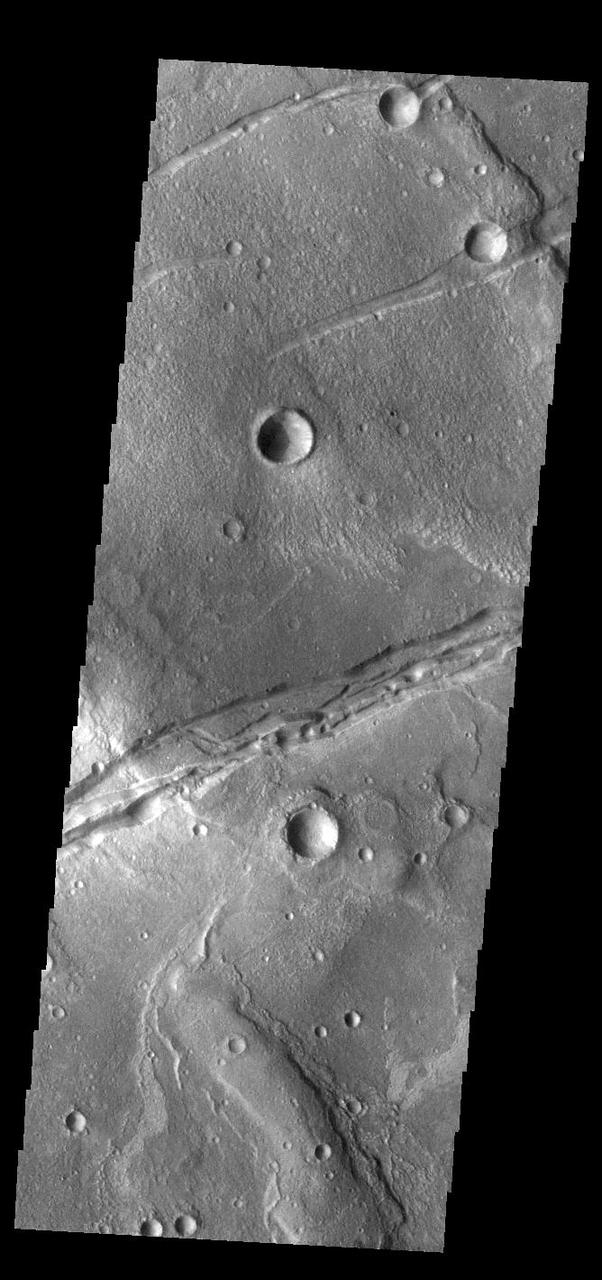
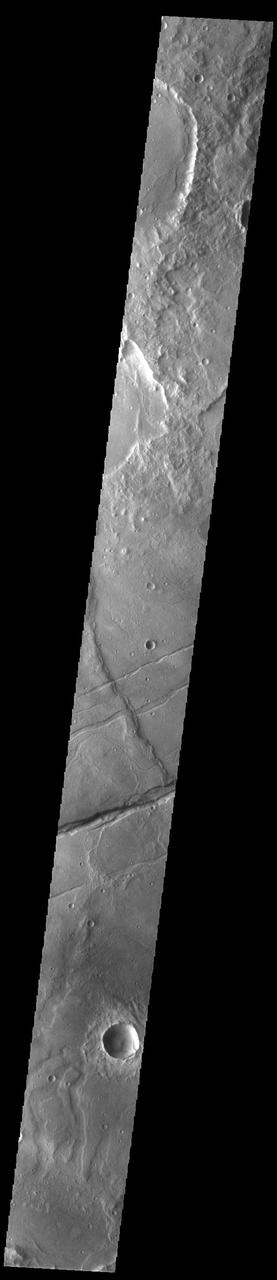
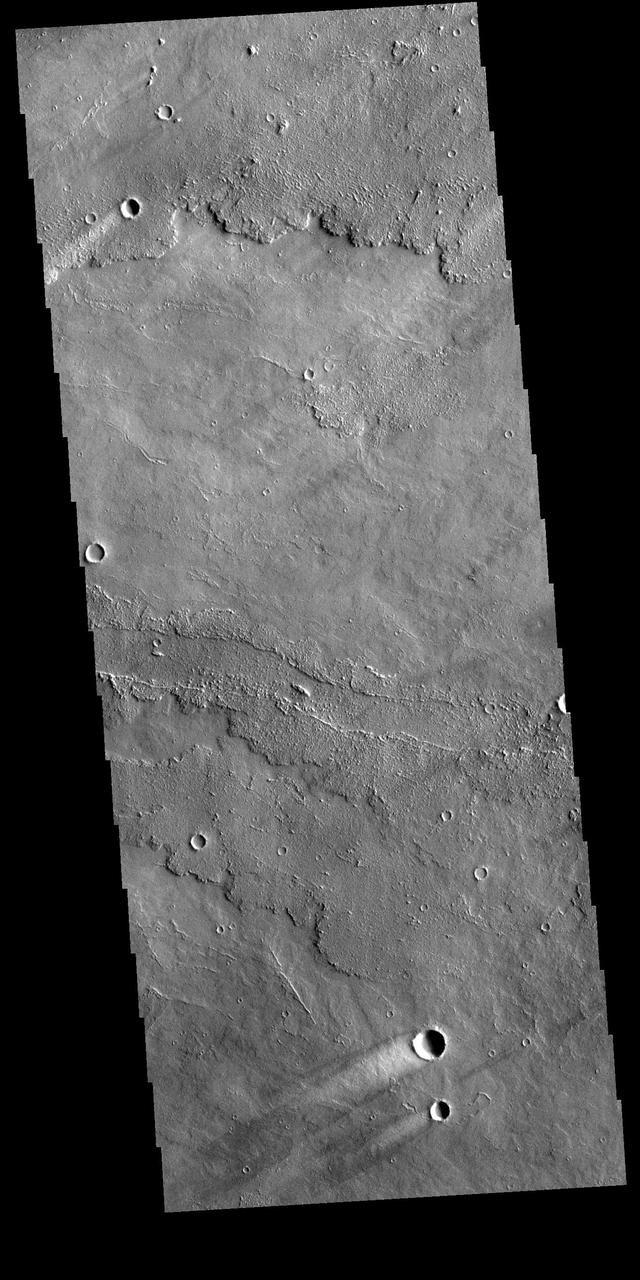
Searching for Evidence of Extension on Mercury
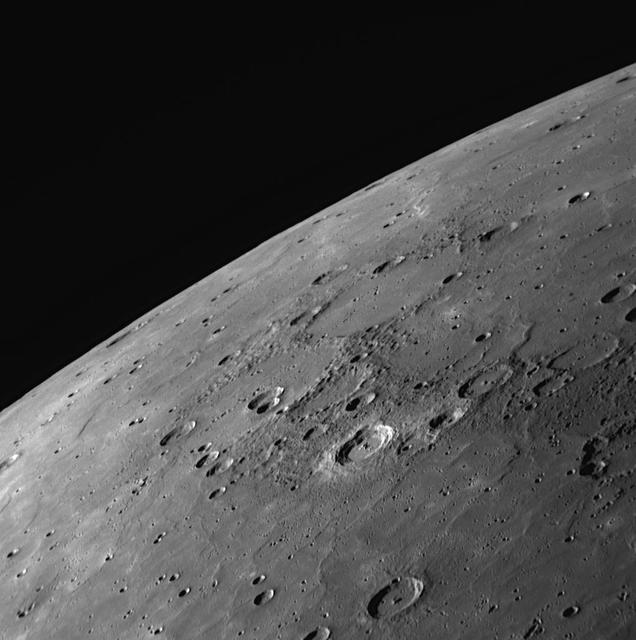
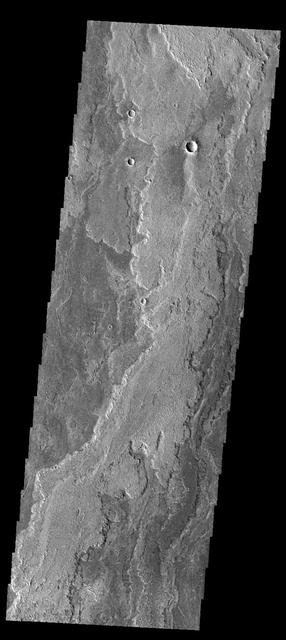
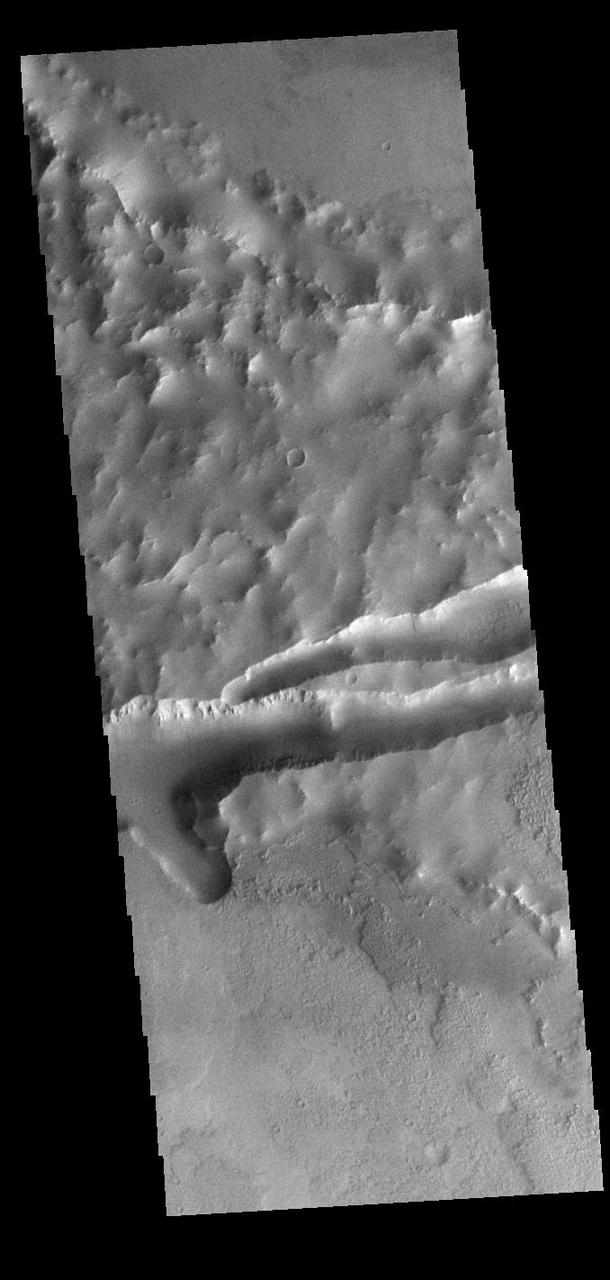
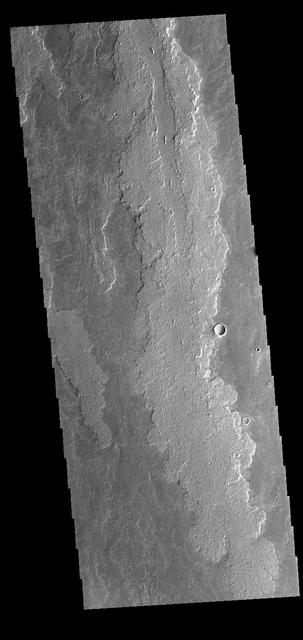
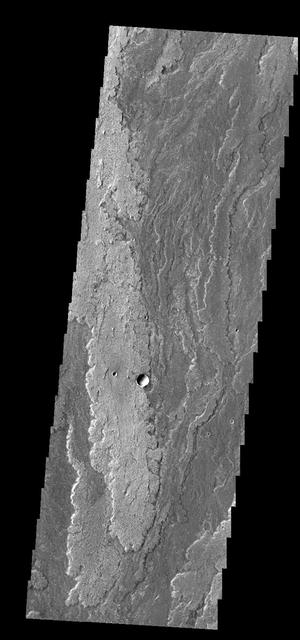
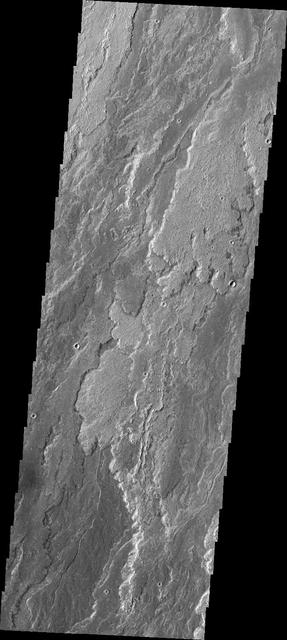
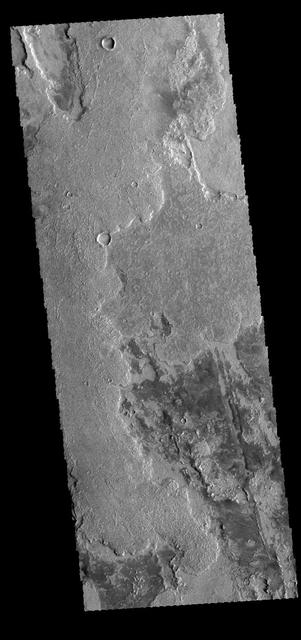
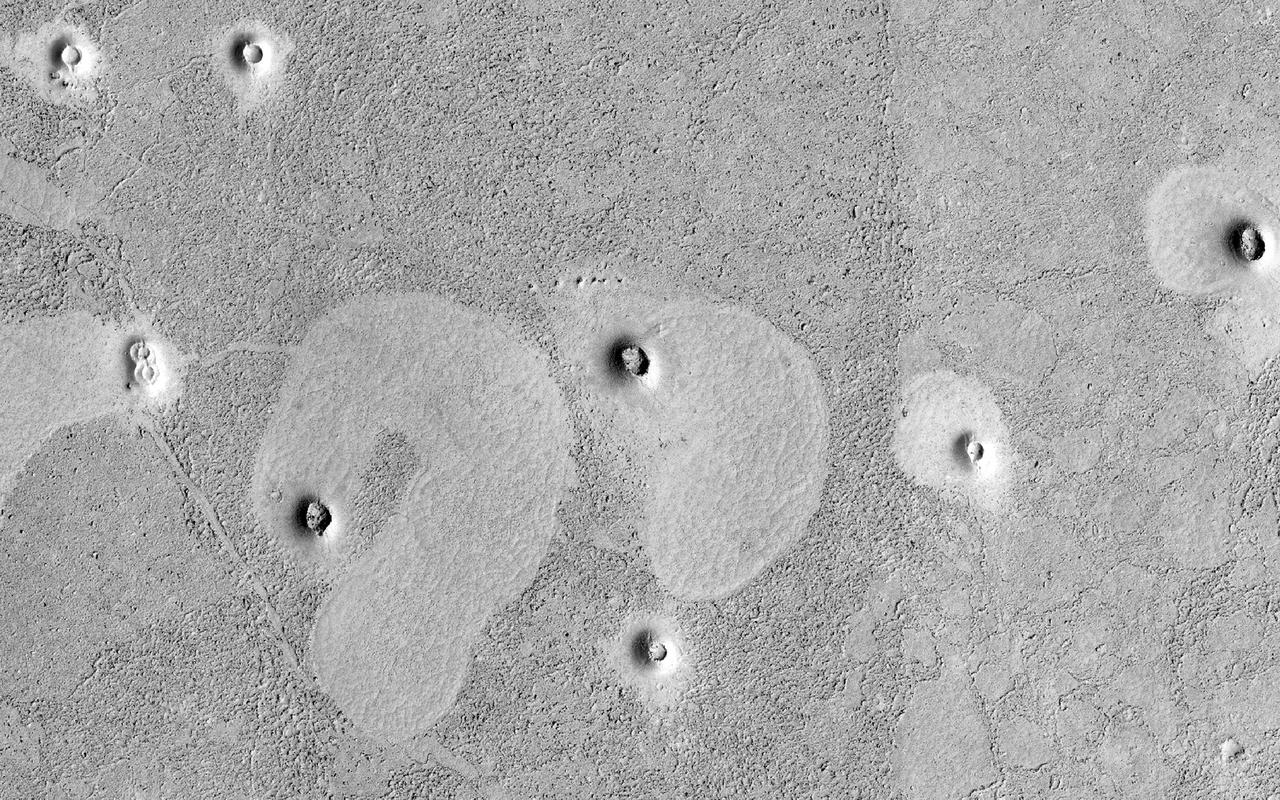
Extensive Smooth Plains on Mercury
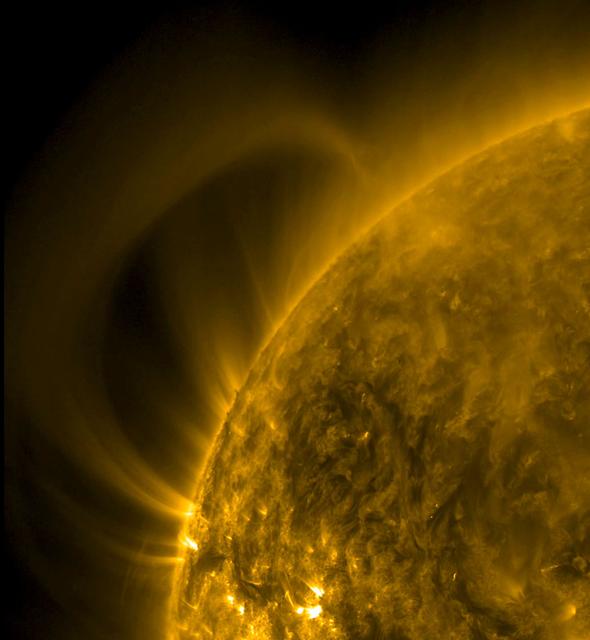
A giant arch of plasma rose up out of the Sun and then stretched itself until it had reached back to a point behind our view of the Sun (Sept, 17-18, 2014). Since it emerged from a magnetically intense active region, the arch is likely connecting to another active region over the Sun's horizon. We rarely see material extend this distance. The images were observed in the extreme ultraviolet wavelength of 171 Angstroms. Credit: NASA/Solar Dynamics Observatory <b><a href="http://www.nasa.gov/audience/formedia/features/MP_Photo_Guidelines.html" rel="nofollow">NASA image use policy.</a></b> <b><a href="http://www.nasa.gov/centers/goddard/home/index.html" rel="nofollow">NASA Goddard Space Flight Center</a></b> enables NASA’s mission through four scientific endeavors: Earth Science, Heliophysics, Solar System Exploration, and Astrophysics. Goddard plays a leading role in NASA’s accomplishments by contributing compelling scientific knowledge to advance the Agency’s mission. <b>Follow us on <a href="http://twitter.com/NASAGoddardPix" rel="nofollow">Twitter</a></b> <b>Like us on <a href="http://www.facebook.com/pages/Greenbelt-MD/NASA-Goddard/395013845897?ref=tsd" rel="nofollow">Facebook</a></b> <b>Find us on <a href="http://instagram.com/nasagoddard?vm=grid" rel="nofollow">Instagram</a></b>

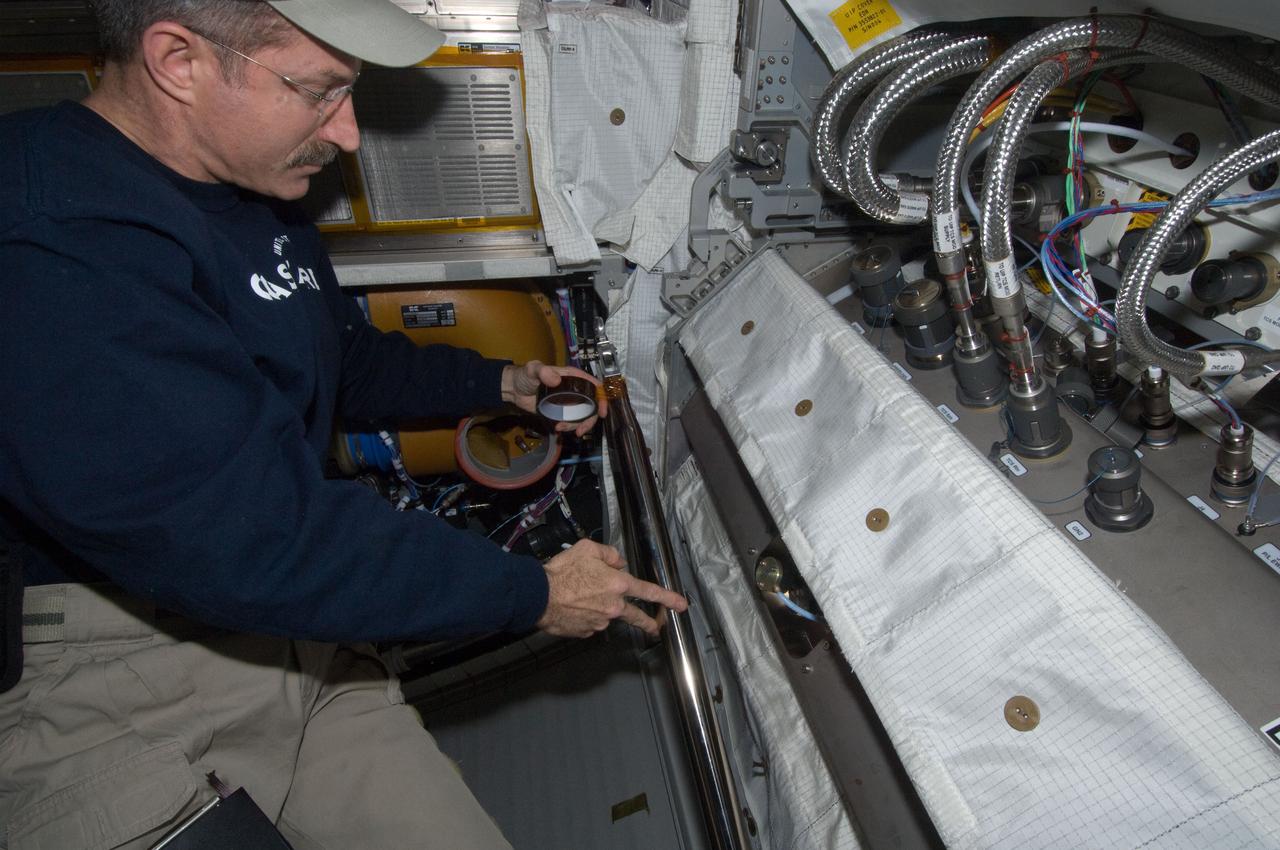
51D-04-015 (15 April 1985) --- Astronaut Rhea Seddon and Karol J. Bobko continue work on snag-type extension for the Remote Manipulator System (RMS) as part of an effort to activate a lever on a troubled communications satellite. Since the crew learned soon after deployment of the Syncom IV (LEASAT) spacecraft that it was not functioning properly plans were formulated for a rendezvous in space between the Discovery and the satellite. A fly swatter-like extension and another resembling a LaCrosse stick were fashioned from onboard supplies and furnishings. Stowage lockers nearby serve as a work bench for the two. At various times during the seven-day mission, the majority of the seven-member crew participated in the tool-making and preparations for an extravehicular activity (EVA) by the flights other two mission specialists -- Jeffrey A. Hoffman and S. David Griggs -- to connect the two tools to the RMS. Bobko is mission commander and Dr. Seddon, a mission specialist.

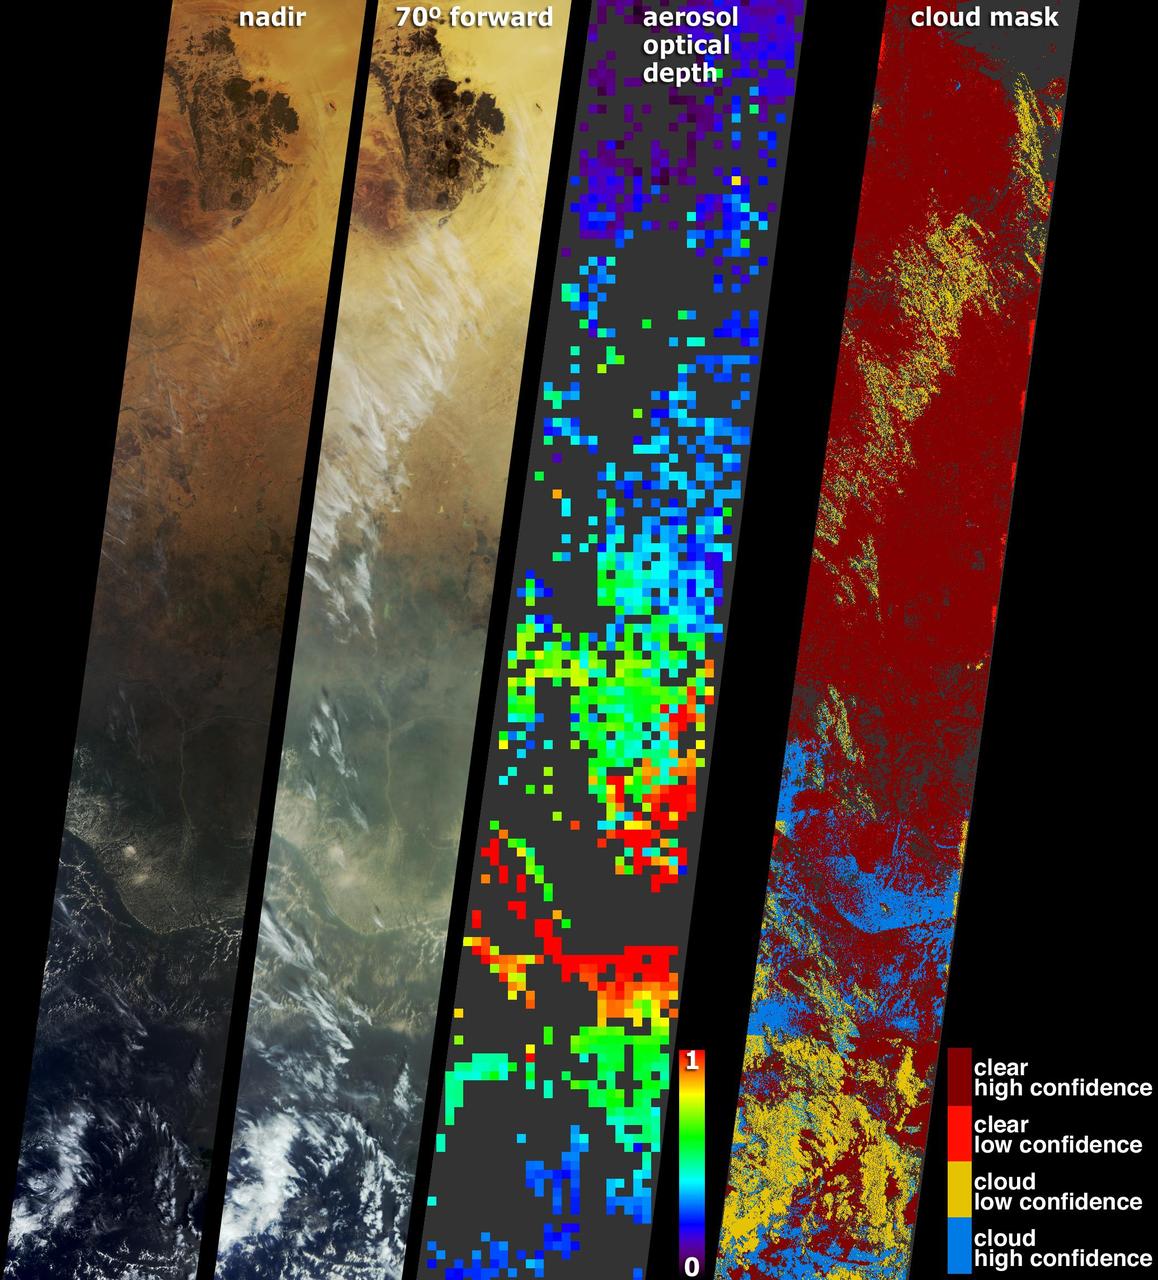
The Visible Infrared Imaging Radiometer Suite (VIIRS) on the Suomi NPP satellite captured this view of extensive sea-ice fracturing off the northern coast of Alaska. The event began in late-January and spread west toward Banks Island throughout February and March 2013. Visualizations of the Arctic often give the impression that the ice cap is a continuous sheet of stationary, floating ice. In fact, it is a collection of smaller pieces that constantly shift, crack, and grind against one another as they are jostled by winds and ocean currents. Especially during the summer—but even during the height of winter—cracks—or leads—open up between pieces of ice. That was what was happening on the left side of the animation (seen here: <a href="http://bit.ly/10kE7sh" rel="nofollow">bit.ly/10kE7sh</a>) in late January. A high-pressure weather system was parked over the region, producing warmer temperatures and winds that flowed in a southwesterly direction. That fueled the Beaufort Gyre, a wind-driven ocean current that flows clockwise. The gyre was the key force pulling pieces of ice west past Point Barrow, the northern nub of Alaska that protrudes into the Beaufort Sea. “A fracturing event in this area is not unusual because the Beaufort Gyre tends to push ice away from Banks Island and the Canadian Archipelago,” explained Walt Meier of the National Snow & Ice Data Center (NSIDC). “Point Barrow can act like a ‘pin point’ where the ice catches and fractures to the north and east.” In February, however, a series of storms passing over central Alaska exacerbated the fracturing. Strong westerly winds prompted several large pieces of ice to break away in an arc-shaped wave that moved progressively east. By the end of February, large pieces of ice had fractured all the way to the western coast of Banks Island, a distance of about 1,000 kilometers (600 miles). The data used to create the animation came from the longwave infrared (thermal) portion of the electromagnetic spectrum, so the animation illustrates how much heat the surface was emitting as VIIRS surveyed the area. Cooler areas (sea ice) appear white, while warmer areas (open water) are dark. The light gray plume near the cracks is warmer, moister air escaping from the ocean and blowing downwind. Clouds do not show up well in the VIIRS thermal band, so the storms that fueled the fracturing are not readily visible. While fracturing events are common, few events sprawl across such a large area or produce cracks as long and wide as those seen here. The age of the sea ice in this area was one of the key reasons this event became so widespread. “The region is covered almost completely by seasonal or first-year ice—ice that has formed since last September,” said Meier. “This ice is thinner and weaker than the older, multi-year ice, so it responds more readily to winds and is more easily broken up.” NASA Earth Observatory images by Jesse Allen using VIIRS day-night band data from the Suomi National Polar-orbiting Partnership. Suomi NPP is the result of a partnership between NASA, the National Oceanic and Atmospheric Administration, and the Department of Defense. Caption by Adam Voiland. Instrument: Suomi NPP - VIIRS For more info go to: <a href="http://earthobservatory.nasa.gov/IOTD/view.php?id=80752" rel="nofollow">earthobservatory.nasa.gov/IOTD/view.php?id=80752</a> Credit: <b><a href="http://www.earthobservatory.nasa.gov/" rel="nofollow"> NASA Earth Observatory</a></b> <b><a href="http://www.nasa.gov/audience/formedia/features/MP_Photo_Guidelines.html" rel="nofollow">NASA image use policy.</a></b> <b><a href="http://www.nasa.gov/centers/goddard/home/index.html" rel="nofollow">NASA Goddard Space Flight Center</a></b> enables NASA’s mission through four scientific endeavors: Earth Science, Heliophysics, Solar System Exploration, and Astrophysics. Goddard plays a leading role in NASA’s accomplishments by contributing compelling scientific knowledge to advance the Agency’s mission. <b>Follow us on <a href="http://twitter.com/NASA_GoddardPix" rel="nofollow">Twitter</a></b> <b>Like us on <a href="http://www.facebook.com/pages/Greenbelt-MD/NASA-Goddard/395013845897?ref=tsd" rel="nofollow">Facebook</a></b> <b>Find us on <a href="http://instagram.com/nasagoddard?vm=grid" rel="nofollow">Instagram</a></b>

The Visible Infrared Imaging Radiometer Suite (VIIRS) on the Suomi NPP satellite captured this view of extensive sea-ice fracturing off the northern coast of Alaska. The event began in late-January and spread west toward Banks Island throughout February and March 2013. Visualizations of the Arctic often give the impression that the ice cap is a continuous sheet of stationary, floating ice. In fact, it is a collection of smaller pieces that constantly shift, crack, and grind against one another as they are jostled by winds and ocean currents. Especially during the summer—but even during the height of winter—cracks—or leads—open up between pieces of ice. That was what was happening on the left side of the animation (seen here: <a href="http://bit.ly/10kE7sh" rel="nofollow">bit.ly/10kE7sh</a>) in late January. A high-pressure weather system was parked over the region, producing warmer temperatures and winds that flowed in a southwesterly direction. That fueled the Beaufort Gyre, a wind-driven ocean current that flows clockwise. The gyre was the key force pulling pieces of ice west past Point Barrow, the northern nub of Alaska that protrudes into the Beaufort Sea. “A fracturing event in this area is not unusual because the Beaufort Gyre tends to push ice away from Banks Island and the Canadian Archipelago,” explained Walt Meier of the National Snow & Ice Data Center (NSIDC). “Point Barrow can act like a ‘pin point’ where the ice catches and fractures to the north and east.” In February, however, a series of storms passing over central Alaska exacerbated the fracturing. Strong westerly winds prompted several large pieces of ice to break away in an arc-shaped wave that moved progressively east. By the end of February, large pieces of ice had fractured all the way to the western coast of Banks Island, a distance of about 1,000 kilometers (600 miles). The data used to create the animation came from the longwave infrared (thermal) portion of the electromagnetic spectrum, so the animation illustrates how much heat the surface was emitting as VIIRS surveyed the area. Cooler areas (sea ice) appear white, while warmer areas (open water) are dark. The light gray plume near the cracks is warmer, moister air escaping from the ocean and blowing downwind. Clouds do not show up well in the VIIRS thermal band, so the storms that fueled the fracturing are not readily visible. While fracturing events are common, few events sprawl across such a large area or produce cracks as long and wide as those seen here. The age of the sea ice in this area was one of the key reasons this event became so widespread. “The region is covered almost completely by seasonal or first-year ice—ice that has formed since last September,” said Meier. “This ice is thinner and weaker than the older, multi-year ice, so it responds more readily to winds and is more easily broken up.” NASA Earth Observatory images by Jesse Allen using VIIRS day-night band data from the Suomi National Polar-orbiting Partnership. Suomi NPP is the result of a partnership between NASA, the National Oceanic and Atmospheric Administration, and the Department of Defense. Caption by Adam Voiland. Instrument: Suomi NPP - VIIRS For more info go to: <a href="http://earthobservatory.nasa.gov/IOTD/view.php?id=80752" rel="nofollow">earthobservatory.nasa.gov/IOTD/view.php?id=80752</a> Credit: <b><a href="http://www.earthobservatory.nasa.gov/" rel="nofollow"> NASA Earth Observatory</a></b> <b><a href="http://www.nasa.gov/audience/formedia/features/MP_Photo_Guidelines.html" rel="nofollow">NASA image use policy.</a></b> <b><a href="http://www.nasa.gov/centers/goddard/home/index.html" rel="nofollow">NASA Goddard Space Flight Center</a></b> enables NASA’s mission through four scientific endeavors: Earth Science, Heliophysics, Solar System Exploration, and Astrophysics. Goddard plays a leading role in NASA’s accomplishments by contributing compelling scientific knowledge to advance the Agency’s mission. <b>Follow us on <a href="http://twitter.com/NASA_GoddardPix" rel="nofollow">Twitter</a></b> <b>Like us on <a href="http://www.facebook.com/pages/Greenbelt-MD/NASA-Goddard/395013845897?ref=tsd" rel="nofollow">Facebook</a></b> <b>Find us on <a href="http://instagram.com/nasagoddard?vm=grid" rel="nofollow">Instagram</a></b>

The Visible Infrared Imaging Radiometer Suite (VIIRS) on the Suomi NPP satellite captured this view of extensive sea-ice fracturing off the northern coast of Alaska. The event began in late-January and spread west toward Banks Island throughout February and March 2013. Visualizations of the Arctic often give the impression that the ice cap is a continuous sheet of stationary, floating ice. In fact, it is a collection of smaller pieces that constantly shift, crack, and grind against one another as they are jostled by winds and ocean currents. Especially during the summer—but even during the height of winter—cracks—or leads—open up between pieces of ice. That was what was happening on the left side of the animation (seen here: <a href="http://bit.ly/10kE7sh" rel="nofollow">bit.ly/10kE7sh</a>) in late January. A high-pressure weather system was parked over the region, producing warmer temperatures and winds that flowed in a southwesterly direction. That fueled the Beaufort Gyre, a wind-driven ocean current that flows clockwise. The gyre was the key force pulling pieces of ice west past Point Barrow, the northern nub of Alaska that protrudes into the Beaufort Sea. “A fracturing event in this area is not unusual because the Beaufort Gyre tends to push ice away from Banks Island and the Canadian Archipelago,” explained Walt Meier of the National Snow & Ice Data Center (NSIDC). “Point Barrow can act like a ‘pin point’ where the ice catches and fractures to the north and east.” In February, however, a series of storms passing over central Alaska exacerbated the fracturing. Strong westerly winds prompted several large pieces of ice to break away in an arc-shaped wave that moved progressively east. By the end of February, large pieces of ice had fractured all the way to the western coast of Banks Island, a distance of about 1,000 kilometers (600 miles). The data used to create the animation came from the longwave infrared (thermal) portion of the electromagnetic spectrum, so the animation illustrates how much heat the surface was emitting as VIIRS surveyed the area. Cooler areas (sea ice) appear white, while warmer areas (open water) are dark. The light gray plume near the cracks is warmer, moister air escaping from the ocean and blowing downwind. Clouds do not show up well in the VIIRS thermal band, so the storms that fueled the fracturing are not readily visible. While fracturing events are common, few events sprawl across such a large area or produce cracks as long and wide as those seen here. The age of the sea ice in this area was one of the key reasons this event became so widespread. “The region is covered almost completely by seasonal or first-year ice—ice that has formed since last September,” said Meier. “This ice is thinner and weaker than the older, multi-year ice, so it responds more readily to winds and is more easily broken up.” NASA Earth Observatory images by Jesse Allen using VIIRS day-night band data from the Suomi National Polar-orbiting Partnership. Suomi NPP is the result of a partnership between NASA, the National Oceanic and Atmospheric Administration, and the Department of Defense. Caption by Adam Voiland. Instrument: Suomi NPP - VIIRS For more info go to: <a href="http://earthobservatory.nasa.gov/IOTD/view.php?id=80752" rel="nofollow">earthobservatory.nasa.gov/IOTD/view.php?id=80752</a> Credit: <b><a href="http://www.earthobservatory.nasa.gov/" rel="nofollow"> NASA Earth Observatory</a></b> <b><a href="http://www.nasa.gov/audience/formedia/features/MP_Photo_Guidelines.html" rel="nofollow">NASA image use policy.</a></b> <b><a href="http://www.nasa.gov/centers/goddard/home/index.html" rel="nofollow">NASA Goddard Space Flight Center</a></b> enables NASA’s mission through four scientific endeavors: Earth Science, Heliophysics, Solar System Exploration, and Astrophysics. Goddard plays a leading role in NASA’s accomplishments by contributing compelling scientific knowledge to advance the Agency’s mission. <b>Follow us on <a href="http://twitter.com/NASA_GoddardPix" rel="nofollow">Twitter</a></b> <b>Like us on <a href="http://www.facebook.com/pages/Greenbelt-MD/NASA-Goddard/395013845897?ref=tsd" rel="nofollow">Facebook</a></b> <b>Find us on <a href="http://instagram.com/nasagoddard?vm=grid" rel="nofollow">Instagram</a></b>

A large coronal hole has been spewing solar wind particles in the general direction of Earth over the past few days (Aug. 31- Sept. 1, 2017). It is the extensive dark area that stretches from the top of the sun and angles down to the right. Coronal holes are areas of open magnetic field, which allow charge particles to escape into space. They appear dark in certain wavelengths of extreme ultraviolet light such as shown here. These clouds of particles can cause aurora to appear, particularly in higher latitude regions. Movies are available at https://photojournal.jpl.nasa.gov/catalog/PIA21942
ISS030-E-093414 (22 Feb. 2012) --- NASA astronaut Dan Burbank, Expedition 30 commander, performs the scheduled extensive cleanup of ventilation systems in the Columbus laboratory of the International Space Station.
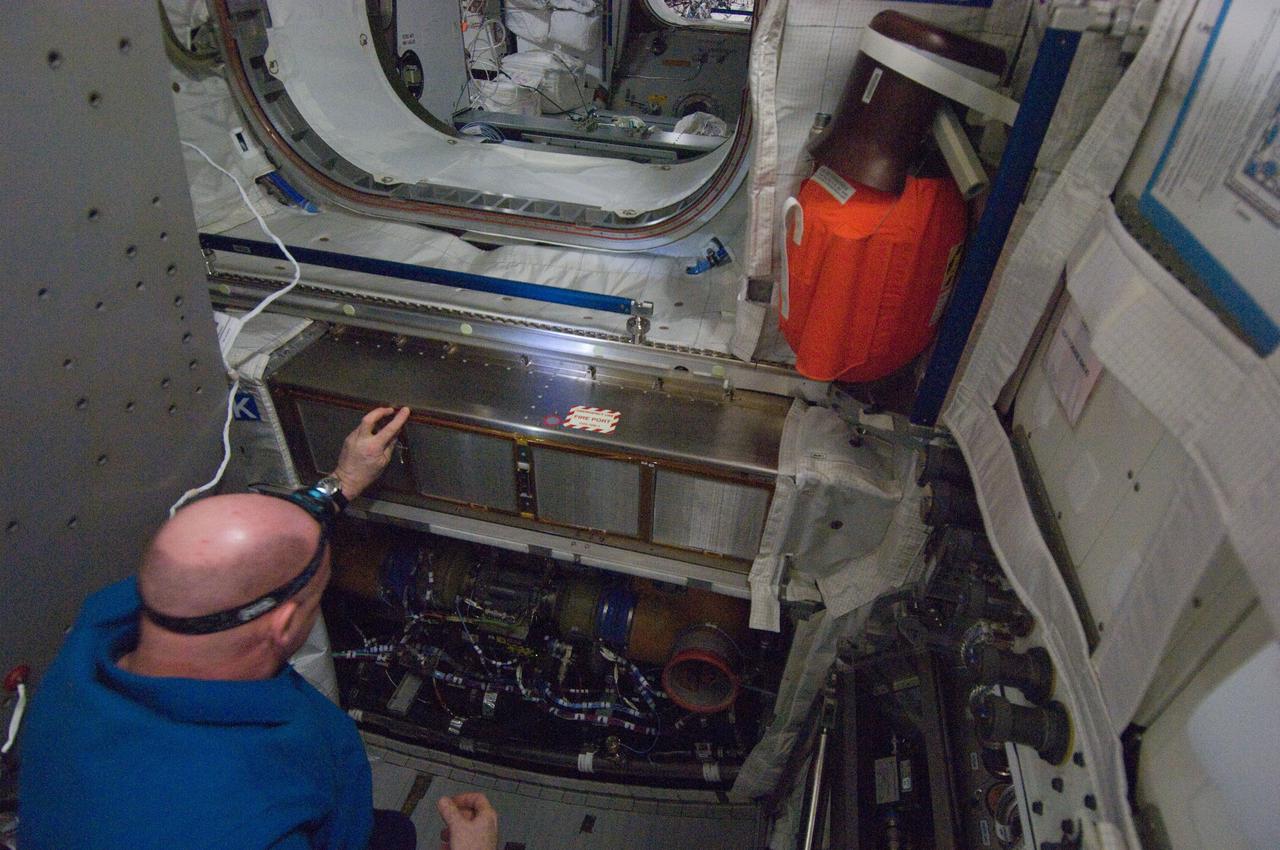
ISS030-E-094598 (23 Feb. 2012) --- European Space Agency astronaut Andre Kuipers, Expedition 30 flight engineer, performs the scheduled inspection and extensive cleanup of ventilation systems in the Columbus laboratory of the International Space Station.

51D-07-003 (12-19 April 1985) --- Astronaut Rhea Seddon begins early work on a fly swatter-like snagging device to be used as an extension to the Remote Manipulator System (RMS) arm on Discovery for an April 17, 1985 attempt to trip a lever on the troubled Syncom-IV satellite.

This ultraviolet image from NASA Galaxy Evolution Explorer shows the Southern Pinwheel galaxy, also know as Messier 83 or M83. It is located 15 million light-years away in the southern constellation Hydra.
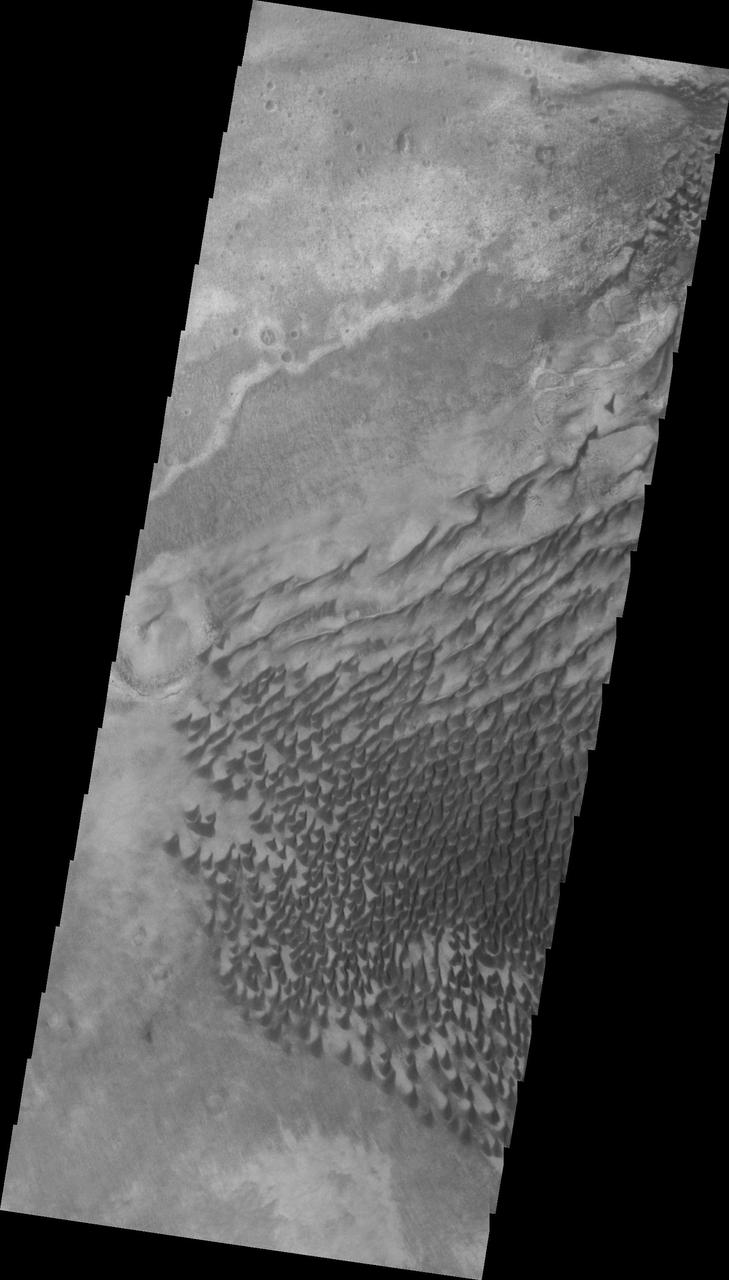
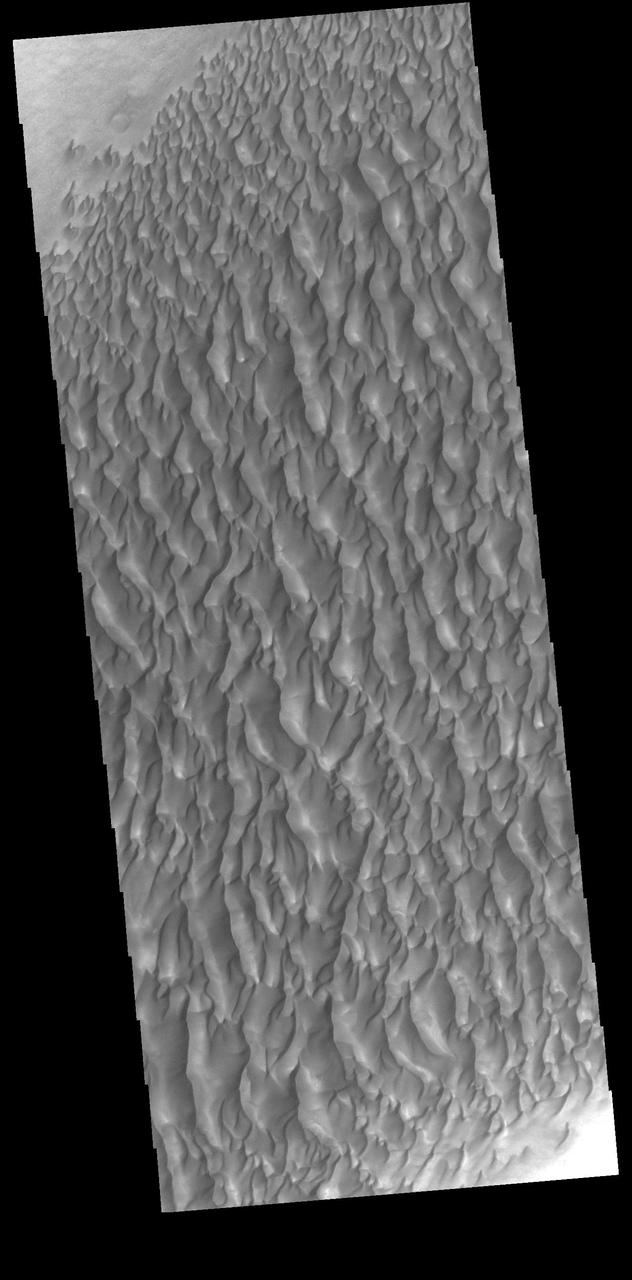
This extensive dune field in located on the floor of a large unnamed crater in Noachis Terra
This image of Tharsis Rise from NASA Mars Odyssey shows a series of linear features called graben, which are associated with crustal extension resulting in up and down blocks of crust that run perpendicular to the direction of the extension.
S88-E-5018 (12-05-98) --- This medium closeup electronic still camera (ESC) photograph shows Endeavour's docking system in the cargo bay. Though partially obscured, Unity can be seen in its stowed position in aft payload pay. The arm of the remote manipulator system (RMS) is seen in its berthed position on the right. The photo was taken prior to astronaut Nancy Currie's moving of the 12.8-ton Unity connecting module to link it with Endeavour's docking system. The photo was taken at 09:35:57 GMT, Dec. 5, and downlinked later to flight controllers in Houston.
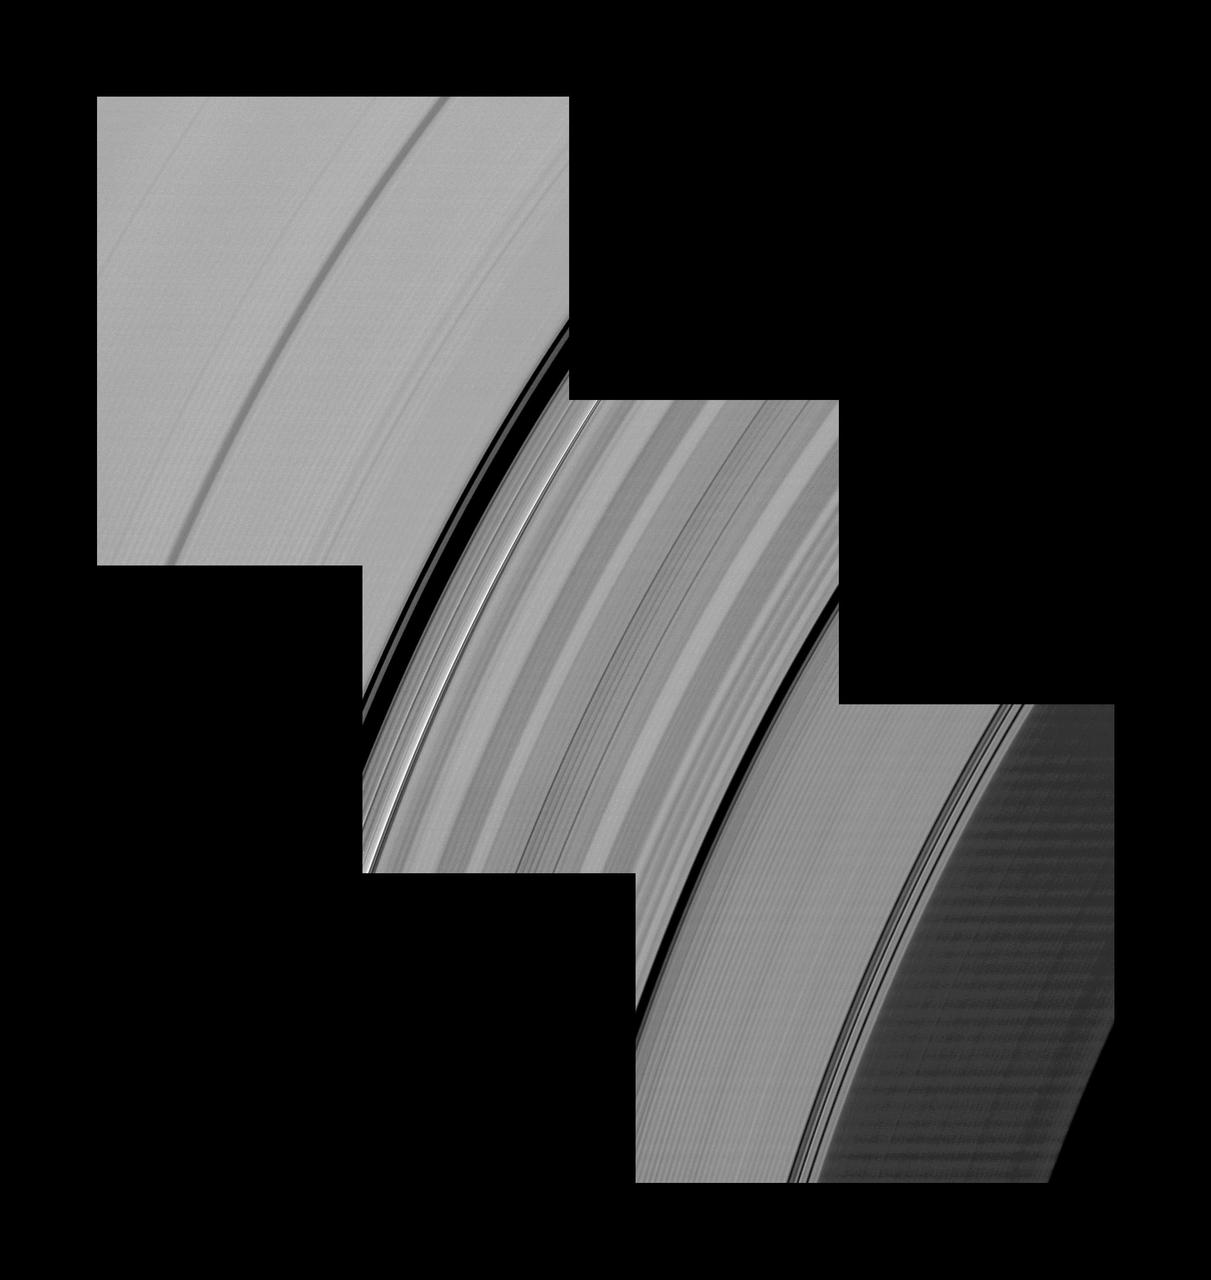
Alternating light and dark bands, extending a great distance across Saturn’s D and C rings taken by NASA Cassini spacecraft one month before the planet’s August 2009 equinox.
S88-E-5019 (12-05-98) --- This medium closeup electronic still camera (ESC) photograph shows Endeavour's docking system in the cargo bay. Though partially obscured, Unity can be seen in its stowed position in aft payload pay. The arm of the remote manipulator system (RMS) is seen in its berthed position on the right. The photo was taken prior to astronaut Nancy Currie's moving of the 12.8-ton Unity connecting module to link it with Endeavour's docking system. The photo was taken at 09:36:33 GMT, Dec. 5, and downlinked later to flight controllers in Houston.
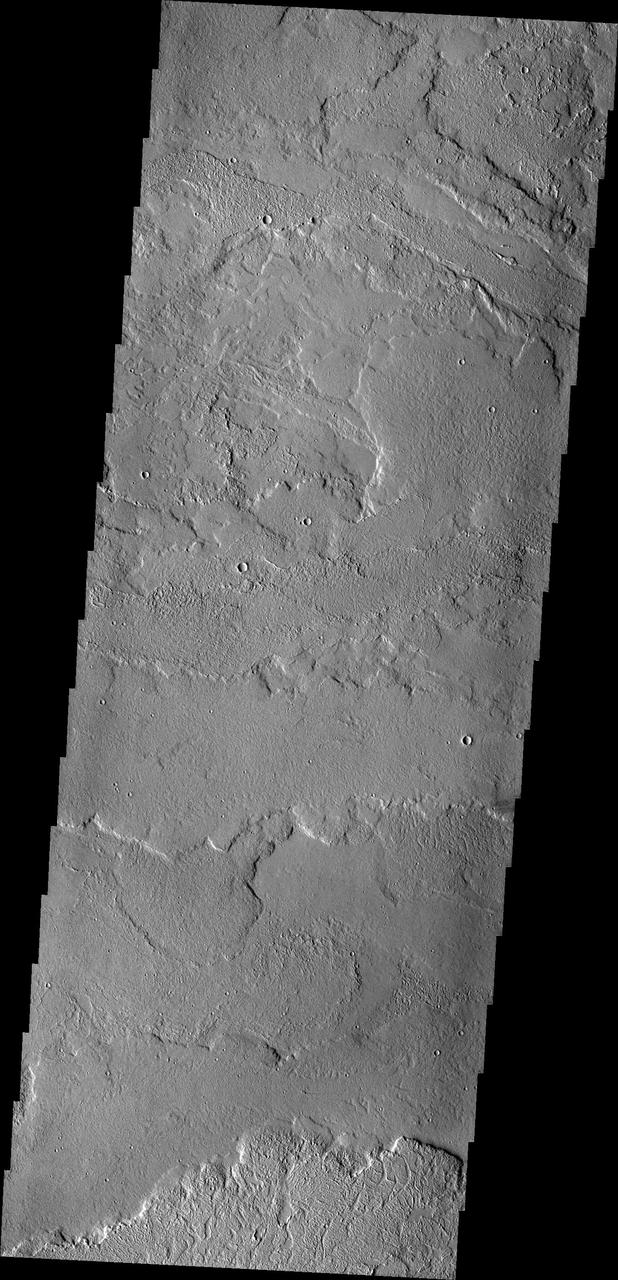
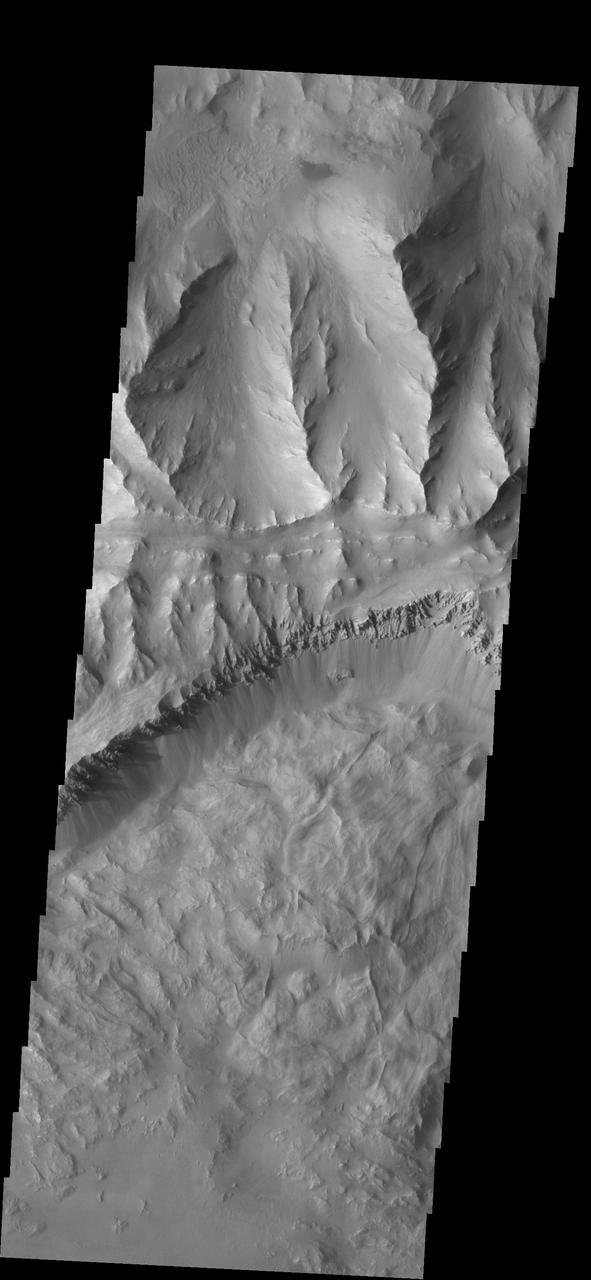
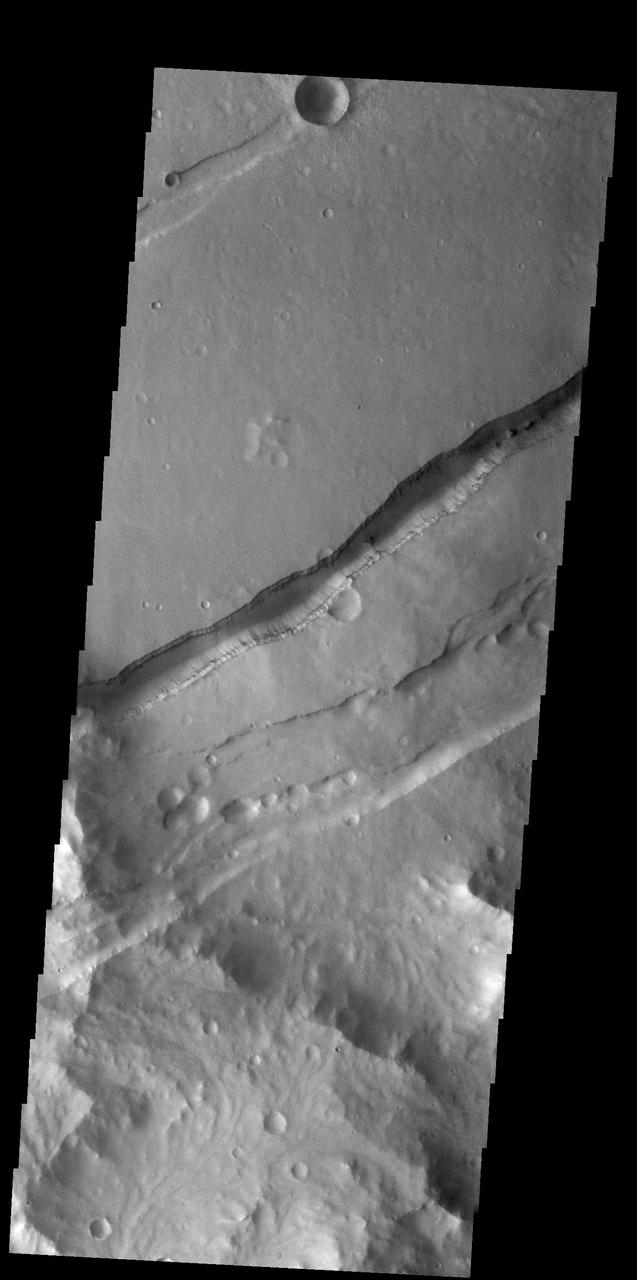
This image from NASA 2001 Mars Odyssey spacecraft shows the shallower extension of Coprates Chamsa called Coprates Catena.
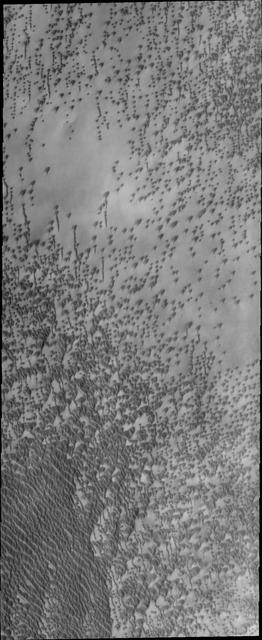
An extensive field of small, dark dunes in located on the floor of the unnamed crater in Arabia Terra
This 2001 Mars Odyssey image shows a portion of the extensive dune field in on the floor of Russell Crater.
This image from NASA 2001 Mars Odyssey spacecraft shows some of the extensive volcanic flows east of the large Tharsis volcanoes.
This image shows a small portion of the extensive Tharsis Volcanic Field. Several different surface textures are present in this image
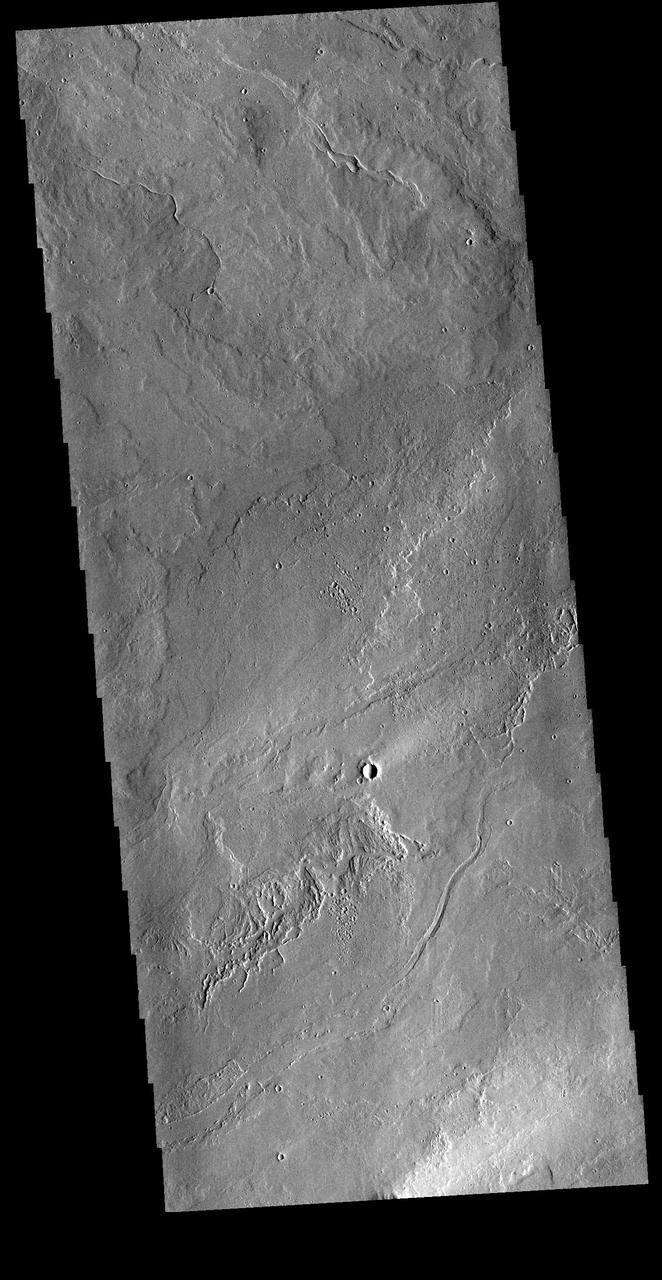
The extensive volcanic flows in this image captured by NASA 2001 Mars Odyssey spacecraft are part of Daedalia Planum.
This 2001 Mars Odyssey THEMIS VIS image shows a channel with extensive scalloping of its margins. The process of scalloping is widening the channel.
This 2001 Mars Odyssey image shows an extensive sand sheet near the south polar cap.
The lava flows in this image taken by NASA 2001 Mars Odyssey spacecraft are part of the extensive flow field of Arsia Mons.
This image from NASA 2001 Mars Odyssey spacecraft shows part of the extensive lava flows that make up Daedalia Planum.
The lava flows in this image from NASA 2001 Mars Odyssey spacecraft are part of the extensive lava plains of Daedalia Planum.
This image from NASA Mars Odyssey of the floor of Ganges Chasma shows eroded fill material and extensive sand deposits.
This image captured by NASA 2001 Mars Odyssey spacecraft shows part of the extensive lava flows that comprise Daedalia Planum.
This image from NASA Mars Odyssey spacecraft shows some of the extensive lava flows that originate at Arsia Mons.

This daytime infrared 2001 Mars Odyssey image shows part of the extensive dune field on the floor of Russell Crater.
This image captured by NASA 2001 Mars Odyssey spacecraft shows more of the extensive lava flows in Daedalia Planum.
The two dark windstreaks in this image from NASA 2001 Mars Odyssey spacecraft are located on the extensive lava plains of Daedalia Planum.
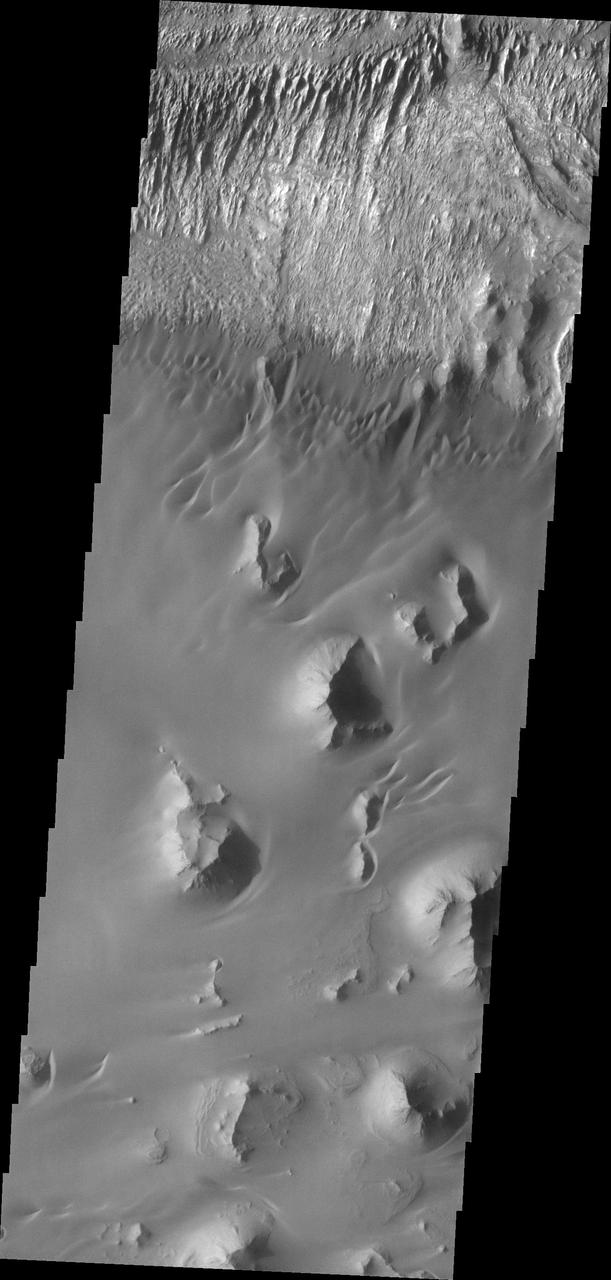
The landslide deposit in this image captured by NASA Mars Odyssey is located in shallow extension of Tithonium Chasma, in the western part of Valles Marineris.
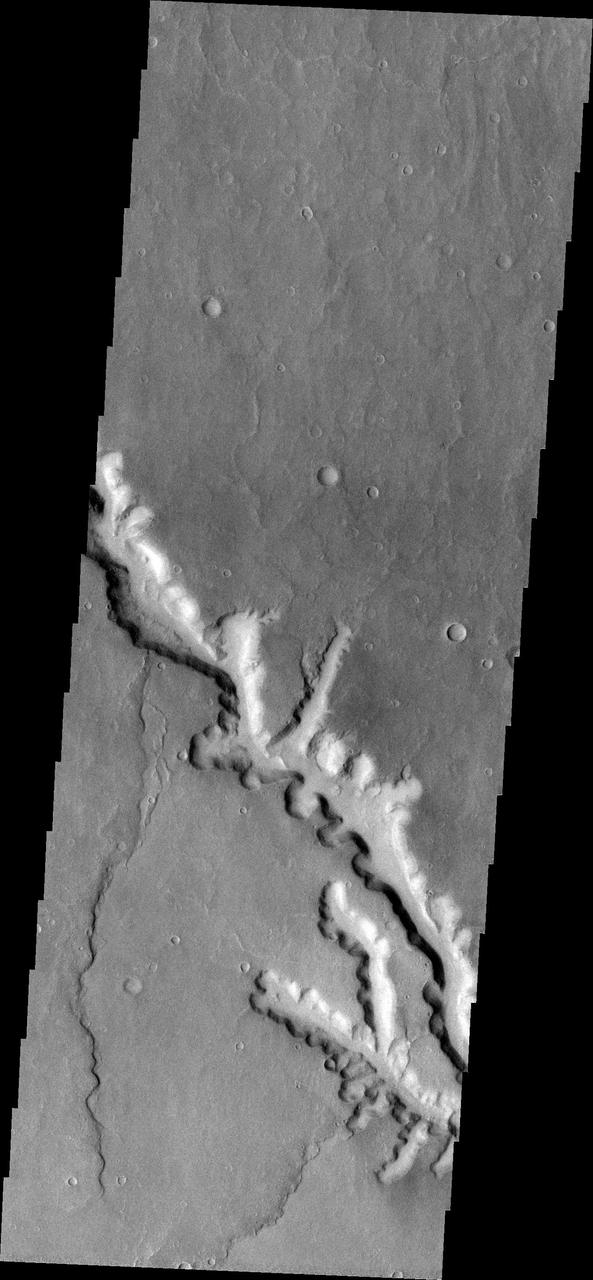
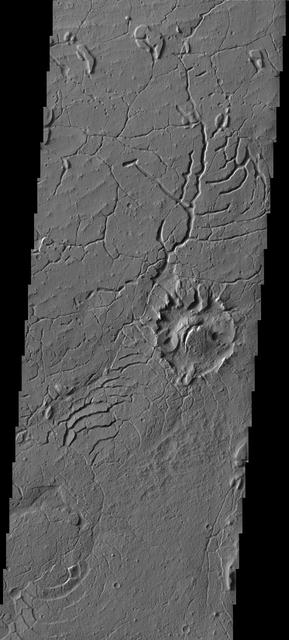
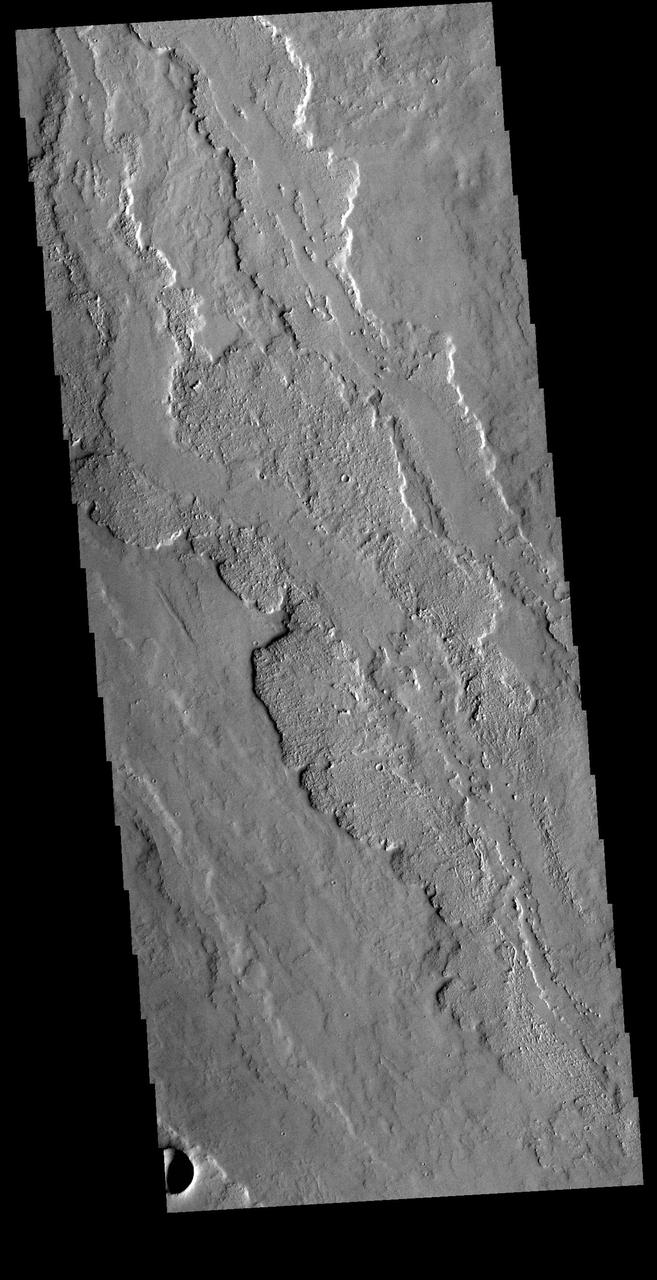
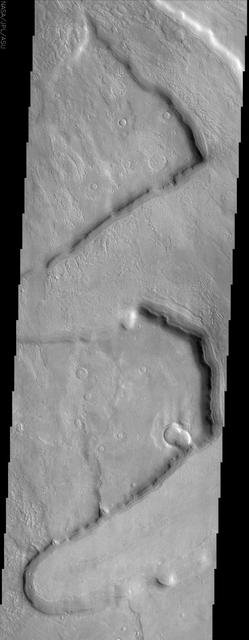
This VIS image shows part of Mangala Fossae. Fossae are long linear depressions called a graben and were formed by extension of the crust and faulting. When large amounts of pressure or tension are applied to rocks on timescales that are fast enough that the rock cannot respond by deforming, the rock breaks along faults. In the case of a graben, two parallel faults are formed by extension of the crust and the rock in between the faults drops downward into the space created by the extension. Mangala Fossae is 828 km long (514 miles). Orbit Number: 91672 Latitude: -15.2701 Longitude: 219.213 Instrument: VIS Captured: 2022-08-14 13:49 https://photojournal.jpl.nasa.gov/catalog/PIA25619
Mangala Fossae is a long linear depression called a graben and was formed by extension of the crust and faulting. When large amounts of pressure or tension are applied to rocks on timescales that are fast enough that the rock cannot respond by deforming, the rock breaks along faults. In the case of a graben, two parallel faults are formed by extension of the crust and the rock in between the faults drops downward into the space created by the extension. Mangala Fossae is 828 km long (514 miles). Orbit Number: 88715 Latitude: -19.129 Longitude: 208.571 Instrument: VIS Captured: 2021-12-14 02:14 https://photojournal.jpl.nasa.gov/catalog/PIA25297
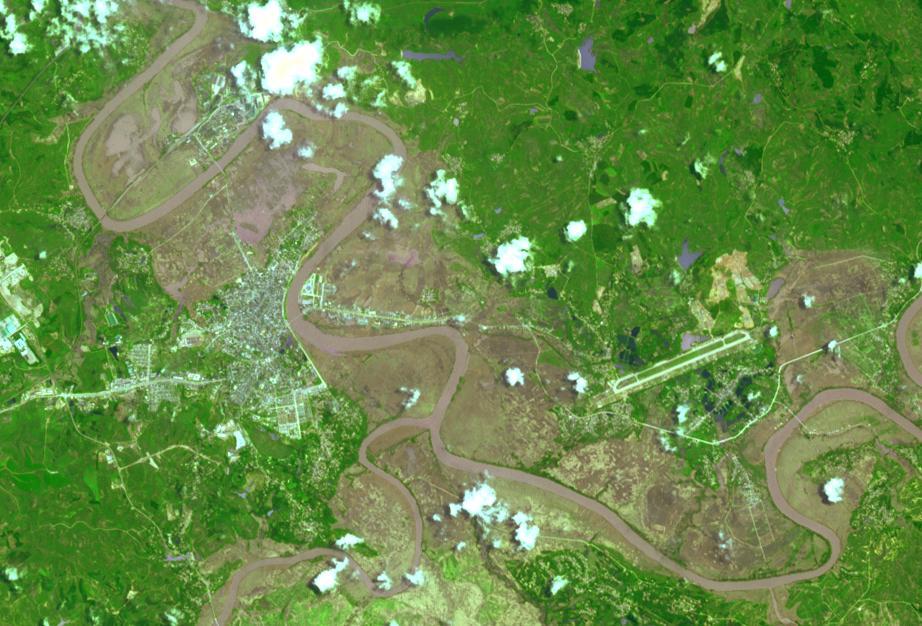
This image from the NASA Terra spacecraft shows extensive flooding resulting from Typhoon Rammasun in Ningming, China. This ASTER image was acquired on July 24, 2014.
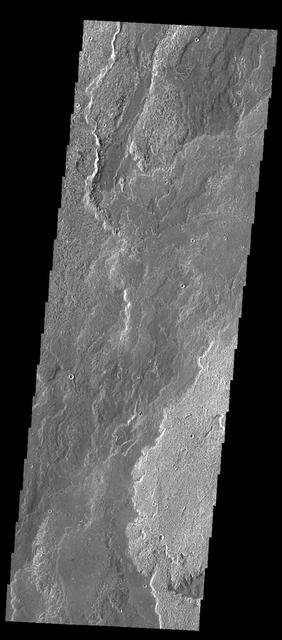
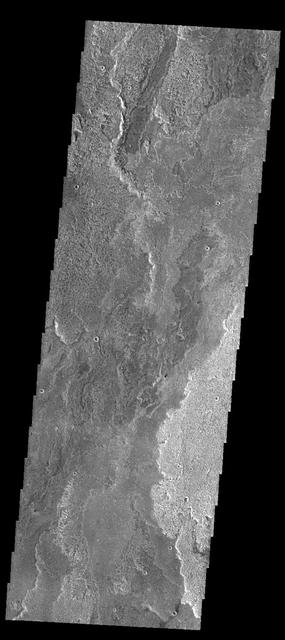
This image captured by NASA 2001 Mars Odyssey spacecraft shows a portion of Daedalia Planum, an extensive volcanic plain comprised of flows from Arsia Mons.
This image shows a small portion of the Martian dichotomy near Lucus Planum. The ancient crater at the right center of the images has been extensively modified by the fracturing
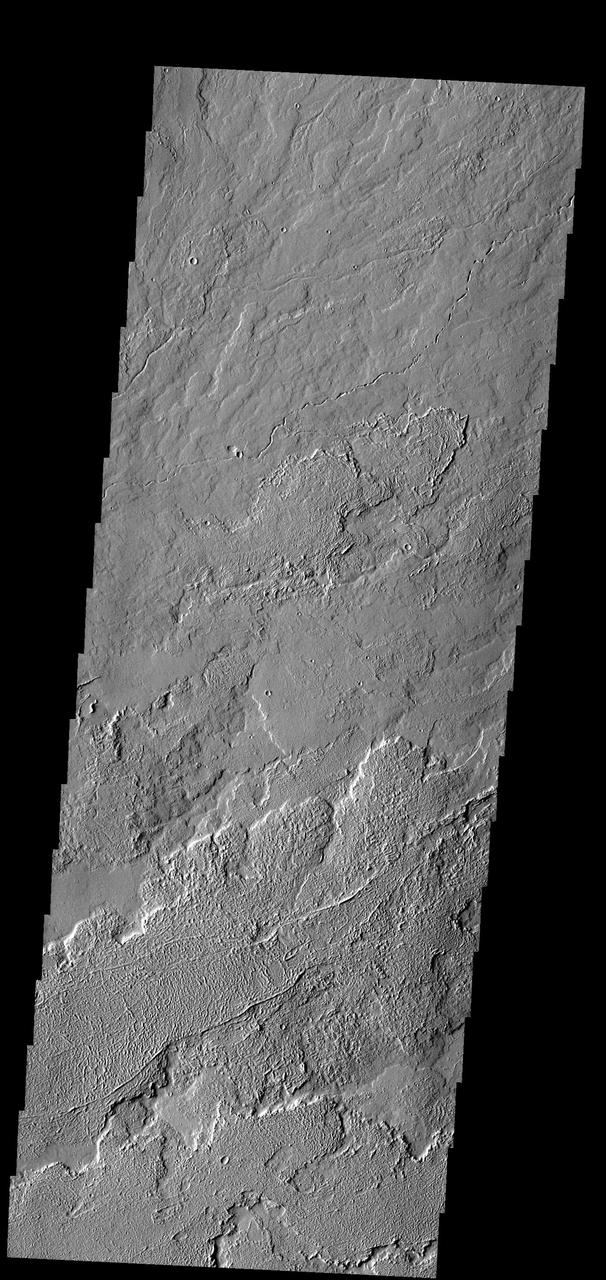
This image from NASA 2001 Mars Odyssey spacecraft shows part of Coprates Chasma, which is just one part of the extensive Valles Marineris canyon system.
The graben in this image from NASA 2001 Mars Odyssey spacecraft is Cyane Fossae. The lava flows are part of the extensive Tharsis volcanic flows.
This image captured by NASA 2001 Mars Odyssey spacecraft shows a small portion of Olympia Undae, an extensive dune field near the north polar cap.
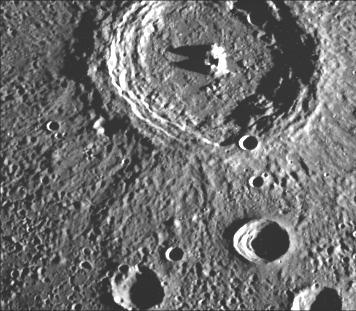
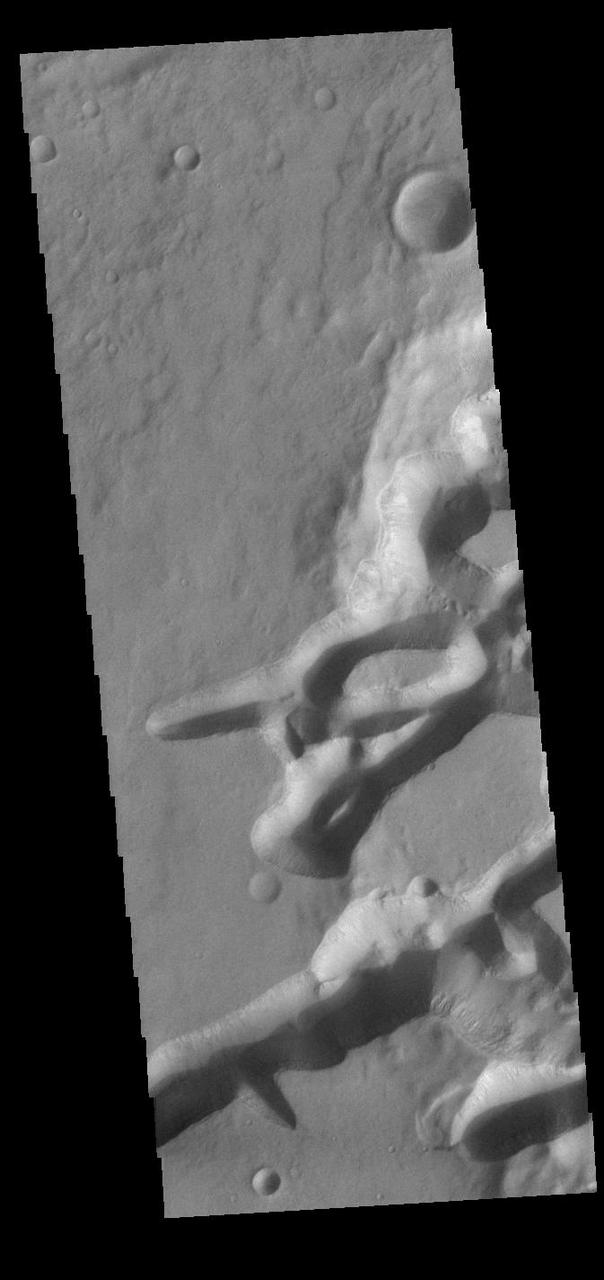
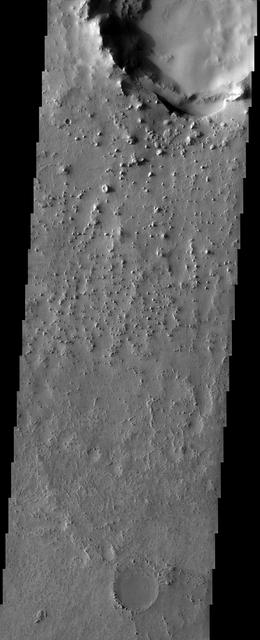
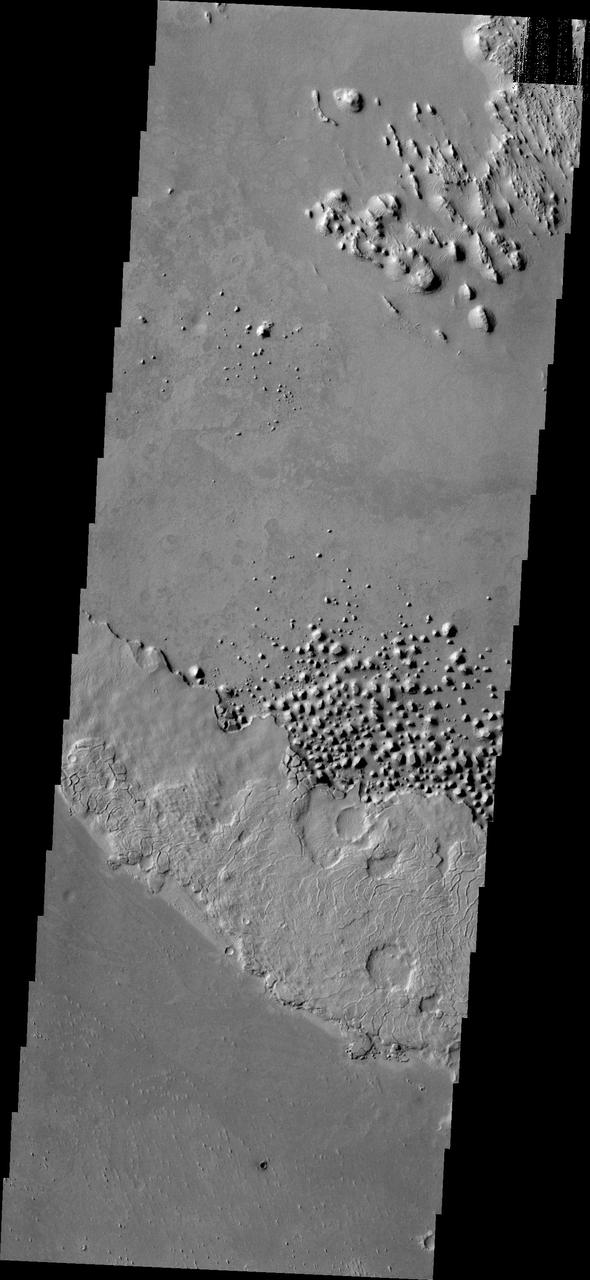
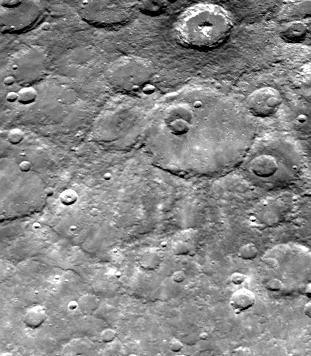
This crater illustrates the narrow hummocky rim facies, radial ridges, and surrounding extensive field of secondary craters. This image of Mercury was taken by NASA Mariner 10.

The Cassini spacecraft looks at Saturn largest moon, Titan, revealing its halo-like ring formed in the upper hazes of the moon extensive atmosphere.
This image captured by NASA 2001 Mars Odyssey spacecraft shows part of the extensive field of lava flows that make up Daedalia Planum.
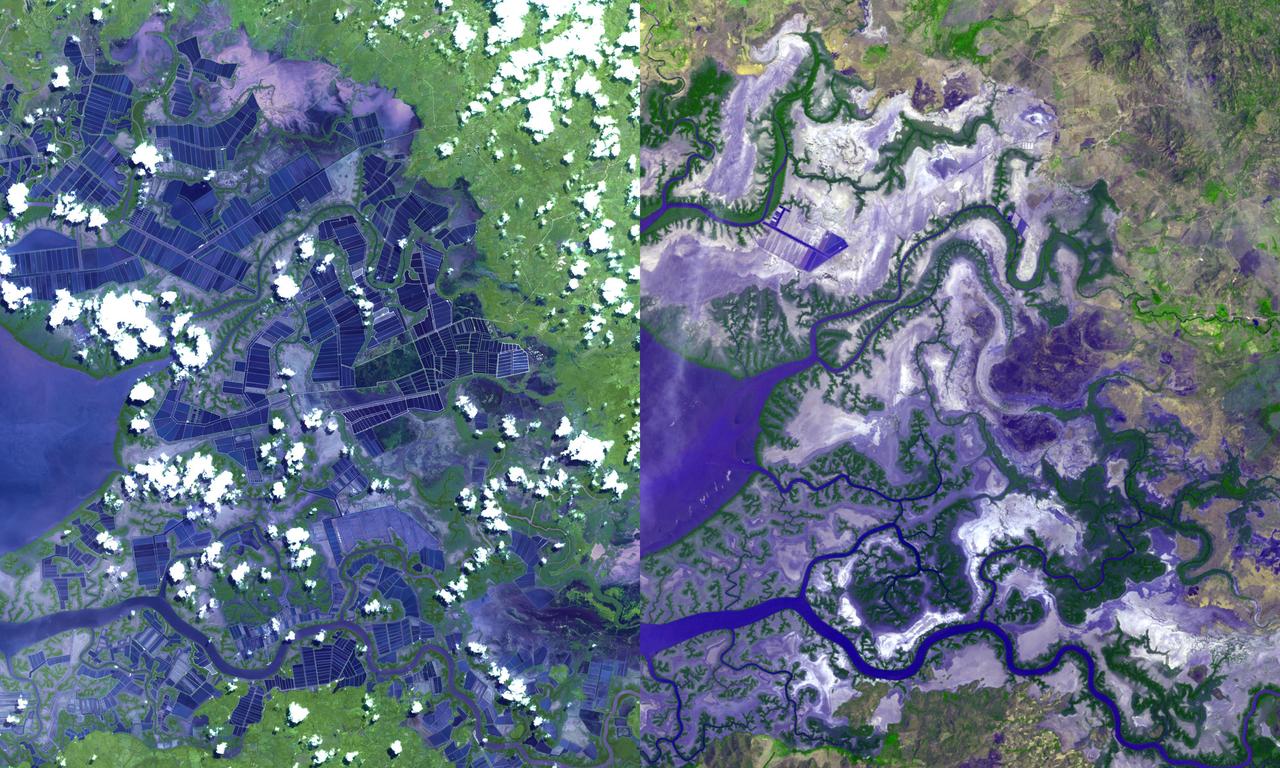
Acquired by NASA Terra spacecraft, this image shows the eastern end of the Gulf of Fonseca, in Honduras, originally the site of extensive wetlands ecosystem, dominated by six species of mangroves.
Polar layered deposits slopes are quite extensive and partially surround the South polar residual cap as seen in this image from NASA Mars Reconnaissance Orbiter.
The volcanic flows in this image captured by NASA Mars Odyssey spacecraft are part of Daedalia Planum, an extensive flow field originating from Arsia Mons.
Extensive lava flows originating from Arsia Mons created Daedalia Planum. This image is from NASA 2001 Mars Odyssey spacecraft.
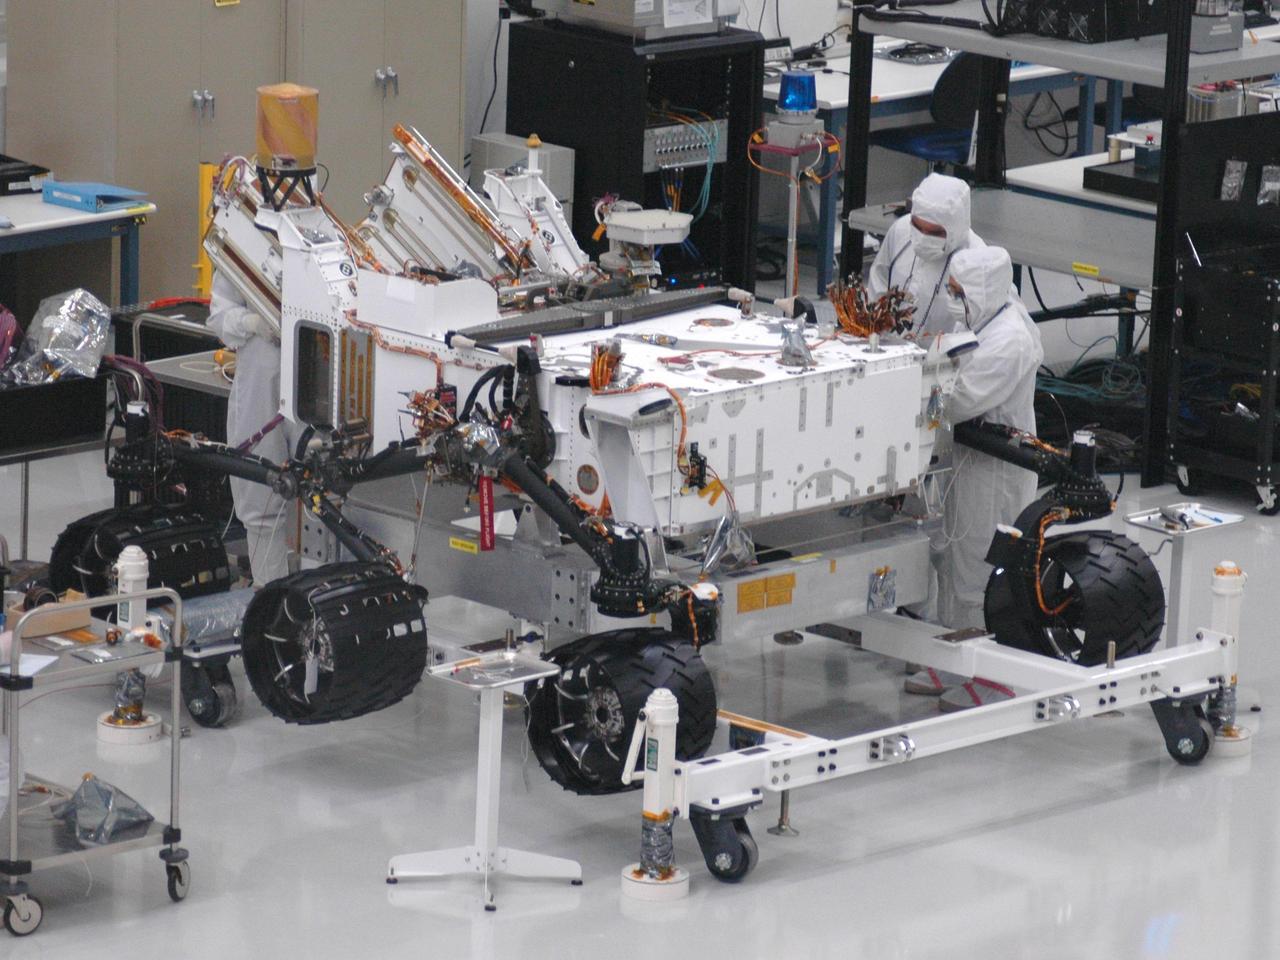
Mars rover Curiosity, the centerpiece of NASA Mars Science Laboratory mission, is coming together for extensive testing prior to its late 2011 launch.
Daedalia Planum was created by extensive lava flows from Arsia Mons. This image from NASA Mars Odyssey shows a small portion of those flows.
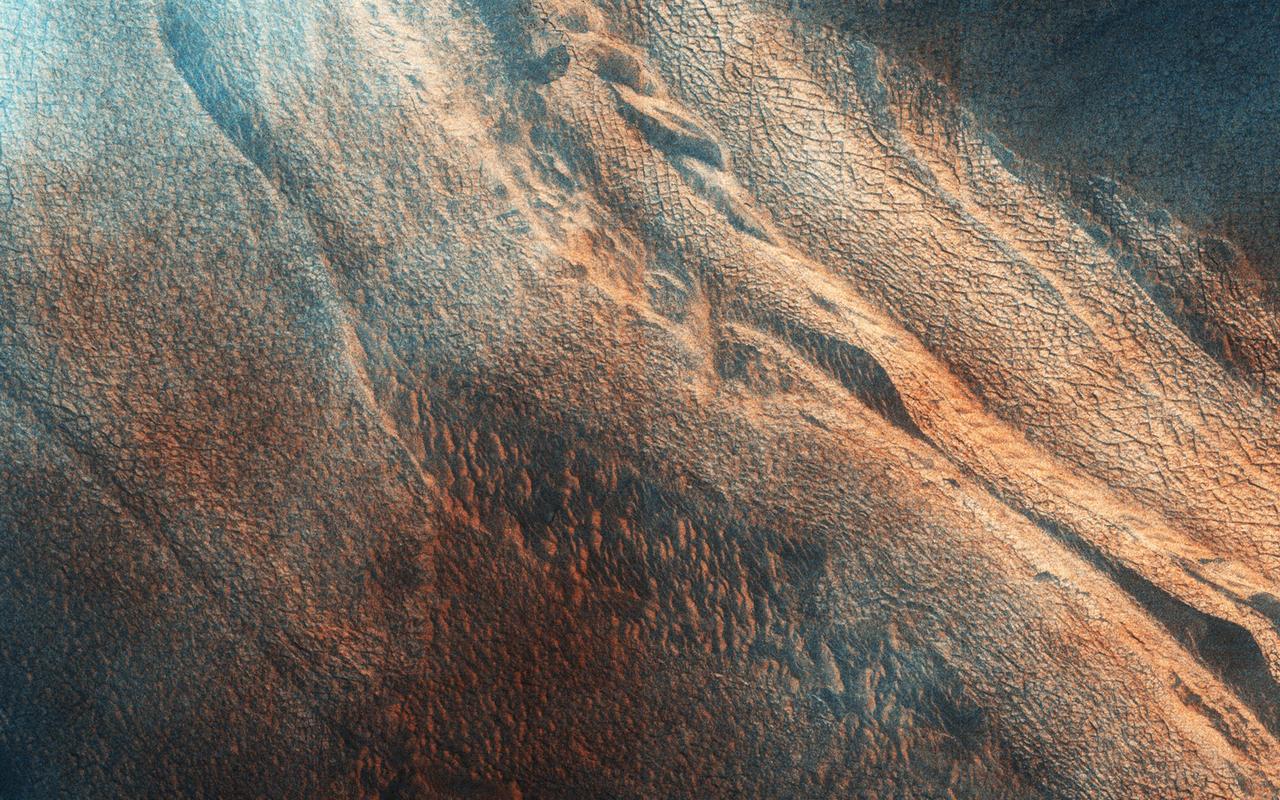
An extensive sand sheet and dunes are located within Pityusa Patera. This daytime infrared image shows that the sand is relatively warmer than the surrounding materials.
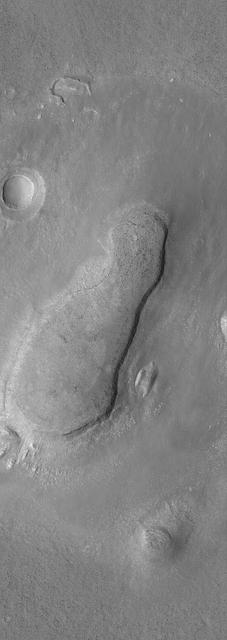
The linear features in this image are part of Mangala Fossae. Mangala Fossae are long linear depressions called a graben and were formed by extension of the crust and faulting. When large amounts of pressure or tension are applied to rocks on timescales that are fast enough that the rock cannot respond by deforming, the rock breaks along faults. In the case of a graben, two parallel faults are formed by extension of the crust and the rock in between the faults drops downward into the space created by the extension. Mangala Fossae is 828 km long (514 miles). Orbit Number: 91822 Latitude: -19.0175 Longitude: 212.283 Instrument: VIS Captured: 2022-08-26 22:12 https://photojournal.jpl.nasa.gov/catalog/PIA25650
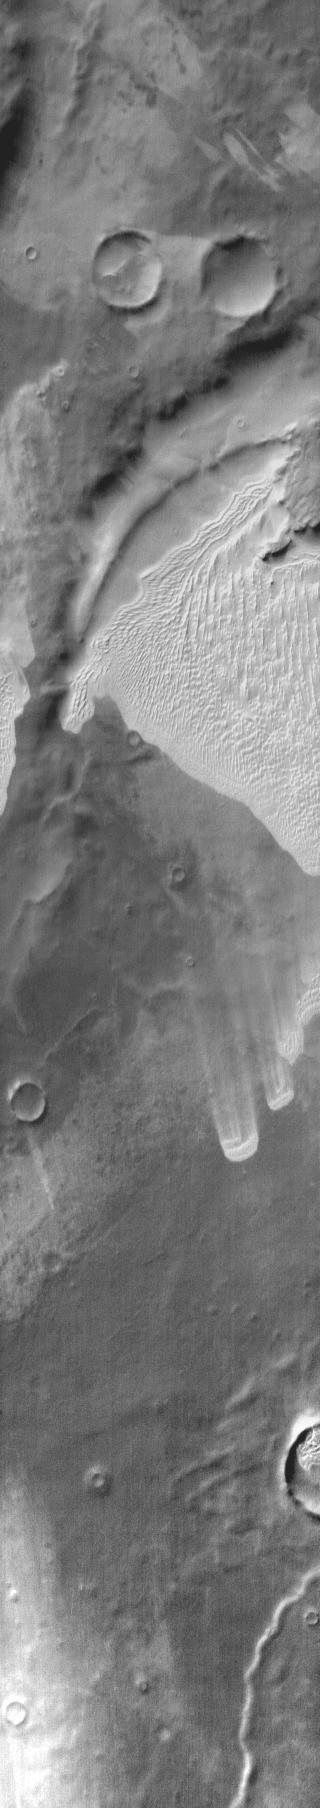
Mangala Fossae is a long linear depression called a graben and was formed by extension of the crust and faulting. When large amounts of pressure or tension are applied to rocks on timescales that are fast enough that the rock cannot respond by deforming, the rock breaks along faults. In the case of a graben, two parallel faults are formed by extension of the crust and the rock in between the faults drops downward into the space created by the extension. At the right side of the image the graben enters an impact crater, and creates a complex group of tectonic fractures and depressions. Mangala Fossae is 828 km long (514 miles). Orbit Number: 91061 Latitude: -19.2481 Longitude: 206.825 Instrument: VIS Captured: 2022-06-25 06:21 https://photojournal.jpl.nasa.gov/catalog/PIA25533
Today's VIS image shows a very small portion of the extensive lava flows of the Tharsis volcanic complex. These flows are located southwest of Ascraeus Mons. Orbit Number: 81900 Latitude: 6.11029 Longitude: 250.287 Instrument: VIS Captured: 2020-05-31 23:08 https://photojournal.jpl.nasa.gov/catalog/PIA24089
This VIS image shows part of the extensive volcanic flows in the Tharsis region. These flows are east of Ascraeus Mons. Orbit Number: 81076 Latitude: 11.2203 Longitude: 261.313 Instrument: VIS Captured: 2020-03-25 02:50 https://photojournal.jpl.nasa.gov/catalog/PIA23935
This long image is entirely over the extensive central peak complex of Hale Crater. Of particular interest are bedrock outcrops and associated fine-grained sediments with different colors. This 153-kilometer diameter crater was named after American astronomer George Ellery Hale. https://photojournal.jpl.nasa.gov/catalog/PIA23101
This VIS image shows some of the extensive lava flows that comprise Solis Planum. Orbit Number: 64810 Latitude: -20.2434 Longitude: 258.499 Instrument: VIS Captured: 2016-07-24 06:51 http://photojournal.jpl.nasa.gov/catalog/PIA20991
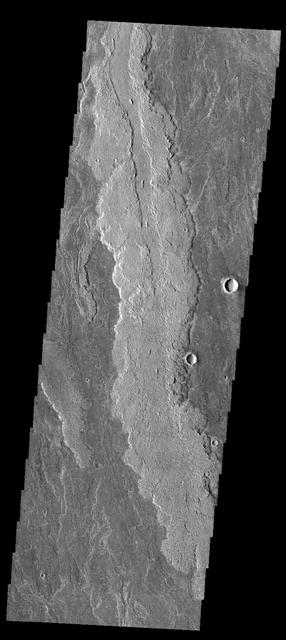
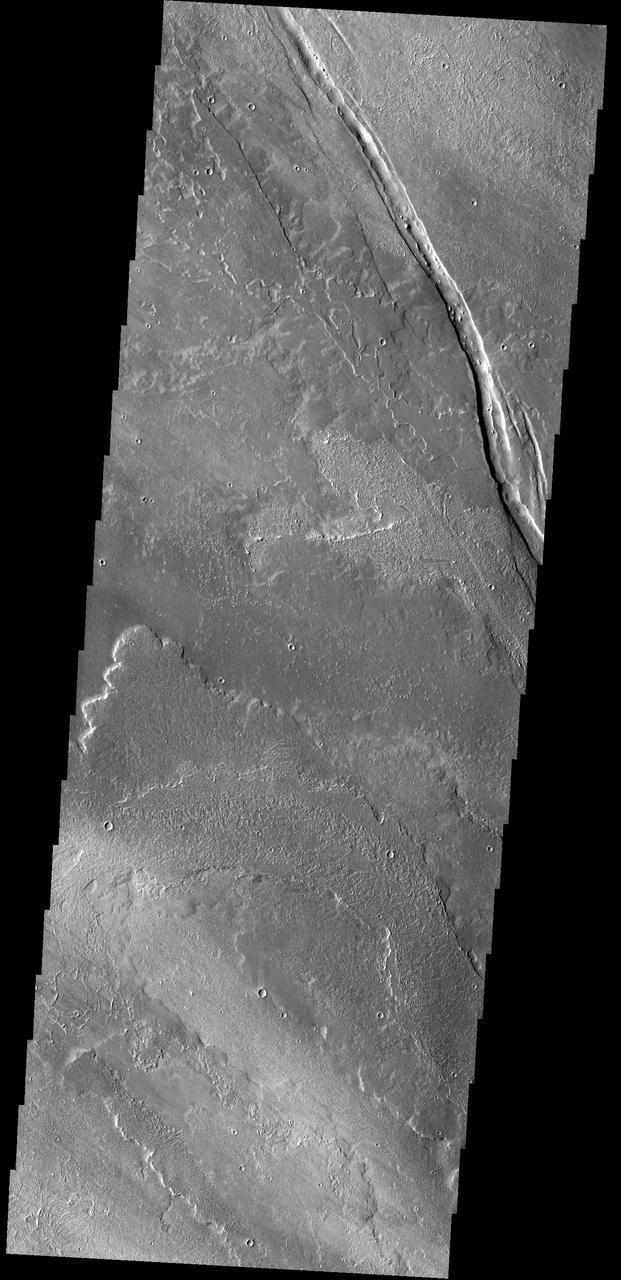
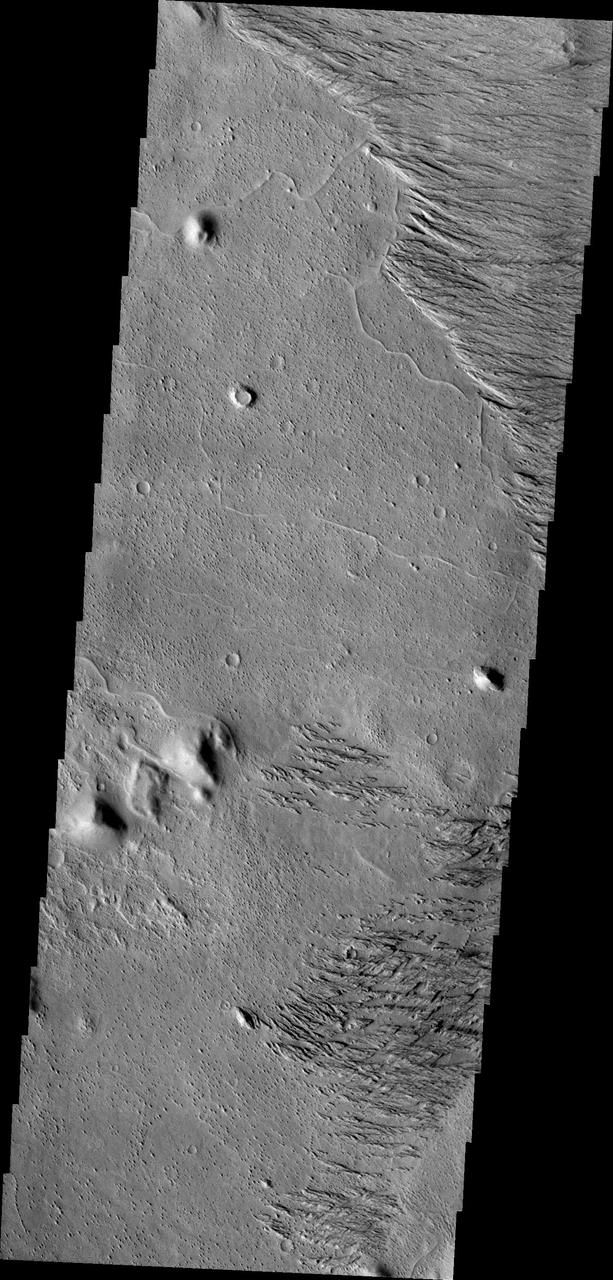
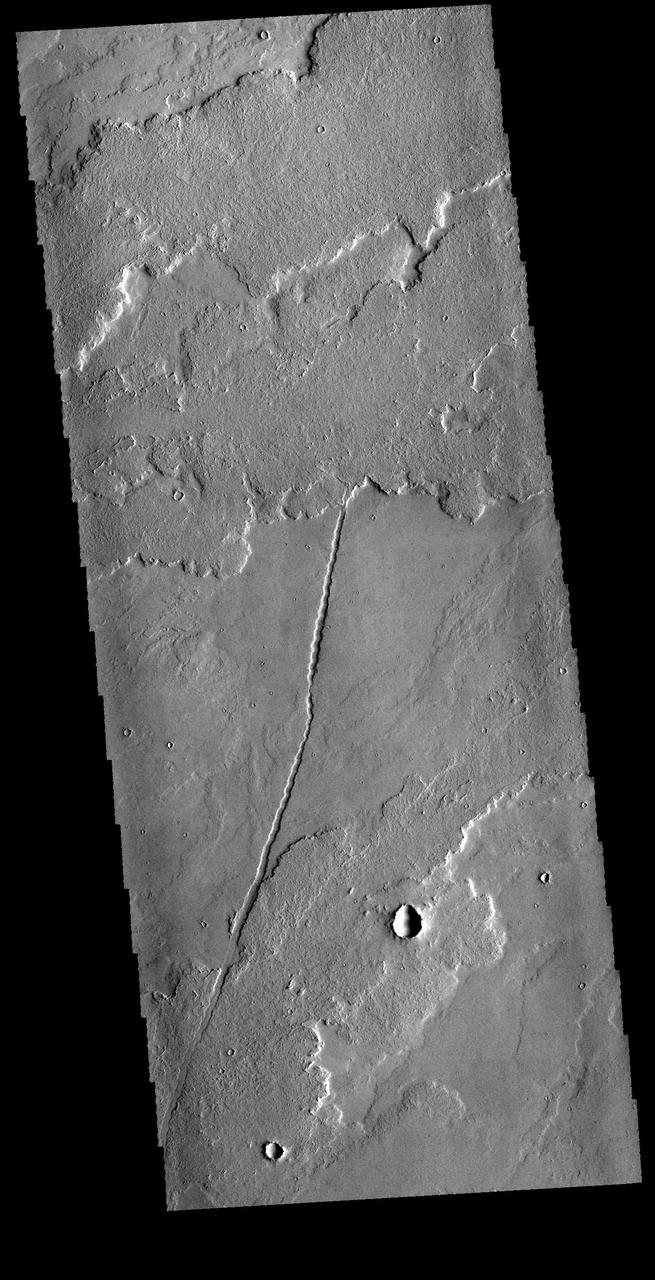
Tantalus Fossae, seen in this image from NASA Mars Odyssey spacecraft, is a set of long valleys on the eastern side of Alba Patera. These valleys are referred to as grabens and are formed by extension of the crust and faulting.
This image from NASA Mars Odyssey is located west of Zephyria Planum. Surfaces in this region have undergone extensive erosion by the wind. Wind is one of the most active processes of erosion on the surface of Mars today.
This daytime infrared image of Rabe Crater illustrates the warming effect of the sun on sand. The extensive sand sheet and dunes of Rabe crater appear bright in the infrared indicating they are warmer than the surrounding floor and plains materials.
Many valleys occur all over Mars that reveal an extensive ancient history of liquid water erosion. This image from NASA Mars Reconnaissance Orbiter shows a complex valley network near Idaeus Fossae.
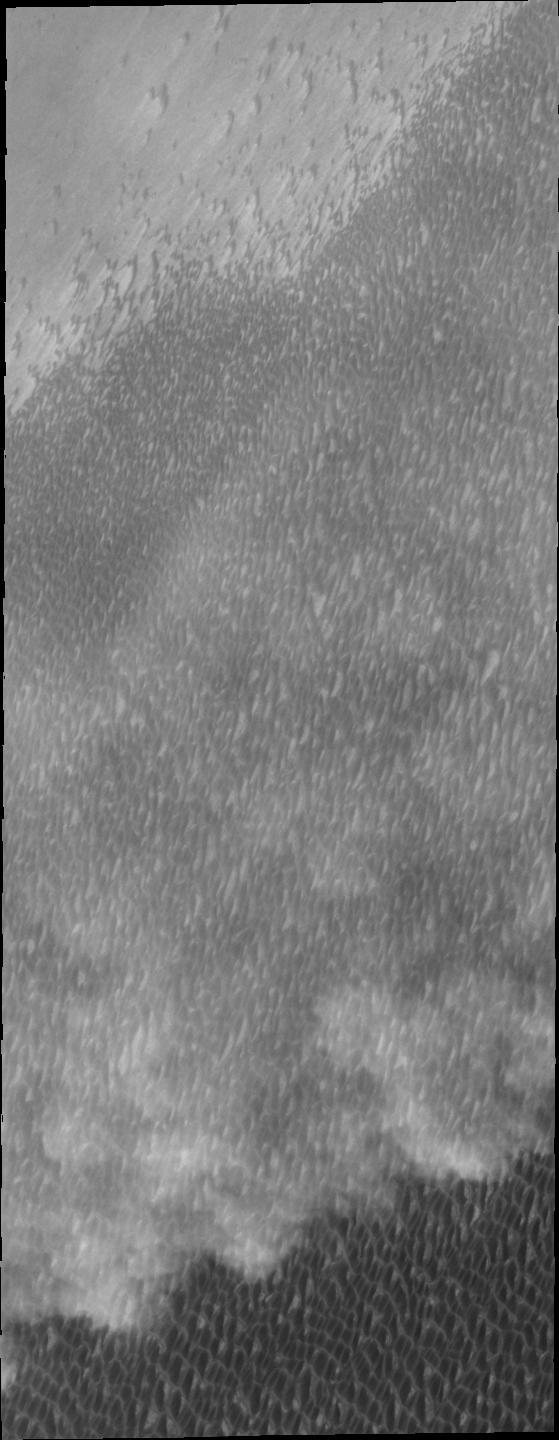
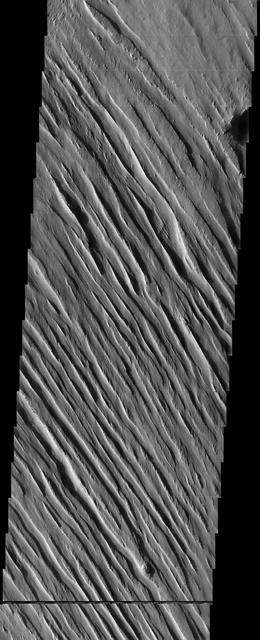
By high summer, the extensive dune fields of the north polar region are completely defrosted and the number and variety of dunes are readily visible. This image was captured by NASA Mars Odyssey on August 31, 2010.
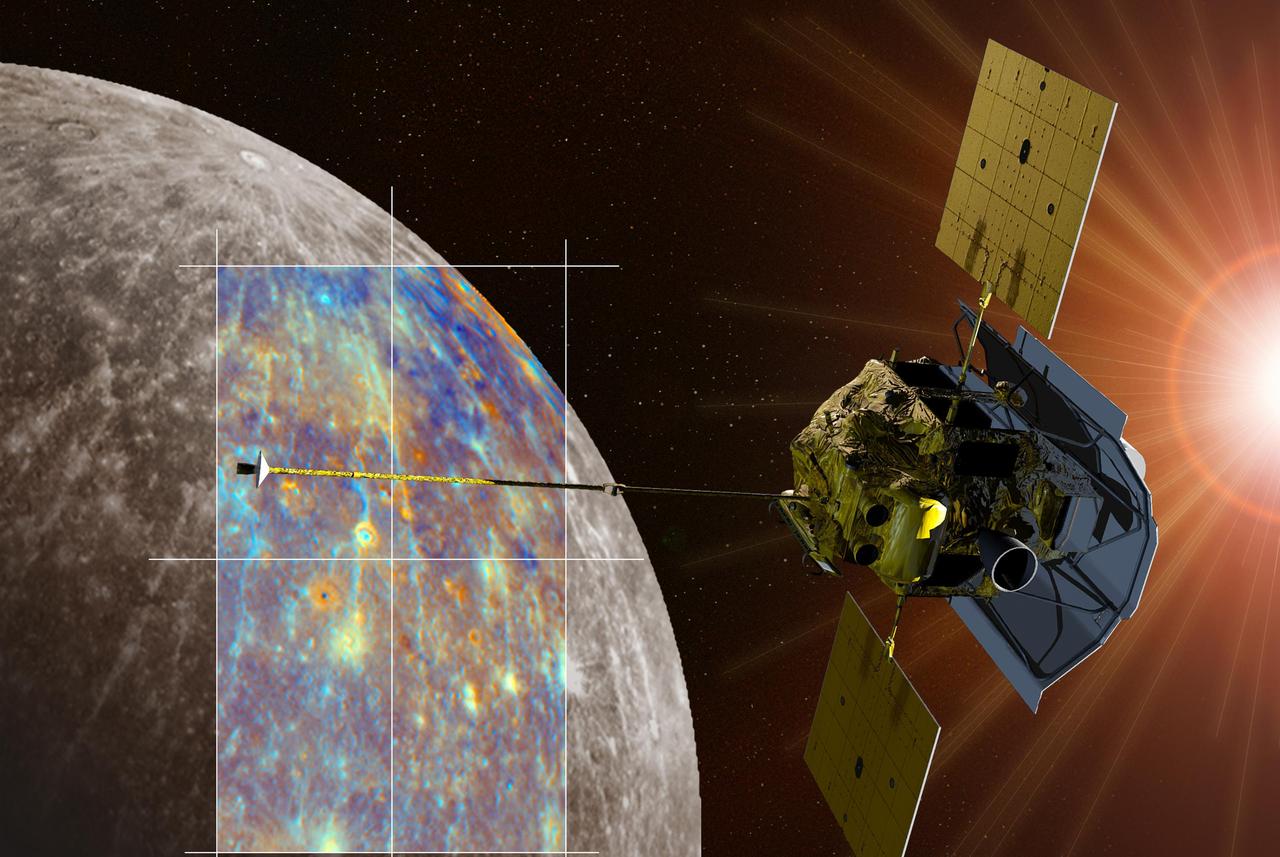
An artist rendering of the MESSENGER spacecraft is shown passing near the crater Hokusai and its extensive system of rays. Both the monochrome and enhanced color views of Mercury were obtained during MESSENGER second Mercury flyby.
This MOC image shows a cone-shaped hill, perhaps a remnant of a material that was once more laterally extensive across the area, on a textured plain in the Hyperboreus Labyrinthus region in the north polar region of Mars
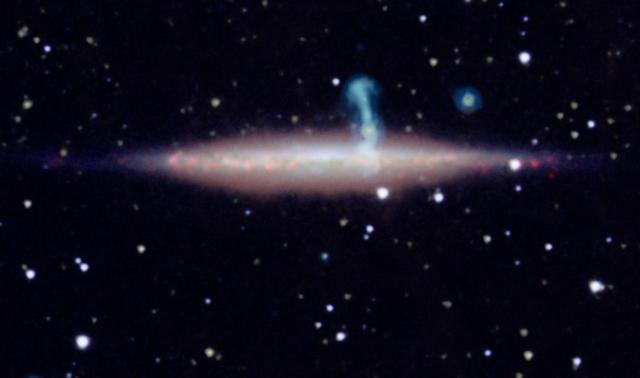
New detailed radio data from the NRAO Jansky Very Large Array VLA revealed that the large perpendicular extension of UGC 10288 halo blue is really a distant background galaxy with radio jets.
The north end of this long image from NASA Mars Reconnaissance Orbiter shows a lava surface in southern Elysium Planitia. Small cones are common on the extensive young flood lavas in this region.

With the extensive amount of dust and sandy materials on Mars, dunes are a pervasive feature. Many dunes are small, like the ones in this image from NASA 2001 Mars Odyssey spacecraft. The bright quiggles in this image are small dunes.
Spring storms are common near the north pole. This image captured by NASA 2001 Mars Odyssey spacecraft shows a storm front over the extensive dune field which surrounds part of the polar cap.
This Mars Global Surveyor MOC image shows the remains of a once more laterally extensive layer overlying undulating terrain very near the south polar residual cap
Just north of the hematite deposit in Meridiani Planum, the remnants of a formerly extensive layer of material remain as isolated knobs and buttes in this image from NASA Mars Odyssey spacecraft.
These images and data products from NASA Terra spacecraft documented extensive smoke from fires burning throughout Nigeria and north central Africa on January 31, 2003.
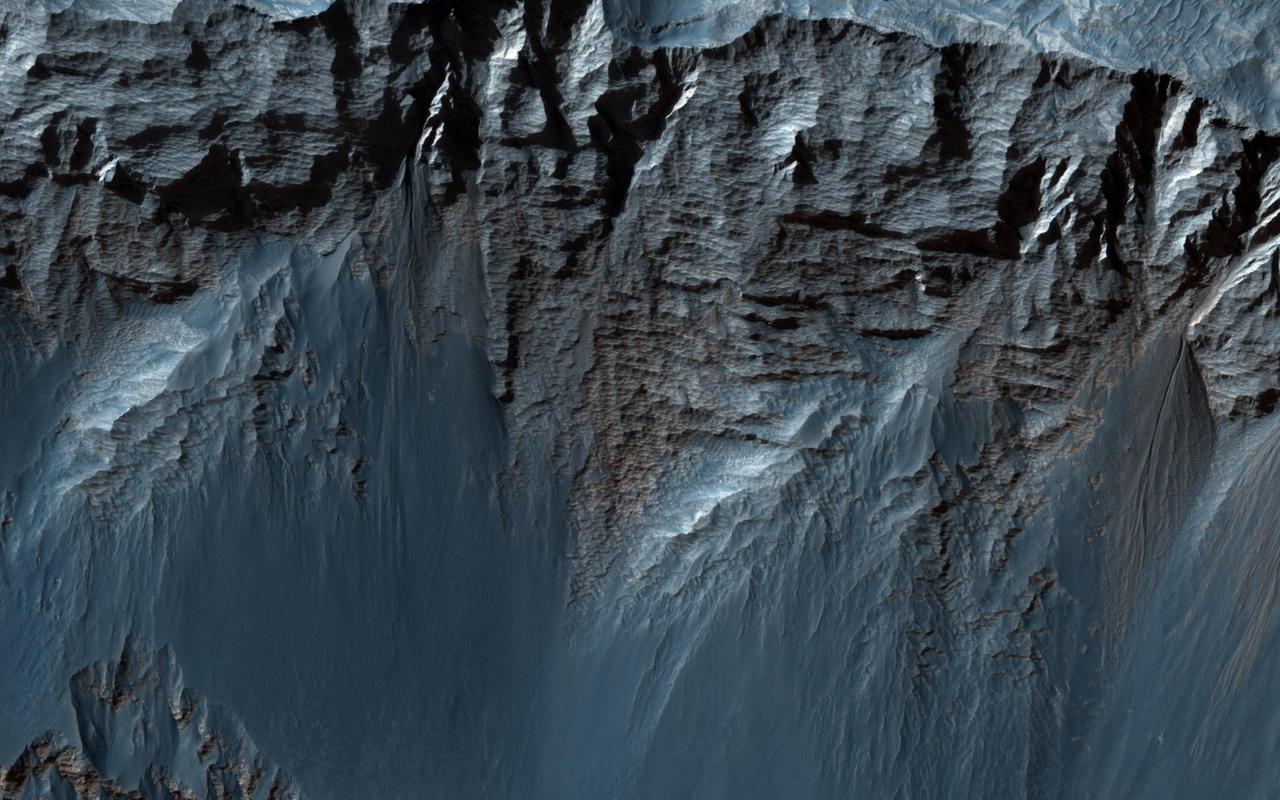
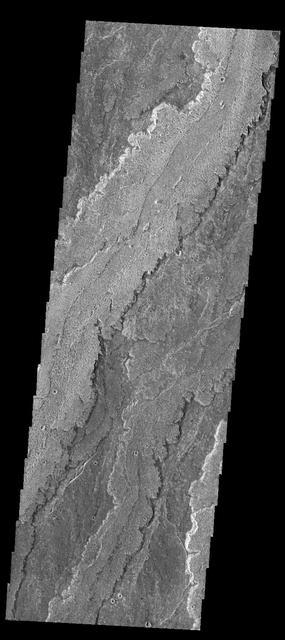
This beautiful image shows terrific layers and exposed bedrock along a cliff in west Candor Chasma, which is part of the extensive Valles Marineris canyon system as seen by NASA Mars Reconnaissance Orbiter.
This MOC image shows blocky remnants of a material that was once more laterally extensive on the floor of an impact crater located northwest of Herschel Crater on Mars. Large ripples of windblown sediment have accumulated around and between the blocks
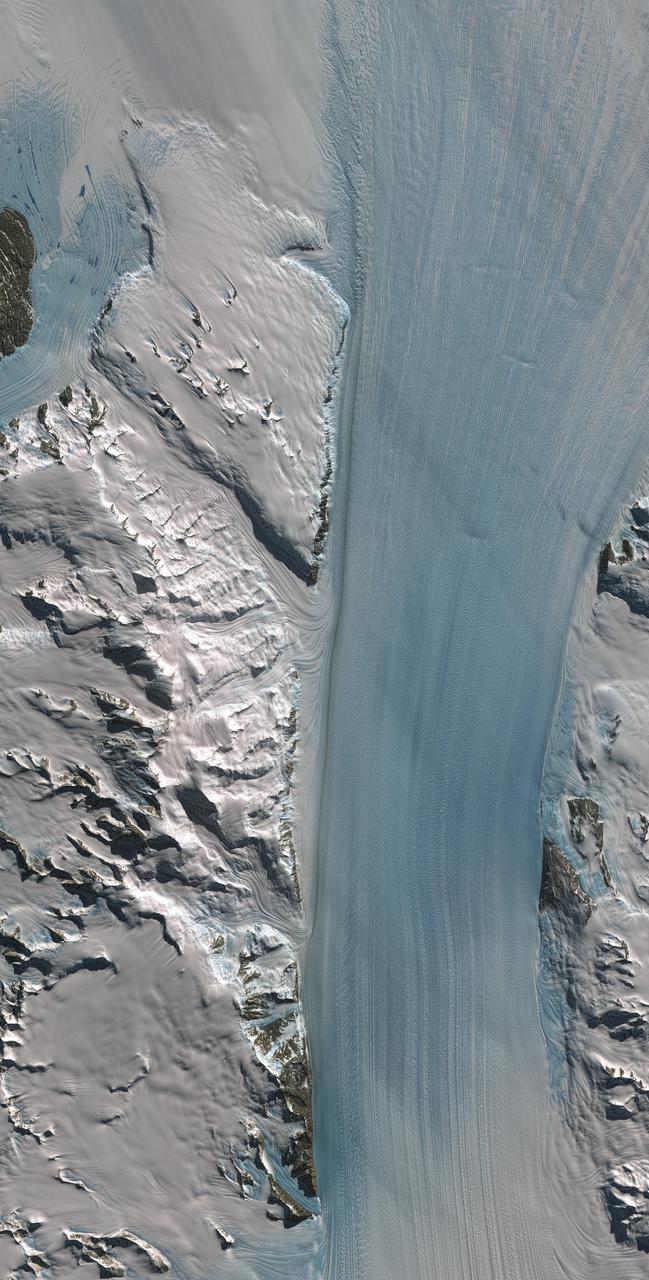
Byrd Glacier is a major glacier in Antarctica; it drains an extensive area of the polar plateau and flows eastward between the Britannia Range and the Churchill Mountains to discharge into the Ross Ice Shelf. This image is from NASA Terra satellite.
Clouds are common near the north polar caps throughout the spring and summer. The clouds typically cause a haze over the extensive dune fields. This image from NASA Mars Odyssey shows the edge of the cloud front.
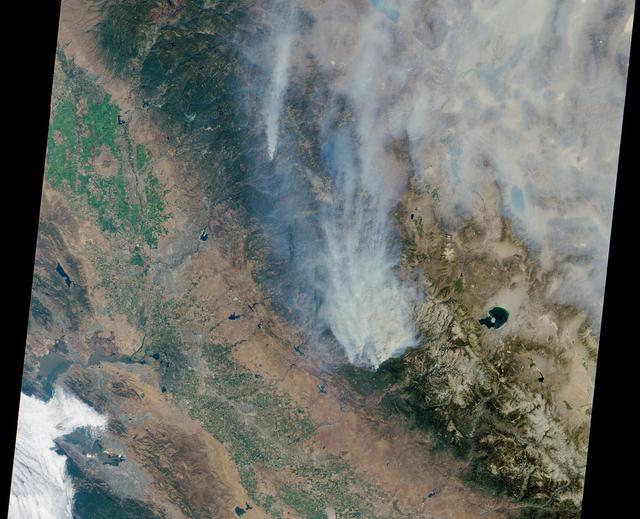
This visible image of California Rim Fire was acquired Aug. 23, 2013 by the Multi-angle Imaging SpectroRadiometer MISR instrument on NASA Terra spacecraft, showing extensive, brownish smoke.
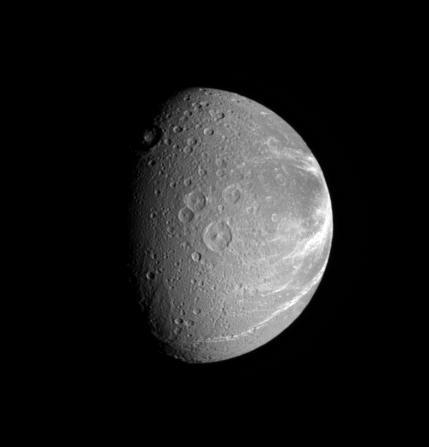
Bright fractures creep across the surface of icy Dione. This extensive canyon system is centered on a region of terrain that is significantly darker that the rest of the moon. Part of the darker terrain is visible at right
This small region of hills appears to be forming from the fractured material just south of it. This material is the northern extension of Zephyria Planum. This image is from NASA 2001 Mars Odyssey spacecraft.
The wind-sculpted yardangs in this scene from NASA Mars Odyssey spacecraft are part of the Medusae Fossae Formation, a regionally extensive geologic unit that probably was produced from the accumulation of volcanic ash.
The north end of this long image from NASA Mars Reconnaissance Orbiter shows a lava surface in southern Elysium Planitia. Small cones are common on the extensive young flood lavas in this region.
This NASA Mars Odyssey image shows several fretted channels within Deuteronilus Mensae in the northern plains of Mars. These linear troughs appear to have been extensively modified by surficial processes.
This image shows a small portion of the extensive lava flows created by the large Tharsis volcanoes as seen by NASA 2001 Mars Odyssey spacecraft. These flows are located north east of Ascraeus Mons.
This MOC image shows a mesa and an impact grater just east of Phlegra Montes. The mesa is the eroded remnant of a once more extensive terrain. An apron of material surrounds the mesa
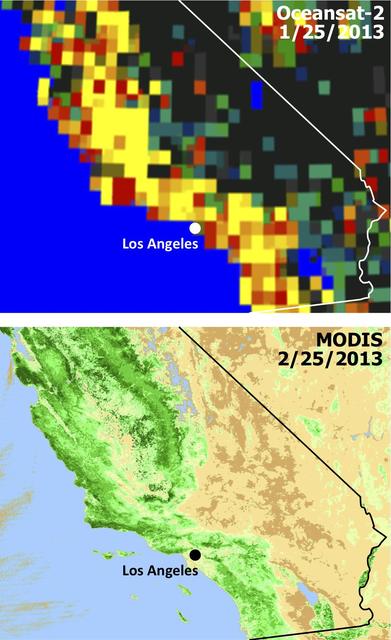
Extensive and persistent rains between Jan. 24 and Jan. 27, 2013, significantly increased soil moisture and enhanced vegetation growth in Southern California based on data from NASA Aqua spacecraft and ISRO Oceansat-2 satellite.
The dark markings in this image from NASA 2001 Mars Odyssey spacecraft are tracks made by the passage of dust devils. Dust devils are common in the extensive plains of the northern latitudes. This image is located in Utopia Planitia.

NASA Phoenix Mars Lander parachuted for nearly three minutes as it descended through the Martian atmosphere on May 25, 2008. Extensive preparations for that crucial period included this drop test near Boise, Idaho, in October 2006.
NASA Mariner 10 took this picture about an hour after it passed under the South Pole of Mercury in 1974.
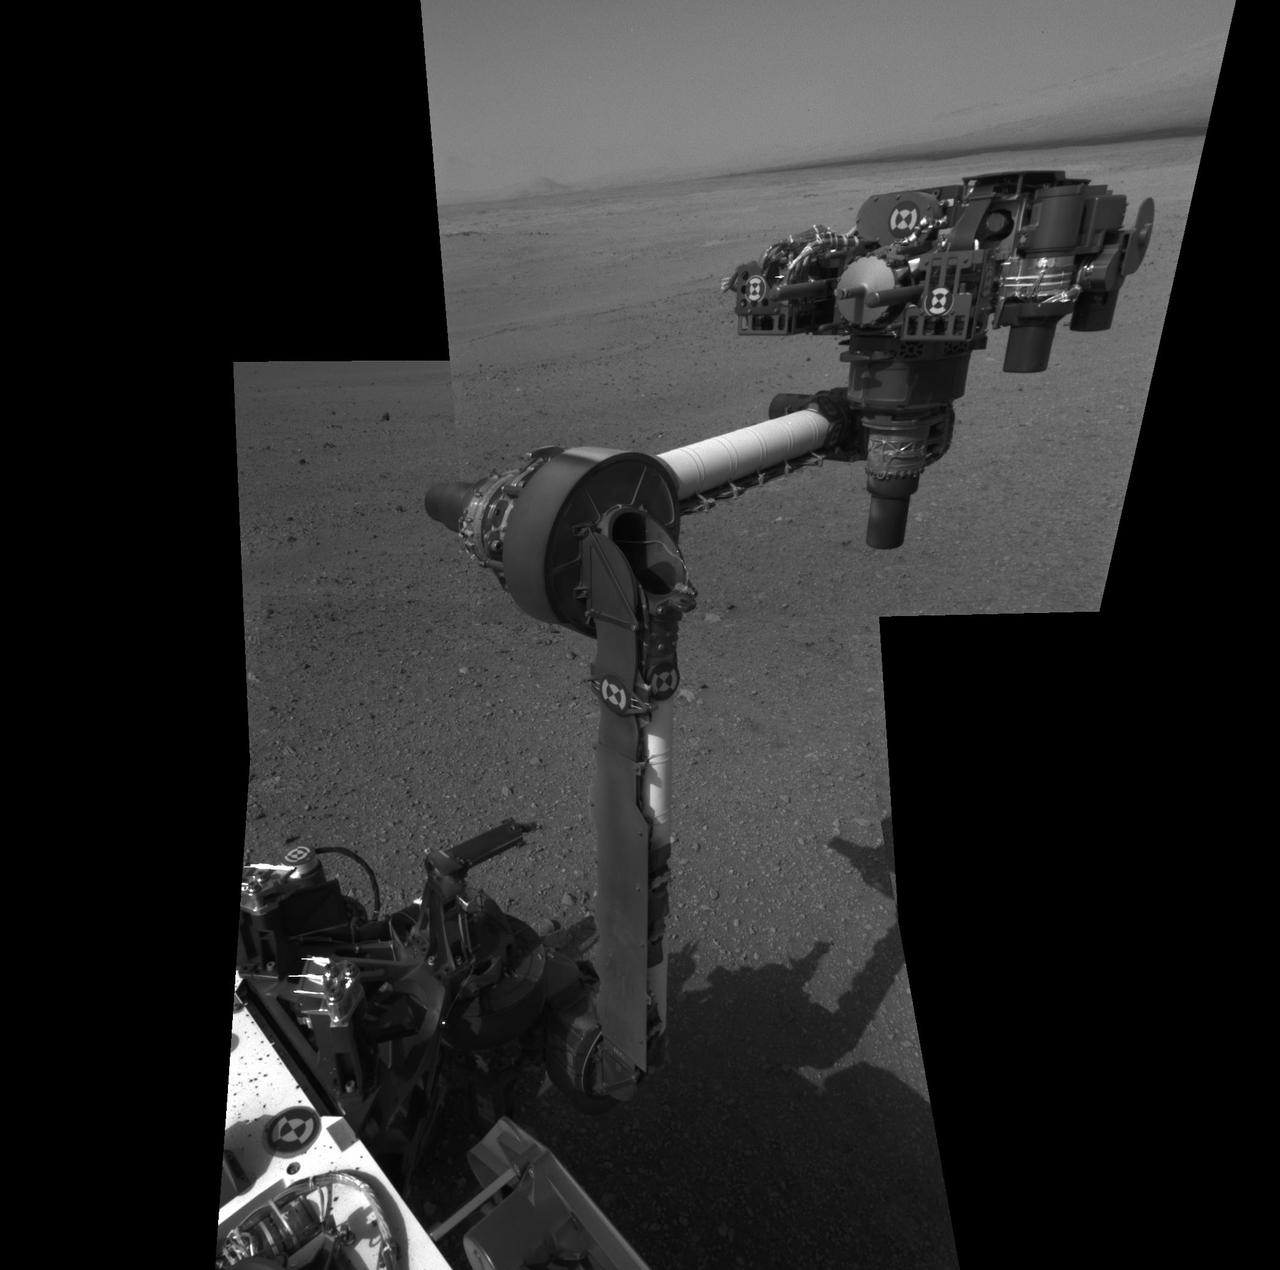
The extended robotic arm of NASA Mars rover Curiosity can be seen in this mosaic of full-resolution images from Curiosity Navigation camera Navcam. Curiosity extended its arm on Aug. 20, 2012.
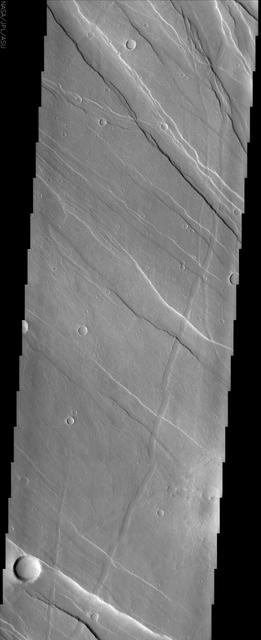
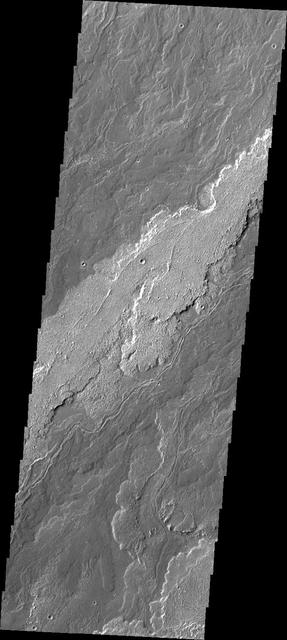
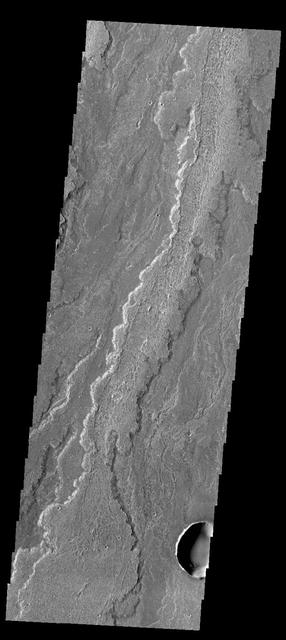
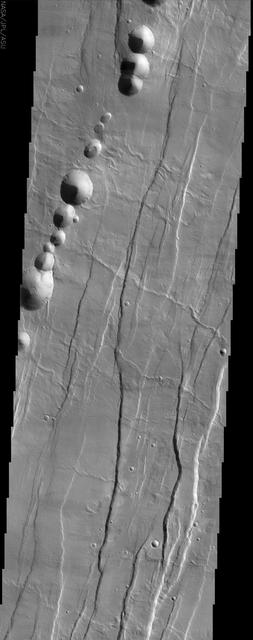
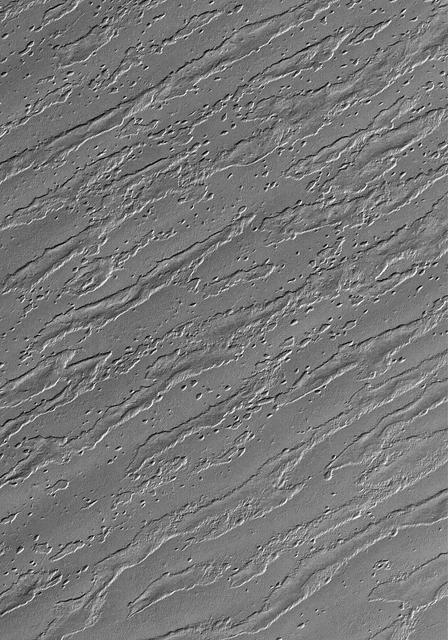
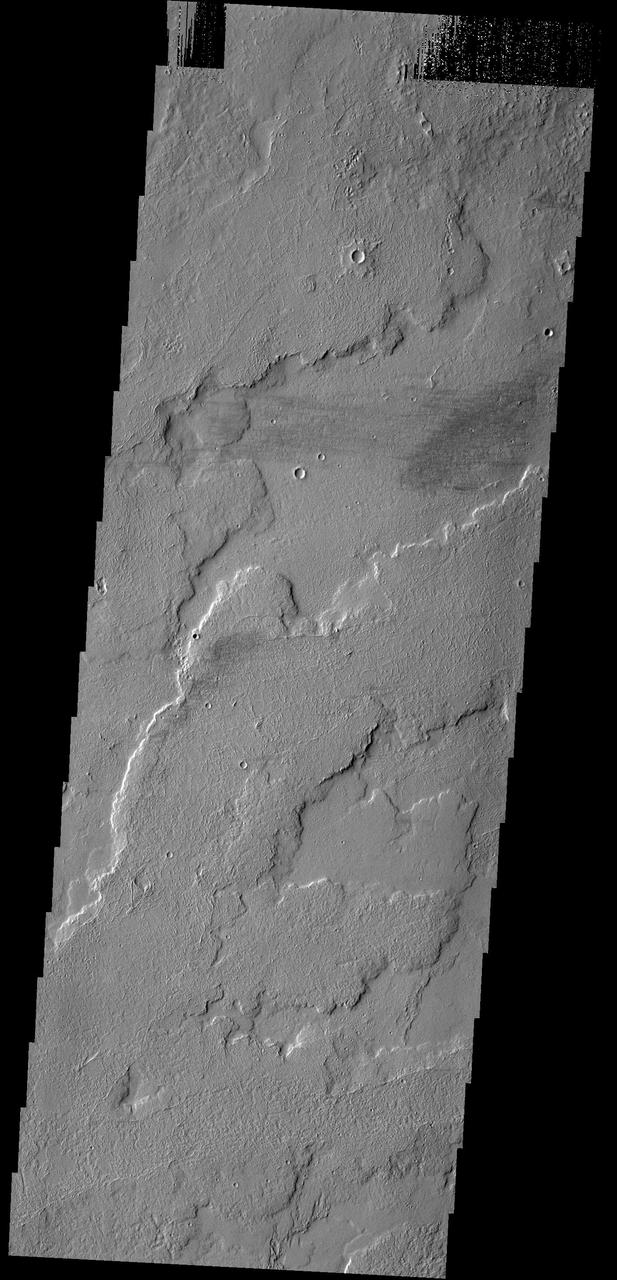
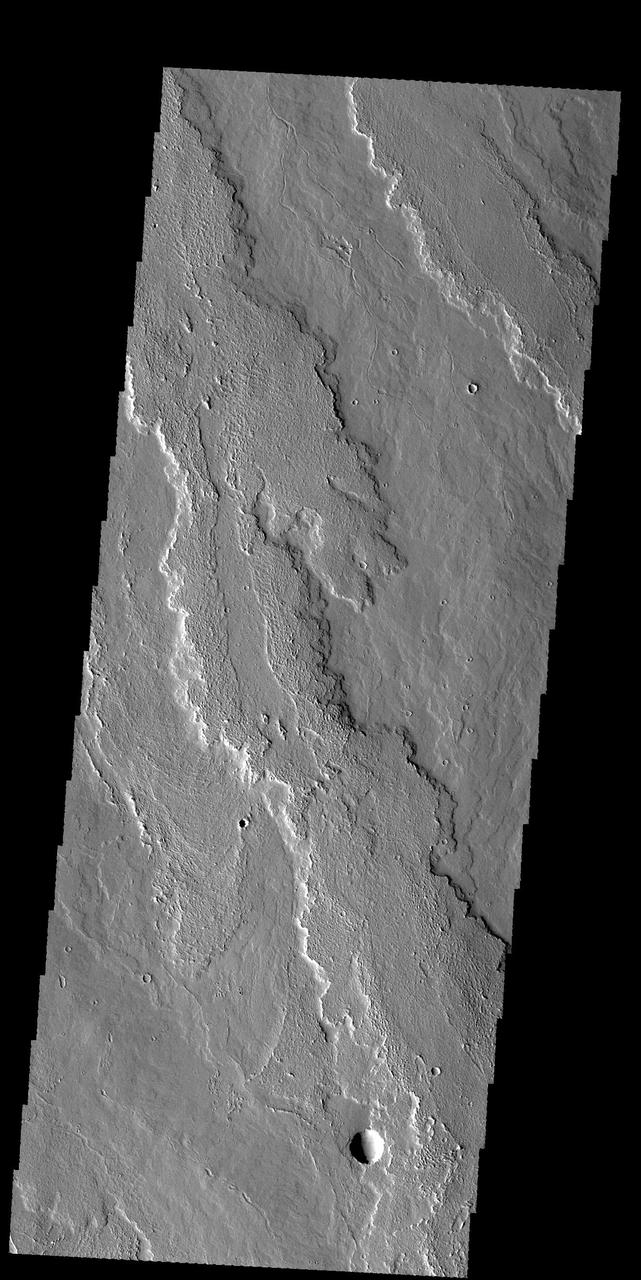
Today's VIS image shows a portion of Sirenum Fossae. The linear features are tectonic graben. Graben are formed by extension of the crust and faulting. When large amounts of pressure or tension are applied to rocks on timescales that are fast enough that the rock cannot respond by deforming, the rock breaks along faults. In the case of a graben, two parallel faults are formed by extension of the crust and the rock in between the faults drops downward into the space created by the extension. Numerous sets of graben are visible in this THEMIS image, trending from north-northeast to south-southwest. Because the faults defining the graben are formed perpendicular to the direction of the applied stress, we know that extensional forces were pulling the crust apart in the west-northwest/east-southeast direction. The Sirenum Fossae graben are 2735km (1700 miles) long and stretch from eastern Terra Sirenum into western Daedalia Planum. Orbit Number: 92627 Latitude: -27.7786 Longitude: 216.392 Instrument: VIS Captured: 2022-11-01 04:18 https://photojournal.jpl.nasa.gov/catalog/PIA25766
Today's VIS image shows a portion of Sirenum Fossae. The linear features are tectonic graben. Graben are formed by extension of the crust and faulting. When large amounts of pressure or tension are applied to rocks on timescales that are fast enough that the rock cannot respond by deforming, the rock breaks along faults. In the case of a graben, two parallel faults are formed by extension of the crust and the rock in between the faults drops downward into the space created by the extension. Numerous sets of graben are visible in this THEMIS image, trending from north-northeast to south-southwest. Because the faults defining the graben are formed perpendicular to the direction of the applied stress, we know that extensional forces were pulling the crust apart in the west-northwest/east-southeast direction. The Sirenum Fossae graben are 2735km (1700 miles) long and stretch from eastern Terra Sirenum into western Daedalia Planum. Orbit Number: 91816 Latitude: -29.2208 Longitude: 213.139 Instrument: VIS Captured: 2022-08-26 09:39 https://photojournal.jpl.nasa.gov/catalog/PIA25645
Today's VIS image shows a portion of Sirenum Fossae. The linear features are tectonic graben. Graben are formed by extension of the crust and faulting. When large amounts of pressure or tension are applied to rocks on timescales that are fast enough that the rock cannot respond by deforming, the rock breaks along faults. In the case of a graben, two parallel faults are formed by extension of the crust and the rock in between the faults drops downward into the space created by the extension. Numerous sets of graben are visible in this THEMIS image, trending from north-northeast to south-southwest. Because the faults defining the graben are formed perpendicular to the direction of the applied stress, we know that extensional forces were pulling the crust apart in the west-northwest/east-southeast direction. The Sirenum Fossae graben are 2735km (1700 miles) long and stretch from eastern Terra Sirenum into western Daedalia Planum. Orbit Number: 92416 Latitude: -39.2691 Longitude: 181.857 Instrument: VIS Captured: 2022-10-14 19:23 https://photojournal.jpl.nasa.gov/catalog/PIA25758
Today's VIS image shows a portion of Sirenum Fossae. The linear features are tectonic graben. Graben are formed by extension of the crust and faulting. When large amounts of pressure or tension are applied to rocks on timescales that are fast enough that the rock cannot respond by deforming, the rock breaks along faults. In the case of a graben, two parallel faults are formed by extension of the crust and the rock in between the faults drops downward into the space created by the extension. Numerous sets of graben are visible in this THEMIS image, trending from north-northeast to south-southwest. Because the faults defining the graben are formed perpendicular to the direction of the applied stress, we know that extensional forces were pulling the crust apart in the west-northwest/east-southeast direction. The Sirenum Fossae graben are 2735km (1700 miles) long and stretch from eastern Terra Sirenum into western Daedalia Planum. Orbit Number: 92253 Latitude: -32.4503 Longitude: 205.396 Instrument: VIS Captured: 2022-10-01 09:14 https://photojournal.jpl.nasa.gov/catalog/PIA25753
Today's VIS image shows a portion of Sirenum Fossae. The linear features are tectonic graben. Graben are formed by extension of the crust and faulting. When large amounts of pressure or tension are applied to rocks on timescales that are fast enough that the rock cannot respond by deforming, the rock breaks along faults. In the case of a graben, two parallel faults are formed by extension of the crust and the rock in between the faults drops downward into the space created by the extension. Numerous sets of graben are visible in this THEMIS image, trending from north-northeast to south-southwest. Because the faults defining the graben are formed perpendicular to the direction of the applied stress, we know that extensional forces were pulling the crust apart in the west-northwest/east-southeast direction. The Sirenum Fossae graben are 2735km (1700 miles) long and stretch from eastern Terra Sirenum into western Daedalia Planum. Orbit Number: 93139 Latitude: -32.2816 Longitude: 204.773 Instrument: VIS Captured: 2022-12-13 08:06 https://photojournal.jpl.nasa.gov/catalog/PIA25842
This image captured by NASA 2001 Mars Odyssey spacecraft shows part of the extensive flow field called Daedalia Planum. The lava flows originated at Arsia Mons. Orbit Number: 58928 Latitude: -16.8846 Longitude: 242.147 Instrument: VIS Captured: 2015-03-27 20:06 http://photojournal.jpl.nasa.gov/catalog/PIA19465
This VIS image is located on the flank of Tharsis Tholus. The Tharsis region of Mars is dominated by large volcanoes and extensive lava plains. Orbit Number: 77220 Latitude: 12.1833 Longitude: 269.178 Instrument: VIS Captured: 2019-05-12 14:27 https://photojournal.jpl.nasa.gov/catalog/PIA23299
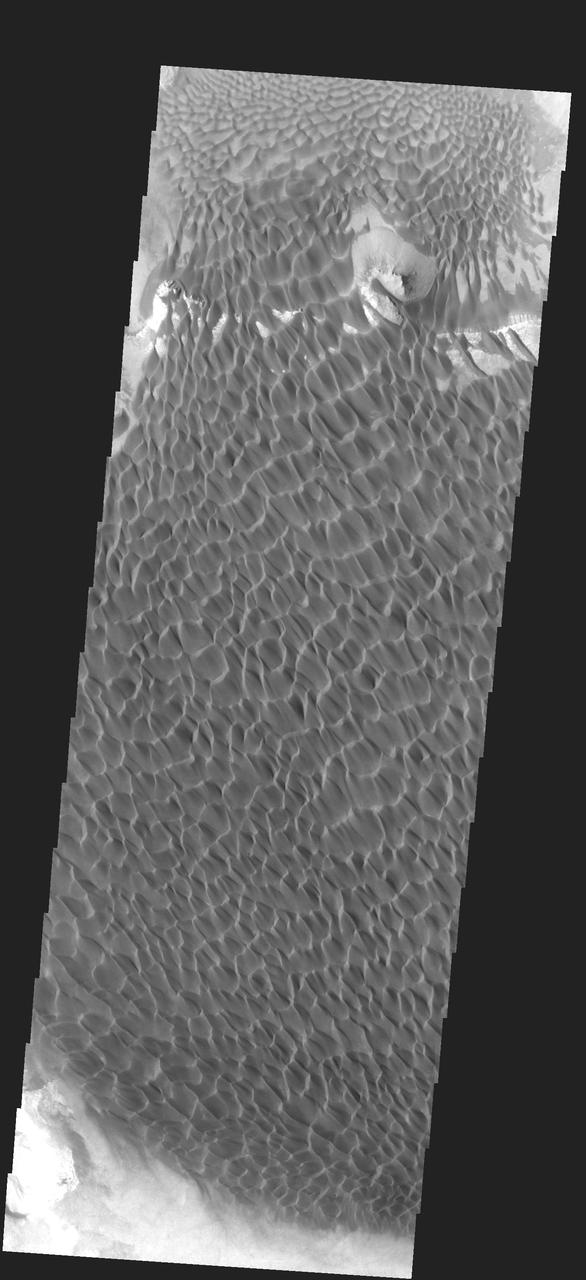
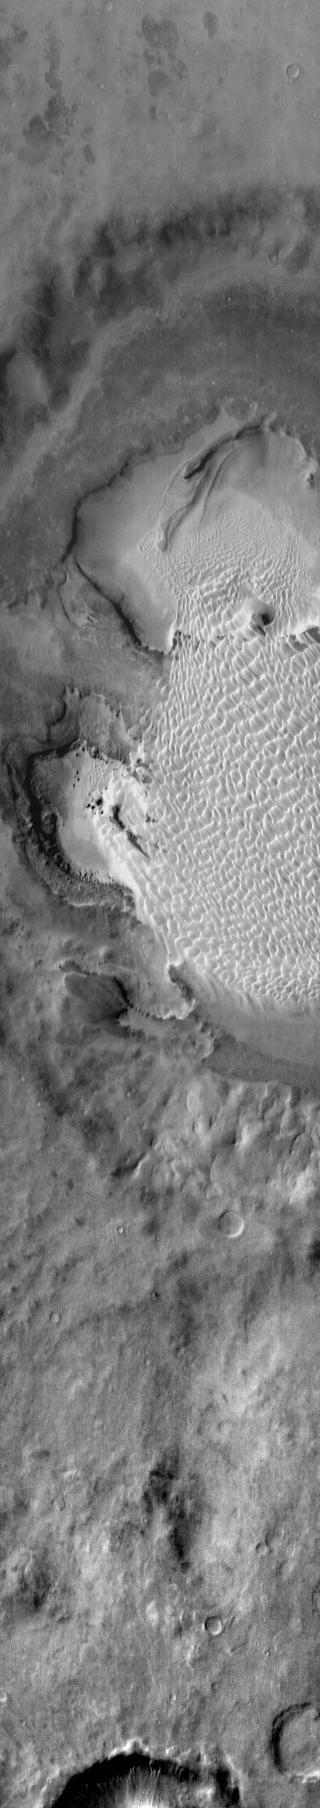
This VIS image shows part of the extensive dune field on the floor of Proctor Crater. Proctor Crater is located in Noachis Terra. Orbit Number: 74883 Latitude: -47.6285 Longitude: 30.2768 Instrument: VIS Captured: 2018-11-01 03:03 https://photojournal.jpl.nasa.gov/catalog/PIA22891
Today's VIS image shows a very small portion of the extensive lava flows of the Tharsis volcanic complex. These flows are located southeast of Ascraeus Mons. Orbit Number: 64473 Latitude: 5.06074 Longitude: 260.881 Instrument: VIS Captured: 2016-06-26 12:47 http://photojournal.jpl.nasa.gov/catalog/PIA20971
Today's VIS image shows several windstreaks on lava plains southwest of Arsia Mons. The extensive lava flow field is called Daedalia Planum. Orbit Number: 80603 Latitude: -14.064 Longitude: 230.438 Instrument: VIS Captured: 2020-02-15 03:58 https://photojournal.jpl.nasa.gov/catalog/PIA23842