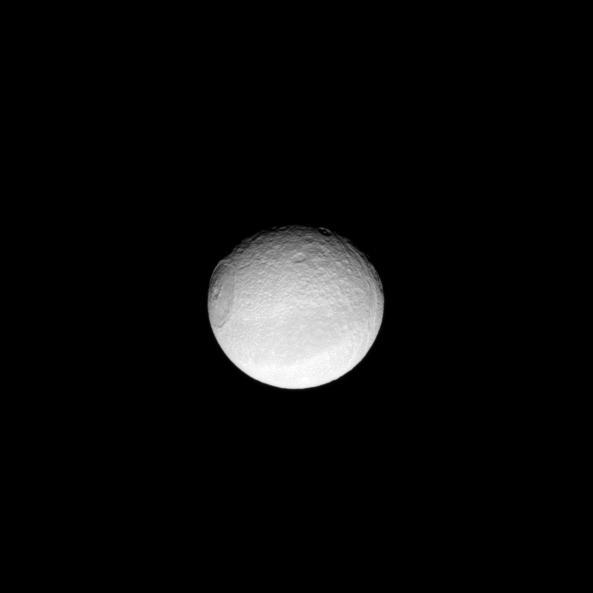
Appearing like an iris of a human eye, the huge Odysseus Crater dominates the sphere of the moon Tethys.
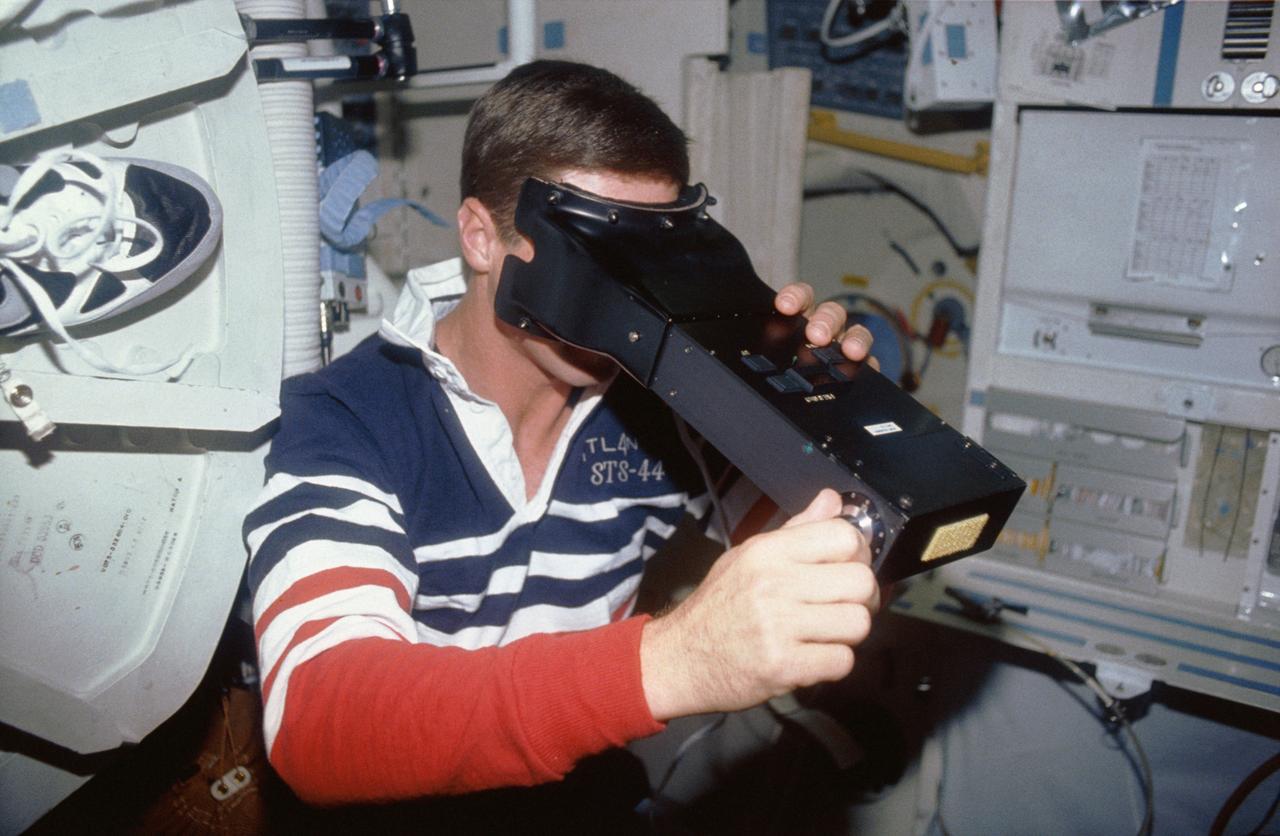
STS044-14-013 (24 Nov-1 Dec 1991) --- Terence T. (Tom) Henricks, STS-44 pilot, tests his visual acuity with the Visual Function Test (VFT) apparatus. This photograph was among the first released by NASA following the eight day mission, dedicated to the Department of Defense.

JSC2007-E-28303 (8 June 2007) --- A "fish-eye" lens perspective of activity in the shuttle flight control room of Houston's Mission Control Center, as flight controllers anticipate an ontime launch for STS-117 several hundred miles away at the Kennedy Space Center. From the left are astronauts Terry Virts and Dominic (Tony) Antonelli, both spacecraft communicators (CAPCOM), along with flight directors Norm Knight (ascent) and Steve Stich.
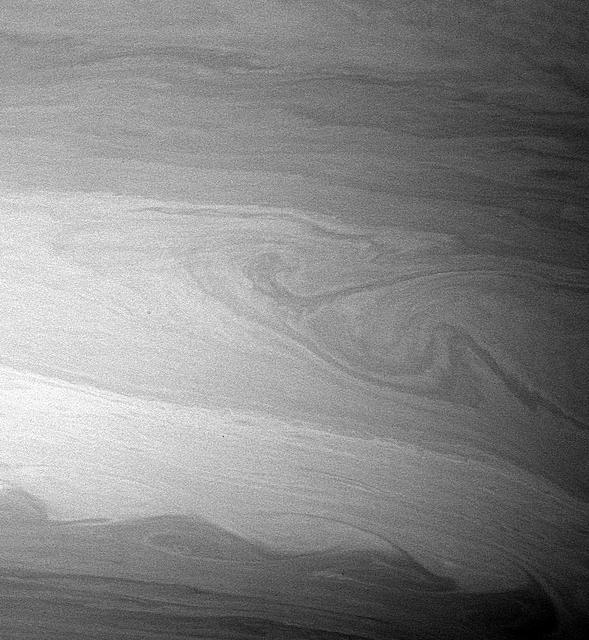
During its time in orbit, Cassini has spotted many beautiful cat's eye-shaped patterns like the ones visible here. These patterns occur in places where the winds and the atmospheric density at one latitude are different from those at another latitude. The opposing east-west flowing cloud bands are the dominant patterns seen here and elsewhere in Saturn's atmosphere. Contrast in the image was enhanced to aid the visibility of atmospheric features. The image was taken with the Cassini spacecraft wide-angle camera on Aug. 20, 2005. http://photojournal.jpl.nasa.gov/catalog/PIA07600

This image from NASA's retired Spitzer Space Telescope highlights the stars and dust clouds in the Andromeda galaxy. One of Earth's nearest galactic neighbors, Andromeda spans a swath of sky nearly 3.8 degrees across, which is close to the width of eight full Moons lined up side by side. The area around the galaxy includes data from NASA's Wide-field Infrared Survey Explorer (WISE). Spitzer observed infrared light, a range of wavelengths longer than what human eyes can detect. In this image, starlight glows blue and cyan (representing infrared wavelengths of 3.6 and 4.5 microns). Dust dominates the galaxy in red (8 microns). The longest wavelength detected by Spitzer (24 microns) gives an indication of the dust's temperature and is represented in green; it combines with the red to create orange and yellow, indicating regions where stars are forming. https://photojournal.jpl.nasa.gov/catalog/PIA26276
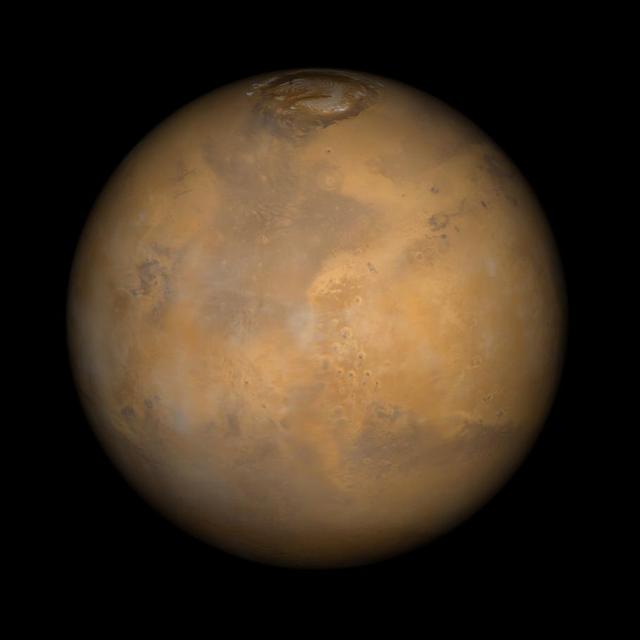
Somewhere down there sits the Mars Pathfinder lander and Sojourner rover. This Mars Global Surveyor Mars Orbiter Camera view of the red planet shows the region that includes Ares Vallis and the Chryse Plains upon which both Mars Pathfinder and the Viking 1 landed in 1997 and 1976, respectively. Acidalia Planitia is the dark surface that dominates the center left. The Pathfinder site is immediately south of Acidalia, just left of center in this view. Also shown--the north polar cap is at the top, and Arabia Terra and Sinus Meridiani are to the right. The bluish-white features are clouds. This is a color composite of 9 red and 9 blue image strips taken by the Mars Global Surveyor Mars Orbiter Camera on 9 successive orbits from pole-to-pole during the calibration phase of the mission in March 1999. The color is computer-enhanced and is not shown as it would actually appear to the human eye. http://photojournal.jpl.nasa.gov/catalog/PIA02000
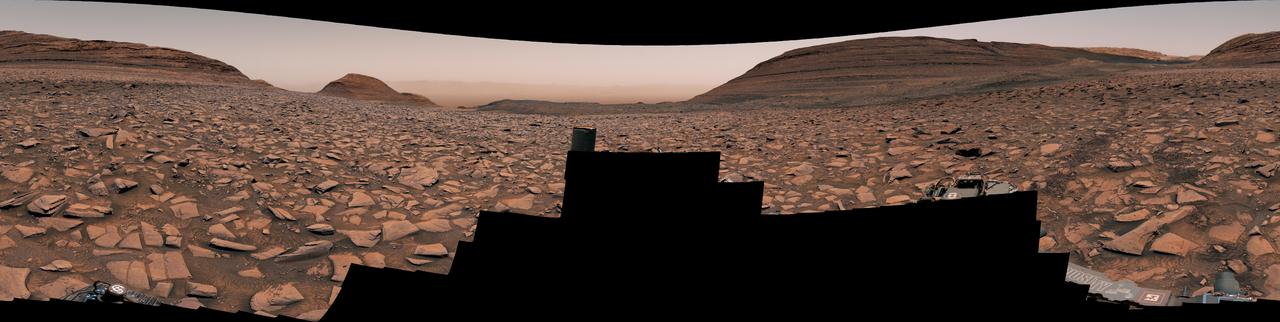
NASA's Curiosity Mars rover captured this view using its Mast Camera, or Mastcam, while heading west away from Gediz Vallis channel on Nov. 2, 2024, the 4,352nd Martian day, or sol, of the mission. This panorama is made up of two mosaics: one consisting of 171 individual images taken at 12:16 p.m. local Mars time; and another consisting of 169 at 12:46 p.m. local Mars time. The color has been adjusted to match lighting conditions as the human eye would see them on Earth. Rover tracks can be seen trailing behind Curiosity at right. The difficult, rocky terrain made for slow going. The butte on the left side of the scene is nicknamed "Texoli"; the butte dominating the right side of the scene is nicknamed "Kukenán." https://photojournal.jpl.nasa.gov/catalog/PIA26471
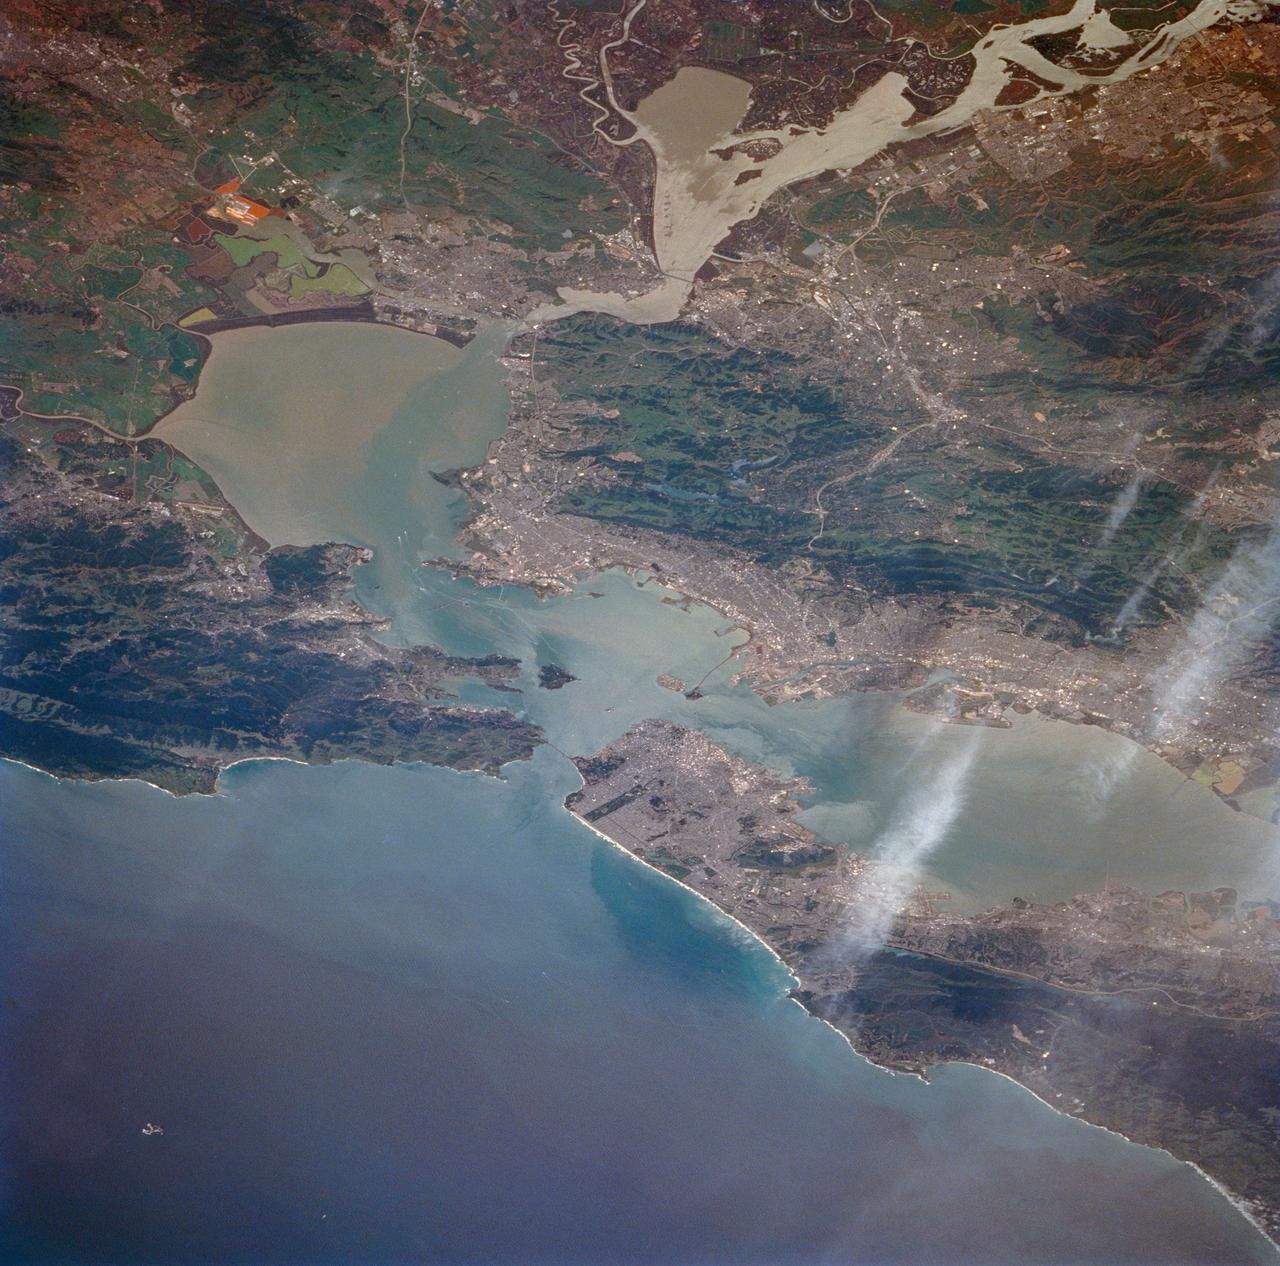
STS059-213-009 (9-20 April 1994) --- San Francisco Bay. Orient with the sea up. The delta of the combined Sacramento and San Joaquin Rivers occupies the foreground, San Francisco Bay the middle distance, and the Pacific Ocean the rest. Variations in water color caused both by sediment load and by wind streaking strike the eye. Man-made features dominate this scene. The Lafayette/Concord complex is left of the bay head, Vallejo is to the right, the Berkeley/Oakland complex rims the shoreline of the main bay, and San Francisco fills the peninsula beyond. Salt-evaporation ponds contain differently-colored algae depending on salinity. The low altitude (less than 120 nautical miles) and unusually-clear air combine to provide unusually-strong green colors in this Spring scene. Hasselblad camera.
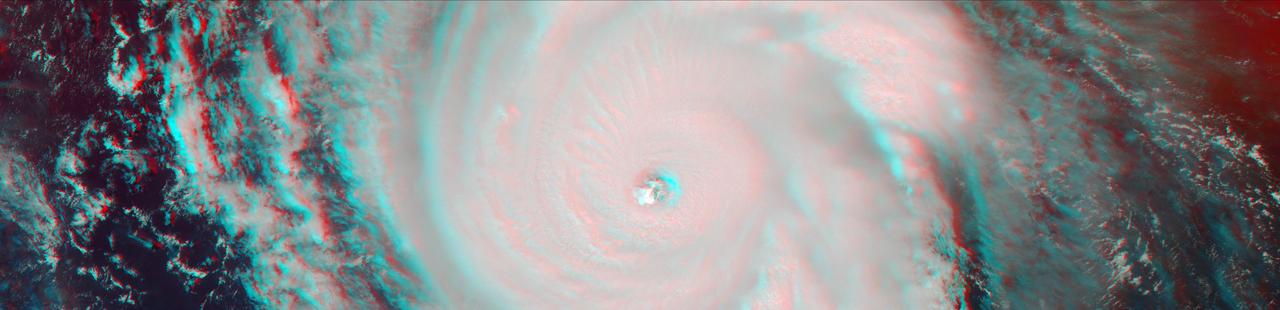
On Sept. 7, the Multi-angle Imaging SpectroRadiometer (MISR) instrument on NASA's Terra satellite passed over Hurricane Irma at approximately 11:20 am local time. The MISR instrument comprises nine cameras that view the Earth at different angles, and since it takes roughly seven minutes for all nine cameras to capture the same location, the motion of the clouds between images allows scientists to calculate the wind speed at the cloud tops. This stereo anaglyph combines two of the MISR angles to show a three-dimensional view of Irma. You will need red-blue glasses to view the anaglyph; place the red lens over your left eye. At this time, Irma's eye was located approximately 60 miles (100 kilometers) north of the Dominican Republic and 140 miles (230 kilometers) north of its capital, Santo Domingo. Irma was a powerful Category 5 hurricane, with wind speeds at the ocean surface up to 185 miles (300 kilometers) per hour. The MISR data show that at cloud top, winds near the eye wall (the most destructive part of the storm) were approximately 90 miles per hour (145 kilometers per hour), and the maximum cloud-top wind speed throughout the storm calculated by MISR was 135 miles per hour (220 kilometers per hour). While the hurricane's dominant rotation direction is counter-clockwise, winds near the eye wall are consistently pointing outward from it. This is an indication of outflow, the process by which a hurricane draws in warm, moist air at the surface and ejects cool, dry air at its cloud tops. https://photojournal.jpl.nasa.gov/catalog/PIA21945
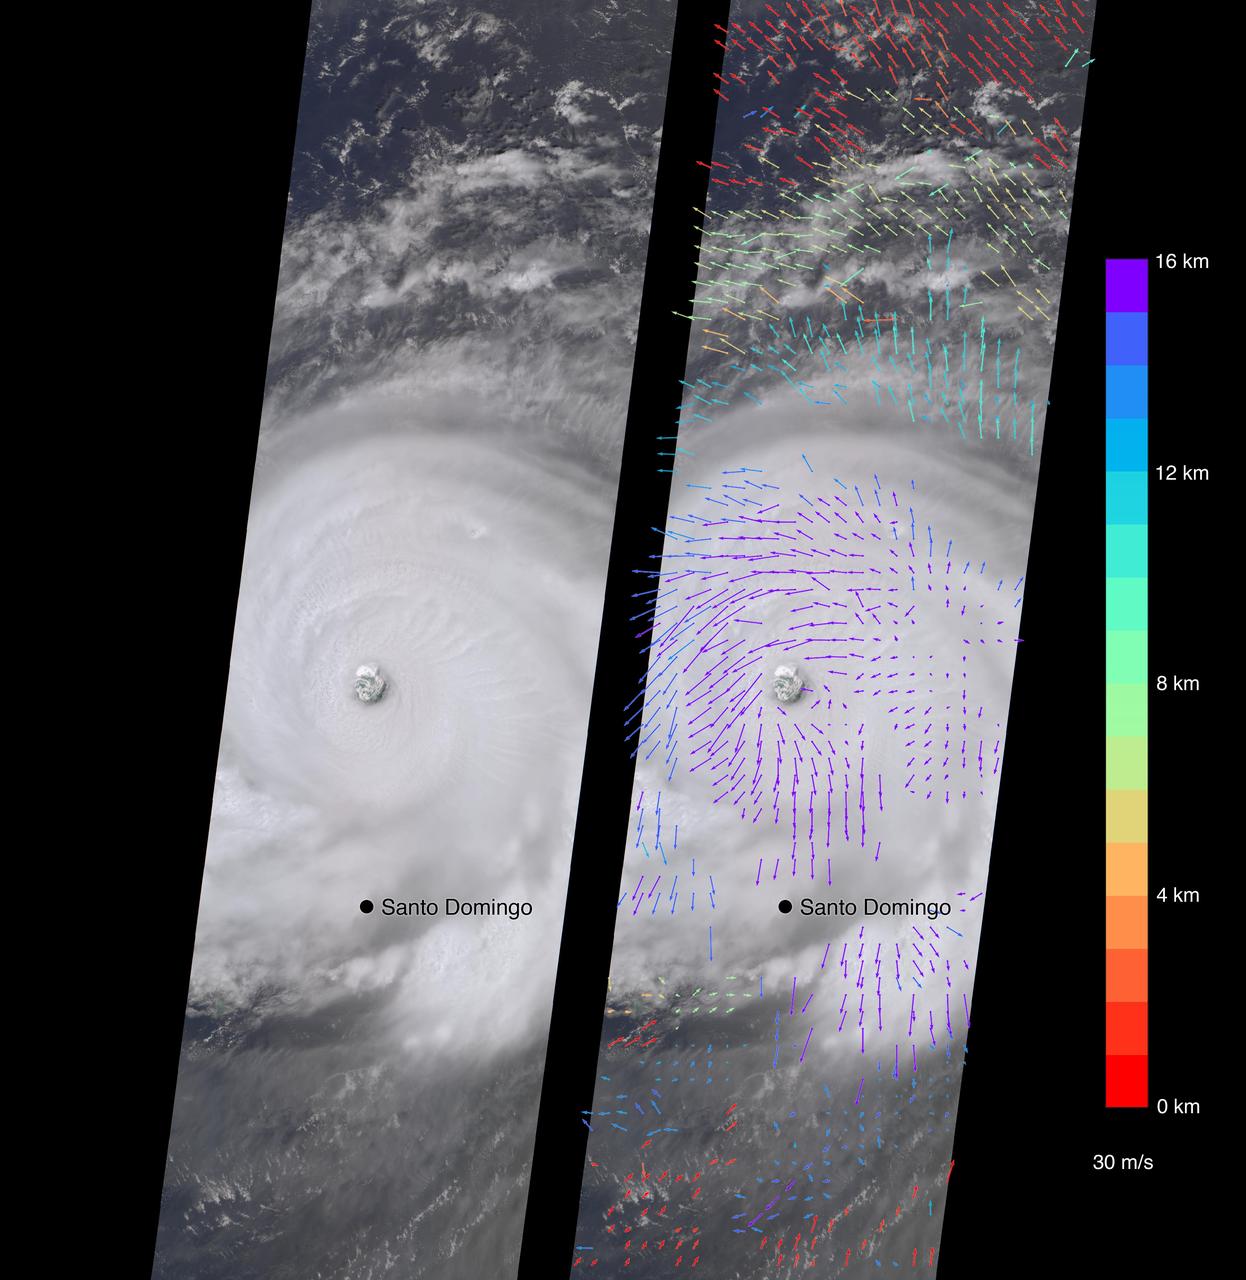
On Sept. 7, the Multi-angle Imaging SpectroRadiometer (MISR) instrument on NASA's Terra satellite passed over Hurricane Irma at approximately 11:20 a.m. local time. The MISR instrument comprises nine cameras that view the Earth at different angles, and since it takes roughly seven minutes for all nine cameras to capture the same location, the motion of the clouds between images allows scientists to calculate the wind speed at the cloud tops. The animated GIF shows Irma's motion over the seven minutes of the MISR imagery. North is toward the top of the image. This composite image shows Hurricane Irma as viewed by the central, downward-looking camera (left), as well as the wind speeds (right) superimposed on the image. The length of the arrows is proportional to the wind speed, while their color shows the altitude at which the winds were calculated. At the time the image was acquired, Irma's eye was located approximately 60 miles (100 kilometers) north of the Dominican Republic and 140 miles (230 kilometers) north of its capital, Santo Domingo. Irma was a powerful Category 5 hurricane, with wind speeds at the ocean surface up to 185 miles (300 kilometers) per hour, according to the National Oceanic and Atmospheric Administration. The MISR data show that at cloud top, winds near the eye wall (the most destructive part of the storm) were approximately 90 miles per hour (145 kilometers per hour), and the maximum cloud-top wind speed throughout the storm calculated by MISR was 135 miles per hour (220 kilometers per hour). While the hurricane's dominant rotation direction is counter-clockwise, winds near the eye wall are consistently pointing outward from it. This is an indication of outflow, the process by which a hurricane draws in warm, moist air at the surface and ejects cool, dry air at its cloud tops. These data were captured during Terra orbit 94267. An animation is available at https://photojournal.jpl.nasa.gov/catalog/PIA21946
A rippled linear dune of dark Martian sand, "Nathan Bridges Dune," dominates this full-circle panorama from the Mast Camera (Mastcam) of NASA's Curiosity Mars rover. This dune was one research stop of the rover mission's campaign to investigate active Martian dunes. The feature was informally named in 2017 in memory of Nathan Bridges (1966-2017), a planetary scientist who was a leader of the Curiosity team's dune campaign. The scene combines 112 images taken with Mastcam's left-eye camera on Feb. 5, 2017, during the 1,601st Martian day, or sol, of Curiosity's work on Mars. The panorama has been white-balanced so that colors of the rock and sand materials resemble how they would appear under daytime lighting conditions on Earth. The center is toward east-southeast and both ends are toward west-northwest. The dark butte on the horizon in the left half is "Ireson Hill." Upper Mount Sharp is on the horizon in the center. An annotated figure and full resolution TIFF file is available at https://photojournal.jpl.nasa.gov/catalog/PIA21719

In the Orbiter Processing Facility (OPF) Bay 2, under the watchful eyes of a KSC worker (far left) the STS-99 crew look over equipment as part of a Crew Equipment Interface Test (CEIT). From left (second from right) are Mission Specialists Janet Lynn Kavandi (Ph.D.), Mamoru Mohri, Gerhard P.J. Thiele, and Janice Voss (Ph.D.); behind Voss are Pilot Dominic L. Pudwill Gorie and Commander Kevin R. Kregel. Mohri is with the National Space Development Agency (NASDA) of Japan, and Thiele is with the European Space Agency. The CEIT provides an opportunity for crew members to check equipment and facilities that will be aboard the orbiter during their mission. The STS-99 mission is the Shuttle Radar Topography Mission (SRTM), a specially modified radar system that will gather data for the most accurate and complete topographic map of the Earth's surface that has ever been assembled. SRTM will make use of radar interferometry, wherein two radar images are taken from slightly different locations. Differences between these images allow for the calculation of surface elevation, or change. The SRTM hardware will consist of one radar antenna in the shuttle payload bay and a second radar antenna attached to the end of a mast extended 60 meters (195 feet) out from the shuttle. STS-99 is scheduled to launch Sept. 16 at 8:47 a.m. from Launch Pad 39A
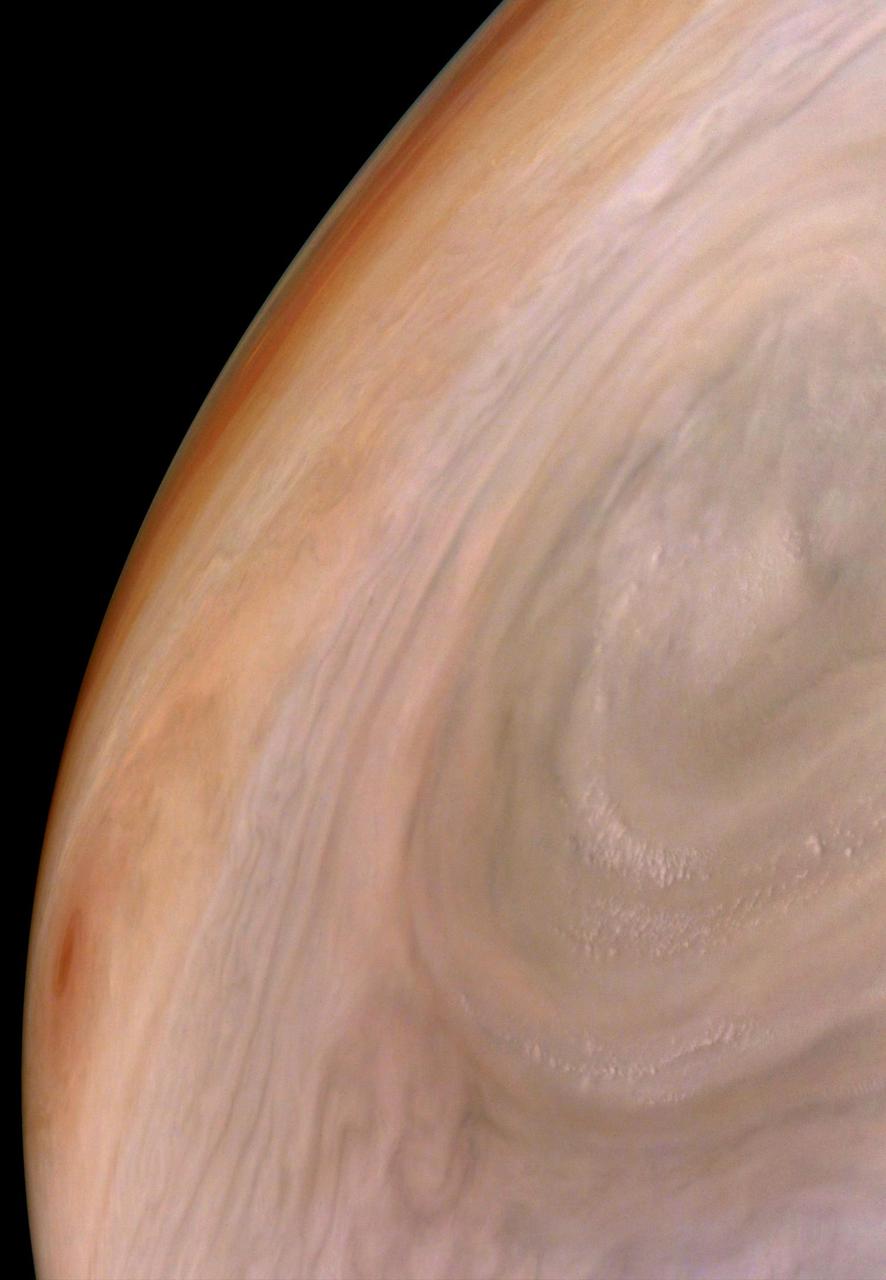
As the orbit of NASA's Juno spacecraft evolves, the spacecraft's closest approach point to Jupiter is at a higher latitude with every pass. Near that closest approach point, the spacecraft's JunoCam can capture only a small fraction of Jupiter in a single image. From this perspective, the planet's belts and zones appear as thin strips of color on the horizon while one large circular storm dominates the image. A small orange storm is visible on the far left. Jupiter appears to have a pastel hue to the naked eye through a telescope. The color in this image has been "exaggerated," processed by citizen scientist Brian Swift to bring out subtle differences. This image was taken on Oct. 16, 2021, at 10:17 a.m. PDT (1:17 p.m. EDT) as Juno performed its 37th close flyby of Jupiter. At the time the image was taken, the spacecraft was about 2,196 miles (3,534 kilometers) from the planet's could tops, at a latitude of 21.23 degrees. https://photojournal.jpl.nasa.gov/catalog/PIA24973

STS-99 Pilot Dominic Gorie, under the watchful eye of Capt. George Hoggard, a trainer with the KSC Fire Department, practices driving the M-113, an armored personnel carrier. Part of Terminal Countdown Demonstration Test (TCDT) activities, the M-113 could be used by the crew in the event of an emergency at the pad during which the crew must make a quick exit from the area. Riding in the rear are Mission Specialists Mamoru Mohri, who is with the National Space Development Agency (NASDA) of Japan, Janet Lynn Kavandi (Ph.D.) and Janice Voss (Ph.D.). TCDT provides the crew with simulated countdown exercises, emergency egress training, and opportunities to inspect the mission payloads in the orbiter's payload bay. STS-99 is the Shuttle Radar Topography Mission, which will chart a new course, using two antennae and a 200-foot-long section of space station-derived mast protruding from the payload bay to produce unrivaled 3-D images of the Earth's surface. The result of the Shuttle Radar Topography Mission could be close to 1 trillion measurements of the Earth's topography. Besides contributing to the production of better maps, these measurements could lead to improved water drainage modeling, more realistic flight simulators, better locations for cell phone towers, and enhanced navigation safety. Launch of Endeavour on the 11-day mission is scheduled for Jan. 31 at 12:47 p.m. EST

STS-99 Pilot Dominic Gorie, under the watchful eye of Capt. George Hoggard, a trainer with the KSC Fire Department, practices driving the M-113, an armored personnel carrier. Part of Terminal Countdown Demonstration Test (TCDT) activities, the M-113 could be used by the crew in the event of an emergency at the pad during which the crew must make a quick exit from the area. Riding in the rear are Mission Specialists Mamoru Mohri, who is with the National Space Development Agency (NASDA) of Japan, Janet Lynn Kavandi (Ph.D.) and Janice Voss (Ph.D.). TCDT provides the crew with simulated countdown exercises, emergency egress training, and opportunities to inspect the mission payloads in the orbiter's payload bay. STS-99 is the Shuttle Radar Topography Mission, which will chart a new course, using two antennae and a 200-foot-long section of space station-derived mast protruding from the payload bay to produce unrivaled 3-D images of the Earth's surface. The result of the Shuttle Radar Topography Mission could be close to 1 trillion measurements of the Earth's topography. Besides contributing to the production of better maps, these measurements could lead to improved water drainage modeling, more realistic flight simulators, better locations for cell phone towers, and enhanced navigation safety. Launch of Endeavour on the 11-day mission is scheduled for Jan. 31 at 12:47 p.m. EST
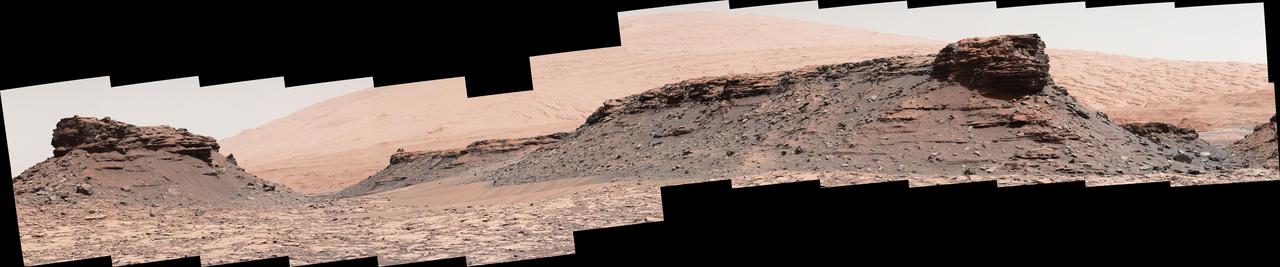
The two prominent mesas in this view of Mars' "Murray Buttes" region from NASA's Curiosity Mars rover are about 260 feet (about 80 meters) apart. The top of the one on the left is about 26 feet (about 8 meters) above the surrounding plain and about 330 feet (about 100 meters) from Curiosity's position when the rover acquired this view on Aug. 18, 2016, during the 1,434th Martian day, or sol, of its work Mars. The component images of this mosaic were taken by the right-eye camera of the rover's Mast Camera (Mastcam), which has a telephoto lens. The mesa on the right is about 33 feet (about 10 meters) high. The top of it is about 270 feet (about 82 meters) from the rover. Upper Mount Sharp is the salmon-hued mound dominating the horizon between the scene's two prominent mesas. The left edge of this view is east-northeast from the rover; the right edge is southeast. The rover's location when it recorded this scene was the site it reached in its Sol 1433 drive. (See map at http://mars.nasa.gov/msl/multimedia/images/?ImageID=7999.) The scene is presented with a color adjustment that approximates white balancing, to resemble how the rocks and sand would appear under daytime lighting conditions on Earth. http://photojournal.jpl.nasa.gov/catalog/PIA20841
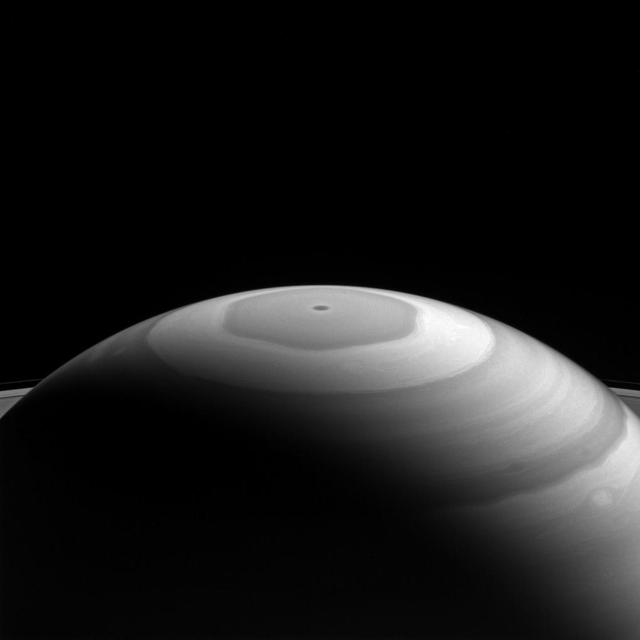
Saturn's north polar region displays its beautiful bands and swirls, which somewhat resemble the brushwork in a watercolor painting. Each latitudinal band represents air flowing at different speeds, and clouds at different heights, compared to neighboring bands. Where they meet and flow past each other, the bands' interactions produce many eddies and swirls. The northern polar region of Saturn is dominated by the famous hexagon shape (see PIA11682) which itself circumscribes the northern polar vortex -- seen as a dark spot at the planet's pole in the above image-- which is understood to the be eye of a hurricane-like storm (PIA14946). This view looks toward the sunlit side of the rings from about 20 degrees above the ring plane. The image was taken with the Cassini spacecraft wide-angle camera on Sept. 5, 2016 using a spectral filter which preferentially admits wavelengths of near-infrared light centered at 728 nanometers. The view was obtained at a distance of approximately 890,000 miles (1.4 million kilometers) from Saturn. Image scale is 53 miles (86 kilometers) per pixel. http://photojournal.jpl.nasa.gov/catalog/PIA20507
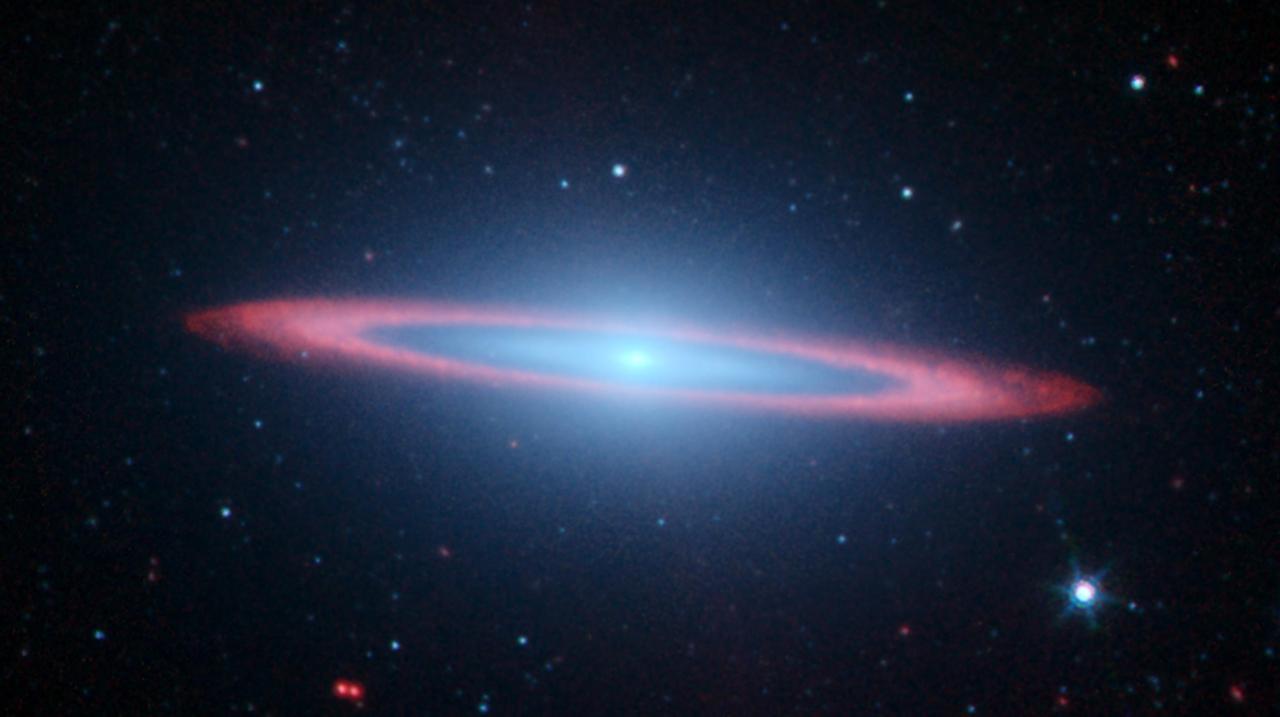
NASA's Spitzer Space Telescope set its infrared eyes on one of the most famous objects in the sky, Messier 104, also called the Sombrero galaxy. In this striking infrared picture, Spitzer sees an exciting new view of a galaxy that in visible light has been likened to a "sombrero," but here looks more like a "bulls-eye." Recent observations using Spitzer's infrared array camera uncovered the bright, smooth ring of dust circling the galaxy, seen in red. In visible light, because this galaxy is seen nearly edge-on, only the near rim of dust can be clearly seen in silhouette. Spitzer's full view shows the disk is warped, which is often the result of a gravitational encounter with another galaxy, and clumpy areas spotted in the far edges of the ring indicate young star-forming regions. Spitzer's infrared view of the starlight from this galaxy, seen in blue, can pierce through obscuring murky dust that dominates in visible light. As a result, the full extent of the bulge of stars and an otherwise hidden disk of stars within the dust ring are easily seen. The Sombrero galaxy is located some 28 million light years away. Viewed from Earth, it is just six degrees south of its equatorial plane. Spitzer detected infrared emission not only from the ring, but from the center of the galaxy too, where there is a huge black hole, believed to be a billion times more massive than our Sun. This picture is composed of four images taken at 3.6 (blue), 4.5 (green), 5.8 (orange), and 8.0 (red) microns. The contribution from starlight (measured at 3.6 microns) has been subtracted from the 5.8 and 8-micron images to enhance the visibility of the dust features. http://photojournal.jpl.nasa.gov/catalog/PIA07899

An elongated crater called "Spirit of St. Louis," with a rock spire in it, dominates this stereo view from NASA's Mars Exploration Rover Opportunity. The scene combines views from the left eye and right eye of Opportunity's panoramic camera (Pancam) to appear three-dimensional when seen through blue-red glasses with the red lens on the left. Opportunity completed its 4,000 Martian day, or sol, of work on Mars on April 26, 2015. The rover has been exploring Mars since early 2004. This scene from late March 2015 shows a shallow crater called Spirit of St. Louis, about 110 feet (34 meters) long and about 80 feet (24 meters) wide, with a floor slightly darker than surrounding terrain. The rocky feature toward the far end of the crater is about 7 to 10 feet (2 to 3 meters) tall, rising higher than the crater's rim. The component images of this mosaic view were taken on March 29 and 30, 2015, during Sol 3973 and Sol 3974 of the mission. This version of the image is presented in approximate true color by combing exposures taken through three of the Pancam's color filters, centered on wavelengths of 753 nanometers (near-infrared), 535 nanometers (green) and 432 nanometers (violet). The unusually shaped Spirit of St. Louis Crater lies on the outer portion of the western rim of Endeavour Crater. Endeavour spans about 14 miles (22 kilometers) in diameter, and Opportunity has been exploring its western rim for about one-third of the rover's mission, which has lasted more than 11 years. Endeavour's elevated western rim extends northward to the left from Spirit of St. Louis Crater in this scene. A glimpse to the far side of Endeavour is visible on either side of the rock spire. http://photojournal.jpl.nasa.gov/catalog/PIA19395
This 360-degree mosaic from the Mast Camera (Mastcam) on NASA's Curiosity Mars rover looks out over a portion of the Bagnold Dunes, which stretch for several miles. From early February to early April 2017, the rover examined four sites near linear dunes for comparison with what it found in late 2015 and early 2016 during its investigation of crescent-shaped dunes. The dark, rippled surface of a linear dune is visible at the center of the view and receding into the distance to the left. The bedrock of the Murray formation, made from sediments deposited in lakes billions of years ago, is in the foreground, along with some components of the rover. The location, called "Ogunquit Beach," is on the northwestern flank of lower Mount Sharp. Northwest is at both ends of this full-circle panorama; southeast is at the center, where a higher portion of Mount Sharp dominates the horizon. Among the questions this Martian dune campaign is addressing is how winds shape the dunes into different patterns. Others include whether Martian winds sort grains of sand in ways that affect the distribution of mineral compositions, which also would have implications for studies of Martian sandstones. The 115 individual images that were combined into this mosaic were acquired by the Mastcam's left-eye camera on March 24 and March 25, 2017, (PST) during the 1,647th Martian day, or sol, of Curiosity's work on Mars. This mosaic is white-balanced so that the colors of the colors of the rock and sand materials resemble how they would appear under daytime lighting conditions on Earth. The rover's position on Sol 1647 is shown at https://mars.nasa.gov/multimedia/images/2017/curiositys-traverse-map-through-sol-1646 as the location reached by a drive on Sol 1646. https://photojournal.jpl.nasa.gov/catalog/PIA11241
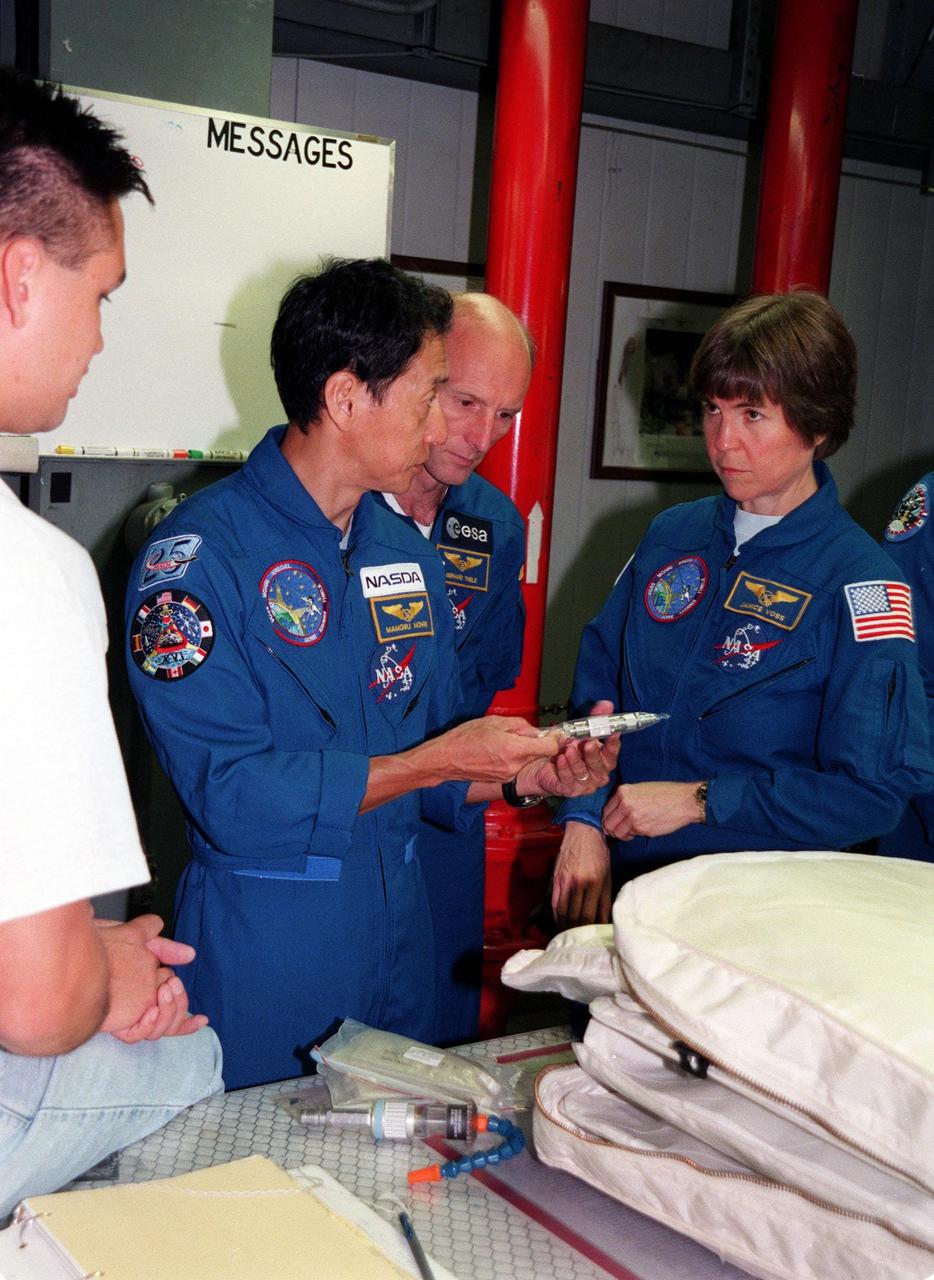
Under the watchful eyes of a KSC worker (far left), members of the STS-99 crew check out equipment in the Orbiter Processing Facility (OPF) Bay 2. From left are Mission Specialists Mamoru Mohri, Gerhard P.J. Thiele, and Janice Voss (Ph.D.). Mohri represents the National Space Development Agency (NASDA) of Japan, and Thiele the European Space Agency. Other crew members (not shown) are Commander Kevin R. Kregel, Pilot Dominic L. Pudwill Gorie, and Mission Specialist Janet Lynn Kavandi (Ph.D.). The crew are at KSC to take part in a Crew Equipment Interface Test (CEIT), which provides an opportunity for crew members to check equipment and facilities that will be aboard the orbiter during their mission. The STS-99 mission is the Shuttle Radar Topography Mission (SRTM), a specially modified radar system that will gather data for the most accurate and complete topographic map of the Earth's surface that has ever been assembled. SRTM will make use of radar interferometry, wherein two radar images are taken from slightly different locations. Differences between these images allow for the calculation of surface elevation, or change. The SRTM hardware will consist of one radar antenna in the shuttle payload bay and a second radar antenna attached to the end of a mast extended 60 meters (195 feet) out from the shuttle. STS-99 is scheduled to launch Sept. 16 at 8:47 a.m. from Launch Pad 39A
The THEMIS VIS camera contains 5 filters. The data from different filters can be combined in multiple ways to create a false color image. These false color images may reveal subtle variations of the surface not easily identified in a single band image. Today's false color image shows the floor of Matara Crater. A large sand sheet dominates the floor of this crater located in Noachis Terra. The top of the sand sheet has been sculpted by the wind, creating dune forms. Matara Crater is 48km (30 miles) in diameter. The THEMIS VIS camera is capable of capturing color images of the Martian surface using five different color filters. In this mode of operation, the spatial resolution and coverage of the image must be reduced to accommodate the additional data volume produced from using multiple filters. To make a color image, three of the five filter images (each in grayscale) are selected. Each is contrast enhanced and then converted to a red, green, or blue intensity image. These three images are then combined to produce a full color, single image. Because the THEMIS color filters don't span the full range of colors seen by the human eye, a color THEMIS image does not represent true color. Also, because each single-filter image is contrast enhanced before inclusion in the three-color image, the apparent color variation of the scene is exaggerated. Nevertheless, the color variation that does appear is representative of some change in color, however subtle, in the actual scene. Note that the long edges of THEMIS color images typically contain color artifacts that do not represent surface variation. Orbit Number: 83817 Latitude: -49.4554 Longitude: 34.8949 Instrument: VIS Captured: 2020-11-05 19:05 https://photojournal.jpl.nasa.gov/catalog/PIA25002
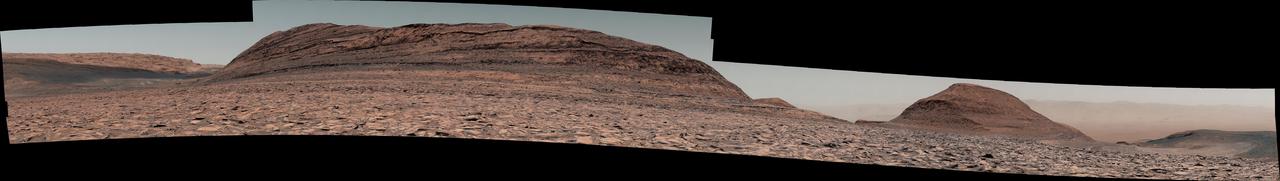
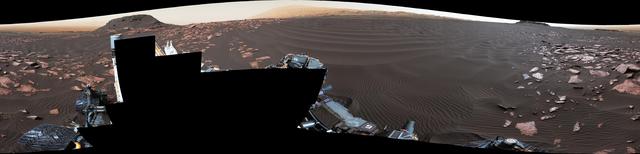
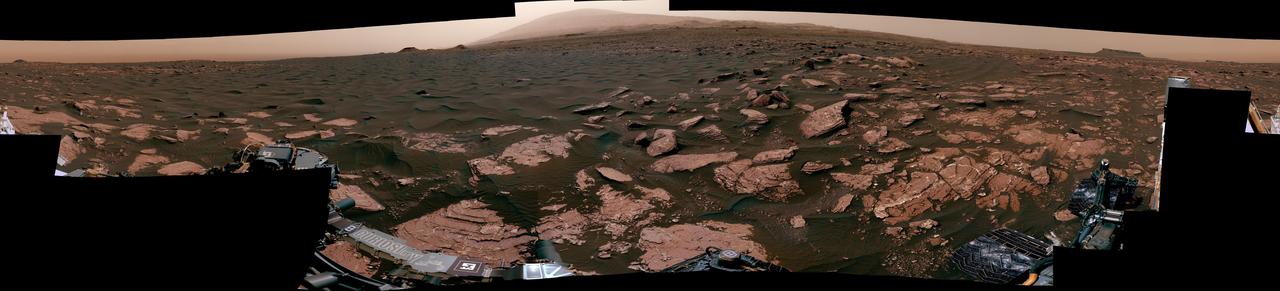
NASA's Curiosity Mars rover used its right Mast Camera, or Mastcam, to capture this panorama on Nov. 26, 2024, the 4,375th Martian day, or sol, of the mission. Made from 251 individual images containing 393 million pixels, the panorama's color has been adjusted to match lighting conditions as the human eye would see them on Earth. This is one of the largest high-resolution panoramas Curiosity has taken during its mission. Curiosity is making its way up the foothills of Mount Sharp, a 3-mile-tall (5-kilometer-tall) mountain found within Mars' Gale Crater. Dominating the scene in this image is a butte on Mount Sharp nicknamed "Texoli," which has many stratigraphic layers that scientists can study to learn more about the formation of this region of Mars. Texoli stands about 525 feet (160 meters) tall. To the right of Texoli is another butte nicknamed "Wilkerson," which is 262 feet (80 meters) tall. Curiosity will travel between the two buttes as it drives away from Gediz Vallis channel, which it has been investigating for the past year, and from Gediz Vallis (Gediz valley) itself, where it's been for four years. On the horizon beyond Texoli on the left side of the image is the Yardang Unit – a higher-elevation geologic region that Curiosity's scientists hope to visit in the years to come. On the horizon on the right side of the image, beyond Wilkerson, is the floor of Gale Crater and, visible through a dusty haze, the crater's distant northern rim. https://photojournal.jpl.nasa.gov/catalog/PIA26477
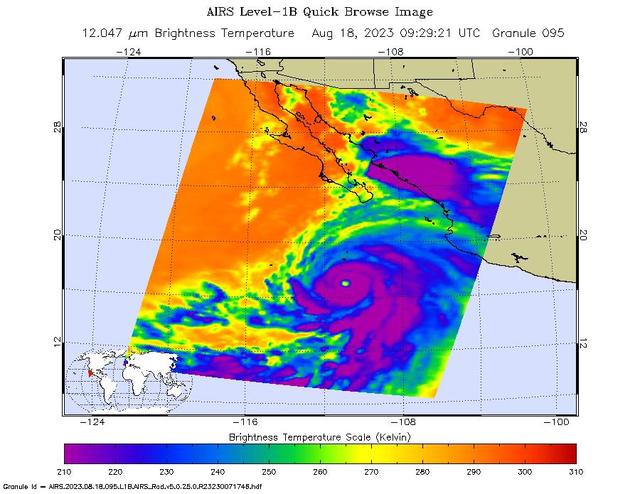
NASA's Atmospheric Infrared Sounder (AIRS) captured Hurricane Hilary on the morning of Aug. 18, 2023, when it was a Category 4 storm roughly 470 miles (760 kilometers) south of Baja California. Hilary could be the first tropical storm to make landfall in California since 1939, according to the National Weather Service. Hilary grew from a tropical storm into a Category 2 hurricane within 24 hours on Aug. 17. Another period of rapid intensification – an increase in maximum sustained wind speed of at least 30 knots (35 mph) within 24 hours – occurred Aug. 17-18. The animation shows some of this rapid growth, with images taken by AIRS Aug. 15-18. This intensification was driven by very warm ocean surface waters and weak wind shear, a term for vertical changes in wind speed. Strong wind shear can keep hurricanes from forming, or can tear them apart. AIRS measures cloud temperatures in infrared wavelengths, which can reveal information about the atmosphere not visible to the human eye. Hilary shows several indicators of a powerful hurricane: a well-defined eye surrounded by a ring of very cold clouds in purple, with warmer outer regions seen in yellows and oranges. Purple and violet areas are colder, between about minus 82 degrees Fahrenheit and minus 46 F (minus 63 degrees Celsius to minus 44 C). Blue and green regions are roughly minus 28 F to 26 F (minus 33 C to minus 3 C). The cooler parts of the clouds are associated with very heavy rainfall. Most hurricanes in the Pacific Ocean off Mexico travel westward, following tropical trade winds. Occasionally, one of these storms will head northward. Hurricane Hilary is being steered by a weak low-pressure system off the coast of California, an area normally dominated by high pressure and an atmospheric circulation pattern that would deflect storms from the region. The current forecast from the National Hurricane Center has Hilary closely following the western coastline of the Baja California peninsula, weakening as it moves north. Rainfall projections for Southern California range from 2 inches (5 centimeters) in coastal areas to 8 or more inches (20 or more centimeters) in local mountains. For comparison, San Diego and Los Angeles receive no rain in August most years, and the wettest parts of the local mountains receive about 1 inch (3 centimeters) of rain over a normal summer. In conjunction with the Advanced Microwave Sounding Unit (AMSU), AIRS senses emitted infrared and microwave radiation from Earth to provide a 3D look at the planet's weather and climate. Working in tandem, the two instruments make simultaneous observations down to Earth's surface. With more than 2,000 channels sensing different regions of the atmosphere, the system creates a global, 3D map of atmospheric temperature and humidity, cloud amounts and heights, greenhouse gas concentrations, and many other atmospheric phenomena. Launched into Earth orbit in 2002 aboard NASA's Aqua spacecraft, the AIRS and AMSU instruments are managed by NASA's Jet Propulsion Laboratory in Southern California, under contract to NASA. JPL is a division of Caltech. Animation available at https://photojournal.jpl.nasa.gov/catalog/PIA25779
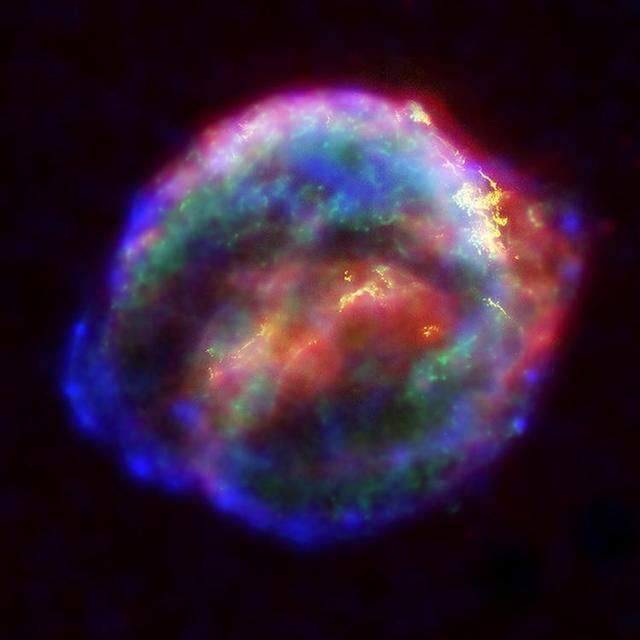
NASA's three Great Observatories -- the Hubble Space Telescope, the SpitzerSpace Telescope, and the Chandra X-ray Observatory -- joined forces to probe theexpanding remains of a supernova, called Kepler's supernova remnant, first seen 400 years ago by sky watchers, including astronomer Johannes Kepler. The combined image unveils a bubble-shaped shroud of gas and dust that is 14light-years wide and is expanding at 4 million miles per hour (2,000 kilometersper second). Observations from each telescope highlight distinct features of thesupernova remnant, a fast-moving shell of iron-rich material from the explodedstar, surrounded by an expanding shock wave that is sweeping up interstellar gasand dust. Each color in this image represents a different region of the electromagneticspectrum, from X-rays to infrared light. These diverse colors are shown in thepanel of photographs below the composite image. The X-ray and infrared datacannot be seen with the human eye. By color-coding those data and combining themwith Hubble's visible-light view, astronomers are presenting a more completepicture of the supernova remnant. Visible-light images from the Hubble telescope (colored yellow) reveal where the supernova shock wave is slamming into the densest regions of surrounding gas.The bright glowing knots are dense clumps from instabilities that form behindthe shock wave. The Hubble data also show thin filaments of gas that look likerippled sheets seen edge-on. These filaments reveal where the shock wave isencountering lower-density, more uniform interstellar material. The Spitzer telescope shows microscopic dust particles (colored red) that havebeen heated by the supernova shock wave. The dust re-radiates the shock wave'senergy as infrared light. The Spitzer data are brightest in the regionssurrounding those seen in detail by the Hubble telescope. The Chandra X-ray data show regions of very hot gas, and extremely high-energyparticles. The hottest gas (higher-energy X-rays, colored blue) is locatedprimarily in the regions directly behind the shock front. These regions alsoshow up in the Hubble observations, and also align with the faint rim of glowingmaterial seen in the Spitzer data. The X-rays from the region on the lower left(colored blue) may be dominated by extremely high-energy electrons that wereproduced by the shock wave and are radiating at radio through X-ray wavelengthsas they spiral in the intensified magnetic field behind the shock front. CoolerX-ray gas (lower-energy X-rays, colored green) resides in a thick interior shelland marks the location of heated material expelled from the exploded star. Kepler's supernova, the last such object seen to explode in our Milky Waygalaxy, resides about 13,000 light-years away in the constellation Ophiuchus. The Chandra observations were taken in June 2000, the Hubble in August 2003;and the Spitzer in August 2004. http://photojournal.jpl.nasa.gov/catalog/PIA06907
![This image from NASA Spitzer Space Telescope, shows the wispy filamentary structure of Henize 206, is a four-color composite mosaic created by combining data from an infrared array camera IRAC. The LMC is a small satellite galaxy gravitationally bound to our own Milky Way. Yet the gravitational effects are tearing the companion to shreds in a long-playing drama of 'intergalactic cannibalism.' These disruptions lead to a recurring cycle of star birth and star death. Astronomers are particularly interested in the LMC because its fractional content of heavy metals is two to five times lower than is seen in our solar neighborhood. [In this context, 'heavy elements' refer to those elements not present in the primordial universe. Such elements as carbon, oxygen and others are produced by nucleosynthesis and are ejected into the interstellar medium via mass loss by stars, including supernova explosions.] As such, the LMC provides a nearby cosmic laboratory that may resemble the distant universe in its chemical composition. The primary Spitzer image, showing the wispy filamentary structure of Henize 206, is a four-color composite mosaic created by combining data from an infrared array camera (IRAC) at near-infrared wavelengths and the mid-infrared data from a multiband imaging photometer (MIPS). Blue represents invisible infrared light at wavelengths of 3.6 and 4.5 microns. Note that most of the stars in the field of view radiate primarily at these short infrared wavelengths. Cyan denotes emission at 5.8 microns, green depicts the 8.0 micron light, and red is used to trace the thermal emission from dust at 24 microns. The separate instrument images are included as insets to the main composite. An inclined ring of emission dominates the central and upper regions of the image. This delineates a bubble of hot, x-ray emitting gas that was blown into space when a massive star died in a supernova explosion millions of years ago. The shock waves from that explosion impacted a cloud of nearby hydrogen gas, compressed it, and started a new generation of star formation. The death of one star led to the birth of many new stars. This is particularly evident in the MIPS inset, where the 24-micron emission peaks correspond to newly formed stars. The ultraviolet and visible-light photons from the new stars are absorbed by surrounding dust and re-radiated at longer infrared wavelengths, where it is detected by Spitzer. This emission nebula was cataloged by Karl Henize (HEN-eyes) while spending 1948-1951 in South Africa doing research for his Ph.D. dissertation at the University of Michigan. Henize later became a NASA astronaut and, at age 59, became the oldest rookie to fly on the Space Shuttle during an eight-day flight of the Challenger in 1985. He died just short of his 67th birthday in 1993 while attempting to climb the north face of Mount Everest, the world's highest peak. http://photojournal.jpl.nasa.gov/catalog/PIA05517](https://images-assets.nasa.gov/image/PIA05517/PIA05517~medium.jpg)
This image from NASA Spitzer Space Telescope, shows the wispy filamentary structure of Henize 206, is a four-color composite mosaic created by combining data from an infrared array camera IRAC. The LMC is a small satellite galaxy gravitationally bound to our own Milky Way. Yet the gravitational effects are tearing the companion to shreds in a long-playing drama of 'intergalactic cannibalism.' These disruptions lead to a recurring cycle of star birth and star death. Astronomers are particularly interested in the LMC because its fractional content of heavy metals is two to five times lower than is seen in our solar neighborhood. [In this context, 'heavy elements' refer to those elements not present in the primordial universe. Such elements as carbon, oxygen and others are produced by nucleosynthesis and are ejected into the interstellar medium via mass loss by stars, including supernova explosions.] As such, the LMC provides a nearby cosmic laboratory that may resemble the distant universe in its chemical composition. The primary Spitzer image, showing the wispy filamentary structure of Henize 206, is a four-color composite mosaic created by combining data from an infrared array camera (IRAC) at near-infrared wavelengths and the mid-infrared data from a multiband imaging photometer (MIPS). Blue represents invisible infrared light at wavelengths of 3.6 and 4.5 microns. Note that most of the stars in the field of view radiate primarily at these short infrared wavelengths. Cyan denotes emission at 5.8 microns, green depicts the 8.0 micron light, and red is used to trace the thermal emission from dust at 24 microns. The separate instrument images are included as insets to the main composite. An inclined ring of emission dominates the central and upper regions of the image. This delineates a bubble of hot, x-ray emitting gas that was blown into space when a massive star died in a supernova explosion millions of years ago. The shock waves from that explosion impacted a cloud of nearby hydrogen gas, compressed it, and started a new generation of star formation. The death of one star led to the birth of many new stars. This is particularly evident in the MIPS inset, where the 24-micron emission peaks correspond to newly formed stars. The ultraviolet and visible-light photons from the new stars are absorbed by surrounding dust and re-radiated at longer infrared wavelengths, where it is detected by Spitzer. This emission nebula was cataloged by Karl Henize (HEN-eyes) while spending 1948-1951 in South Africa doing research for his Ph.D. dissertation at the University of Michigan. Henize later became a NASA astronaut and, at age 59, became the oldest rookie to fly on the Space Shuttle during an eight-day flight of the Challenger in 1985. He died just short of his 67th birthday in 1993 while attempting to climb the north face of Mount Everest, the world's highest peak. http://photojournal.jpl.nasa.gov/catalog/PIA05517
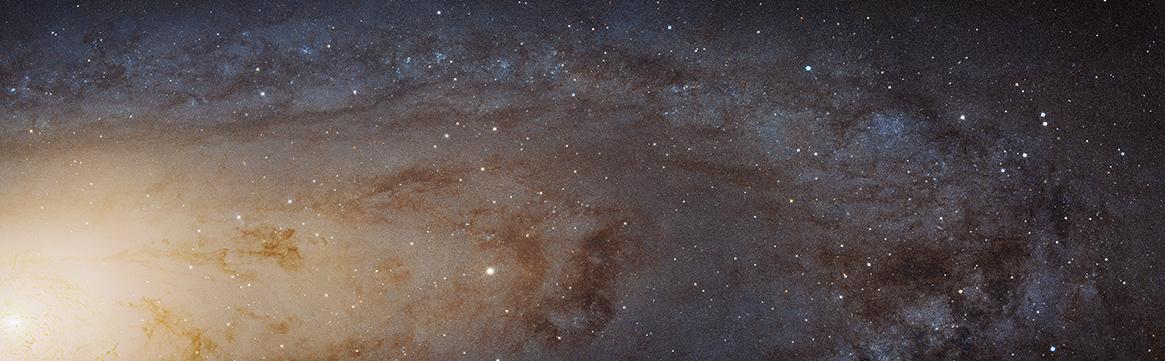
The largest NASA Hubble Space Telescope image ever assembled, this sweeping bird’s-eye view of a portion of the Andromeda galaxy (M31) is the sharpest large composite image ever taken of our galactic next-door neighbor. Though the galaxy is over 2 million light-years away, The Hubble Space Telescope is powerful enough to resolve individual stars in a 61,000-light-year-long stretch of the galaxy’s pancake-shaped disk. It's like photographing a beach and resolving individual grains of sand. And there are lots of stars in this sweeping view -- over 100 million, with some of them in thousands of star clusters seen embedded in the disk. This ambitious photographic cartography of the Andromeda galaxy represents a new benchmark for precision studies of large spiral galaxies that dominate the universe's population of over 100 billion galaxies. Never before have astronomers been able to see individual stars inside an external spiral galaxy over such a large contiguous area. Most of the stars in the universe live inside such majestic star cities, and this is the first data that reveal populations of stars in context to their home galaxy. Hubble traces densely packed stars extending from the innermost hub of the galaxy seen at the left. Moving out from this central galactic bulge, the panorama sweeps from the galaxy's central bulge across lanes of stars and dust to the sparser outer disk. Large groups of young blue stars indicate the locations of star clusters and star-forming regions. The stars bunch up in the blue ring-like feature toward the right side of the image. The dark silhouettes trace out complex dust structures. Underlying the entire galaxy is a smooth distribution of cooler red stars that trace Andromeda’s evolution over billions of years. Because the galaxy is only 2.5 million light-years from Earth, it is a much bigger target in the sky than the myriad galaxies Hubble routinely photographs that are billions of light-years away. This means that the Hubble survey is assembled together into a mosaic image using 7,398 exposures taken over 411 individual pointings. Read more: <a href="http://1.usa.gov/1y0i3H8" rel="nofollow">1.usa.gov/1y0i3H8</a> Credit: NASA, ESA, J. Dalcanton, B.F. Williams, and L.C. Johnson (University of Washington), the PHAT team, and R. Gendler <b><a href="http://www.nasa.gov/audience/formedia/features/MP_Photo_Guidelines.html" rel="nofollow">NASA image use policy.</a></b> <b><a href="http://www.nasa.gov/centers/goddard/home/index.html" rel="nofollow">NASA Goddard Space Flight Center</a></b> enables NASA’s mission through four scientific endeavors: Earth Science, Heliophysics, Solar System Exploration, and Astrophysics. Goddard plays a leading role in NASA’s accomplishments by contributing compelling scientific knowledge to advance the Agency’s mission. <b>Follow us on <a href="http://twitter.com/NASAGoddardPix" rel="nofollow">Twitter</a></b> <b>Like us on <a href="http://www.facebook.com/pages/Greenbelt-MD/NASA-Goddard/395013845897?ref=tsd" rel="nofollow">Facebook</a></b> <b>Find us on <a href="http://instagram.com/nasagoddard?vm=grid" rel="nofollow">Instagram</a></b>
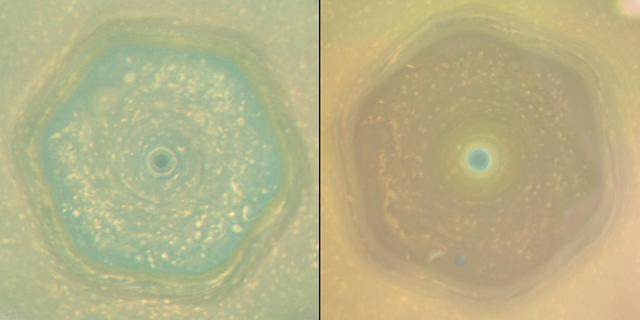
These natural color views from NASA's Cassini spacecraft compare the appearance of Saturn's north-polar region in June 2013 and April 2017. In both views, Saturn's polar hexagon dominates the scene. The comparison shows how clearly the color of the region changed in the interval between the two views, which represents the latter half of Saturn's northern hemisphere spring. In 2013, the entire interior of the hexagon appeared blue. By 2017, most of the hexagon's interior was covered in yellowish haze, and only the center of the polar vortex retained the blue color. The seasonal arrival of the sun's ultraviolet light triggers the formation of photochemical aerosols, leading to haze formation. The general yellowing of the polar region is believed to be caused by smog particles produced by increasing solar radiation shining on the polar region as Saturn approached the northern summer solstice on May 24, 2017. Scientists are considering several ideas to explain why the center of the polar vortex remains blue while the rest of the polar region has turned yellow. One idea is that, because the atmosphere in the vortex's interior is the last place in the northern hemisphere to be exposed to spring and summer sunlight, smog particles have not yet changed the color of the region. A second explanation hypothesizes that the polar vortex may have an internal circulation similar to hurricanes on Earth. If the Saturnian polar vortex indeed has an analogous structure to terrestrial hurricanes, the circulation should be downward in the eye of the vortex. The downward circulation should keep the atmosphere clear of the photochemical smog particles, and may explain the blue color. Images captured with Cassini's wide-angle camera using red, green and blue spectral filters were combined to create these natural-color views. The 2013 view (left in the combined view), was captured on June 25, 2013, when the spacecraft was about 430,000 miles (700,000 kilometers) away from Saturn. The original versions of these images, as sent by the spacecraft, have a size of 512 by 512 pixels and an image scale of about 52 miles (80 kilometers) per pixel; the images have been mapped in polar stereographic projection to the resolution of approximately 16 miles (25 kilometers) per pixel. The second and third frames in the animation were taken approximately 130 and 260 minutes after the first image. The 2017 sequence (right in the combined view) was captured on April 25, 2017, just before Cassini made its first dive between Saturn and its rings. During the imaging sequence, the spacecraft's distance from the center of the planet changed from 450,000 miles (725,000 kilometers) to 143,000 miles (230,000 kilometers). The original versions of these images, as sent by the spacecraft, have a size of 512 by 512 pixels. The resolution of the original images changed from about 52 miles (80 kilometers) per pixel at the beginning to about 9 miles (14 kilometers) per pixel at the end. The images have been mapped in polar stereographic projection to the resolution of approximately 16 miles (25 kilometers) per pixel. The average interval between the frames in the movie sequence is 230 minutes. Corresponding animated movie sequences are available at https://photojournal.jpl.nasa.gov/catalog/PIA21611 https://photojournal.jpl.nasa.gov/catalog/PIA21611
The sharp eye of NASA's Hubble Space Telescope has captured the tiny moon Phobos during its orbital trek around Mars. Because the moon is so small, it appears star-like in the Hubble pictures. Over the course of 22 minutes, Hubble took 13 separate exposures, allowing astronomers to create a time-lapse video showing the diminutive moon's orbital path. The Hubble observations were intended to photograph Mars, and the moon's cameo appearance was a bonus. A football-shaped object just 16.5 miles by 13.5 miles by 11 miles, Phobos is one of the smallest moons in the solar system. It is so tiny that it would fit comfortably inside the Washington, D.C. Beltway. The little moon completes an orbit in just 7 hours and 39 minutes, which is faster than Mars rotates. Rising in the Martian west, it runs three laps around the Red Planet in the course of one Martian day, which is about 24 hours and 40 minutes. It is the only natural satellite in the solar system that circles its planet in a time shorter than the parent planet's day. About two weeks after the Apollo 11 manned lunar landing on July 20, 1969, NASA's Mariner 7 flew by the Red Planet and took the first crude close-up snapshot of Phobos. On July 20, 1976 NASA's Viking 1 lander touched down on the Martian surface. A year later, its parent craft, the Viking 1 orbiter, took the first detailed photograph of Phobos, revealing a gaping crater from an impact that nearly shattered the moon. Phobos was discovered by Asaph Hall on August 17, 1877 at the U.S. Naval Observatory in Washington, D.C., six days after he found the smaller, outer moon, named Deimos. Hall was deliberately searching for Martian moons. Both moons are named after the sons of Ares, the Greek god of war, who was known as Mars in Roman mythology. Phobos (panic or fear) and Deimos (terror or dread) accompanied their father into battle. Close-up photos from Mars-orbiting spacecraft reveal that Phobos is apparently being torn apart by the gravitational pull of Mars. The moon is marred by long, shallow grooves that are probably caused by tidal interactions with its parent planet. Phobos draws nearer to Mars by about 6.5 feet every hundred years. Scientists predict that within 30 to 50 million years, it either will crash into the Red Planet or be torn to pieces and scattered as a ring around Mars. Orbiting 3,700 miles above the Martian surface, Phobos is closer to its parent planet than any other moon in the solar system. Despite its proximity, observers on Mars would see Phobos at just one-third the width of the full moon as seen from Earth. Conversely, someone standing on Phobos would see Mars dominating the horizon, enveloping a quarter of the sky. From the surface of Mars, Phobos can be seen eclipsing the sun. However, it is so tiny that it doesn't completely cover our host star. Transits of Phobos across the sun have been photographed by several Mars-faring spacecraft. The origin of Phobos and Deimos is still being debated. Scientists concluded that the two moons were made of the same material as asteroids. This composition and their irregular shapes led some astrophysicists to theorize that the Martian moons came from the asteroid belt. However, because of their stable, nearly circular orbits, other scientists doubt that the moons were born as asteroids. Such orbits are rare for captured objects, which tend to move erratically. An atmosphere could have slowed down Phobos and Deimos and settled them into their current orbits, but the Martian atmosphere is too thin to have circularized the orbits. Also, the moons are not as dense as members of the asteroid belt. Phobos may be a pile of rubble that is held together by a thin crust. It may have formed as dust and rocks encircling Mars were drawn together by gravity. Or, it may have experienced a more violent birth, where a large body smashing into Mars flung pieces skyward, and those pieces were brought together by gravity. Perhaps an existing moon was destroyed, reduced to the rubble that would become Phobos. Hubble took the images of Phobos orbiting the Red Planet on May 12, 2016, when Mars was 50 million miles from Earth. This was just a few days before the planet passed closer to Earth in its orbit than it had in the past 11 years. A time-lapse video captures a portion of the path that tiny Phobos takes around Mars. Over the course of 22 minutes, Hubble snapped 13 separate exposures of the little Martian moon. The video can be viewed at https://photojournal.jpl.nasa.gov/catalog/PIA21837